Embed Size (px)
Citation preview

originalni naučni rad
14Bankarstvo, 2016, vol. 45, br. 1
UDK 336.76(497.11)"2005/2015" 005.334:005.585
DOI: 10.5937/bankarstvo1601014J
PROCENA I VALIDACIJA VAR
MODELA NA TRŽIŠTU KAPITALA U SRBIJI U PERIODU OD 2005. DO
2015. GODINE
Zoran JeremićUniverzitet Singidunum
Prevod obezbedili
autori
Rezime
Globalna finansijska kriza ukazala je na značajne slabosti postojećih modela merenja rizika na finansijskim tržištima. Posebno je izražena potreba za unapređivanjem i daljim razvojem modela finansijskog rizika na tržištima kapitala u zemljama u tranziciji. U ovom radu bavimo se mogućnošću predviđanja i ponašanjem raznih klasa VaR modela usredsređujući se na tržište kapitala u Srbiji od 2005. do kraja 2015. godine. U postupku procene tržišnog rizika implementirali smo različite VaR modele, a za validaciju VaR modela, koristili smo dvofazni postupak „backtestinga”. Rezultati ukazuju da se VaR model, baziran na simetričnom GARCH modelu sa GED raspodelom inovacija, ponaša opravdano dobro u periodu testiranja izvan uzroka. Najbolje rezultate daje filtrirana istorijska simulacija za interval poverenja od 99%. Ovi rezultati istraživanja ukazuju da standardni VaR modeli koji se najčešće koriste u finansijskim institucijama potcenjuju predviđanja rizika na tržištu kapitala u Srbiji u svim tržišnim okolnostima. Autori stoga sugerišu regulatornim telima i investitorima da za tržište kapitala u Srbiji uvedu robusnije i kompleksnije mere rizika.
Ključne reči: Tržišni rizik, tržišta kapitala u nastajanju, GARCH, Istorijska simulacija, Risk Metrics, VaR, Backtest
JEL: G17, G32, C53
Primljen: 11.01.2016. Prihvaćen: 01.02.2016.
Ivica TerzićUniverzitet Singidunum
Marko MilojevićUniverzitet Singidunum
mmilojević@singidunum.ac.rs

15 Bankarstvo, 2016, Vol. 45, Issue. 1
original scientific paper
VALUE AT RISK ESTIMATION AND
VALIDATION IN THE SERBIAN CAPITAL MARKET IN THE PERIOD 2005-2015
Zoran JeremićSingidunum [email protected]
Translation provided by the authors
Summary
The global financial crisis pointed at the significant weaknesses of the existing models for measuring risk in financial markets. In particular, there is a need for improvement and further development of the financial risk models in the capital markets in transition countries. Within this paper we deal with the possibility of predicting and behavior of various classes of VaR models focusing on the capital market in Serbia from 2005 to the end of 2015.We implemented various VaR models in assessing market risk and used a two-stage backtesting process for VaR models validation. The results indicate that VaR based on symmetric GARCH model with generalized error distribution of innovations behaves reasonably well in the post-of-sample testing period. Filtered historical simulation at 99% confidence level gives the best results. Standard VaR models mostly used by financial institutions underestimate the risk forecast in the Serbian capital market in all market circumstances. Thus, the authors suggest to the regulators and investors to introduce more robust and complex risk measures in the Serbian capital market.
Keywords: market risk, frontier markets, GARCH, historical simulation, EWMA, riskmetrics, VaR, backtest
JEL: G17, G32, C53
Ivica TerzićSingidunum [email protected]
Marko MilojevićSingidunum Universitymmilojević@singidunum.ac.rs
Received: 11.01.2016 Accepted: 01.02.2016
UDC 336.76(497.11)"2005/2015"005.334:005.585
DOI: 10.5937/bankarstvo1601014J

Uvod
Poslednja svetska finansijska kriza ukazala je na potrebu fundamentalnih promena u upravljanju rizikom. Sve veći obim i složenost hartija od vrednosti kojima sa trguje, uz povećanu volatilnost tržišta tokom protekle decenije, primorali su finansijske institucije i regulatorna tela da usvoje veliki broj modela merenja rizika (Milojević i Terzić, 2014.). U jeku je debata učesnika na finansijskim tržištima, kao i akademske javnosti, o distribuciji prinosa i rizika na finansijskim tržištima u cilju poboljšanja njihovog modelovanja kako bi se povećala upotrebna vrednost i preciznost ovih modela.
Model rizične vrednosti (u daljem tekstu VaR) je jedan od najpopularnijuh modela analize tržišnog rizika koji koriste kako institucije, za interno upravljanje rizikom, tako i regulatorna tela u svrhu propisivanja kapitalnih zahteva za pokrivanje tržišnog rizika. Popularnost ovog modela se pojačala nakon što su Banka za međunarodna poravnanja odobrile VaR model za merenje rizika. Bazelska Komisija za superviziju banaka nametnula je korišćenje VaR modela za finansijske institucije (videti BIS (2011) koji je objavila Bazelska Komisija za superviziju banaka za proširenu analizu primene VaR modela na merenje rizika u regulatornom kontekstu). VaR model je procenjivan brojnim metodama uključujući model varijanse-kovarijanse, istorijske simulacije i Monte Karlo modela (Beder, 1995; Hendrix, 1996; Mahoney, 1996; i Alexander and Leigh, 1997).
U upravljanju finansijskim rizikom, VaR je svakako predstavljao značajan korak napred u odnosu na tradicionalne modele koji su uglavnom bili bazirani na osetljivosti na tržišne promenljive (Živković, 2007). Uprkos brojnim dobro poznatim nedostacima, VaR ostaje daleko najistaknutija i najčešće korišćena kvantativna metoda merenja rizika. Štaviše, Danielsson et al. (2005) tvrde da neki nedostaci VaR modela u praksi nisu toliko značajni.
Ovaj model sumira izloženosti tržišnom riziku jednog portfolija samo jednim brojem - koji ukazuje na gubitak vrednosti tog portfolija. Kada je u pitanju tržišni rizik, cilj je da se procene razmere potencijalnog gubitka portoflija usled nepovoljnih kretanja cena. VaR se koristi da bi se utvrdio broj koji, sa
određenim stepenom pouzdanosti, ukazuje na maksimalni gubitak koji se može dogoditi u definisanom vremenskom okviru, obično bilo koji vremenski raspon - od jednog dana do nekoliko meseci. Gubitak se obračunava kao pad tržišne vrednosti celokupnog portfolija ili nekog njegovog dela. VaR model se pokazao kao moćan alat za merenje izloženosti tržišnom riziku portfolija, sektora, ili hartije od vrednosti tokom određenog perioda vremena. Regularna tela i savetovani odbori u finansijskoj industriji preporučuju VaR model kao sredstvo merenja rizika. (Milojević i Terzić, 2014).
VaR model uzima kao pretpostavku da se pozicije mogu zatvoriti tokom određenog perioda vremena. Ova pretpostavka se pokazala neodrživom tokom nedavnih događanja kako na razvijenim tržištima kapitala tako i na onima u razvoju. Skorašnja kriza finansijskog tržišta potekla sa drugorazrednog hipotekarnog tržišta u SAD-u imala je, naime, značajne posledice na nagli pad likvidnosti razvijenih tržišta kapitala. Situacija se dodatno usložnjava kada se u obzir uzmu tržišta kapitala u nastajanju na kojima su akcije postale praktično nelikvidne.
Predmet našeg empirijskog istraživanja je tačnost VaR modela primenjenih na relativno nelikvidne finansijske instrumente i tržišta kapitala u nastajanju. Da bi rezulati VaR modela bili pouzdani, moramo se služiti rigoroznim postupcima validacije i kalibracije. Ovi postupci predstavljaju ključnu odliku upravljanja finansijskim rizikom čiji je cilj da osigura da VaR modeli daju pouzdane i dosledne procene na osnovu kojih se mogu donositi kompetentne odluke. Postoje tržišta kapitala u razvoju kod kojih je prisutan materijalni rizik vrednovanja koji nije uočljiv na nivou VaR-a od 95/99%, što naglašava potrebu da se utvrdi da li je VaR model prikladan za primenu na određenu klasu finansijske aktive na ovim tržištima.
Tržište kapitala u Srbiji predstavlja tržište u nastajanju (eng. frontier market). Ova tržišta, koja se nazivaju tržištima u fazi pre razvoja, u poslednje vreme privlače pažnju investitora iz celog sveta. Iako su ova tržišta još uvek u ranoj fazi razvoja, neki investitori ih posmatraju kao privlačnu priliku sa dobrim potencijalom za ostvarivanje visokih kapitalnih dobitaka. Ovaj potencijal je, međutim, praćen većim stepenom rizika koji su svojstveni neefikasnim,
Jeremić Z., Terzić I., Milojević M.Procena i validacija VaR modela na tržištu kapitala
u Srbiji u periodu od 2005. do 2015. godineBankarstvo, 2016, vol. 45, br. 1 16

Introduction
The last global financial crisis indicated the need for fundamental changes in risk management. The growing magnitude and complexity of trading securities, accompanied with the increased market volatility over the last decade, have pushed financial institutions and regulators to adopt a wide array of risk measurement models (Milojević and Terzić, 2014). There is an ongoing discussion among the financial markets practitioners, as well as academics, about the return distribution and risk in financial markets, with a view to improving their modeling to maximize the utility and precision of these models.
Value at Risk (herein after VaR) is one of the most popular models of market risk analysis in the risk industry, used both by institutions for internal risk management, and by regulators to dictate the regulatory market risk capital requirements. Its popularity increased after the Bank for International Settlements and the Securities and Exchange Commission applied VaR as a measure to quantify risk. The Basel Committee on Banking Supervision imposed on financial institutions the use of VaR (see BIS (2011) by the Basel Committee on Banking Supervision for an extended analysis of the application of VaR for risk measurement in the regulatory context). VaR can be estimated by a number of methods, including variance-covariance, historical simulation and Monte Carlo simulation methods (Beder, 1995; Hendricks, 1996; Mahoney, 1996; and Alexander and Leigh, 1997).
In financial risk management, VaR certainly represents a significant step forward in relation to the more traditional measures, mostly based on the sensitivity to market variables (Živković, 2007). Notwithstanding a number of well-know drawbacks, VaR remains by far the most prominent and commonly-used quantitative method for risk measurement. Moreover, Danielsson et al. (2005) argue that some of the VaR drawbacks may not be that important in practice.
The model aggregates the market risk exposures of a portfolio into one number - signifying the loss in the portfolio’s value. In terms of market risk, the aim is to assess the magnitude of large potential losses of a portfolio
due to adverse price fluctuations. VaR is used to provide a number that states, with a certain level of confidence, the maximum loss that can occur within a defined time horizon, usually anything from one day up to a few months. The loss is calculated as the drop of market prices of the entire portfolio or one of its portions. VaR has arisen as a powerful tool to capture market risk exposure of a portfolio, sector, asset class or security over some specified period of time. Regulators and the financial industry advisory committees recommend VaR as a way of measuring risk (Milojević and Terzić, 2014).
The VaR model assumes that positions can be liquidated over a specified period. This liquidity assumption has proved invalid over the course of recent market events in both developed and emerging equity markets. The fact that the recent financial market crisis originated in the US sub-prime mortgage market had important implications on the sudden drop in developed equity markets liquidity. The situation becomes even more complex when we consider frontier stock markets, where stocks became practically illiquid.
The accuracy of VaR, when applied to relatively illiquid financial instruments and frontier equity markets, is the subject of our empirical research. For VaR outputs to be reliable, we should implement the rigorous processes for model validation and calibration. Those processes are a critical feature of financial risk management to ensure that VaR models are producing reliable and consistent VaR figures based on which we can make competent decisions. There are frontier equity markets which have inherent valuation risk that could be material and which would not be picked up at the 95/99 percent VaR levels, highlighting the need to determine whether VaR is appropriate for particular asset classes in those markets.
The equity market in Serbia is a frontier market. Frontier markets, or “pre-emerging” markets, have recently been gaining attention from investors worldwide. While these markets are still in their early stages of development, some investors consider them an attractive opportunity for long-term economic growth with strong return potential.This high growth potential is, however, accompanied by greater risk and inefficiencies which are inherent in
Jeremić Z., Terzić I., Milojević M.Value at risk estimation and validation in the Serbiancapital market in the period 2005-2015
17 Bankarstvo, 2016, Vol. 45, Issue. 1

mladim tržištima u nastajanju. Ova tražišta se često karakterišu kao vrlo volatilna, rizična i neefikasna, ali su nedavna pobošljanja i uslovi olakšali ulaganje na ovim ranije zanemarenim tržištima. Ipak, mnogi investitori tvrde da rizici i nelikvidnost ovih investicija mogu nadvladati bilo koji potencijalni prinos, te su se stoga mnogi povukli sa ovih tržišta izazvavši veliki pad cena akcija i nelikvidnost (slučaj Srbije).
Postoje brojni radovi o testitranju performansi raznih VaR modela na razvijenim tržištima i tržištima u razvoju, ali su istraživački radovi, koji se bave obračunom i verifikacijom VaR modela na finansijskom tržištu Srbije, vrlo retki. Iako postoje studije koje se bave izračunavanjem VaR-a, prema našim saznanjima, ova studija je jedinstvena po tome što poredi performanse VaR modela u srpskoj tržišnoj ekonomiji korišćenjem podataka iz desetogodišnjeg perioda koji obuhvata volatilne tržišne uslove i uključuje u izračun VaR-a i modele za modeliranje volatilnosti. Nekoliko autora je testiralo određene mere rizika i standardne VaR modele na tržištu akcija u Srbiji, ali su analize pretežno bile zasnovane na kratkim vremenskim serijama i jednostavnim „backtesting” procedurama (Jeremić i Terzić, 2008; Đorić i Đorić, 2011; Radivojević i saradnici, 2010). Jednu od najdetaljnijih studija primene VaR metodologije prilagođene za domaće tržište kapitala empirijski je istražio Terzić (2014). Milojević i Terzić (2014) testirali su performanse različitih VaR modela na primeru Srbije u periodu od 2005-2013. Stoga je cilj ovog rada testiranje i validacija različitih VaR modela na tržištu kapitala u Srbiji u periodu od 2005. do kraja 2015. godine uvođenjem dvofazne backtesting procedure VaR modela i ocenom stabilnosti i pouzdanosti testiranih VaR modela Milojevića i Terzića (2014) tokom različitih vremenskih perioda. Rad stoga ima za cilj i da proširi vrlo oskudno empirijsko istraživanje na procenu VaR-a na ovom finansijskom tržištu i obezbedi dragocene informacije regulatornim organima, finansijskim institucijama i investitorima za utvrđivanje kapitalnih zahteva za pokrivanje tržišnog rizika i procenu izloženosti tržišnom rizku njihovih portfolija za trgovanje na osnovu VaR metodologije.
Rad je organizovan na sledeći način: nakon prvog, uvodnog dela, u drugom delu rada predstavljena je metodologija istraživanja sa
opisom testiranih VaR modela i backtesting tehnike. Treći deo rada daje opis analiziranih podataka i statističkih karakteristika tržišta kapitala u Srbiji, kao i nalaze i rezulte „backtestinga”. Četvrti deo rada predstavlja zaključak u kome su sažeto predstavljeni glavni rezultati empirijskog istraživanja.
Metodologija istraživanja
VaR se obično definiše kao maksimalni potencijalni gubitak koji portfolio može pretrpeti u okviru fiksnog intervala poverenja tokom perioda držanja (Alexander, 2008). Još konkretnije, VaR (1 - α) je definisan kao granična vrednost koja premašuje 100 * α puta iz 100 pokušaja u proseku. 1 - α je interval poverenja, gde je α ∈ (0, 1) realan broj. Slučajevi u kojima je ex post prinos na portfolio niži od procenjenog VaR-a zovu se izuzeci. Jedan od osnovnih vrednosti koje ulaze u izračun VaR-a je interval poverenja. Kada se utvrdi interval poverenja, VaR se mora izračunati tako da odstupanja budu jednaka 100 * α (Köksal et al, 2013).
Iako postojeći modeli za izračun VaR-a koriste različite metodologije, mogu se generalno klasifikovati u dve široke kategorije: indirektni pristup i direktni pristup (Fabozzi et al, 2008). U delu ovog rada koji se bavi empirijskim istraživanjem primenićemo indirektni pristup određivanja VaR-a koji se sastoji od klasičnog parametarskog pristupa, neparametarskog pristupa i poluparametarskog pristupa. Prema Fabociju i saradnicima (2008), svi ovih tipovi VaR modela koji slede zajedničku strukturu mogu se sumirati u tri koraka: 1) dnevno usklađivanje računa tako da odražava obračunate profite i gubitke 2) procena raspodele prinosa na finansijsku aktivu, i 3) izračun VaR-a inverzijom funkcije raspodele. Poteškoće ove kategorije pristupa leže u drugom koraku jer finansijski prinosi obično pokazuju grupisanje volatilnosti u klastere (visoka autokorelacija), značajan koeficijent zaobljenosti (izduženog i zadebljanog repa), marginalnu asimetriju i u slučaju indeksa, autokorelaciju prinosa.
Sadašnja praksa umnogome sledi restriktivne pristupe merenju tržišnog rizika kao što su istorijska simulacija ili RiskMetrics (Perignon and Smit, 2008). Za razliku od toga, mi predlažemo dodatne fleksibilne metode
Jeremić Z., Terzić I., Milojević M.Procena i validacija VaR modela na tržištu kapitala
u Srbiji u periodu od 2005. do 2015. godineBankarstvo, 2016, vol. 45, br. 1 18

the young economies of these frontier markets. Frontier markets are often characterized as being highly volatile, risky, and inefficient, but recent improvements and conditions have facilitated investment in these previously overlooked markets. However, many investors argue that the risks and illiquidity of these investments may outweigh any potential returns, and therefore many withdrew from those markets causing a large drop in stock prices and illiquidity (case of Serbia).
There are multiple papers testing the performance of various VaR models in developed and developing markets, but research papers dealing with VaR calculation and verification in the Serbian financial market are very rare. Although there are studies that calculate the VaR, to the best of our knowledge, this is a unique study which compares the performance of VaR models in the Serbian market economy using the data from a ten-year period, which covers the volatile market conditions, and incorporates volatility modeling models into the VaR calculations. Several authors have tested certain standard VaR models in the Serbian equity market, yet the analyses were primarily based on short time series and simple backtesting procedures (Jeremić and Terzić, 2008; Djorić and Djorić, 2011; Radivojević et al, 2010). One of the most detailed studies on the use of VaR methodology adapted to the domestic equity market was empirically researched by Terzić (2014). Milojević and Terzić (2014) tested the performance of different VaR models in Serbia in the period 2005-2013. Thus, the aim of this paper is to test and validate different VaR models in the Serbian equity market in the period from 2005 until the end of 2015 by introducing a two-stage backtesting procedure of VaR models and by testing the stability and reliability of tested VaR models by Milojević and Terzić (2014) over different horizons. The paper, thus, aims to extend the very scarce empirical research on VaR estimation in this financial market and provide valuable information to regulators, financial institutions and investors for setting the market risk capital requirements and evaluating the market risk exposure of their trading portfolios based on VaR methodology.
The paper is organized in the following way: after the introductory section, section 2 presents
the methodology of research with descriptions of tested VaR models and backtesting techniques. Section 3 gives the description of the analyzed data and statistical characteristics of the Serbian stock market, along with the backtesting findings and results. Section 4 concludes by summarizing the main results of the empirical research.
Research Methodology
VaR is usually defined as the maximum potential loss that a portfolio can suffer within a fixed confidence level during a holding period (Alexander, 2008). More specifically, VaR (1 - α) is defined as the threshold that is exceeded 100 * α times out of 100 trials on average. 1 - α is the confidence level where α ∈ (0, 1) is a real number. The cases in which ex post portfolio returns are lower than VaR estimates are called violations. One of the main inputs to the VaR calculation is the confidence level. Once the confidence level is set, VaR must be calculated in such a way that the violations should be equal to 100 * α (Köksal et al, 2013).
Although the existing models for calculating VaR employ different methodologies, they can be generally classified into two broad categories: indirect-VaR approach and direct-VaR approach (Fabozzi et al, 2008). In the empirical part of the paper, we include the indirect-VaR approach which consists of the classical parametric approach, nonparametric approach, and semi-parametric approach. According to Fabozzi et al. (2008), all those types of VaR models follow the common structure which can be summarized in three steps: 1) mark to market, 2) estimate the distribution of the asset return, and 3) compute VaR by inverting the distribution function. The difficulty of this category of approaches lies in the second step because financial returns usually exhibit volatility clustering (high autocorrelation), significant kurtosis (peaked and fat tailed), marginal skewness (time-varying nature) and, in the case of indexes, autocorrelation of returns.
Current practice largely follows the restrictive approaches to market risk measurement, such as historical simulation or RiskMetrics (Perignon and Smit, 2008). In contrast, we propose additional flexible
Jeremić Z., Terzić I., Milojević M.Value at risk estimation and validation in the Serbiancapital market in the period 2005-2015
19 Bankarstvo, 2016, Vol. 45, Issue. 1

koje primenjuju skorašnje ostvarene napretke u finansijskoj ekonometrici i koje će verovatnije dati preciznije procene rizika.
U ovoj studiji, implementirali smo sledeće tipove gorepomenutih VaR pristupa:• istorijsku simulaciju, neparametarski model
koji koristi veliki obim istorijskih podataka za procenu VaR-a ali koristi mimimalne pretpostavke o raspodeli prinosa faktora rizika.
• parametarski VaR pristup baziran na grupi GARCH modela i EWMA modelima.
• filtriranu istorijsku simulaciju, polu-parametarski model koji VaR izračunava kombinujući istorijsku simulaciju sa GARCH procenama volatilnosti. Ovde se filtriranje odnosi na korišćenje GARCH predviđanje volatilnosti za kreiranje standardizovanih inovacija iz kojih izračunavamo empirijski kvintil za VaR.U tabeli 1 su predstavljene formule i opisi
VaR modela.
Druga ulazna vrednost koja je neophodna za izračun VaR-a je standardna devijacija kao mera volatilnosti prinosa. Ključni predmet interesovanja je uslovna standardna devijacija. Opšte je poznato da uslovljena volatilnost nije konstantna tokom vremena i da je izuzetno postojana. Modeliranje i predviđanje volatilnosti ima ključan značaj za investitore koji su zainteresovani za predviđanje varijanse prinosa portfolija koji varira s vremenom tokom perioda držanja. Volatilnost je važan faktor u proceni rizika jer utiče na sve kvantile raspodele prinosa uključujući one veoma ekstremne. Stoga, svaki model verovatnoće za procenu rizika bi trebalo da obuhvata komponentu GARCH tipa (Stojanov i saradnici, 2011.). Najnovije i najnaprednije VaR metode koriste GARCH model za izračunavanje uslovne standardne devijacije (Köksal i drugi, 2013).
Nakon implementiranja različitih VaR izračuna za analizu izloženosti indeksa akcija tržišnom riziku, sledeći korak je da se odgovori
Tabela 1- Izabrani VaR modeli
Model Formula Opis
Istorijska simulacija
Risk Metricsαcl - korespondirajući kvintil standardne normalne varijable *μt - uslovna srednja vrednost **
GARCH VaR*** (normalna, GED i studentov-t raspodela inovacija)αcl - korespondirajući kvintil raspodele koji najbolje odgovara podacima
Optimalni EWMA VaR
Filtrirana istorijska simulacija ,
* Prilikom korišćenja RiskMetrics modela, pretpostavili smo da prinos ima standardnu normalnu raspodelu prinosa.** Radi jednostavnosti, ovde ćemo pretpostaviti nultu uslovnu srednju vrednost, μt = 0. To je uobičajena pretpostavka u upravljanju rizikom kada se uzimaju u obzir kratki periodi prinosa (tj. dnevni ili nedeljni). Ovo je opravdano zbog činjenice da obim dnevnih volatilnosti (uslovna standardna devijacija) σt lako dominira nad μt za većinu portofolija. Ovo se takođe indirektno ogleda u činjenici da je u praksi precizna procena srednje vrednosti mnogo teža od precizne procene volatilnosti. Ipak, dinamika uslovne srednje vrednosti bi se lako mogla inkorporirati u bilo koji od GARCH modela uzimanjem u obzir dodatne vrednosti prinosa rt - μt umesto rt.*** GARCH VaR je procenjen pod pretpostavkom alternativnih raspodela: normalna, t-student raspodela, uopštena raspodela greške. Konačan odabir GARCH VAR-a je zasnovan na raspodeli koja najbolje odgovara podacima u skladu sa maksimalnom vrednošću LLF.
Jeremić Z., Terzić I., Milojević M.Procena i validacija VaR modela na tržištu kapitala
u Srbiji u periodu od 2005. do 2015. godineBankarstvo, 2016, vol. 45, br. 1 20

methods that exploit recent developments in financial econometrics and are likely to produce more accurate risk assessments.
In this study, the following types of each of the aforementioned VaR approaches are applied:• Historical simulation, non-parametric
model, which uses a large quantity of historical data to estimate VaR but makes minimal assumptions about the risk factor return distribution.
• Parametric VaR based on GARCH model family and EWMA models.
• Filtered historical simulation, semi-parametric model, which computes VaR by combining historical simulation with GARCH estimates of volatility. Here, filtering refers to using the estimated GARCH volatility to create standardized innovations from which we compute empirical quantile for VaR.The VaR models, their formulations and
descriptions are presented in Table 1.
The second input that is necessary to calculate VaR is the standard deviation or volatility of returns. The key object of interest is the conditional standard deviation. It is well-known that conditional volatility is not constant over time and that it is highly persistent. Modeling and forecasting volatility is crucial for investors who are interested in the forecast of the variance of a time-varying portfolio return over the holding period.
Volatility is an important factor in risk estimation because it affects all quantiles of the return distribution including the very extreme ones. Therefore, any probabilistic model for risk estimation should include a GARCH-type component (Stoyanov et al, 2011). The most recent and advanced VaR methods make use of GARCH models to calculate the conditional standard deviation (Köksal et al, 2013).
After adoption of different VaR calculations for the analysis of the stock index exposure to market risk, the next step is to give an answer on the question whether VaR, calculated
Jeremić Z., Terzić I., Milojević M.Value at risk estimation and validation in the Serbiancapital market in the period 2005-2015
Table 1. Selected VaR models
VAR model VAR formulation Description
Historical simulation
Risk Metricsαcl - corresponding quantileof standard normal variable*
- conditional mean**
GARCH VaR*** (normal, generalized error and t-student distribution of innovation)αcl - corresponding quantile of distribution that best fits data
Optimalni EWMA VaR
Filtered historical simulation ,
*In the RM VaR we have assumed a standard normal distribution for the return innovation.** For the sake of simplicity we will henceforth assume a zero conditional mean, μt = 0. It is a common assumption in risk management when short (e.g., daily or weekly) return horizons are considered. It is readily justified by the fact that the magnitude of the daily volatility (conditional standard deviation) σt easily dominates that of μt for most portfolios of practical interest. This is also indirectly evident in the fact that, in practice, accurate estimation of the mean is typically much more difficult than accurate estimation of volatility. Still, conditional mean dynamics could easily be incorporated into any of the GARCH models by considering additional returns rt - μt in place of rt.*** According to the GARCH model VaR is estimated under alternative distributional assumptions: normal, t-student, and generalized error. Final selection of GARCH-type VaR is based on distribution that best fits the data according to the maximum value of LLF.
21 Bankarstvo, 2016, Vol. 45, Issue. 1

na pitanje da li je VaR, izračunat u skladu sa bilo kojom metodom predstavljenom u tabeli 1, realističan i tačan. Za procenu budućih performansi predloženih modela, koristili smo dvofaznu backtesting proceduru. U proceni kolika je mogućnost VaR modela u predviđanju, uzeli smo u obzir i statističke mere i mere funkcije gubitka. U ovom radu koristimo POF test koji je predložilo Kupiec (1995. godine) tj. test bezuslovne pokrivenosti i Kristofersenove (1998. godine) testove nezavisnosti i uslovne pokrivenosti. Bezuslovna pokrivenost i nezavisnost su osnovne osobine adekvatnog VaR modela. Model rizika tačno predviđa i ima efekta samo ukoliko poseduje obe osobine.
Test bezuslovne pokrivenosti koji je predložio Kupiec (1995) omogućava testiranje koje bi utvrdilo da li je postignuta stopa devijacije od VaR-a, koji predstavlja broj dana kada je gubitak bio veći od VaR-a, podeljen sa veličinom uzorka, u skladu sa intervalom poverenja. Nedostatak Kupiecevog testa je što ne uzima u obzir redosled izuzetaka. Da bi popravio ove nedostatke, Christoffersen (1998) je osmislio test koji naglasak stavlja na prethodniku izuzetka. Kao što je navedeno kod Chistoffersena (1998), testiranje isključivo u svrhu tačne bezuslovne pokrivenosti VaR modela zanemaruje mogućnost da se izuzeci grupišu u klastere tokom vremena. Stoga, drugi test služi da se proveri da li je proces VaR izuzetaka serijski nezavistan. Christoffersen (1998) je razvio i test uslovne pokrivenosti koji podrazumeva testiranje hipoteze o bezuslovnoj pokrivenosti i nezavisnosti.
Druga faza procesa validacije je bazirana na rangiranju VaR modela korišćenjem dve funkcije gubitka. Funkcija gubitka dopušta da veličina gubitka u repu raspodele utiče na rangiranje VaR modela. Modeli koji generišu veće gubitke u repu raspodele generišu veće vrednosti u okviru ove fukcije gubitka, nego modeli koji generišu manje gubitke u repu raspodele. U svrhu odabira superiornijih VaR modela, svaki model se mora gradirati prema dve funkcije gubitka: funkcija kvadrata gubitka (QL) i funkcija apsolutnog gubitka (AL).
(1)
(2)
QL i AL funkcije ne "kažnjavaju" model kada se ne jave izuzeci. Dobar model daje niži skor.
Podaci i empirijski rezultati
Glavni ciljevi ovog dela rada jesu analiza vremenskih serija stopa prinosa indeksa akcija u Srbiji i razvoj odgovarajućih modela za procenu rizika. Pre nego što pokušamo da modeliramo i predvidimo datu vremensku seriju prinosa, poželjno je da preliminarno pogledamo podatke kako bismo ih bolje shvatili i razumeli njihove glavne osobine. Ovo će biti od neprocenjive vrednosti kasnije u procesu modelovanja. U ovu svrhu, prvo ćemo opisati podatke korišćenjem sumarne statistike i grafičkih metoda. Kao drugo, uvešćemo modeliranje volatilnosti kako bismo našli prikladan statistički model za opisivanje procesa generisanja podataka. Kao treće, primenićemo VaR modele opisane u odeljku 2 kako bismo predvideli vrednosti tržišnog rizika. I konačno, izmerene rizike ćemo proveriti backtesting tehnikama.
U analizi podataka, počinjemo od opisnih statističkih osobina podataka iz uzorka. Dnevni istorijski podaci kretanja srpskog berzanskog indeksa akcija (BELEX 15) za period od 4. oktobra 2005. godine do 5. oktobra 2015. godine preuzeti su sa sajta Beogradske berze. Koristićemo isti skup podataka za svaki od pet modela da bismo procenili 1% i 5% jednodnevni VaR. Dakle, koristimo podatke iz perioda pre i nakon finansijske krize iz 2008. godine. Ova serija cena je konvertovana u logaritamske prinose korišćenjem jednačine (3):
(3)
Kako bismo pokrenuli procenu koristimo prvih 500 podataka za početnu procenu VaR-a, i kreiramo skup podataka koji pokriva period od 8. oktobra 2007. godine do 5. oktobra 2015. Godine. Ovu seriju podataka koristimo u svrhu backtestinga. Metodom simulacije nastojimo da utvrdimo kakve bi performanse pokazao svaki VaR model tokom realističnog opsega prinosa indeksa tokom uzorkovanog perioda. Istražili smo performanse izvan uzorka (predviđanje) na osnovu testa bezuslovne pokrivenosti i Christoffersenovih testova nezavisnosti i uslovne pokrivenosti. Backtesting dijagnostika
Jeremić Z., Terzić I., Milojević M.Procena i validacija VaR modela na tržištu kapitala
u Srbiji u periodu od 2005. do 2015. godineBankarstvo, 2016, vol. 45, br. 1 22

according to any of the methods presented in Table 1, is realistic and correct. To assess the predictive performance of the proposed models, we employ a two-stage backtesting procedure. We consider both statistical and loss function measures to evaluate the VaR models forecasting power. In this paper, we use the proportion of failure test proposed by Kupiec (1995), i.e. the unconditional coverage test and Christoffersen’s (1998) independence and conditional coverage tests. Unconditional coverage and independence are fundamental properties of an adequate VaR model. The risk model has the correct forecasting power and effect only if both properties are satisfied.
The test of unconditional coverage, which has been proposed by Kupiec (1995) enables testing so as to check whether the realized VaR deviation rate, which represents the number of days when the loss was higher than VaR, divided by the size of the sample, is in line with the confidence interval.
The drawback of the Kupiec test is that it does not take into account the sequence of violations. To fix this shortcoming, Christoffersen (1998) designed a test that places emphasis to the predecessor of a violation. As stated by Christoffersen (1998), testing solely for the purpose of the correct uncoditional coverage of a VaR-model neglects the possibility that violations might cluster over time. Thus, the second test aims to check whether the process of VaR violations is serially independent.Christoffersen (1998) also developed the conditional coverage test, which represents an incorporated test of the hypothesis of unconditional coverage and independence.
The second stage of the validation process is based on ranking VaR models using two loss functions. Loss function allows for the sizes of tail losses to influence the rankings of VaR models. Models that generate higher tail losses would generate higher values under this size-adjusted loss function than models that generate lower tail losses. In order to select superior VaR models, each model will be graded by two loss functions: quadratic loss function and absolute loss function.
(1)
(2)
The QL and AL functions do not penalize the model when exceptions do not occur. A well performing model yields a lower score.
Data and Empirical Results
The main objectives in this section are the time-series analysis of the Serbian stock index returns and the development of appropriate risk estimation models. Before trying to model and forecast a given time series of returns, it is desirable to have a preliminary look at the data to get a ‘feel’ for them and to understand their main properties. This will be invaluable later on in the modeling process. For this purpose, we first describe the data using summary statistics and graphical methods. Secondly, we introduce the modeling of volatility to find a suitable statistical model to describe the data generating process. Thirdly, we employ VaR models as described in Section 3 to forecast the future values of the market risk. Finally, we verify our risk measures through backtesting techniques.
In data analysis, we start with the descriptive statistical properties of the sample data. The daily historical data on the Serbian blue chip stock index (BELEX 15) from 4th October 2005 until 5th October 2015 are taken from the Belgrade Stock Exchange. Using the same data set, we apply the five models to estimate the 1% and 5% 1-day VaR. We thus use the data from the period both before and after the 2008 financial crisis. This series of prices is converted to log returns series using the equation (3):
(3)
Data sets for VaR estimation start 500 days later and cover the period from 8th October 2007 to 5th October 2015, for the purpose of initializing the estimation. The rest of the data series are used for backtesting purposes. Through the simulation methodology, we attempt to determine how each VaR approach would have performed over a realistic range of indices over the sample period. We investigate out-of-sample (forecasting) performance based on the unconditional coverage test and Christoffersen’s
Jeremić Z., Terzić I., Milojević M.Value at risk estimation and validation in the Serbiancapital market in the period 2005-2015
23 Bankarstvo, 2016, Vol. 45, Issue. 1

2018 procenjenih VaR brojeva za analizirani indeks akcija predstavljena je u tabeli 8.
Pre nego što analiziramo prediktivne performanse VaR modela, neke stilizovane činjenice o seriji prinosa berzanskog indeksa Belex 15 smo ispitali i testirali u tabelama 2, 3, 4 i 5. Grafički prikaz kretanja vrednosti i dnevnih promena indeksa u analiziranom periodu dati su na grafikonu 1.
Na grafikonu 1, dnevni prinosi su predstavljeni kao vremenske serije. Kao što se može videti, period od 2005. do prve polovine 2007. godine karakteriše značajno povećanje vrednosti indeksa kao i ulazak stranih investitora na domaće tržište kapitala (primarna osa). Na grafikonu (sekundarna osa) možemo primetiti da postoje neki periodi u kojima su prinosi volatilniji nego u drugim periodima, što ide u prilogu modelu koji uzima u obzir volatilnost koja se menja s vremenom. Grupisanje volatilnosti u klastere se jasno vidi na grafikonu.
Grafikon 2 daje pregled dnevnih prinosa u okviru Q-Q dijagrama. QQ dijagram pokazuje da su raspodele zadebljanih repova asimetrične u odnosu na normalnu raspodelu jer pozitivni repovi nisu jednaki sa negativnim repovima. Svojstva raspodele prinosa kao što su zadebljani repovi i asimetrija daju povoda za korišćenje raspodele nenormaliteta u ovoj studiji.
Tabela 2 ilustruje deskriptivnu statistiku dnevnih prinosa indeksa. Prosečan prinos je blizu nule i nije moguće statistički odbaciti prosečan prinos koji je jednak nuli (p-vrednost od 24% je mnogo veća od nivoa značajnosti od 5%). Standardna devijacija prinosa potpuno dominira nad srednjom vrednošću prinosa u kratkim vremenskim periodima kao što je dnevni. Neuslovna standardna devijacija je 1,35%. Belex 15 pokazuje spljoštenost koja je iznad 3 (14,36) što ukazuje da raspodela dnevnih prinosa ima zadebljane repove.
Zadebljani repovi znače veću verovatnoću nastanka ekstremnih gubitaka (i dobitaka) nego što bi na to ukazivala normalna raspodela. Adekvatno razumevanje ovih zadebljanih repova je od vitalnog značaja u upravljanju rizikom. Još jedna odlika vremenskih serija je prisustvo zakošenosti. Zapravo, indeks pokazuje pozitivnu zakošenost koja je reda veličine 0,15. Na bazi sumarne statistike možemo zaključiti da vremenska serija nema oblik normalne serije distribucije prinosa.
Grafik 1: Kretanje dnevnih vrednosti i logaritamskih prinosa za Belex 15 od 4. oktobra 2005. do 5. oktobra 2015. godine
Izvor: Beogradska berza, obrada autora
Grafik 2: Q-Q dijagram za Belex 15 od 4. oktobra 2005. do 5. oktobra 2015. godine
Izvor: Autori
Jeremić Z., Terzić I., Milojević M.Procena i validacija VaR modela na tržištu kapitala
u Srbiji u periodu od 2005. do 2015. godineBankarstvo, 2016, vol. 45, br. 1 24

independent and conditional coverage tests. Backtesting diagnostics of 2018 VaR forecasts for the analyzed stock index is presented in Table 8.
Before analyzing the predictive performance of VaR models, some stylized facts of Belex 15 return series are examined and tested in Tables 2, 3, 4 and 5. Graphic representation of levels and daily index changes in the analyzed period is given in Figure 1.
In graph 1, the daily returns are represented as a time series. As it can be seen, the period from 2005 to the first half of 2007 is characterized by the significant increase in index value with the entry of foreign investors into the domestic capital market (primary axis). From the figure (secondary axis) we also observe that there are some periods in which returns are more volatile than in others, which is in favor of a model that accounts for time-varying volatility. Volatility clustering is clearly observable in the graph.
Graph 2 presents the daily returns in a Q-Q plot. QQ plot shows that the fat-tailed distributions are asymmetric against the normal distribution because positive tails are unequal to their counterparts. The fat-tailed and asymmetric properties of return distribution motivate the use of non-normality distribution innovations in this study.
Table 2 shows the descriptive statistics of the daily index returns. The average return is close to zero and it is not possible to statistically reject a zero mean return (p-value of 24% is much higher than 5% significance level). The standard deviation of returns completely dominates the mean of returns at short horizons such as the daily ones. The unconditional standard deviation is 1.35%. Belex 15 exhibits kurtosis above 3 (14.36), which indicates that the daily return distribution has fat tails. Fat tails imply a higher
probability of large losses (and gains) than the normal distribution would suggest. Capturing these fat tails appropriately is crucial in risk management. Another feature of the return series is the presence of skewness. In fact, the index is positively skewed with the magnitude of 0.15. These indicate that the return series is non-normal.
Jeremić Z., Terzić I., Milojević M.Value at risk estimation and validation in the Serbiancapital market in the period 2005-2015
Graph 1. Belex 15 daily index prices and daily log returns from 4th October 2005 to 5th October 2015
Source: Belgrade Stock Exchange; adapted by authors
Graph 2. Q-Q plot Belex 15 in the period 2005-2015
Source: Authors
Theoretical distribution
Empi
rica
l dis
trib
utio
n
25 Bankarstvo, 2016, Vol. 45, Issue. 1

Takođe Jarque-Bera test za nivo značajnosti od 5%, pokazuje da raspodela prinosa nema normalnu distribuciju, kao što je prikazano na tabeli 3. Rezultati dobijeni testom vode do odbijanja nulte hipoteze o normalnoj raspodeli.
Vremenska serija cene indeksa akcija nije stacionaran proces jer se lako može pokazati da se varijansa povećava s vremenom. Ipak, prvi diferencijali u vremenskoj seriji, naime (Pt - Pt−1), čine stacionarnu vremensku seriju. Da bismo testirali da li je određena vremenska serija prinosa Belex 15 akcija stacionarna ili ne, primenićemo indirektan test jediničnog korena (prošireni Dickey-Fullerov test). Takođe, sprovešćemo stacionarni test korišćenjem nekoliko scenarija, kao što je prikazano u tabeli 4. Kada je u pitanju stacionarnost, prevashodno nas zanima stabilnost varijanse i kovarijanse na nivou celog uzorka. Rezultat statističkog testa se poredi sa relevantnom kritičnom vrednošću dobijenim proširenim Dickey-Fullerovim testom. Ukoliko je rezultat statističkog testa manji od kritične vrednosti, odbacujemo nultu hipotezu i zaključujemo da nema jediničnog korena. Prema tome, podaci iz vremenske serije indeksa Belex 15 su stacionarni.
I konačno, tabela 5. pokazuje statistiku Ljung-Box Q testa (beli šum) za autokorelaciju prinosa. Test je izvršen na nivou značajnosti od 5% i sa najviše 25 lagova pa se zaključuje da je autokorelacija prisutna u razmatranoj vremenskoj seriji stope prinosa. Iglov ARCH test izveden za nivo značajnosti od 5% sa najviše 25 lagova ukazuje na prisustvo ARCH efekata u podacima tj. da se kvadrati prinosa nalaze u serijskoj korelaciji i da su prinosi uslovno heteroskedastični. Gore navedene cifre podstiču potrebu za korišćenjem heteroskedastičnih modela za izračunavanje VaR-a. Zaključujemo da prinosi i kvadrati prinosa pokazuju jaku međuzavisnost i kao posledica toga, ovde je najprikladnije primeniti ARMA-ARCH/GARCH model.
Nakon preliminarne deskriptivne i statističke analize, zaključujemo da je dnevni prinosi BELEX 15 indeksa pokazuju uobičajeno kretanje koje je podrobno dokumentovano u finansijskoj literaturi (Mandelbrot, 1963; Fama, 1965; Tsay, 2005; Stoyanov, 2011): grupisanje volatilnosti u klastere, volatilnost ne divergira
Tabela 2: Deskriptivna statistika za vremenske serije stopa prinosa Belex 15 akcija od 4. oktobra 2005. do 5. oktobra 2015 godine
Deskriptivna statistikaTest značajnost
Ciljana vrednost P-vrednost SIG?PROSEK: -0,02% 0 24% NETAČNOSTAND. DEV.: 1,35% - - -ZAKOŠENOST: 0,15 0 0% TAČNOKURTOSIS: 14,36 0 0% TAČNOSREDNJA VREDNOST: -0,02%MIN: -10,86%MAX: 12,16%Q 1: -0,54%Q 3: 0,51%
Izvor: Autori
Tabela 3: Test normalnosti za BELEX 15 od 4. oktobra 2005. do 5. oktobra 2015 godineTest normalnosti Skor C. V. P-vrednost Prolaz?
Jarque-Bera 21871,02 5,99 0,0% NETAČNOIzvor: Autori
Tabela 4: Testovi stacionarnosti BELEX 15 od 4. oktobra 2005. do 5. oktobra 2015 godineTestiranje pri nivou značajanosti od 5% Stat P-vrednost C. V. Stacionaran?
ADFNo Const -10,1 0,1% -1,9 TAČNOConst-Only -10,1 0,1% -2,9 TAČNOConst + Trend -10,1 0,0% -1,6 TAČNOConst+Trend+Trend^2 -10,2 0,0% -1,6 TAČNO
Izvor: Autori
Jeremić Z., Terzić I., Milojević M.Procena i validacija VaR modela na tržištu kapitala
u Srbiji u periodu od 2005. do 2015. godineBankarstvo, 2016, vol. 45, br. 1 26

We also confirmed that this non-normality via the Jarque-Bera test performed at the 5% level, as presented in Table 3. The results obtained by the test lead to the rejection of the null hypothesis of normality.
The time series of stock index prices is not a stationary process as it is easy to show that the variance increases over time. However, the first differentials within the series, namely (Pt − Pt−1), do form a stationary series. To test whether a given time series of Belex 15 log returns is stationary or not, we apply an indirect test for the existence of a unit root (Augmented Dickey-Fuller Test). We also conduct a stationary test using several scenarios, as shown in Table 4. When it comes to stationarity, we are mainly concerned with the stability of variances and covariances throughout the sample.The test statistics value is compared to the relevant critical value for the Augmented Dickey-Fuller Test. If the test statistic is less than the critical value, we reject the null hypothesis and conclude that no unit-root is present. According to that, the time series data of Belex 15 index is stationary.
Finally, Table 5 shows the Ljung-Box Q test statistics (white noise test) for autocorrelation in returns. The test performed at the 5% significance level and with up to 25 lags, leads to the conclusion that autocorrelation is present in the considered return series. Engle’s ARCH test performed at the 5% level with up to 25 lags leads to the conclusion that ARCH effects are present in the data i.e. the squared returns are serially correlated and we have a conditional heteroskedasticity in the log returns.The above features motivate the need for heteroskedasticity models in calculating VaR. We can conclude that the log returns and squared returns exhibit a strong interdependency, and as a result, an ARMA-ARCH/GARCH model may be in order here.
After the preliminary descriptive and statistical analysis, we can conclude that the daily log returns of BELEX 15 index exhibit common patterns that are well-documented in financial literature (Mandelbrot, 1963; Fama, 1965; Tsay, 2005; Stoyanov, 2011): volatility clusters; volatility does not diverge to infinity; autoregressive behavior; skewness and fat tails.
Jeremić Z., Terzić I., Milojević M.Value at risk estimation and validation in the Serbiancapital market in the period 2005-2015
Table 2. Descriptive statistics for the Belex 15 return series in the period 2005-2015
Descriptive StatisticsSignificance test
Target P-Value SIG?AVERAGE: -0.02% 0 24% FALSESTD. DEV.: 1.35% - - -SKEW: 0.15 0 0% TRUEKURTOSIS: 14.36 0 0% TRUEMEDIAN: -0.02%MIN: -10.86%MAX: 12.16%Q 1: -0.54%Q 3: 0.51%
Source: Authors
Table 3. BELEX 15 normality test of in the period 2005-2015Normality Test Score C. V. P-Value Pass?
Jarque-Bera 21871,02 5,99 0.0% FALSESource: Authors
Table 4. Stationarity tests of BELEX 15 in the period 2005-2015Test at 5% significance Stat P-Value C. V. Stationary?
ADFNo Const -10,1 0.1% -1,9 TRUEConst-Only -10,1 0.1% -2,9 TRUEConst + Trend -10,1 0.0% -1,6 TRUEConst+Trend+Trend^2 -10,2 0.0% -1,6 TRUE
Source: Authors
27 Bankarstvo, 2016, Vol. 45, Issue. 1

u beskonačnost, autoregresivno ponašanje, zakošenost i zadebljani repovi.
Da bismo izračunali jednodnevni VaR prvo smo koristili istorijsku simulaciju. VaR dobijen istorijskom simulacijom jednostavno aproksimira VaR-u kao 100-ti percentil ili statistiku Tpti reda za skup od T istorijskih pseudo prinosa konstruisanih na osnovu istorijskih cena.
Drugi model je Risk Metrics metoda, gde se dnevne varijanse izračunavaju korišćenjem eksponencijalno ponderisanog pokretnog proseka sa faktorom opadanja od 0,94. Za razliku od jednostavne procene pokretnog proseka volatilnosti, eksponencijalno ponderisan pokretni prosek omogućava najskorašnjijim posmatranjima da imaju veći uticaj na izračun VaR-a od posmatranja iz dalje prošlosti. Prednost ove procene je što beleži šokove na tržištu bolje nego što to čini jednostavni pokretni prosek pa smo za izračun VaR-a izuzeli alternativu jednako ponderisanih pokretnih proseka.
Drugi pristup za procenu vrednosti koju varijansa ima u izračunu VaR-a uključuje korišćenje modifikovanog Risk Metrics modela sa optimalnim faktorom opadanja za tržište kapitala u Srbiji. Optimalni faktor opadanja smo dobili korišećnjem statistike za procenu budućih rezultata kao što je koren iz srednje kvadratne greške (RMSE). Kako bismo pronašli optimalnu vrednosti, postavili smo problem optimizacije radi svođenja na minimum korena iz srednje kvadratne greške između procenjene EWMA vrednosti i ostvarene volatilnosti, variranjem lambda vrednosti. Optimalna dobijena lambda vrednost za skup podataka Belex 15 prinosa je 0,83, kao što je prikazano na grafikonu 3.
Empirijska istraživanja su čvrsto ustanovila činjenicu da je grupisanje volatilnosti po klasterima stilizovana činjenica o prinosu aktive. Predlagani su različiti ekonometrijski modeli koji bi pojasnili volatilnost koja varira kroz vreme a oni koji su najčešće korišćeni su modeli GARCH tipa (Stoyanov et al, 2011). U našoj studiji smo koristili modele vremenskih serija GARCH (1,1) i EGARCH (1,1) kako bi smo raščistili grupisanje efekta volatilnosti u klastere pretpostavljajući normalnu, klasičnu studentov-t raspodelu i GED raspodelu inovacija. Kako bismo dobili uslovnu volatilnost zasnovanu na modelima iz GARCH porodice modela i kasnije je uključili u formulu za izračun VaR-a, parametri modela su računati korišćenjem metoda maksimizacije funkcije verodostojnosti (LLF). Procene maksimalne verodostojnosti za parametre smo dobili numeričkom maksimizacijom LLF korišćenjem NUMXL softvera za predviđanje vremenskih serija. Procene optimalnih parametara iz različitih specifikacija uslovnih heteroskedastičnih
Grafik 3: Optimalni faktor opadanja za procenjenu EWMA vrednost za BELEX 15
Izvor: Autori
Tabela 5: Test belog šuma indeksa BELEX 15 i test ARCH efekta indeksa BELEX 15
Test belog šuma Test ARCH efektaLag Skor C. V. P-vrednost Prolazi? Skor C. V. P-vrednost Prisutan?
1 265,9986 3,841459 0% NETAČNO 312,5094 3,841459 0% TAČNO5 324,1471 11,0705 0% NETAČNO 736,726 11,0705 0% TAČNO10 351,9588 18,30704 0% NETAČNO 978,6753 18,30704 0% TAČNO15 437,0058 24,99579 0% NETAČNO 1125,779 24,99579 0% TAČNO20 511,0028 31,41043 0% NETAČNO 1202,639 31,41043 0% TAČNO25 533,3954 37,65248 0% NETAČNO 1234,12 37,65248 0% TAČNO
Izvor: Autori
Jeremić Z., Terzić I., Milojević M.Procena i validacija VaR modela na tržištu kapitala
u Srbiji u periodu od 2005. do 2015. godineBankarstvo, 2016, vol. 45, br. 1 28
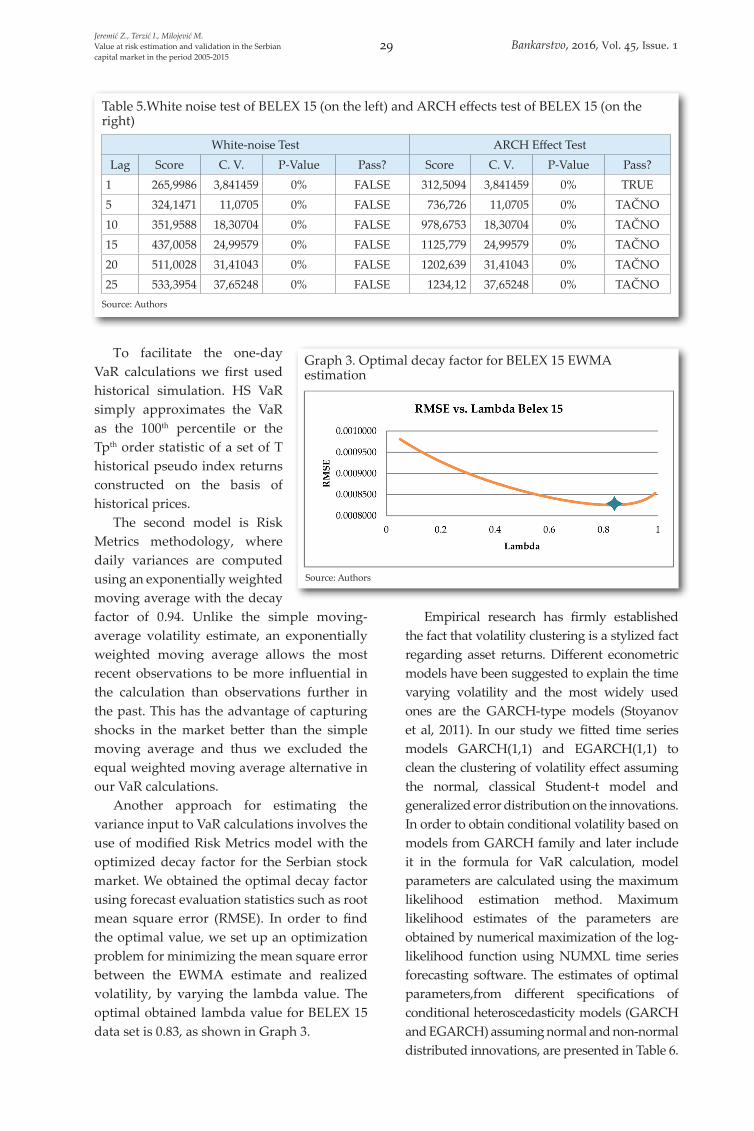
To facilitate the one-day VaR calculations we first used historical simulation. HS VaR simply approximates the VaR as the 100th percentile or the Tpth order statistic of a set of T historical pseudo index returns constructed on the basis of historical prices.
The second model is Risk Metrics methodology, where daily variances are computed using an exponentially weighted moving average with the decay factor of 0.94. Unlike the simple moving-average volatility estimate, an exponentially weighted moving average allows the most recent observations to be more influential in the calculation than observations further in the past. This has the advantage of capturing shocks in the market better than the simple moving average and thus we excluded the equal weighted moving average alternative in our VaR calculations.
Another approach for estimating the variance input to VaR calculations involves the use of modified Risk Metrics model with the optimized decay factor for the Serbian stock market. We obtained the optimal decay factor using forecast evaluation statistics such as root mean square error (RMSE). In order to find the optimal value, we set up an optimization problem for minimizing the mean square error between the EWMA estimate and realized volatility, by varying the lambda value. The optimal obtained lambda value for BELEX 15 data set is 0.83, as shown in Graph 3.
Empirical research has firmly established the fact that volatility clustering is a stylized fact regarding asset returns. Different econometric models have been suggested to explain the time varying volatility and the most widely used ones are the GARCH-type models (Stoyanov et al, 2011). In our study we fitted time series models GARCH(1,1) and EGARCH(1,1) to clean the clustering of volatility effect assuming the normal, classical Student-t model and generalized error distribution on the innovations. In order to obtain conditional volatility based on models from GARCH family and later include it in the formula for VaR calculation, model parameters are calculated using the maximum likelihood estimation method. Maximum likelihood estimates of the parameters are obtained by numerical maximization of the log-likelihood function using NUMXL time series forecasting software. The estimates of optimal parameters,from different specifications of conditional heteroscedasticity models (GARCH and EGARCH) assuming normal and non-normal distributed innovations, are presented in Table 6.
Jeremić Z., Terzić I., Milojević M.Value at risk estimation and validation in the Serbiancapital market in the period 2005-2015
Table 5.White noise test of BELEX 15 (on the left) and ARCH effects test of BELEX 15 (on the right)
White-noise Test ARCH Effect TestLag Score C. V. P-Value Pass? Score C. V. P-Value Pass?
1 265,9986 3,841459 0% FALSE 312,5094 3,841459 0% TRUE5 324,1471 11,0705 0% FALSE 736,726 11,0705 0% TAČNO10 351,9588 18,30704 0% FALSE 978,6753 18,30704 0% TAČNO15 437,0058 24,99579 0% FALSE 1125,779 24,99579 0% TAČNO20 511,0028 31,41043 0% FALSE 1202,639 31,41043 0% TAČNO25 533,3954 37,65248 0% FALSE 1234,12 37,65248 0% TAČNO
Source: Authors
Graph 3. Optimal decay factor for BELEX 15 EWMA estimation
Source: Authors
29 Bankarstvo, 2016, Vol. 45, Issue. 1

modela (GARCH i EGARCH), uz pretpostavku normalne i ne-normalne raspodele inovacija, predstavljene su u tabeli 6.
Odabir modela je izvršen u skladu sa LLF kriterijumom. U tabeli 7 su sažeto prikazane LLF vrednosti svakog modela i naši rezultati pokazuju da je GARCH model sa GED raspodelom inovacijama razuman model koji dobro odgovara podacima jer ima najveću vrednost verodostojnosti a pretpostavke modela su uglavnom zadovoljene. Shodno tome, koristimo GARCH model sa GED raspodelom za predviđanje volatilnosti u linearnoj VaR formuli (videti tabelu 1).
Sledeća faza modelovanja se zove verifikacija modela. Verifikacija je opšti proces provere da li je model adekvatan. Ovaj odeljak se fokusira na backtesting tehnike za proveru tačnosti VaR modela. Kako bismo izvršili validaciju modela rizika, formalno ćemo testirati da li sekvence izuzetaka zadovoljavaju standardne uslove za backtesting. Formalno, potrebno nam je da ispitamo nultu hipotezu da je verovatnoća da dobijemo izuzetak jedanaka α. Uobičajen način za proveru VaR modela jeste da se izbroji broj izuzetaka kada gubici po portfoliju premašuju procenjeni VaR. Tačnim VaR pristupom se dobija broj prekoračenja od VaR-a koji je
najbliži mogući broju prekoračenja od VaR-a utvrđen intervalom poverenja. Ukoliko je broj odstupanja veći od broja koji sugeriše izabrani interval poverenja, može se tumačiti da model potcenjuje rizik. S druge strane, ukoliko je broj odstupanja manji, onda model precenjuje rizik. Test se obavlja korišćenjem T1 / T, gde je T ukupan broj posmatranja a T1 je broj odstupanja za određeni interval poverenja.
Poređenjem broja prekoračenja od procenjenog VaR-a vizuelnom proverom (videti grafikon 4) vidimo da rezultati ukazuju da su EWMA i RM VaR modeli previše optimistični, naročito sa dnevnim predviđanjem VaR-a za interval poverenja od 99% koji su previše niski. Suprotno tome, izgleda da svi drugi modeli daju izuzetke koji su u skladu sa intervalom poverenja tj. bezuslovne pokrivenosti.
Rezultati backtestinga VaR modela za Belex 15 su prikazani u tabeli 8. Uzeli smo u razmatranje rezultate statističkih testova (racio test verodostojnosti) u svrhu backtestinga za bezuslovni pokrivenost, i osobinu nezavisnosti i uslovnu pokrivenost.
Tabela 6: Procenjeni optimalni GARCH i EGARCH parametri za normalnu, GED i studentov-t raspodelu prinosa BELEX 15
GARCH (1,1) EGARCH (1,1)Parametar Vrednost Parametar Vrednost
μ 0,00 μ 0,00α0 0,00 α0 -0,91α1 0,28 α1 0,50β1 0,71 γ1 -0,06
β1 0,94GARCH (1,1) & t-dist (v) EGARCH (1,1) & t-dist (v)
μ 0,00 μ 0,00α0 0,00 α0 -8,32α1 0,18 α1 0,68β1 0,16 γ1 -0,04ν 4,00 β1 0,15
ν 4,00GARCH (1,1) & GED (v) EGARCH (1,1) & GED (v)
μ 0,00 μ 0,00α0 0,00 α0 -8,21α1 0,26 α1 0,64β1 0,72 γ1 -0,04ν 1,29 β1 0,14
ν 1,00Izvor: Autori
Tabela 7. LLF koji daje maksimalnu vrednost za BELEX 15
Normalna t-Dist GED
GARCH (1,1) 8213,69 8097,99 8292,73
EGARCH (1,1) 8231,38 8094,47 8084,59Izvor: Autori
Jeremić Z., Terzić I., Milojević M.Procena i validacija VaR modela na tržištu kapitala
u Srbiji u periodu od 2005. do 2015. godineBankarstvo, 2016, vol. 45, br. 1 30

Model selection was done according to the log likelihood function criteria. We summarize the LLF value of each model in Table 7 and our results indicate that GARCH model with GED innovations is a reasonable model that fits the data well, because it has the highest log-likelihood value and the model assumptions are largely satisfied. Consequently, we use GARCH model with generalized error distributed innovations for volatility forecasting in the linear VaR formula (see Table 1).
The next modeling stage is called model verification. Verification is the general process of checking whether the model is adequate. This section focuses on backtesting techniques for verifying the accuracy of VaR models. In order to validate the risk model, we formally test whether the sequences of exceptions satisfy the standard backtesting conditions. Formally, we need to test the null hypothesis that the probability of having an exception is α. A typical way to examine a VaR model is to
count the number of VaR violations when portfolio losses exceed the VaR estimates. An accurate VaR approach produces a number of VaR exceedances as close as possible to the number of VaR exceedances specified by the confidence level. If the number of violations is higher than the selected confidence level would indicate, then the model underestimates the risk. On the other hand, if the number of violations is smaller, then the model overestimates the risk. The test is conducted as T1 /T, where T is the total number of observations, and T1 is the number of violations for the specific confidence level.
Comparing the number of exceedances by visual inspection (see Graph 4), the results indicate that EWMA and RM VaR models are too optimistic, particularly with their daily 99% VaR forecasts being too low. In contrast, it seems that all other models produce exceptions that are consistent with the confidence level, i.e. unconditional coverage.
The backtesting results of VaR models for the Belex 15 are shown in Table 8. We consider the results of statistical tests (likelihood ratio tests) for the purpose of backtesting for unconditional coverage, independence and conditional coverage.
Jeremić Z., Terzić I., Milojević M.Value at risk estimation and validation in the Serbiancapital market in the period 2005-2015
Table 6. Estimated optimal GARCH and EGARCH parameters for Normal, Generalized error and Student-t innovation distribution of BELEX 15
GARCH (1,1) EGARCH (1,1)Parametar Vrednost Parametar Vrednost
μ 0,00 μ 0,00α0 0,00 α0 -0,91α1 0,28 α1 0,50β1 0,71 γ1 -0,06
β1 0,94GARCH (1,1) & t-dist (v) EGARCH (1,1) & t-dist (v)
μ 0,00 μ 0,00α0 0,00 α0 -8,32α1 0,18 α1 0,68β1 0,16 γ1 -0,04ν 4,00 β1 0,15
ν 4,00GARCH (1,1) & GED (v) EGARCH (1,1) & GED (v)
μ 0,00 μ 0,00α0 0,00 α0 -8,21α1 0,26 α1 0,64β1 0,72 γ1 -0,04ν 1,29 β1 0,14
ν 1,00Source: Authors
Table 7. Log likelihood function maximizing values of BELEX 15
Normal t-Dist GED
GARCH (1,1) 8213,69 8097,99 8292,73
EGARCH (1,1) 8231,38 8094,47 8084,59Source: Authors
31 Bankarstvo, 2016, Vol. 45, Issue. 1
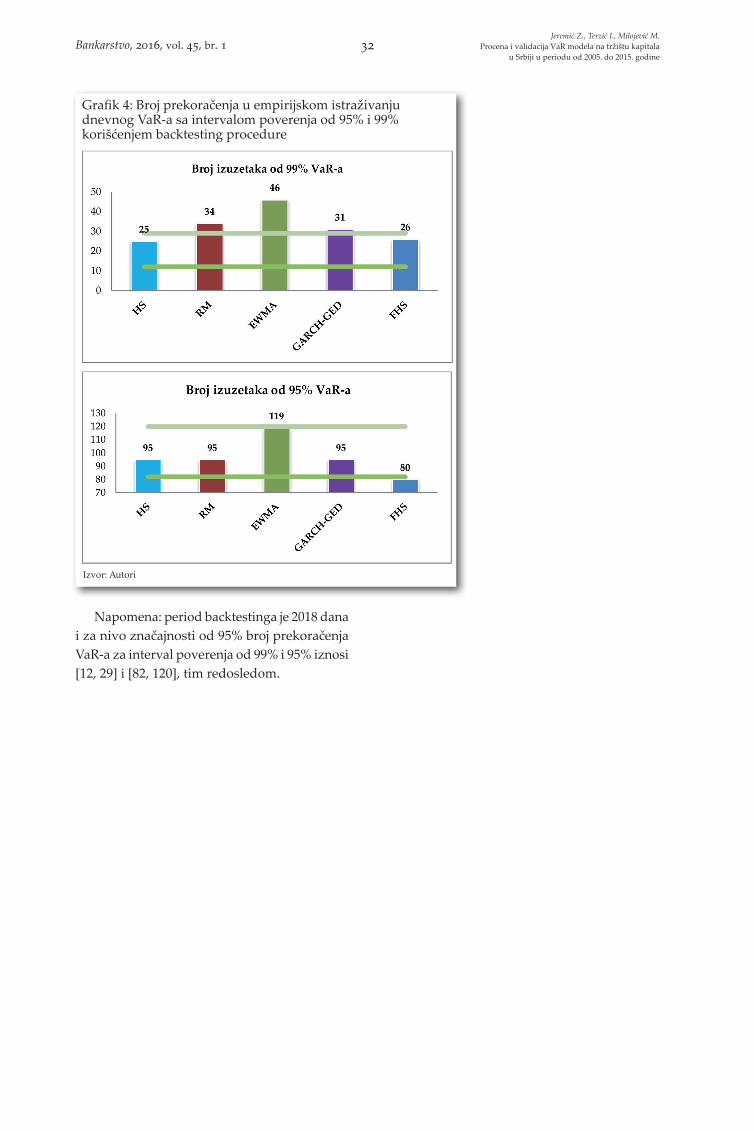
Napomena: period backtestinga je 2018 dana i za nivo značajnosti od 95% broj prekoračenja VaR-a za interval poverenja od 99% i 95% iznosi [12, 29] i [82, 120], tim redosledom.
Grafik 4: Broj prekoračenja u empirijskom istraživanju dnevnog VaR-a sa intervalom poverenja od 95% i 99% korišćenjem backtesting procedure
Izvor: Autori
Jeremić Z., Terzić I., Milojević M.Procena i validacija VaR modela na tržištu kapitala
u Srbiji u periodu od 2005. do 2015. godineBankarstvo, 2016, vol. 45, br. 1 32
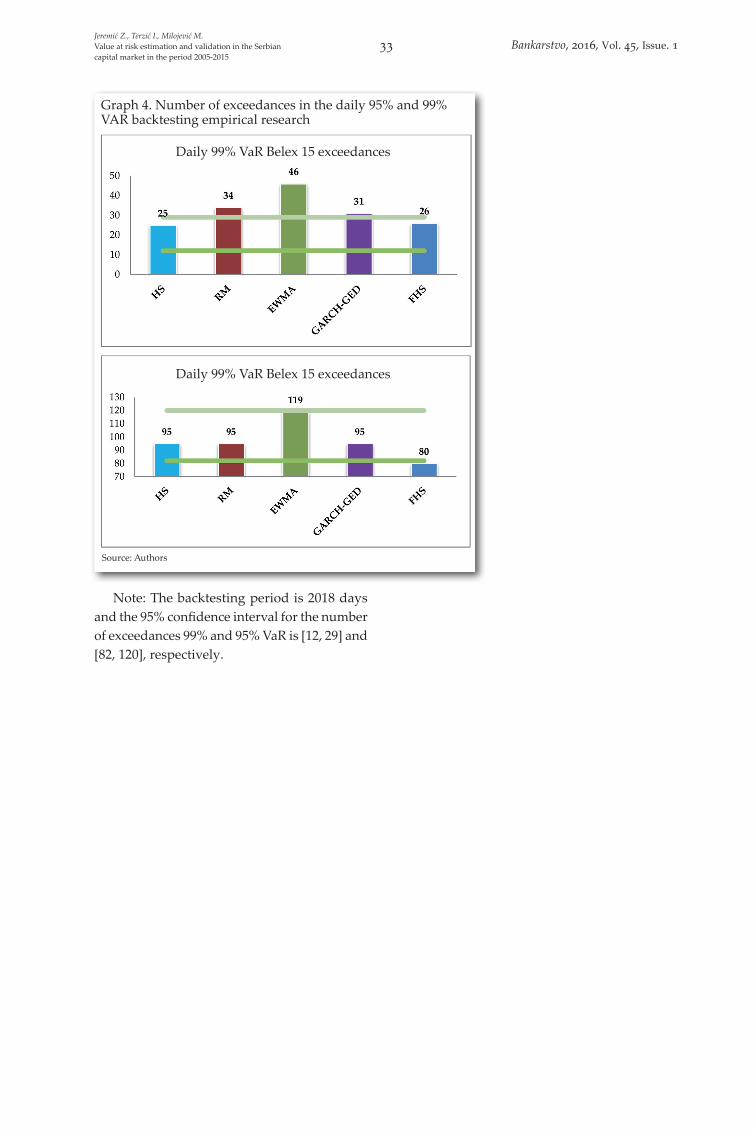
Note: The backtesting period is 2018 days and the 95% confidence interval for the number of exceedances 99% and 95% VaR is [12, 29] and [82, 120], respectively.
Jeremić Z., Terzić I., Milojević M.Value at risk estimation and validation in the Serbiancapital market in the period 2005-2015
Graph 4. Number of exceedances in the daily 95% and 99% VAR backtesting empirical research
Source: Authors
Daily 99% VaR Belex 15 exceedances
Daily 99% VaR Belex 15 exceedances
33 Bankarstvo, 2016, Vol. 45, Issue. 1

Kao što se može videti iz tabele 8, zadovoljavajući učinak u pogledu Christoffersenovog testa zajedničke uslovne pokrivenosti je zabeležen za parametarski model (GARCH-GED VaR) za interval poverenja od 99% i za poluparametarski model (FIS VaR) na oba intervala poverenja. Vrlo slab učinak je zabeležen kod IS (500), RM i EWMA (0,83) metode izračuna VaR-a za nivoe značajanosti od 1% i 5%. Iako model istorijske simulacije zadovoljava uslov bezuslovne pokrivenosti za oba intervala poverenja, očigledno je grupisanje izuzetaka u klastere. RM i EWMA modeli sa optimalnim parametrom opadanja su pokazali najslabiji učinak, s tim da je EWMA 1% VaR model, za razliku od RM 1% VaR-a, bio u stanju da generiše nezavisne izuzetke od VaR-a. Rezultati backtestova za VaR vrednost dobijenu istorijskom simulacijom i RM modelom na tržištu kapitala u Srbiji su bili u skladu sa ranijim nalazima Terzića i Milojevića (2013), što nas dovodi do zaključka da istorijska simulacija i RM
model nisu pogodni za merenje tržišnog rizika na ovom finansijskom tržištu. Stoga, neuspeh ovih modela se potvrđuje u raznim uzorcima vremenskih serija i vremenskih intervala rizika.
Za validaciju VaR modela izabrali smo kriterijum koji predstavlja rezultate dva testa i bazirali naše nalaze na činjenici da VaR modeli ispunjavaju oba svojstva istovremeno: bezuslovnu pokrivenosti i nezavisnost tj. uslovnu pokrivenost. Prema tome, u slučaju prva tri VaR modela nijedan nije ispunio u potpunosti oba kriterijuma za backtesting za VaR modele. Možemo zaključiti da istorijska simulacija, RM i optimalni EWMA 1% i 5% VaR model dovode do pogrešnog prestavljanja stvarne izloženosti riziku u posmatranom vremenskom okviru. Izostanak uredno naznačene dinamike u modelu istorijske simulacije može dovesti do ignorisanja dobro poznate stilizovane činjenice o zavisnosti prinosa, i ono što je najznačanije, do grupisanja varijansi u klastere. Ovo obično uzrokuje da istorijska simulacija reaguje previše sporo na promene tržišnog rizika.
Tabela 8: Rezultati backtestinga i dijagnostike VaR modela za period od 8. oktobra 2007. do 5. oktobra 2015. godine
BELEX 15
HS (RW 500) VaR Risk Metric (RM) EWMA (0,83) VaR GARCH-GED VaR FHS VaR
1% 5% 1% 5% 1% 5% 1% 5% 1% 5%
T0 1993 1923 1984 1923 1972 1899 1987 1923 1992 1938
T1 25 95 34 95 46 119 31 95 26 80
T00 1975 1859 1957 1845 1928 1799 1957 1841 1966 1871
T01 18 64 27 78 44 100 30 82 26 72
T10 18 64 27 78 44 100 30 82 26 72
T11 7 31 7 17 2 19 1 13 0 9
p ^ 1,24% 4,71% 1,68% 4,71% 2,28% 5,90% 1,54% 4,71% 1,29% 3,96%
L (p)^ 3,43E-59 4,42E-167 1,15E-75 4,42E-167 5,16E-96 3,79E-197 2,63E-70 4,42E-167 4,39E-61 6,43E-147
L (p) 2,00E-59 3,67E-167 2,19E-77 3,67E-167 2,47E-101 7,49E-198 2,12E-71 3,67E-167 2,02E-61 5,57E-148
p ^01
0,90% 3,33% 1,36% 4,06% 2,23% 5,27% 1,51% 4,26% 1,31% 3,72%
p ^11
28,00% 32,63% 20,59% 17,89% 4,35% 15,97% 3,23% 13,68% 0,00% 11,25%
L (p1)^ 9,64E-52 1,09E-148 2,88E-70 7,44E-162 7,40E-96 1,54E-193 3,30E-70 2,16E-164 6,17E-61 1,01E-146
LRuc 1,081 0,370 7,929 0,370 24,498 3,240 5,035 0,370 1,554 4,890
LRind 34,301 84,702 24,857 24,070 0,721 16,626 0,454 12,387 0,679 0,902
LRcc 35,382 85,072 32,786 24,440 25,220 19,866 5,489 12,757 2,233 5,792
Testiranje hipoteza (Hi kvadrat Test)
LRuc Accept Accept Reject Accept Reject Accept Reject Accept Accept Reject
LRind Reject Reject Reject Reject Accept Reject Accept Reject Accept Accept
LRcc Reject Reject Reject Reject Reject Reject Accept Reject Accept Accept
Izvor: Autori
Jeremić Z., Terzić I., Milojević M.Procena i validacija VaR modela na tržištu kapitala
u Srbiji u periodu od 2005. do 2015. godineBankarstvo, 2016, vol. 45, br. 1 34

As evident from Table 8, the satisfactory performance with regards to Christoffersen’sjointconditional coverage test is recorded for the parametric model (GARCH-GED VaR) at 99% confidence level and semi-parametric model (FHS VaR) at both confidence levels. Very weak performance is recorded for HS (500), RM and EWMA (0.83) 1% and 5% VaR. Although HS approach satisfied the unconditional coverage condition at both confidence levels, the clustering of exceptions is evident. RM and EWMA with the optimized decay parameter were the worst performers, but EWMA 1% VaR model unlike RM 1% VaR was able to generate the independent VaR failures. The results of backtests for HS and RM VaR in the Serbian stock market are consistent with the earlier findings of Terzić et al. (2013), which leads us to conclude that HS and RM VaR models are not suitable for measuring market risk in this financial market. Thus, the failure of these models is confirmed in various time series samples and risk horizons.
As thevalidationcriterion for VaR models we chose the results of two tests and based our findings on the fact that VaR models must simultaneously satisfy both unconditional coverage and independence properties, i.e. conditional coverage property. Accordingly, none of the first three VaR models fully satisfied the both backtesting criteria for VaR models. We can conclude that HS, RM and optimal EWMA 1% and 5% VaR lead to misrepresentation of actual risk exposures within the observed time horizon. The lack of properly specified dynamics in the HS methodology causes it to ignore well-established stylized facts on return dependence, most importantly variance clustering. This typically causes the HS VaR to react too slowly to changes in the market risk environment.
On the other hand, the use of more sophisticated models based on GARCH volatility forecasting, especially the combination of historical simulation with GARCH estimates of volatility (FHS), significantly improves
Jeremić Z., Terzić I., Milojević M.Value at risk estimation and validation in the Serbiancapital market in the period 2005-2015
Table 8. Backtesting results and diagnostics of VaR models from 8th October 2007 to 5th October 2015
BELEX 15
HS (RW 500) VaR Risk Metric (RM) EWMA (0,83) VaR GARCH-GED VaR FHS VaR
1% 5% 1% 5% 1% 5% 1% 5% 1% 5%
T0 1993 1923 1984 1923 1972 1899 1987 1923 1992 1938
T1 25 95 34 95 46 119 31 95 26 80
T00 1975 1859 1957 1845 1928 1799 1957 1841 1966 1871
T01 18 64 27 78 44 100 30 82 26 72
T10 18 64 27 78 44 100 30 82 26 72
T11 7 31 7 17 2 19 1 13 0 9
p ^ 1,24% 4,71% 1,68% 4,71% 2,28% 5,90% 1,54% 4,71% 1,29% 3,96%
L (p)^ 3,43E-59 4,42E-167 1,15E-75 4,42E-167 5,16E-96 3,79E-197 2,63E-70 4,42E-167 4,39E-61 6,43E-147
L (p) 2,00E-59 3,67E-167 2,19E-77 3,67E-167 2,47E-101 7,49E-198 2,12E-71 3,67E-167 2,02E-61 5,57E-148
p ^01
0,90% 3,33% 1,36% 4,06% 2,23% 5,27% 1,51% 4,26% 1,31% 3,72%
p ^11
28,00% 32,63% 20,59% 17,89% 4,35% 15,97% 3,23% 13,68% 0,00% 11,25%
L (p1)^ 9,64E-52 1,09E-148 2,88E-70 7,44E-162 7,40E-96 1,54E-193 3,30E-70 2,16E-164 6,17E-61 1,01E-146
LRuc 1,081 0,370 7,929 0,370 24,498 3,240 5,035 0,370 1,554 4,890
LRind 34,301 84,702 24,857 24,070 0,721 16,626 0,454 12,387 0,679 0,902
LRcc 35,382 85,072 32,786 24,440 25,220 19,866 5,489 12,757 2,233 5,792
Hypotheses tests (Chi square Test)
LRuc Accept Accept Reject Accept Reject Accept Reject Accept Accept Reject
LRind Reject Reject Reject Reject Accept Reject Accept Reject Accept Accept
LRcc Reject Reject Reject Reject Reject Reject Accept Reject Accept Accept
Source: Authors
35 Bankarstvo, 2016, Vol. 45, Issue. 1

S druge strane, korišćenje sofisticiranijih modela baziranih na predviđanju volatilnosti pomoću GARCH modela, naročito kombinacijom istorijske simulacije sa GARCH procenama volatilnosti (FIS), značajno poboljšava procenu tržišnog rizika i tačno kvantifikuje rizik. U slučaju filtrirane istorijske simulacije, VaR vrednost je prošla backtest za uslovnu pokrivenost za intervale poverenja od 95% i 99%, dok je GARCH-GED VaR model prošao test za interval poverenja od 99%. Dobijeni rezultati su u skladu sa ranijim nalazima Milojevića i Terzića (2014), pa u tom smislu možemo zaključiti da je model filtrirane istorijske simulacije pokazao izuzetnu stabilnost i postojanost za različite vremenske periode kada je u pitanju domaće tržište kapitala.
Prema korišćenoj dvofaznoj backtesting proceduri, VaR model sa najboljim učinkom mora pre svega proći i test bezuslovne pokrivenosti i Christoffersenov test nezavisnosti a zatim dati superiorna, u smislu svođenja na minimum statističkih grešaka, predviđanja gubitaka u repovima. Optimalna VaR vrednost treba funkciju gubitka da svede na minimum. Izbor modela se oslanja na analizu skorova funkcije gubitka koji su predstavljeni u tabeli 9. U ovu svrhu, primenili smo QL i AL funkcije kao što je prikazano i opisano u jednačinama 1 i 2.
U smislu QL funkcije gubitka pri intervalu poverenja od 99%, model filtrirane istorijske simulacije je apsolutni pobednik. RM i EWMA zauzimaju drugo i treće mesto. GARCH-GED VaR model, koji nije odbačen statističkim testovima, rangira se četvrti. Model istorijske simulacije ima najslabiji učinak. U pogledu AL funkcije gubitka, model filtrirane istorijske simulacije opet pokazuje dobar učinak. Daje najniži AL, dok se GARCH-GED model nalazi na četvrtom mestu. RM zauzima istu poziciju, dok model istorijske simulacije i EWMA menjanju mesta. Visoki skorovi za QL i AL funkciju koje daje GARCH model mogu ukazivati da ovaj model ima tendenciju da precenjuje VaR.
Između ovih pet modela, pri intervalu
poverenja od 95%, u smislu QL i AL funkcija gubitka, model filtrirane istorijske simulacije opet pokazuje dobar učinak. Daje najnižu QL a kod AL vrednosti se rangira kao drugi model. Ovaj model se, čini se, ističe iako se razlike u rezultatima relativno male. U slučaju GARCH-GED VaR-a sa intervalom poverenja od 95%, ovaj model deluje kao dobar izbor za modelovanje VaR-a za indeks Beogradske berze. Razmotreni RM i EWMA modeli sa intervalom poverenja od 95% ne daju dobre rezultate i nisu pogodni za modelovanje VaR-a na ovom tržištu. Njihovi dnevni 95% VaR-a deluju previše optimistično, sa vrlo niskim predviđenim vrednostima.
Ovi rezultati potvrđuju da regulatorna tela i investitori na finansijskim tržištima u zemljama u tranziciji treba da promene tradicionalno viđenje i razumevanje modelovanja rizika i prinosa. Potrebno je da uvedu robusnije i kompleksnije mere rizika, dok VaR modeli razvijeni za mirna i stabilna razvijena tržišta nisu pogodni za tržište kapitala u Srbiji. Zaključujemo da VaR modeli bazirani na pretpostavci o normalnoj raspodeli nisu pogodni za merenje finansijskih rizika na tržištu kapitala u Srbiji i daju nove dokaze da su kompleksnije i komplikovanije verzije VaR modela prikladnije za ovo tržište. Ovi rezultati mogu imati veliku vrednost za domaće i strane investitore.
Zaključak
Ogromni gubici koji su nastali tokom nedavne globalne ekonomske krize pokrenuli su debatu o tome da li postojeći VaR modeli, umnogome bazirani na pretpostavci o normalnoj raspodeli, predstavljaju adekvatan i pouzdan okvir za merenje finansijskog rizika na tržištima u nastajanju. U ovom radu, istraživali smo
Tabela 9: Skorovi funkcija gubitka i rangiranje različitih VaR modela
Belex 15 VaR QL Belex 15
VaR AL Belex 15 VaR QL Belex 15
VaR AL
1% FHS 0,000059 1% FHS 0,000786 5% FHS 0,000121 5% GARCH 0,002053
1% RM 0,000089 1% RM 0,001009 5% GARCH 0,000125 5% FHS 0,002099
1% EWMA 0,000090 1% HS 0,001133 5% RM 0,000130 5% RM 0,002104
1% GARCH 0,000095 1% GARCH 0,001135 5% EWMA 0,000130 5% HS 0,002194
1% HS 0,000107 1% EWMA 0,001227 5% HS 0,000130 5% EWMA 0,002380
Izvor: Autori
Jeremić Z., Terzić I., Milojević M.Procena i validacija VaR modela na tržištu kapitala
u Srbiji u periodu od 2005. do 2015. godineBankarstvo, 2016, vol. 45, br. 1 36
the market risk assessment and quantifies risk accurately. In case of theFHS approach, VaR passed the conditional coverage backtest at 95% and 99% confidence levels, while GARCH-GED VaR passed the test at 99% confidence level.
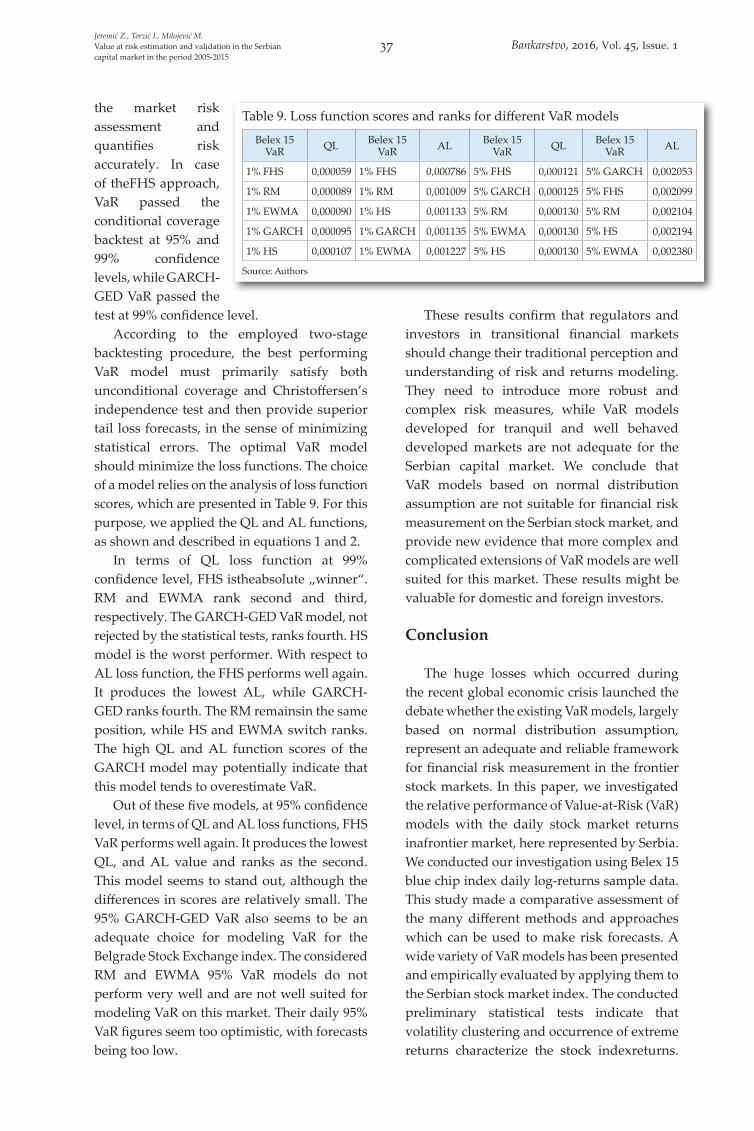
According to the employed two-stage backtesting procedure, the best performing VaR model must primarily satisfy both unconditional coverage and Christoffersen’s independence test and then provide superior tail loss forecasts, in the sense of minimizing statistical errors. The optimal VaR model should minimize the loss functions. The choice of a model relies on the analysis of loss function scores, which are presented in Table 9. For this purpose, we applied the QL and AL functions, as shown and described in equations 1 and 2.
In terms of QL loss function at 99% confidence level, FHS istheabsolute „winner“. RM and EWMA rank second and third, respectively. The GARCH-GED VaR model, not rejected by the statistical tests, ranks fourth. HS model is the worst performer. With respect to AL loss function, the FHS performs well again. It produces the lowest AL, while GARCH-GED ranks fourth. The RM remainsin the same position, while HS and EWMA switch ranks. The high QL and AL function scores of the GARCH model may potentially indicate that this model tends to overestimate VaR.
Out of these five models, at 95% confidence level, in terms of QL and AL loss functions, FHS VaR performs well again. It produces the lowest QL, and AL value and ranks as the second. This model seems to stand out, although the differences in scores are relatively small. The 95% GARCH-GED VaR also seems to be an adequate choice for modeling VaR for the Belgrade Stock Exchange index. The considered RM and EWMA 95% VaR models do not perform very well and are not well suited for modeling VaR on this market. Their daily 95% VaR figures seem too optimistic, with forecasts being too low.
These results confirm that regulators and investors in transitional financial markets should change their traditional perception and understanding of risk and returns modeling. They need to introduce more robust and complex risk measures, while VaR models developed for tranquil and well behaved developed markets are not adequate for the Serbian capital market. We conclude that VaR models based on normal distribution assumption are not suitable for financial risk measurement on the Serbian stock market, and provide new evidence that more complex and complicated extensions of VaR models are well suited for this market. These results might be valuable for domestic and foreign investors.
Conclusion
The huge losses which occurred during the recent global economic crisis launched the debate whether the existing VaR models, largely based on normal distribution assumption, represent an adequate and reliable framework for financial risk measurement in the frontier stock markets. In this paper, we investigated the relative performance of Value-at-Risk (VaR) models with the daily stock market returns inafrontier market, here represented by Serbia. We conducted our investigation using Belex 15 blue chip index daily log-returns sample data. This study made a comparative assessment of the many different methods and approaches which can be used to make risk forecasts. A wide variety of VaR models has been presented and empirically evaluated by applying them to the Serbian stock market index. The conducted preliminary statistical tests indicate that volatility clustering and occurrence of extreme returns characterize the stock indexreturns.
Jeremić Z., Terzić I., Milojević M.Value at risk estimation and validation in the Serbiancapital market in the period 2005-2015
Table 9. Loss function scores and ranks for different VaR models
Belex 15 VaR QL Belex 15
VaR AL Belex 15 VaR QL Belex 15
VaR AL
1% FHS 0,000059 1% FHS 0,000786 5% FHS 0,000121 5% GARCH 0,002053
1% RM 0,000089 1% RM 0,001009 5% GARCH 0,000125 5% FHS 0,002099
1% EWMA 0,000090 1% HS 0,001133 5% RM 0,000130 5% RM 0,002104
1% GARCH 0,000095 1% GARCH 0,001135 5% EWMA 0,000130 5% HS 0,002194
1% HS 0,000107 1% EWMA 0,001227 5% HS 0,000130 5% EWMA 0,002380
Source: Authors
37 Bankarstvo, 2016, Vol. 45, Issue. 1

performanse modela rizične vrednosti (Value-at-Risk - VaR) sa dnevnim prinosom akcija na tržištu kapitala u Srbiji. Naše istraživanje smo sproveli koristeći podatke o dnevnim prinosima Belex 15 indeksa blue chip akcija. Ova studija je dala komparativnu procenu više različitih modela i pristupa koji se mogu koristiti za predviđanje rizika. Velika raznovrsnost VaR modela je predstavljena i empirijski procenjena njihovom primenom na indeks tržišta kapitala u Srbiji. Sprovedeni preliminarni statistički testovi ukazuju da je grupisanje volatilnosti po klasterima i pojava ekstremnih vrednosti ono što karakteriše stopu prinosa indeksa akcija. Na osnovu statističke analize indeksa akcija koju smo izvršili u ovom radu, utvrđeno je da prinose na indeks akcija u Srbiji karakterišu zadebljani repovi i asimetrija. Drugim rečima, ekstremne fluktuacije su verovatnije od onih predviđenih modelom normalne raspodele. Log prinosi pokazuju značajanu serijsku korelaciju i ARCH efekat. Ove karakteristike analiziranog indeksa akcija imaju ozbiljne posledice na performanse poznatih VaR modela, kao što je istorijska simulacija i Risk Metrics. Ovi nalazi su dokumentovani u našoj backtesting proceduri. Dalje, razvili smo EWMA VaR model sa optimalnim faktorom opadanja za tržište kapitala u Srbiji koji je, u pogledu RiskMetrics modela prošao kriterijum nezavisnosti, ali broj odstupanja nije bio u skladu sa intervalom poverenja (bezuslovna pokrivenost). Analiza druga dva VaR modela bila je zasnovana na upotrebi GARCH modela. Menadžeri rizika bi trebalo da se usredsrede na modelovanje repova raspodele prinosa. Procenu parametara u modelu smo izvršili pomoću tri distributivne pretpostavke: Gausova raspodela, Studentov-t raspodela i GED raspodela.
GARCH (1,1) model sa GED raspodelom inovacija deluje kao razuman izbor modela za dnevne log prinose indeksa akcija u Srbiji; ima najveću LLF vrednost i prepostavke tog modela su u najvećem delu zadovoljene. Nakon specifikacije GARCH modela, koristili smo model rizične vrednosti da konvertujemo cifre
dobijene GARCH modelom u najveći mogući iznos gubitka. Rezultati pokazuju da je GARCH (1,1) model sa GED raspodelom pogodan za modelovanje vremenskih serija prinosa indeksa akcija u Srbiji te otuda VaR dobro predviđa kretanje cena akcija. Uslovna volatilnost GARCH (1,1) modela se kreće zajedno sa EWMA modelom ali je ona dosledno niža i, u većini slučajeva, reaguje brže od EWMA modela. Stoga, ovo je jedan od razloga zbog koga je VaR model baziran na uslovnoj volatilnosti GARCH modela superiorniji u poređenju sa VaR modelima iz porodice EWMA modela. I konačno, videli smo da u posmatranom periodu, filtrirana istorijska simulacija, kao model merenja rizika, daje preciznije rezultate od GARCH modela. Backtestovi ukazuju da filtrirana istorijska simulacija, uz dnevnu simetričnu GARCH specifikaciju, najbolje modeluje tržišni rizik za tržište kapitala u Srbiji za oba intervala poverenja i vremenske intervale rizika. Regulatorna tela i investitore bi trebalo više da brine korisnost tradicionalnih metoda merenja rizika (model istorijske simulacije i RM model) kada ih primenjuju na portfolija koja sadrže uglavnom akcije sa srpskog tržišta i potrebno je da sprovode okvir za upravljanje rizikom koji je zasnovan na sofisticiranijoj metrici rizika (GARCH model i model filtrirane istorijske simulacije - FIS).
Ovi rezultati mogu imati značajan uticaj na investitore i menadžere finansijskog rizika koji posluju na volatilnim i nelikvidnim tržištima. Iako je potrebno sprovesti još istraživanja, naročito testirati više modela i direktno koristiti prinose stvarnih portfolija umesto stope prinosa indeksa, naši nalazi mogu biti naročito korisni i zanimljivi direktnim učesnicima na tržištu kao što su portfolio menadžeri, menadžeri rizika i regulatori. Ipak, osnovno ograničenje ove studije je što se empirijsko istraživanje odnosi samo na tržište kapitala u Srbiji tako da se njeni rezultati ne mogu generalno preneti na druga tržišta u nastajanju bez sprovođenja istraživanja tih tržišta i njihovog poređenja sa srpskim tržištem akcija.
Jeremić Z., Terzić I., Milojević M.Procena i validacija VaR modela na tržištu kapitala
u Srbiji u periodu od 2005. do 2015. godineBankarstvo, 2016, vol. 45, br. 1 38
Based on the statistical analysis of the stock index performed in the paper, it was determined that returns on the Serbian equity index are characterized by fat tails and asymmetry. In other words, extreme movements are more probable than those predicted by the normal-distribution model. The log returns exhibit the significant serial correlation and ARCH effects.These characteristics of the analyzed stock index have serious consequences on the performance of well known VaR models, such as historical simulation and RiskMetrics. These findings are documented in our backtesting procedure. Furthermore, we developed EWMA VaR with theoptimized decay factor for the Serbian stock market, which in regard to RiskMetrics passed the independence criterion, but the number of violations was not in accordance with the confidence levels (unconditional coverage). The analysis of other two VaR models was based on the fitting of GARCH model to the financial return series. Risk managers ought to focus on modeling the tails of the returns distribution.The estimation of the parameters in the model was examined by means of three distributional assumptions for the innovations: Gaussian distribution, Student-t distribution and GED distribution.
The GARCH(1,1) with GED distribution innovations seems like a reasonable model for the Serbian index daily-log returns; it has the highest log-likelihood value and the model assumptions are largely satisfied. After specification of GARCH, we used Value at Risk model to convert GARCH figures to the maximum possible loss amount. The results indicate that GARCH (1,1) model with GED distribution is suitable for modeling the Serbian stock index return series, hence, the VaR
properly captures the stock price movements. The GARCH(1,1) conditional volatility moves together with EWMA, but it is consistently lower and, in many cases, it responds faster than EWMA. Thus, it is one more reason why VaR based on GARCH conditional volatility performs superior to VaR based on models from the EWMA family. Finally, we could see that, within the observed period, FHS as a risk measurement model performs more accurately than GARCH VaR. Our testing suggests that filtered historical simulation with daily symmetric GARCH specification is most capable of modeling market risk accurately for the Serbian equity market at the both tested confidence levels and risk horizons. Regulators and investors should concern themselves more with the usefulness of traditional VaR risk measures (HS and RM) when applied to portfolios containing predominantly stocks from the Serbian market, and need to implement risk framework based on themore sophisticated risk metrics (GARCH and FHS).
These results may have important implications for investors and financial risk managers who operate in the volatile and illiquid markets. Although further research is needed, especially the testing of more models and direct usage of the real portfolio returns instead of indexes returns, our findings can be particularly useful and interesting to practitioners like portfolio managers, risk managers and financial regulators. However, the main limitation of this study is that our empirical research refers only to the Serbian capital market so that its results cannot be generally applied to other frontier markets, without previous comparative analysis.
Jeremić Z., Terzić I., Milojević M.Value at risk estimation and validation in the Serbiancapital market in the period 2005-2015
39 Bankarstvo, 2016, Vol. 45, Issue. 1

Literatura / References
1. Alexander, C., 2008. Value at Risk Models. Chichester: John Wiley & Sons Ltd.
2. Alexander, C. and Leigh, C., 1997. On the covariance matrices used in value at risk models. The Journal of Derivatives 4, pp. 50-62.
3. Beder, T., 1995. VAR: Seductive but dangerous. Financial Analysts Journal, pp. 12-24.
4. BIS, 2011. Messages from the academic literature on risk management for the tradingbook. [online] Available at: <https://www.bis.org/publ/bcbs_wp19.htm > [Accessed on January 2011].
5. Christoffersen, P., 1998. Evaluating Interval Forecasts. International Economic Review, 39 (4), pp. 841-862.
6. Danielsson, J. Jorgensen, B. N. Sarma, M. Samorodnitsky, G. and de Vries, C. G., 2005. Subadditivity re-examined: The case for value-at-risk. www.RiskResearch.org.
7. Đorić, E. and Đorić, D., 2011. Dynamic Value at Risk Estimation for BELEX15. Metodoloski zvezki 8 (1), pp. 79-98.
8. Fabozzi, F., Focard, S. and Jonas, C., 2008. On the challenges in quantitative equity management. Quantitative Finance, 8 (7), pp. 649-665.
9. Fama, E., 1965. The behavior of stock market pricess, Journal of Business 38 (1), pp. 34-105.
10. Giot, P. and Laurent, S., 2003. Value-at-Risk for long and short trading positions. Journal of Applied Econometrics, 18, pp. 641-664.
11. Hendricks, D., 1996. Evaluation of value-at-risk models using historical data. Federal Reserve Bank of New York Economic Policy Review, pp. 39-69.
12. Jeremić, Z. and Terzić, I., 2008. Mogućnosti primene modernih portfolio teorija na kreiranje optimalnog portfolija akcija sa Beogradske berze, Singidunum revija, Vol. 5, No. 1, 17-26
13. Köksal, B. and Orhan, M., 2013. Market Risk of Developed and Emerging Countries During the Global Financial Crisis. Emerging Markets Finance and Trade, pp. 49 (3), 20-34.
Jeremić Z., Terzić I., Milojević M.Procena i validacija VaR modela na tržištu kapitala
u Srbiji u periodu od 2005. do 2015. godineBankarstvo, 2016, vol. 45, br. 1 40

Jeremić Z., Terzić I., Milojević M.Value at risk estimation and validation in the Serbiancapital market in the period 2005-2015
14. Kupiec, P. H., 1995. Techniques for verifying the accuracy of risk measurement models. Journal of Derivatives, 2, pp. 73-84.
15. Mahoney, J., 1997. Forecast biases in value-at-risk estimations: Evidence from foreign exchange and global equity portfolios. LSE Financial Markets, Special Paper Series, no. 93.
16. Mandelbrot, B., 1963. The variation of certain speculative prices, Journal of Business 26 (2), pp. 394-419.
17. Milojević M. and Terzić I., 2014. Modeling market risk in frontier equity markets-Evidence from Serbia. CBU International Conference Proceedings, pp 75-81.
18. Pérignon C. and Smith D., 2008. A New Approach to Comparing VaR Estimation Methods, The Journal of Derivatives, Vol. 16, No. 2: pp. 54-66
19. Radivojević, N., Milojković, D., Stojković, D., 2010. Testiranje aplikativnosti parametarske i neparametarske metode vrednosti pri riziku na tržištu kapitala Srbije. Bankarstvo, Vol. 2010, No. 11/12, 46-61.
20. Sarma, M. Thomas, S. and Shah, A., 2003. Selection of VaR models. Journal of Forecasting, 22, pp. 337-358.
21. Stoyanov, S. V. Rachev, S. Racheva-Iotova, B. and Fabozzi, F. J., 2011. Fat-tailed Models for Risk Estimation. Journal of Portfolio Management, 37 (2), pp. 107-117.
22. Terzić, I. and Milojević, M., 2013. Evaluting measures of market risk in circumstances of global financial crisis-empirical evidence from five countries. CBU International Conference Proceedings, pp 75-81.
23. Terzić I., 2014. Savremene metode merenja rizika na tržištu kapitala u Srbiji, Univerzitet Singidunum, Beograd
24. Živković, S., 2007. Testing popular VaR models in EU new member and candidate states. The Proceedings of Rijeka Faculty of Economics, 25, pp. 325-346.
41 Bankarstvo, 2016, Vol. 45, Issue. 1