Embed Size (px)
Citation preview

Qu’a apporté la génomique à la phylogénie des animaux ?
Hervé Philippe
Département de Biochimie, Centre Robert Cedergren, Université de Montréal, Succursale Centre-Ville, Montréal, Québec H3C3J7, Canada

Cambrian explosion: a paleontological perspective
Marrella
HalkieriaPikaia
Aysheaia

Cambrian explosion: a molecular perspective
ChoanoflagellataPoriferaPoriferaPoriferaCnidariaCnidariaEcdysozoaEcdysozoaEcdysozoaLophotrochozoaLophotrochozoaLophotrochozoaLophotrochozoaDeuterostomiaDeuterostomiaDeuterostomiaDeuterostomia
700 600 500 400 300 200 100 0
Cambrian explosion
Molecular phylogenies should resolve series of
speciation events separated by a few
millions of years
MYa

(1) Inadequate selection of sequences (non-orthologous, saturated, etc.)
(2) Inadequate tree reconstruction method
(3) Inadequate taxon sampling
(4) Rapid diversification of species
Lack of resolution in molecular phylogenetics
Points (1), (2) and (3) are always mixed:
• A (simplistically) theoretical overview
• Analyses of several case studies
• A molecular dating approach

Cambrian explosion: a molecular perspective
ChoanoflagellataPoriferaPoriferaPoriferaCnidariaCnidariaEcdysozoaEcdysozoaEcdysozoaLophotrochozoaLophotrochozoaLophotrochozoaLophotrochozoaDeuterostomiaDeuterostomiaDeuterostomiaDeuterostomia
700 600 500 400 300 200 100 0
Cambrian explosion
MYa
18S Ribosomal RNA (~1000 positions): ~100 substitutions over 500 MY
resolution for branches with T 15 MY
Bootstrap support 95% requires 3 substitutions on the corresponding branch (Felsenstein, 1985)
T
50 genes (Rokas et al. 2005, 12060 positions): ~2400 substitutions over 500 MY
resolution for branches with T 0.7 MY
146 genes (Delsuc et al. 2006, 33800 positions): ~7000 substitutions over 500 MY
resolution for branches with T 0.25 MY

true history
1
2
3
Inferredtrees
1: 80%
2: 25%
3: 10%
1: 100%
2: 100%
3: 100%
21
3
12000positions
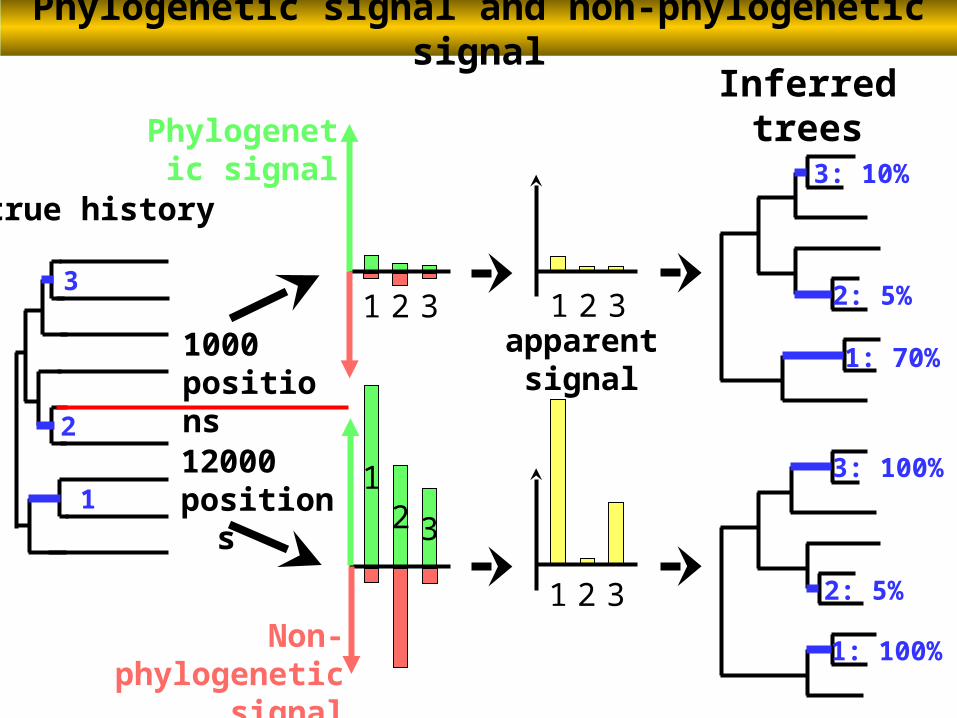
Phylogenetic signal
Phylogenetic signal
1000 positions
21 3

Comparison of ML SSU and LSU trees (A and B, respectively)
Medina M. et.al. PNAS 2001;98:9707-9712

Rokas et al. (2005) Animal evolution and the molecular signature of radiations compressed in time. Science, 310:1993-1998
50 genes (12,060 amino acid positions), ML RtREV+I+ / MP bootstrap support

true history
1
2
3
Inferredtrees
1: 80%
2: 25%
3: 10%
1: 100%
2: 100%
3: 100%
21
3
12000positions
Phylogenetic signal
Phylogenetic signal
1000 positions
21 3

Non-phylogenetic signal
Sequence evolves according to a very complex and heterogeneous process that our tree reconstruction method approximates as best as they can using elaborated model of
sequence evolutionReal complexities: mutation process is not homogeneous over time and across the genome, population structure is not homogeneous over time, selective pressures are not homogeneous over time and across the genome
Nucleotide compositions are heterogeneous across species, evolutionary rate is heterogeneous across positions and over time (heterotachy), substitution process is heterogeneous across positions and over time, positions are inter-dependent, etc.
All the complexities that are not adequately handled by our oversimplified models of sequence evolution can imply
systematic biases, which are referred here as non-phylogenetic signal
true history
1
2
3
Phylogenetic signal
Inferredtrees
1: 70%
2: 5%
3: 10%
1: 100%
2: 5%
3: 100%
21
3
1000 positions
12000positions
Phylogenetic signal and non-phylogenetic signal
21 3apparent
signal
21 3
21 3Non-phylogenetic
signal

Systematic error: the error in phylogenetic estimates that is due to the failure of the reconstruction method to account fully for multiple substitutions (in a probabilistic framework, the properties of the data)
Systematic errors (inconsistency)
LONG BRANCH ATTRACTION (Felsenstein, 1978)
A
DB
C
p
q q
p<q2
A
DB
C
A
D
CB
A
D
BC
Systematic errors will not disappear with phylogenomics, and may indeed
become more apparent

C
AA
C
Multiple substitutions at the same position
ACGC
AG
Tree building artefact
C
AA
C

Rokas et al. (2005) Science, 310:1993-1938
50 genes (12,060 amino acid positions), ML RtREV+I+ / MP bootstrap support
ML MP
99 56
94 55
97 51
72 36
84 54
100 75
43 74

true history
1
2
3
Phylogenetic signal
21
3
Inferredtrees
1: 100%
2: 99%
3: 84%
1: 75%
2: 56%
3: 54%
12000 positions
12000positions
Phylogenetic signal and non-phylogenetic signal
apparentsignal
21 3
21 3
21
3
Non-phylogeneticsignal
ML
MP
ML MP
99 56
94 55
97 51
72 36
84 54
100 75
43 74

QuickTime™ et undécompresseur TIFF (LZW)
sont requis pour visionner cette image.
Phylogenomics yields incongruent results
PLoS Biology Nature Current Biology

AmoebozoaAscomycotaBasidomycotaCalcareaHexactinellida
DemospongiaeScyphozoaAnthozoaTrichoplax adhaerens
ChoanoflagellataEchinodermata
MammaliaHexapodaCrustacea
BivalviaAnnelida
GastropodaHemichordata
0.1
Mitochondrial ATP synthase F0 subunit 6
Single gene phylogeny of Schierwater et al. (2009)
AnthozoaHexapoda
CrustaceaScyphozoa
PriapulidaBivalvia
EchinodermataHexactinellida
CalcareaDemospongiae
HydrozoaMammalia
CtenophoraTrichoplax adhaerens
ChoanoflagellataAmoebozoa
ExcavataAscomycotaBasidomycota
ChromalveolataAnnelida
0.1
Cytosolic HSP70
NON-HOMOLOGOUS
PARALOGOUS
ER HSP70

Single gene phylogeny of Schierwater et al. (2009)
RAC1
CDC42
BasidomycotaAscomycota
ChoanoflagellataCalcarea
AnthozoaHexactinellida
ChromalveolataMammalia
EchinodermataHexapoda
Trichoplax adhaerensDemospongiae
Amoebozoa0.1
Small RAS-like GTPase AmoebozoaAscomycotaBasidomycota
ChoanoflagellataTrichoplax_adhaerens
ExcavataChromalveolata
EchinodermataDemospongiae
HexactinellidaAnthozoa
MammaliaAnnelidaHexapoda
CubozoaCalcarea
PriapulidaGastropoda
Hydrozoa
0.1
GTP-binding nuclear protein Ran

Single gene phylogeny of Schierwater et al. (2009)
DemospongiaeCubozoa
ScyphozoaAnthozoa
MammaliaHexapoda
Trichoplax adhaerensEchinodermata
Hydrozoa
0.1
Pair box domain protein PAX-B
AnthozoaChromalveolata
ExcavataAscomycota
Trichoplax adhaerensMammaliaBasidomycota
AmoebozoaHexapoda
0.1
DNA directed RNA polymerase
Pol II
Pol III

Porifera
0.1
4
9
CnidariaBilateria
ExcavataCiliophora
Amoebozoa
AscomycotaBasidiomycota
Choanoflagellata
CalcareaDemospongiae
HexactinellidaCtenophora
Placozoa
5398
2762
0.1
38
36
44
40
23
ExcavataCiliophora
AmoebozoaAscomycota
BasidiomycotaChoanoflagellataCalcareaDemospongiae
HexactinellidaCtenophora
Placozoa 4
9
CnidariaBilateria
Porifera
Contaminated datasetSchierwater et al. (2009) PLoS Biol 7(1): e1000020
Clean datasetPhilippe et al. (2011) PLoS Biol in press

Dunn et al. : 150 genes 24,708 positions
Contaminations:Symsagitiferra: 13 genes (including 6 Chlorophyta, 2 Ciliophora, 2 Bacteria)
4 Neochildia (Microsporidia)2 Saccoglossus (Mus)2 Acanthoscurria (angiosperm)2 Hydra (Artemia)1 Oscarella (Pseudomonas)1 Asterina (Bacteria)1 Dugesia (Gallus)1 Xiphinema (Lumbricus)1 Monosiga (Rhizopus)1 Macrostomum2 Trichinella2 Priapulus1 Branchiostoma

Dunn et al.: 150 genes 24,708 positions
Frameshifts: 63 concerned speciesDrosophila 2Paraplanocera 3Echinoderes 4Xenoturbella 4Chaetopterus 5Cyanea 5Cristatella 6Platynereis 6Spinochordodes 6Cryptococcus 8Spadella 8Mnemiopsis 9Bugula 10Gnathostomula 10Hydra 10Sphaeroforma 10Turbanella 10Chaetoderma 15Myzostoma 15Scutigera 16Carcinus 18
Lumbricus 20Ptychodera 20Euperipatoides 21Carcinoscorpius22Symsagittifera 22Chaetopleura 23Homo 25Boophilus 30Hypsibius 30Richtersius 30Daphnia 32Asterina 35Anoplodactylus 40Argopecten 43Xiphinema 43Acropora 45Dugesia 46Brachionus 50Ciona 50Branchiostoma 52Hydractinia 53
Haementeria 54Flaccisagitta 55Strongylocentrotus 55Acanthoscurria 58Aplysia 58Saccoglossus 60Capsaspora 68Gallus 73Phoronis 87Capitella 93Echinococcus 100Ferrenopenaeus 112Monosiga 118Schmidtea 129Oscarella 141Mytilus 151Euprymna 201Trichinella 281Crassostrea 296Macrostomum 382Biomphalaria 384

Frameshifts: 3868 “invented” amino acids
Many single point errors :A total 970 errors(in large part due to the use of
erroneous mitochondrial genetic code!)
DUNN: 150 genes 21,152 positions55.6% of missing data
UPDUNN: 150 genes 18,463 positions35.6% of missing data
Several genes with paralogy issues:2-5 intractable problems10-20 tractable problems
5 introns:AnoplodactylusChaetopterusCionaThemisteTrichinella

SaccharomycesCryptococcus
SphaeroformaAmoebidium
CapsasporaMonosiga
AmphimedonOscarella
mertensiidMnemiopsis
HydractiniaHydra
CyaneaNematostelAcropora
0.2
SymsagittiferaNeochildia
HomoGallus
CionaBranchiostoma
XenoturbellaSaccoglossPtychodera
StrongylocentrotusAsterina
GnathostomulaSpadellaFlaccisagitta
PhilodinaBrachionus
MacrostomumParaplanocera
EchinococcusSchmidteaDugesia
PedicellinaCristatella
BugulaPhoronis
TurbanellaTerebrataliaCerebratulusCarinoma
ChaetopterusMyzostoma
ThemistePlatynereis
LumbricusHaementeria
UrechisCapitella
ChaetopleuraChaetodermaEuprymnaMytilusCrassostreaArgopecten
BiomphalariaAplysia
PriapulusEchinoderes
XiphinemaTrichinella
SpinochordodesRichtersius
HypsibiusEuperipatoides
DrosophilaDaphniaFenneropenaeusCarcinus
ScutigeraCarcinoscorpius
AnoplodactylusAcanthoscurriaBoophilus
30
86
58
62
84
BS=100%
70<BS<100
Cnidaria
PoriferaCtenophora
Bilateria
CAT+ model
150 genes 18,463 positions35.6% of missing data
Clean Dunn et al. dataset
00.01
0.020.03
0.040.050.06
0.070.08
0.090.1
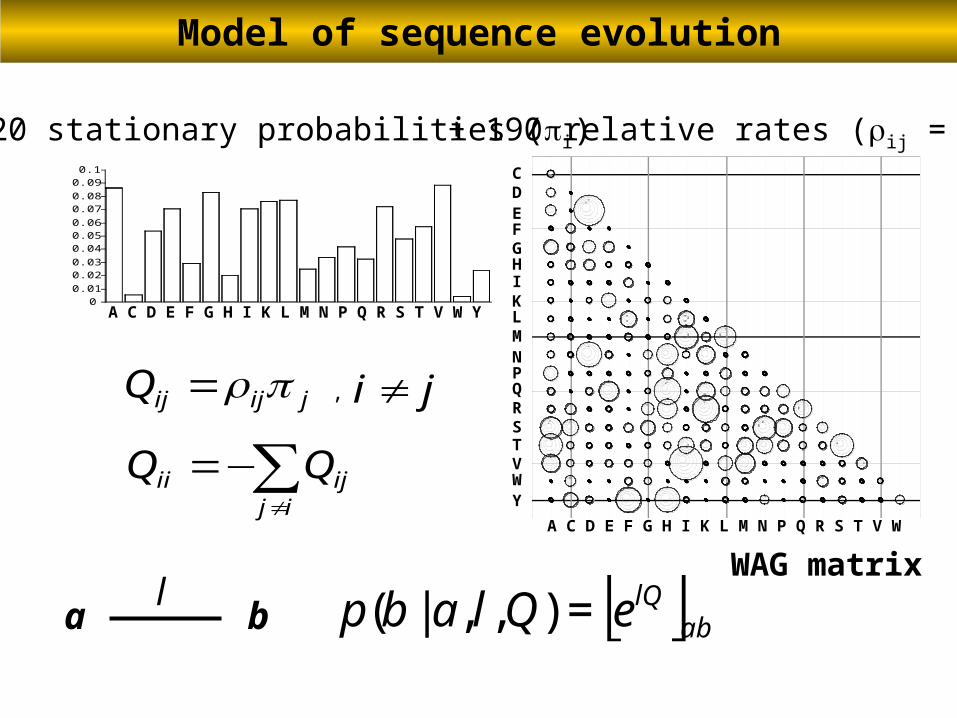
A C D E F G H I K L M N P Q R S T V W
A C D E F G H I K L M N P Q R S T V W Y
+ 190 relative rates (ij = ji)+ 20 stationary probabilities (i)
E
CD
FGHIKLMNPQRSTVWY
jijijQ =
∑≠
−=ij
ijii QQ
ji ≠,
[ ]ablQeQlabp =),,|(bal
Model of sequence evolution
WAG matrix

amino acid profiles …
ACD...VWY ACD...VWY ACD...VWY ACD...VWY
Categories (modes): 1 2 3 … K
Heterogeneous (CAT) model : K distinct profiles Homogeneous (WAG) model1 substitution
matrix
Man
Zebrafish
Frog
Fly
Yeast
Amoeba
ParameciumGreen alga
M A E I G R L I E F S A M V D F W Q N R CM A E I G R L V E Y S A M V D F W Q N R CM A D L G K L I D Y S A L V D F W Q N R CM S D I G K L V E F S P M V E F W Q Q K CM S E I G R L V E F T P M V E F W Q N R CL S E L G R L V D F T A M V D F W N N R CL A E L G K L V E Y A P M I D F W Q A R CL S D L G K L I D F S A M I N F W Q N K C
The CAT model of sequence evolution
Lartillot & Philippe (2004) Mol Biol Evol. 21:1095-1109

A C D E F G H I K L M N P Q R S T V W
+ uniform relative rates (ij=ji)+ 20 stationary probabilities (i)
E
CD
FGHIKLMNPQRSTVWY
The CAT model of sequence evolution
Lartillot & Philippe (2004) Mol Biol Evol. 21:1095-1109
To keep the number of parameters low, a category is only defined by a set of stationary probabilities (the
relative rates are uniform), and the number of categories is inferred from the alignment
…A C D E F G H I K L M N P Q R S T V W Y
A C D E F G H I K L M N P Q R S T V W Y

Stable categories inferred by the CAT model
D N
E Q
The size of an amino acid is proportional to
its stationary probability
E
E
E
E
E
E
E
E
E
E
E
EE
E
E
E
EE
D
D
DD
D
D
DDD
D
D
DD
D
D
D
D
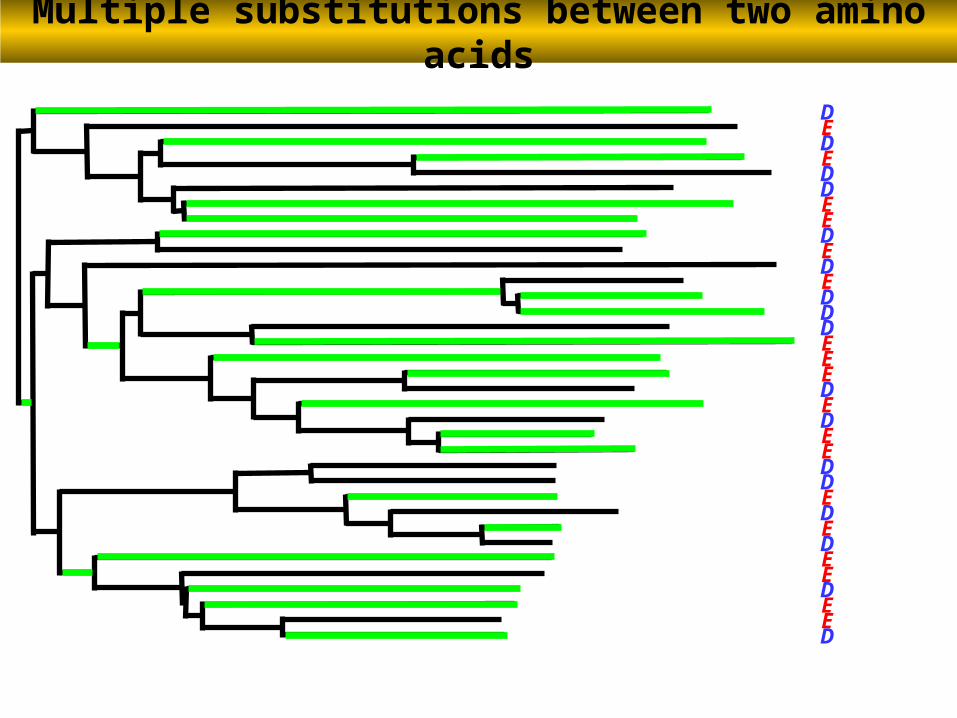
Multiple substitutions between two amino acids

# substitutions
What is predicted by evolutionary models?
WAG GTR CAT
1
2
3
4
5
6
7
0

E
E
E
E
E
E
E
E
E
E
E
EE
E
E
E
EE
D
D
DD
D
D
DDD
D
D
DD
D
D
D
D
These multiple substitutions are well handled by the CAT model because this position will be explained by this profile:
Multiple substitutions between two amino acids
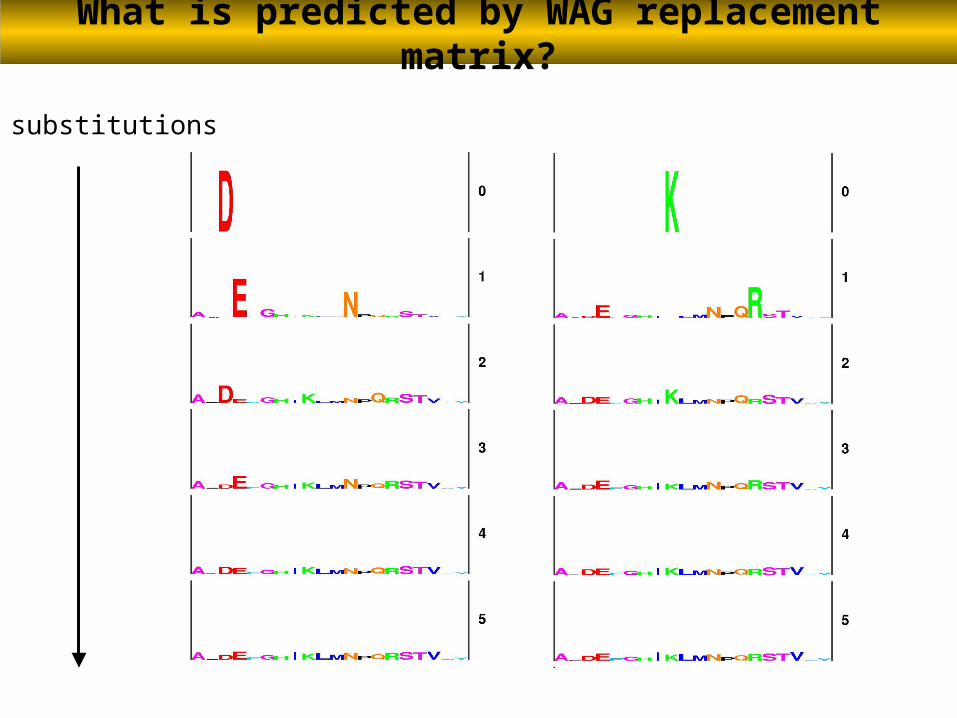
# substitutions
What is predicted by WAG replacement matrix?

ChoanoflagellateDemosponge
Calcareous poriferanHexactinelid poriferan
Hydrozoan cnidarianAnthozoan cnidarian
NematodeArthropod
PriapulidAnnelid
MolluskTrematode platyhelminthTriclad platyhelminth
TunicateZebrafishMouseHuman
0.02
98
55
74
76
78
100100
100
95
99
10063
49
5276
Further reduction of non-phylogenetic signal
Alignment of Rokas et al. (2005): 50 genes (12,060 amino acid positions)
Model CAT+, inferred using phylobayes; 100 bootstrap replicates

0
10
20
30
40
50
60
70
80
90
100
MP rtREV+CAT+
Chordates
Protostomes
Ecdysozoa
Lophotrochozoa
Bilaterians
Cnidarians
Poriferans
Reduction of non-phylogenetic signal
Boots
trap
su
pp
ort

0.1
Choanoflagellata
CalcareaHomoscleromorpha
DemospongiaePlacozoa
CtenophoraCnidaria
Bilateria
2
2
3
4
3
9
2298
90
64
62
62
78
3
5 FungiIchthyosporea
99
PoriferaHexactinellida
0.1
80
91
98
45
55
99
38
Choanoflagellata
Calcarea
HomoscleromorphaHexactinellida
Demospongiae
Placozoa
Ctenophora
CnidariaBilateria
2
3
9
22
3
5
3
2
4
FungiIchthyosporea
128 genes30,257 positionsPhilippe et al. (2009) Curr. Biol.
Model CAT+
Philippe et al. (2011) PLOS Biol.
Model WAG+

Improvement of phylogenetic resolution
true history
1
2
3Phylogenetic
signal2
13
Non-phylogeneticsignal
To improve resolution, one has to use the same methods as to avoid systematic errors:1) Complex model of sequence evolution2) Rich taxon sampling3) Removal of fast evolving positions
and taxa
Phylogenomics: phylogenetic signal
as well as non-phylogenetic signal
are abundant

0.1Ctenophora
Placozoa
Hexactinellida
Calcarea
Demospongiae
Choanoflagellata
Cnidaria
86
94
70
44
56
53
3
9 Bilateria
0.1
Porifera
Choanoflagellata
CalcareaHomoscleromorpha
HexactinellidaDemospongiaePlacozoa
CtenophoraCnidaria
Bilateria
2
2
3
4
3
9
2294
96
91
62
90
93
47 species128 genes30,257 positionsPhilippe et al. (2009) Curr. Biol.
Model CAT+
Philippe et al. (2011) PLOS Biol.
Model CAT+
18 speciesSame sampling asSchierwater et al.

M A D I G R L I E F S A M V D F WM G E I G R L V E Y S A M V D F WM A E L G K L I D Y S A L V D F WM T D I G K L V E F S P M V E F WM W D I G R L V E F T P M V E Y WM S D L A R L V D F T A M V D F WM Y D L G K L I D F S A M I N F WM A D I G R L I E F S A M V D Y WM E D I G R L V E Y S A M V D F WM R D L G K L I D Y S A L V D F W
• Hétérogénéité entre les sitesHétérogénéité entre les sites• loi gamma, modèle CAT loi gamma, modèle CAT
• Hétérogénéité au cours du tempsHétérogénéité au cours du temps• modèle covarion, points de changementsmodèle covarion, points de changements
• Hétérogénéité des états de caractères• matrices d’échange : Dayhoff, WAG … LG, GTR
Hétérogénéité des modèles

Hypothèse
QuickTime™ et undécompresseur TIFF (LZW)
sont requis pour visionner cette image.
HétéropécilieHétéropécilievariation temporelle du processus variation temporelle du processus
de substitution en acides aminés de substitution en acides aminés
pour un site donnépour un site donné (( = to vary)= to vary)
HétéropécilieHétéropécilievariation temporelle du processus variation temporelle du processus
de substitution en acides aminés de substitution en acides aminés
pour un site donnépour un site donné (( = to vary)= to vary)

Roure & Philippe (2011) BMC Evol Biol Roure & Philippe (2011) BMC Evol Biol 11:1711:17
13 protéines mitochondriales13 protéines mitochondriales
68 espèces68 espèces
sites retirésaligneme
ntPIPn nb % taille
- - - 1927= 0 168 8.7 1759
≥ e-12 165 8.6 1594≥ e-8 177 9.2 1417≥ e-6 177 9.2 1240≥ e-
4.5 201 10.4 1039
• Sites retirés suivant une Sites retirés suivant une valeur croissante de PIPvaleur croissante de PIPnn
Choanoflagellata
Protostomia
Deuterostomia
Porifera
Cnidaria
CAT+4
• Inférence par CAT+ΓInférence par CAT+Γ44 avec les avec les
jeux réduitsjeux réduits
DonnéesDonnées ProtocoleProtocole
Retrait progressif des sites hétéropécilles

taille de l’alignement
Cnidaria
Choanoflagellata
Protostomia
Deuterostomia
Porifera
Bilateria
4141Roure & Philippe (2011) BMC Evol Biol Roure & Philippe (2011) BMC Evol Biol 11:1711:17
Retrait progressif des sites hétéropécilles

Cnidaria
Choanoflagellata
Protostomia
Deuterostomia
Porifera
taille de l’alignement
Roure & Philippe (2011) BMC Evol Biol Roure & Philippe (2011) BMC Evol Biol 11:1711:17
Retrait progressif des sites hétéropécilles

Cnidaria
Choanoflagellata
Protostomia
Deuterostomia
Porifera
Porifera
Cnidaria
Choanoflagellata
Protostomia
Deuterostomia
Porifera
taille de l’alignement
Roure & Philippe (2011) BMC Evol Biol Roure & Philippe (2011) BMC Evol Biol 11:1711:17
Retrait progressif des sites hétéropécilles

taille de l’alignement
Choanoflagellata
Porifera
Protostomia
Deuterostomia
Cnidaria
Choanoflagellata
Protostomia
Deuterostomia
Porifera
Porifera
Cnidaria
Choanoflagellata
Protostomia
Deuterostomia
Porifera
Roure & Philippe (2011) BMC Evol Biol Roure & Philippe (2011) BMC Evol Biol 11:1711:17
Retrait progressif des sites hétéropécilles

Sites hétéropéciles
taille de l’alignement
Sites à évolution rapide
taille de l’alignement
Le regroupement incorrect des Cnidaires et des Porifères n’est pas dû à la présence de sites à évolution rapide, mais à la présence de sites
hétéropéciles qui est erronément interprétée comme une synapomorphie pour regrouper Cnidaires et Porifères
Roure & Philippe (2011) BMC Evol Biol Roure & Philippe (2011) BMC Evol Biol 11:1711:17
Retrait progressif des sites