Embed Size (px)
Citation preview

RESEARCH ARTICLE Open Access
Characteristic distribution of the total andindividual item scores on the KesslerScreening Scale for Psychological Distress(K6) in US adultsShinichiro Tomitaka1,2,3* , Yohei Kawasaki2,4, Kazuki Ide2,4,5, Maiko Akutagawa2, Hiroshi Yamada2, Yutaka Ono6
and Toshiaki A. Furukawa3
Abstract
Background: The distributional pattern of total scores on depression screening scales in the general populationhas not been well studied. Recent studies suggest that the total scores on depression screening scales follow anexponential pattern, with the exception of the lower end of the distribution. To further investigate the findings, wedetermined the distributions of the total and individual item scores on the Kessler Screening Scale for PsychologicalDistress (K6).
Methods: Data were obtained from the National Survey of Midlife Development in the United States. Participantscomprised 6,223 individuals between the ages of 25 and 74. The distributions of the total and individual itemscores in various combinations were investigated with histograms and regression analysis.
Results: Irrespective of the combination of items, the total and individual item scores followed an exponentialpattern except at the lower scores. The estimated rate parameters of regression analysis were similar amongdistributions with the same number of chosen items. At the lower scores, the distributional patterns of total scoresvaried according to the ratio of “a little” to “none” for each item response.
Conclusions: The present results have the potential to estimate the distribution of depressive symptoms in thegeneral population. While the degree of depressive symptoms varies from individual to individual, an entirepopulation may show a certain mathematical distribution.
Keywords: Depressive symptom, Kessler Screening Scale for Psychological distress, Item response, National Surveyof midlife development, Exponential distribution, Depressive symptom measure
BackgroundDepression is a common mental disorder that affectsabout 350 million people worldwide [1, 2]. Because the de-gree of depressive symptoms is fundamental to a diagnosisof clinical depression, the severity distribution of depressivesymptoms in the general population is a major area ofinterest within the field of psychiatry [3, 4]. The distribution
of depressive symptoms is significant as well because statis-tical hypothesis tests and statistical estimators are derivedfrom statistical models, which are assumed to adequatelyapproximate the empirical distribution [5].Population studies of depressive symptoms have been
conducted using parametric statistics, factor analysis,and item response theory. These methods are calledconfirmatory data analysis (CDA), which presupposes astatistical model, tests a hypothesis, and estimates pa-rameters [6]. On the other hand, exploratory data ana-lysis (EDA) is an inductive approach designed to revealcharacteristics and patterns in the data, often with visualmethods [6, 7]. Both inductive and deductive approaches
* Correspondence: [email protected] of Mental Health, Panasonic Health Center, Landic building 3F,Nishishinbashi 3-8-3, Minato-ku, Tokyo 105-0003, Japan2Department of Drug Evaluation and Informatics, School of PharmaceuticalSciences, University of Shizuoka, 52-1 Yada, Suruga-ku, Shizuoka 422-8526,JapanFull list of author information is available at the end of the article
© The Author(s). 2017 Open Access This article is distributed under the terms of the Creative Commons Attribution 4.0International License (http://creativecommons.org/licenses/by/4.0/), which permits unrestricted use, distribution, andreproduction in any medium, provided you give appropriate credit to the original author(s) and the source, provide a link tothe Creative Commons license, and indicate if changes were made. The Creative Commons Public Domain Dedication waiver(http://creativecommons.org/publicdomain/zero/1.0/) applies to the data made available in this article, unless otherwise stated.
Tomitaka et al. BMC Psychiatry (2017) 17:290 DOI 10.1186/s12888-017-1449-1

are necessary for data analysis. However, whereas CDAhas been performed by a large number of researchers,exploratory data analysis has not drawn attention in thefield of psychiatry. For example, little work has beendone to visualize the distributions of depressive symp-tom scores in the general population to understand theircharacteristics patterns.Visualizations are central to EDA because the rich in-
formation they provide is unrivaled in its ability to de-tect data patterns [8, 9]. Recently, through visualizationswith histograms, several large sample studies have dem-onstrated that total scores on depression screeningscales in the general population approximate exponentialdistributions, with the exception of the lower end of thedistribution. An analysis of data from almost 10,000 re-spondents to the British National Household PsychiatricMorbidity Survey has revealed that an exponentialmodel best fits the total score data on the RevisedClinical Interview Schedule (CIS-R), except at the lowestsymptom counts [10]. Analyzing almost 25,000 respon-dents to the Japanese Active Survey of Health andWelfare, we have similarly reported that the distributionof total scores on the Center for Epidemiologic StudiesDepression Scale (CES-D) approximates an exponentialpattern, with the exception of the lower end of thedistribution [11]. These findings were consistentlyconfirmed in a sample of about 7600 Japanese employeesusing the CES-D [12].To verify the findings, we determined the total score
distributions of the Kessler Screening Scale for Psycho-logical Distress (K6) in representative US studies. TheK6 assesses the degree of psychological distress andidentifies respondents with a diagnosable mental illness[13]. Although the K6 was designed to measure psycho-logical distress [14], the six items of the K6 (depressedmood, motor agitation, fatigue, worthless guilt, andworry) may be grouped as depressive symptoms. The K6 isa reliable and valid tool to screen for depressive symptomsand mood disorders in epidemiological survey [15, 16].The distributional pattern of the total scores has also beenrepeated in two analyses of K6 data from the NationalSurvey of Midlife Development (MIDUS) and the NationalHealth Interview Survey (NHIS) [17, in submission].Furthermore, we investigated the total scores of the Pa-
tient Health Questionnaire (PHQ) in a representative USsurvey (in submission). The PHQ is a globally used self-rating screening scale for depression [18, 19]. In an analysisof data from the eight-item version of the Patient HealthQuestionnaire (PHQ-8) of the Behavioral Risk Factor Sur-veillance Survey (BRFSS) in the United States, we con-firmed that total scores followed an exponential pattern,except for the lowest symptom counts [in submission].Taken together, the distributional pattern of the total
scores concurs with results of the national surveys
utilizing the CIS-R, CES-D, K6, and PHQ-8. If the distri-butional patterns of the total scores on depressionscreening scales in the general population is established,a new perspective will be presented on how depressivesymptoms are distributed in the general population. Fur-thermore, if the pattern of the empirical distribution fol-lows a non-normal distribution, the statistical model ofnormal distributed depressive symptom scores, which ispresupposed in parametric statistics and item responsetheory, requires reconsideration. To confirm reproduci-bility of these findings, further studies are necessary.The results of previous studies suggest that regardless
of the combination of items, total scores on depressionscreening scales follow an exponential pattern, with theexception of the lower end of the distribution. Thus, inour previous studies, we analyzed the distributions ofthe total scores of the chosen items on the CES-D invarious combinations and found that for any combin-ation of items, the total scores of the selected items ap-proximated an exponential pattern, with the exceptionof the lowest scores [20]. Furthermore, we observed that(1) the total score distributions with the same number ofchosen items exhibited similar estimated rate parame-ters; (2) the estimated rate parameters increased in pro-portion to the number of chosen items; and (3) the ratioof “none” to “some” of item responses contributed tothe non-exponential pattern of total score distribu-tions at the lowest scores [20]. These findings suggestthat the distributional patterns of the total scores aredependent on the item responses of such items. How-ever, there are few studies that have investigatedwhether the aforementioned findings are reproducedfor other scales.The MIDUS is a collaborative investigation of midlife
development in the areas of physical health and psycho-logical well-being [21]. The K6 has been included as partof the MIDUS questionnaires. All MIDUS datasets anddocumentation are archived at the Interuniversity Con-sortium for Political and Social Research (ICPSR) reposi-tory and are publicly available [21]. Since data ofMIDUS are large sample sizes with limited selectionbias, they are suitable to confirm the previous findings.The present study used data from the MIDUS to verifyaforementioned findings.The aim of the present study was threefold: (1) to con-
firm that, regardless of the combination of chosen items,the total scores of chosen items on the K6 show an ex-ponential curve, with the exception of the lower end ofthe distribution; (2) to investigate the relationship be-tween the number of chosen items and the estimatedrate parameters of the exponential model; and (3) toexamine how the ratio of “a little” to “none” in item re-sponses contributes to the patterns of the total scores atthe lower end of the distribution.
Tomitaka et al. BMC Psychiatry (2017) 17:290 Page 2 of 12
MethodsData setData were obtained from the first wave of MIDUS(MIDUS 1) [21, 22]. The MacArthur Foundation Re-search Network on Successful Midlife Development con-ducted the MIDUS 1 between 1995 and 1996. TheMIDUS 1 comprised a nationally representative sampleof adults between the ages of 25 and 74 in the UnitedStates. The average age of the sample was 46.4 years(SD = 13). Non-English speaking and institutionalizedindividuals were excluded. The MIDUS 1 sample con-sisted of 7108 participants (male: n = 3395) includingfour subsamples: the main sample from a nationalrandom-digit-dialing (RDD) procedure, oversamples fromfive US areas, siblings of participants from the RDDsample, and a national sample of twin pairs. A detaileddescription of response rates and sociodemographiccharacteristics has been published elsewhere [22]. Theinstitutional review board at each participating siteapproved the MIDUS, and all participants providedinformed consent.
Ethics statementThis study used de-identified data available to the public.The author’s institutional review board did not considerthe secondary analysis of publicly available data as humansubjects research.
MeasuresThe self-administered questionnaire of the MIDUS 1 in-cluded the K6 items. The K6 consists of six items askingabout the frequency of feeling (1) sad, (2) nervous, (3)restless or fidgety, (4) hopeless, (5) that everything wasan effort, and (6) worthless in the last 30 days (Table 1).All items are scored on a 5-point scale from 0 (none ofthe time) to 4 (all of the time). A total item score rangesfrom 0 to 24. One of the K6 items used in the MIDUSquestionnaires is expressed as follows: “How much of thetime did you feel so sad that nothing could cheer you up?”This question slightly differs from that generally used in
the standard K6: “How often did you feel so depressedthat nothing could cheer you up?’ [14].
Analysis procedureWe excluded 885 respondents (12.5%) from the presentanalysis because they did not respond to all six items. Thefinal sample consisted of 6223 respondents, including 2975,647, 858, and 1743 respondents from the national RDDsample, siblings, twin pairs, and oversamples, respectively.First, item response rates were calculated for all 6
items. As the previous study demonstrated, the ratio of“a little” to “none” contributes to the distributional pat-tern at the lower end of the distribution [20]. Accordingto the previous study, while the total scores of itemswith high values of the ratio of “a little” to “none” are ex-pected to exhibit lower frequencies than predicted fromthe exponential regression curve, the total scores ofitems with low values of the ratio of “a little” to “none”are expected to exhibit higher frequencies than predictedfrom the regression curve. On the other hand, the ratiosof “some” to “a little” were similar among all 6 items[20]. Therefore, the ratios of “a little” to “none,” and“some” to “a little” were calculated for all 6 items. All 6items were ranked according to the ratio of “a little” to“none” in ascending order. Thereafter, patterns of itemresponses were analyzed with graphical analysis.The distributions of the total scores of the chosen K6
items for various combinations were investigated usinghistograms and regression analysis. As an exponentialcurve exhibits a linear pattern with a semi-logarithmicscale, a semi-logarithmic scale allows us to identify therange of an exponential pattern. Regression analysis wasused to estimate the relationship between the sum of theK6 and the frequencies. The total score distributions of2 items, 3 items, 4 items, and 5 items were analyzed invarious combinations. According to the ranking of theratio of “a little” to “none,” the 6 items of the K6were organized into groups. The exponential regres-sion analysis was conducted using the least squaremethod. Descriptive statistics and frequency distribution
Table 1 Item responses of respondents (N = 6223)
Item Response, n (%) Ratio of “alittle” to “none”
Ratio of “some”to “a little”
Rank orderof the ratio of“a little” to “none”
None A little Some Most All
1 Sad 4383 (70.4) 1260 (20.2) 462 (7.4) 97 (1.6) 21 (0.3) 0.29 0.37 3
2 Nervous 2718 (43.7) 2253 (36.2) 1011 (16.2) 199 (3.2) 42 (0.7) 0.83 0.45 6
3 Restless 2951 (47.4) 2042 (32.8) 997 (16.0) 184 (3.0) 49 (0.8) 0.69 0.49 5
4 Hopeless 5000 (80.3) 768 (12.3) 330 (5.3) 91 (1.5) 34 (0.5) 0.15 0.43 2
5 Effort 3632 (58.4) 1664 (26.7) 637 (10.2) 214 (3.4) 76 (1.2) 0.46 0.38 4
6 Worthless 5004 (80.4) 765 (12.3) 326 (5.2) 89 (1.4) 39 (0.6) 0.15 0.43 1
Average 3948 (63.4) 1459 (23.4) 627 (10.1) 146 (2.3) 44 (0.7) 0.43 0.42
Tomitaka et al. BMC Psychiatry (2017) 17:290 Page 3 of 12

curves were calculated using SAS JMP (Version 11 forWindows).
ResultsItem responses for K6 items and the distribution of totalitem scoresItem responses to the K6 are shown in Table 1. The itemresponses for the 6 items showed a certain pattern, withthe highest response rate for “none,” a decreasing re-sponse rate with the increasing item score, and the low-est response rate for “all.” While the ratio of “a little” to“none” varied by item (mean ± SD = 0.43 ± 0.28), the ra-tio of “some” to “a little” was stable for all items(mean ± SD = 0.42 ± 0.04). All 6 items were rankedaccording to the ratio of “a little” to “none” in as-cending order.For the pattern analysis of item responses, all response
frequencies were plotted on a single graph. As presentedin Fig. 1a, the item response frequencies demonstrated acertain pattern. As pointed by the arrow (Fig. 1a), the linesfor the 6 items intersected at a single point between“none” and “a little,” whereas the same lines decreasedregularly and converged at one point. As verified in ourprevious studies, if the ratios of “some” to “a little,” “most”to “some,” and “all” to “most” are similar among all items,lines for item responses intersect at a single point between“none” and “a little” as expected [23].Using a semi-logarithmic scale (Fig. 1b), the item re-
sponses of the 6 items approximated a linear pattern be-tween “a little” and “all of the time.” The slopes of thelines for the 6 items were similar between “a little” and“all.” The extent of parallelism of the 6 items represents
the similarity of the ratios of “some” to “a little,” “most”to “some,” and “all” to “most” among the 6 items. Expo-nential regression analysis was performed on the datafrom 1 to 5 points (“a little” to “all”) for item 1(y = 5909e-1.384x, R2 = 0.99), item 2 (y = 11054e-1.357x,R2 = 0.98), item 3 (y = 9211e-1.288x, R2 = 0.98), item 4(y = 2392e-1.064x, R2 = 0.99), item 5 (y = 4817e-1.035x,R2 = 0.99), and item 6 (y = 2211e-1.023x, R2 = 0.99). Thepredictor variable (x) was the item score, the predictedvariable (y) was the frequency of respondents, and R2
was the coefficient of determination. The analysisshowed high R2 values, indicating that the exponentialmodels provided a good fit to the data with similar re-gression coefficients (−1.023 to −1.384).As shown in Fig. 2, we examined the total score distri-
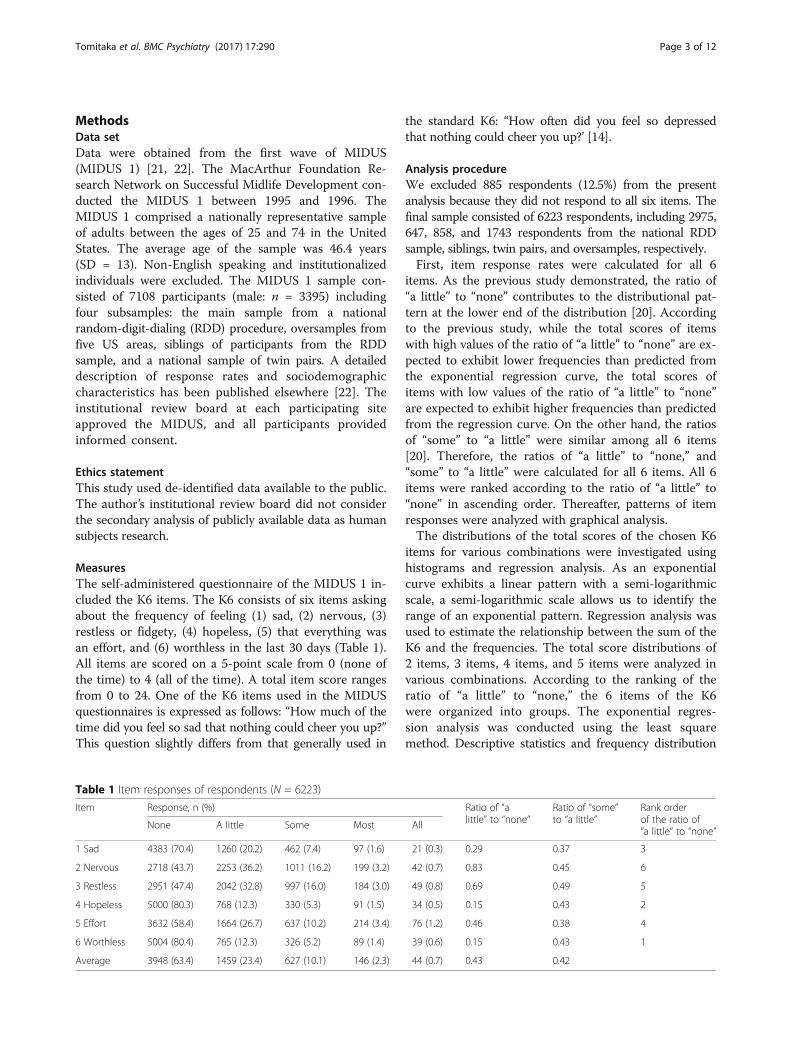
bution of the 6 items. The distribution was positivelyskewed (Fig. 2a). Using a semi-logarithmic scale (Fig. 2b),the total scores exhibited a linear pattern for almost thewhole extent of the distribution. Of note, the total scoresfluctuated more with the increase of total scores, consist-ent with previous studies [11, 17]. The fluctuation may bedue to the small sample sizes at the highest scores. Thepossibility that the small sample sizes caused the fluctua-tions is supported by the fact that the frequencies at thehigher scores were very low (less than 10).Exponential regression analysis was performed on
the total score data (y = 1787.7e-0.26x, R2 = 0.97). Thepredictor variable (x) was the total score, and the pre-dicted variable (y) was the frequency of participants.The analysis showed a high R2 value, indicating thattotal scores showed a good fit to an exponentialdistribution.
Fig. 1 Item responses for 6 items. The item responses for 6 items are presented for normal (a) and semi-logarithmic (b) scales. a The item responsesfor each of the 6 items showed a common pattern. The lines for the 6 items crossed between “none” and “a little,” whereas the same lines exhibiteda right-skewed pattern between “a little” and “all.” The line of item 4 is hiding behind that of item 6. The responses of Item 4 and 6 are very similar(Table 1). b Using a semi-logarithmic scale, the item responses for the 6 items showed a linear pattern between “a little” and “all”
Tomitaka et al. BMC Psychiatry (2017) 17:290 Page 4 of 12
Distributions of the sum of 5 itemsNext, the total score distributions of 5 item scores wereanalyzed. Based on the ranking order of the ratio of “alittle” to “none,” two groups of items were chosen: lowratio group (items 1, 3, 4, 5, and 6) and high ratio group(items 1, 2, 3, 4, and 5). The low ratio group compriseditems from first to fifth place in the ranking of the ratioof “a little” to “none” in ascending order, and the highratio group consisted of items ranked second to sixth.The average of the ratio of “a little” to “none” was0.35 and 0.48 for the low ratio group and high ratiogroup, respectively.The distributions for the two groups are depicted in
Fig. 3a (low ratio group) and Fig. 3b (high ratio group).Both of the distributions were positively skewed. Using asemi-logarithmic scale (Fig. 3c and d), the two groupsexhibited linear patterns with similar slopes from 0 to 20points, indicating that the two distributions exhibited anexponential pattern, with similar regression coefficients.Consistent with the total scores of the 6 items (Fig. 2b), thedistribution fluctuated at the highest scores (Fig. 3c and d).Exponential regression analysis was perfrmed on data of
the low ratio group from 0 to 24 points (y = 2059.7e-0.311x,R2 = 0.95) and high ratio group from 0 to 24 points(y = 2275e-0.306x, R2 = 0.98). In line with semi-logarithmicscale findings, the regression analysis showed high coeffi-cients of determination (R2, 0.95 to 0.98) with similar rateparameters (−0.306 to −0.311).
Distributions of the sum of 4 itemsBased on the ranking order of the ratio of “a little” to“none,” three groups were chosen: low ratio group
(items 1, 4, 5, and 6), middle ratio group (items 1, 3, 4,and 5), and high ratio group (items 1, 2, 3, and 5). Thelow ratio group comprised items from the first to thefourth rank order of the ratio of “a little” to “none,” themiddle ratio group comprised items from the second tofifth, and high ratio group comprised items from thethird to sixth. The averages of the ratio of “a little” to“none” were 0.26, 0.40, and 0.57 for the low ratio group,middle ratio group, and high ratio group, respectively.Figure 4 depicts the total score distributions for the
three groups. While all three distributions were posi-tively skewed, they differed in frequency of the zero score(Fig. 4a–c). Using a semi-logarithmic scale (Fig. 4d–f), allthree groups exhibited linear patterns with similar slopes.As the arrows point, the distribution of the low ratio group(Fig. 4d) showed mildly higher frequencies than expectedfrom the linear patterns, while the distribution of the highratio group (Fig. 4f) showed mildly lower frequencies thanexpected from the linear patterns. An apparent gap be-tween the frequencies at the lowest end of the total scoreand the linear pattern was not detected in the middle ratiogroup (Fig. 4e).Exponential regression analysis was performed on data
from the low ratio group (y = 2072e-0.358x, R2 = 0.95),middle ratio group (y = 2687e-0.371x, R2 = 0.98), and highratio group (y = 3088e-0.372x, R2 = 0.97). The analysis re-vealed high R2 values in three distributions with similarparameters (−0.358 to −0.372).
Distributions of the sum of 3 itemsThree groups were chosen: low ratio group (items 1, 4,and 6), middle ratio group (items 1, 3, and 5), and high
Fig. 2 Distributions of the total scores of the K6. a The distribution of the total score was right-skewed on a normal scale. b The distribution ofthe total score showed a linear pattern on a semi-logarithmic scale
Tomitaka et al. BMC Psychiatry (2017) 17:290 Page 5 of 12

ratio group (items 2, 3, and 5). The low ratio group con-sisted of items from the first to the third rank order ofthe ratio of “a little” to “none,” the middle ratio groupconsisted of items from the third to fifth, and high ratiogroup consisted of items from the fourth to sixth. Theaverages of the ratio of “a little” to “none” were 0.20,0.48, and 0.66 for the low ratio group, middle ratiogroup, and high ratio group, respectively.Figure 5a–c depicts the distributions of the total scores
for the three groups. While all three distributions werepositively skewed, the high ratio group exhibited a plateaubetween points 1 and 2 (Fig. 5c). Using a semi-logarithmicscale (Fig. 5d–f ), all three distributions exhibited linearpatterns with similar slopes. Between points 0 to 2, thelow ratio group (Fig. 5d) showed higher frequencies thanexpected from the linear pattern, while the high ratiogroup (Fig. 5f) showed lower frequencies than expectedfrom the linear pattern. An apparent gap between the fre-quencies at the lowest end of the total score and the linearpattern was not detected in the middle ratio group(Fig. 5). At point 12, all three distributions showed higherfrequencies than expected from the linear patterns.
Exponential regression analysis was performed on datafrom the low ratio group (y = 2559e-0.463x, R2 = 0.96),middle ratio group (y = 4158e-0.484x, R2 = 0.98), and lowratio group (y = 3942e-0.447x, R2 = 0.97). In line withsemi-logarithmic scale findings, the regression analysisshowed high R2 values in all three distributions withsimilar rate parameters (−0.447 to −0.484).
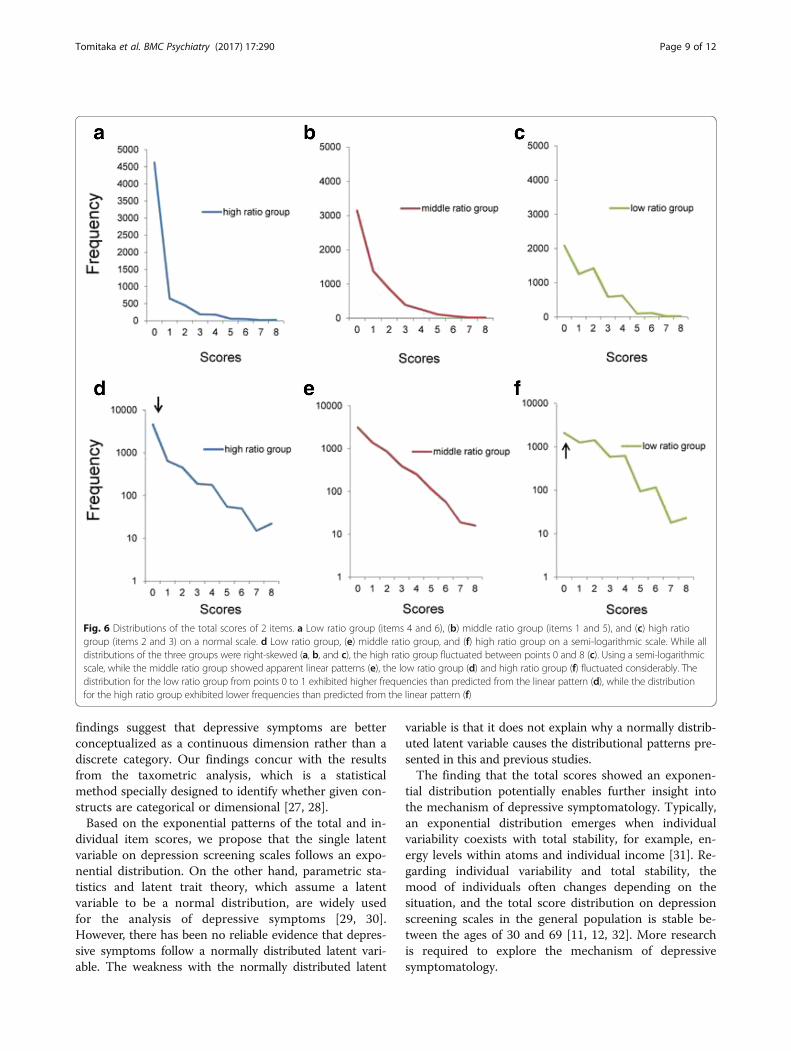
Distributions of the sum of 2 itemsFinally, to analyze the patterns of the sum of 2 itemscores, three groups were chosen: low ratio group (items4 and 6), middle ratio group (items 1 and 5), and low ra-tio group (items 2 and 3). The low ratio group consistedof the first and second items in the rank order of the ra-tio of “a little” to “none,” middle ratio group consisted ofthe third and fourth, and high ratio group consisted of thefifth and sixth. The averages of the ratio of “a little” to“none” were 0.15, 0.38, and 0.76 for the low ratio group,middle ratio group, and high ratio group, respectively.Figure 6a–c shows the three distributions of the sum
of 2 item scores. While the three distributions were posi-tively skewed, the high ratio group fluctuated between
Fig. 3 Distributions of the total scores of the 5 items. a Low ratio group (items 1, 3, 4, 5, and 6) and (b) high ratio group (items 1, 2, 3, 4, and 5)on a normal scale. c Low ratio group and (d) high ratio group on a semi-logarithmic scale. The distributions of the total scores of 5 item scores for thetwo groups were commonly right-skewed (a, b). Using semi-logarithmic scales, the two groups showed linear patterns with similar gradients (c, d)
Tomitaka et al. BMC Psychiatry (2017) 17:290 Page 6 of 12

points 0 and 6 (Fig. 6c). Using a semi-logarithmic scale,while the middle ratio group (Fig. 6e) showed a linearpattern, the low ratio group (Fig. 6d) and high ratiogroup (Fig. 6f ) fluctuated considerably. The distributionfor the low ratio group (Fig. 6d) from points 0 to 1showed higher frequencies than expected from the linearpattern, while the distribution for the high ratio group(Fig. 6f ) showed lower frequencies than expected fromthe linear pattern.Exponential regression analysis was performed on data
from the low ratio group (y = 3674e-0.638x, R2 = 0.93),middle ratio group (y = 6132e-0.677x, R2 = 0.99), and highratio group (y = 6051e-0.627x, R2 = 0.92). Although the
regression analysis revealed a higher R2 value in the mid-dle ratio group, the low ratio group and high ratio groupdid not exhibit higher R2 values compared to the middleratio group, probably due to the fluctuations of the dis-tributions. The estimated rate parameters were similaramong the three groups (−0.627 to −0.677).
DiscussionThe present studies yielded three main findings. First, ir-respective of the choice of items, the sum of item scoresof K6 exhibited an exponential pattern,with the excep-tion of the lower end of the distribution. Second, the es-timated rate parameters of the regression analysis were
Fig. 4 Distributions of the total scores of 4 items. a Low ratio group (items 1, 4, 5, and 6), (b) middle ratio group (items 1, 3, 4, and 5), and (c)high ratio group (items 1, 2, 3, and 5) on a normal scale. d Low ratio group, (e) middle ratio group, and (f) high ratio group on a semi-logarithmicscale. While all distributions of the three groups are right-skewed, the frequencies of the zero score differed between groups (a, b, and c). Usingsemi-logarithmic scales, all three groups showed linear patterns with similar gradients. At the lowest end of the scores, the distribution for thelow ratio group (d) exhibited slightly higher frequencies than predicted from the linear pattern, while the distribution for the high ratio group (f)exhibited slightly lower frequencies than predicted from the linear pattern. The divergence of the actual data from the predicted linear pattern atthe lower end of the distribution was not evident for the middle ratio group (e)
Tomitaka et al. BMC Psychiatry (2017) 17:290 Page 7 of 12

similar among groups with the same number of items,and increased in proportion to the number of chosenitems. Lastly, the ratio of “none” to “a little” of thechosen items contributed to the distributional pattern ofthe total scores at the lower end of the distribution.Our results reveal that the sum of K6 item scores in
various combinations shows an exponential curve, withthe exception of the lower end of the distribution. Theseresults concur with previous findings using the CES-D[20], suggesting that regardless of the depression screen-ing scales, the sum of item scores approximate an expo-nential pattern, with the exception of the lowest scores.A theory proposed by our research group may explainwhy the sum of item scores for depression screeningscales follow an exponential pattern [11, 24, 25]. Our
theory consists of three main parts. First, all item scoresare manifest variables, which correspond to a single la-tent variable. Second, the latent variable of all itemscores follows an exponential distribution. Finally, thethreshold of item scoring differs from individual to indi-vidual, and forms a frequency distribution according tothe single latent variable [11, 24, 25]. In favor of this the-ory, our recent study simulating the three parts showedthat the total score distribution exhibits the distribu-tional pattern of a latent variable, with the exception ofthe lowest symptom counts [24].A total score of 13 on the K6 scale has been used as a
cut-off point for serious mental illness [26]. Figure 2 il-lustrates that exponential pattern extends almost the en-tire range of K6 scores beyond the cut-off point. These
Fig. 5 Distributions of the total scores of 3 items. a Low ratio group (items 1, 4, and 6), (b) middle ratio group (items 1, 3, and 5), and (c) highratio group (items 2, 3, and 5) on a normal scale. d Low ratio group, (e) middle ratio group, and (f) high ratio group on a semi-logarithmic scale.While all distributions of the three groups were right-skewed, the frequencies of the zero score differed between groups (a, b, and c). Usingsemi-logarithmic scales, all three groups showed linear patterns with similar gradients. At the lowest end of the scores, the distribution for the lowratio group (d) exhibited higher frequencies than predicted from the linear pattern, while the distribution for the high ratio group (f) exhibited lowerfrequencies than predicted from the linear pattern. The divergence of the actual data from the predicted linear pattern at the lower end of thedistribution was not evident for the middle ratio group (e)
Tomitaka et al. BMC Psychiatry (2017) 17:290 Page 8 of 12
findings suggest that depressive symptoms are betterconceptualized as a continuous dimension rather than adiscrete category. Our findings concur with the resultsfrom the taxometric analysis, which is a statisticalmethod specially designed to identify whether given con-structs are categorical or dimensional [27, 28].Based on the exponential patterns of the total and in-
dividual item scores, we propose that the single latentvariable on depression screening scales follows an expo-nential distribution. On the other hand, parametric sta-tistics and latent trait theory, which assume a latentvariable to be a normal distribution, are widely usedfor the analysis of depressive symptoms [29, 30].However, there has been no reliable evidence that depres-sive symptoms follow a normally distributed latent vari-able. The weakness with the normally distributed latent
variable is that it does not explain why a normally distrib-uted latent variable causes the distributional patterns pre-sented in this and previous studies.The finding that the total scores showed an exponen-
tial distribution potentially enables further insight intothe mechanism of depressive symptomatology. Typically,an exponential distribution emerges when individualvariability coexists with total stability, for example, en-ergy levels within atoms and individual income [31]. Re-garding individual variability and total stability, themood of individuals often changes depending on thesituation, and the total score distribution on depressionscreening scales in the general population is stable be-tween the ages of 30 and 69 [11, 12, 32]. More researchis required to explore the mechanism of depressivesymptomatology.
Fig. 6 Distributions of the total scores of 2 items. a Low ratio group (items 4 and 6), (b) middle ratio group (items 1 and 5), and (c) high ratiogroup (items 2 and 3) on a normal scale. d Low ratio group, (e) middle ratio group, and (f) high ratio group on a semi-logarithmic scale. While alldistributions of the three groups were right-skewed (a, b, and c), the high ratio group fluctuated between points 0 and 8 (c). Using a semi-logarithmicscale, while the middle ratio group showed apparent linear patterns (e), the low ratio group (d) and high ratio group (f) fluctuated considerably. Thedistribution for the low ratio group from points 0 to 1 exhibited higher frequencies than predicted from the linear pattern (d), while the distributionfor the high ratio group exhibited lower frequencies than predicted from the linear pattern (f)
Tomitaka et al. BMC Psychiatry (2017) 17:290 Page 9 of 12

The estimated rate parameters of the individual andtotal scores were −1.02 to −1.38, −0.63 to −0.68, −0.45to −0.48, −0.36 to 0.37, −0.30 to −0.31, and −0.26 foreach item response, and 2, 3, 4, 5, and 6 items, respect-ively. The estimated parameters increased in proportionto the number of chosen items, and the distributions ofthe same number of items showed similar parameters,consistent with previous reports using the CES-D [20].The previous paper using the CES-D indicated that
the estimated rate parameters of the distributions for 2, 4,8, and 16 items were −0.62 to −0.93, −0.41 to −0.52, −0.26to −0.29, and −0.14, respectively [20]. Interestingly, therate parameters were similar between 6-item scores ofthe K6 (−0.26) and 8-item scores of the CES-D(−0.26 to −0.29), and between 3-item scores of theK6 (−0.45 to −0.48) and the 4-item score of the CES-D (−0.41 to −0.52). The maximum total scores forboth 6-item scores of the K6 and 8-item scores of theCES-D have the same maximum total score of 24points, and 3-item scores of the K6 and the 4-itemscore of the CES-D have the same highest possiblescore of 12 points. These results raise the possibilitythat the highest possible score of chosen items maycontribute to the estimated rate parameter of thetotal score distributions of the chosen items. More re-search is required to understand the mechanism ofthe rate parameters.Our findings demonstrate that, at the lower end of the
distribution, the total scores of chosen items exhibiteddifferent patterns according to the ratio of “a little” to“none.” More specifically, the distributional pattern forthe low ratio group with 2, 3, and 4 items showed higherfrequencies than expected from the fitted exponentialcurve, whereas the high ratio group with 2, 3, and 4items showed lower frequencies than expected from theexponential curve. The middle ratio group showed anexponential pattern for the entire range. Our resultsconcur with previous reports using the CES-D [20].Taken together, these findings support that the probabil-ity of “none” plays a vital role in predicting the patternof total scores of the chosen item at the lowest scores.Several analyses of CIS-R data from the British National
Household Psychiatric Morbidity Survey have revealedthat, although exponential regression analysis fitted totalCIS-R scores, the actual frequencies at the lower end ofthe total CIS-R scores were higher compared to thoseexpected from the regression analysis [10, 33, 34]. TheCIS-R is scored with binary response options (absence orpresence) [35], suggesting that the pattern at the lowerend of the total CIS-R scores depends on the percentageof “absence.” Based on our analysis of the CIS-R data [36],the average percentage of “absence” in CIS-R data (90.1%)was much greater than the percentage of “none” in thepresent study (63.4%).
Our findings indicated that the total scores fluctuatedmore with the increase of total scores on a semi-logarithmic scale (Fig. 2b). These results are congruentwith previous studies [11, 17], indicating that the smallsample sizes resulted in fluctu0ation at the higher end ofthe distribution. In fact, as the total scores increased, thefrequencies decreased.The findings of this research need interpretation in
light of some limitations. Although we demonstratedthat an exponential curve fitted the total and individualitem score data, we did not fit other functions to thedata. Generally, the most important part of model selec-tion is to identify patterns in data. However, there is lit-tle published data on the patterns of total and individualitem scores. Thus, using histograms and regression ana-lysis, we identified the patterns. More research is neededto assess the comparative fit of other patterns to the datafrom the Interuniversity Consortium for Political andSocial Research (ICPSR) repository.This research has some methodological strengths.
First, as noted in the Introduction, data of MIDUS arelarge sample sizes with limited selection bias. Moreover,since all data are archived at the ICPSR repository andare publicly available, researchers can easily review thepresent findings using the raw data. Second, even thoughthe method for this research was simple (visualizationswith histograms), it enabled identification of a complexpattern of item responses; this could have been over-looked if item responses were not examined visually.Graphical analysis is indispensable in exploratory dataanalysis for complex models [37]. Finally, the results ofthis research provide insights into depressive symptom-atology in the general population. It would be interestingto determine whether these findings can be generalizedto clinician-rated depression scales.
ConclusionThe findings from this research suggest that total scoreson the depression screening scales follow an exponentialpattern, with the exception of the lower end of the dis-tribution. Based on the distributional patterns observedin this study, it is necessary to reconsider the statisticalmodel of normally distributed depressive symptomscores, which is often presupposed in population studieson depressive symptomatology. The present results po-tentially enable further insight into the mechanism ofdepressive symptomatology, and estimation of how de-pressive symptoms distribute in a general population.
AbbreviationsBRFSS: Behavioral Risk Factor Surveillance Survey; CDA: Confirmatory dataanalysis; CES-D: Center for Epidemiologic Studies Depression Scale; CIS-R: Revised Clinical Interview Schedule; EDA: Exploratory data analysis;K6: Kessler Screening Scale for Psychological Distress; MIDUS: National Surveyof Midlife Development in the United States; NHIS: National Health InterviewSurvey; PHQ: Patient Health Questionnaire; RDD: Random-digit-dialing
Tomitaka et al. BMC Psychiatry (2017) 17:290 Page 10 of 12

AcknowledgementsWe would like to thank Professor Kazumasa Mori at Bunkyo University for hishelpful advice.
FundingThe research received no specific grant from any funding agency in thepublic, commercial, and not-for-profit sectors.
Availability of data and materialsThe datasets analyzed during the current study are available in the ICPSRrepository.
Authors’ contributionsST carried out the design of the study and the statistical analysis and wrotethe manuscript. YK, KI, MA, contributed to the analysis of the data. HY, YO,and TAF contributed to the acquisition of data. YK, KI, MA, HY, YO, and TAFinterpreted the data and wrote the manuscript. All authors read andapproved the final manuscript.
Ethics approval and consent to participateThe present study used de-identified data available to the public. The author’sinstitutional review board did not recognize the secondary analysis of publiclyavailable data as human subjects research.
Consent for publicationNot applicable.
Competing interestsThe authors declare that they have no competing interests.
Publisher’s NoteSpringer Nature remains neutral with regard to jurisdictional claims in publishedmaps and institutional affiliations.
Author details1Department of Mental Health, Panasonic Health Center, Landic building 3F,Nishishinbashi 3-8-3, Minato-ku, Tokyo 105-0003, Japan. 2Department of DrugEvaluation and Informatics, School of Pharmaceutical Sciences, University ofShizuoka, 52-1 Yada, Suruga-ku, Shizuoka 422-8526, Japan. 3Department ofHealth Promotion and Human Behavior, Department of ClinicalEpidemiology, Kyoto University Graduate School of Medicine/School ofPublic Health, Yoshida Konoe-cho, Sakyo-ku, Kyoto 606-8501, Japan.4Department of Pharmacoepidemiology, Graduate School of Medicine andPublic Health, Kyoto University, Yoshida Konoe-cho, Sakyo-ku, Kyoto606-8501, Japan. 5Center for the Promotion of Interdisciplinary Educationand Research, Kyoto University, Yoshida-honmachi, Sakyo-ku, Kyoto 606-8501,Japan. 6Center for the Development of Cognitive Behavior Therapy Training,Shirogane-cho 1-13, Shinjuku-ku, Tokyo 162-0816, Japan.
Received: 3 March 2017 Accepted: 28 July 2017
References1. WHO | Depression [Internet]. WHO. World Health Organization; 2017 [cited 2017
May 5]. Available from: http://www.who.int/mediacentre/factsheets/fs369/en/.2. Whiteford HA, Degenhardt L, Rehm J, Baxter AJ, Ferrari AJ, Erskine HE, et al.
Global burden of disease attributable to mental and substance usedisorders: findings from the Global Burden of Disease Study 2010. Lancet[Internet]. 2013 [cited 2017 May 6];382:1575–86. Available from: http://www.thelancet.com/journals/lancet/article/PIIS0140-6736(13)61611-6/fulltext.
3. Blazer DG, Kessler RC, McGonagle KA, Swartz MS. The prevalence anddistribution of major depression in a national community sample: TheNational Comorbidity Survey. Am. J. Psychiatry [Internet] AmericanPsychiatric Publishing; 1994 [cited 2017 Apr 15];151:979–986. Available from:http://psychiatryonline.org/doi/abs/10.1176/ajp.151.7.979.
4. Kroenke K, Strine TW, Spitzer RL, Williams JBW, Berry JT, Mokdad AH, et al.The PHQ-8 as a measure of current depression in the general population. J.Affect. Disord. [Internet]. World Health Organization, Geneva, Switzerland;2009 [cited 2017 Apr 15];114:163–73. Available from: http://www.ncbi.nlm.nih.gov/pubmed/18752852.
5. Wild C. The concept of distribution. Stat. Educ. Res. J. [Internet]. 2006 [cited2017 May 28];5:10–26. Available from: https://pdfs.semanticscholar.org/2f3e/4ae2d453913eddfb79d01fd4fbd5f8fde269.pdf.
6. Tukey JW. Exploratory data analysis: Addison-Wesley Pub. Co; 1977.7. Haig BD. An Abductive Theory of Scientific Method. Psychol. Methods
[Internet]. 2005 [cited 2017 may 10];10:371–88. Available from: http://www.ncbi.nlm.nih.gov/pubmed/16392993.
8. Behrens JT, Yu C-H, Behrens JT, Yu C. Exploratory Data Analysis. Handb. Psychol.[Internet]. Hoboken, NJ, USA: John Wiley & Sons, Inc.; 2003 [cited 2017 Apr 29].Available from: http://doi.wiley.com/10.1002/0471264385.wei0202.
9. Jebb AT, Parrigon S, Woo SE. Exploratory data analysis as a foundation ofinductive research. Hum. Resour. Manag. Rev. [Internet]. 2017 [cited 2017Apr 29];27:265–76. Available from: http://www.sciencedirect.com/science/article/pii/S1053482216300353.
10. Melzer D, Tom BDM, Brugha TS, Fryers T, Meltzer H. Common mentaldisorder symptom counts in populations: are there distinct case groupsabove epidemiological cut-offs? Psychol. Med. [Internet]. CambridgeUniversity Press; 2002 [cited 2017 Apr 15];32:1195–201. Available from:http://www.journals.cambridge.org/abstract_S0033291702006049.
11. Tomitaka S, Kawasaki Y, Furukawa T. Right tail of the distribution ofdepressive symptoms is stable and follows an exponential curve duringmiddle adulthood. Stewart R, editor. PLoS One [Internet]. Labor and WelfareStatistics Association; 2015 [cited 2017 May 4];10:e0114624. Available from:http://dx.plos.org/10.1371/journal.pone.0114624.
12. Tomitaka S, Kawasaki Y, Ide K, Yamada H, Miyake H, Furukawa TA.Distribution of total depressive symptoms scores and each depressivesymptom item in a sample of Japanese employees. Hashimoto K,editor. PLoS One [Internet]. Public Library of Science; 2016 [cited 2017Jun 8];11:e0147577. Available from: https://doi.org/10.1371/journal.pone.0147577.
13. Furukawa TA, Kessler RC, Slade T, Andrews G. The performance of the K6and K10 screening scales for psychological distress in the AustralianNational Survey of Mental Health and Well-Being. Psychol. Med. [Internet].2003 [cited 2017 may 21];33:357–62. Available from: http://www.ncbi.nlm.nih.gov/pubmed/12622315.
14. Kessler RC, Andrews G, Colpe LJ, Hiripi E, Mroczek DK, Normand SLT, et al.Short screening scales to monitor population prevalences and trends innon-specific psychological distress. Psychol. Med. [Internet]. CambridgeUniversity Press; 2002 [cited 2017 Apr 15];32:959–76. Available from: http://www.ncbi.nlm.nih.gov/pubmed/12214795.
15. Sakurai K, Nishi A, Kondo K, Yanagida K, Kawakami N. Screeningperformance of K6/K10 and other screening instruments for mood andanxiety disorders in Japan. Psychiatry Clin. Neurosci. [Internet]. BlackwellPublishing Asia; 2011 [cited 2017 May 27];65:434–41. Available from: http://doi.wiley.com/10.1111/j.1440-1819.2011.02236.x.
16. Chan SM, Fung TCT. Reliability and validity of K10 and K6 in screeningdepressive symptoms in Hong Kong adolescents. Vulnerable Child. YouthStud. [Internet]. Routledge; 2014 [cited 2017 May 27];9:75–85. Availablefrom: http://www.tandfonline.com/doi/abs/10.1080/17450128.2013.861620.
17. Tomitaka S, Kawasaki Y, Ide K, Akutagawa M, Yamada H, Yutaka O, et al.Pattern analysis of total item score and item response of the KesslerScreening Scale for Psychological Distress (K6) in a nationally representativesample of US adults. PeerJ [Internet]. 2017;5:e2987. Available from: https://doi.org/10.7717/peerj.2987.
18. Kroenke K, Spitzer RL. The PHQ-9: A New Depression Diagnostic andSeverity Measure. Psychiatr. Ann. [Internet]. SLACK; 2002 [cited 2017 Apr 29];32:509–15. Available from: http://www.healio.com/doiresolver?doi=10.3928/0048-5713-20020901-06.
19. Kroenke K, Spitzer RL, Williams JBW, Löwe B. The Patient Health QuestionnaireSomatic, Anxiety, and Depressive Symptom Scales: a systematic review. Gen.Hosp. Psychiatry [Internet]. 2010 [cited 2017 Apr 20];32:345–59. Available from:http://www.ncbi.nlm.nih.gov/pubmed/20633738.
20. Tomitaka S, Kawasaki Y, Ide K, Akutagawa M, Yamada H, Furukawa TA, et al.Relationship between item responses of negative affect items and the distributionof the sum of the item scores in the general population. Hashimoto K, editor. PLoSOne [Internet]. Labor and Welfare Statistics Association; 2016 [cited 2017 Jun 4];11:e0165928. Available from: http://dx.plos.org/10.1371/journal.pone.0165928.
21. Brim OG, Ryff CD, Kessler RC. The MIDUS National Survey: An Overview.How Heal. Are We? A Natl. Study Well-being Midlife [Internet]. University ofChicago Press; 2004 [cited 2017 Apr 15]. p. 1–36. Available from: http://psycnet.apa.org/psycinfo/2004-00121-001.
Tomitaka et al. BMC Psychiatry (2017) 17:290 Page 11 of 12

22. Brim OG, Baltes PB, Bumpass LL, Cleary PD, Featherman DL, Hazzard WR,et al. Midlife in the United States (MIDUS 1), 1995–1996. ICPSR2760-v11. AnnArbor, MI: Inter-university Consortium for Political and Social Research[distributor], 2016–03-23. https://doi.org/10.3886/ICPSR02760.V11.
23. Tomitaka S, Kawasaki Y, Furukawa T. A distribution model of the responsesto each depressive symptom item in a general population: a cross-sectionalstudy. Br. Med. J. [Internet]. 2015;5:e008599. Available from: http://dx.doi.org/10.1136/bmjopen-2015-008599.
24. Tomitaka S, Kawasaki Y, Ide K, Akutagawa M. Exponential distribution of totaldepressive symptom scores in relation to exponential latent trait and itemthreshold distributions: a simulation study. Proc. the Japanese Jt. Stat. Meet. 39.2016.
25. Tomitaka S, Kawasaki Y, Ide K, Akutagawa M, Yamada H, Furukawa TA, et al.Boundary curves of individual items in the distribution of total depressivesymptom scores approximate an exponential pattern in a generalpopulation. PeerJ [Internet]. 2016 [cited 2017 Jul 25];2016:e2566. Availablefrom: http://www.ncbi.nlm.nih.gov/pubmed/27761346.
26. Kessler RC, Barker PR, Colpe LJ, Epstein JF, Gfroerer JC, Hiripi E, et al.Screening for serious mental illness in the general population. Arch. Gen.Psychiatry [Internet]. 2003 [cited 2017 may 26];60:184–9. Available from:http://www.ncbi.nlm.nih.gov/pubmed/12578436.
27. Slade T, Andrews G. Latent structure of depression in a community sample:a taxometric analysis. Psychol. Med. [Internet]. 2005 [cited 2017 may 28];35:489–97. Available from: http://www.ncbi.nlm.nih.gov/pubmed/15856719.
28. Okumura Y, Sakamoto S, Ono Y. Latent Structure of Depression in aJapanese Population Sample: Taxometric Procedures. Aust. New Zeal. J.Psychiatry [Internet]. 2009 [cited 2017 May 28];43:666–73. Available from:http://journals.sagepub.com/doi/10.1080/00048670902970841.
29. Emberton X, Reise X. Item Response Theory for Psychologists [Internet].Lawrence Erlbaum Associates Publishers; 2000 [cited 2017 May 21].Available from: http://doi.apa.org/record/2000-03918-000.
30. Lindsey JK. Parametric Statistical Inference [Internet]. Oxford UniversityPress.; 1996 [cited 2017 May 21]. Available from: https://books.google.co.jp/books?hl=ja&lr=lang_ja%7Clang_en&id=YnsQ-NnMxJ8C&oi=fnd&pg=PA3&dq=lindsey+parametric+statistical+inference&ots=swV6FzvTKj&sig=MLf0SalIPfa959e_q1Yf2FWR5n4.
31. Dragulescu A, Yakovenko VM. Statistical mechanics of money. Eur. Phys. J. B[Internet]. EDP Sciences; 2000 [cited 2017 May 27];17:723–9. Available from:http://link.springer.com/10.1007/s100510070114.
32. Tomitaka S, Kawasaki Y, Ide K, Yamada H, Furukawa TA, Ono Y. Age-relatedchanges in the distributions of depressive symptom items in the generalpopulation: a cross-sectional study using the exponential distribution model.PeerJ [Internet]. 2016;4:e1547. Available from: https://peerj.com/articles/1547/.
33. Bebbington PE, McBride O, Steel C, Kuipers E, Radovanovi M, Brugha T, et al.The structure of paranoia in the general population. Br. J. Psychiatry [Internet].2013 [cited 2017 Apr 15];202:419–27. Available from: http://bjp.rcpsych.org/content/202/6/419.
34. Brugha TS, Bebbington PE, Singleton N, Melzer D, Jenkins R, Lewis G, et al.Trends in service use and treatment for mental disorders in adults throughoutGreat Britain. Br. J. Psychiatry [Internet]. 2004 [cited 2017 May 21];185. Availablefrom: http://bjp.rcpsych.org/content/185/5/378.
35. Lewis G, Pelosi AJ, Araya R, Dunn G. Measuring psychiatric disorder in thecommunity: a standardized assessment for use by lay interviewers. Psychol.Med. [Internet]. 1992 [cited 2017 Apr 19];22:465–86. Available from: http://www.ncbi.nlm.nih.gov/pubmed/1615114.
36. McManus S, Meltzer H, Brugha TT, Bebbington PP, Jenkins R. Adultpsychiatric morbidity in England, 2007 Results of a household survey[Internet]. Heal. Soc. Care Inf. Centre, Soc. Care Stat. 2009 [cited 2017 May21]. Available from: https://sp.ukdataservice.ac.uk/doc/6379/mrdoc/pdf/6379research_report.pdf.
37. Gelman A. Exploratory Data Analysis for Complex Models. J. Comput. Graph.Stat. [Internet]. Taylor & Francis; 2004 [cited 2017 Apr 15];13:755–79. Availablefrom: http://www.tandfonline.com/doi/abs/10.1198/106186004X11435.
• We accept pre-submission inquiries
• Our selector tool helps you to find the most relevant journal
• We provide round the clock customer support
• Convenient online submission
• Thorough peer review
• Inclusion in PubMed and all major indexing services
• Maximum visibility for your research
Submit your manuscript atwww.biomedcentral.com/submit
Submit your next manuscript to BioMed Central and we will help you at every step:
Tomitaka et al. BMC Psychiatry (2017) 17:290 Page 12 of 12

BioMed Central publishes under the Creative Commons Attribution License (CCAL). Underthe CCAL, authors retain copyright to the article but users are allowed to download, reprint,distribute and /or copy articles in BioMed Central journals, as long as the original work isproperly cited.


![[CB16] Background Story of "Operation neutralizing banking malware" and highly developed financial malware by Kazuki Takada](https://img.pdfslide.tips/doc/110x75/587756c21a28ab84388b776d/cb16-background-story-of-operation-neutralizing-banking-malware-and-highly.jpg)