Embed Size (px)
Citation preview
RIKENAccelerator
Progress Report
the Institute of Physical and Chemical Research
vol. 15
理化学研究所

RIKEN Accelerator Progress Report January-December
J~ 1t ~~ff ~ fifT
the Institute 01 Physical and Chemical Research Wako-shi, Saitoma, 3SJ JAPAN

Editors
F. Ambe Y. Gono
A. Hashizume T. Inamura
H. Kamitsubo N. Shiotani
This volume contains recent information of the accelerators at RIKEN (IPCR) , informal
reports and abstracts of papers which will be published at scientific meetings or in
publications by staff members, guests, and visitors.
All rights reserved. This report or any part thereof may not be reproduced in any
form (including photostatic or microfilm form) without written permission from
the publisher.
PREFACE
This is the fifteenth issue of the progress reports on research activities at the IPCR Cyclotron.
The first beam from the cyclotron was obtained in October in 1966 and the collaborative researches
started in 1967. Many important researches on nuclear physics, atomic and solid state physics,
nuclear and radiation chemistry and radiation biology have been carried out in these fifteen years.
The progress reports on these activities have been issued annually since 1967.
Need for a new accelerator increased in recent years at IPCR to develop researches using the
cyclotron , and construction of a new heavy-ion linac started in 1974. It was finished in 1980 and
beam acceleration tests are being carried out by now. At the same time the collaborative researches
using the linac started and many experimental facilities and devices have been installed at the
linac. Research works using the linac are in progress.
Now at IPCR the research activities using accelerators are developing in the new and wider
area in the fields of science and technology. Under these circumstances we decided to issue the
progress report of the IPCR Cyclotron in a new format. It contains not only the results obtained
at the 160 cm cyclotron but also those at the linac and other small accelerators. This new format
is to reflect the growing activities in the research fields of basic and applied nuclear science at our
Institute. At the same time the name of RIKEN will be used instead of IPCR. RIKEN is a
traditional abbreviation of the Institute of Physical and Chemical Research.
This volume summarized studies on nuclear physics, atomic collisions, solid state physics and
material engineering, radio chemistry, radiation biology and so on in a period from January to
December in 1981. There are also many reports on the developments in the accelerator technology
and design study of the new separated sector cyclotron which is now under construction as the
post accelerator for the linac.
I would like to acknowledge the effort of Dr. K. Mori to prepare the new format of the
RIKEN Accelerator Progress Report.
Hiromichi Kamitsubo
Editor

CONTENTS
I. INTRODUCTION
II. OPERATION OF ACCELERATORS
1. Machine Operation
2. Operation of Heavy Ion Linear Accelerator ......................... .
3. TANDETRON -Operation
III. RESEARCH ACTIVITIES
1. Nuclear Physics
1.
2.
3.
4.
Bare Potential DWBA for (d, p) Reactions
Mass Diffusion Coefficients in the Adiabatic Approximation
Non Perturbation Effect on the Nucleon Transfer Amplitudes in Close Contact Heavy-Ion Collisions
Full Finite-Range CCBA Analysis of the 22Ne (p, t)2oNe Reaction
5. Extended Brink Model and Its Derivation from Distorted
Page
11
14
16
17
20
23
26
Wave Born Approximation ....................................... 28
6. Angular Distribution of Reaction Products in Preequilibrium Process ....................................................... 30
7. Strongly Damped Components in the Reaction of 20Ne + 50Cr and 20N e + 54 Cr Systems ........................................ . 33
8. Incident Energy Dependence of Heavy-Residue Products in 14N + 62Ni ................................................. . 37
9. Light-Particle Emissions in the 93Nb + 14N Reaction
in the Region of "'7 to '" 15 Me V / A ............................... . 40
10. Alpha Particle vs. Ejectile Correlations in the 93Nb + 14N Reaction at 208 MeV ................................ . 43
11. Projectile Dependence of Fast Light-Particle Emission in Heavy- Ion Reaction 45
12. Polarization of Continuous Protons Emitted at 40° in the 93Nb + 14N Reaction ..................................... . 48
Page
13. Light-Particle Emission Following 7 Li-Induced Reactions 50
14. Influence of Chemical Environment on Outer-Shell Internal Conversion in 119Sn ... . ....................................... . 51
15. Highly Neutron Deficient Nuclei 157Yb ............. . ............... . 54
16. Calculation of Gamma-Ray Multiplicity Moments Associated with Massive-Transfer Reactions ................................... 57
17. Angular-Momentum Transfer and Alignment Following Preequilibrium ~-Particle Emission in Heavy-Ion Reactions
18. Search for ~-Decay from High Spin Yrast Region
19. In-Beam ')'-Ray Spectroscopy of 216Ra
2. Atomic and Solid-State Physics
1. A Broad Range Crystal Spectrometer
2. Angular Distribution of X-Rays Following Multiple Inner Shell Ionization ........................................... .
3. Ionization of Gases by Ion Bombardment ........................... .
4. Target Gas Pressure Dependence of X-Rays from 110 MeV Ne9+ Ions .....
5. Chemical Effects on F, Al and Si K~, and Cu L~ Satellite Spectra Produced by 2.4 MeV He++ ..................... . ......... .
6. Chemical Effect on 0 K~ Satellite Spectra Induced by 2.4 MeV He++ Ions .......................................... .
7. Preliminary Experiments for PIXE ................................ .
8. Backscattering Spectra from Silicides .............................. .
9. High Resolution Electron Spectrometer ......... . .................. .
10. Parallel Plate Electrostatic Spectrograph Using MCP and PSD ........... .
11. Beam-Foil Spectroscopy
12. Optical Detection of Atomic and Nuclear Spin Polarization Produced by Beam-Foil Interaction
13. Lattice Location of Sn Atoms Implanted into Al Crystals as Investigated by Means of Channeling Method ..................... .
60
61
64
66
69
70
71
73
75
77
79
81
83
85
86
87

Page
14. Secondary Electron Emission from Metal Targets under Heavy-Ion Bombardment . . . . . . . . . . . . . . . . . . . . . . . . . . . . . . . . . . . 88
15. Distributions of the Hyperfine Magnetic Field at 119Sn ( +- 119Sb) on the Surfaces of ~-Fe203 ......................... . 91
16. Angular Correlation Measurements on Nb-Mo System 94
17. Creep Properties in Helium-injected SUS 316 and I'" -Precipitation Strengthened Alloy ............................... . 95
18. Channeling in Argon-Implanted Diamond ........................... . 98
19. Ion Beam Mixing of the Aluminum Film-Iron Substrate Interface ............................................ . 100
3. Radiochemistry and Nuclear Chemistry
1. Charged Particle Activation Analysis of Semiconductor Materials 103
2. Charged Particle Activation Analysis for Surface Oxygen on Silicon and Aluminum ............................. "........... 105
3. Heat Treatment Behaviour of Oxygen in Silicon as Measured by Charged Particle Activation Analysis ............................ . 107
4. Effect of Carbon Precipitation on Gold Diffusion in Silicon 110
5. Separation and Purification of Carrier-Free 119Sb from 119mTe Produced by the Sn(~, xn) Reaction ....................... . 112
6. Adsorption Kinetics of Carrier-Free 119Sb(V) onto ~-Fe2 0 3 Surfaces ............................................. . 114
4. Radiation Chemistry and Radiation Biology
1. Inactivation of B. Subtilis Spores by Heavy Ions 116
2. Relative Biological Effectiveness of Nitrogen Ions on Inactivation of Cultured Mammalian Cells .......................... . 117
5. Instrumentation
1. Gamma-Ray Circular Polarimeter 119
2. Neutron Detection in In-Beam Spectroscopy ........................ . 121

Page
3. Data Processing System at RILAC 123
IV. ACCELERATOR DEVELOPMENT
1. New Gas-Feed System and Acceleration Test of
Heavy Ions with Gas Mixing ...................................... 125
2. Beam Acceleration Test at RILAC ................................ . 128
3. Performance of Light Link System for Control of
Instruments on High Voltage Terminal .............................. 131
4. Metal Ion Source ... . . ............ ..... ...... ........ . ......... . 133
5. Construction of ECR Ion Source .................................. . 136
6. Simplified Control Circuit for RILAC RF System .......... .... ...... . 137
7. Design of Compact Quadrupole Magnet ............................ . 139
8. Simple Pepper-Pot Device for Beam Diagnostics 140
9. Performance of Digital Emittance Measuring Device 141
10. Single Arm Motor-Driven Slit System ............... .... ......... .. . 144
11. Simple Low-Cost Profile Monitor ............. ................ ... . . 146
12. Beam Attenuation by Slit with V-Slots 148
13. Status of the RIKEN Separated Sector Cyclotron Project . .. . ... ....... . 149
14. Some Results Obtained from Orbit Calculations 152
15. Formulation of Beam Centering Equation in a
Separated Sector Cyclotron ..................................... . 155
16. Beam Centering and Related Problems in a Separated Sector Cyclotron ........... ...... . ............................ . 157
17. Design of Injection and Extraction Harmonic Coils for the RIKEN SSC .... 159
18. The Sector Magnet for the RIKEN SSC ............................ . 162
19. Structural Analysis of Sector Magnet by Finite Element Method 166
20. Model Test of the Trim Coil for the SSC ........................... . 169
Page
21. Design of the Trim Coils for the RIKEN SSC ........................ . 173
22. Automatic Measuring System of Magnetic Field Distribution 177
23 . Beam Transport System for the RIKEN SSC (II) Injecting Transfer Line .. . . . . . . . . . . . . . . . . . . . . . . . . . . . . . . . . . . . . . . . 179
24. Beam Extraction System for the RIKEN SSC (I) ..................... . 183
25. Model Study of Magnetic Inflection Channel for the SSC 185
26. Calculation of RF Electromagnetic Field by Finite Element Method ................. .. ... ...... ....... ...... . . . .. . 190
27. Model Study of RF Resonator for the RIKEN SSC ................... . 193
28. New Method to Vary Resonant Frequency of Resonator for SSC ........ . 196
29. Vacuum System of the sse (I) ... . .... ... ..... ...... ... ... .. .. .. . . 198
30. Vacuum System of the SSC (II) 200
31. The sse Beam Handling System 203
32. Status of Radiation Shielding for the RIKEN SSC Facility .............. . 206
33. Status of the Prototype Baby Cyclotron 209
V. RADIATION MONITORING
1. Routine Monitoring ............................................ . 212
2. Leakage-Radiation Measurement at the Underground Passage ........... . 214
3. Examination of Shielding Performance of Doors in the Linac Building . .... 216
VI. LIST OF PUBLICATIONS 218
VII. LIST OF OUTSIDE USERS AND THEIR THEMES ........................ 226
VIII. LIST OF SEMINARS 228
IX. LIST OF PERSONNEL 230
AUTHOR INDEX

I. INTRODUCTION
H. Kamitsubo
Nuclear science is one of principal subjects of the research activities at the Institute of Physical
and Chemical Research (Riken). Collaborative researches on physical, chemical, biological and
other problems using accelerators started at Riken in 1967, when the 160 cm heavy-ion cyclotron
was completed and brought into stationary operation. In the early time, most of the beam time
was devoted to the studies of nuclear physics and machine development. However shares of the
research fields other than nuclear physics. in the beam time have gradually increased and many
significant results have been obtained in these studies.
Systematic studies of heavy-ion reactions and nuclear structures of heavy nuclei are the
typical examples of works in the field of nuclear physics. Charged particle activation analysis
of carbon and oxygen impurities in the high purity semiconductors, production of radio-isotopes
for medical uses and synthesis of physiological compounds labelled with them, radio lysis studies
of inorganic and organic compounds by heavy ions and studies of radiation effects on biological
materials at different LETs are also examples of pioneering works in Japan using accelerators in
the fields of chemistry and biology. Simulation studies of materials for FBR and thermonuclear
fusion reactors by alpha-particle irradiation and those of semiconductor devices for space satellites
are the important applications of accelerators and have been promoted at the 160 cm cyclotron.
It has been recognized that energetic heavy ions play an important role to develop new areas
in various research fields and there have been increasing demands for accelerators of high quality.
In 1974 there started the construction of a heavy-ion linac (Rilac). It was completed in 1979 and
is now in test operation. Rilac is designed to be an injector for a big separated sector cyclotron
(SSC) with k = 540. The SSC project was granted in 1980 and two sector magnets will be completed
in 1982. The SSC is one of the biggest heavy-ion cyclotrons now under construction in the world.
On the other hand a 200 kV ion implanter was installed in 1975 to develop modification and
improvement of physical, chemical and mechanical properties of near-surface region of metals,
semiconductors and insulators. In addition to this machine a tandem Van de Graaf accelerator
(Tandetron) of 1 MV was also installed in 1979 for the studies of characterization of solid materials
and particle-induced X-ray spectroscopy (PIXE).
Collaborative and interdisciplinary researches by use of the cyclotron, Rilac, the ion implanter
and Tandetron are now in progress. Heavy ion reactions were extensively studied in 1981 as in
the preceding years. Search for short-lived ~-decays from high spin yrast states was newly started.
Studies of atomic collisions were pursued in 1981 using the cyclotron, Rilac and Tandetron. A
high resolution electron spectrometer and other measuring devices have been installed at the Rilac.
Collaboration with National Research Institute for Metals on the development of metals having
low swelling characteristic was continued in this period. Charged particle activation analysis was
applied to study the behavior of impurity oxygen on the surfaces of high purity silicon and
aluminum. Radiation-biological studies were continued for cultured cells. Brief descriptions of
the cyclotron, Rilac, Tandetron and the ion implanter are given in the following.
2
160 cm Cyclotron
I. Kohno
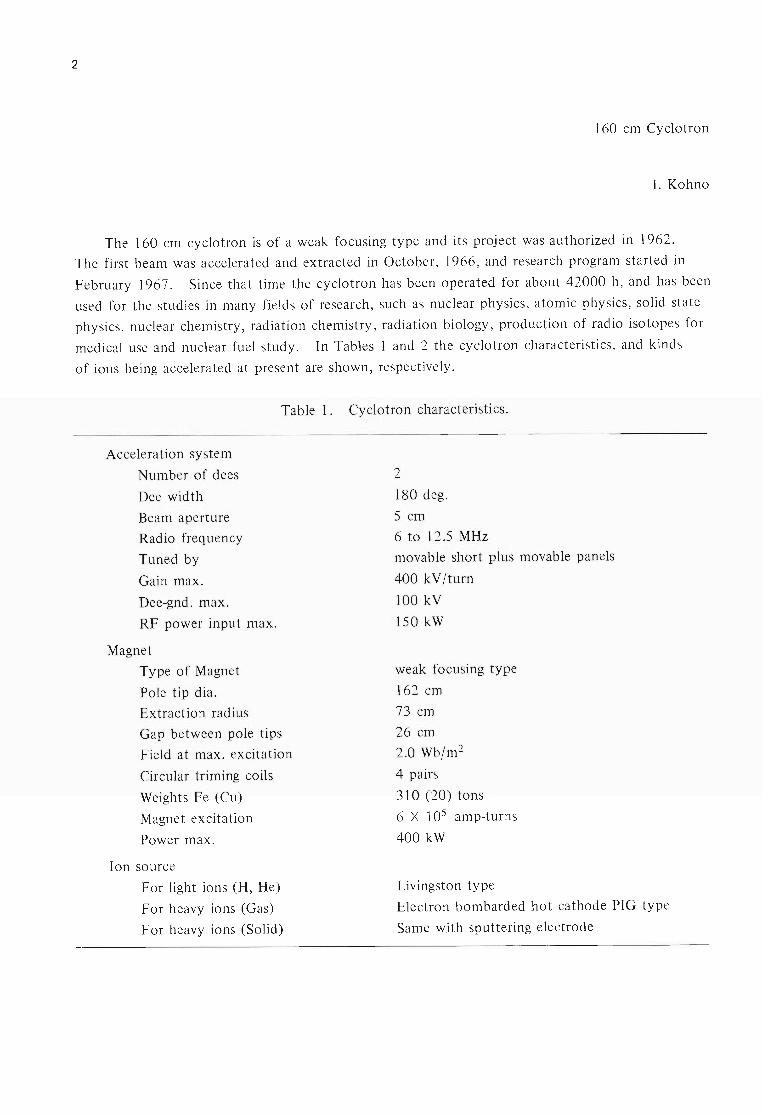
The 160 cm cyclotron is of a weak focusing type and its project was authorized in 1962.
The first beam was accelerated and extracted in October, 1966, and research program started in
February 1967. Since that time the cyclotron has been operated for about 42000 h, and has been
used for the studies in many fields of research, such as nuclear physics, atomic physics, solid state
physics , nuclear chemistry, radiation chemistry , radiation biology, production of radio isotopes for
medical use and nuclear fuel study. In Tables 1 and 2 the cyclotron characteristics , and kinds
of ions being accelerated at present are shown , respectively.
Acceleration system
Number of dees
Dee width
Beam aperture
Radio frequency
Tuned by
Gain max.
Dee-gnd. max.
RF power input max.
Magnet
Type of Magnet
Pole tip dia.
Extraction radius
Table 1.
Gap between pole tips
Field at max. excitation
Circular triming coils
Weights Fe (Cu)
Magnet excitation
Power max.
Ion source
For light ions (H, He)
For heavy ions (Gas)
For heavy ions (Solid)
Cyclotron characteristics.
2
180 deg.
5 cm
6 to 12.5 MHz
movable short plus movable panels
400 kV /turn
100 kV
150 kW
weak focusing type
162 cm
73 cm
26 cm
2.0 Wb/m2
4 pairs
310 (20) tons
6 X 10⁵ amp-turns
400 kW
Livingston type
Electron bombarded hot cathode PIG type
Same with sputtering electrode
3
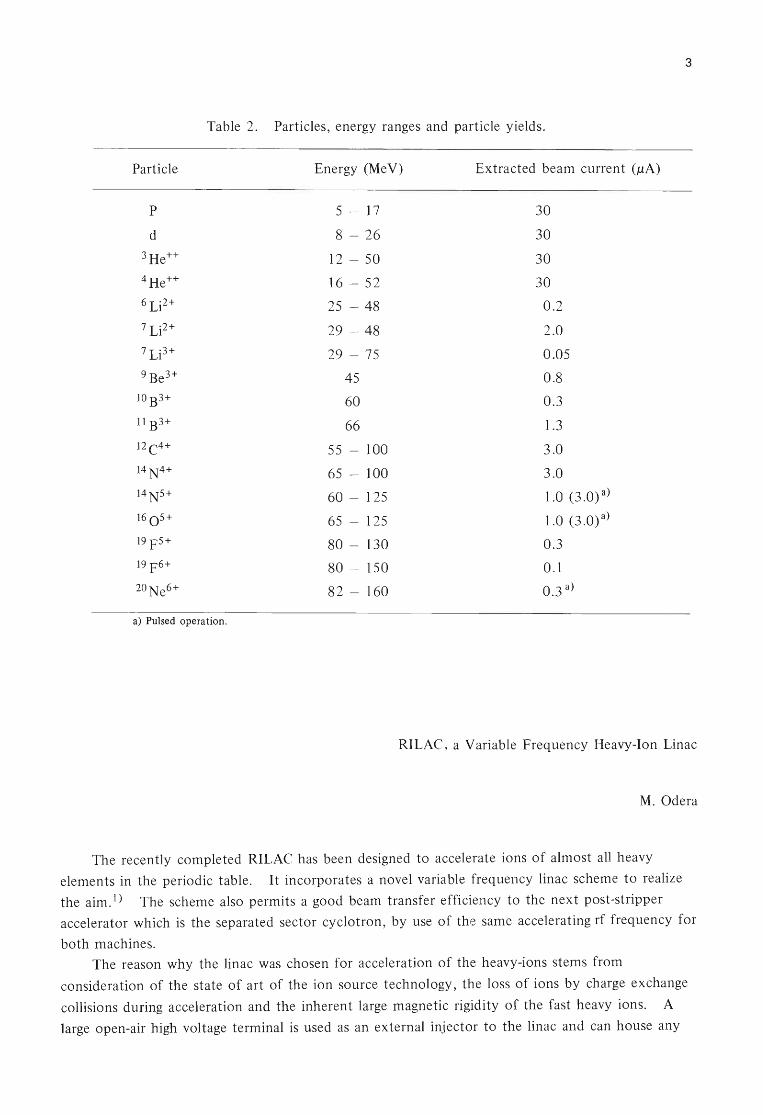
Table 2. Particles, energy ranges and particle yields.
Particle Energy (Me V) Extracted beam current (IlA)
P 5 - 17 30
d 8 - 26 30 3He++ 12 - 50 30 4He++ 16 - 52 30 6Li2+ 25 - 48 0.2 7 Li2+ 29 - 48 2.0 7Li3+ 29 - 75 0.05 9 Be3+ 45 0.8
lOB3+ 60 0.3 11 B3+ 66 1.3 12C4+ 55 100 3.0 14N4+ 65 100 3.0 14N5+ 60 - 125 1.0 (3.0)a) 16 0 5+ 65 - 125 1.0 (3.0)a) 19 F5+ 80 - 130 0.3 19 F6+ 80 - 150 0.1 2oNe6+ 82 - 160 0.3 a)
a) Pulsed operation.
RILAC, a Variable Frequency Heavy-Ion Linac
M.Odera
The recently completed RILAC has been designed to accelerate ions of almost all heavy
elements in the periodic table. It incorporates a novel variable frequency linac scheme to realize
the aim.1) The scheme also permits a good beam transfer efficiency to the next post-stripper
accelerator which is the separated sector cyclotron, by use of the same accelerating rf frequency for
both machines.
The reason why the linac was chosen for acceleration of the heavy-ions stems from
consideration of the state of art of the ion source technology, the loss of ions by charge exchange
collisions during acceleration and the inherent large magnetic rigidity of the fast heavy ions. A
large open-air high voltage terminal is used as an external injector to the linac and can house any
4
ion source of rather complicated and power consuming characteristics. 2) Short accelerating path
and the structure which allows to attain high vacuum along the path will minimize charge changing
effect by collision of accelerated particles with the residual gas. The straight line of acceleration
permits to neglect the large magnetic rigidity effect except for the focusing magnets contained in
the accelerating electrodes to counteract the inherent defocusing effect of acceleration in the linac.
We have developed the compact and high gradient quadrupole magnets to be installed in the drift
tubes (accelerating electrodes) to solve this problem. 3) In addition, the variable frequency scheme
is effective to relax the requirements for focusing strength of the quadrupole magnets by use of the
lower frequencies for the heavier projectiles.
The variable frequency scheme involves several technical difficulties which hitherto have
delayed realization of this type. The largest problems are its cavity structure, rf source and
operation by remote control, especially of the high power amplifiers in the variable frequency
mode. Firstly, we have developed a suitable structure after studies by the models and
calculations.4 ) Then, a proty-type amplifier chain was fabricated and made to work in January
1979 , though frequency range was between 17 and 35 MHz and was much lower than the final
goal of 45 MHz maximum.S) The first beam using the proto-type amplifier was obtained in that
year. Incorporating some modifications found necessary by the operation of the first amplifier,
other five amplifiers were ordered and fabricated in a factory including modification of the first
one itself. Acceleration of beams by synchronizing a few amplifiers was made in March and the
beam by the semi-automatic control of the whole six amplifiers was obtained in October 1981 at
20 MHz. In the semi-automatic control mode, starting up procedures of cavity excitation such as
crossing of the multipactoring region, search of the optimum power level and choice of the relative
phase difference between cavities are made mannually. After a suitable operating condition is
found, the stabilizing circuit of the accelerating voltage and phase is switched in and the automatic
mode operation begins. In future, most of the starting up procedures will also become automatic
either.
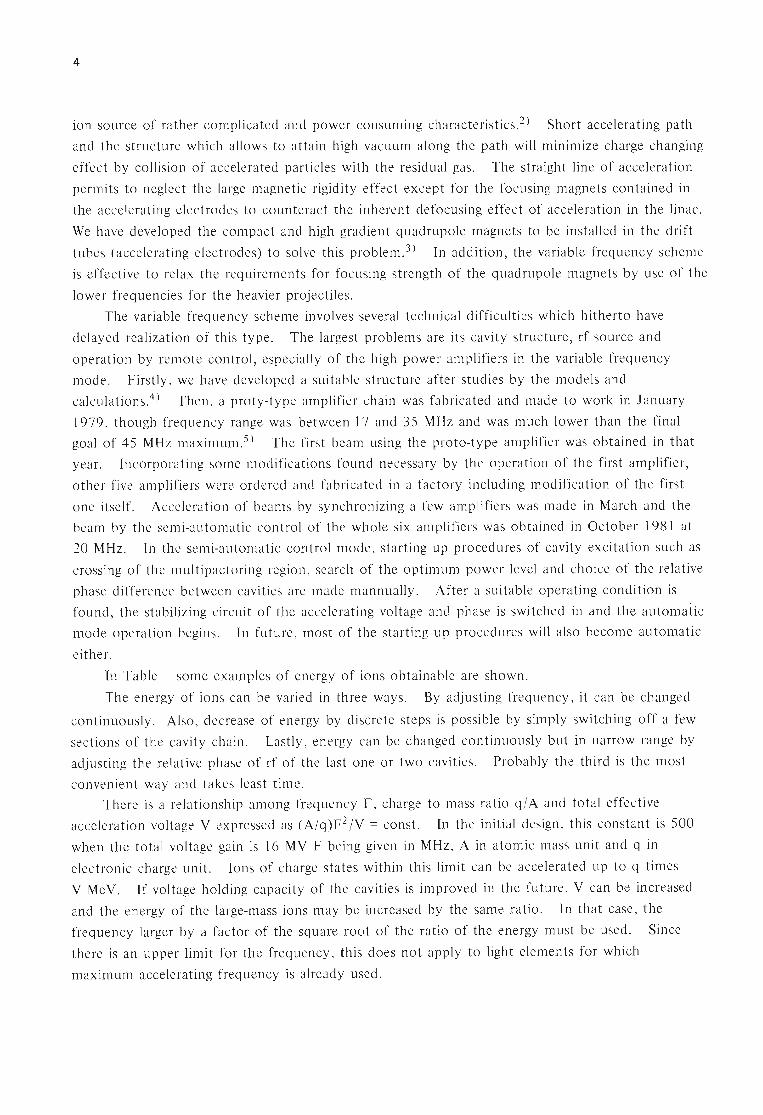
In Table 1 some examples of energy of ions obtainable are shown.
The energy of ions can be varied in three ways. By adjusting frequency, it can be changed
continuously. Also, decrease of energy by discrete steps is possible by simply switching off a few
sections of the cavity chain. Lastly, energy can be changed continuously but in narrow range by
adjusting the relative phase of rf of the last one or two cavities. Probably the third is the most
convenient way and takes least time.
There is a relationship among frequency F, charge to mass ratio q/ A and total effective
acceleration voltage V expressed as (A/q)F2 IV = const. In the initial design, this constant is 500
when the total voltage gain is 16 MV F being given in MHz, A in atomic mass unit and q in
electronic charge unit. Ions of charge states within this limit can be accelerated up to q times
V Me V. If voltage holding capacity of the cavities is improved in the future, V can be increased
and the energy of the large-mass ions may be increased by the same ratio. In that case, the
frequency larger by a factor of the square root of the ratio of the energy must be used. Since
there is an upper limit for the frequency, this does not apply to light elements for which
maximum accelerating frequency is already used.
5
Table 1. Examples of ions and their energies.
Ion Charge Maximum freq. Maximum energy
Ne- 20 4 40.3 MHz 65 MeV
Ar- 40 4 28.5 65
Ar- 40 7 37.6 114
Kr- 84 8 27.8 130
Xe-132 9 23.5 146
References
1) M.Odera: IPCR Cyclotron Progr. Rep.,.i, 24 (1970); M. Odera and T. Tonuma: Proc.6th
Intern. Cyclotron Conf., (Eds. Burgerjon and A. Strathdee), Vancouver (1972); AlP Conf.
Proc. No.9, p. 283; T. Tonuma, F. Yoshida and M. Odera: IEEE NS-23, No.2, 1031 (1976).
2) M. Hemmi and M. Odera: IPCR Cyclotron Progr. Rept.,2, III (1975); M. Odera: Proc.
1976, Proton Linear Accelerator Conf., (Ed. S. O. Schriber), Chalk River, AECL-5677, 62
(1976).
3) M. Odera and M. Hemmi: IPCR Cyc1otorn Progr. Rep. , Q, 21 (1972); Y. Miyazawa, T. Inoue,
and M. Odera: ibid.,j0 113 (1975); I. Takeshita, I. Yokoyama, and M. Odera: ibid., p. 118;
M. Hemmi and M. Odera: ibid.,.§., 155 (1974); T. Inoue and M. Odera: ibid., p. 159;
Y. Miyazawa and M. Odera: ibid., 10, 127 (1976); I. Takeshita and M. Odera: ibid., p. 129;
Y. Miyazawa, T. Inoue, M. Hemmi, Y. Chiba, F. Yoshida, and M. Odera: ibid., p. 130; I.
Takeshita and M. Odera: ibid., p. 132; I. Takeshita, I. Yokoyama, and M. Odera: ibid.,
p. 133; I. Yokoyama, I. Takeshita, and M. Odera: ibid., p. 135; I. Yokoyama: ibid., p. 138;
I. Takeshita, I. Yokoyama, T. Kambara, and M. Odera: ibid., p. 140; M. Odera: Proc.
1976 Proton Linear Accelerator Conf. (1976).
4) M.Odera: IPCR Cyclotron Progr. Rep.,~ 16 (1972); M. Odera, T. Tonuma, M. Hemmi,
and Y. Chiba: ibid., L 143 (1973); M. Odera, Y. Chiba, Y. Miyazawa, and M. Hemmi: ibid .,
~ 138 (1974); M. Odera and Y. Chiba: ibid., p.139; Y. Chiba and M. Odera: ibid., p. 142;
M. Odera: ibid., p. 144; Y. Miyazawa, M. Hemmi, and M. Odera: ibid., p. 146; M. Odera,
Y. Chiba, M. Hemmi, T. Inoue, y.. Miyazawa, T. Tonuma, and F. Yoshida: ibid., p. 148;
Y. Miyazawa and M. Odera: ibid., p. 150; Y. Miyazawa and M. Odera: ibid., p. 151; S.
Takeda: ibid., p. 157; Y. Chiba: ibid.,!Q., 144 (1976); M. Odera: Proc. 1976 Proton Linear
Accelerator Conf. (1976). 5) Y. Chiba: IPCR Cyclotron Progr. Rep., 11 141 (1979); Y. Chiba: ibid., p. 143; M. Kase,
M. Yanokura, Y. Chiba, and T. Tonuma: ibid., ~ 117 (1980); Y. Chiba: ibid., p. 120;
T. Kubo and Y. Chiba: ibid., p. 123; M. Odera, Y. Chiba, and T. Kambara: Proc. 1979
Linear Accelerator Conf., (Ed. R. L. Witkover), Montauk, BNL-51134, p. 28 (1979).
6
Tandetron
H. Sakairi
Tandetron is , as her name suggests, a tandem type ion accelerator, a commercial product
of General Ionex Corporation (Glx) in U.S.A. The first machine was supplied to the Hewlett
Packard , California, in 1979 and the second machine was introduced into Riken in Feb. 1980
and licenced to be operated by the Science and Technology Agency in Feb. 1981. Operation for
test and scientific experiments sta rted in March.
The tandem type accelerator was preferred because the ion source is held at earth potential.
The scheme widens the range of selection of the type of ion sources, which is important in the
sense that it can responds to the increasing demand for heavy ions in the field of material science.
The Riken Tandetron is equipped with two ion sources, a duoplasmatron and a sputter
source. The former has been used mainly for helium ion production. Positive ions from
duoplasmatron are changed to negative ions by passing through a lithium vapour canal. In the
latter source, cesium ions are used as primary ions for sputtering to produce negative secondary
ions from a solid target.
High voltage for acceleration is generated by a Cockcroft-Walton type circuit. It can be
varied between 0 .35 MV and I MV. The accelerated negative ions are changed to positive ions
at the coupler of the tandem , which is a nitrogen gas canal. The ion beam is focused, after
final acceleration, by a doublet of electrostatic quadrupole and infl ected by + 15 ° or +30° with an
analyzing magnet, the ME valu e of which is 136 for the IS ° port.
Specifications of beams are
H+
He 2+
N 3+
Si 3+
Au 3+
J1A at 2.0 MeV,
0.1 J1A at 3.0 MeV,
0.5 J1A at 4.0 MeV,
5 J1A at 4.0 MeV,
J1A at 4.0 MeV.
Main experimental faciliti es are a Rutherford back scattering (RBS ) spectrometer and an ion
induced X-ray spectrometer. In the scattering chamber for RBS , a three axis goniometer was
installed to make the channeling RBS measurement possible. Scattered ions are energy analyzed
by a silicon detecter and Elcor-Northern TN-4000 MCA system. On the downstream of that
chamber, another small chamber was placed which was designed to make a quick exchange of a
sample holder easy, in the RBS , measurement without channeling effects.
High resolution X-ray spectrometer with double crystals was constructed to observe chemical
effect on outer shell electrons, in the peak structure of ion induced X-ray spectra. Crystals used
are EDDT, RAP, LSD, Ge, and ADP , and the detecter is a proportional counter of gas flow type.
The energy range of measurement covers 0.18 to 3 keV , and the resolving power is, for example,
0.8 and 2.5 eY for Al KO' and S KO' respectively , which is almost equal to the energy band width .
Current subjects of research are depth profiling of implanted ions in solid materials by RBS
spectroscopy (performed by Friction and Lubrication Lab. , Deformation Processing Lab. ,
Semiconductors Lab., Inorganic Chemistry Lab., and Beam Analysis Center), identification of lattice
7
location of implanted ions in crystalline solids by channeling RBS spectroscopy (by Metal Physics
Lab. and Beam Analysis Center) and study of chemical effect of outer shell electrons in chemical
compounds by ion induced X-ray spectroscopy (by Solid-state Chemistry Lab .).
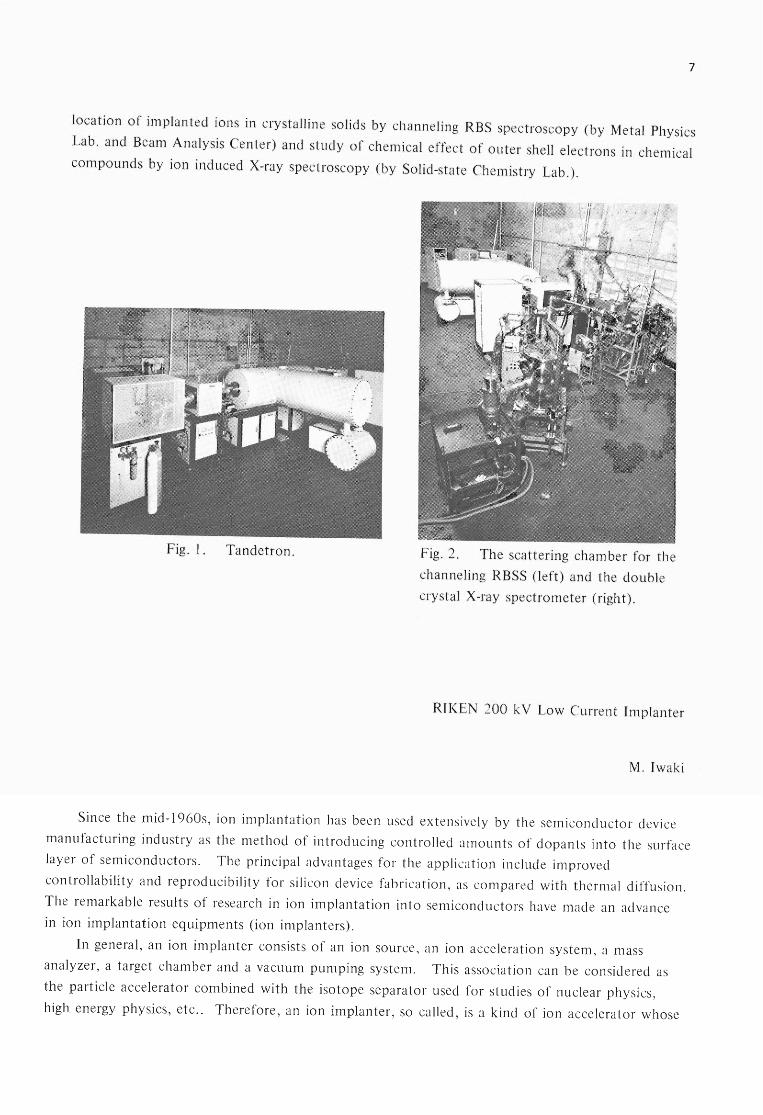
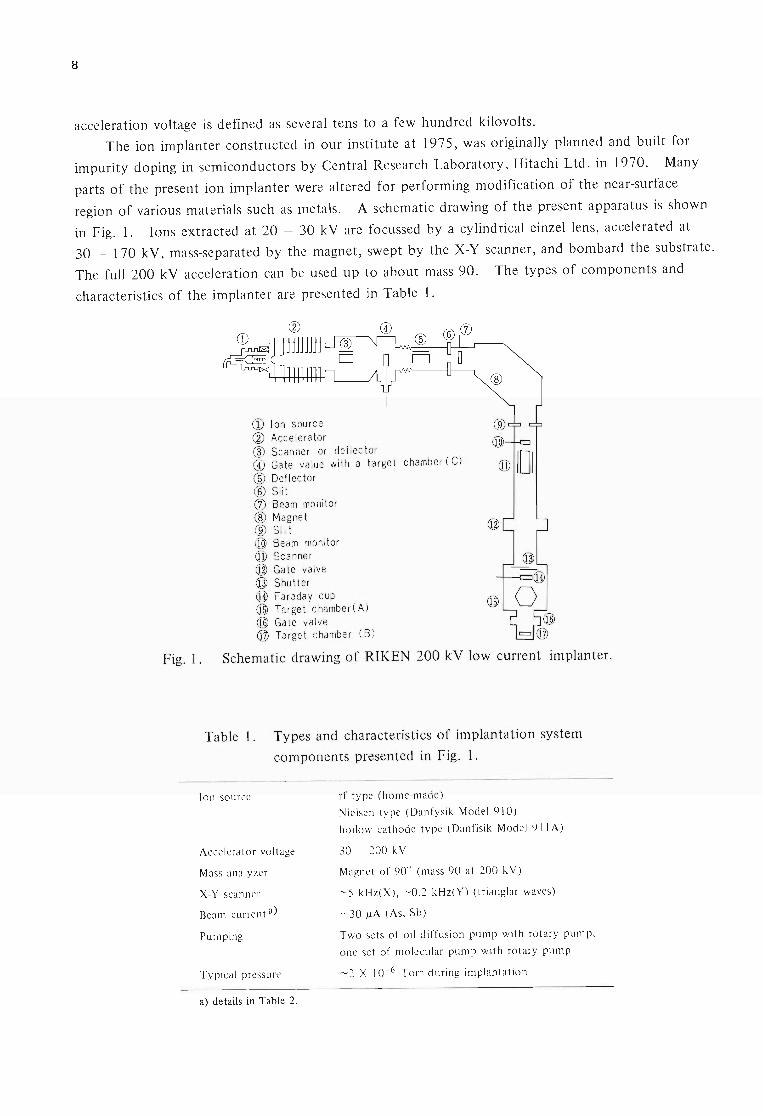
Fig. 1. Tandetron. Fig. 2. The scattering chamber for the
channeling RBSS (left) and the double
crystal X-ray spectrometer (right).
RIKEN 200 kY Low Current Implanter
M. Iwaki
Since the mid-1960s, ion implantation has been used extensively by the semiconductor device
manufacturing industry as the method of introducing controlled amounts of dopants into the surface
layer of semiconductors. The principal advantages for the application include improved
controllability and reproducibility for silicon device fabrication, as compared with thermal diffusion .
The remarkable results of research in ion implantation into semiconductors have made an advance
in ion implantation equipments (ion implanters).
In general, an ion implanter consists of an ion source, an ion acceleration system, a mass
analyzer, a target chamber and a vacuum pumping system. This association can be considered as
the particle accelerator combined with the isotope separator used for studies of nuclear physics,
high energy physics, etc.. Therefore , an ion implanter, so called, is a kind of ion accelerator whose
8
acceleration voltage is defined as several tens to a few hundred kilovolts.
The ion implanter constructed in our institute at 1975 , was originally planned and built for
impurity doping in semiconductors by Central Research Laboratory, Hitachi Ltd. in 1970. Many
parts of the present ion implanter were altered for performing modification of the near-surface
region of various materials such as metals. A schematic drawing of the present apparatus is shown
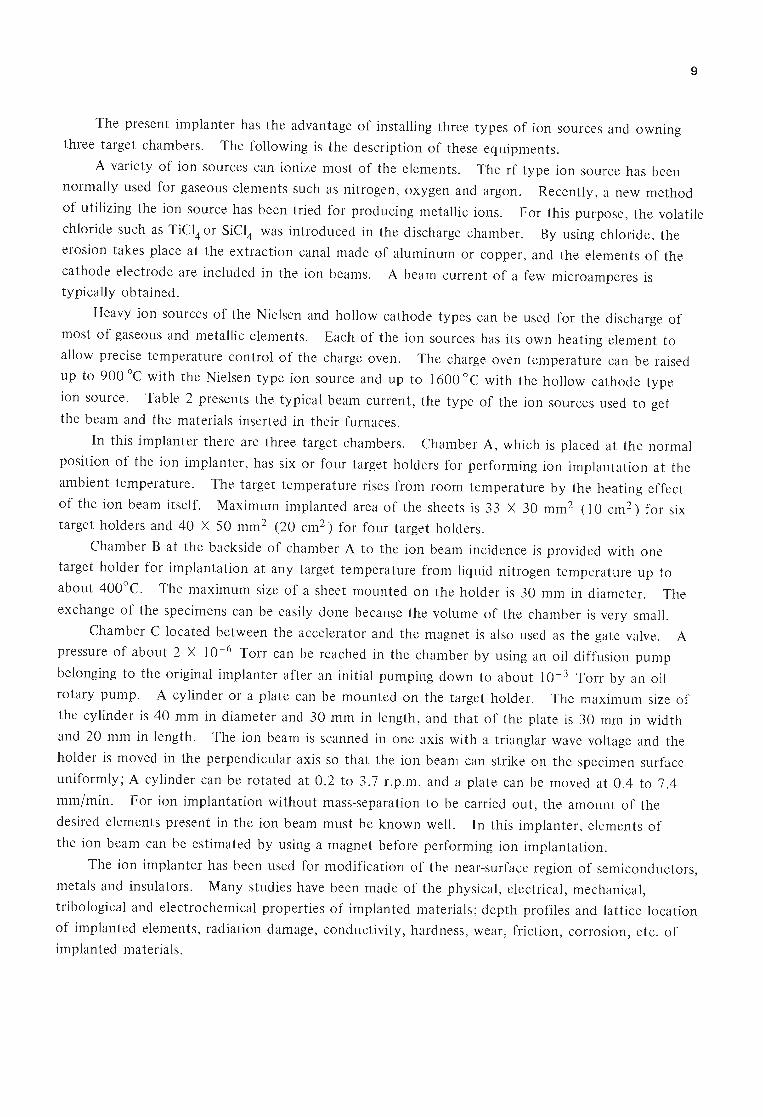
in Fig. 1. Ions extracted at 20 - 30 kV are focussed by a cylindrical einzel lens, accelerated at
30 - 170 kV, mass-separated by the magnet, swept by the X-Y scanner, and bombard the substrate.
The full 200 kV acceleration can be used up to about mass 90. The types of components and
characteristics of the implanter are presented in Table 1.
CD I on source @ Acce lera tor ® Scanner or def lector @ Gate val ue with a target chambe r ( C) ® Deflector ® Slit (j) Bea m mo ni tor ® Magnet ® Slit @ @ Beam monitor @ Scanner @ @ Gate valve @ Shutter @ @ Faraday cup 0 @ Target chambe r ( A) @ @ Gate valve @ @ Target chamber ( B) = @
Fig. 1. Schematic drawing of RIKEN 200 kV low current implanter.
Table 1. Types and characteristics of implantation system
components presented in Fig. 1.
Io n source
Accelera tor va I tage
Mass analy zer
X-Y scanner
Beam current a)
Pumping
Typical pressure
a) details in Table 2.
rf type (home-made)
Nie lsen type (Danfysik Model 910)
hollow ca thod e type (Dan fisik Mod el 9 1 I A)
30 - 200 kV
Magne t of 90° (mass 90 at 200 kV )
~5 kH z(X), ~0 .2 kHz(Y) (trianglar waves)
~30 IlA (As, Sb)
Two se ts of oil diffusion pump with rotary pump ,
one se t of molecular pump with rotary pump
~2 X 10 - 6 Torr during implantation
The present implanter has the advantage of installing three types of ion sources and owning
three target chambers. The following is the description of these equipments.
9
A variety of ion sources can ionize most of the elements. The rf type ion source has been
normally used for gaseous elements such as nitrogen, oxygen and argon. Recently, a new method
of utilizing the ion source has been tried for producing metallic ions. For this purpose, the volatile
chloride such as TiCl4 or SiCl4 was introduced in the discharge chamber. By using chloride, the
erosion takes place at the extraction canal made of aluminum or copper, and the elements of the
cathode electrode are included in the ion beams. A beam current of a few microamperes is
typically obtained.
Heavy ion sources of the Nielsen and hollow cathode types can be used for the discharge of
most of gaseous and metallic elements. Each of the ion sources has its own heating element to
allow precise temperature control of the charge oven. The charge oven temperature can be raised
up to 900°C with the Nielsen type ion source and up to 1600 ° C with the hollow cathode type
ion source. Table 2 presents the typical beam current , the type of the ion sources used to get
the beam and the materials inserted in their furnaces.
In this implanter there are three target chambers. Chamber A, which is placed at the normal
position of the ion implanter, has six or four target holders for performing ion implantation at the
ambient temperature. The target temperature rises from room temperature by the heating effect
of the ion beam itself. Maximum implanted area of the sheets is 33 X 30 mm2 (10 cm2 ) for six
target holders and 40 X 50 mm2 (20 cm2 ) for four target holders.
Chamber B at the backside of chamber A to the ion beam incidence is provided with one
target holder for implantation at any target temperature from liquid nitrogen temperature up to
about 400°C. The maximum size of a sheet mounted on the holder is 30 mm in diameter. The
exchange of the specimens can be easily done because the volume of the chamber is very small.
Chamber C located between the accelerator and the magnet is also used as the gate valve. A
pressure of about 2 X 10- 6 Torr can be reached in the chamber by using an oil diffusion pump
belonging to the original implanter after an initial pumping down to about 10- 3 Torr by an oil
rotary pump. A cylinder or a plate can be mounted on the target holder. The maximum size of
the cylinder is 40 mm in diameter and 30 mm in length , and that of the plate is 30 mm in width
and 20 mm in length. The ion beam is scanned in one axis with a trianglar wave voltage and the
holder is moved in the perpendicular axis so that the ion beam can strike on the specimen surface
uniformly; A cylinder can be rotated at 0.2 to 3.7 r.p.m. and a plate can be moved at 0.4 to 7.4
mm/min. For ion implantation without mass-separation to be carried out, the amount of the
desired elements present in the ion beam must be known well. In this implanter, elements of
the ion beam can be estimated by using a magnet before performing ion implantation.
The ion implanter has been used for modification of the near-surface region of semiconductors,
metals and insulators. Many studies have been made of the physical, electrical, mechanical,
tribological and electrochemical properties of implanted materials; depth profiles and lattice location
of implanted elements, radiation damage, conductivity, hardness, wear, friction, corrosion, etc. of
implanted materials.
10
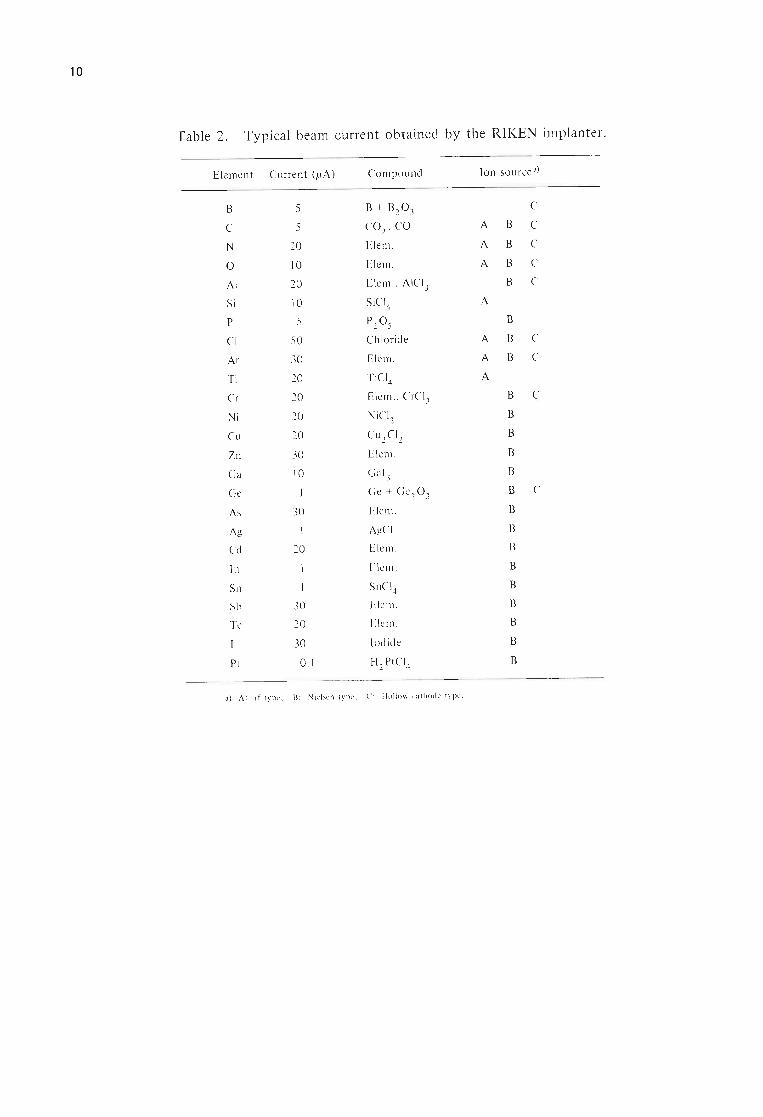
Table 2. Typical beam current obtained by the RIKEN implanter.
Element Current (/lA) Compound Ion source a)
B 5 B + B2 0 3 C
C 5 CO2 , CO A B C
N 20 Elem . A B C
° 10 Elem . A B C
AI 20 Elem. , AICI 3 B C
Si 10 SiCI4 A
P 5 P2 Os B
CI 50 Chloride A B C
Ar 30 Elem. A B C
Ti 20 TiCI4 A
Cr 20 Elem ., CrCI 3 B C
Ni 20 NiCI2 B
Cu 20 CU 2 CI 2 B
Zn 30 Elem. B
Ga 10 Gal 3 B
Ge Ge + Ge Z0 3 B C
As 30 Elem. B
Ag AgCI B
Cd 20 Elem. B
In Elem. B
Sn I SnCI 4 B
Sb 30 Elem. B
Te 20 Elem. B
30 Iodid e B
Pt 0.1 H2 PtCI4 B
a) A: rf ty pe, 13 : Nie lsen type, C: Hollo", cath od e ty pe.
11
II . OPERATION OF ACCELERATORS
1. Machine Operation
T. Kageyama, S. Fujita, K. Ikegami, S. Kohara,
K. Ogiwara, H. Takebe, and I. Kohno
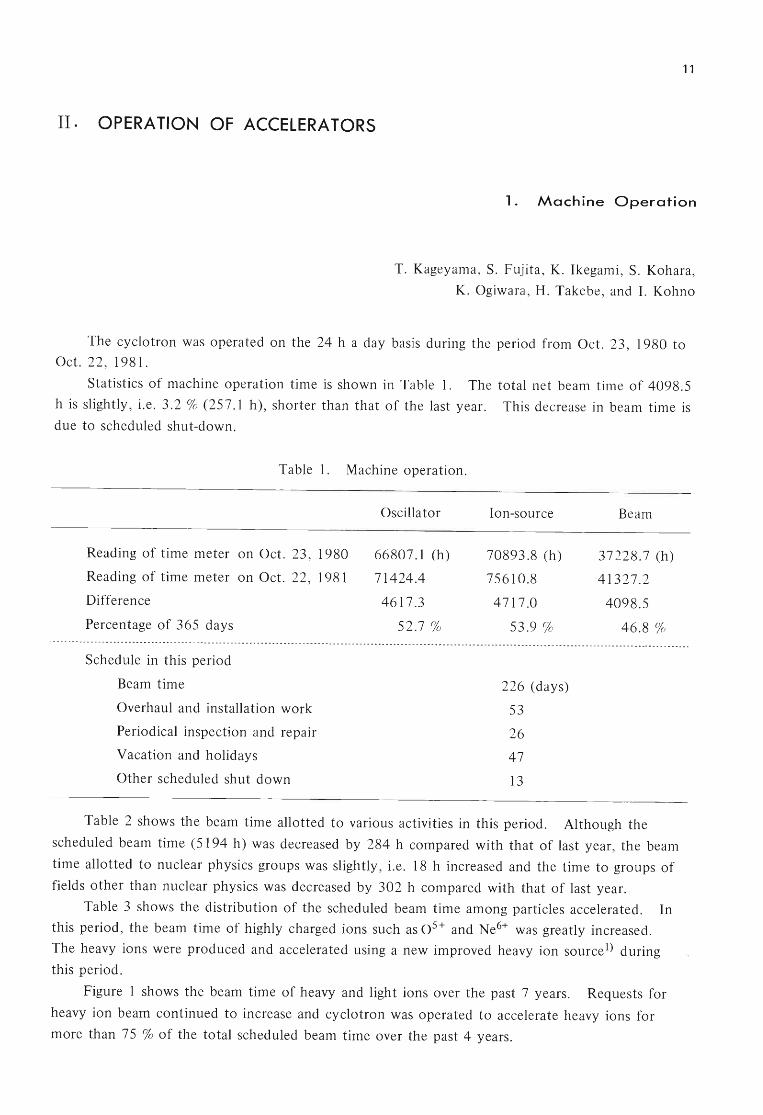
The cyclotron was operated on the 24 h a day basis during the period from Oct. 23, 1980 to
Oct. 22, 1981.
Statistics of machine operation time is shown in Table 1. The total net beam time of 4098.5
h is slightly , i.e. 3.2 % (257.1 h), shorter than that of the last year. This decrease in beam time is
due to scheduled shut-down.
Table 1. Machine operation.
Reading of time meter on Oct. 23, 1980
Reading of time meter on Oct. 22, 1981
Difference
Percentage of 365 days
Schedule in this period
Beam time
Overhaul and installation work
Periodical inspection and repair
Vacation and holidays
Other scheduled shut down
Oscillator
66807.1 (h)
71424.4
4617.3
52.7 %
Ion-source
70893.8 (h)
75610.8
4717.0
53.9 %
226 (days)
53
26
47
13
Beam
37228.7 (h)
41327.2
4098.5
46.8 %
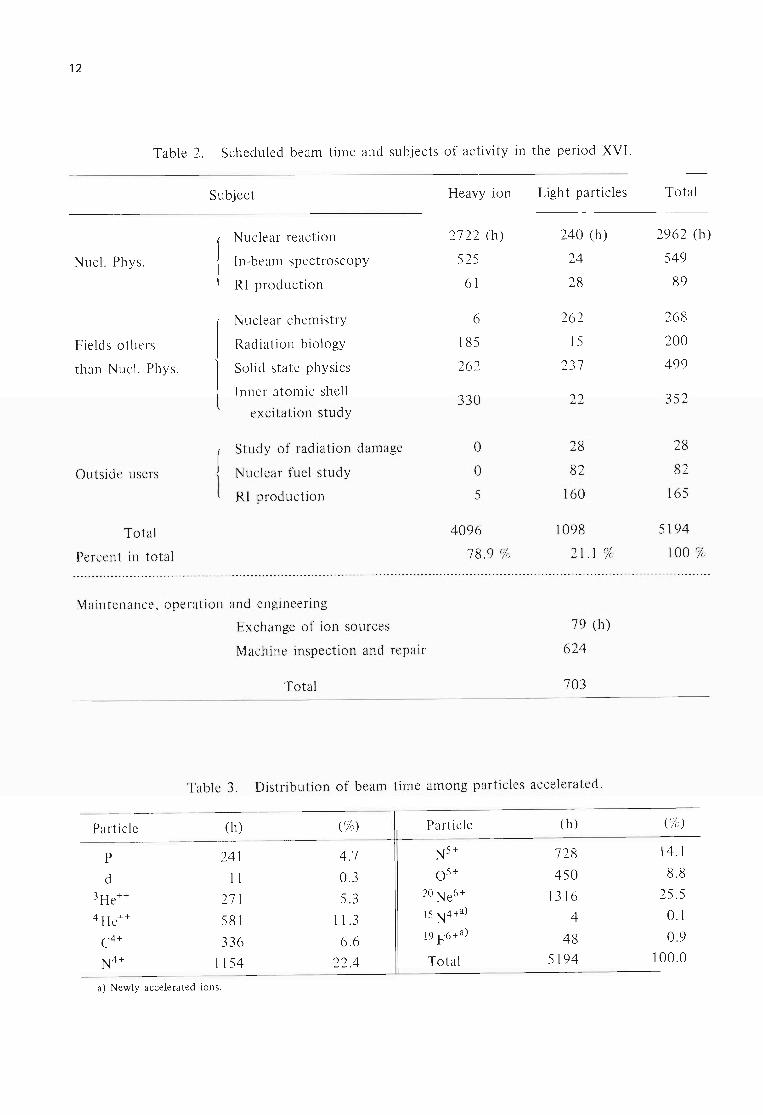
Table 2 shows the beam time allotted to various activities in this period. Although the
scheduled beam time (5194 h) was decreased by 284 h compared with that of last year, the beam
time allotted to nuclear physics groups was slightly , i.e. 18 h increased and the time to groups of
fields other than nuclear physics was decreased by 302 h compared with that of last year.
Table 3 shows the distribution of the scheduled beam time among particles accelerated. In
this period, the beam time of highly charged ions such as 0 5+ and Ne6+ was greatly increased.
The heavy ions were produced and accelerated using a new improved heavy ion source 1) during
this period.
Figure 1 shows the beam time of heavy and light ions over the past 7 years. Requests for
heavy ion beam continued to increase and cyclotron was operated to accelerate heavy ions for
more than 75 % of the total scheduled beam time over the past 4 years.
12
Table 2. Scheduled beam time and subjects of activity in the period XVI.
Subject Heavy ion Ligh t particles Total
1
Nuclear reaction 2722 (h) 240 (h) 2962 (h)
Nucl. Phys. In-beam spectroscopy 525 24 549
RI production 61 28 89
Nuclear chemistry 6 262 268
Fields others Radiation biology 185 15 200
than Nucl. Phys. Solid state physics 262 237 499
Inner atomic shell 330 22 352
excitation study
{ Study of radiation damage 0 28 28
Outside users Nuclear fuel study 0 82 82
RI production 5 160 165
Total 4096 1098 5194
Percent in total 78.9 % 21.1% 100 % ---------------- ---------- ------- - ---- -- - - --------------------- ----- --.----------- -- ---------------- ----------------------- -- - ----- ------------- ---- - ---------
Maintenance , operation and engineering
Exchange of ion sources
Machine inspection and repair
Total
79 (h)
624
703
Table 3. Distribution of beam time among particles accelerated.
--~---
Particle (h) (%) Particle (h)
P 241 4.7 N5+ 728
d 1 1 0.3 0 5+ 450 3He++ 271 5.3 20 Ne6+ 1316 4He++ 581 11.3 15 N4+a) 4
C4+ 336 6.6 19 F6+a) 48 N4+ 1154 22.4 Total 5194
a) Newly accelerated ions.
(%)
14.1 8.8
25.5 0.1 0.9
100.0

Reference
o
---..- Heavy ion ~ Light particles -><:- Total
1974 '75 '76 '77 '78 '79 '80 '81
Calendar year Fig. 1. The cyclotron beam time history.
1) T. Kageyama, K. Ikegami , and I. Kohno: IPCR Cyclotron Progr. Rep. ~ 4 (1980).
13
14
II -2. Operation of Heavy Ion linear Accelerator
M. Odera
After achieving the test beam acceleration in 1980, effort has been paid to set up and tune the
RF control system which is assisted by a computer for synchronized operation of the whole six
amplifiers coupled with cavities. In the course of a running test of the individual cavity excitation,
a serious vacuum leak and damage was generated in the driving mechanism of the shorting plate of
the fourth cavity. Before completion of repair of those defects , acceleration of the singly charged
nitrogen ions was tried in March 1981. The results are given in another paper in this Progress
Report. I) Energy resolution was 1.7 (fc) at the exit of the third cavity without use of the chopper
or the buncher.
In that operation some defects were found in the power supplies for the amplifiers and other
small components of the accelerator such as the beam probe containers or cavity signal pick-ups.
Also distribution of the probes for beam diagnosis along the beam line was found desirable to be
modified. After improving those parts, acceleration through all the cavities was realized in
October.
A pulse excitation method varying the width and repetition rate by a large factor during the
starting-up period of the cavity excitation was found to be a convenient means to search resonance
of the resonator to the given frequency and to overcome the multipactoring phenomenon.
Hitherto, the method of cw excitation at a slightly detuned frequency has been used to cross the
multipactoring region. The pulse excitation is also effective for degassing of the cavities at the
relatively good vacuum.
In order to get quickly information of the characteristics of the beam being injected, a simple
pepper-pot device was fabricated and tested. In combination with a profile monitor, it gives a
rough estimation of the emittance of the beam in not complete but intuitive way. It is convenient
to indicate to the operator the effect of his adjustment of the parameters of the injection beam
line on the beam. A computer program for orbit analysis gives the beam trajectories expected by
injection of the beam for assumed parameters of the magnetic lens system in the accelerator on
the CRT at the operator console. Also another emittance device which sends digitized signals to
allow direct presentation of the emittance figure on the CRT is equipped in the injection line to
give a complete information of the beam if necessary. Automatic range switching multichannel
current monitors were designed and installed in the control room. The monitors send analog
signals of beam current on the slit blades or beam stoppers to the control console. Maximum
sensitivity is 10- 10 A. For the profile monitors which require higher sensitivity, another amplifier
systems are provided.
A beam intensity attenuator using the slits with V-slots was fabricated and installed in the
beam line downstream of the last cavity. It enables us to attenuate the beam current by a factor
of 10- 5 in combination with a quarupole magnet in front of it. It allows use of a very small
current of small diameter for some experiments.
Though the transmission efficiency of the beam through the accelerator is to be improved
15
further, and the beam buncher and chopper are not working yet, use of the beam was started from
November. For a while, only the elements in gaseous state will be accelerated.
In the test bench, PIG ion source equipped with a sputtering electrode is producing ions of
solid elements. However, some improvements in the intensity of highly charged ions are still
desirable. The first stage of the ECR ion source was completed in early summer and gave singly
and doubly-charged ions of Argon in summer. In that test an uneven spatial distribution of plasma
density was found in the ionizing chamber, and the extracted current was smaller than expected.
It was disassembled to find the origin and a suitable solution for the insufficient performance.
There occurred two troubles in the injector high voltage power supply. One is a damage in
the high frequency transformer of the 50 kHz generator which supplies power to the Cock croft
Walton voltage multiplier. Another is the damage of one of the rectifier stacks.
Reference
1) T. Kubo, T. Kambara, Y. Miyazawa, M. Hemmi, Y. Gono, T. Inoue, T. Tonuma, M. Kase ,
M. Yanokura, Y. Chiba, T. Fujisawa, and M. Odera: p. 128 in this report.
16
II -3. T ANDETRON-Operation
H. Sakairi, E. Yagi, A. Koyama, T. Urai, and Y. Yamada
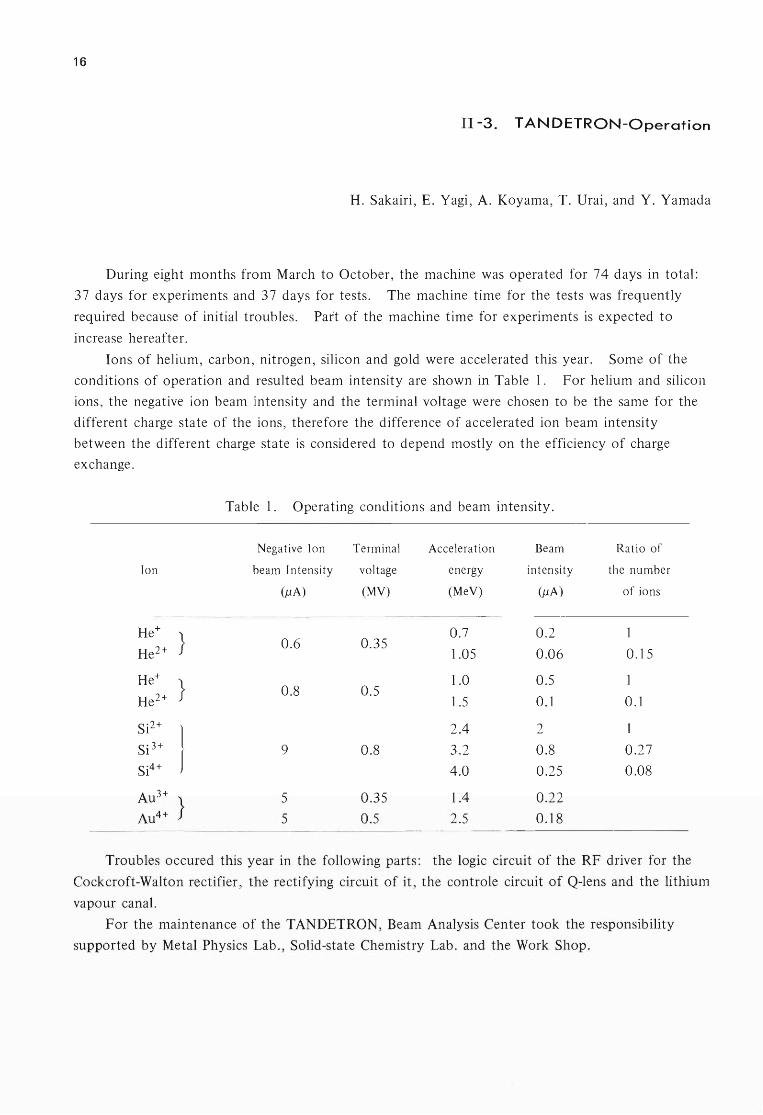
During eight months from March to October, the machine was operated for 74 days in total:
37 days for experiments and 37 days for tests. The machine time for the tests was frequently
required because of initial troubles. Part of the machine time for experiments is expected to
increase hereafter.
Ions of helium, carbon, nitrogen, silicon and gold were accelerated this year. Some of the
conditions of operation and resulted beam intensity are shown in Table 1. For helium and silicon
ions, the negative ion beam intensity and the terminal voltage were chosen to be the same for the
different charge state of the ions , therefore the difference of accelerated ion beam intensity
between the different charge state is considered to depend mostly on the efficiency of charge
exchange.
Ion
He+ } He2+
He+ }
He2+
Si2+
} Si 3+
Si4+
Au3+ } Au4+
Table 1. Operating conditions and beam intensity.
Negative Ion Terminal Acceleration Beam
beam Intensity voltage energy intensity
(IlA) (MV) (MeV) (PA)
0.7 0.2 0.6 0.35
1.05 0.06
1.0 0.5 0.8 0.5
1.5 0.1
2.4 2
9 0.8 3.2 0.8
4.0 0.25
5 0.35 1.4 0.22
5 0.5 2.5 0.18
Ratio of
the number
of ions
0.15
1
0.1
0.27
0.08
Troubles occured this year in the following parts: the logic circuit of the RF driver for the
Cockcroft-Walton rectifier, the rectifying circuit of it, the controle circuit of Q-1ens and the lithium
vapour canal.
For the maintenance of the TANDETRON, Beam Analysis Center took the responsibility
supported by Metal Physics Lab., Solid-state Chemistry Lab. and the Work Shop.
III. RESEARCH ACTIVITIES
1. Nuclear Physics
17
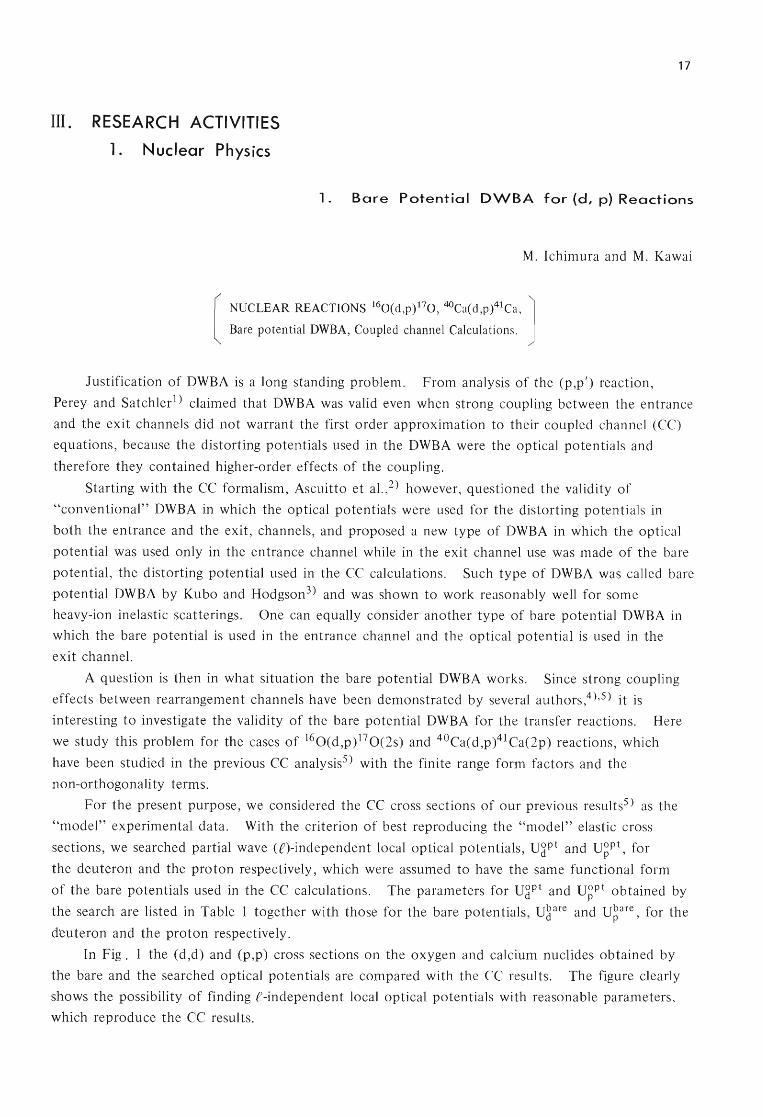
1. Bare Potential DWBA for (d, p) Reactions
M. Ichimura and M. Kawai
[
NUCLEAR REACTIONS 160(d,p)170 , 4OCa(d ,p)41 Ca, J Bare potential DWBA, Coupled channel Calculations.
Justification of DWBA is a long standing problem. From analysis of the (p ,p') reaction ,
Perey and Satchlerl) claimed that DWBA was valid even when strong coupling between the entrance
and the exit channels did not warrant the first order approximation to their coupled channel (CC)
equations, because the distorting potentials used in the DWBA were the optical potentials and
therefore they contained higher-order effects of the coupling.
Starting with the CC formalism , Ascuitto et al.,2) however, questioned the validity of
"conventional" DWBA in which the optical potentials were used for the distorting potentials in
both the entrance and the exit , channels , and proposed a new type of DWBA in which the optical
potential was used only in the entrance channel while in the exit channel use was made of the bare
potential, the distorting potential used in the CC calculations. Such type of DWBA was called bare
potential DWBA by Kubo and Hodgson3) and was shown to work reasonably well for some
heavy-ion inelastic scatterings. One can equally consider another type of bare potential DWBA in
which the bare potential is used in the entrance channel and the optical potential is used in the
exit channel.
A question is then in what situation the bare potential DWBA works. Since strong coupling
effects between rearrangement channels have been demonstrated by several authors,4 ) ,5) it is
interesting to investigate the validity of the bare potential DWBA for the transfer reactions. Here
we study this problem for the cases of 160(d,p)170(2s) and 4oCa(d,p)41Ca(2p) reactions, which
have been studied in the previous CC analysis5) with the finite range form factors and the
non-orthogonality terms.
For the present purpose, we considered the CC cross sections of our previous results5 ) as the
"model" experimental data. With the criterion of best reproducing the "model" elastic cross
sections, we searched partial wave (e)-independent local optical potentials, u ctpt and u~Pt , for
the deuteron and the proton respectively , which were assumed to have the same functional form
of the bare potentials used in the CC calculations. The parameters for u ctpt and u~Pt obtained by
the search are listed in Table I together with those for the bare potentials , u~are and u~are , for the
d'Emteron and the proton respectively.
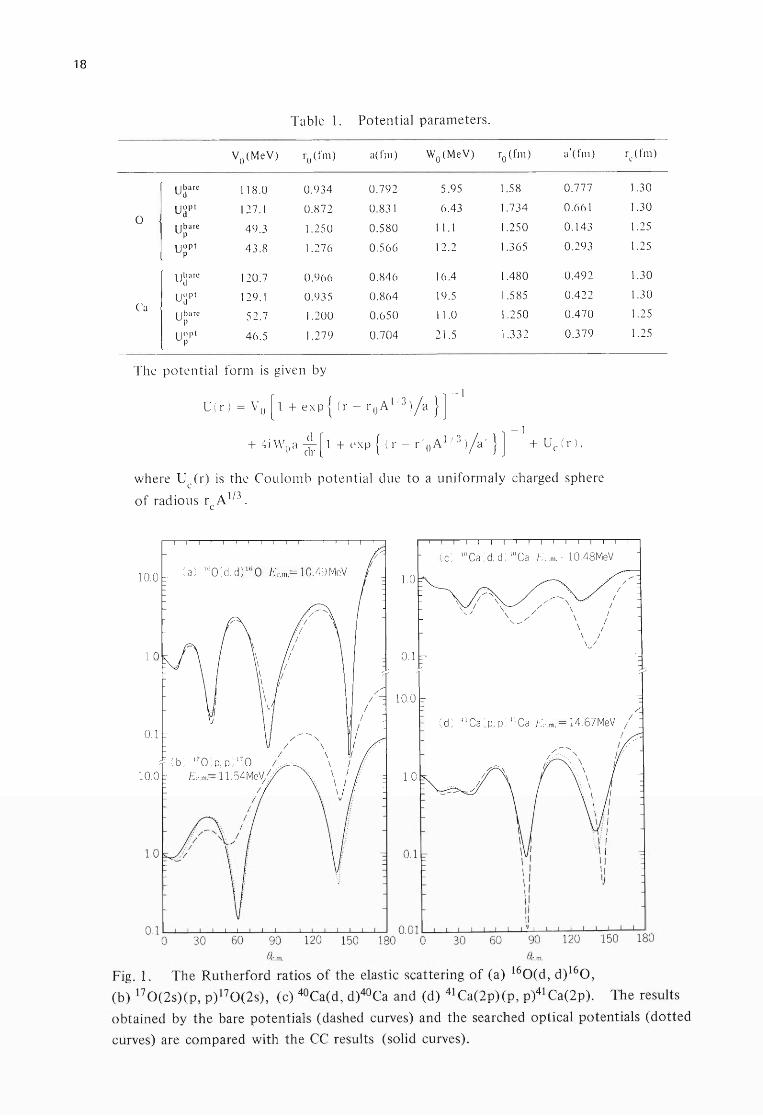
In Fig . 1 the (d,d) and (p,p) cross sections on the oxygen and calcium nuclides obtained by
the bare and the searched optical potentials are compared with the CC results. The figure clearly
shows the possibility of finding f-independent local optical potentials with reasonable parameters,
which reproduce the CC results.
18
Table 1. Potential parameters.
Vo(M eV) ro (I'm) a(fm) Wo(MeV) ro (fm) a'(fm)
ubare d 118 .0 0.934 0.79 2 5.95 1.58 0.777
o uct
pt 127.1 0.87 2 0.831 6.43 1.734 0 .661
ubare 49.3 1.2 50 0.580 11.1 1.250 0.143 p
uopt p 43.8 1.276 0.566 12.2 1.365 0.293
Uh ;lfc d 120.7 0.966 0.846 16.4 1.480 0.492
uo pt d 129.1 0.935 0.864 19.5 1.585 0.422
ubare 52.7 1.200 0.650 1 1.0 1. 250 0.470 p
uopt p 46 .5 1.279 0.704 21.5 1.332 0 .379
The potential form is given by
where Ue(r) is the Coulomb potential due to a uniformaly charged sphere
of radious r A 1/3 . e
10. 0
1.0 / /
/
/
~,
.; / " / /
rc (fm)
1.30
1.30
1. 25
1.25
1.30
1.30
1.25
1.25
/
0.1 (d) .IICa (p, p) 4l Ca J·;c.m. = 14.67 MeV /
10.0
1.0
/~~ I / /
- - j ( b ) Ii 0 ( p, p ) 11 0 j . ....
j .. Ec.m.= 11. 54Me\j .
/ /
./
30 60
/
j
/ /
90 l1c. m.
O. 0 1 L-..l.---L---L.-....L...-.L.-L--L----L.:--l....-..L.-J----'----'---'--....L....-~--' 120 150 180 0 30 60 90 120 150 180
Fig. 1. The Rutherford ratios of the elastic scattering of (a) 160(d, d)160,
(b) l70(2s)(p, p) 170(2s), (c) 4oCa(d, d)4oCa and (d) 41Ca(2p)(p, p)41 Ca(2p). The results
obtained by the bare potentials (dashed curves) and the searched optical potentials (dotted
curves) are compared with the CC results (solid curves).
19
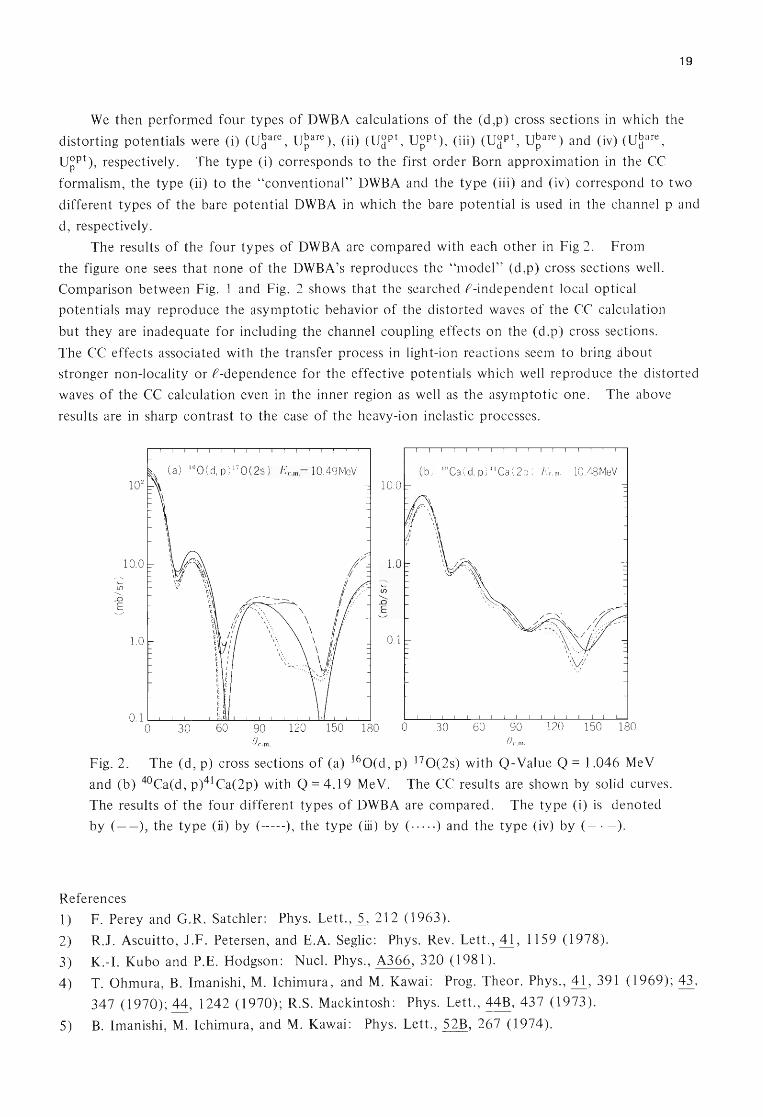
We then performed four types of DWBA calculations of the (d,p) cross sections in which the
distorting potentials were (i) (u~are , u~ a re) , (ii) (UdPt, u~Pt), (iii) (UdPt, u~are) and (iv) (u~are ,
u~Pt), respectively. The type (i) corresponds to the first order Born approximation in the CC
formalism, the type (ii) to the "conventional" DWBA and the type (iii) and (iv) correspond to two
different types of the bare potential DWBA in which the bare potential is used in the channel p and
d, respectively.
The results of the four types of DWBA are compared with each other in Fig 2. From
the figure one sees that none of the DWBA's reproduces the "model" (d ,p) cross sections well.
Comparison between Fig. 1 and Fig. 2 shows that the searched e -independent local optical
potentials may reproduce the asymptotic behavior of the distorted waves of the CC calculation
but they are inadequate for including the channel coupling effects on the (d,p) cross sections.
The CC effects associated with the transfer process in light-ion reactions seem to bring about
stronger non-locality or f-dependence for the effective potentials which well reproduce the distorted
waves of the CC calculation even in the inner region as well as the asymptotic one. The above
results are in sharp contrast to the case of the heavy-ion inelastic processes.
160 ( d, p ) 170 ( 2s ) J·.'c.m.= 1O.49MeV 10.0
, , , \ \ \ \ \
10. 0 '. (/\.'\ 1. 0 \(1 "~
<fl \) 'is <fl '-- ';S
Ll '--E ~~ Ll
t E
\\ 1. 0 f ' 0.1 t
~
O. 1 L-L.---L.-.....L.-.I...-..l~L...l..-.J..--1--L...---L-..J..-.J'---1J.L---L-J.-l......J o 30 60 90 120 150 180 0 30 60 180
8c.m .
Fig. 2. The (d, p) cross sections of (a) 160(d, p) 170(2s) with Q-Value Q = 1.046 MeV
and (b) 4oCa(d, p)41 Ca(2p) with Q = 4.19 MeV. The CC results are shown by solid curves.
The results of the four different types of DWBA are compared. The type (i) is denoted
by (--), the type (ii) by (-----), the type (iii) by ( ..... ) and the type (iv) by (_ . - ).
References
1) F. Perey and G.R. Satchler: Phys. Lett. , i, 212 (1963).
2) R.J. Ascuitto, J.F. Petersen, and E.A. Seglic: Phys. Rev. Lett., 41,1159 (1978).
3) K.-I. Kubo and P.E. Hodgson: Nucl. Phys., A366 , 320 (1981).
4) T. Ohmura, B. Imanishi, M. Ichimura, and M. Kawai: Prog. Theor. Phys., il, 391 (1969); 43,
347 (1970); 44,1242 (1970); R.S. Mackintosh: Phys. Lett. , 44B, 437 (1973).
5) B. Imanishi, M. Ichimura, and M. Kawai: Phys. Lett., 52B, 267 (1974).
20
III -1-2. Mass Diffusion Coefficients In the Adiabatic Approximation
S. Yamaji, A. Iwamoto,* K. Harada,* and S. Yoshida
r NUCLEAR REACTIONS Microscopic calculation of mass diffusion coefficients,]
llinear response theory, two-center shell model.
During the past several years, relaxation phenomena in deep inelastic collisions (OIC) have
been extensively studied both experimentallyl) and theoretically.2) The mass transfer in DIC is
described on the basis of a non-perturbative statistical treatment which leads to the Fokker-Planck
equation for the mass number of projectile-like nucleus AI' 3) - 7) The diffusion coefficient 0A in
the equation is one of the important quantities for this treatment.
Experimentally, the value of DA has been obtained by the use of the relation DA = X(8)2/
[16 In2 T· t (8)] with the interaction time estimated on the basis of classical models. 3), 4) The m
width X (8) is obtained from the experimental mass distribution at the deflection angle 8, by assuming
the distribution to be gaussian.
Theoretical calculations on D A have been performed by serveral authors3) - 6) in the sudden or
frozen density approximation. In these treatment , aside from the formation of a neck or window,
the two fragments essentially remain spherical. However , the fragments separate with the kinetic
energy less than the Coulomb energy of two touching spheres. This suggests the formation of
large deformation and the use of adiabatic basis is required for the description of the mass
fragmentation.
Therefore , in the present work, we calculate DA microscopically using the linear response
theory,7) which is formulated for an adiabatic basis. By neglecting the coupling between mass
transfer motion and other motions such as radial and deforming motions , the same type of the
Fokker-Planck equation as that in Refs. 3 and 4 is used under the condition of the overdamped
motion for the mass transfer, which has been justified numerically for the 63Cu + 197 Au reaction. S)
The diffusion coefficient in this formalism is expressed as
(1)
Here , T stands for the temperature. The friction coefficient 'Y A corresponding to the mass transfer
motion is expressed in terms of eigenfunctions I i> with eigenvalues ej in the two-center potential
V by
(2)
* Japan Atomic Energy Research Institute.
21
The two-center potential V depends on the distance between centers of masses of two nuclei R,
deformation of two nuclei 0 (0 = 01= O2), neck parameter E and mass number Al and ~, and its
specification is given in Ref. 9. The chemical potential A is determined by the conservation of the
total number of nucleons. The smearing width r is introduced to take into account the finite
wid th of the energy levels.
The calculations are performed for the reactions 20Ne + 27 Al at 120 MeV, 160 + 58Ni at 92
MeV, 32S + 50Ti at 131 and 166 MeV, 40Ar + 109Ag at 288 MeV, 40Ar + 197Au at 288 and 340 MeV,
40Ar + 232Th at 279 and 388 MeV, 63Cu + 197Au at 365 and 443 MeV, 84Kr + I65Ho at 714 MeV,
86Kr + I97Au at 620 MeV, 84Kr + 209Bi at 714 MeV and 136Xe + 209Bi at 1130 MeV. For the
estimation of the temperature T, we use the relation3)
T = 3.46~ E * / A , (3)
where the intrinsic energy E * is assumed to be the difference between the incident energy and
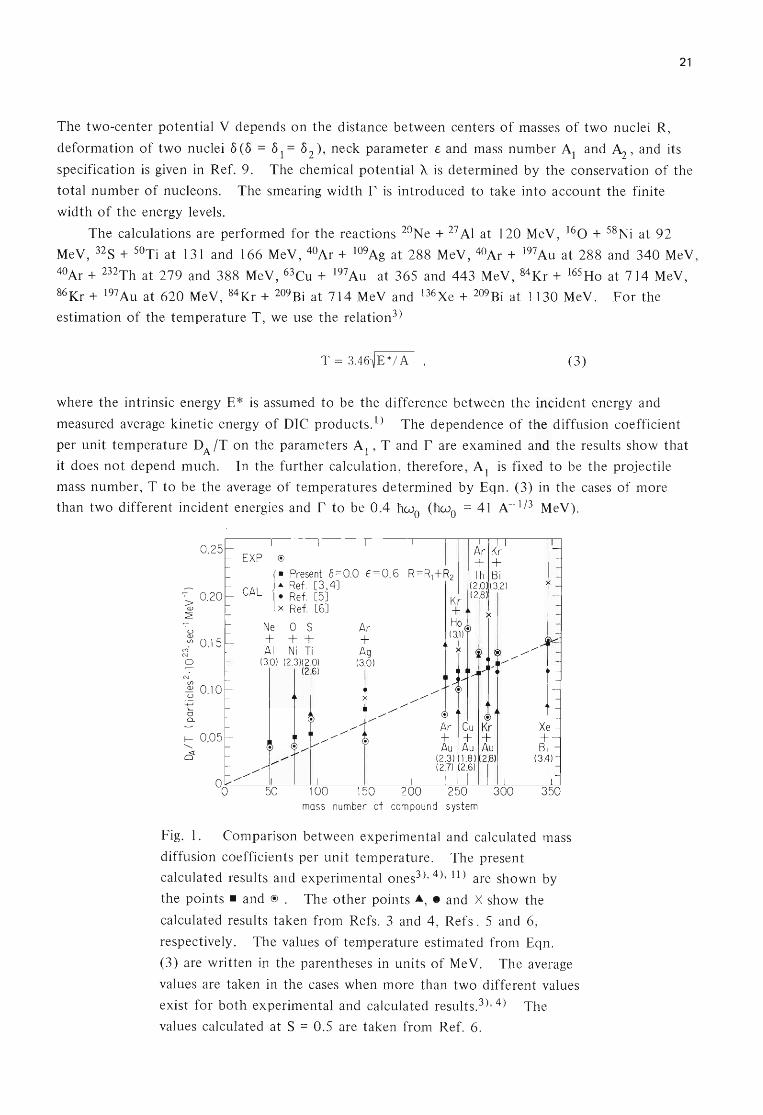
measured average kinetic energy of DIC products.1) The dependence of the diffusion coefficient
per unit temperature D A IT on the parameters Al ' T and r are examined and the results show that
it does not depend much. In the further calculation, therefore, Al is fixed to be the projectile
mass number, T to be the average of temperatures determined by Eqn. (3) in the cases of more
than two different incident energies and r to be 0.4 hwo (hwo = 41 A- I /3 MeV).
I U
0 .25
~ 0.15 ~ o
C\J
~ 0. 10 u
t o 0..
f-- 0.05 .........
c1
1- Present 8=0.0 [=0.6
CAL ... Ref [3.4J • Ref. [5J x Ref. [6J
Ne 0 S + + + AI Ni Ti
(3.0) (2.3)(2.0) (2 .6)
Ar + Ag
(3.0)
!
150 mass number of compound system
Xe + Bi
(3.4)
Fig. 1. Comparison between experimental and calculated mass
diffusion coefficients per unit temperature. The present
calculated results and experimental ones3), 4),11) are shown by
the points - and @. The other points ... , • and X show the
calculated results taken from Refs. 3 and 4, Refs. 5 and 6,
respectively. The values of temperature estimated from Eqn.
(3) are written in the parentheses in units of Me V. The average
values are taken in the cases when more than two different values
exist for both experimental and calculated results. 3), 4) The
values calculated at S = 0.5 are taken from Ref. 6.
22
The dependence of D A IT on the parameters 8, Rand c are also examined and the results show
that it is strong. The smooth increase in D A IT is found with the increase of 8, the decrease of R
and the decrease of c . This trend is consistent with the physical intuition that the mass transfer
occurs more rapidly under the situation of deeper penetration of two nuclei and larger neck-radius.
The calculation is found to give a rough magnitude of the experimental result.
Since the calculated values of D A IT depend strongly on R, we have to fix the value of R in
order to compare the calculated results with the experimental ones. For that purpose, we assume
that the mass transfer occurs while two nuclei form a rotating composite system at R = RJ
+ R2
(Ri = I.] 8 Ail / 3 fm) in the same way as in Ref. 4. A comparison at R = RI + R2 shows that the
values of c = 0.6 and 0.8 seem to give overall good fits to the experimental results for the cases of
8 = 0.0 and 0.2 , respectively. The latter value of 8 is the average of the deformations which are
obtained at the distances of the closest approach in the calculation for the 120 MeV 20Ne + 28Si
reaction. 10)
In Fig. 1, the present calculated results are compared with both the experimental ones3), 4), 11)
and the other calculated ones. 3) - 6) A dashed line is drawn between the origin and our
calculated value for the reaction 136Xe + 209Bi to help to see the trend that both the calculated and
experimental values of D A IT increase with the mass number of the compound system A.
Agreements between our calculated and experimental results are satisfactory in view of the
uncertainty of experimental results which comes from the uncertainty in the determination of the
interaction time. It should also be noted that our calculation based on the adiabatic approximation
and other ones3)- 6) based on the sudden approximation give rather similar results.
References
I) M. Lefort and C. Ngo: Ann. Phys., 1, 5 (1978).
2) H.A. Weidenmuller: Progr. in Particle and Nucl. Phys., l, 49 (1980).
3) S. Ayik, B. Schurman , and W. Norenberg: Z. Physik , A279, 145 (1976).
4) G. Wolschin and W. Norenberg: ibid. , A284, 209 (1978).
5) C.M. Ko, G.F. Bertsch , and D. Cha: Phys. Lett. , 77B, 174 (1978).
6) M. Prakash, S. Shlomo , V.S. Ramamurthy , S.S. Kapoor, and S.K. Kataria: ibid. , 988, 413
(1981 ).
7) H. Hofmann and PJ. Siemens: Nucl. Phys. , A275, 464 (1977).
8) S. Yamaji, A. Iwamoto , K. Harada, and S. Yoshida: Proc. Intern. Conf. on Nucl. Phys. ,
Berkeley (1980).
9) K. Sato , A. Iwamoto, K. Harada, S. Yamaji, and S. Yoshida: Z. Physik, A288, 383 (1978).
10) K. Sato, S. Yamaji, K. Harada , and S. Yoshida: ibid., A290, 149 (1979).
11) S. Yamaji: IPCR Cyclotron Progr. Rep., l.l, 42 (1979).

23
III - 1 -3. Non Perturbation Effect on the Nucleon Transfer Amplitudes
in Close Contact Heavy-Ion Collisions
N. Takigawa, T. Uchiyama,* and K. Sato
[NUCLEAR REACTION DIC , nucleon transfer amplitude non J perturbation effect, Green's function.
In deep inelastic heavy ion collisions (DIC) the scattering nuclei come in close contact with each other for a
long period. Accordingly, the amplitudes of single nucleon transfer , which govern the mass transport coefficients ,
cannot be estimated by the lowest order perturbation treatment. I), 2) In order to go beyond the lowest order
perturbation approximation we introduce the single particle Green's function G(t , to) that describes the time
evolution of a nucleon in the unified mean field created by the scattering nuclei. The matrix element of G(t, to)
with respect to the i-th and j-th single particle states of the scattering nucleus A, <P Ai and <P Aj ' is given by
GAjAi (t,tO ) =~ < <I>Ajlxa >< xa I <l>Ai > exp { - iEa ( t-tO )/ft + ieAjt/ n - ieAit O/n} a
==O.~ < <I> .Ix >< x 1<1> . > exp{-i (E - e k )( t-tO ) / ft}, (1) IJ a Al a a Al a 1
where 1 XC\' > is the a-th single particle bound state of the combined system , EC\' is the corresponding eigenenergy,
and eAi is the energy of the single particle state 1 <P Ai >. We use all the bound states of the colliding nuclei A
and B, i.e. {I<p Ai>} and {I <PBk >} , as the working space and deal with the scattering in the static approximation.
Namely, we disregard the change of the relative distance between the colliding nuclei during the period when the
nucleon transfer takes place. The transition amplitude tki for the transfer of a nucleon from I <P Ai> to I <PBk > is
then given by
t k i ( t ) == ( l/ift ) f~o ds {~ < 1/7 B k ( s ) 1 U A (:.. - ~ A ( s ) ) 11/7 Ai ( s) > G AjAi (s, to )
+f < 1/7Bk ( S ) I UA (~-~A ( S )) I ¢Bl ( S » GBIAi ( S,tO ) }' (2)
where U A is the single particle potential of the fragment A, and ¢ Aj (s) = <P Aj X exp { - e Aj t/fi } etc. The lowest
order perturbation approximation for tki corresponds to putting Gji(s - to) == G AjAi (s, to) ~ Dji and GBlAi (s, to) ~
o in Eqn. (2). In the following we study the behavior of the Green's function G .. (t) by considering one n
dimentional scattering problem. We assume the Woods-Saxon potential for each separated fragment and choose
50 MeV, 1.2 A l /3 fm (A being the mass) and 0.65 fm to be the values of depth, range and diffuseness parameters,
respectively. The separation distance between the centers of the scattering nuclei, R, is chosen so as to correspond
to the distance of closest approach for typical partial waves of DIC.
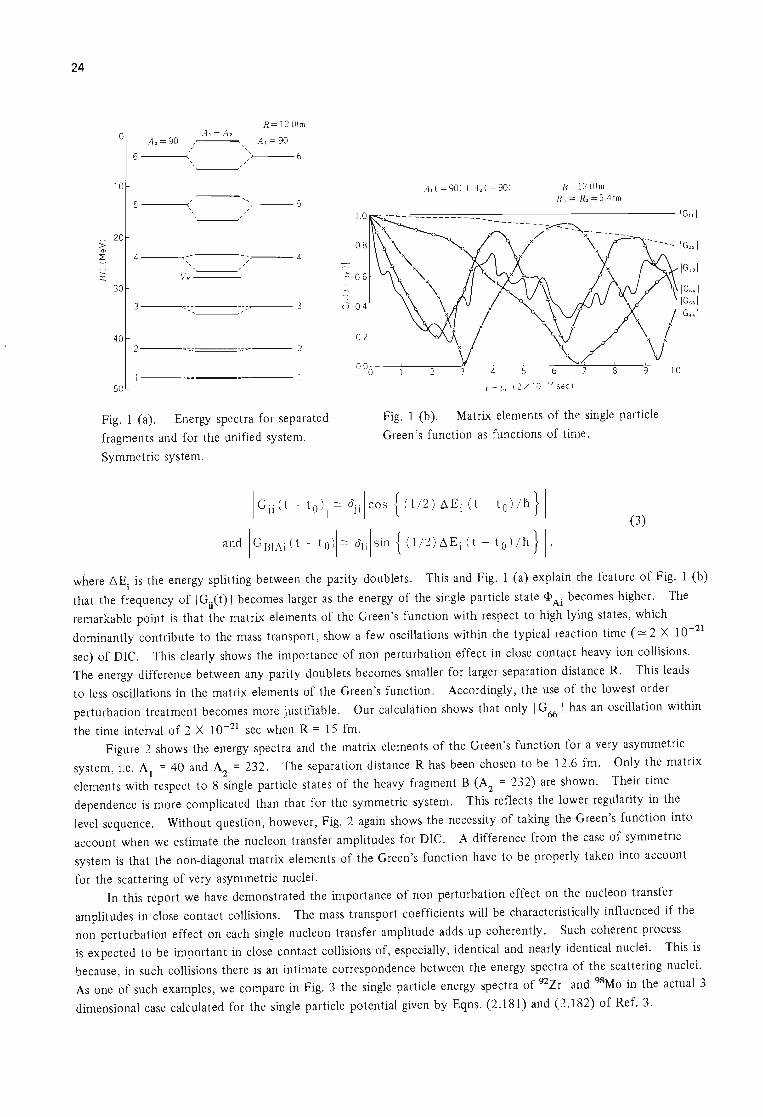
In Fig. 1 we consider a symmetric system, i.e. Al = A2 = 90. The left and the right of Fig. 1 (a) show the
single particle energy spectrum of each separated fragment. The middle shows the energy spectrum for the unified
system when R = 12.0 fm. Each of the energy levels can be distinguished by the number of nodes of the
corresponding level of the separated fragment and the paIity. The thick bar at - 27.8 MeV represents the height of
the potential barrier VB between the scattering nuclei. Figure 1 (b) shows the absolute values of the diagonal
matrix elements of the corresponding Green's function as functions of time. Roughly speaking, each of IGii(t - to)1
behaves like Icoswi(t - to)l. The frequency can be easily estimated by two level approximation , i.e. by keeping
only the parity doublets Xi+ and Xi_ that correspond to <P Ai in the sum over a in Eqn. (1). In this approximation,
* Department of Physics, Tohoku University.
24
0 .-1,+ .4 2
.4 2 =90
6 ,
10
5 c
20 > ~ 4
- VB 30
3 -, ,
40 2
1------50
R= 12.0fm
A , = 90
J 6
, , 5
/ /
4
3
~~---- 2
.'\, (= 90 ) + .'1 2 (= 90) 1< = 12.0fm N. = Hz = 5.4fm
1.0 ~::--"====::-::-::_=_-_-_------------IGIII
0.8
..:- 0.6 I
si 0.4
0.2
IGH I IG 55 ]
\ jlG .. 1
\/ 000~-7---~--~--~---+--~6--~~~8~--~9--~10
t - to (2 x l 0 "sec)
Fig. 1 (a). Energy spectra for separated Fig. I (b). Matrix elements of thp. single particle
fragments and for the unified system. Green's function as functions of time.
Symmetric system.
IG ji ( t - to ) l::: aii lcos { O!2) t.Ei ( t - to )/h} I
and IGB1Ai ( t - to JI::: alil s in { (1/ 2) t.Ei ( t - to )/h} I, (3)
where 6Ei is the energy splitting between the parity doublets. This and Fig. 1 (a) explain the feature of Fig. 1 (b)
that the frequency of I GnC t) I becomes larger as the energy of the single particle state cP Ai becomes higher. The
remarkable point is that the matrix elements of the Green's function with respect to high lying states, which
dominantly contribute to the mass transport, show a few oscillations within the typical reaction time (~2 X 10-21
sec) of DIC. This clearly shows the importance of non perturbation effect in close contact heavy ion collisions.
The energy difference between any parity doublets becomes smaller for larger separation distance R. This leads
to less oscillations in the matrix elements of the Green's function. Accordingly, the use of the lowest order
perturbation treatment becomes more justifiable . Our calculation shows that only I G66
I has an oscillation within
the time interval of 2 X 10-21 sec when R = 15 fm .
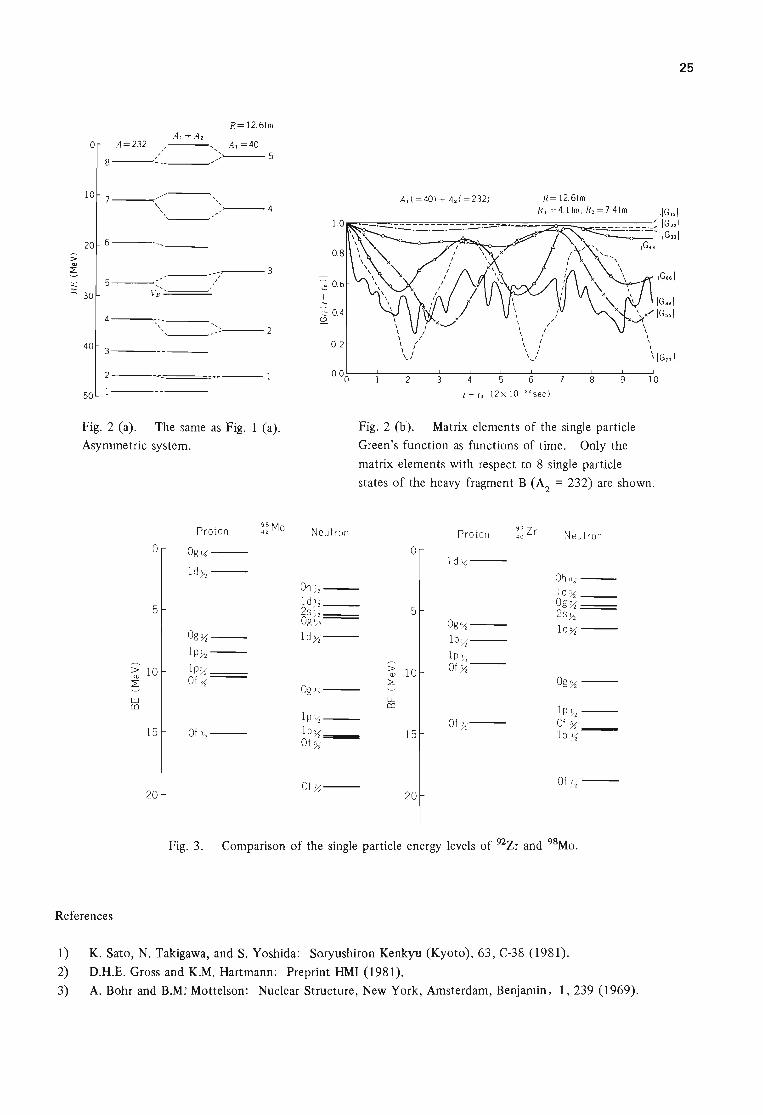
Figure 2 shows the energy spectra and the matrix elements of the Green's function for a very asymmetric
system , i.e. Al = 40 and A2 = 232. The separation distance R has been chosen to be 12.6 fm. Only the matrix
elements with respect to 8 single particle states of the heavy fragment B (A2 = 232) are shown. Their time
dependence is more complicated than that for the symmetric system. This reflects the lower regularity in the
level sequence. Without question, however, Fig. 2 again shows the necessity of taking the Green's function into
account when we estimate the nucleon transfer amplitudes for DIC. A difference from the case of symmetric
system is that the non-diagonal matrix elements of the Green's function have to be properly taken into account
for the scattering of very asymmetric nuclei.
In this report we have demonstrated the importance of non perturbation effect on the nucleon transfer
amplitudes in close contact collisions. The mass transport coefficients will be characteristically influenced if the
non perturbation effect on each single nucleon transfer amplitude adds up coherently. Such coherent process
is expected to be important in close contact collisions of, especially, identical and nearly identical nuclei. This is
because, in such collisions there is an intimate correspondence between the energy spectra of the scattering nuclei.
As one of such examples, we compare in Fig. 3 the single particle energy spectra of 92Zr and 98Mo in the actual 3
dimensional case calculated for the single particle potential given by Eqns. (2.181) and (2.182) of Ref. 3.
R= 12.6fm .4, +.42
0 .4 = 232 " .4, =40 , /
, 5
8 , ,
10 , 7 , , ,
) 4 /
20 6-----___ _
4--~·
'-__ -----2 40 3---
2----~_----::"'---- 1
50
Fig. 2 (a). The same as Fig. 1 (a).
Asymmetric system.
Proton ~ ~ Mo
0 Og~ ---
I d%---
5
OgYz---Ip~---
IP%= ~ 10 L Of Yz
w m
15 Of %---
20
Al ( = 40 ) + A2 ( = 232)
0. 2
R= 12.6fm R, = 41fm, R2 = 74fm ,IG"I
_________ ~ IG22
1
'-'-'-'-~ ' IGJJI
IG .. I
o 00:----=------:-2----:3~-..... 4 -~5----:6----::---8::----:':-9--:'1 0
t- to (2 x 10 U see )
Fig. 2 (b). Matrix elements of the single particle
Green's function as functions of time. Only the
matrix elements with respect to 8 single particle
states of the heavy fragment B (A2
= 232) are shown.
Neutron Proton ~~ Zr Neut ron
0 Id %---
Oh ~ ---QhIYz --- I d% ___ Id % ___
5 Og )1 ---
2s ~ ___ 2s ~ __ -Og~--- Og %--- Id %---Id %--- Ip~---
1 p Yz > Of % ---Q) 10
Og%---L Og% ---
w m
1p ~ ---1p)1 _-- Of )1--- Of Yz 1 P Yz 15 IP Yz -Of %
Ot Y2--- Of Y2 ---20
Fig. 3. Comparison of the single particle energy levels of 92Zr and 98Mo.
References
1) K. Sato, N. Takigawa, and S. Yoshida: Soryushiron Kenkyu (Kyoto), 63, C-38 (1981).
2) D.H.E. Gross and K.M. Hartmann: Preprint HMI (1981).
3) A. Bohr and B.M: Mottelson: Nuclear Structure, New York, Amsterdam, Benjamin,.!., 239 (1969).
25
26
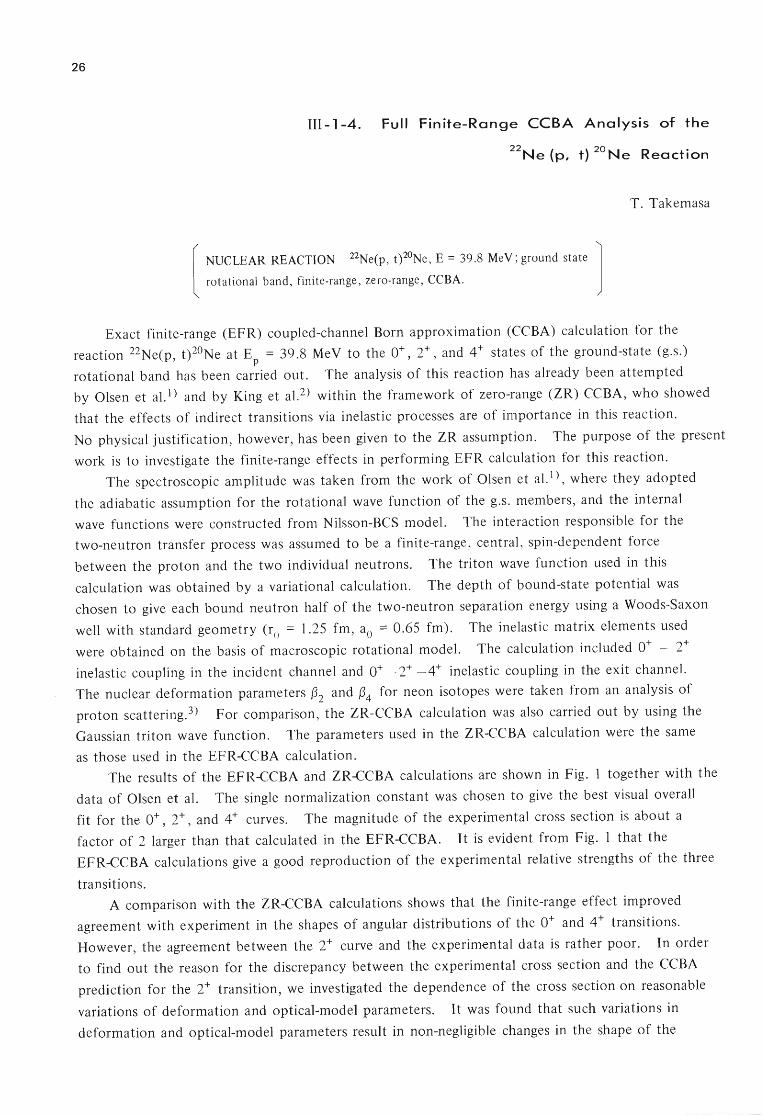
III-1-4. Full Finite-Range CCBA Analysis of the
22 20 • Ne (p, t) Ne Reaction
[
NUCLEAR REACTION 22Ne(p , t)2oNe , E = 39.8 MeV ; ground state J rotational band , finite-range , zero-range, CCBA.
T. Takemasa
Exact finite-range (EFR) coupled-channel Born approximation (CCBA) calculation for the
reaction 22Ne(p , t)2oNe at E = 39.8 MeV to the 0+ , 2+, and 4+ states of the ground-state (g.s.) p
rotational band has been carried out. The analysis of this reaction has already been attempted
by Olsen et a1.l) and by King et a1. 2) within the framework of zero-range (ZR) CCBA , who showed
that the effects of indirect transitions via inelastic processes are of importance in this reaction.
No physical justification, however, has been given to the ZR assumption. The purpose of the present
work is to investigate the finite-range effects in performing EFR calculation for this reaction.
The spectroscopic amplitude was taken from the work of Olsen et aLl) , where they adopted
the adiabatic assumption for the rotational wave function of the g.s. members, and the internal
wave functions were constructed from Nilsson-BCS model. The interaction responsible for the
two-neutron transfer process was assumed to be a finite-range , central, spin-dependent force
between the proton and the two individual neutrons. The triton wave function used in this
calculation was obtained by a variational calculation. The depth of bound-state potential was
chosen to give each bound neutron half of the two-neutron separation energy using a Woods-Saxon
well with standard geometry (ro = 1.25 fm, ao = 0.65 fm). The inelastic matrix elements used
were obtained on the basis of macroscopic rotational model. The calculation included 0+ - 2+
inelastic coupling in the incident channel and 0+ - 2+ - 4+ inelastic coupling in the exit channel.
The nuclear deformation parameters {32 and (34 for neon isotopes were taken from an analysis of
proton scattering. 3) For comparison, the ZR-CCBA calculation was also carried out by using the
Gaussian triton wave function. The parameters used in the ZR-CCBA calculation were the same
as those used in the EFR-CCBA calculation.
The results of the EFR-CCBA and ZR-CCBA calculations are shown in Fig. I together with the
data of Olsen et al. The single normalization constant was chosen to give the best visual overall
fit for the 0+ , 2+ , and 4+ curves. The magnitude of the experimental cross section is about a
factor of 2 larger than that calculated in the EFR-CCBA. It is evident from Fig. I that the
EFR-CCBA calculations give a good reproduction of the experimental relative strengths of the three
transitions.
A comparison with the ZR-CCBA calculations shows that the finite-range effect improved
agreement with experiment in the shapes of angular distributions of the 0+ and 4+ transitions.
However, the agreement between the 2+ curve and the experimental data is rather poor. In order
to find out the reason for the discrepancy between the experimental cross section and the CCBA
prediction for the 2+ transition, we investigated the dependence of the cross section on reasonable
variations of deformation and optical-model parameters. It was found that such variations in
deformation and optical-model parameters result in non-negligible changes in the shape of the
10'
10"
10-2
... ~ D
..§. t>1~ "0"0
10"
o
22 ( 20 Ne P.t) Ne Ep= 39.8 MeV
-EFR-CCBA ---ZR-CCBA
\ o· \ \ 0 , ,
\ , , , , , . ,:
•
• ..... -
eo
Fig. 1. Comparison of EFR-CCBA
(solid lines) and ZR-CCBA (dashed lines)
calculations with the datal) for the
differential cross sections to the 0+ (g.s.),
2+ 0.63 MeV), and 4+ (4.25 MeV)
states of 2oNe.
27
angular distribution, but some differences between the theory and experiment for the 2+ transition
still remained. The result points out that other higher-order reaction mechanisms such as
successive transfer processes not included in the CCBA calculation could account for some of the
remaining discrepancies.
References
1) D.K. Olsen, T. Udagawa, T. Tamura, and R.E. Brown: Phys. Rev. C, ~ 609 (973).
2) C.H. King, M.A.M. Shahabuddin, and B.H. Wildenthal: Nucl. Phys., A270, 399 (976).
3) R. de Swinarski, A.D. Baher, F.G. Resmini, G.R. Plattner, D.L. Herndrie, and J. Raynal: Phys.
Rev. Lett., 28, 1139 (1972).
28
III-1-5. Extended Brink Model and Its Derivation from
Distorted Wave Born Approximation
A. Ichimura, M. Ichimura, and S. Yamaji
[
NUCLEAR REACTIONS Cluster transfer J reaction , matching conditions.
The optimum particle transfer in heavy-ion reactions has been treated by Brink using a
classical model.1) The method can be extended to cluster transfer with general mass as shown by
Ichimura et al.2) This schematic model predicts the optimum excitation energy and spin of
the residual nucleus. However, it does not give the strength distribution of the cross section and
the validity of the model is not warranted.
In the present work we derive the extended Brink model from the formalism of DWBA
(distorted wave Born approximation) which is a completely quantum mechanical one. It enables
us to clarify the origin of the matching conditions and to estimate the width of the distribution
as well as the optimum conditions. In the following we summarize the logic of the derivation.
It is similar to that shown by Gross,3) but he derived only the optimum conditions for light particle
transfer.
We start from the DWBA transition amplitudes for the cluster transfer reaction,
(1)
where F (3 0! is a nonlocal form factor determined by the clustering bound-state wave functions and
by the coupling interaction. First we express the distorted wave X(+) and X( - ) according to the
geometrical optics approximation (three-dimensional 'VKB approximation). They are constructed
by the set of classical trajectries with incident momenta k O! and kf3 ' respectively. It should be
noted here that an arbitrary point is passed in general by many classical trajectries and that the
wave function is a superposition of many components. We further make an approximation ,
however, to take only one component with the largest impact parameter. Because the flux of the
other components is absorbed more rapidly , this procedure is reasonable particularly when the
transition occurs near the point of closest approach for the grazing trajectory.
The absolute value I X{3 (-) * F{3O! XQ (+) I of the integrand has a maximum when the transferred
cluster is placed between the other two clusters in the reaction plane. It is the very configuration
to be expected when the transition is assumed to occur in the schematic model. l ), 2) Then we
expand the exponent of the integrand around this configuration and approximate it by a six
dimensional complex quadratic form.
Thus the integral (1) is reduced to a product of six Gauss integrals and finally we obtain the
approximate expression for the transition probability
29
(2)
Here A denotes a real regular transformation and 6.P transferred momenta between three clusters ~v ~
by the transition. The expression (2) has a maximum when
6P = 0 ~
(}1 = 1, ... , 6) , (3)
namely when each cluster takes no recoil. The conditions (3) are nothing but the optimum
matching conditions of the extended Brink model. The width of the distribution can be also
estimated from the expression (2).
References
1) D. M. Brink: Phys. Lett., 40B, 37 (1972).
2) M. Ichimura, E. Takada, T. Yamaya, and K. Nagatani: ibid., 101B, 31 (1981).
3) D.H.E. Gross: ibid., 43B, 371 (1973).
30
III -1-6. Angular Distribution of Reaction Products
in Preequilibrium Process
M. Takahashi,* Y. Nagame, K. Sueki,* H. Nakahara, and I. Kohno
[
NUCLEAR REACTIONS 59Co(3 He , n); cross section , recoil range ,
angular distribution , pre equilibrium model.
The preequilibrium process in light-particle-induced reactions has been successfully explained by the exciton
model originally proposed by Griffin.1) However , the model is restricted to the explanation of energy spectra and
cross sections of emitted particles. Only recently , the model has been extended to include the angular behavior
of the preequilibrium process by WeidenmUller and his collaborators?) and also by Akkermans et al.3) The new
model has been tested for angular distributions of neutrons emitted in such reactions as (n , n/) , (p , n) , and (0' , n).
But since the number of data available is still scant , it is necessary to accumulate more data in order to check the
validity of the model.
In this work , angular distributions of the residual nuclei produced in the 59Coe He , n )61 Cu reaction at the
incident energies of 17.5 MeV and 30 MeV were investigated in order to study the angular behavior in pre
equilibrium reaction process. Excitation functions and mean recoil ranges projected onto the beam direction were
also measured to aid the understanding of preequilibrium process. A similar work was carried out by Fujiwara
and Porile4) for the reaction system of 64CueHe, n)66Ga ; they varied the incident energy from 16.9 MeV to
31:9 MeV, and covered the angular range of 0° to 42°, but the detection angles were taken at only in coarse steps.
Excitation functions and recoil ranges were measured by the stacked-foil technique . Self-supporting target
foils 4-8 mg/cm2 thick prepared by an eiectrodeposition method were used. The recoil catchers consisted of
0.0025 cm thick aluminum foils of high purity (99.997 %). The target stack was constructed by inserting 8 - 12
target foils in between aluminum catcher foils as well as appropriate aluminum energy degrading foils. The range
energy relation for 3He reported by Williamson et al. S) was used to determine the bombarding energy at each
target position in the stack. Irradiations were performed at the cyclotron with the initial beam energies of 40 MeV
and 27 MeV. The beam current was "'1.2 I1A.
After the bombardment , the reaction products recoiled into the catcher foil were chemically separated and
their activities were determined by measurement of -y-rays with a 40 cc Ge(Li) detector. The -y-rays from products
Beam
Fig. 1. Schematic diagram of irradiation arrangement used
in the angular distribution study.
l. Target , 2. flux monitor, 3. carbon collimator, 4. aluminum
catcher foil,S. catcher foil backing, 6. Faraday cup.
* Faculty of Science, Tokyo Metropolitan University.
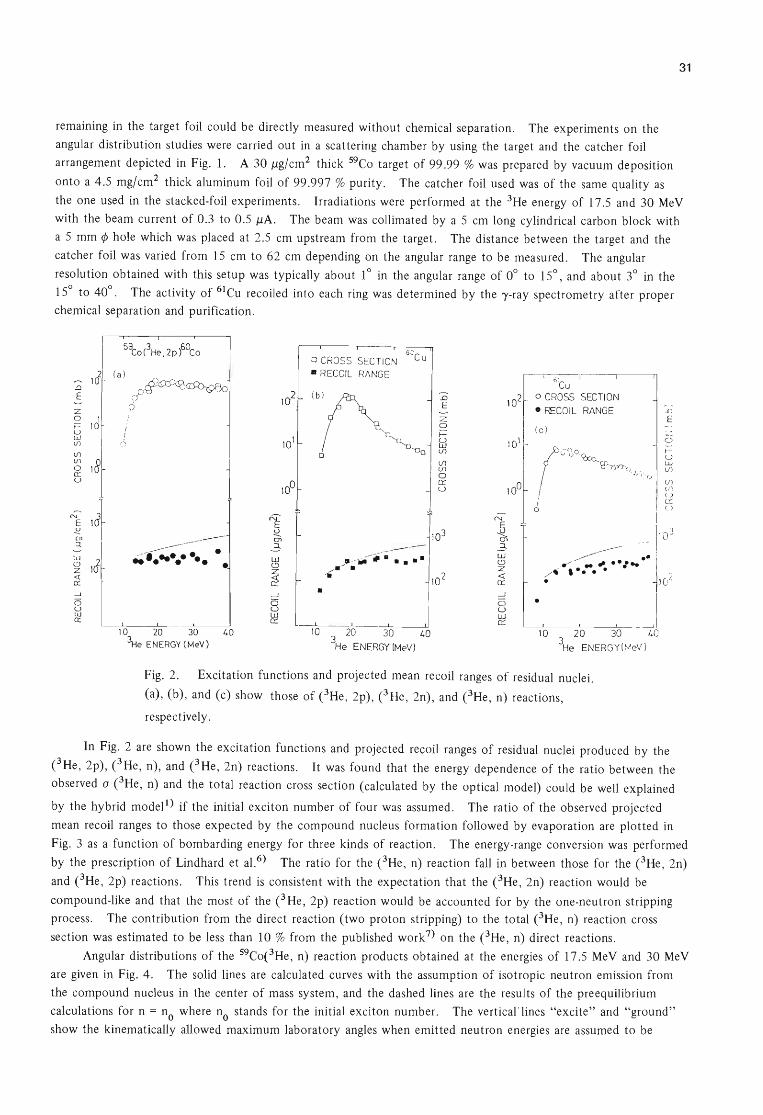
remaining in the targe t foil could be directly measured without chemical separation. The experiments on the
angular distribution studies were carried out in a scattering chamber by using the target and the catcher foil
arrangement depicted in Fig. 1. A 30 /lg/cm2 thick 59CO target of 99.99 % was prepared by vacuum deposition
onto a 4.5 mg/cm2 thick aluminum foil of 99.997 % purity. The catcher foil used was of the same quality as
31
the one used in the stacked-foil experiments. Irradiations were performed at the 3He energy of 17.5 and 30 MeV
with the beam current of 0.3 to 0.5 /lA. The beam was collimated by a 5 cm long cylindrical carbon block with
a 5 mm 1> hole which was placed at 2.5 cm upstream from the target. The distance between the target and the
catcher foil was varied from 15 cm to 62 cm depending on the angular range to be measured . The angular
resolution obtained with this setup was typically about lOin the angular range of 0° to ISo, and about 3° in the
ISo to 40° . The activity of 6lCu recoiled into each ring was determined by the 'Y-ray spectrometry after proper
chemical separation and purification.
1G ..a E
z 0 1 i= 10 u w If)
If)
lfl 18 0 0:: U
E 1d ~ (Jl
::J.
W
~ 1a <t: 0::
~
o u W 0::
59CO (3He • 2p )60co
(a)
i I
0
cP~~~ ¢
~ ------, ...... ... . . . --1
B u W 0::
o CROSS SEC TI ON 6CCU
• RECOIL RANGE
..a E
z o f= trl V)
V) V) o 0:: _ u
•
,t u i
1021- 0 CRO SS SECTION
• REeOI L RANGE
•
I
10 20 30 40 10 3 20 30 40 10 20 30 40 ~e ENERGY (MeV) He ENERGY (MeV) 3He ENERGY( ~eV)
Fig. 2. Excitation functions and projected mean recoil ranges of residual nuclei.
(a) , (b) , and (c) show those of CHe , 2p), CHe, 2n) , and CHe , n) reactions,
respectively.
J: )
E
In Fig. 2 are shown the excitation functions and projected recoil ranges of residual nuclei produced by the
CHe, 2p) , CHe , n), and CHe , 2n) reactions. It was found that the energy dependence of the ratio between the
observed aCHe, n) and the total reaction cross section (calculated by the optical model) could be well explained
by the hybrid model l ) if the initial exciton number of four was assumed. The ratio of the observed projected
mean recoil ranges to those expected by the compound nucleus formation followed by evaporation are plotted in
Fig. 3 as a function of bombarding energy for three kinds of reaction. The energy-range conversion was performed
by the prescription of Lindhard et a1.6) The ratio for the CHe , n) reaction fall in between those for the CHe , 2n)
and CHe, 2p) reactions. This trend is consistent with the expectation that the CHe, 2n) reaction would be
compound-like and that the most of the C He, 2p) reaction would be accounted for by the one-neutron stripping
process. The contribution from the direct reaction (two proton stripping) to the total CHe , n) reaction cross
section was estimated to be less than 10 % from the published work 7) on the CHe, n) direct reactions.
Angular distributions of the 59CoeHe , n) reaction products obtained at the energies of 17.5 MeV and 30 MeV
are given in Fig. 4. The solid lines are calculated curves with the assumption of isotropic neutron emission from
the compound nucleus in the center of mass system , and the dashed lines are the results of the preequilibrium
calculations for n = no where no stands for the initial exciton number. The vertical'lines "excite" and "ground"
show the kinematically allowed maximum laboratory angles when emitted neutron energies are assumed to be
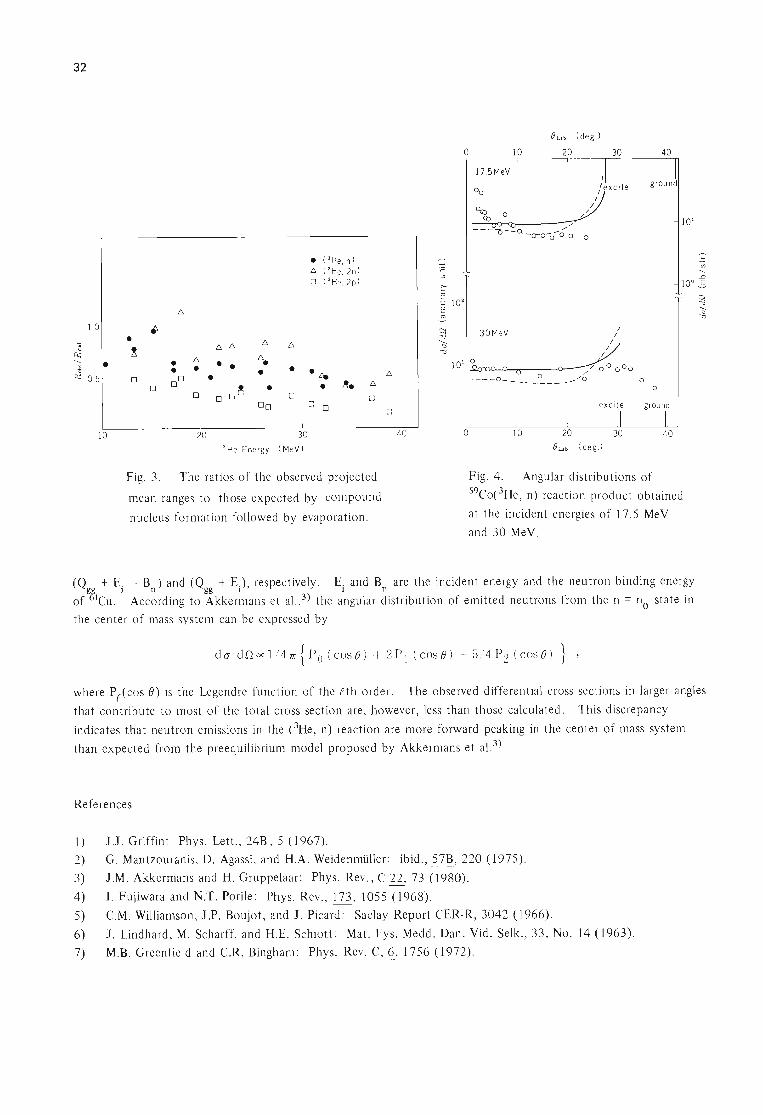
32
lOr-
~ '- • ~ 0.5
10
D.
~ • D.
! D. D.
• D. • 6.
• • • • 0 00 • 0 o~ • 0 0
00
20 3 He Energy
D.
• 0
30 (MeV)
• (3He. n) D. (3 He . 2n) o (J He.2p )
.~
• ~.
0 0
6
0
Fig. 3. The ratios of the observed projected
mean ranges to those expected by compound
nucleus formation followed by evaporation.
o I
40
·c '" >-<U
~ 102
<U
o 10 30
~ 30MeV / 6 /
~10'~oo o / ----0 _________ -/0
exc ite
,/ o 10 20 30
40
I grou nd
o o
ground
1 40
Fig. 4. Angular distributions of
59CoeHe, n) reaction product obtained
at the incident energies of 17. 5 MeV
and 30 MeV.
(Q + E. - B ) and (Q + E.), respectively. E. and B are the incident energy and the neutron binding energy gg 1 n gg I I n
of lCU. According to Akkermans et a1.,3) the angular distribution of emitted neutrons from the n = no state in
the center of mass system can be expressed by
d 0/ d n ex: 1/ 4 7l' { Po ( cos (j ) + 2 P 1 ( c os (j ) + 5/ 4 P 2 ( c os (j ) } ,
where Picos 8) is the Legendre function of the f th order. The observed differential cross sections in larger angles
that contribute to most of the total cross section are, however, less than those calculated. This discrepancy
indicates that neutron emissions in the eHe, n) reaction are more forward peaking in the center of mass system
than expected from the preequilibrium model proposed by Akkermans et a1.3)
References
1) J.J. Griffin: Phys. Lett., 24B, 5 (1967).
2) G. Mantzouranis , D. Agassi, and H.A. Weidenmiiller: ibid., 57B, 220 (1975).
3) J.M. Akkermans and H. Gruppelaar: Phys. Rev. , C 22 , 73 (1980).
4) I. Fujiwara and N.T. Porile: Phys. Rev., 173, 1055 (1968).
5) C.M. Williamson, J.P. Boujot, and J. Picard: Saclay Report CER-R, 3042 (1966).
6) J. Lindhard, M. Scharff, and H.E. Schiott: Mat. Fys. Medd. Dan. Vid. Selk., ~ No. 14 (1963).
7) M.B. Greenfield and C.R. Bingham: Phys. Rev. C, §.' 1756 (1972).
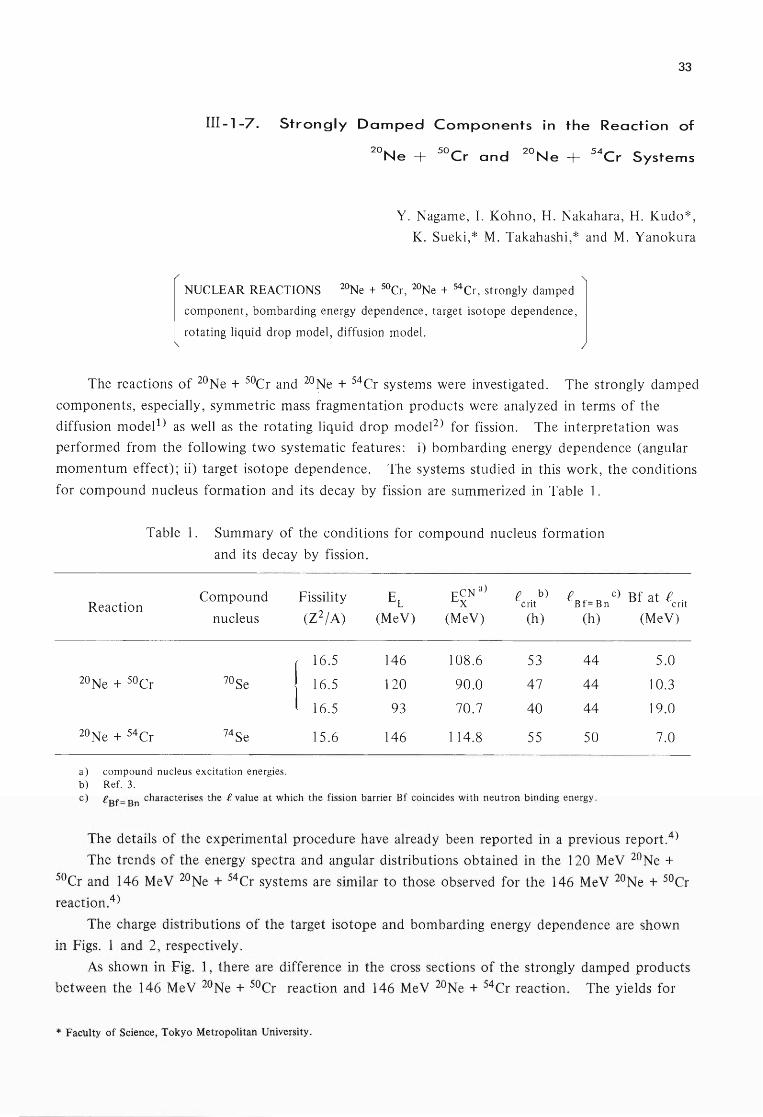
33
III-1-7. Strongly Damped Components in the Reaction of
2°Ne + 50Cr and 2°Ne + 54Cr Systems
Y. Nagame, 1. Kohno, H. Nakahara, H. Kudo*,
K. Sueki,* M. Takahashi,* and M. Yanokura
[
NUCLEAR REACTIONS 20Ne + sOCr, 20Ne + 54Cr, strongly damped 1 component, bombarding energy dependence, target isotope dependence ,
rotating liquid drop model, diffusion model.
The reactions of 20Ne + sOCr and 20Ne + S4Cr systems were investigated. The strongly damped
components, especially, symmetric mass fragmentation products were analyzed in terms of the
diffusion model!) as well as the rotating liquid drop model2) for fission . The interpretation was
performed from the following two systematic features: i) bombarding energy dependence (angular
momentum effect); ii) target isotope dependence. The systems studied in this work, the conditions
for compound nucleus formation and its decay by fission are summerized in Table l.
Table 1.
Reaction
Summary of the conditions for compound nucleus formation
and its decay by fission.
Compound
nucletls
I
Fissility
(Z2 fA)
16.5
16.5
16.5
15.6
EL (MeV)
146
120
93
146
eN a) Ex
(MeV)
108.6
90.0
70.7
114.8
.e erit b) .e
Bf=Bn
(h) (h)
53 44
47 44
40 44
55 50
a) compound nucleus excitation energies. b) Ref. 3. c) t'Bf= Bn characterises the f value at which the fission barrier Bf coincides with neutron binding energy.
c) Bf at Pcrit
(MeV)
5.0
10.3
19.0
7.0
The details of the experimental procedure have already been reported in a previous report. 4)
The trends of the energy spectra and angular distributions obtained in the 120 MeV 20Ne + 50Cr and 146 MeV 20Ne + 54Cr systems are similar to those observed for the 146 MeV 20Ne + sOCr
reaction.4 )
The charge distributions of the target isotope and bombarding energy dependence are shown
in Figs. 1 and 2, respectively.
As shown in Fig. 1, there are difference in the cross sections of the strongly damped products
between the 146 MeV 20Ne + 50Cr reaction and 146 MeV 20Ne + 54Cr reaction. The yields for
* Faculty of Science, Tokyo Metropolitan University.
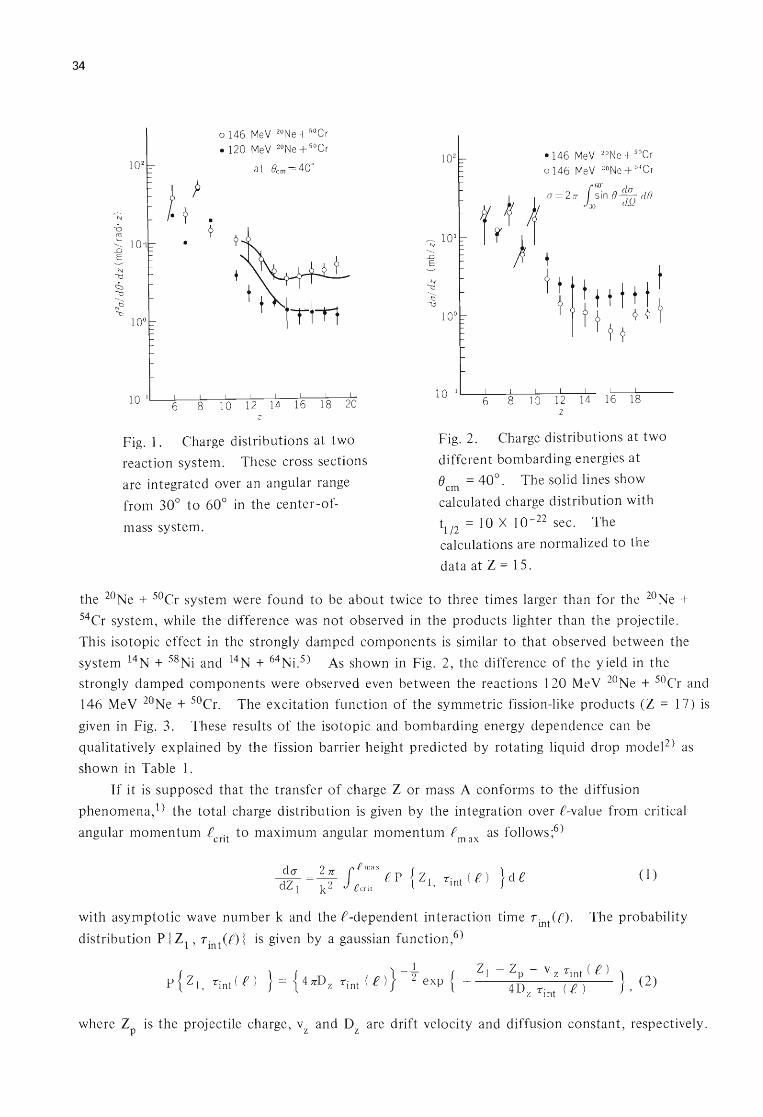
34
0146 MeV 2°Ne + sOCr • 120 MeV 2° Ne + sOCr
at eem = 400
1./. ?
•
z
Fig. 1. Charge distributions at two
reaction system. These cross sections
are integrated over an angular range
from 30° to 60° in the center-of
mass system.
z
Fig. 2. Charge distributions at two
different bombarding energies at
e em = 40° . The solid lines show
calculated charge distribution with
t1/2 = 10 X 10 - 22 sec. The
calculations are normalized to the
data at Z = 15.
the 20Ne + 50Cr system were found to be about twice to three times larger than for the 20Ne +
54Cr system, while the difference was not observed in the products lighter than the projectile.
This isotopic effect in the strongly damped components is similar to that observed between the
system 14N + 58Ni and 14N + 64Ni .5) As shown in Fig. 2, the difference of the yield in the
strongly damped components were observed even between the reactions 120 MeV 20Ne + 50Cr and
146 MeV 20Ne + 50Cr. The excitation function of the symmetric fission-like products (Z = 17) is
given in Fig. 3. These results of the isotopic and bombarding energy dependence can be
qualitatively explained by the fission barrier height predicted by rotating liquid drop model2) as
shown in Table I.
If it is supposed that the transfer of charge Z or mass A conforms to the diffusion
phenomena,1) the total charge distribution is given by the integration over f-value from critical
angular momentum f ·t to maximum angular momentum f as follows;6) en max
d (j 2 7l' J f rna x { } -dZ = -2 . I? P Z 1 'tj nt ( f ) d e
1 k fent '
with asymptotic wave number k and the e -dependent interaction time 7 int (I?).
distribution P 1 Zl ' 7 int (/:') f is given by a gaussian function,6)
(1)
The probability
where Zp is the projectile charge, v z and Dz are drift velocity and diffusion constant, respectively.
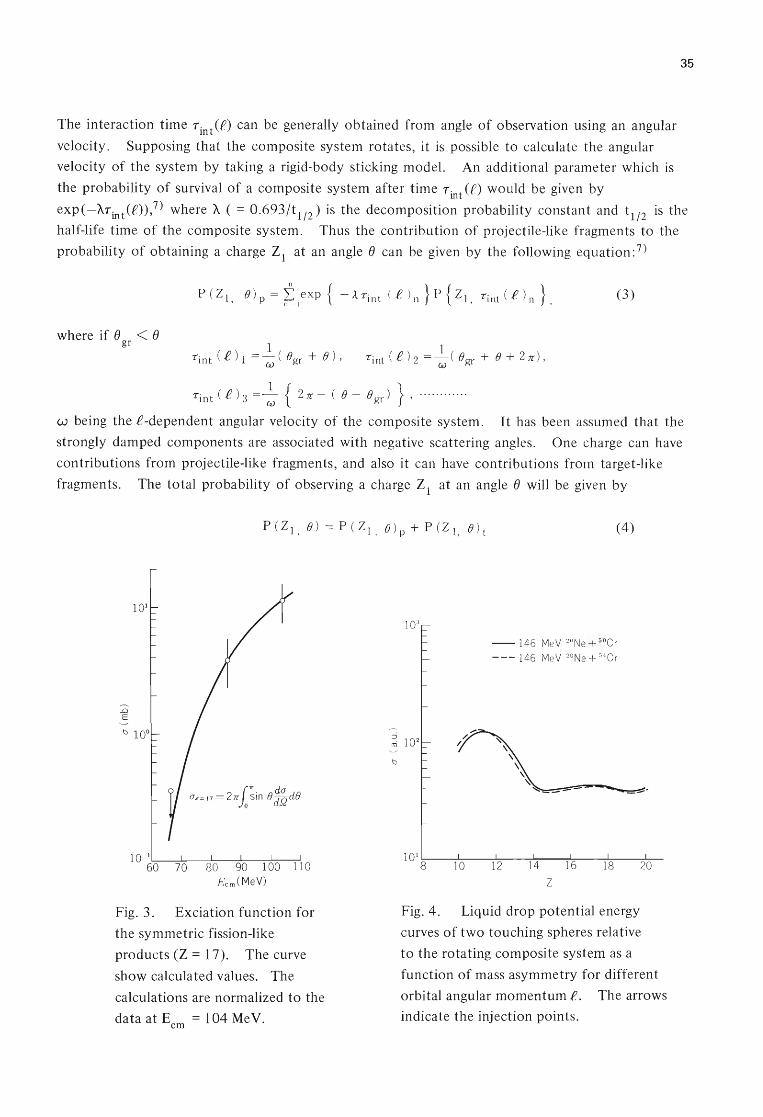
35
The interaction time T int(£) can be generally obtained from angle of observation using an angular
velocity. Supposing that the composite system rotates , it is possible to calculate the angular
velocity of the system by taking a rigid-body sticking model. An additional parameter which is
the probability of survival of a composite system after time Tint (£) would be given by
exp(-XTint (£)) ,7) where X ( = 0.693/t 1/2 ) is the decomposition probability constant and tl/2 is the
half-life time of the composite system. Thus the contribution of projectile-like fragments to the
probability of obtaining a charge Z1 at an angle e can be given by the following equation: 7)
(3)
where if e gr < e
Tint ( .e ) 3 = ~ { 2 7r - ( e - e gr) } , ........... .
w being the P-dependent angular velocity of the composite system. It has been assumed that the
strongly damped components are associated with negative scattering angles. One charge can have
contributions from projectile-like fragments, and also it can have contributions from target-like
fragments. The total probability of observing a charge Z1 at an angle e will be given by
1"' , da aZ = 17= 27r oSln8dQ d8
Fig. 3. Exciation function for
the symmetric fission-like
products (Z = 17). The curve
show calculated values. The
calculations are normalized to the
data at Ecm = 104 MeV.
(4)
- 146 MeV 2°Ne + 50Cr --- 146 MeV 2°Ne + 54C r
~
" \ \
\
~ ~ - - -~-"""""-""-----,....,
z
Fig. 4. Liquid drop potential energy
curves of two touching spheres relative
to the rotating composite system as a
function of mass asymmetry for different
orbital angular momentum P. The arrows
indicate the injection points.
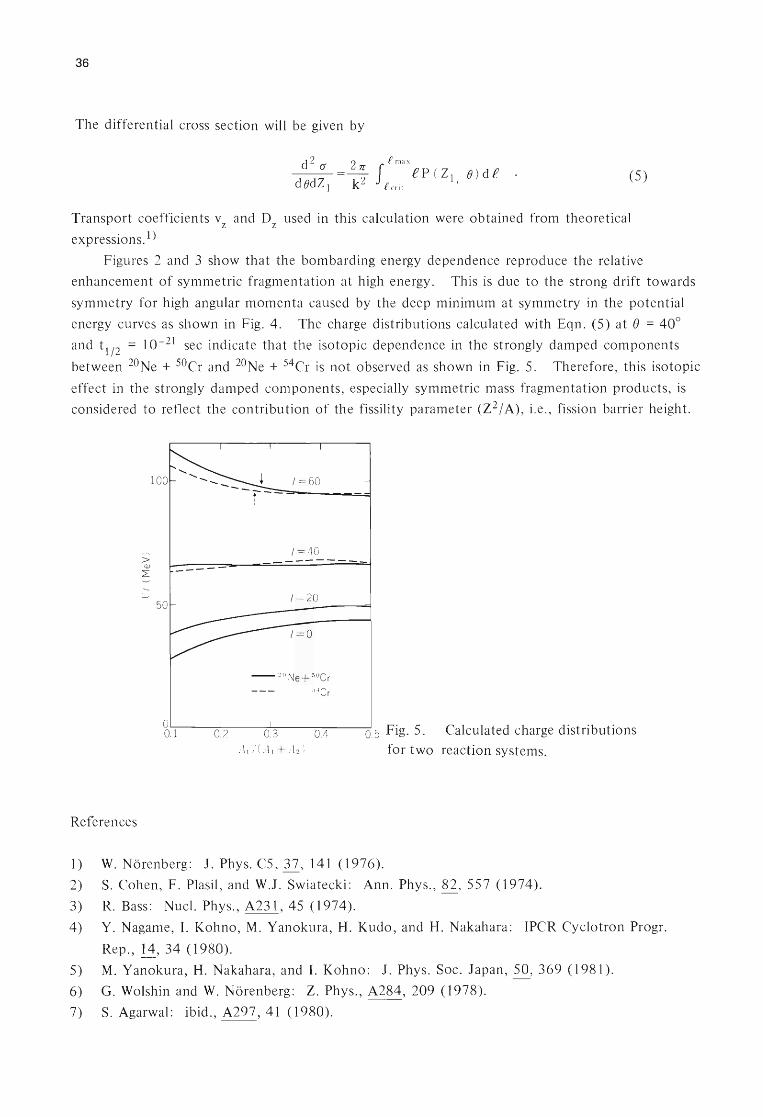
36
The differential cross section will be given by
d 2 (j' 27l £ max
--=- f £P ( ZI e)d£ dedZ 1 k 2
£ cr i t ' (5)
Transport coefficients v and D used in this calculation were obtained from theoretical z z
expressions. 1 )
Figures 2 and 3 show that the bombarding energy dependence reproduce the relative
enhancement of symmetric fragmentation at high energy . This is due to the strong drift towards
symmetry for high angular momenta caused by the deep minimum at symmetry in the potential
energy curves as shown in Fig. 4. The charge distributions calculated with Eqn. (5) at e = 40°
and t 1/2 = 10 - 21 sec indicate that the isotopic dependence in the strongly damped components
between 20Ne + 50Cr and 20Ne + 54Cr is not observed as shown in Fig. 5. Therefore, this isotopic
effect in the strongly damped components, especially symmetric mass fragmentation products, is
considered to reflect the contribution of the fissility parameter (Z2 / A), i.e., fission barrier height.
> Q)
L ----l = 40 --------
1= 20
-2 °Ne+ ooCr
54Cr
~'-;-. 1--~--~---::::-'-:----='0.5 Fig. 5. Calculated charge distributions
for two reaction systems.
References
1) W. Norenberg: J. Phys. C5, 37, 141 (1976).
2) S. Cohen, F. Plasil, and W.J. Swiatecki: Ann. Phys., 82, 557 (1974).
3) R. Bass: Nucl. Phys. , A231, 45 (1974).
4) Y. Nagame, I. Kohno, M. Yanokura, H. Kudo, and H. Nakahara: IPCR Cyclotron Progr.
Rep., 14 , 34 (1980).
5) M. Yanokura, H. Nakahara, and I. Kohno: J. Phys. Soc. Japan, 2Q, 369 (1981).
6) G. Wolshin and W. Norenberg: Z. Phys., A284, 209 (1978).
7) S. Agarwal: ibid ., A297, 41 (1980).
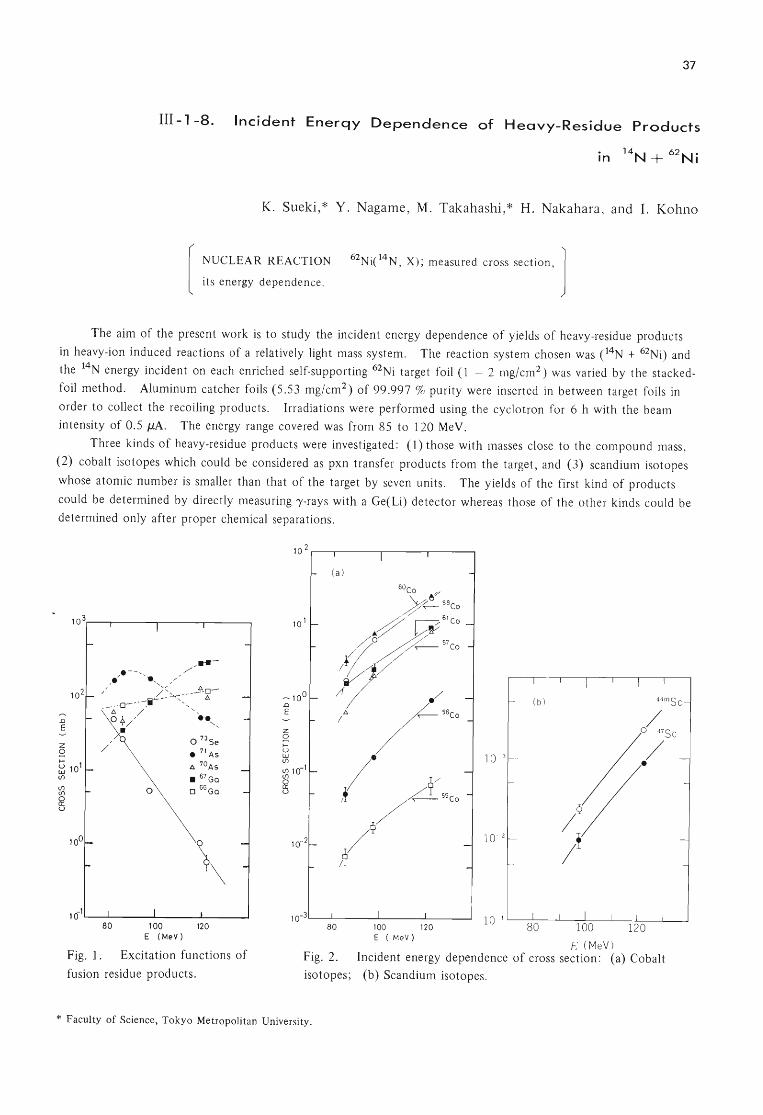
37
III - 1 -8. Incident Enerqy Dependence of Heavy-Residue Products
K. Sueki, * Y. Nagame, M. Takahashi, * H. Nakahara, and I. Kohno
[
NUCLEAR REACTION
its energy dependence.
62Ni(14N , X); measured cross section, ]
The aim of the present work is to study the incident energy dependence of yields of heavy-residue products
in heavy-ion induced reactions of a relatively light mass system. The reaction system chosen was ct4 N + 62Ni) and
the 14N energy incident on each enriched self-supporting 62Ni target foil (1 - 2 mg/cm2) was varied by the stacked
foil method. Aluminum catcher foils (5.53 mg/cm2 ) of 99.997 % purity were inserted in between target foils in
order to collect the recoiling products. Irradiations were performed using the cyclotron for 6 h with the beam
intensity of 0.5 J,lA. The energy range covered was from 85 to 120 MeV.
Three kinds of heavy-residue products were investigated: (1) those with masses close to the compound mass,
(2) cobalt isotopes which could be considered as pxn transfer products from the target , and (3) scandium isotopes
whose atomic number is smaller than that of the target by seven units. The yields of the first kind of products
could be determined by directly measuring 'Y-rays with a Ge(Li) detector whereas those of the other kinds could be
determined only after proper chemical separations.
.Q E
o
o 73 Se • 71 As
t:. 70 As • 67 Ga o 66 Ga
80 100 120 E (MeV)
Fig. 1. Excitation functions of
fusion residue products.
10 2 r--r------,-----,------, I 1
z ~ tU UJ 1Il
t-
101
-
-
-
iji 10-1_
5 t-
f-
( a ) -
10-3,---...1..-,----_.1.....-1 -----',------'
80 100 120 E ( MeV)
I I I I I I
( b ) 44mSc -
10 1 L-~t ___ ~I ~IL_~t ___ L_t ~t __ ~ 80 100 120
E ( MeV ) Fig. 2. Incident energy dependence of cross section: (a) Cobalt
isotopes; (b) Scandium isotopes.
* Faculty of Science, Tokyo Metropolitan University.
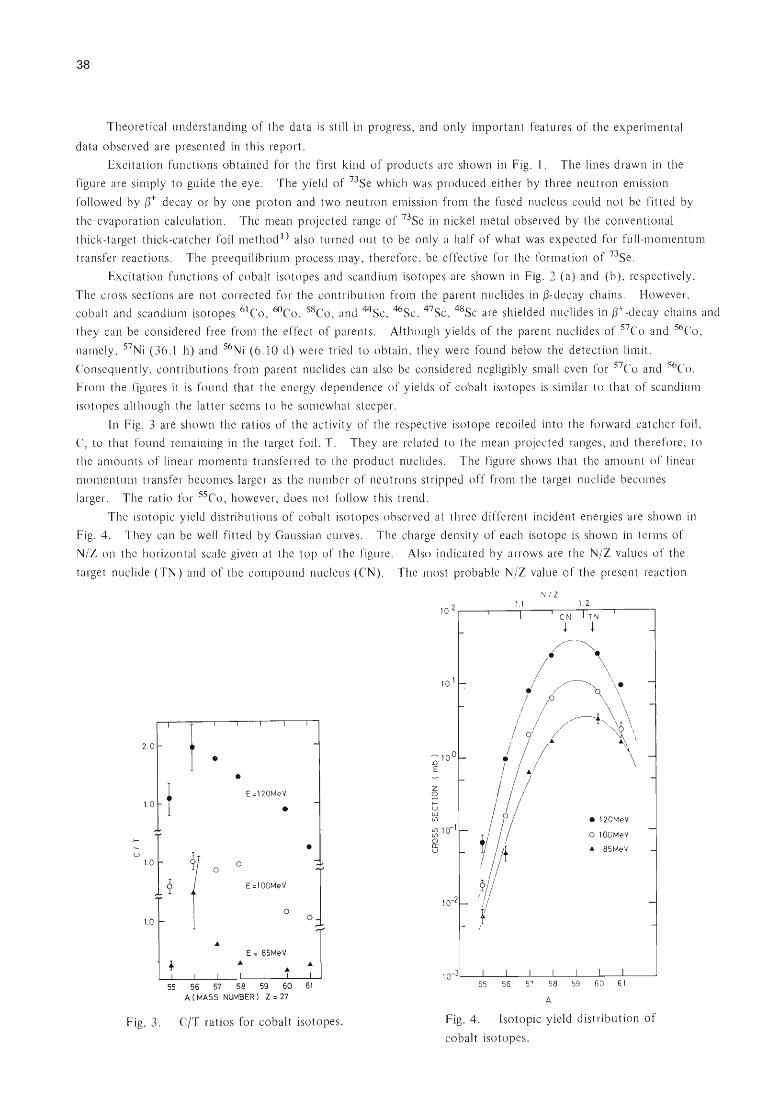
38
Theoretical understanding of the data is still in progress, and only important features of the experimental
data observed are presented in this report.
Excitation functions obtained for the first kind of products are shown in Fig. 1. The lines drawn in the
figure are simply to guide the eye. The yield of 73Se which was produced either by three neutron emission
followed by 0+ decay or by one proton and two neutron emission from the fused nucleus could not be fitted by
the evaporation calculation. The mean projected range of 73Se in nickel metal observed by the conventional
thick-target thick-catcher foil method 1) also turned out to be only a half of what was expected for full-momentum
transfer reactions. The preequilibrium process may, therefore, be effective for the formation of 73Se.
Excitation functions of cobalt isotopes and scandium isotopes are shown in Fig. 2 (a) and (b), respectively.
The cross sections are not corrected for the contribution from the parent nuclides in /3-decay chains. However ,
cobalt and scandium isotopes 61Co, 6OCo, 58CO, and 44SC, 46Sc , 47SC, 48Sc are shielded nuclides in /3+ -decay chains and
they can be considered free from the effect of parents. Although yields of the parent nuclides of 57CO and 56CO,
namely, 57Ni (36.1 h) and 56Ni (6.10 d) were tried to obtain , they were found below the detection limit.
Consequently , contributions from parent nuclides can also be considered negligibly small even for 57CO and 56CO.
From the figures it is found that the energy dependence of yields of cobalt isotopes is similar to that of scandium
isotopes although the latter seems to be somewhat steeper.
In Fig. 3 are shown the ratios of the activity of the respective isotope recoiled into the forward catcher foil,
C, to that found remaining in the target foil, T. They are re lated to the mean projected ranges, and therefore, to
the amounts of linear momenta transferred to the product nuclides. The figure shows that the amount of linear
momentum transfer becomes larger as the number of neutrons stripped off from the target nuclide becomes
larger. The ratio for 55Co, however, does not follow this trend.
The isotopic yield distributions of cobalt isotopes observed at three different incident energies are shown in
Fig. 4. They can be well fitted by Gaussian curves. The charge density of each isotope is shown in terms of
Nil on the horizontal scale given at the top of the figure. Also indicated by arrows are the Ni l values of the
target nuclide (TN) and of the compound nucleus (CN). The most probable Nil value of the present reaction
2.0
10 t
;'oL 1.0
55
Fig. 3.
• •
E=120MeV
•
•
r 0
0
J E=100MeV
0
... E = 85MeV
56 57 58 59 60
A (MASS NUMBER) Z = 27
CIT ratios for cobalt isotopes.
N/Z
55 56 57 58 59 60 61
A
Fig. 4. Isotopic yield distribution of
cobalt isotopes.
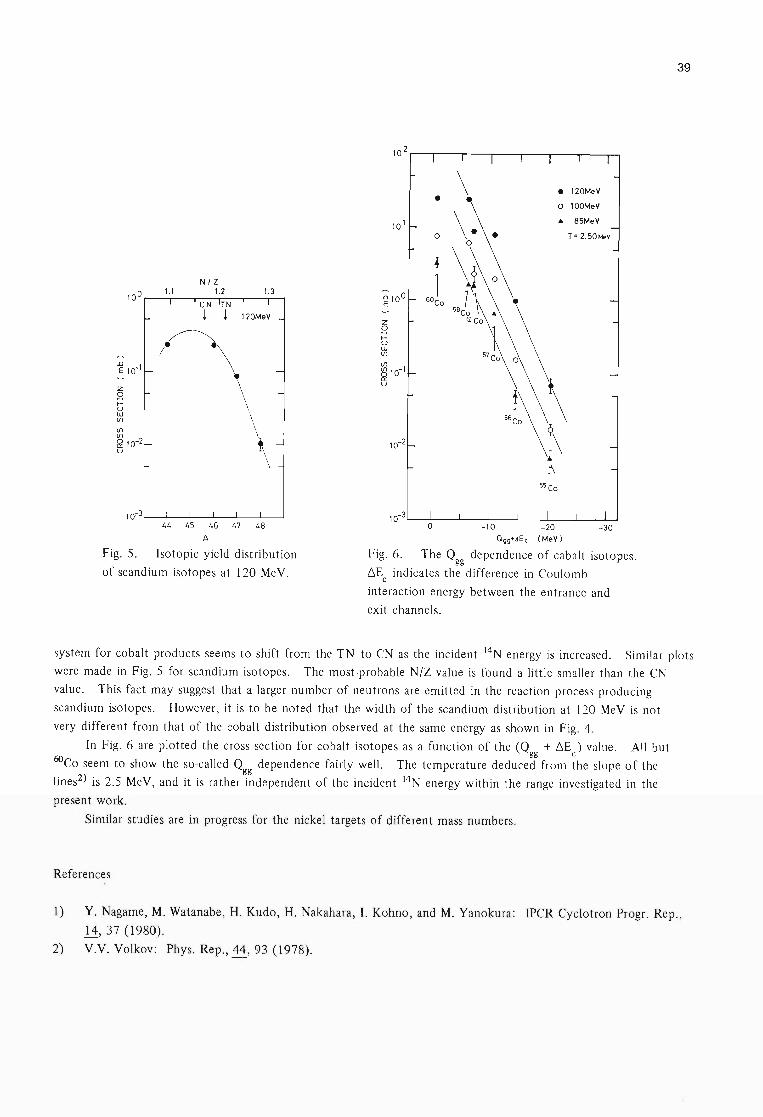
N/Z
10°r--,I._I __ ~-,1.~2 __ ~-,1.r3~ , eN 'TN '
! ! 120MeV_
lif3~_~I~I ___ L-I~I __ ~1~~ 44 45 46 47 48
A
Fig. 5. Isotopic yield distribution
of scandium isotopes at 120 MeV.
z ~ IU W If)
10 2
10 1
~ 10-1 ex: u
•
0
o -10
• 120MeV
0 100MeV
... 85MeV
T= 2.50MpV
-20 -30 Qgg+~Ec (MeV)
Fig. 6. The Q dependence of cabalt isotopes. gg
~Ec indicates the difference in CouLomb
interaction energy between the entrance and
exit channels.
39
system for cobalt products seems to shift from the TN to CN as the incident 14N energy is increased. Similar plots
were made in Fig. 5 for scandium isotopes. The most-probable N/Z value is found a little smaller than the CN
value. This fact may suggest that a larger number of neutrons are emitted in the reaction process producing
scandium isotopes. However, it is to be noted that the width of the scandium distribution at 120 MeV is not
very different from that of the cobalt distribution observed at the same energy as shown in Fig. 4.
In Fig. 6 are plotted the cross section for cobalt isotopes as a function of the (Q +.6.E) value. All but gg c
6OCo seem to show the so-called Q dependence fairly well. The temperature deduced from the slope of the gg
lines2) is 2.5 MeV, and it is rather independent of the incident 14N energy within the range investigated in the
present work.
Similar studies are in progress for the nickel targets of different mass numbers.
References
1) Y. Nagame, M. Watanabe, H. Kudo, H. Nakahara, I. Kohno, and M. Yanokura: IPCR Cyclotron Progr. Rep.,
14,37 (1980).
2) V.V. Volkov: Phys. Rep., 44, 93 (1978).
40
III - 1-9. light- Particle Emissions in the 93Nb + 14N Reaction
in the Region of ~7 to ~ 15 MeV/ A
M. Ishihara , T. Fukuda,* M. Tanaka,** H. Ogata,***
I. Miura,*** T. Shimoda ,* and K. Katori*
[
NUCLEAR REACTIONS 93Nbct4N , X) with X = p, d , t , Q , J E = 132 , 160, 210 MeV; measured aCE, fJ).
The strong emission of fast - light particles is one of characteristic aspects of heavy-ion
reactions in a broad region of the projectile energy. Several mechanisms have been proposed to
account for these emissions. Apparently , the phenomenon bears different features as the incident
energy varies from low to high energies. In the low-energy region of rv5 MeV/nucleon, the energy
spectrum shows a Maxwellian-line shape , which may favour treatments in terms of "hot-spot" model
and "exciton" models. On the other hand, in the high-energy region of some 100 MeV/nucleon,
the aspect of projectile fragmentation dominates. In the intermediate region, the competition
among such different mechanisms is likely.
The present work is aimed at investigation of energy dependence of the light-particle emission
in the 93Nb + 14N reaction in the energy range of rv7 to rv 15 MeV/nucleon. The 14N beam of
132 , 160 , and 210 MeV from the RCNP cyclotron (Research Center for Nuclear Physics at Osaka)
was used to irradiate a metalic target of 93Nb. Energy spectra and angular distributions of light
charged particles, i.e., p, d, t, and ~ were measured using telescopes of Si-detectors and those
incorporating intrinsic Ge detectors.
Figure ] shows some energy spectra of ~ particles taken at different incident energies. The
spectra shown are those -obtained after subtracting the equilibrium components whose intensities
and spectral shapes are estimated from the data at backward angles. The spectra at 115 MeV are
chara ~terized by their shapes, which may be fitted by Maxwellian shapes. At higher incident
energies, the spectral shapes no longer exhibit such a monotonic structure; typically , for the 210
MeV data at forward angles, the energy spectra clearly show an extra enhancement in the higher
energy region and particularly in the energy region corresponding to the incident velocity of the
projectile. Recently an alpha-particle-emission mechanism 1) associated with the projectile breakup
was proposed. The enhancement at the higher energy region is suggestive of such a mechanism.
The angular distributions of p , d , t, and ~ taken at 132 MeV are compared in Fig. 2. The
equilibrium components are again subtracted. The slope of the distribution is rather similar
among p , d, t, while that of a is considerably steeper. The significant deviation observed for the
alpha particles may characterize a particular feature of the alpha-particle emission.
A detailed description of data and comparison of the results with various models are in
preparation.
* Department of Physics, Osaka University. ** Kobe Tokiwa Junior College. ** * Research Center for Nuclear Physics, Osaka University.
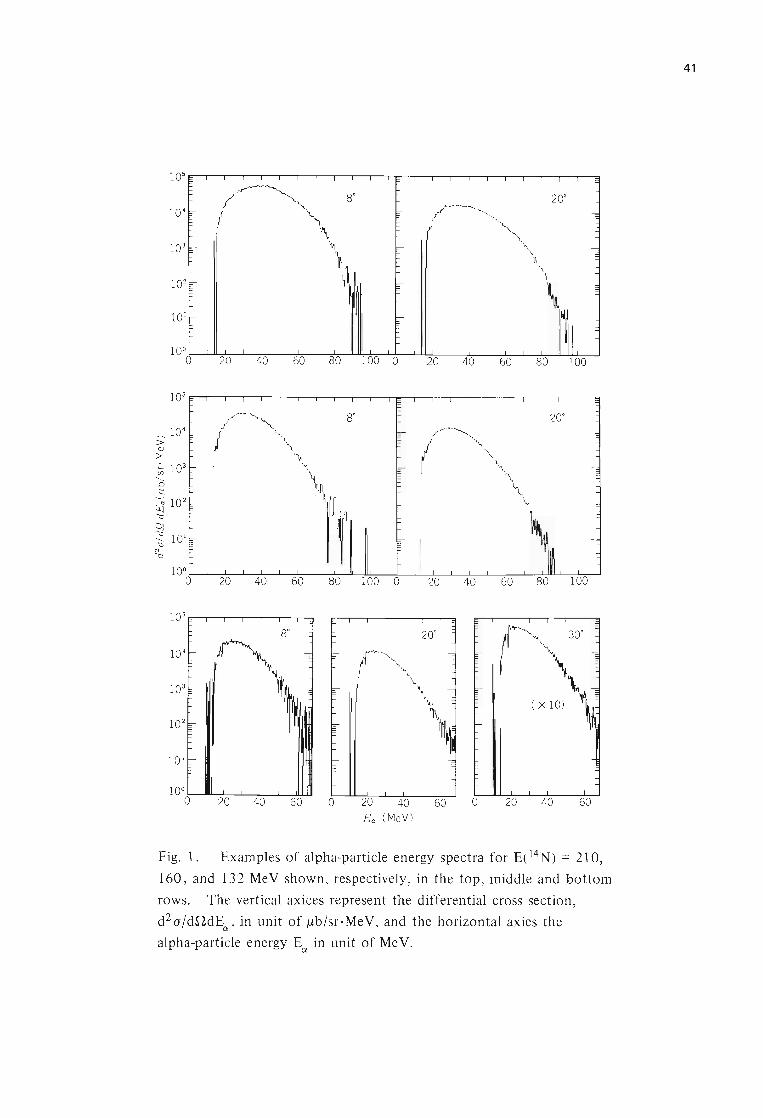
.-.. 10 4
> Q)
L
~ 103
......... ..0
:::t '-;; 10 2
~
"'" q
~ 101
~
80 100 0
o 20 40 Ea ( MeV)
20 40 60
60 o 20 40 60
Fig. 1. Examples of alpha-particle energy spectra for EcI4N) = 210,
160, and 13 2 MeV shown, respectively , in the top, middle and bottom
rows. The vertical axices represent the differential cross section,
d2 a/dndE , in unit of ,ub/sroMeV, and the horizontal axies the Q
alpha-particle energy EQ in unit of Me V.
41
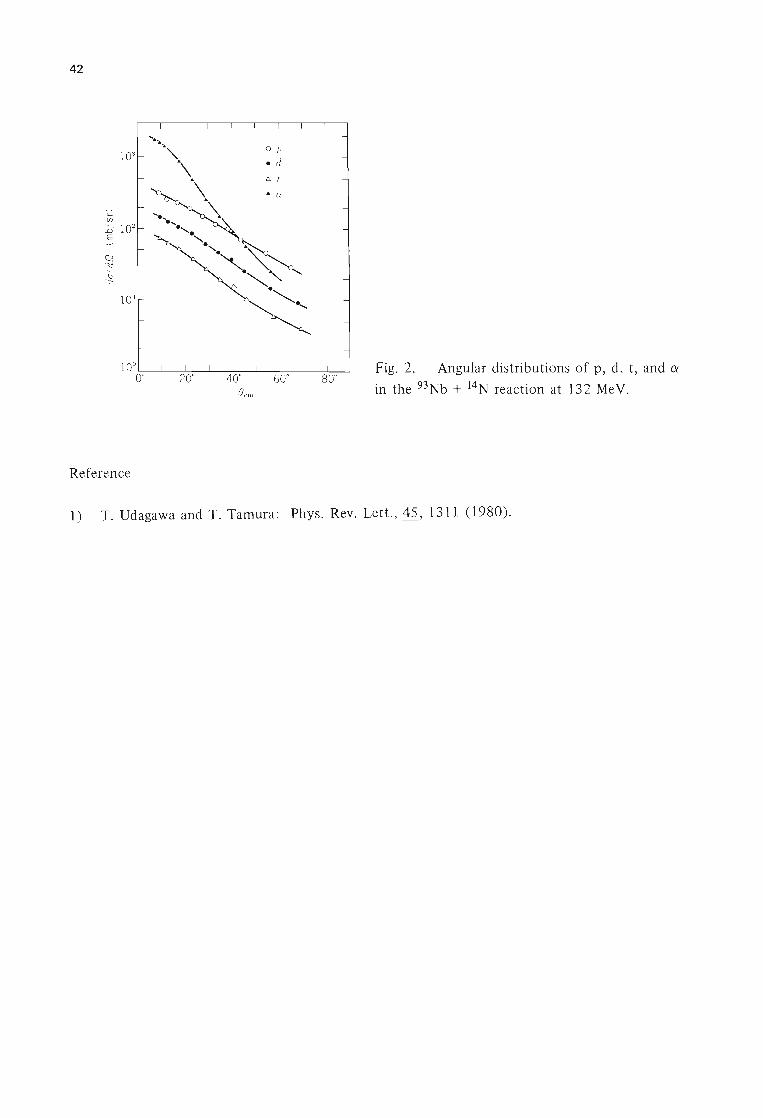
42
Fig. 2. Angular distributions of p, d, t, and C\'
in the 93Nb + 14N reaction at 132 MeV.
Reference
1) T. Udagawa and T. Tamura: Phys. Rev. Lett., 45, 1311 (1980).
43
111-1-10. Alpha Particle vs. Eiectile Correlations
in the 93Nb + 14N Reaction at 208 MeV
M. Ishihara, T. Fukuda,* M. Tanaka,** H. Ogata,***
I. Miura,*** T. Shimoda,* and K. Katori*
[
NUCLEAR REACTION 93Nct4N, aX) with X = Li - 0, E = 208 MeV; ]
measured correlations between a and X.
The present note is to report on the correlation between alpha particles and ejectiles measured
in the heavy ion reaction 93Nb + 208 MeV 14N. A large number of experiments on such
correlations have been reported for various reactions, being followed by suggestions of different
mechanisms to account for the phenomena. The accumulated data now indicate two types of
mechanisms to be significant for the correlation observed. The first is a sequential emission of
alpha particles from excited ejectiles produced in the primary heavy ion reaction.1) The second
bears a feature of direct ternary process and is argued2 ) to have characteristic behaviour of cross
sections as described by the factorized form
where subscripts I and 2 refer to ejectile and alpha particle, respectively. The important property
involved in this formula is that the energy and angular dependence of each of the coincident
particles are identical with those of singles. This particular property involved a conjecture that the
direct-like mechanism may consist of a two-step process, i.e., the projectile breakup followed by
deep-inelastic-type reaction.
The primary aim of the present work is to obtain further information on the direct-like
process. In the experiments so far performed, the counter for ejectiles was usually placed at
forward angles. This resulted in significant contamination of the ejectile-decay component in the
observed spectra so that the validity of (1) is hard to be tested. In the present measurement, the
correlation has been observed for three ejectile angles, 22°, 50°, and 80°. For the data of the
backward angles, 50° and 80°, the kinematic conditions allowed to isolate the two components
fairly well. Moreover, the present data provides extended information on the direct-like process
over a wider angular range.
The experiment was performed using 14N ions from the RCNP cyclotron at Osaka University.
The alpha particles and ejectiles were detected in coincidence using conventional Si-detector
telescopes. The energy and angular correlations were recorded. A detailed report on the
experiment will be published elsewhere. Here we only describe some of the characteristic features
of the experimental results.
* Department of Physics, Osaka University. ** Kobe Tokiwa Junior College.
*** Research Center for Nuclear Physics, Osaka University.
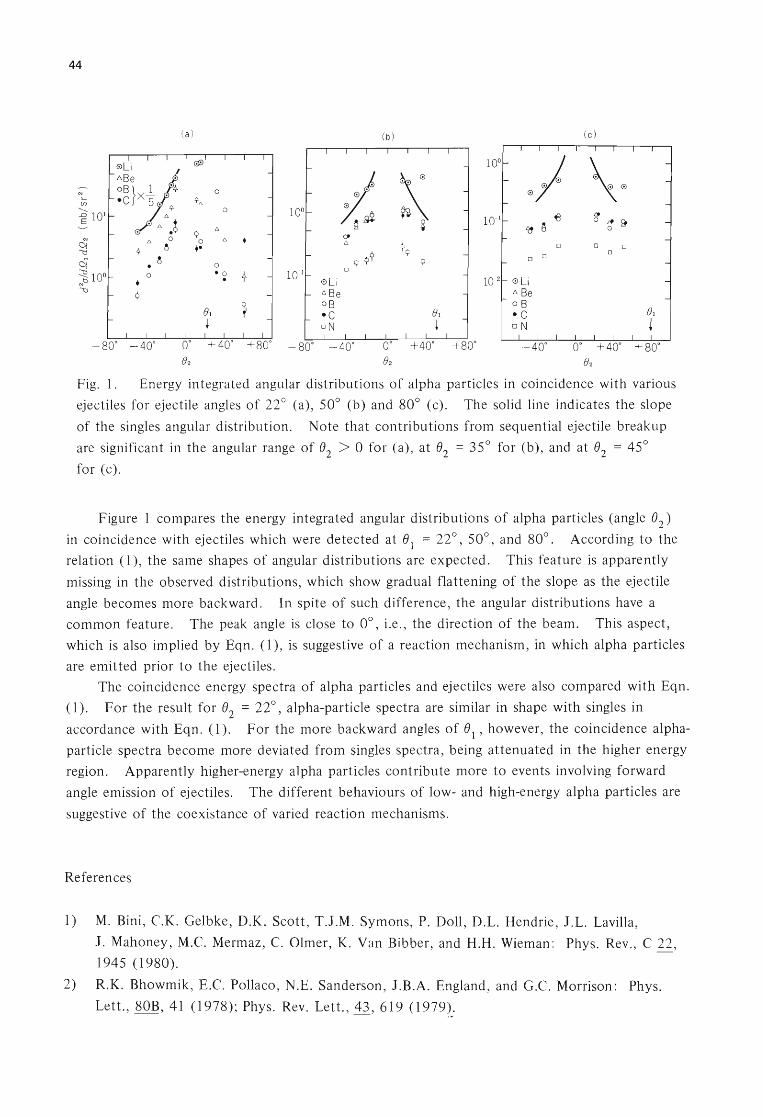
44
(a)
1 1
-
-
-
-
-
Bl ~ + -
1 1 1 1 1 1 1 1
- 80 0 - 40 0
( b )
1 1 I I I I I
-
10-1 -0 L i
- l\ Be oB
I-- -C oN 1 1
- 80 0 _ 40 0
-
-
-
-
-
-
1 I
+ 40 0 +80 0
o 0
10-2 - 0 Li l\ Be
I-- 0 B
- C o N
o
I I I
- 400
(e)
o o o
00 +40 0 +80 0
B2
-
-
-
-
Fig. 1. Energy integrated angular distributions of alpha particles in coincidence with various
ejectiles for ejectile angles of 22° (a), 50° (b) and 80° (c). The solid line indicates the slope
of the singles angular distribution. Note that contributions from sequential ejectile breakup
are significant in the angular range of 82
> 0 for (a) , at 82
= 35° for (b), and at 82
= 45°
for (c).
Figure 1 compares the energy integrated angular distributions of alpha particles (angle 82
)
in coincidence with ejectiles which were detected at 81 = 22°, 50°, and 80°. According to the
relation (1), the same shapes of angular distributions are expected. This feature is apparently
missing in the observed distributions, which show gradual flattening of the slope as the ejectile
angle becomes more backward. In spite of such difference, the angular distributions have a
common feature. The peak angle is close to 0°, i.e., the direction of the beam. This aspect,
which is also implied by Eqn. (1), is suggestive of a reaction mechanism, in which alpha particles
are emitted prior to the ejectiles.
The coincidence energy spectra of alpha particles and ejectiles were also compared with Eqn.
(1). For the result for 82
= 22°, alpha-particle spectra are similar in shape with singles in
accordance with Eqn. (1). For the more backward angles of 81 , however, the coincidence alpha
particle spectra become more deviated from singles spectra, being attenuated in the higher energy
region. Apparently higher-energy alpha particles contribute more to events involving forward
angle emission of ejectiles. The different behaviours of low- and high-energy alpha particles are
suggestive of the coexistance of varied reaction mechanisms.
References
1) M. Bini, C.K. Gelbke, D.K. Scott, T.J.M. Symons, P. Doll , D.L. Hendrie , J.L. Lavilla,
J. Mahoney, M.C. Mermaz, C. Olmer, K. Van Bibber, and H.H. Wieman: Phys. Rev., C 22,
1945 (1980).
2) R.K. Bhowmik, E.C. Pollaco, N.E. Sanderson, J.B.A. England, and G.C. Morrison: Phys.
Lett., 80B, 41 (1978); Phys. Rev. Lett. , 43, 619 (1979J:
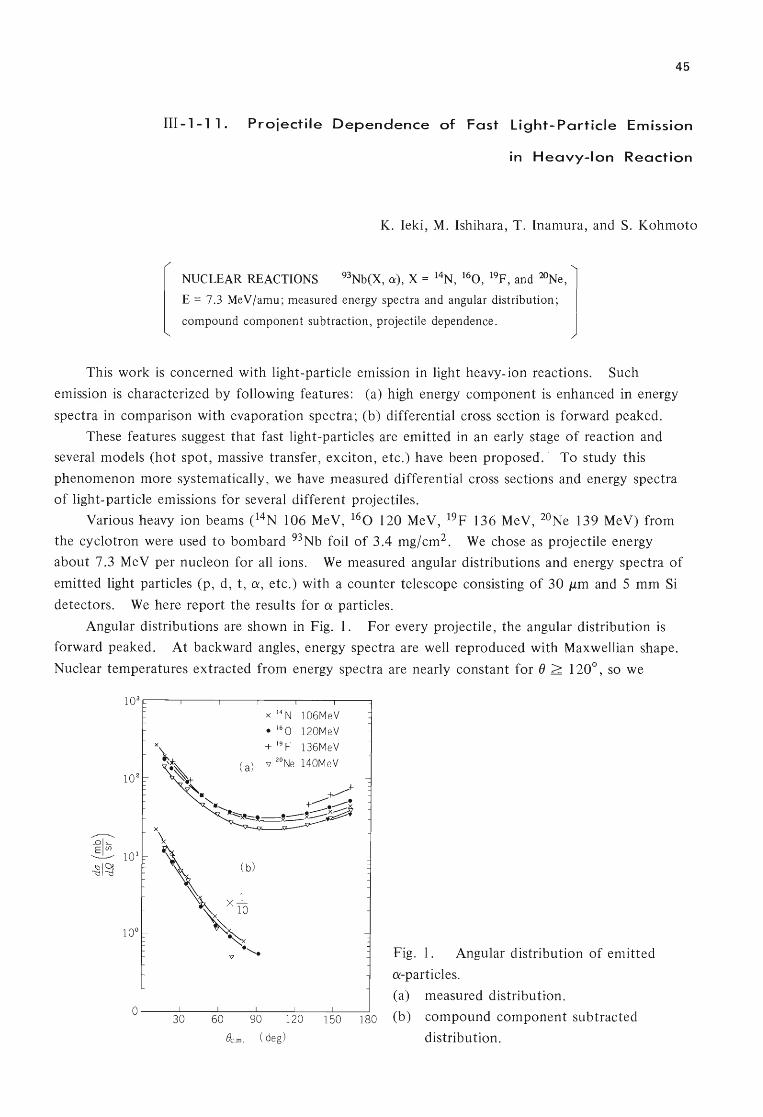
45
III -1-11. Proiectile Dependence of Fast Light-Particle Emission
in Heavy-Ion Reaction
K. Ieki, M. Ishihara, T. Inamura, and S. Kohmoto
[
NUCLEAR REACTIONS 93Nb(X, a), X = 14N, 160, 19p, and 2ONe, 1 E = 7.3 MeV/amu; measured energy spectra and angular distribution;
compound component subtraction, projectile dependence.
This work is concerned with light-particle emission in light heavy-ion reactions. Such
emission is characterized by following features: (a) high energy component is enhanced in energy
spectra in comparison with evaporation spectra; (b) differential cross section is forward peaked.
These features suggest that fast light-particles are emitted in an early stage of reaction and
several models (hot spot, massive transfer, exciton, etc.) have been propose-a-: - To study this
phenomenon more systematically, we have measured differential cross sections and energy spectra
of light-particle emissions for several different projectiles.
Various heavy ion beams (14N 106 MeV, 160 120 MeV, 19F 136 MeV, 20Ne 139 MeV) from
the cyclotron were used to bombard 93Nb foil of 3.4 mg/cm2. We chose as projectile energy
about 7.3 MeV per nucleon for all ions. We measured angular distributions and energy spectra of
emitted light particles (p, d, t, a, etc.) with a counter telescope consisting of 30 11m and 5 mm Si
detectors. We here report the results for a particles.
Angular distributions are shown in Fig. 1. For every projectile, the angular distribution is
forward peaked. At backward angles, energy spectra are well reproduced with Maxwellian shape.
Nuclear temperatures extracted from energy spectra are nearly constant for e > 1200, so we
--;;--1 '-E(/) ~
x
X 14 N 106MeV
• 16 0 120MeV
+ 19F 136MeV
( a) v zONe 140MeV
\
\ (b)
\\: ~. v '. Fig. 1. Angular distribution of emitted
a-particles.
(a) measured distribution. o '-----.-J3o~---l60--9-L.O-----'-------1...L50--1......J80 (b) compound component subtracted
Bc.m. ( deg ) distribution.
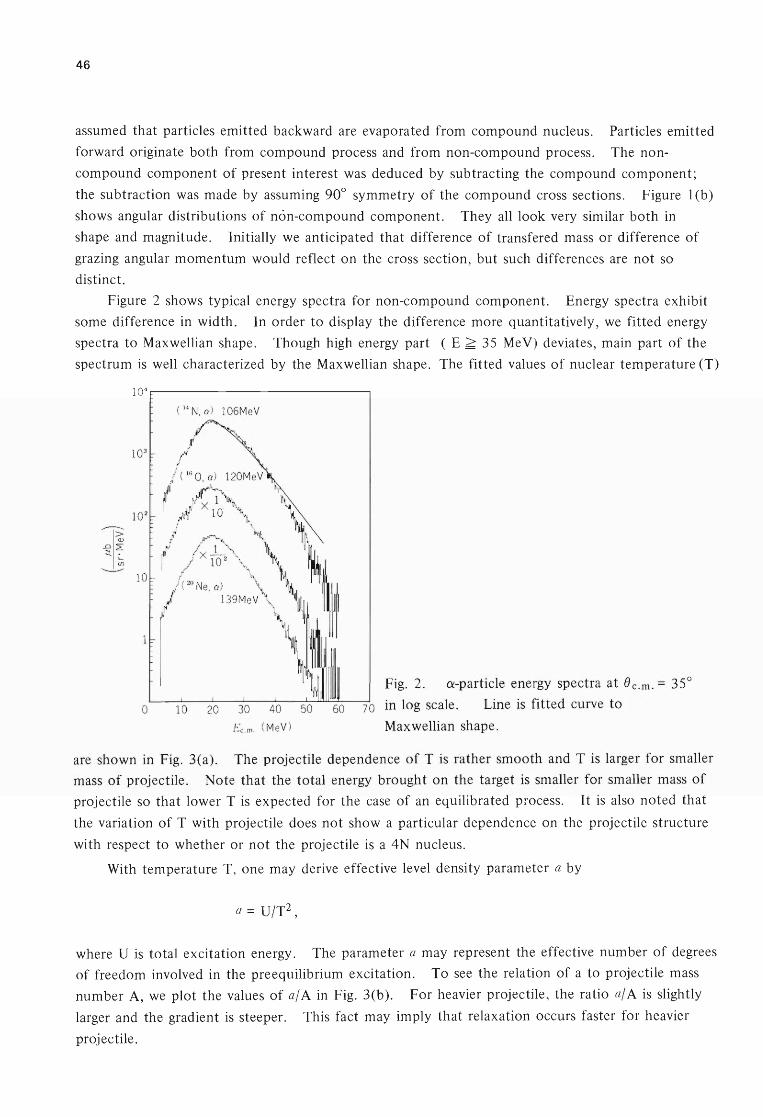
46
assumed that particles emitted backward are evaporated from compound nucleus. Particles emitted
forward originate both from compound process and from non-compound process. The non
compound component of present interest was deduced by subtracting the compound component;
the subtraction was made by assuming 90° symmetry of the compound cross sections. Figure 1 (b)
shows angular distributions of non-compound component. They all look very similar both in
shape and magnitude. Initially we anticipated that difference of transfered mass or difference of
grazing angular momentum would reflect on the cross section, but such differences are not so
distinct.
Figure 2 shows typical energy spectra for non-compound component. Energy spectra exhibit
some difference in width. In order to display the difference more quantitatively, we fitted energy
spectra to Maxwellian shape. Though high energy part (E ~ 35 MeV) deviates, main part of the
spectrum is well characterized by the Maxwellian shape. The fitted values of nuclear temperature (T)
1 04~------------------------~
( 14 N, 0 ) 106M eV
10
Fig. 2. ~-particle energy spectra at 8c .m . = 35°
o 10 20 30 40 60 70 in log scale. Line is fitted curve to
Ec.m. (MeV) Maxwellian shape.
are shown in Fig. 3(a). The projectile dependence of T is rather smooth and T is larger for smaller
mass of projectile. Note that the total energy brought on the target is smaller for smaller mass of
projectile so that lower T is expected for the case of an equilibrated process. It is also noted that
the variation of T with projectile does not show a particular dependence on the projectile structure
with respect to whether or not the projectile is a 4N nucleus.
With temperature T, one may derive effective level density parameter a by
a = U/T2 ,
where U is total excitation energy. The parameter a may represent the effective number of degrees
of freedom involved in the pre equilibrium excitation. To see the relation of a to projectile mass
number A, we plot the values of a/ A in Fig. 3(b). For heavier projectile, the ratio a/ A is slightly
larger and the gradient is steeper. This fact may imply that relaxation occurs faster for heavier
projectile.
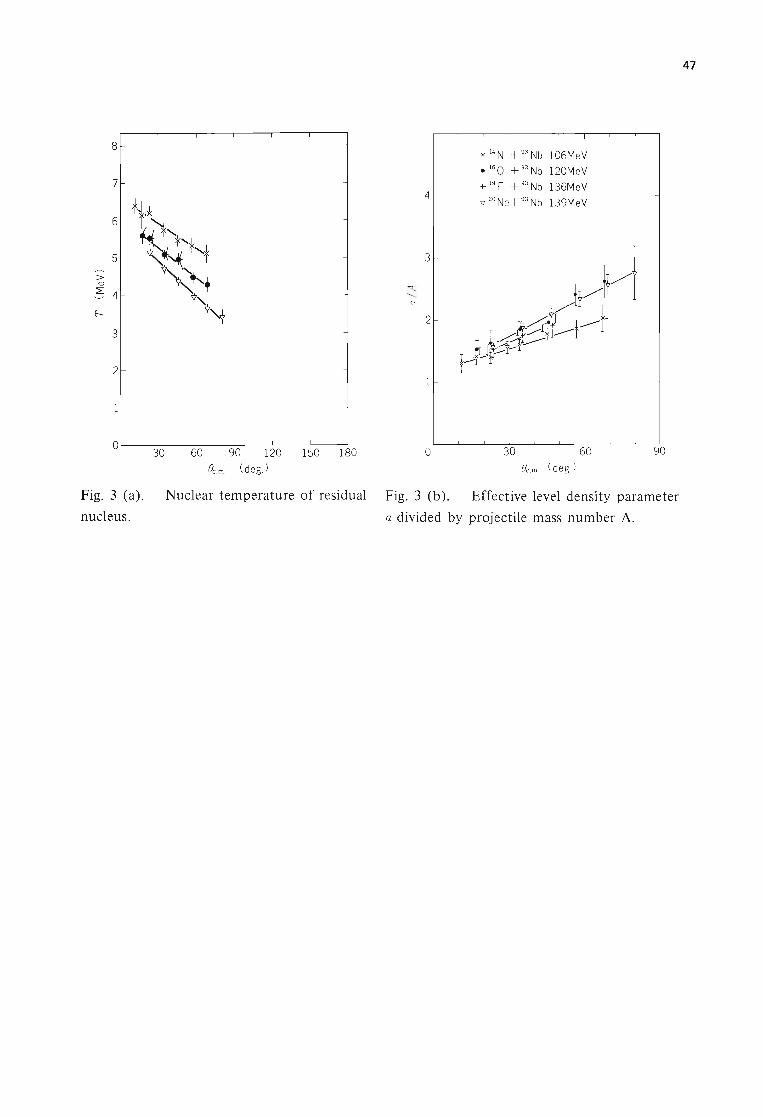
> Q)
81-
7
6
5
I
-
2: 4
h
3
21-
11-
O il I L----3Lo--~60----9~0~--1~20~--15~0~-1~80
Bc.m. (degJ
41-
3r-
2r-
11-
o
I I
X 14 N + 93 Nb 1 06Me V
• 16 0 + 93 Nb 120MeV
+ 19 F + 93 Nb 136MeV
'V 2° Ne+ 93 Nb 139MeV
I
30
Bc .rn.
I
60
( deg)
-
90
Fig. 3 (a). Nuclear temperature of residual Fig. 3 (b). Effective level density parameter
nucleus. a divided by projectile mass number A.
47
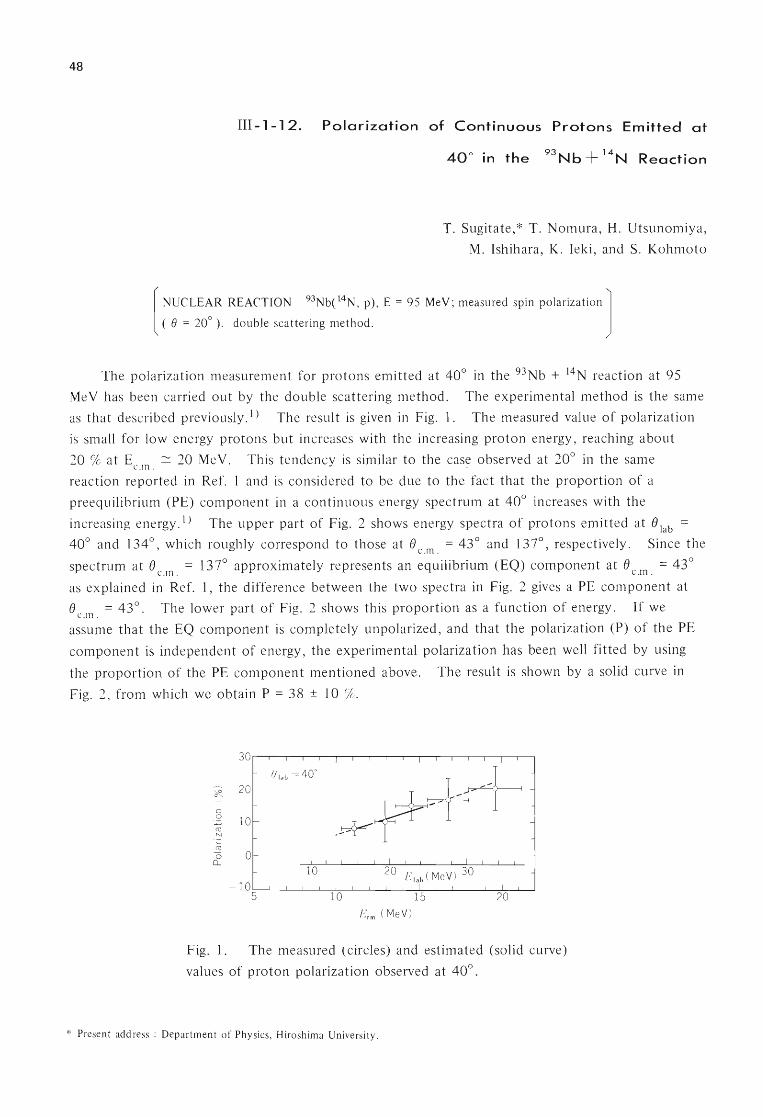
48
III-1-12. Polarization of Continuous Protons Emitted at
40° in the 93 Nb + 14N Reaction
T. Sugitate,* T. Nomura, H. Utsunomiya,
M. Ishihara, K. Ieki, and S. Kohmoto
[
NUCLEAR REACTION 93Nbct4N , p), E = 95 MeV; measured spin polarization J ( e = 20° ). double scattering method.
The polarization measurement for protons emitted at 40° in the 93Nb + 14N reaction at 95
Me V has been carried out by the double scattering method. The experimental method is the same
as that described previously. 1) The result is given in Fig. 1. The measured value of polarization
is small for low energy protons but increases with the increasing proton energy, reaching about
20 % at E ~ 20 Me V. This tendency is similar to the case observed at 20° in the same C. In . .
reaction reported in Ref. I and is considered to be due to the fact that the proportion of a
preequilibrium (PE) component in a continuous energy spectrum at 40° increases with the
increasing energy . I) The upper part of Fig. 2 shows energy spectra of protons emitted at e lab
40° and 134°, which roughly correspond to those at e = 43° and 137°, respectively. Since the C.In.
spectrum at e = 137° approximately represents an equilibrium (EQ) component at e = 43° C.In . C.In.
as explained in Ref. 1, the difference between the two spectra in Fig. 2 gives a PE component at
e = 43°. The lower part of Fig. 2 shows this proportion as a function of energy . If we C.In .
assume that the EQ component is completely unpolarized , and that the polarization (P) of the PE
component is independent of energy, the experimental polarization has been well fitted by using
the proportion of the PE component mentioned above. The result is shown by a solid curve in
Fig. 2, from which we obtain P = 38 ± 10 %.
30
B lab = 400
.~F++ ~ 20
c 0 10 CO N
CO
0 0 I I I n... I I I I I I
10 20 ( 30 -10
E l ab MeV)
5 10 15 20 J:'cm ( MeV)
Fig. 1. The measured (circles) and estimated (solid curve)
values of proton polarization observed at 40°.
* Present address: Department of Physics, Hiroshima University.
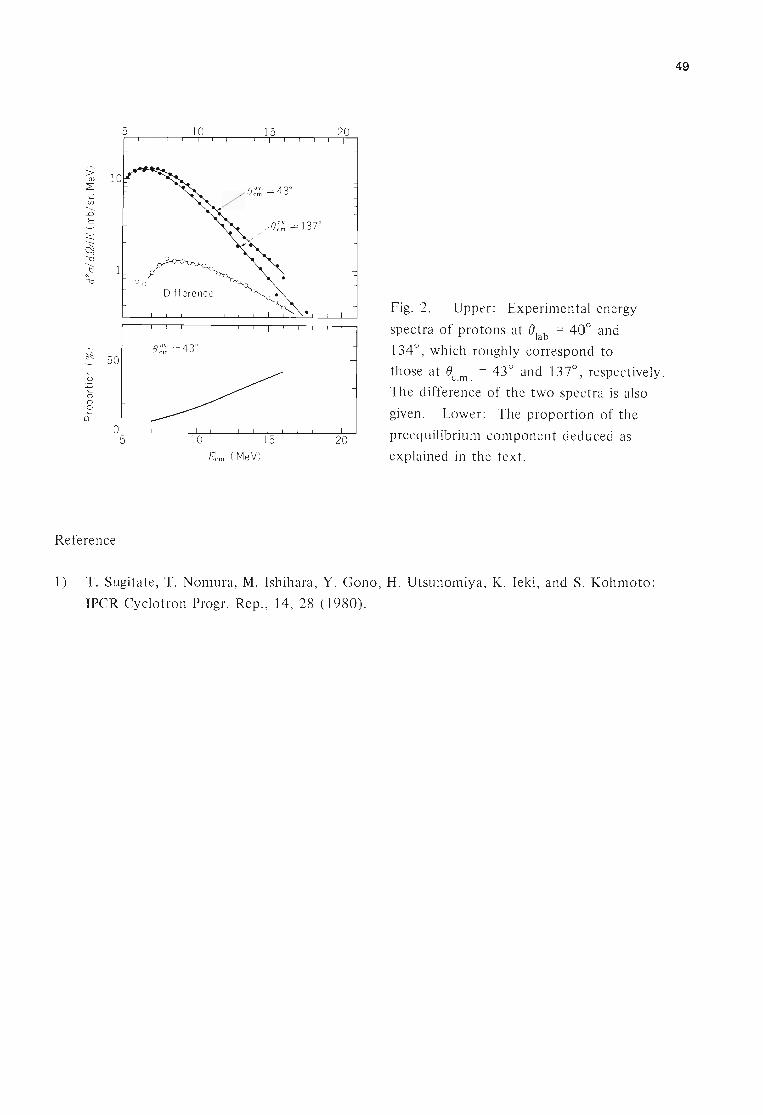
5
:; Q)
z: ....: en
-------..0 E
ltl (j q (j
-------Nt::> (j
~ 50-c: 0
0 0.. 0
D-
O 5
Reference
e:~' = 137"
I I I
8:~'=43°
~ I I
10 15
Ecm ( MeV)
I
I
20
-
Fig. 2. Upper: Experimental energy
spectra of protons at Blab = 40° and
134 0 , which roughly correspond to
those at Be .m . = 43° and 137°, respectively .
The difference of the two spectra is also
given . Lower: The proportion of the
preequilibrium component deduced as
explained in the text.
1) T . Sugitate, T. Nomura, M. Ishihara, Y. Gono , H. Utsunomiya, K. Ieki, and S. Kohmoto:
IPCR Cyclotron Progr. Rep. , 14, 28 (1980) .
49
50
III -1-13. light-Particle Emission Following 7li-lnduced Reactions
H. Utsunomiya, S. Kubono, * M. Tanaka, *
K. Morita,* M. Sugitani,* and T. Nomura
[
N~CLEAR REACT~ON 93NbC~i, x), 159TbC Li, x), 232ThCLi, X)'] E - 49,77 MeV, x - p, d, t, a, f, measured aCE, 8), angular
correlations.
The light-particle emission has been studied in 7Li-induced reactions on 93Nb, 159Tb, and
232Th targets. The experiment has been carried out at beam energy of 49 Me V at Riken and of
77 Me V at Institute for Nuclear Study. The following measurements have been done: 1) energy
and angular distributions of protons, deuterons, tritons and 0' particles measured between 20° and
160°; 2) angular correlations of two light particles emitted at forward angles (mainly between 20°
and 50°); 3) angular correlations between light particles and fission fragments in order to study
angular-momentum transfer and alignment in the case of 232Th target.
The analysis of the experimental results is now in progress.
* Institute for Nuclear Study , University of Tokyo.

51
III - 1 - 14. Influence of Chemical Environment on Outer-Shell
Internal Conversion in 119Sn
H. Muramatsu, T. Miura, H. Nakahara, M. Fujioka,
E. Tanaka, * and A. Hashizume
[
RADIOACTIVITY 119Sb ; measured E , I ; deduced Chemical] ce ce
effect, O/N l ' 5s electron density , CaSn03, white tin.
Iron free magnetic spectrometer. Enriched targets.
In a number of experiments 1) chemical states have been shown to affect the rate of radioactive decay . These
effects are related with the sum of electron densities of several electron orbitals near the nucleus, that is , with the
so-called electron contact densities. However, quantitative analysis of these results is almost impossible because of
the lack of knowledge of the effects of chemical binding on the related electron wave functions. On the other hand,
observations of the internal conversion probabilities of the outermost shell electrons give more direct information
on the effects of chemical binding on each individual electron wave function. Chemical effects on internal
conversions of the outermost shell electrons was investigated by several groups in the past. 2 )
For experiments of this type with a high resolution beta-ray spectrometer, it is necessary that the transition
energy is less than about 50 keVin order for the conversion line due to the electrons in the outermost shell to be
separated from that due to the electrons in the next-inner shell. This requirement comes from the fact that the
best momentum resolution of the spectrometer is about 0.05 % in this energy region and the energy difference
between the conversion line of the outermost shell electrons and that of the next-inner shell electrons is 137 eV.
It is also preferable that the transition multipolarity is that of a magnetic dipole (M 1) since such conversion can be
interpreted simply in terms of the s-orbital electron density. Therefore , we chose the 23.87 keY Ml transition
of 119Sn that follows decay of 119Sb (T 1/2 = 38.1 h) in our investigations. In this case , the energy of the
conversion electron is so low and energy losses of such electrons are considerably large that high resolution
measurements of the conversion electron spectra become extremely difficult , and the most essential problem is how
to prepare a source sufficiently thin, e.g. 10 J1.g/cm 2.
Internal conversion sources with different chemical environments , namely, white tin and CaSn03
, were
prepared by the implantation of 119Sb using the electromagnetic isotope separator at Tohoku University. The
119Sb was obtained by the milking method from 119mTe produced by proton irradiation of the natural antimony at
AYF cyclotron of Tohoku University. Implantation of the radioactive 119Sb was carried out at the terminal
potential of 20 kV at room temperature. The dose rate was ~ 107 atoms/cm2 for the mass number 119. From
the radioactivity of the implanted sample, the number of implanted 119Sb atoms was determined to be :::; 10 12
atoms/cm2 . In order to identify the final chemical state of the samples , emission Mossbauer spectra were measured
with a CaSn03
absorber at 77 and 150 K.
Measurement of conversion electron spectra was made with a 50 cm, double focusing, iron-free beta-ray
spectrometer at the Riken. A resolution of 0.14 % in momentum (full width at half maximum measured at LI
line of the 23.87 keY transition) was achieved with a 1 mm X 20 mm source and 1 mm X 20 mm final detector
aperture. The detector was a gas-flow proportional counter with a thin polypropylene window ('" 100 J1.g/cm 2 ).
All the conversion lines of the 23.87 keY transition were measured. In Fig. 1 there are shown the conversion
electron spectra in the region of Nand 0 lines from sources of white tin and CaSn03. The spectra have been
normalized to equal Nr line intensity and K-LM Auger lines of tin are also shown. The NI line and 0 lines with
the energy difference of 137 e V could be clearly resolved from each other. The relative intensities of the Nand
o lines were evaluated using the computer code, ACSEMp3) whose function essentially a least-squares analysis
* Faculty of Science, Tohoku University.
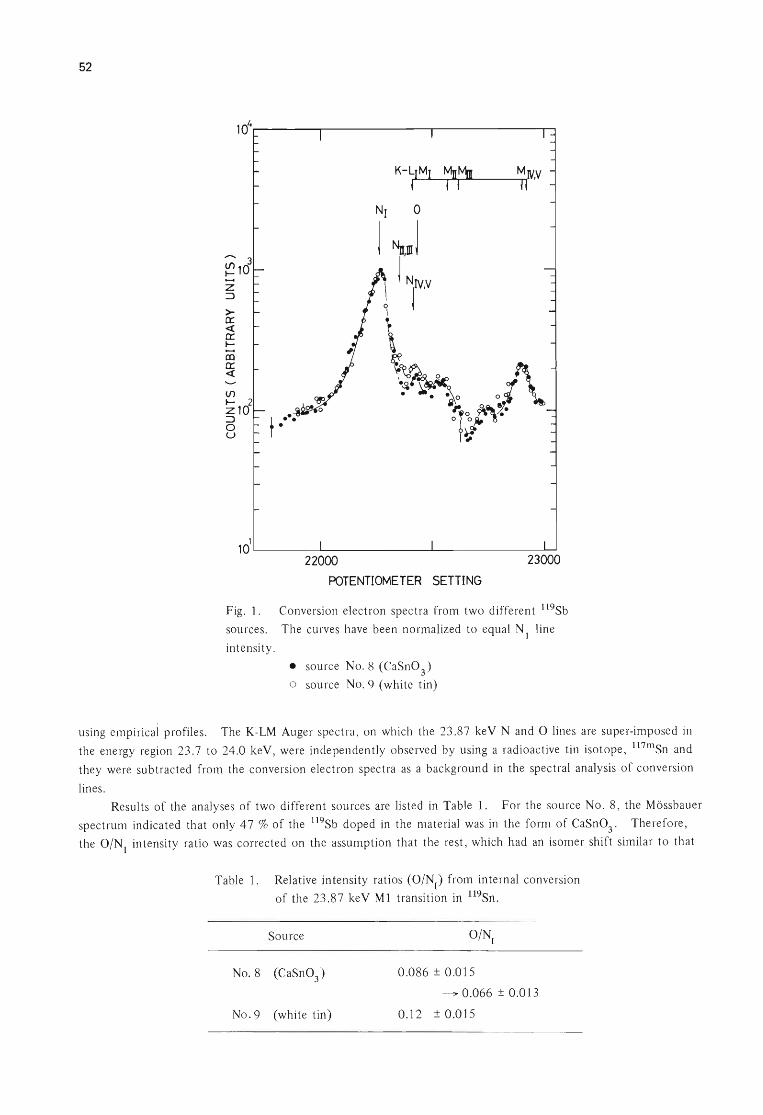
52
104
K-LIMI ~ ~~ I
MIV,V 1I
Nr 0
-- 3 J ~mJ
~10 iNr z =>
0 > I ex:
~ <{ ex: \ ~ -CD
~~ '\ 0:: <{
(/') ~ ':~~O l
~ 2 z10 ~o ~~ ~,e. => t •••• o !Oo~ • 0 u 1'.-]
1 10~------~------------~------------~
22000 23000
POTENTIOMETER SETTING
Fig. 1. Conversion electron spectra from two different 119Sb
sources. The curves have been normalized to equal N 1 line
intensity.
• source No.8 (CaSn03
)
o source No.9 (white tin)
using empirical profiles. The K-LM Auger spectra , on which the 23.87 keY Nand 0 lines are super-imposed in
the energy region 23.7 to 24.0 keY, were independently observed by using a radioactive tin isotope, f17mSn and
they were subtracted from the conversion electron spectra as a background in the spectral analysis of conversion
lines.
Results of the analyses of two different sources are listed in Table 1. For the source No.8, the Mbssbauer
spectrum indicated that only 47 % of the 119Sb doped in the material was in the form of CaSn03
. Therefore ,
the O/Nr intensity ratio was corrected on the assumption that the rest, which had an isomer shift similar to that
Table 1. Relative intensity ratios (O/Nr) from internal conversion
of the 23.87 keY Ml transition in 119Sn.
Source
No.9 (white tin)
0.086 ± 0.015
~ 0.066 ± 0.013
0.12 ± 0.015
53
of white tin, was of the chemical composition of the source No.9. If the effects of the change in the 5s electron
density on the inner s-electron densities are small , one can deduce the 5s electron density at the nucleus from the
observed O/NI
ratios by using the formula
where \ l/J (0)5 \2 is the 5s electron density at the nucleus for the chemical medium x and \ l/J (0)4 \2 is the 4s 5 X 5
electron density of the tin atom. We adopted a value of 719 a.u. for the \l/J (0)45 \2 reported by Band et a1.4)
who carried out relativistic Dirac-Fock calculations for the tin atom and ions. The difference in the 5s electron
density between white tin and CaSn03
is then evaluated as
Ll 1 ¢ ( 0 ) 55 12 = 1 ¢ ( 0 ) 55 1 ~asno 3 - I ¢ ( 0 ) 5 s 1 ;n
= - 38 a . u.
This result shows that the presence of more electrophilic oxgen atoms around the tin atoms causes the reduction
of the valence s-electrons in the tin atom. The change of the lifetime of the 23.87 keV level is also calculated
to be about 0 .12 %, that is , the lifetime of the 23.87 keV state of 119Sn in CaSn03
is expected to be about 0.1 2 % longer than that of white tin.
References
1) See , for example , R .F. Leininger , F. Segre , and C. Wiegand : Phys. Rev. , 76 , 897 (1949);~, 280 (1951) .
2) See, for example , I.-P. Bocquet, Y.Y. Chu, O.C. Kistner , M.L. Perlman , and G.T. Emery: Phys. Rev. Lett. ,
12, 809 (1966); T.A. Carlson, P. Erman , and K. Franson: Nucl. Phys., AlII, 371 (1968).
3) M. Fujioka and M. Takashima: I. Phys., 40 , C2-32 (1979).
4) I.M. Band and V.I. Fomichev: Atomic Data and Nuclear Data Tables , 23, No.4 , p. 295 (1979).
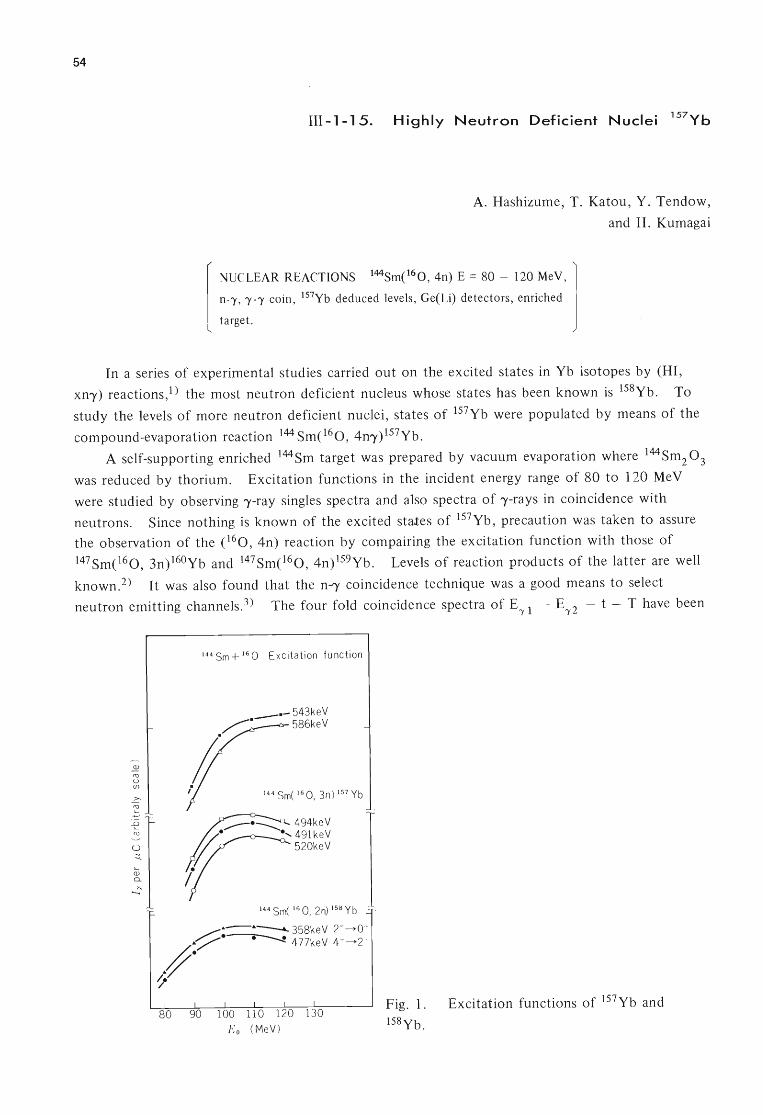
54
111-1-15. Highly Neutron Deficient Nuclei 157Yb
A. Hashizume, T. Katou, Y. Tendow,
and H. Kumagai
[
NUCLEAR REACTIONS 144Smct6 0, 4n) E = 80 - 120 MeV, 1 n-'Y, 'Y-'Y coin, 157Yb deduced levels, Ge(Li) detectors, enriched
target.
In a series of experimental studies carried out on the excited states in Yb isotopes by (HI,
xn'Y) reactions,1) the most neutron deficient nucleus whose states has been known is 158Yb. To
study the levels of more neutron deficient nuclei, states of 157Yb were populated by means of the
compound-evaporation reaction 144 Sme60, 4n'Y)157Yb.
A self-supporting enriched 144Sm target was prepared by vacuum evaporation where 144Sm2 03
was reduced by thorium. Excitation functions in the incident energy range of 80 to 120 MeV
were studied by observing 'Y-ray singles spectra and also spectra of 'Y-rays in coincidence with
neutrons. Since nothing is known of the excited states of 157Yb, precaution was taken to assure
the observation of the e60, 4n) reaction by compairing the excitation function with those of
147Smct60, 3n) 160Yb and 147Smct60, 4n)159Yb. Levels of reaction products of the latter are well
known.2) It was also found that the n-')' coincidence technique was a good means to select
neutron emitting channels. 3) The four fold coincidence spectra of E-y 1 - E-Y2 - t - T have been
~ cu u (j)
-e cu
144 Sm + 16 ° Excitation function
____ - 543keV
~- 586keV
II ,. 144 Sm( 160, 3n) 157 Yb
~.--....... 494keV
//. ., 491keV V / 520keV
i 144 Sm( 160, 2n) 158 Yb
~-A--""'358keV 2+-0+ ~.~ 477keV 4+-2+
.I" ~.
Eo (MeV )
Fig. 1.
158Yb. Excitation functions of 157Yb and

55
measured where E')'l and E')'2 are the 'Y-ray energies , t is the time between two 'Y-rays, and T is the
time from a natural bunched beam of the cyclotron.
Figure 1 shows excitation function for the cI60 , 3n'Y) reaction observed with some 'Y-rays and
Fig. 2 shows a spectrum of 'Y-rays coincident with neutrons when 144Sm was bombarded by 100
MeV 160. As shown in Fig. 2, three intense 'Y-rays, 491 , 543, and 586 keY , which coincide with
neutrons were observed. When the gate was opened by 491 keY in 'Y-'Y coincident spectrum,
those 'Y-rays coincide as shown in Fig. 3. It was also shown that all of those 'Y-rays are emitted
in coincidence.
6000~----------------------------------------------------------------~
..92 <U U (f)
(1)
>
~ 4000
(1)
c C <U ~ U
~ 2000 0..
2 c :::J o
U
...0 >-'" '" 00 """ LO m (Y'") (Y'")
I
...0 >-r- ...0 '" >-
r-
'" (Y'")
""" LO
j
...0 ...0 >-~~ ~ <:'0 moo <..OLD
TI
144 Sm + 160 ( lOOMeV) n- y coincidence
OLL--------------~5~070--------------~1~0~070 --------------~1~50~0~--------~2~000
Channel number
Fig. 2. Spectrum of 'Y-rays which coincides with neutrons.
144 Sm + O( 100 MeV)
..92 <U U (f)
(1)
> :,::; <U
~
(1)
c C <U ~ > u (1)
~ > ~ .---< (1)
0.. m -"". >
""" (Y'") (1)
~ ~
""" c 2 LO <..0 :::J cu 00 0
(9 LD U
Channel nu mber
Fig. 3. 'Y-'Y coincidence spectrum gated by the 491 ke V 'Y-ray.
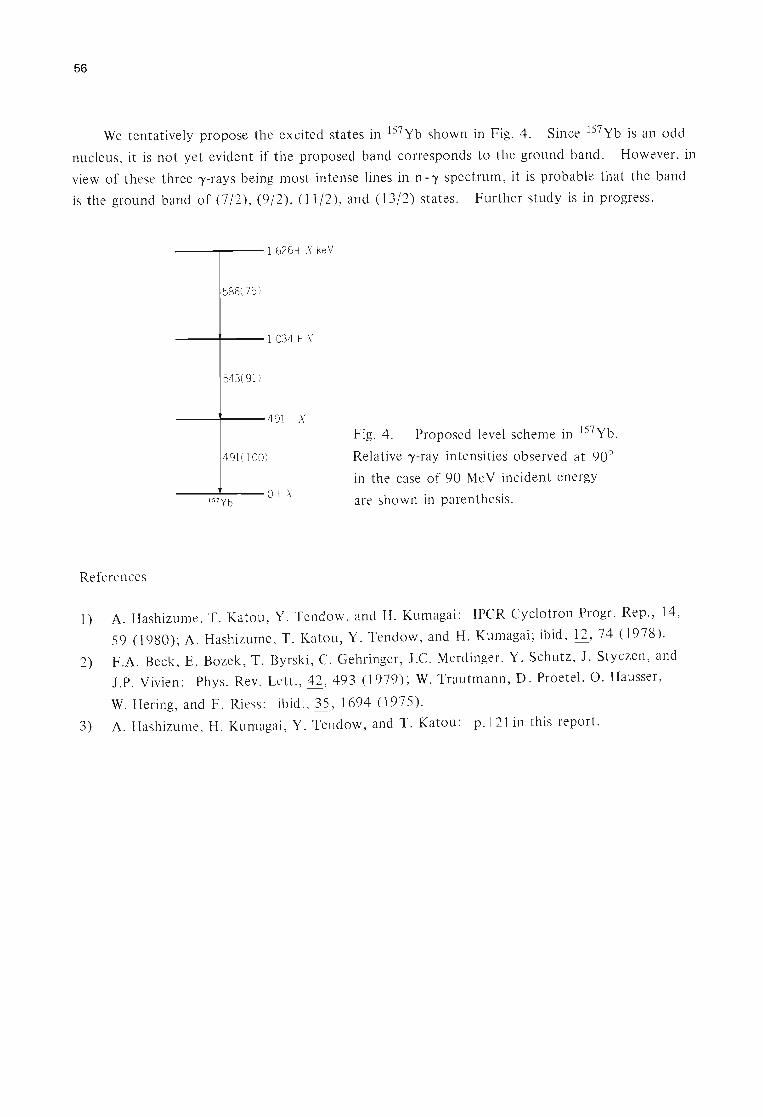
56
We tentatively propose the excited states in 157 Yb shown in Fig. 4. Since 157Yb is an odd
nucleus, it is not yet evident if the proposed band corresponds to the ground band. However, in
view of these three ,),-rays being most intense lines in n - ')' spectrum , it is probable that the band
is the ground band of (7/2), (9/2), (11/2), and (13/2) states. Further study is in progress.
586( 75 )
543( 91 )
491(100)
157 Yb
References
1 626 + X keV
1 034 + X
491+X
O+ X
Fig. 4. Proposed level scheme in lS7Yb.
Relative ')'-ray intensities observed at 90°
in the case of 90 MeV incident energy
are shown in parenthesis.
1) A. Hashizume, T. Katou, Y. Tendow , and H. Kumagai: IPCR Cyclotron Progr. Rep. , 14,
59 (1980) ; A. Hashizume, T. Katou, Y. Tendow , and H. Kumagai; ibid , !l, 74 (1978).
2) F.A. Beck , E. Bozek , T. Byrski , C. Gehringer, J.C. Merdinger , Y. Schutz , 1. Styczen, and
J.P. Vivien: Phys. Rev. Lett. , 42, 493 (1979); W. Trautmann, D. Proetel , O. Hausser,
W. Hering, and F . Riess: ibid., 35,1694 (1975).
3) A. Hashizume, H. Kumagai, Y. Tendow, and T. Katou: p.121in this report.
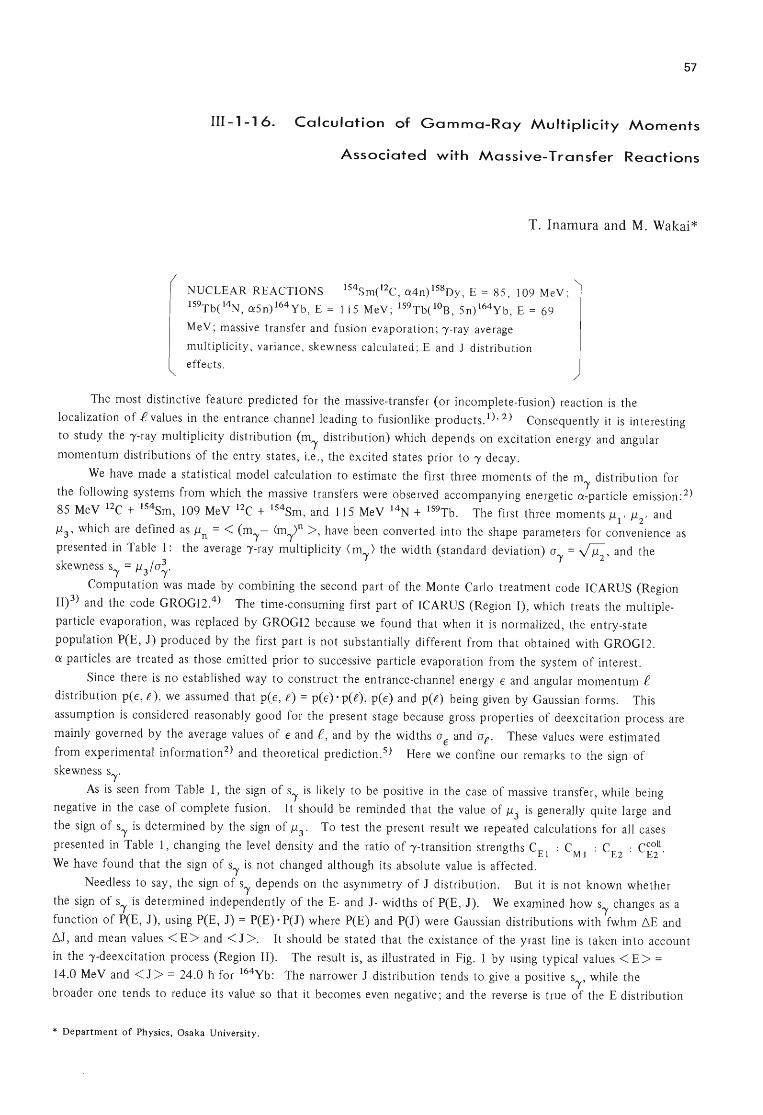
57
III-1-16. Calculation of Gamma-Ray Multiplicity Moments
Associated with Massive-Transfer Reactions
T. Inamura and M. Wakai*
NUCLEAR REACTIONS 154Sm(12C, a4n)158Dy , E = 85 , 109 MeV ;
159Tbe4N, a5n)164 yb , E = 115 MeV ; 159 Tb( lOB, 5n)164yb , E = 69
Me V; massive transfer and fusion evaporation ; ,-ray average
multiplicity, variance , skewness calculated ; E and J distribution
effects.
The most distinctive feature predicted for the massive-transfer (or incomplete-fusion) reaction is the
localization of .e values in the entrance channel leading to fusionlike products. I) , 2) Consequently it is interesting
to study the ,-ray multiplicity distribution (m')' distribution) which depends on excitation energy and angular
momentum distributions of the entry states, i.e. , the excited states prior to , decay.
We have made a statistical model calculation to estimate the first three moments of the m, distribution for
the following systems from which the massive transfers were observed accompanying energetic a-particle emission: 2)
85 MeV 12C + I54Sm, 109 MeV 12C + 154Sm, and 115 MeV 14N + I59Tb. The first three moments J.1I
' J.12
' and
J.13
, which are defined as J.1n = < (m,- <m,)O >, have been converted into the shape parameters for convenience as
presented in Table 1: the average ,-ray multiplicity < m,) the width (standard deviation) a, = vf"ii;, and the
skewness s, = J.1 3 / a~. Computation was made by combining the second part of the Monte Carlo treatment code ICARUS (Region
II)3) and the code GROGI2.4) The time-consuming first part of ICARUS (Region I), which treats the multiple
particle evaporation, was replaced by GROGI2 because we found that when it is normalized , the entry-state
population peE, J) produced by the first part is not substantially different from that obtained with GROGI2.
a particles are treated as those emitted prior to successive particle evaporation from the system of interest.
Since there is no established way to construct the entrance-channel energy E and angular momentum .e distribution peE, f) , we assumed that peE , f ) = p(E)· pee) , peE) and p(f ) being given by Gaussian forms. This
assumption is considered reasonably good for the present stage because gross properties of deexcitation process are
mainly governed by the average values of E and .e, and by the widths a E and af' These values were estimated
from experimental information2 ) and theoretical prediction. 5) Here we confine our remarks to the sign of
skewness sf"
As is seen from Table 1, the sign of s, is likely to be positive in the case of massive transfer , while being
negative in the case of complete fusion. It should be reminded that the value of J.13
is generally quite large and
the sign of s, is determined by the sign of J.13
. To test the present result we repeated calculations for all cases
presented in Table 1, changing the level density and the ratio of ,-transition strengths CE I
: CM
I : CE2
: C~~ll . We have found that the sign of s, is not changed although its absolute value is affected.
Needless to say, the sign of s, depends on the asymmetry of J distribution . But it is not known whether
the sign of s, is determined independently of the E- and J- widths of peE, J). We examined how s, changes as a
function of peE, J), using peE , J) = P(E)· P(J) where peE) and P(J) were Gaussian distributions with fwhm ;0,E and
;0,J, and mean values < E > and < J >. It should be stated that the existance of the yrast line is taken into account
in the ,-deexcitation process (Region II). The result is, as illustrated in Fig. 1 by using typical values < E> = 14.0 MeV and <J > = 24.0 h for I64Yb: The narrower J distribution tends to give a positive Sf' while the
broader one tends to reduce its value so that it becomes even negative; and the reverse is true of the E distribution
* Department of Physics, Osaka University.
58
Table 1. Shape parameters of )'-ray multiplicity distribution for products of massive-transfer
and complete-fusion reactions.
Reaction Product <m)'> 0)' s)'
85 MeV 12C + 154Sma) 158Dy 11.2 2.3 0.12
109 MeV 12C + 154Sma) 158Dy 12.9 2.6 0.07
115 MeV 14N + 159Tb b) 164Yb 14.6 3.1 0.25
69 MeV lOB + 159Tb c) 164Yb 13.7 3.7 - 0.10
115 MeV 14N + 159Tbd) 164Yb 18.4 4.6 - 0.05
a) The transferred fragment is 8Be. b) The transferred fragment is lOB. c) Fusion. The energy of lOB gives the excitation energy of the system that corresponds to the
excitation energy at the most probable energy of a particles emitted in the massive-transfer reaction l59'fb(,4N, a5n)16 4Yb at 115 MeV.
d) Fusion evaporation.
0.4
0.2 >-- .---~
(J) (0)
(E)=14.0 MeV (J) =24.0 n
• (c)
(b) 0.0 !---- -----="'--=---------l
0(0)
-0.2
0.0 0.2 0.4 0.6 0.8 1.0 6.J/(J)
Fig. 1. Dependence of skewness s on the 'Y
entry-state E and J distributions : (a) 6E/<E> =
0.0, (b) 6E/<E> = 0.6 , and (c) 6E/<E> = 0.9.
Solid and open pOints represent s specifically 'Y
calculated for massive transfer and for complete
fusion, respectively (see Table 1): massive
transfer, 159Tbe4N, a5n) 164Yb at 115 MeV
(solid circle), and lS4Sm(12C, a4n)158Dy at
85 MeV (solid triangle) and at 109 MeV (solid
star); fusion, 159Tb(lOB, 5n)164Yb at 69 MeV
(open circle), and 159Tbe4N, a5n)164Yb at
115 MeV (open square).
effect. (These tendencies are enhanced as < J > increases.) Therefore, in general, s)' becomes positive if a e is small and a € is large, i.e., when .e values are localized in the entrance channel whose energy distribution is broad.
In summary, the m)' distribution is expected to possess a positive s)' in the case of massive transfer (or
incomplete fusion), being contrary to the case of complete-fusion reaction. In the light of the present study it is
quite understandable that s)' measured by Geoffroy et a1.6) seems to change its sign from negative to positive as
the emitted a-particle energy increases, reflecting the effect of reaction mechanisms. It is interesting to note that,
in the 86Kr + 144Sm reaction at 490 MeV, s)' of the m)' distribution was found to be positive for the quasielastic
region, while to be negative for the deep inelastic region. 7) Although the reaction system is very much different
from the present examples , there may be some similarities in the reaction mechanisms if the sign of s)' is the same.
It would be very desirable to study the sign of skewness (or third moment) of the m)' distribution systematically in
the heavy-ion reaction.
This study was initiated at the Cyclotron Institute, Texas A & M University.
R,eferences
1) T. Inamura , M. Ishihara , T. Fukuda, T. Shimoda, and K. Hiruta: Phys. Lett., 68B, 51 (1977).

2) T.T. Sugihara: Proc. of Nobel Symp. 50, Sweden, June 23-27 (1980); Physica Scripta, 24, 108 (1981),
and references therein.
3) M. Wakai and A. Faessler: Nucl. Phys., A307, 349 (1978); M. Wakai, M. Muraoka, and A. Faessler: Phys.
Lett., 93B, 232 (1980).
59
4) J. Gilat and J.R. Grover: Phys. Rev., C}, 734 (1971); J. Gilat: Brookhaven Natl. Lab. Rep., No. BNL 50246.
5) T. Udagawa and T. Tamura: Phys. Rev. Lett., 45,1311 (1980).
6) K.A. Geoffroy, D.G. Sarantites, M.L. Halbert, D.C. Hensley, R.A. Dayras, and J.H. Baker: ibid., 43, 1303
(1979).
7) P.R. Christensen, F. Folkmann, Ole Hansen, Q. Nathan, N. Trautner, F. Videb ce k, S.Y. van der Werf, H.C.
Britt, R.P. Chestnut, H. Freiesleben, and F. Puhofer: ibid., 40, 1245 (1978).
60
III-1-17. Angular - Momentum Transfer and Alignment Following
Preequilibrium a-Particle Emission in Heavy-Ion Reactions
H. Utsunomiya, T. Nomura, S. Kohmoto, and M. Sasagase
NUCLEAR REACTION 209BiC60, cd) , E = 120 MeV, 209BieoNe, af), l E = 134, 146 MeV; measured angular correlations. J
If a fissile nucleus is produced in a nuclear reaction as one of the reaction products, angular
correlations of the fission fragments in coincidence with the other product are known to give
information on the magnitude and alignment of angular momenta transferred in the reaction. We
have applied this method to the study of "fast" a-particle emission in heavy-ion fusionlike
reactions in order to study the reaction mechanism relevant to this phenomenon. A series of a-f
angular correlation measurements were performed in 14N_, 16 0_ and 2~e-induced reactions on
209Bi . We have already reported a result of the 209Bi(14N, af) reaction at 115 MeV,l) which
indicates that the preequilibrium a-particle emission mainly originates from entrance angular
momenta smaller than the critical angular momentum for complete fusion.
The present measurements in the 160_ and 2oNe-induced reactions were made at bombarding
energies of 120 and 134 MeV, respectively. The grazing angular momentum is estimated to be 60
h in both reactions, being nearly equal to that in the 14N-induced reactions mentioned above.
These reactions are therefore conveniently utilized to study projectile dependence on the angular
momentum transfer and alignment following the fast a-particle emission. In addition, the
measurement was performed in the 209BieoNe, af) reaction at 146 MeV to see an effect of the
different incident energies. The experimental a-f angular correlations obtained in the 16 0_ and
2oNe-induced reactions have been found to be apparently very similar to those reported in Ref. 1.
A detailed quantitative analysis similar to that in Ref. 1 is now in progress.
Reference
I) H. Utsunomiya, T. Nomura, M. Ishihara , T. Sugitate, K. Ieki, and S. Kohmoto: Phys. Lett.,
105B, 135 (1981).
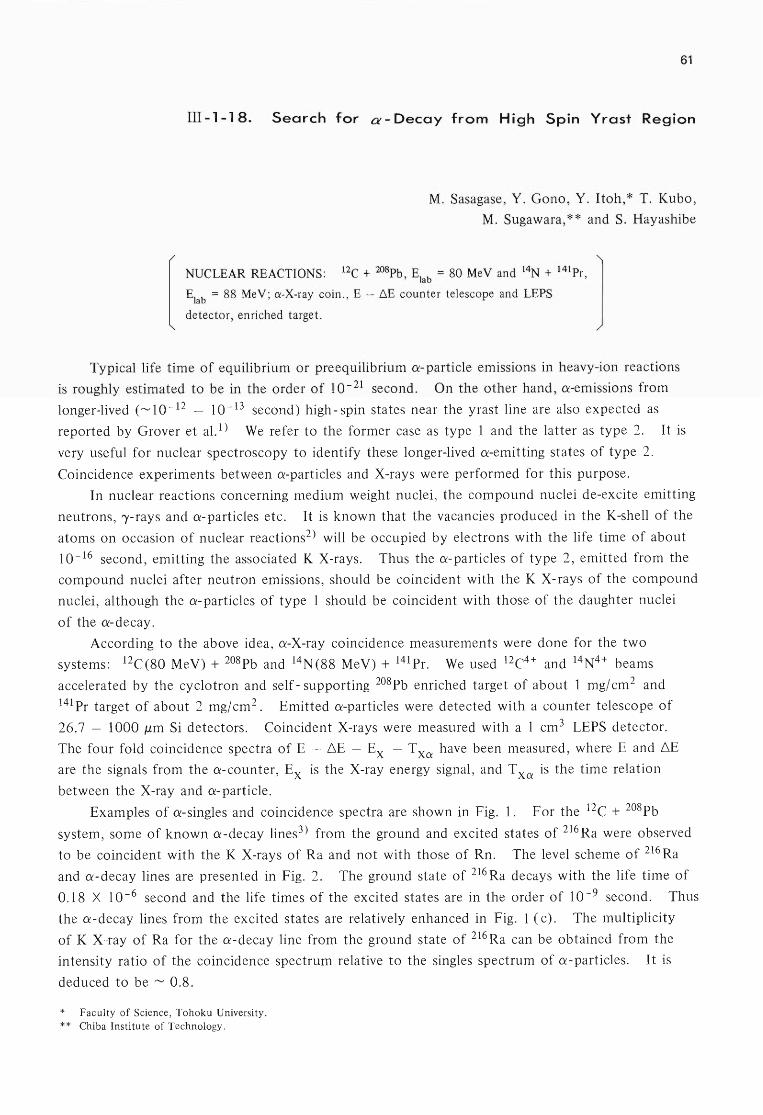
61
III-1-18. Search for a - Decay from High Spin Yrast Region
M. Sasagase, Y. Gono, Y. Itoh,* T. Kubo,
M. Sugawara, * * and S. Hayashibe
[
NUCLEAR REACTIONS' 12C + 208Pb E = 80 MeV and 14N + 141Pr 1 . , lab '
E1ab
= 88 MeV; a-X-ray coin., E - 6.E counter telescope and LEPS
detector, enriched target.
Typical life time of equilibrium or pre equilibrium a-particle emissions in heavy-ion reactions
is roughly estimated to be in the order of 10- 21 second. On the other hand, a-emissions from
longer-lived ('''' I 0 -12 - 10 - 13 second) high - spin states near the yrast line are also expected as
reported by Grover et al.l) We refer to the former case as type I and the latter as type 2. It is
very useful for nuclear spectroscopy to identify these longer-lived a-emitting states of type 2.
Coincidence experiments between a-particles and X-rays were performed for this purpose.
In nuclear reactions concerning medium weight nuclei, the compound nuclei de-excite emitting
neutrons, 'Y-rays and a-particles etc. It is known that the vacancies produced in the K-shell of the
atoms on occasion of nuclear reactions2) will be occupied by electrons with the life time of about
10 - 16 second, emitting the associated K X-rays. Thus the a-particles of type 2 , emitted from the
compound nuclei after neutron emissions, should be coincident with the K X-rays of the compound
nuclei, although the a-particles of type I should be coincident with those of the daughter nuclei
of the a-decay.
According to the above idea, a-X-ray coincidence measurements were done for the two
systems: 12C(80 MeV) + 208Pb and 14N(88 MeV) + 141pr. We used 12C4+ and 14N4+ beams
accelerated by the cyclotron and self-supporting 208Pb enriched target of about I mgj cm2 and
141 Pr target of about 2 mgjcm2 . Emitted a-particles were detected with a counter telescope of
26.7 - 1000 ,urn Si detectors. Coincident X-rays were measured with a 1 cm3 LEPS detector.
The four fold coincidence spectra of E - 6E - Ex - T Xa have been measured, where E and 6E
are the signals from the a-counter, Ex is the X-ray energy signal, and T Xa is the time relation
between the X-ray and a-particle.
Examples of a-singles and coincidence spectra are shown in Fig. 1. For the 12C + 208Pb
system, some of known a-decay lines3 ) from the ground and excited states of 216Ra were observed
to be coincident with the K X-rays of Ra and not with those of Rn. The level scheme of 216Ra
and a-decay lines are presented in Fig. 2. The ground state of 216Ra decays with the life time of
0.18 X 10 - 6 second and the life times of the excited states are in the order of 10-9 second. Thus
the a-decay lines from the excited states are relatively enhanced in Fig. I (c). The multiplicity
of K X··ray of Ra for the a-decay line from the ground state of 216Ra can be obtained from the
intensity ratio of the coincidence spectrum relative to the singles spectrum of a-particles. It is
deduced to be '" 0.8.
* Faculty of Science, Tohoku University. ** Chiba Institute of Technology.
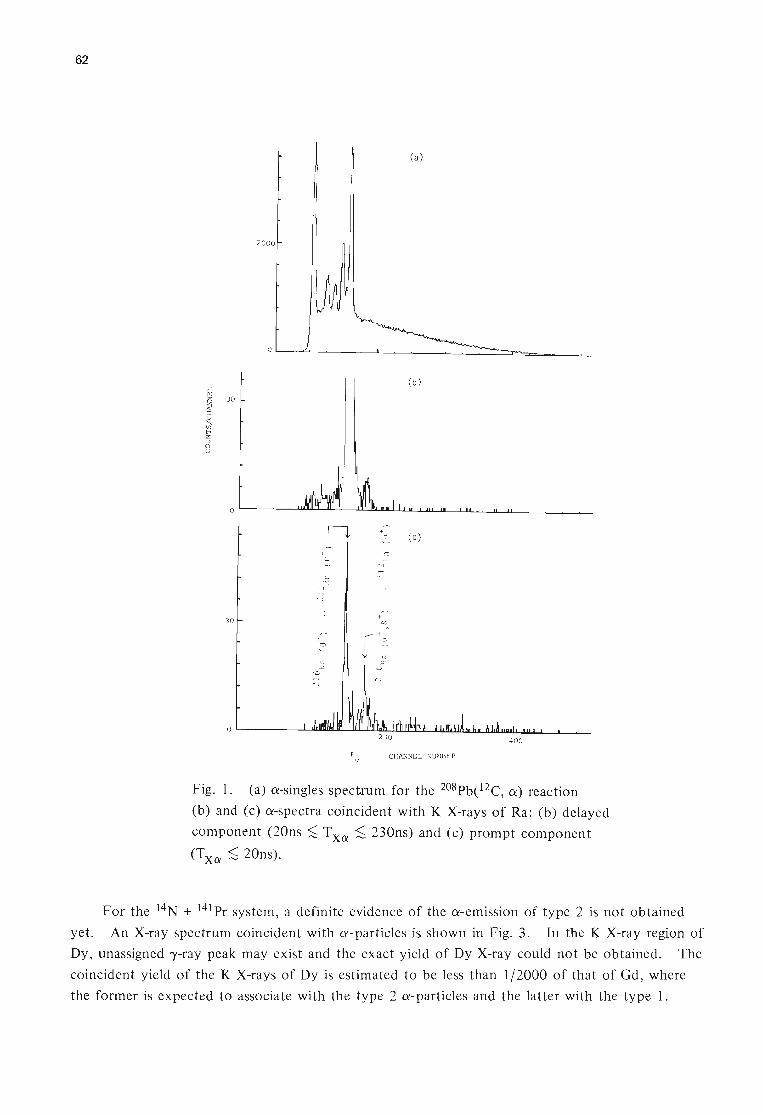
62
(a)
2000
( b)
0
It + (C) co
+ c co
N .--< <'-1
N
<'-1
+ 00 -
+ [+: 0
("j 0:: 0:: -.0
-.0 .--<
;::; r'l
0
E CHANNE L NUMBER
Fig. 1. (a) a-singles spectrum for the 208Pb(12C, 0') reaction
(b) and (c) a -spectra coincident with K X-rays of Ra: (b) delayed
component (20ns :s; T Xa ~ 230ns) and (c) prompt component
(T Xa ~ 20ns).
For the 14 N + 141 Pr system, a definite evidence of the a-emission of type 2 is not obtained
yet. An X-ray spectrum coincident with a-particles is shown in Fig. 3. In the K X-ray region of
Dy , unassigned 'Y-ray peak may exist and the exact yield of Dy X-ray could not be obtained. The
coincident yield of the K X-rays of Dy is estimated to be less than 1/2000 of that of Gd, where
the former is expected to associate with the type 2 a-particles and the latter with the type l.
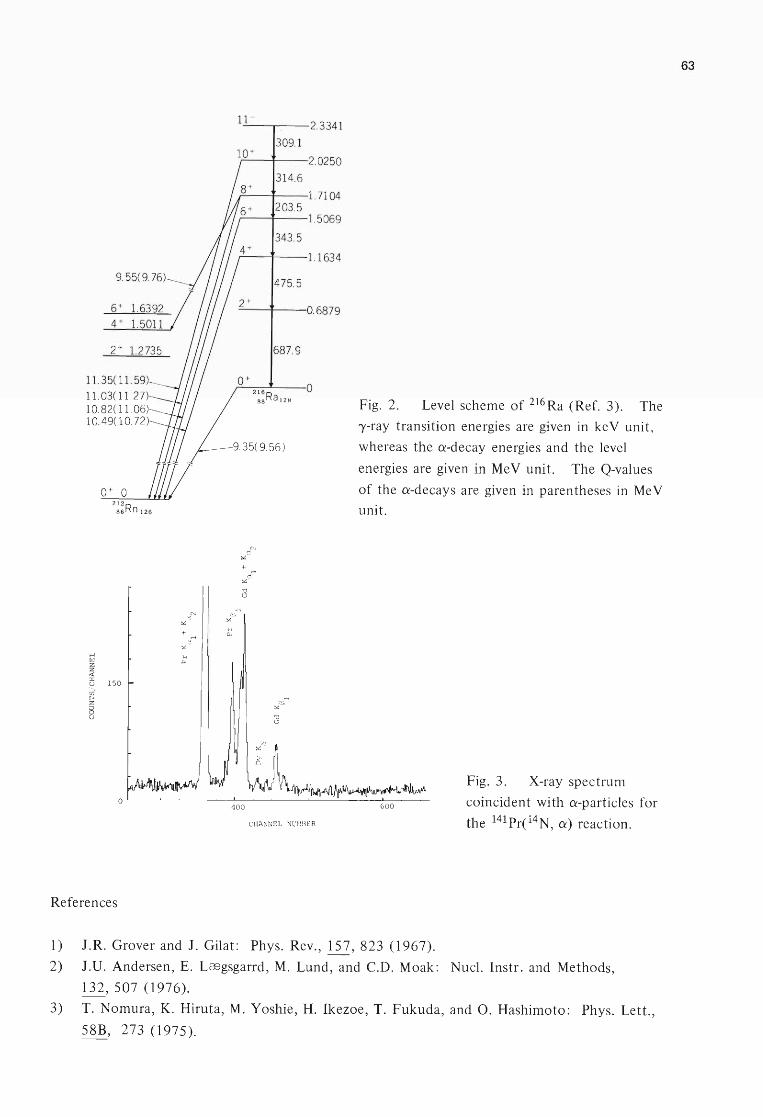
11.35(11. 59)
11.03( 11.27) 10.82( 11.06) 10.49( 10.72)
0 + 0
References
11 -2.3341
309. 1 10+
2.0250
314.6 8 +
1. 71 04 203.5
1.5069
343.5
1.1634
475.5
0.6879
687.9
2~: R a 128 0
400
CHANNEL Nl'~1BER
Fig. 2. Level scheme of 216 Ra (Ref. 3). The
'Y-ray transition energies are given in ke V unit ,
whereas the a-decay energies and the level
energies are given in Me V unit. The Q-values
of the a-decays are given in parentheses in Me V
unit.
Fig. 3. X-ray spectrum
coincident with a-particles for
the 141 Pr( 14 N, a) reaction.
1) J.R. Grover and J. Gilat: Phys. Rev., 157,823 (1967).
2) J.U. Andersen, E. L CBgsgarrd, M. Lund, and C.D. Moak: Nucl. Instr. and Methods,
132,507 (1976).
3) T. Nomura, K. Hiruta, M. Yoshie, H. Ikezoe, T. Fukuda, and O. Hashimoto: Phys. Lett.,
58B, 273 (1975).
63
64
III-1-19. In-Beam r-Ray Spectroscopy of 216Ra
Y. Itoh,* Y. Gono, M. Sasagase, T. Kubo,
M. Sugawara,** S. Hayashibe, K. Hiruta, and T. Nomura
[
NUCLEAR REACTIONS 208Pb( 12C, 4n) E = 80 MeV; "(-"( coin., I-/e),
I-/t), linear polarization ("(). 216Ra deduced levels. Ge(Li) and LEPS
detectors, enriched target.
This study is one of a series of experiments on high-spin states of nuclei in the translead
region. In this report we give a preliminary result of in-beam ,),-ray spectroscopy on 216Ra.
We performed measurements of singles ,),-ray spectra, angular distributions, time spectra, ')'-')'
coincidences, and linear polarizations. States in 216Ra were populated via the 208Pb (12C, 4n')')
reaction at E = 80 MeV.
Angular distributions of ,),-rays were measured at five angles from 8 = 34° to 90° with 72 cm 3
Ge (Li) and 1 cm3 LEPS (Low Energy Photon Spectrometer) detectors. The LEPS detector was
used especially to resolve 344 ke V doublet (343.5 ke V and 344.2 ke V) and to observe 51.4 ke V
,),-ray with good statistics. This low energy 51.4 keY transition in 216Ra was found for the first
time in the CX-')' coincidence study.I) The data were fitted to the equation W(8) = Ao + A2P2 (cos 8) + A4 P 4 (cos 8), where P 2 and P 4 are Legendre polynomials. The ,),-ray intensities were
obtained from the angular distribution coefficients Ao' Time spectra of ')'-rays with respect to
RF signals of the cyclotron were measured with 1 cm3 LEPS and no long-lived (:< 10 ns)
component was observed. The ')'-')' coincidences were measured with Ge(Li) - Ge(Li) and
Ge(Li) - 15 cm3 LEPS combinations. The latter combination was useful to confirm the 51.4 keY
transition. Linear polarizations of ,),-rays were measured by using a Compton polarimeter with a
pair of high-purity Ge diodes. 2)
Figure 1 shows a preliminary level scheme of 216 Ra. The order of transitions was determined
considering the total transition intensities taking account of the internal conversion coefficients
(lCC).3) Up to (14+) level, we referred to Nomura et a1. 4 ) The result of the linear polarization
measurements indicates that all transitions except the 344 ke V doublet below the (14+) level are
electric ones. This confirms the parity of these levels. In Fig. 1, the order of 344.2 keY and
613.3 keY transitions is reversed comparing to that of Nomura et a1.4 ) based on their transition
in tensi ties.
Above the (14+) state, we assumed E2 modes for quadrupole transitions (220.5 keY and
290.1 keY). Half-lives for M2 transitions calculated from the Weisskopf estimateS) are longer than
100 ns for both E')' = 220.5 keY and 290.1 keY with the ICC corrections3) while those for E2
ones are shorter than IOns. The M2 assignments to these transitions are therefore thought to be
improbable because of the absence of the long-lived (:G 10 ns) component in the observed time
spectra. The angular distribution of the 51.4 keY transition shows a dipole character. We
assigned an E 1 mode to it because its transition intensity for M 1 case should exceed that of the
688.2 keY, 2+ ~ g.s. transition. The order of the 220.5, 398.6, and 556.9 keY transitions could
* Faculty of Science, Tohoku University. ** Chiba Institute of Technology.
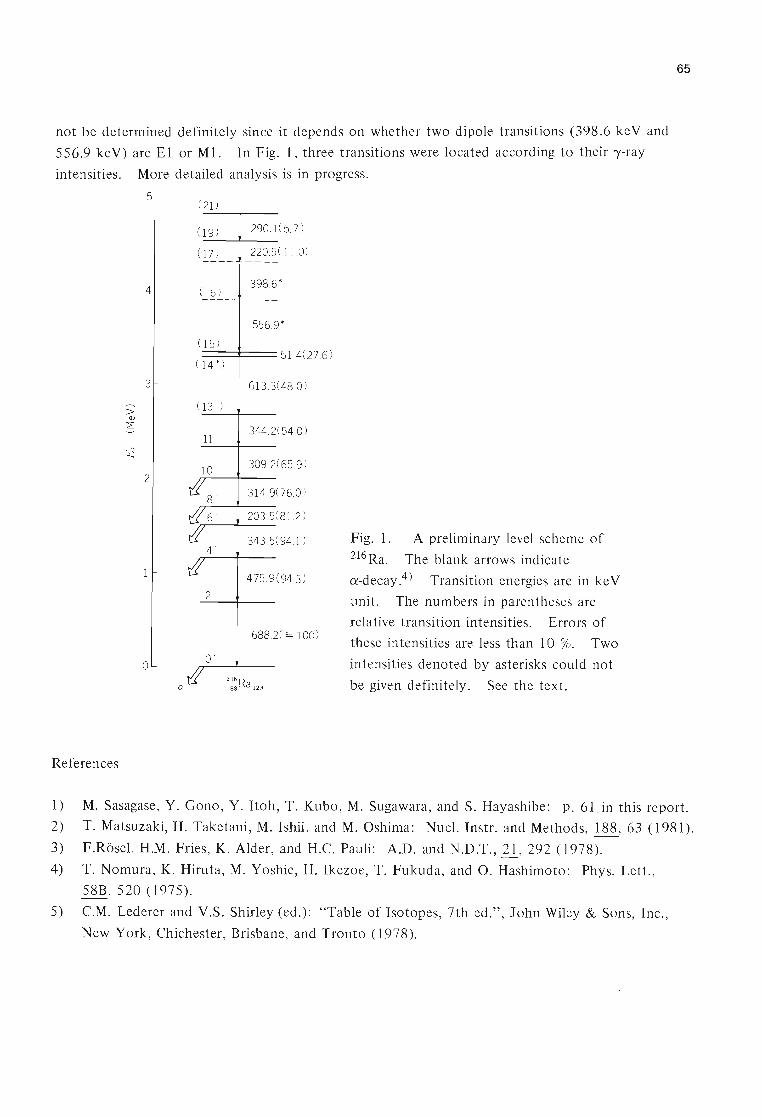
not be determined definitely since it depends on whether two dipole transitions (398.6 ke V and
556.9 ke V) are E 1 or MI. In Fig. 1, three transitions were located according to their I-ray
intensities. More detailed analysis is in progress.
References
> (j)
L
5
4
3
2
o a
(19) 290.1(5.7)
(I 7) 220.5( 110)
398.6*
556.9*
613.3(48.0 )
3442(54.0)
309.2(65.9 )
314906.0 )
2035(81.2 ) "rr---+---
343. 5(94.1 )
475 .9(94.3 )
688.2( == 100)
Fig. 1. A preliminary level scheme of
216 Ra. The blank arrows indicate
a-decay.4) Transition energies are in ke V
unit. The numbers in parentheses are
relative transition intensities. Errors of
these intensities are less than 10 %. Two
intensities denoted by asterisks could not
be given definitely. See the text.
65
1) M. Sasagase, Y. Gono, Y. Itoh, T. Kubo, M. Sugawara, and S. Hayashibe: p. 61.in this report.
2) T. Matsuzaki, H. Taketani, M. Ishii, and M. Oshima: Nuc1. Instr. and Methods, 188, 63 (1981).
3) F.RoseL H.M. Fries, K. Alder, and H.C. Pauli: A.D. and N.D.T., 1L 292 (1978).
4) T. Nomura, K. Hiruta, M. Yoshie, H. Ikezoe, T. Fukuda, and O. Hashimoto: Phys. Lett.,
58B, 520 (1975).
5) C.M. Lederer and V.S. Shirley (ed.): "Table of Isotopes, 7th ed.", John Wiley & Sons, Inc.,
New York, Chichester, Brisbane, and Tronto (1978).
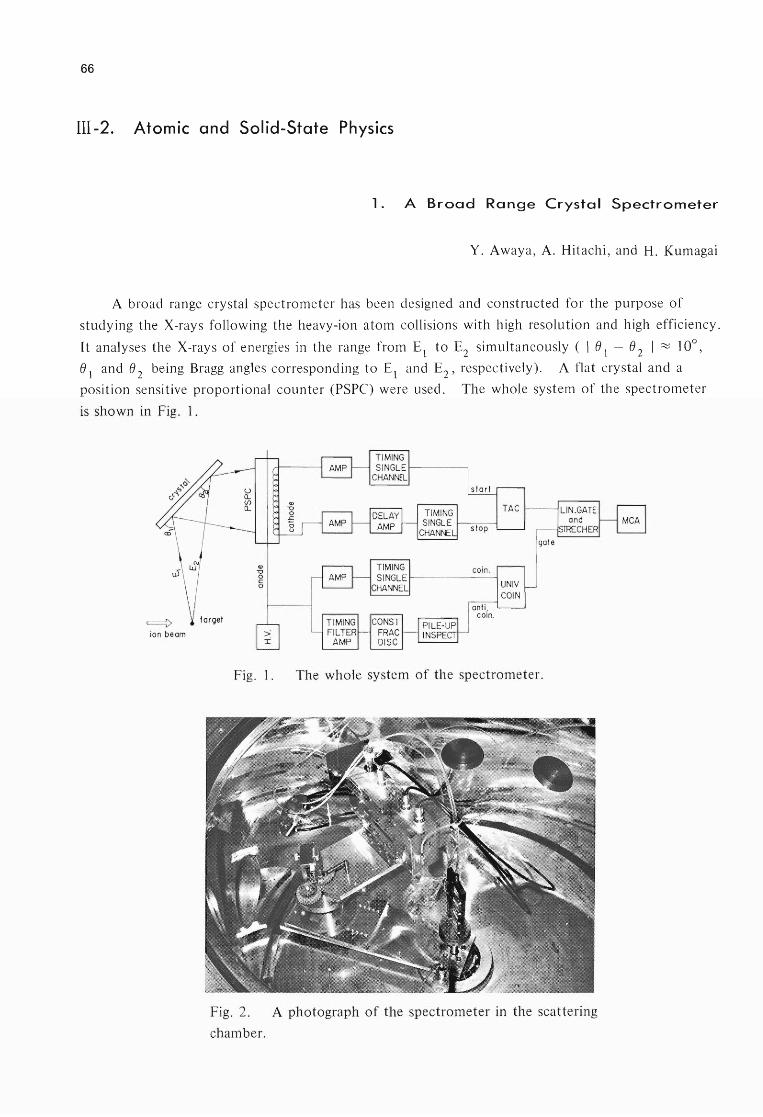
66
III-2. Atomic and Solid-State Physics
1. A Broad Range Crystal Spectrometer
Y. Awaya, A. Hitachi, and H. Kumagai
A broad range crystal spectrometer has been designed and constructed for the purpose of
studying the X-rays following the heavy-ion atom collisions with high resolution and high efficiency.
It analyses the X-rays of energies in the range from El to E2 simultaneously ( leI - e 2 I ~ 10°,
eland e 2 being Bragg angles corresponding to El and E2
, respectively). A flat crystal and a
position sensitive proportional counter (PSPC) were used. The whole system of the spectrometer
is shown in Fig. 1.
ion beam :> I
TAC
UNIV COIN
Fig. 1. The whole system of the spectrometer.
Fig. 2. A photograph of the spectrometer in the scattering
chamber.
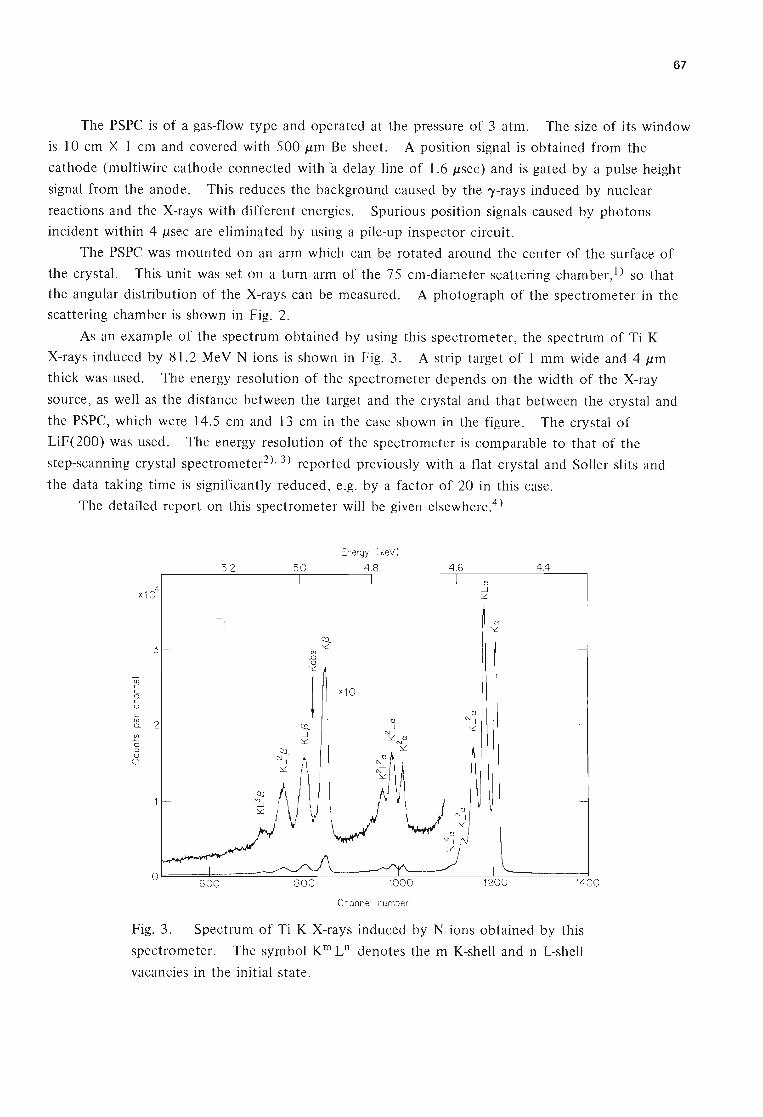
67
The PSPC is of a gas-flow type and operated at the pressure of 3 atm. The size of its window
is 10 cm X 1 cm and covered with 500 JIm Be sheet. A position signal is obtained from the
cathode (multiwire cathode connected with a delay line of l.6 JIsec) and is gated by a pulse height
signal from the anode. This reduces the background caused by the ')'-rays induced by nuclear
reactions and the X-rays with different energies. Spurious position signals caused by photons
incident within 4 JIsec are eliminated by using a pile-up inspector circuit.
The PSPC was mounted on an arm which can be rotated around the center of the surface of
the crystal. This unit was set on a turn arm of the 75 cm-diameter scattering chamber, 1) so that
the angular distribution of the X-rays can be measured. A photograph of the spectrometer in the
scattering chamber is shown in Fig. 2.
As an example of the spectrum obtained by using this spectrometer, the spectrum of Ti K
X-rays induced by 8l.2 MeV N ions is shown in Fig. 3. A strip target of 1 mm wide and 4 JIm
thick was used. The energy resolution of the spectrometer depends on the width of the X-ray
source, as well as the distance between the target and the crystal and that between the crystal and
the PSPC, which were 14.5 cm and 13 cm in the case shown in the figure. The crystal of
LiF(200) was used. The energy resolution of the spectrometer is comparable to that of the
step-scanning crystal spectrometer2), 3) reported previously with a flat crystal and Soller slits and
the data taking time is significantly reduced, e.g. by a factor of 20 in this case.
The detailed report on this spectrometer will be given elsewhere.4)
Q) c c o
..c u
3
~ 2 (j')
C ::J o
U
Ti
Energy ( keV)
4.8
xlO
4.6 4.4
O~===6=OhO====~~~~~~==~=-~;=~=-----~~======~1~400
Channel number
Fig. 3. Spectrum of Ti K X-rays induced by N ions obtained by this
spectrometer. The symbol Km L n denotes the m K-shell and n L-shell
vacancies in the initial state.

68
References
1) T. Fujisawa and Y. Awaya: IPCR Cyclotron Progr. Rep., 1., 54 (1967).
2) Y. Awaya, A. Akiba, T. Katou, H. Kumagai, Y. Tendow, K. Izumo, T. Takahashi,
A. Hashizume, M. Okano, and T. Hamada: ibid,!Q, 78 (1976).
3) Y. Awaya, M. Akiba, T. Katou, H. Kumagai, Y. Tendow, K. Izumo, T. Takahashi,
A. Hashizume, M. Okano, and T. Hamada: Phys. Lett., 61A, III (1977).
4) A. Hitachi, H. Kumagai, and Y. Awaya: Nucl. Instr. and Methods, (in press).
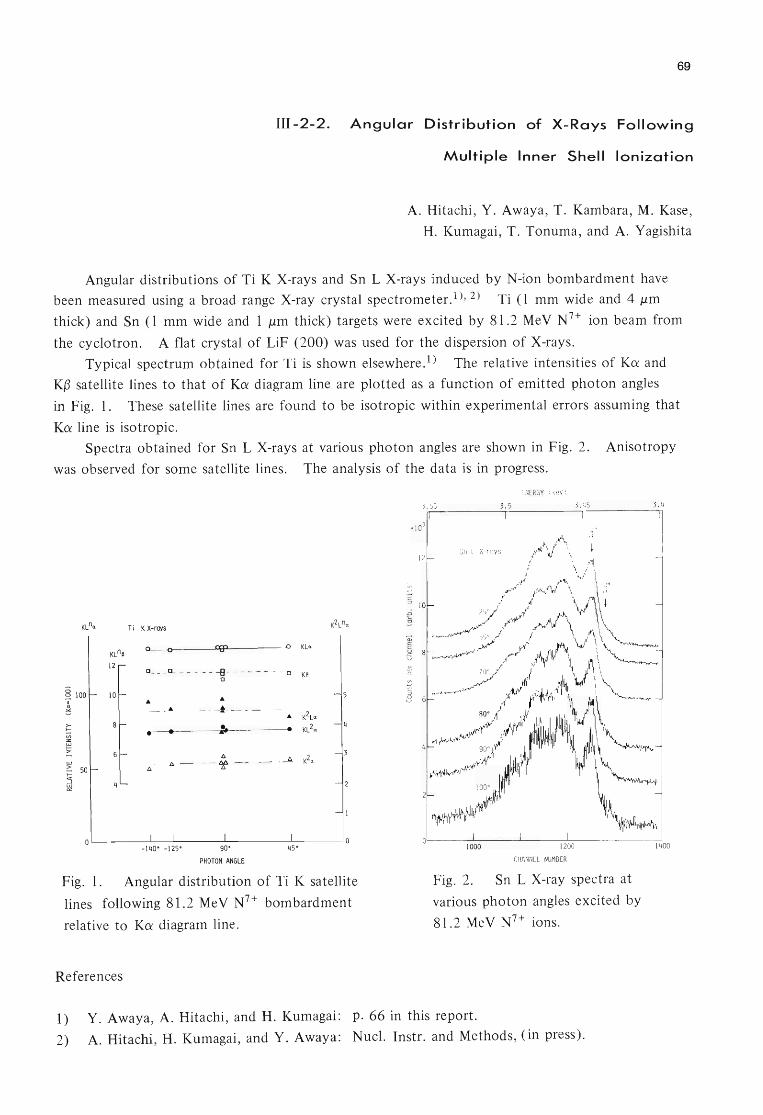
69
III -2-2. Angular Distribution of X-Rays Following
Multiple Inner Shell Ionization
A. Hitachi, Y. Awaya, T. Kambara, M. Kase,
H. Kumagai, T. Tonuma, and A. Yagishita
Angular distributions of Ti K X-rays and Sn L X-rays induced by N-ion bombardment have
been measured using a broad range X-ray crystal spectrometer.1), 2) Ti (1 mm wide and 4 J,lm
thick) and Sn (1 mm wide and 1 11m thick) targets were excited by 81.2 MeV N7+ ion beam from
the cyclotron. A flat crystal of LiF (200) was used for the dispersion of X-rays.
Typical spectrum obtained for Ti is shown elsewhere.1) The relative intensities of K~ and
K{3 satellite lines to that of K~ diagram line are plotted as a function of emitted photon angles
in Fig. 1. These satellite lines are found to be isotropic within experimental errors assuming that
K~ line is isotropic.
Spectra obtained for Sn L X-rays at various photon angles are shown in Fig. 2. Anisotropy
was observed for some satellite lines. The analysis of the data is in progress.
100 10
>-I-
~ W > 50
~
T j K X-roYs
O---o~~---u'1Ptp---~---VO KLo
c_ - - rL - - - - - i ---- - - - -n K8
- _. - - - -~ - - - - -
__ • ----4. ___ --___ ~~-. - KL 20
6 - 6 - - 66 -
6 6
- 140· - 125" 90"
PHOTON ANGLE
45"
Fig. 1. Angular distribution of Ti K satellite
lines following 8l.2 MeV N7+ bombardment
relative to K~ diagram line.
References
[ NERGY ( keV)
3. 55 3.5 3 .45
12
10
Sn LX- rays
1000
Fig. 2.
1200
CHANNEL NUMBER
Sn L X-ray spectra at
various photon angles excited by
8l.2 MeV N7+ ions.
1) Y. Awaya, A. Hitachi, and H. Kumagai: p. 66 in this report.
2) A. Hitachi, H. Kumagai, and Y. Awaya: Nucl. Instr. and Methods, (in press).
3.4
1400

70
III -2-3. Ionization of Gases by Ion Bombardment
T. Tonuma, A. Yagishita, M. Kase, T. Kambara,
Y. Awaya, H. Kumagai, and 1. Kohno
In order to obtain information on multiple ionization in ion-atom collisions, we set up an
experimental apparatus to measure charged ions of gas targets by ion bombardment. The apparatus
used in producing charged ions is shown in Fig. 1. A beam of ions is crossed by a gas target
emerging from a gas jet of I mm in diameter and ionizes gas atoms. Charged ions are extracted
in the direction perpendicular to the beam direction by an extraction electric field produced by
parallel plate electrodes with a slit and are focused by an Einzel lens and an analyzer magnet.
Charge-analyzed ions, which are deflected through 90° along the curve of 16 cm radius by the
analyzer magnet, are detected by a channeltron detector. The magnetic field of the analyzer
magnet is kept constant and charge spectrum of the ionized gas target is observed by scanning
electric potentials of the parallel plate electrodes. The apparatus has two 6" oil diffusion pumps
(P 1 ,P 2) and one 2/1 oil diffusion pump (P 3 ).
Figure 2 shows the Ar charge spectrum produced by 84 MeV N4 + ions obtained by the
cyclotron. The magnetic field was kept at 1.1 kG. The background pressure was 3 X 10 -6
Torr. When Ar gas was introduced at a rate of I cc/min, the pressure rose to about 8 X 10 -5
Torr. Charge states up to Ar7+ were observed.
Gas jet Parallel electrode
Einzel lens
Charge analyzer
Fig. 1. Schematic diagram of the
apparatus. PI' P 2' and P 3 are
pumps.
u c
LO
........ V>
c
X 104
A + 2.0 r
1.5
8 1.0
Fig. 2. Ar charge spectrum by
84 MeV N4+ ions .
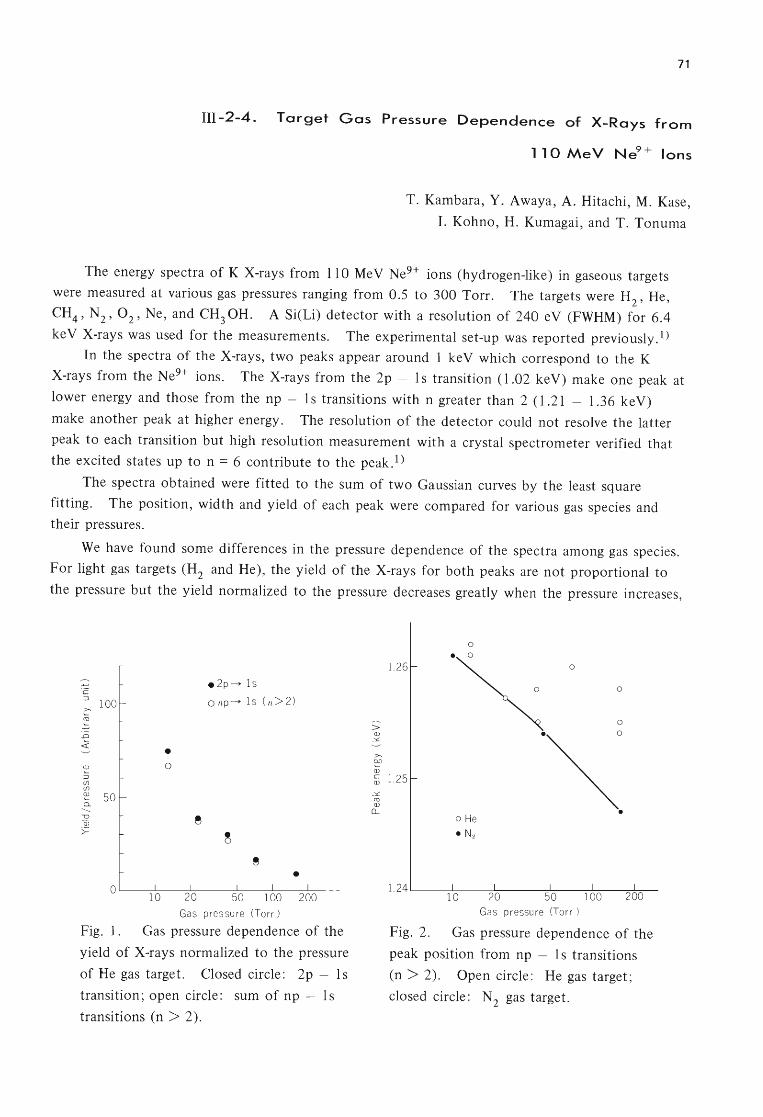
71
III -2-4. Target Gas Pressure Dependence of X-Rays from
110 MeV Ne9+ Ions
T. Kambara, Y. Awaya, A. Hitachi, M. Kase,
1. Kohno, H. Kumagai, and T. Tonuma
The energy spectra of K X-rays from 110 MeV Ne9+ ions (hydrogen-like) in gaseous targets
were measured at various gas pressures ranging from 0.5 to 300 Torr. The targets were H2
, He,
CH4 , N2 , °2 , Ne, and CH3 0H. A Si(Li) detector with a resolution of 240 eV (FWHM) for 6.4
keY X-rays was used for the measurements. The experimental set-up was reported previously.1)
In the spectra of the X-rays, two peaks appear around I keY which correspond to the K
X-rays from the Ne9+ ions. The X-rays from the 2p - 1 s transition (1.02 keY) make one peak at
lower energy and those from the np - I s transitions with n greater than 2 (1.21 - 1.36 keY)
make another peak at higher energy. The resolution of the detector could not resolve the latter
peak to each transition but high resolution measurement with a crystal spectrometer verified that
the excited states up to n = 6 contribute to the peak.1)
The spectra obtained were fitted to the sum of two Gaussian curves by the least square
fitting. The position, width and yield of each peak were compared for various gas species and
their pressures.
We have found some differences in the pressure dependence of the spectra among gas species.
For light gas targets (H2
and He), the yield of the X-rays for both peaks are not proportional to
the pressure but the yield normalized to the pressure decreases greatly when the pressure increases,
-::: . 2p-l s c :::l
C 100 onp-l s(n>2)
co
..0
<l: • ~ 0 :::l Cf) Cf)
~ 50 Q.
-------0 ~ ill >= ~
•
Gas pressure (Torr )
Fig. 1. Gas pressure dependence of the
yield of X-rays normalized to the pressure
of He gas target. Closed circle: 2p - 1 s
transition; open circle: sum of np - Is
transitions (n > 2).
:; Q)
.:,c.
>-~ Q)
c Q)
.:,c. cu Q)
CL
0
1.26 .~ 0
0
0
.~ 1.25
• o He
• N2
Ga s pressure (Torr )
Fig. 2. Gas pressure dependence of the
peak position from np - 1 s transitions
(n > 2). Open circle: He gas target;
closed circle: N 2 gas target.
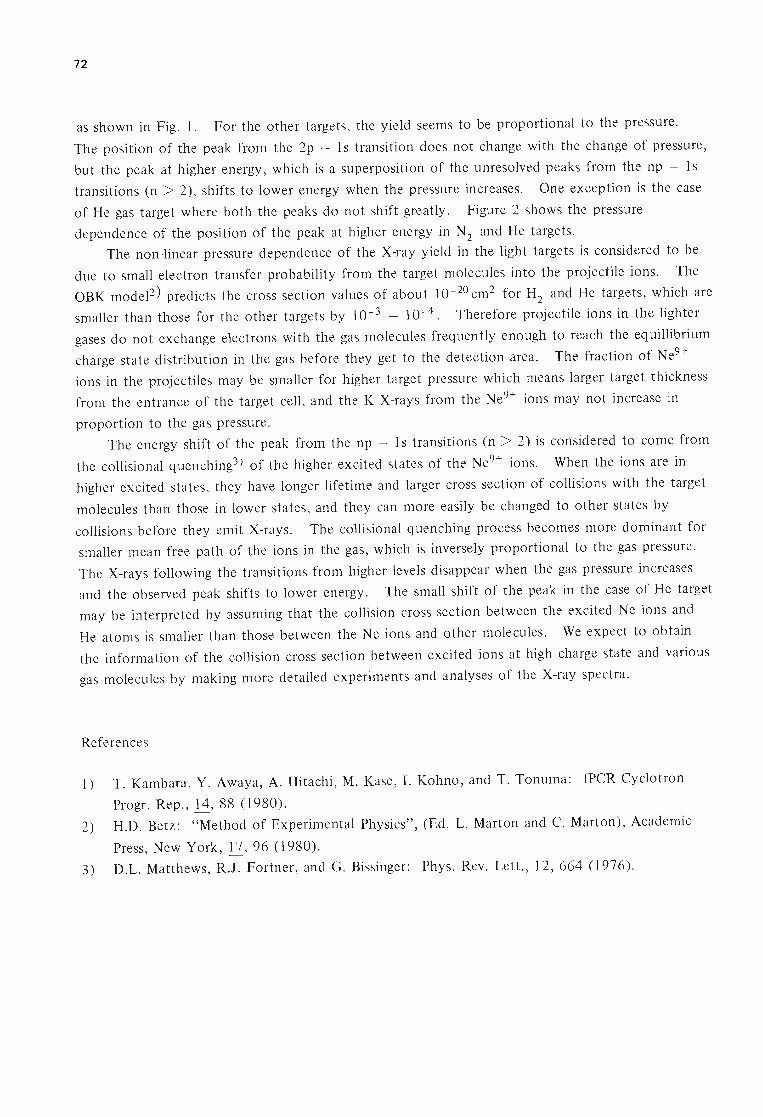
72
as shown in Fig. 1. For the other targets, the yield seems to be proportional to the pressure.
The position of the peak from the 2p - 1 s transition does not change with the change of pressure,
but the peak at higher energy, which is a superposition of the unresolved peaks from the np - Is
transitions (n > 2), shifts to lower energy when the pressure increases. One exception is the case
of He gas target where both the peaks do not shift greatly. Figure 2 shows the pressure
dependence of the position of the peak at higher energy in N2 and He targets.
The non-linear pressure dependence of the X-ray yield in the light targets is considered to be
due to small electron transfer probability from the target molecules into the projectile ions. The
OBK model2) predicts the cross section values of about 10- 2o cm2 for H2 and He targets, which are
smaller than those for the other targets by 10 - 3 - 10 -4. Therefore projectile ions in the lighter
gases do not exchange electrons with the gas molecules frequently enough to reach the equillibrium
charge state distribution in the gas before they get to the detection area. The fraction of Ne9+
ions in the projectiles may be smaller for higher target pressure which means larger target thickness
from the entrance of the target cell, and the K X-rays from the Ne9+ ions may not increase in
proportion to the gas pressure.
The energy shift of the peak from the np - 1 s transitions (n > 2) is considered to come from
the collisional quenching3) of the higher excited states of the Ne9+ ions. When the ions are in
higher excited states, they have longer lifetime and larger cross section of collisions with the target
molecules than those in lower states, and they can more easily be changed to other states by
collisions before they emit X-rays. The collisional quenching process becomes more dominant for
smaller mean free path of the ions in the gas, which is inversely proportional to the gas pressure.
The X-rays following the transitions from higher levels disappear when the gas pressure increases
and the observed peak shifts to lower energy. The small shift of the peak in the case of He target
may be interpreted by assuming that the collision cross section between the excited Ne ions and
He atoms is smaller than those between the Ne ions and other molecules. We expect to obtain
the information of the collision cross section between excited ions at high charge state and various
gas molecules by making more detailed experiments and analyses of the X-ray spectra.
References
I) T. Kambara, Y. Awaya, A. Hitachi, M. Kase, 1. Kohno, and T. Tonuma: IPCR Cyclotron
Progr. Rep., li, 88 (1980).
2) H.D. Betz: "Method of Experimental Physics", (Ed. L. Marton and C. Marton), Academic
Press, New York, !2, 96 (1980).
3) D.L. Matthews, R.J. Fortner, and G. Bissinger: Phys. Rev. Lett., !l, 664 (1976).
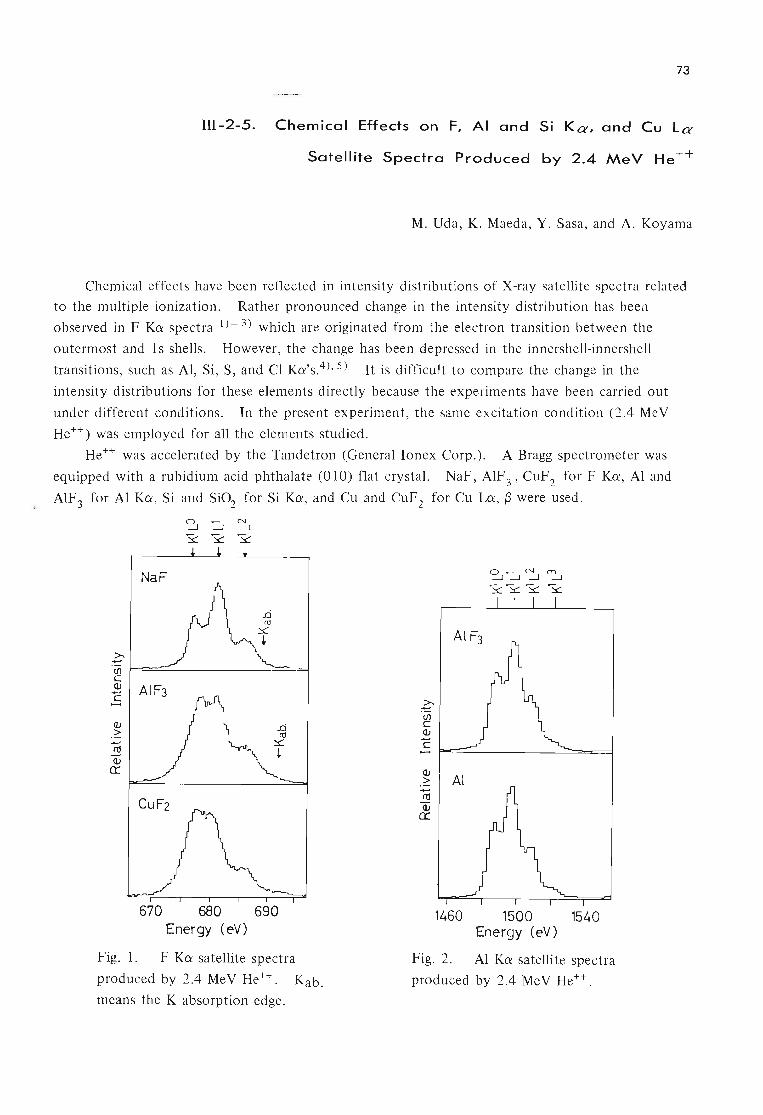
73
III-2-5. Chemical Effects on F, AI and Si Ka, and Cu La
Satellite Spectra Produced by 2.4 MeV He + +
M. Uda, K. Maeda, Y. Sasa, and A. Koyama
Chemical effects have been reflected in intensity distributions of X-ray satellite spectra related
to the multiple ionization. Rather pronounced change in the intensity distribution has been
observed in F Ka spectra 1)- 3) which are originated from the electron transition between the
outermost and I s shells. However, the change has been depressed in the innershell-innershell
transitions, such as AI, Si, S, and CI Ka's.4), 5) It is difficult to compare the change in the
intensity distributions for these elements directly because the experiments have been carried out
under different conditions. In the present experiment, the same excitation condition (2.4 MeV
He++) was employed for all the elements studied.
He++ was accelerated by the Tandetron (General Ionex Corp.). A Bragg spectrometer was
equipped with a rubidium acid phthalate (010) flat crystal. NaF, AIF 3' CuF 2 for F Ka, Al and
AIF3 for Al Ka, Si and Si02
for Si Ka, and Cu and CuF2 for Cu La, (3 were used.
NaF
Z:' .li) c (J) .....
oS
(J)
>
~ (J)
a:
670 680 690 Energy (eV)
Fig. 1. F Ka satellite spectra
produced by 2.4 MeV He++. Kab.
means the K absorption edge.
£ Vl C (J)
c (J)
.~ ..... m
Q) a:
Al
~~~~ ~~"S::: ~
1460 1500 1540 Energy (eV)
Fig. 2. Al Ka satellite spectra
produced by 2.4 MeV He++.

74
£ Vl C Q)
C -QJ
.~ n; Qj 0:
~":.J~~ ~~~~
1700 1740 1780 1820 Energy (eV)
Fig. 3. Si Ka satellite spectra
produced by 2.4 MeV He++.
>-~ Vl C Q)
C Q)
>
~ Cu
Q)
0:: .b ~
.:i
+
920 940 960 Energy (eV)
Fig. 4. eu In, {3 satellite spectra produced by 2.4 MeV He++.
Prior to the X-ray emission, electron vacancies produced in the valence band are expected to
be filled with valence electrons localized on ligand atoms. Enhanced chemical effect should then
be observed on the intensity distribution of the X-ray satellite spectra which are originated from
the transition of the valence electrons to the inner shell (Fig. I for F KO' and Fig. 4 for Cu La, (3).
For elements whose X-ray emission relates indirectly to the electron vacancy transfer between the
atoms of interest and surrounding atoms, much smaller chemical effect than that of the former is
expected to be seen. This is indeed the case in Al KO' and Si KO' as shown in Figs. 2 and 3,
respectively.
References
1) M. Uda, H. Endo, K. Maeda, Y. Awaya, M. Kobayashi, Y. Sasa, H. Kumagai, and T. Tonuma:
Phys. Rev. Lett., 42, 1257 (1979).
2) H. Endo, M. Uda, and K. Maeda: Phys. Rev., A22, 1436 (1980).
3) M. Uda, H. Endo, K. Maeda, Y. Sasa, and M. Kobayashi: Z. Physik A., 300, 1 (1981).
4) P. G. Burkhalter, A. R. Knudson, D. J. Nagel, and K. L. Dunning: Phys. Rev., A~, 2093
( 1972).
5) R. L. Watson, A. K. Leeper, B. I. Sonobe, T. Chiao, and F. E. Jenson: ibid., 12,914
( 1977).

75
III -2-6. Chern ica I Effect on 0 K a Satell ite Spectra
Induced by 2.4 MeV He++ Ions
K. Maeda, Y. Sasa, K. Fuwa, and M. Uda
We have extensively investigated the chemical effects on the intensity distributions of the X-ray
satellites due to multiple ionization.!) - 4) The present paper deals with the He++ -ion induced ° K~ satellite spectra obtained from a series of oxygen compounds.
2.4 MeV He++ -ion beams accelerated by the Tandetron (General Ionex Corp.) were used to
generate the Kl L n states for oxygen, where KI L n denotes a configuration with a single K and n L
vacancies. Target materials used were films of MgO, A120 3 , Si02 , CuO, and Na2S04 , all in 1- 6
mg/cm2 thickness. The emitted X-ray spectra were recorded on a Bragg spectrometer equipped
with a flat analyzing crystal.
The intensities of the ° K~ satellites are supposed to be weak because in the compounds of
small ionicity such as oxides, considerable number of the L shell vacancies generated at the time
of ion impact may be filled with the valence electrons of the surrounding atoms prior to the X-ray
emission. I) Therefore, we magnified the ° K 1 L 2 satellite intensity utilizing a particular analyzing
crystal, rubidium acid phthalate (RAP) to make clear the small change in the satellite intensities.
RAP has a reflectivity spike at 532 eV where the ° Kl L2 satellite is just situated. Electron
induced ° K~ spectra of MgO analyzed with two kinds of crystals, RAP and clinochlore, are shown
in Fig. 1 to demonstrate such an anomalous reflectivity of RAP. The spectrum obtained by RAP
shows a peak at 532 eV, whereas no peak is detected at this energy region when the clinochlore is
used, whose reflection coefficient is almost constant within the measured energy range.S), 6) The
energies of K 1 L 1 and K 1 L 2 satellites given in the figure were calculated, on the basis of the sudden
approximation, by the DV-X~ method7) and were determined by referring to the energy of the
diagram line (K1 LO). The reflection coefficient of RAP at 532 eV was evaluated to be about 4
<::.; --.-J ~ Y -y ~
I I
clinochlore
1 keY e-
~ ~tvlgO
"iii c
! - --
<IJ > :; & RAP
8 keY e-~MgO
Fig. 1. Electron induced ° Ka spectra of MgO analyzed with RAP
520 525 530 535 and clinochlore. Energy (eY)
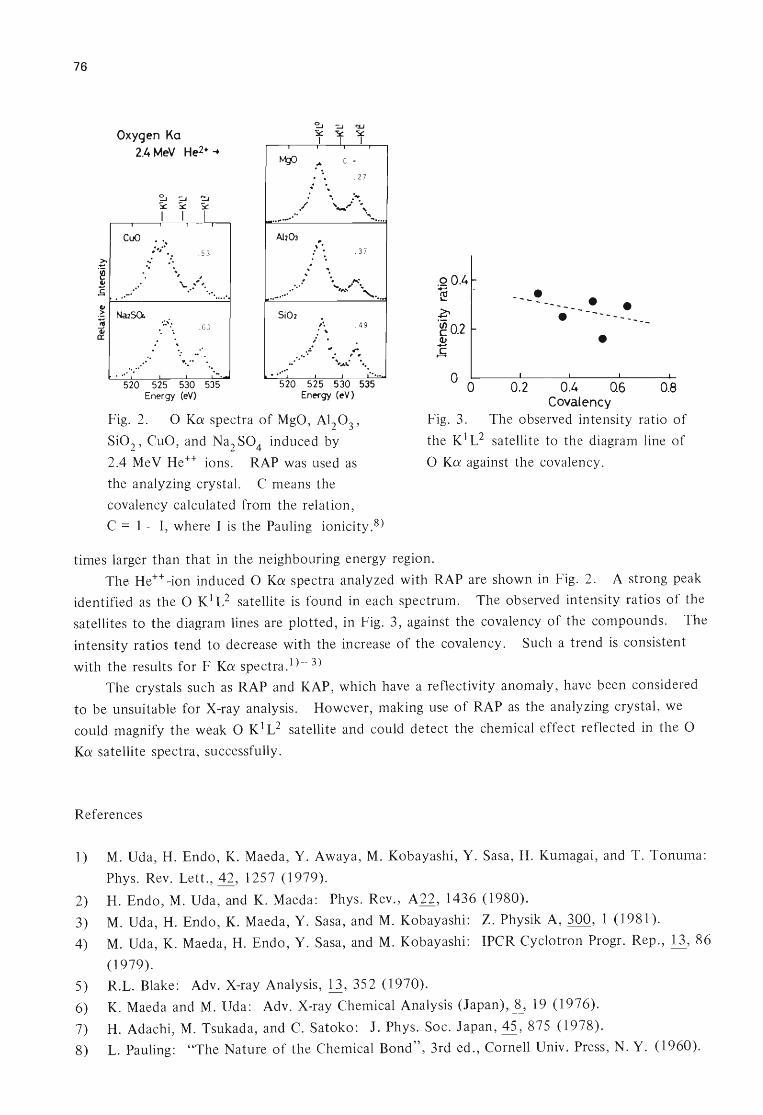
76
Oxygen Ka 2.4 MeV He2+ ~
cuO : : ... # -, • . 53
.. .' '. , , , "'--..... ' '. .........
. 63
. .. : ...... . ....... e •
'-. 520 525 530 535
Energy (eV)
./ ..... -..
. ..... ........
. :: ., .......... . .....
c =
.27
.37
. 49
. .... 520 525 530 535
Energy (eV)
.QO.4 ~
o 0
• ---
0.2
--_. . • --- --- ---
• 0.4 Q6 0.8
Covalency Fig. 2. ° Ka spectra of MgO, A120
3,
Si02, CuO, and Na2 S04 induced by
2.4 MeV He++ ions. RAP was used as
the analyzing crystal. C means the
covalency calculated from the relation ,
Fig. 3. The observed intensity ratio of
the K 1 L 2 satellite to the diagram line of
° Ka against the covalency .
C = I - I, where I is the Pauling ionicity.8)
times larger than that in the neighbouring energy region.
The He++ -ion induced ° Ka spectra analyzed with RAP are shown in Fig. 2 . A strong peak
identified as the ° Kl L2 satellite is found in each spectrum. The observed intensity ratios of the
satellites to the diagram lines are plotted, in Fig. 3 , against the covalency of the compounds. The
intensity ratios tend to decrease with the increase of the covalency. Such a trend is consistent
with the results for F Ka spectra. 1) - 3)
The crystals such as RAP and KAP, which have a reflectivity anomaly, have been considered
to be unsuitable for X-ray analysis . However, making use of RAP as the analyzing crystal, we
could magnify the weak 0 K 1 L 2 satellite and could detect the chemical effect reflected in the 0
Ka satellite spectra, successfully.
References
1) M. Uda, H. Endo , K. Maeda , Y. Awaya, M. Kobayashi, Y. Sasa, H. Kumagai , and T. Tonuma:
Phys. Rev. Lett., 42, 1257 (1979).
2) H. Endo, M. Uda, and K. Maeda: Phys. Rev., A22, 1436 (1980).
3) M. Uda, H. Endo , K. Maeda, Y. Sasa , and M. Kobayashi: Z. Physik A , 300, 1 (1981).
4) M. Uda, K. Maeda, H. Endo, Y. Sasa, and M. Kobayashi: IPCR Cyclotron Progr. Rep., !.l, 86
(1979).
5) R.L. Blake: Adv. X-ray Analysis, u., 352 (1970).
6) K. Maeda and M. Uda: Adv. X-ray Chemical Analysis (Japan), ~ 19 (1976).
7) H. Adachi, M. Tsukada, and C. Satoko: J. Phys. Soc. Japan, 45, 875 (1978).
8) L. Pauling: "The Nature of the Chemical Bond", 3rd ed., Cornell Univ. Press, N. Y. (1960).
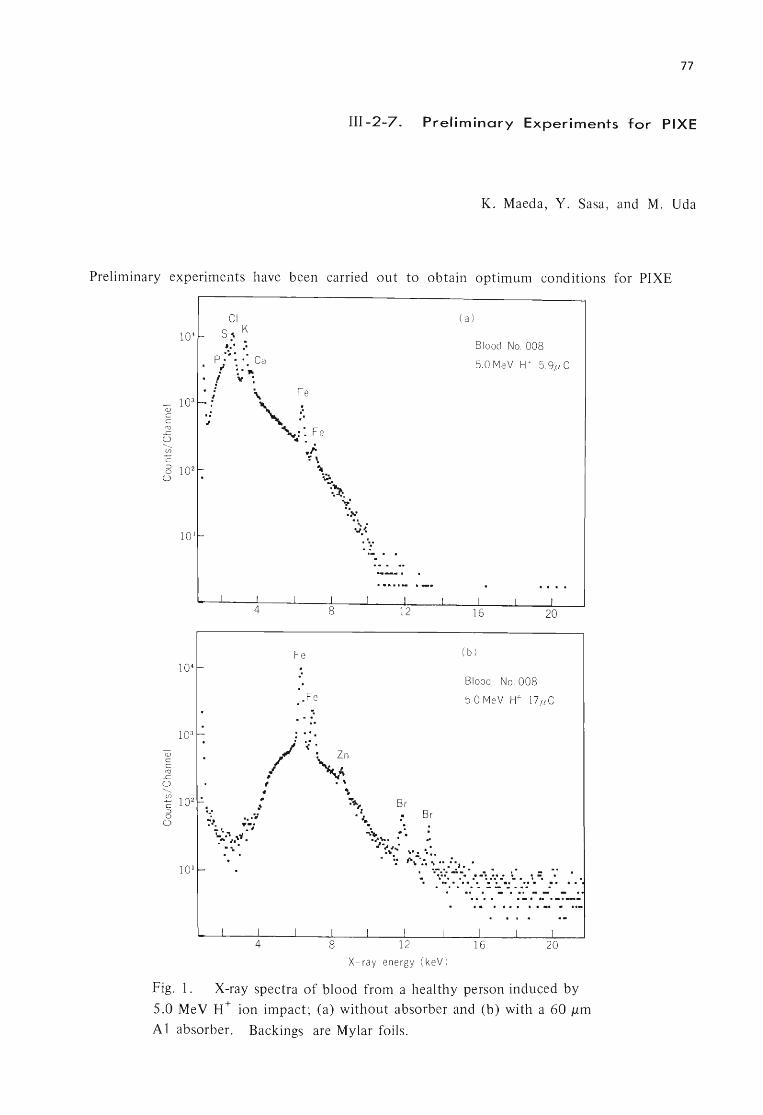
77
III-2-7. Preliminary Experiments for PIXE
K. Maeda, Y. Sasa, and M. Uda
Preliminary experiments have been carried out to obtain optimum conditions for PIXE
Q)
c C r<:J
...c U
103 -
I I
4 I
Fe
" . Fe
. , ., , "
I
8
/ <: Zn ~ ,,,
t ' "
...
I I 12
~ . \ ~ 102 ~.; ':' .... ,.. B r ::J e.- • Br 8 ~I. ; .. ': ' :.. :
-:":'.'" ,'/' I -.~,". :. ..
.#ItI. ~' • '/_1 J.: .
I
( a)
Blood No 008
5.0 MeV H+ 59,u C
I I I 16 20
( b )
Bl ood No. 008
5.0 MeV H+ I7,u C
Of .1t:. ... :.:... . • (o\ ....... "
":,::: ~:::: .... \:.: :.:'" ' .. ~ .. , .' . ... .. _-_ ....
! I I I I I I I I I 4 8 12 16 20
x- ray energy ( keV)
Fig. 1. X-ray spectra of blood from a healthy person induced by
5.0 MeV H+ ion impact ; (a) without absorber and (b) with a 60 J.1m
A 1 absorber. Backings are Mylar foils.

78
(particle induced X-ray emission) analysis.
Our present interest is in finding the correlations between diseases and trace element
concentrations in biological tissues. At the first . step we chose healthy whole blood as samples to
estimate the mean composition of normal human blood. The blood samples treated with
anticoagulant were deposited on 4 11m thick Mylar films or 250 11m thick Be foils. The
anticoagulant used was potassium salt of EDT A. The impurities contained in the backings are
as follows: Ca in Mylar; AI, Si, Fe, and Ni in Be. Two kinds of ion beams, 5.0 MeV H+ and
2.4 MeV He++ accelerated by the cyclotron and the Tandetron (General Ionex Corp.), respectively,
were utilized to induce characteristic X-rays. The emitted X-rays were detected by a Si(Li)
detector (FWHM = 200 eV at 5.9 keV) and processed by a multichannel analyzer. In some cases
X-ray absorbers were inserted between the sample and the detector to depress undisired X-rays.
A dozen of the samples were analyzed with this method. Typical spectra taken with an
without X-ray absorber for the blood sample induced by 5.0 MeV H+ ion impact are represented
in Fig. 1. Eight elements, P, S, Cl, K, Ca, Fe, Zn, and Br, were detected. No significant
difference in the elemental concentrations was observed among the samples used here. The
ability of the Tandetron for PIXE analysis was also checked by use of one of the blood samples.
The spectrum shown in Fig. 2 indicates that the Tandetron is particularly suitable for the analysis
of light elements. Further investigation is in progress for the choice of appropriate experimental
parameters, such as bombarding energy, particle type, absorber, backing etc.
CI S
p~.' K
103 r S i ::: ~ ;. AI " .. '
Q)
c c
..... '"
: .. Ca
~ 10 2 ~/ ~ . "-. ~ c ~ o
U
o I
2 4
Blood No. 002
2.4 MeV He++50,u C
Fe
.. - ... - - . __ .... _- ...... -
1 I I
6 8 10 12 14 X- ray energy (ke V)
Fig. 2. X-ray spectrum of blood from a healthy persons induced by
2.4 MeV He++ ion impact without absorber. A Be backing is used.

79
III-2-S. Backscattering Spectra from Silicides
M. Uda, K. Hirose, N. Yokoyama, N. Imajo,
1. Odomari, K. Fuwa, and Y. Sasa
The Schottky barrier is formed at the interface between a metal and a semiconductor. Its
height for Si and silicide contact has been reported to be related linearly to the heat of formation 1)
and the work function2) of silicides. However, Pt-Si and Ir-Si systems are exceptions to such
empirical law. To get the general rule, bonding natures or electronic structures of outermost
shells of the silicides have to be investigated and classified systematically. For this purpose the
efforts to measure ESCA spectra of the silicides are indispensable.
A series of silicides is formed on Si by evaporating various metals on Si (111) in vacuum and
allowing them to diffuse into the substrate silicon. Thickness of the silicides formed is governed
by annealing temperature and duration. A degree of silicide formation was checked by the
backscattering technique for which the Tandetron (General Ionex Corp.) was used. 2.1 MeV
He++ beams were focused on specimens, whose diameter was 1 mmet>.
Backscattering spectra taken from a Ni-Si system are shown in Fig. 1 (a) - (c). When the
7J "~
500 '\....... : .... .i
( a)
250 " :
'-'-..../'
if)
~ Ot-----------~-o ~ u : .
:::2 ( b)
.~ 1 500 : .. r' ....
no c
'. 500 ~.:
'\.,,: ot-------------'.~·--
3000 ( c)
1 000 \. :' \~ ......
::'--.
:","J'/
2 OOOfr----............ \ .:
0~~110~-~9~0--'~~1~LiO---2~50J;---Ihl
Channel number
Fig. 1 (a). Backscattering spectrum for
a Ni-Si system annealed at 325° C for 2 h.
A peak at the right hand side is that
of pure Ni at the outermost layer. The
second peak which looks like a shoulder
to the first peak is that of Ni in Ni2 Si.
The third one is that of Si in Ni2 Si.
The forth one is that of pure Si which is
the substrate. (b) Backscattering spectrum
for the system annealed at 300°C for 17 h.
(c) Backscattering spectrum for the same
system, but annealed at 500° C for I h.

80
annealing temperature was low, pure nickel layer still remains at the outermost surface of the
specimen. Thus, the surface structure is described as Ni-Ni2 Si-Si in regular sequence from the
surface. After high temperature annealing, for example at 500°C, diffusion between Ni and Si
is almost completed as shown in Fig. I (c). The sample thus heat-treated will be submitted to
ESCA measurement.
References
I) J .M. Anderews and J.C. Phillips: Phys. Rev. Lett., li, 56 (1975).
2) J .L. Freeouf: Solid State Commun., 33, 1059 (1980).
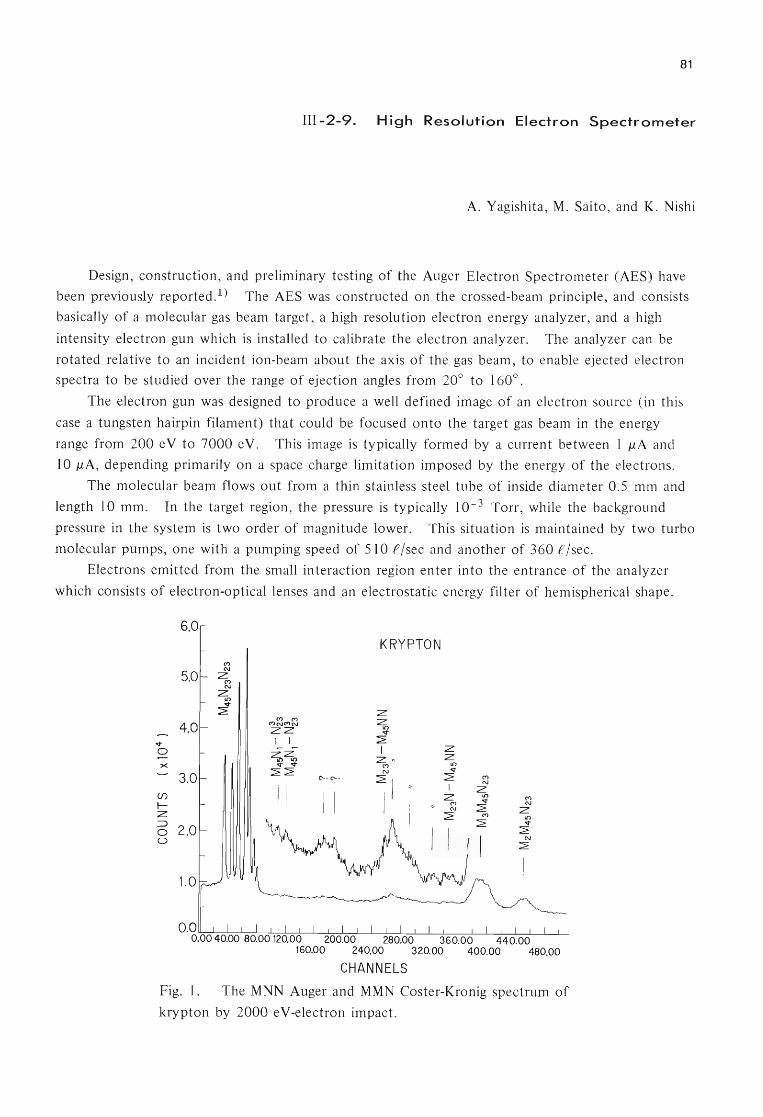
81
III-2-9. High Resolution Electron Spectrometer
A. Yagishita, M. Saito , and K. Nishi
Design, construction, and preliminary testing of the Auger Electron Spectrometer (AES) have
been previously reported.1) The AES was constructed on the crossed-beam principle, and consists
basically of a molecular gas beam target, a high resolution electron energy analyzer , and a high
intensity electron gun which is installed to calibrate the electron analyzer. The analyzer can be
rotated relative to an incident ion-beam about the axis of the gas beam, to enable ejected electron
spectra to be studied over the range of ejection angles from 20° to 160° .
The electron gun was designed to produce a well defined image of an electron source (in this
case a tungsten hairpin filament) that could be focused onto the target gas beam in the energy
range from 200 eV to 7000 eV. This image is typically formed by a current between I J1A and
10 J1A , depending primarily on a space charge limitation imposed by the energy of the electrons.
The molecular beam flows out from a thin stainless steel tube of inside diameter 0.5 mm and
length 10 mm. In the target region , the pressure is typically 10- 3 Torr , while the background
pressure in the system is two order of magnitude lower. This situation is maintained by two turbo
molecular pumps, one with a pumping speed of 510 f /sec and another of 360 e /sec.
Electrons emitted from the small interaction region enter into the entrance of the analyzer
which consists of electron-optical lenses and an electrostatic energy filter of hemispherical shape.
6.0 KRYPTON
C'l N
5.0 Z M N
Z 10 V ~
C'l M
4.0 C'lNC'lN zz v I 1 0 ~~ x v v
3.0 ~~ C'-.C'-.
if) 1/ I I I-z => 2.0 0 (.)
1.0
280.00 360.00 240.00 320.00
CHANNELS
Fig. 1. The MNN Auger and MMN Coster-Kronig spectrum of
krypton by 2000 eV-electron impact.
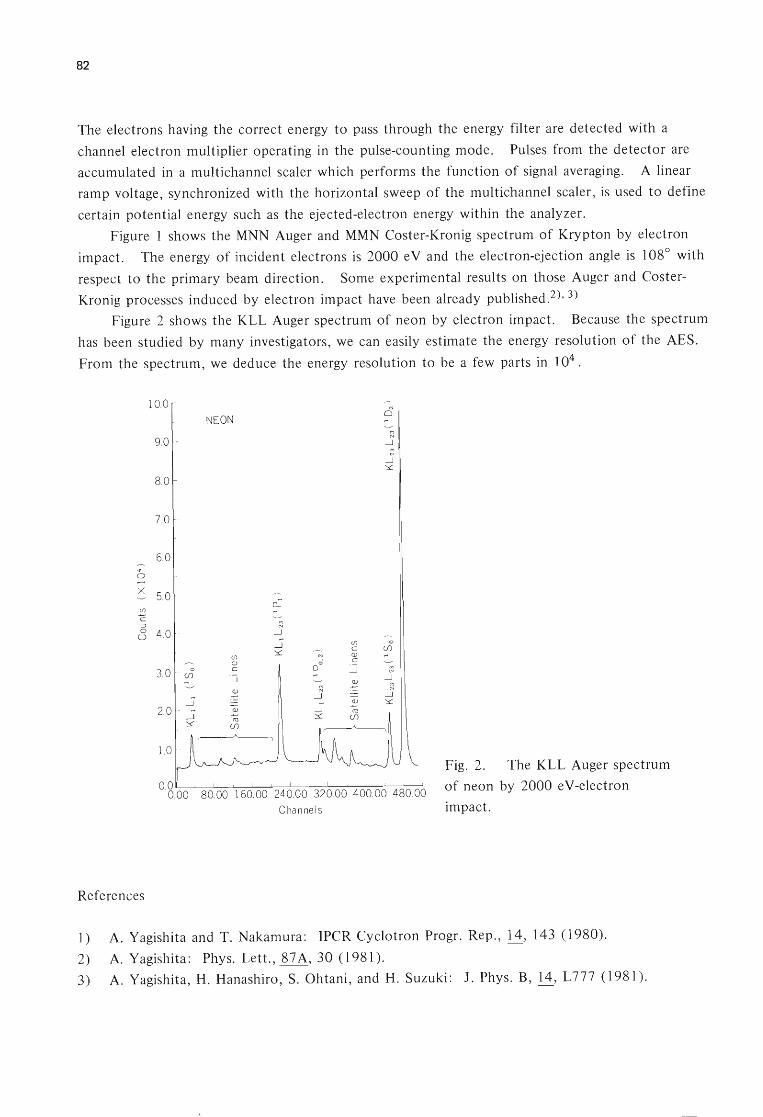
82
The electrons having the correct energy to pass through the energy filter are detected with a
channel electron multiplier operating in the pUlse-counting mode. Pulses from the detector are
accumulated in a multichannel scaler which performs the function of signal averaging . A linear
ramp voltage, synchronized with the horizontal sweep of the multichannel scaler, is used to define
certain potential energy such as the ejected-electron energy within the analyzer.
Figure I shows the MNN Auger and MMN Coster-Kronig spectrum of Krypton by electron
impact. The energy of incident electrons is 2000 e V and the electron-ejection angle is 108° with
respect to the primary beam direction. Some experimental results on those Auger and Coster
Kronig processes induced by electron impact have been already published.2), 3)
Figure 2 shows the KLL Auger spectrum of neon by electron irnpact. Because the spectrum
has been studied by many investigators, we can easily estimate the energy resolution of the AES.
From the spectrum , we deduce the energy resolution to be a few parts in 104 .
10.0
NEON
9.0
8.0
7.0
6.0
0 x
5.0 .......,
(/)
c ~ 0 4.0 0
(/) (l)
3.0 0 c
(f) :J :::......
~ 2
2.0 ~ ~
1.0
00 0.00
References
0::-~
.-J
~ (/)
~ c
N (j)
rf c .-J
~
"---' 2 .-J
2
Channels
13 ~ .......,
'" N
.-J
'" N
.-J ~
0
(j)
"---'
N
.-J
~ ~
Fig. 2. The KLL Auger spectrum
of neon by 2000 e V-electron
impact.
1) A. Yagishita and T. Nakamura: IPCR Cyclotron Progr. Rep., li, 143 (1980).
2) A. Yagishita: Phys. Lett., 87A, 30 (1981) .
3) A. Yagishita, H. Hanashiro, S. Ohtani, and H. Suzuki: J. Phys. B, .!..i, L 777 (1981).
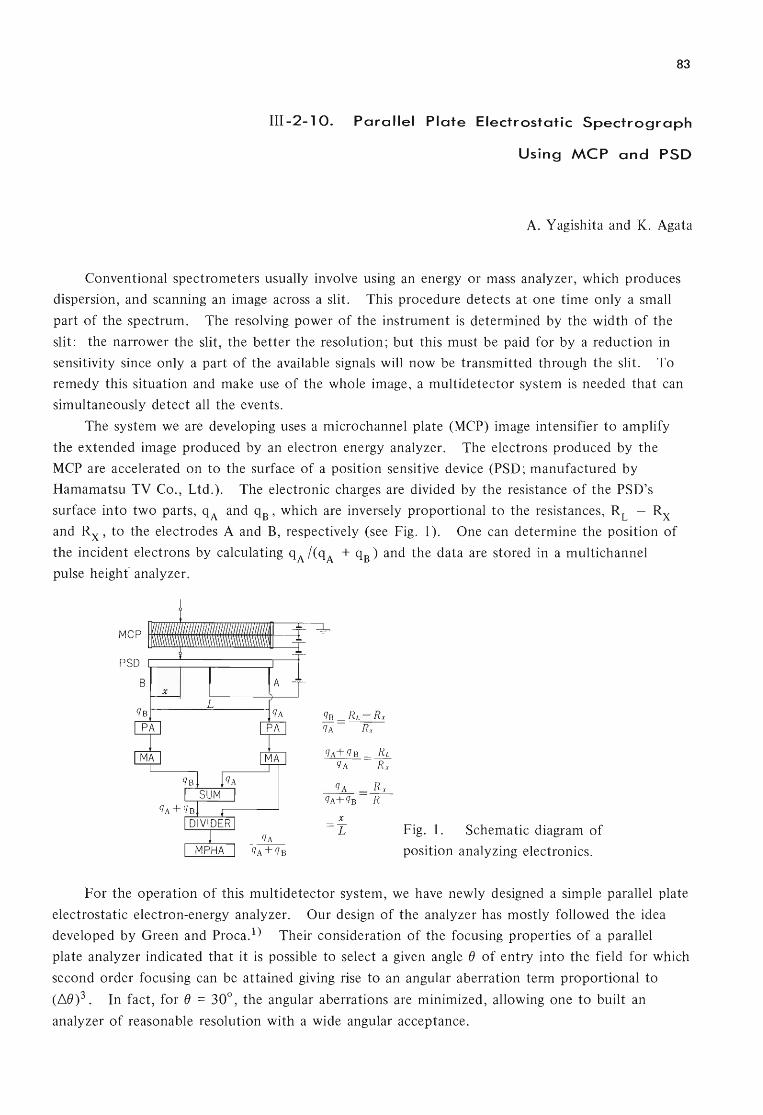
83
III-2-10. Parallel Plate Electrostatic Spectrograph
Using MCP and PSD
A. Yagishita and K. Agata
Conventional spectrometers usually involve using an energy or mass analyzer, which produces
dispersion, and scanning an image across a slit. This procedure detects at one time only a small
part of the spectrum. The resolving power of the instrument is determined by the width of the
slit: the narrower the slit, the better the resolution; but this must be paid for by a reduction in
sensitivity since only a part of the available signals will now be transmitted through the slit. To
remedy this situation and make use of the whole image, a multidetector system is needed that can
simultaneously detect all the events.
The system we are developing uses a microchannel plate (MCP) image intensifier to amplify
the extended image produced by an electron energy analyzer. The electrons produced by the
MCP are accelerated on to the surface of a position sensitive device (PSD; manufactured by
Hamamatsu TV Co., Ltd.). The electronic charges are divided by the resistance of the PSD's
surface into two parts, qA and qB' which are inversely proportional to the resistances, RL - Rx
and Rx ' to the electrodes A and B, respectively (see Fig. 1). One can determine the position of
the incident electrons by calculating qA /(qA + qB) and the data are stored in a multichannel
pulse height" analyzer.
Mep __ ---I=j PSD
8
qB =RL - Rx qA Rx
x =r Fig. 1. Schematic diagram of
position analyzing electronics .
For the operation of this multidetector system, we have newly designed a simple parallel plate
electrostatic electron-energy analyzer. Our design of the analyzer has mostly followed the idea
developed by Green and Proca. 1) Their consideration of the focusing properties of a parallel
plate analyzer indicated that it is possible to select a given angle () of entry into the field for which
second order focusing can be attained giving rise to an angular aberration term proportional to
(6.())3. In fact, for () = 30°, the angular aberrations are minimized, allowing one to built an
analyzer of reasonable resolution with a wide angular acceptance.
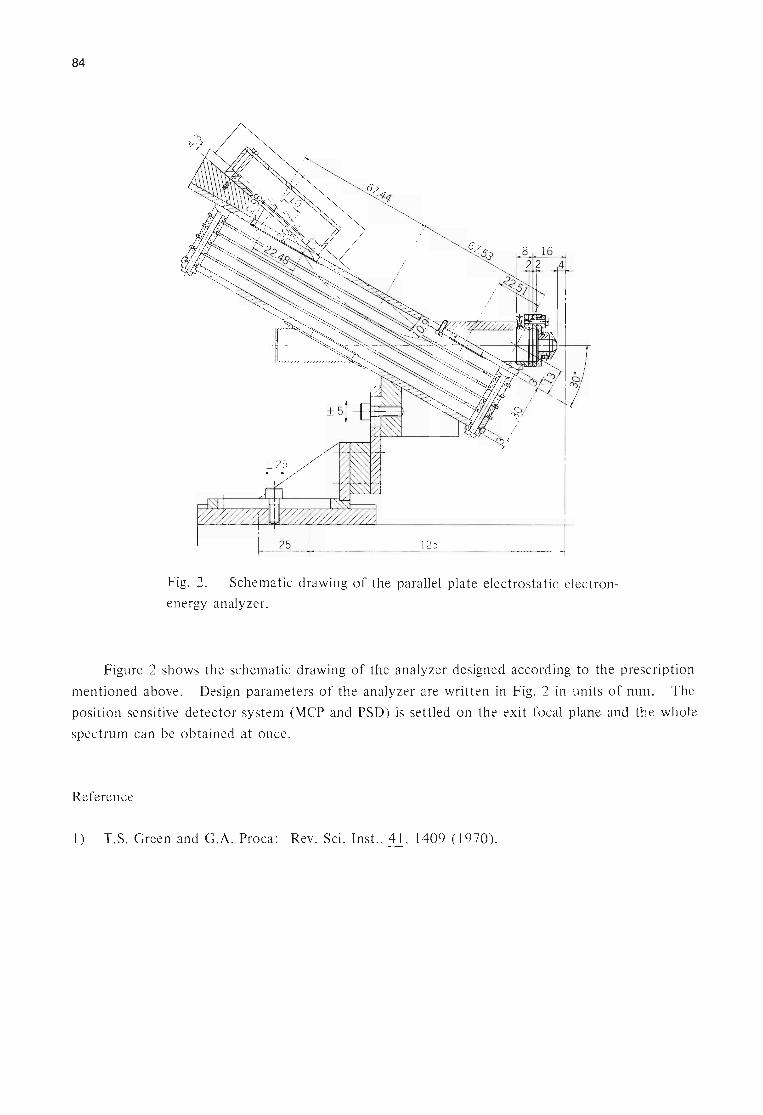
84
8 16 22 4
125
Fig. 2. Schematic drawing of the parallel plate electrostatic electron-
energy analyzer.
Figure 2 shows the schematic drawing of the analyzer designed according to the prescription
mentioned above. Design parameters of the analyzer are written in Fig. 2 in units of mm. The
position sensitive detector system (Mep and PSD) is settled on the exit focal plane and the whole
spectrum can be obtained at once.
Reference
1) T.S. Green and G.A. Proca: Rev. Sci. Inst., ±l., 1409 (1970).
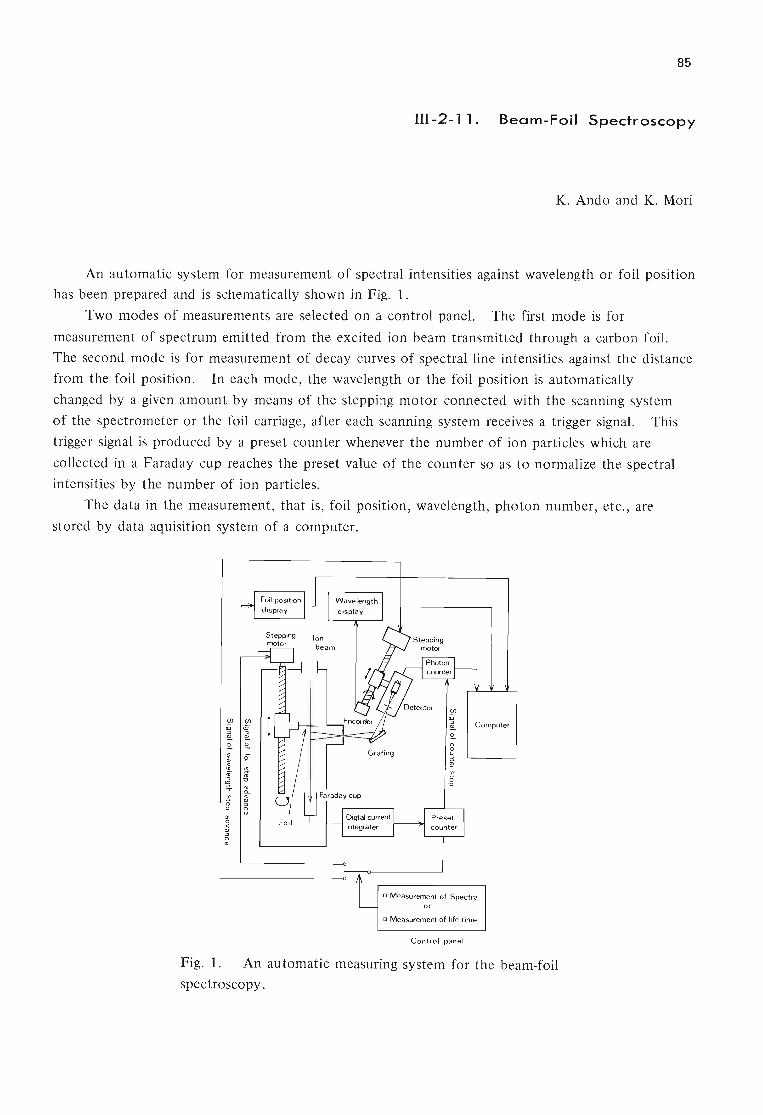
85
III -2- 1 1 . Beam-Foil Spectroscopy
K. Ando and K. Mori
An automatic system for measurement of spectral intensities against wavelength or foil position
has been prepared and is schematically shown in Fig. 1.
Two modes of measurements are selected on a control panel. The first mode is for
measurement of spectrum emitted from the excited ion beam transmitted through a carbon foil.
The second mode is for measurement of decay curves of spectral line intensities against the distance
from the foil position. In each mode, the wavelength or the foil position is automatically
changed by a given amount by means of the stepping motor connected with the scanning system
of the spectrometer or the foil carriage , after each scanning system receives a trigger signal. This
trigger signal is produced by a preset counter whenever the number of ion particles which are
collected in a Faraday cup reaches the preset value of the counter so as to normalize the spectral
intensities by the number of ion particles.
The data in the measurement, that is, foil position, wavelength, photon number, etc., are
stored by data aquisition system of a computer.
Stepping Ion motor
o Measurement of Spectra o r
o Measurement of life time
Control panel
Fig. 1. An automatic measuring system for the beam-foil
spectroscopy.
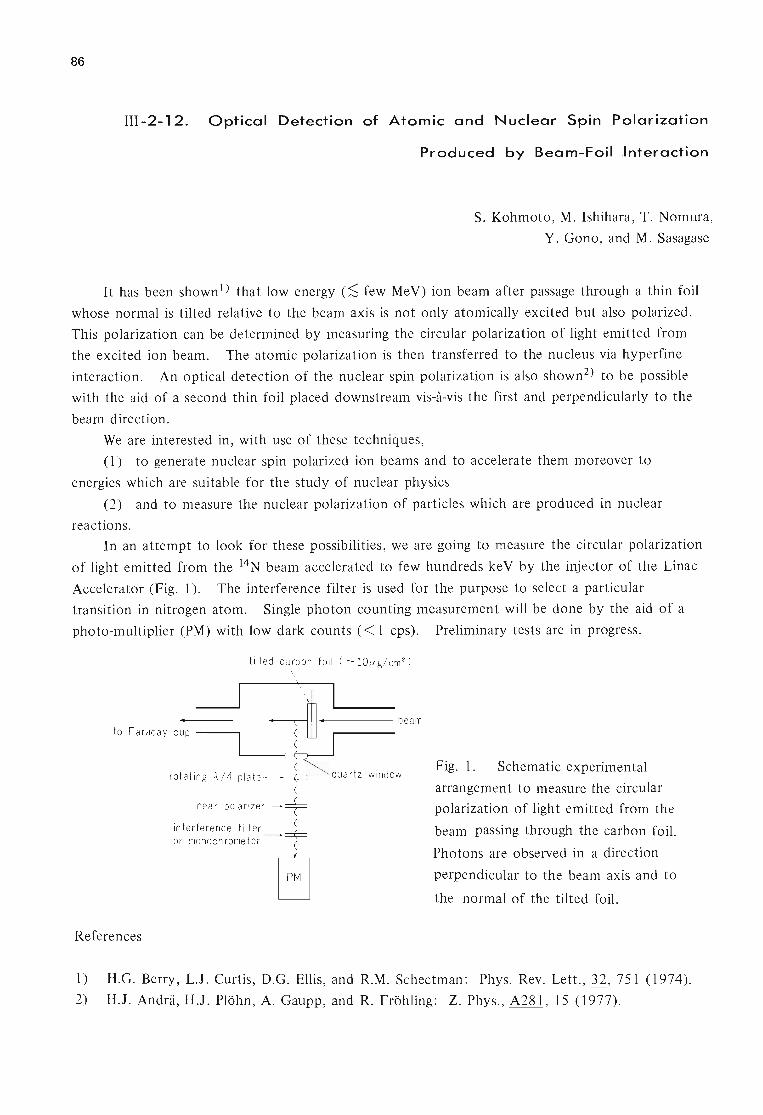
86
III-2-12. Optical Detection of Atomic and Nuclear Spin Polarization
Produced by Beam-Foil Interaction
S. Kohmoto, M. Ishihara, T. Nomura,
Y. Gono, and M. Sasagase
It has been shown1) that low energy (~ few MeV) ion beam after passage through a thin foil
whose normal is tilted relative to the beam axis is not only atomically excited but also polarized.
This polarization can be determined by measuring the circular polarization of light emitted from
the excited ion beam. The atomic polarization is then transferred to the nucleus via hyperfine
interaction. An optical detection of the nuclear spin polarization is also shown2) to be possible
with the aid of a second thin foil placed downstream vis-a-vis the first and perpendicularly to the
beam direction.
We are interested in, with use of these techniques,
(1) to generate nuclear spin polarized ion beams and to accelerate them moreover to
energies which are suitable for the study of nuclear physics
(2) and to measure the nuclear polarization of particles which are produced in nuclear
reactions.
In an attempt to look for these possibilities, we are going to measure the circular polarization
of light emitted from the 14N beam accelerated to few hundreds keV by the injector of the Linac
Accelerator (Fig. 1). The interference filter is used for the purpose to select a particular
transition in nitrogen atom. Single photon counting measurement will be done by the aid of a
photo-multiplier (PM) with low dark counts « 1 cps). Preliminary tests are in progress.
to Faraday cup ---.
rotat in g A / 4 plate -
I inear polar izer -
interfere nce filter or monoch rometer -~~=
PM
References
-----beam
Fig. 1. Schematic experimental
arrangement to measure the circular
polarization of light emitted from the
beam passing through the carbon foil.
Photons are observed in a direction
perpendicular to the beam axis and to
the normal of the tilted foil.
1) H.G. Berry, L.J. Curtis, D.G. Ellis, and R.M. Schectman: Phys. Rev. Lett., 32, 751 (1974).
2) H.J. Andrii, H.J. Plohn, A. Gaupp, and R. Frohling: Z. Phys., A281 , 15 (1977).
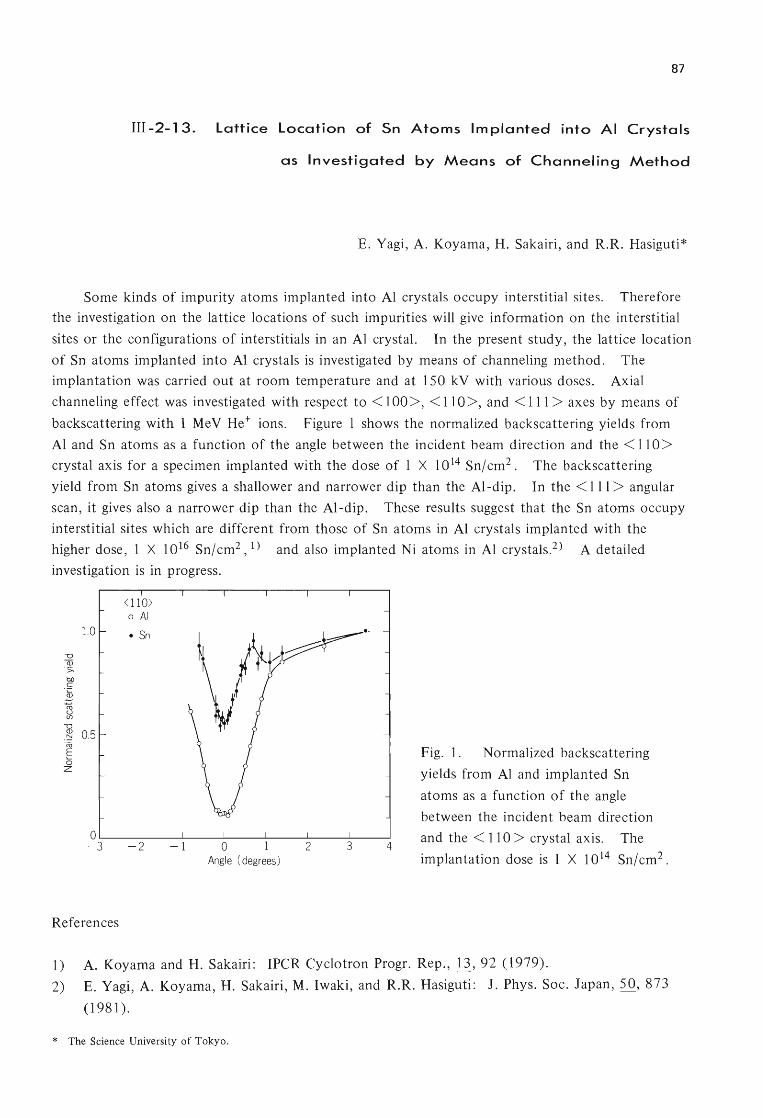
87
III-2-13. lattice location of Sn Atoms Implanted into AI Crystals
as Investigated by Means of Channeling Method
E. Vagi, A. Koyama, H. Sakairi, and R.R. Hasiguti *
Some kinds of impurity atoms implanted into Al crystals occupy interstitial sites. Therefore
the investigation on the lattice locations of such impurities will give information on the interstitial
sites or the configurations of interstitials in an Al crystal. In the present study, the lattice location
of Sn atoms implanted into Al crystals is investigated by means of channeling method. The
implantation was carried out at room temperature and at 150 kV with various doses. Axial
channeling effect was investigated with respect to <100>, <110>, and <Ill> axes by means of
backscattering with 1 MeV He+ ions. Figure 1 shows the normalized backscattering yields from
Al and Sn atoms as a function of the angle between the incident beam direction and the < 110>
crystal axis for a specimen implanted with the dose of 1 X 10¹⁴ Sn/ cm2 . The back scattering
yield from Sn atoms gives a shallower and narrower dip than the AI-dip. In the < 111 > angular
scan, it gives also a narrower dip than the AI-dip. These results suggest that the Sn atoms occupy
interstitial sites which are different from those of Sn atoms in Al crystals implanted with the
higher dose, 1 X 10¹⁶ Sn/cm2 , 1) and also implanted Ni atoms in Al crystals.2) A detailed
investigation is in progress.
<110) 0 AI
1.0 • Sn
-0 Q3 ->-tID c
~ C\l <..) (f)
-0 (l) 0.5 -!::::! m E 0 z
o~ __ ~ ____ ~ __ ~ ____ ~ ____ ~ __ ~ __ ~ -3 -2 -1 0 2 3 4
Angle (degrees)
References
Fig. 1. Normalized backscattering
yields from Al and implanted Sn
atoms as a function of the angle
between the incident beam direction
and the < 110 > crystal axis. The
implantation dose is 1 X 10¹⁴ Sn/cm2 .
1) A. Koyama and H. Sakairi: IPCR Cyclotron Progr. Rep., 11, 92 (1979).
2) E. Vagi, A. Koyama, H. Sakairi, M. Iwaki, and R.R. Hasiguti: 1. Phys. Soc. Japan, 50, 873
(1981).
* The Science University of Tokyo.
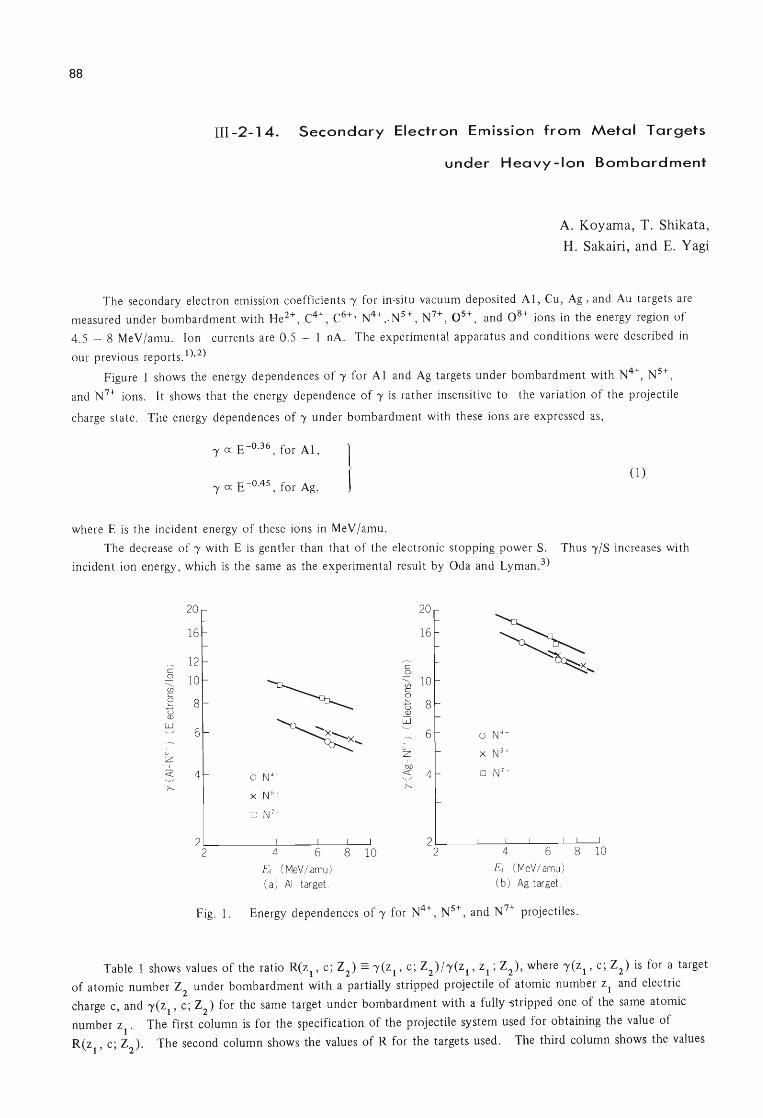
88
III -2- 1 4. Secondary Electron Em ission from Metal Targets
under Heavy-Ion Bombardment
A. Koyama, T. Shikata,
H. Sakairi, and E. Yagi
The secondary electron emission coefficients 'Y for in-situ vacuum deposited AI , Cu, Ag , and Au targets are
measured under bombardment with He2+ , C4 +, C6 + , N4 + " N5 +, N7+, 0 5+ , and 0 8 + ions in the energy region of
4.5 - 8 MeV /amu . Ion currents are 0.5 - 1 nA. The experimental apparatus and conditions were described in
our previous reports.1),2)
Figure 1 shows the energy dependences of 'Y for Al and Ag targets under bombardment with N4 +, N5+ ,
and N7+ ions. It shows that the energy dependence of 'Y is rather insensitive to the variation of the projectile
charge state. Tlle energy dependences of 'Y under bombardment with these ions are expressed as ,
'Y 0: E -0.36, for AI ,
'Y 0: E -0.45 , for Ag , } (1)
where E is the incident energy of these ions in MeV /amu.
The decrease of'Y with E is gentler than that of the electronic stopping power S. Thus 'Y/S increases with
incident ion energy, which is the same as the experimental result by Oda and Lyman. 3)
Table I shows values of the ratio R(zl' c; Z2) == 'Y(Zl' c; Z2)/'Y(zl ' zl; Z2)' where 'Y(zl' c; Z2) is for a target of atomic number Z2 under bombardment with a partially stripped projectile of atomic number Zl and electric
charge c, and 'Y(zl' c; Z2) for the same target under bombardment with a fully -stripped one of the same atomic
number zl' The first column is for the specification of the projectile system used for obtaining the value of
R(zl' c; Z2). The second column shows the values of R for the targets used. The third column shows the values
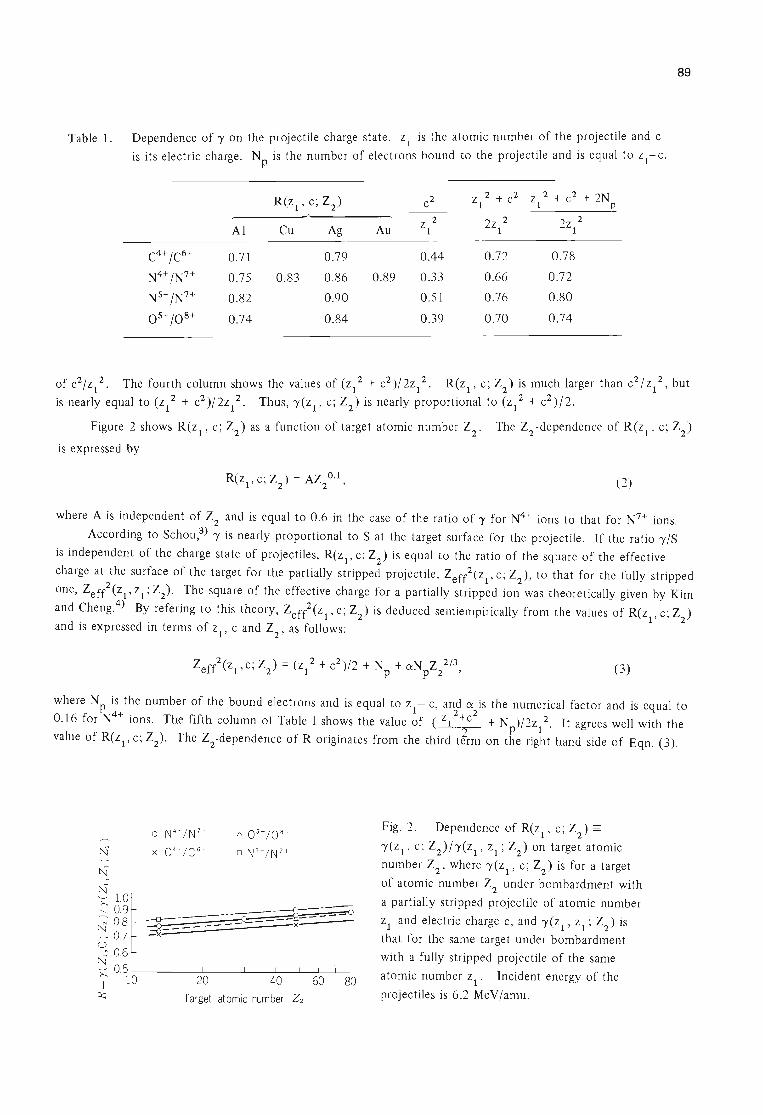
Table 1. Dependence of 'Y on the projectile charge state. Zl is the atomic number of the projectile and c
is its electric charge. N is the number of electrons bound to the projectile and is equal to zl-c. p
R(ZI' c; Z2) c2 Z 2 + c2 Z 2 + c2 + 2N 1 I P
Z 2 2z 2 2z 2 Al Cu Ag Au I 1 1
C4 + /C6+ 0.71 0.79 0.44 0.72 0.7 8
N4 + /N7+ 0.75 0.83 0.86 0.89 0.33 0.66 0.72
N5+ /N7+ 0.82 0.90 0.51 0.76 0.80
0 5+ /0 8+ 0.74 0.84 0.39 0.70 0.74
89
of c2/z 2. The fourth column shows the values of (z 2 + c2)/2z12. R(ZI' c; Z2) is much larger than C2
/z12
, but I 122
is nearly equal to (Z1 2 + c2)/2z12. Thus, 'Y(zl' c; Z2) is nearly proportional to (zl + c )/2.
Figure 2 shows R(zl' c; Z2) as a function of target atomic number Z2' The Z2 -dependence of R(zl' c; Z2)
is expressed by
R(z c· Z ) = AZ 0.1 I' , 2 2' (2)
where A is independent of Z2 and is equal to 0.6 in the case of the ratio of 'Y for N4+ ions to that for N7+ ions.
According to Schou,3) 'Y is nearly proportional to S at the target surface for the projectile. If the ratio 'Y/S
is independent of the charge state of projectiles, R(ZI' c; Z2) is equal to the ratio of the square of the effective
charge at the surface of the target for the partially stripped projectile, Zeff2(zl' c; Z2)' to that for the fully stripped
one, Zef?(zl' Zl; Z). The square of the effective charge for a partially stripped ion was theoretically given by Kim
and Cheng.4) By refering to this theory, Zef?(zl' c; Z2) is deduced semiempirically from the values of R(zl' c; Z2)
and is expressed in terms of Zl' C and Z2' as follows:
Z 2(Z c· Z ) = (z 2 + c2)/2 + N + aN Z 2/3 eff I" 2 1 P P 2 ' (3)
where N is the number of the bound electrons and is equal to Z - c, and a is the numerical factor and is equal to p I 2 2
0.16 for N4 + ions. The fifth column of Table 1 shows the value of (zl +c + Np)/2z12. It agrees well with the
value of R(zl' c; Z2)' The Z2 -dependence of R originates from the third tlrm on the right hand side of Eqn. (3).
o N4 +/ N7 +
X C4+/C6 +
/::, 0 5 +/0 8 +
o N5 +/ N7 +
~ 1.0! ~~! ~~=--~-~~~ ~ 0,5 L-______ ~1 ______ -L __ ~' __ ~~'~'~ __
II 10 20 40 60 80
~ Target atomic number Z2
Fig. 2. Dependence of R(zl ' c; Z) ==
'Y(ZI' c; Z) / 'Y(ZI ' Zl ; Z2) on target atomic
number Z2' where 'Y(ZI' c; Z2) is for a target
of atomic number Z2 under bombardment with
a partially stripped projectile of atomic number
Zl and electric charge c, and 'Y(zl ' Zl ; Z2) is
that for the same target under bombardment
with a fully stripped projectile of the same
atomic number zl . Incident energy of the
projectiles is 6.2 MeV /amu.

90
References
1) A. Koyama, T. Shikata, H. Sakairi, and E. Yagi: Jpn. 1. Appl. Phys., 20,65 (1981).
2) A. Koyama, T . Shikata, and H. Sakairi: IPCR Cyclotron Progr. Rep., 11,83 (1979).
3) N. Oda and 1. T. Lyman: Radiat. Res.,.2: Suppl., p. 20 (1967).
4) Y. K. Kim and K. Cheng: Phys. Rev., A 22,61 (1980).
91
III-2-15. Distributions of the Hyperfine Magnetic Field at
119 119 Sn (- Sb) on the Surfaces of a-Fe20 3
T. Okada, H. Sekizawa, F. Ambe, and S. Ambe
The present work aims to utilize emission Mossbauer measurement of the supertransferred
hyperfine (hereafter abbreviated as STHF) magnetic fields in studying the chemical state of very
dilute antimony ions "adsorbed" onto the surfaces of oxides. In the actual work, the technique
of emission Mossbauer spectroscopy of 119Sn, with 119Sb as the source nuclide, has been applied to
the study of carrier-free pentavalent antimony ions adsorbed on the surfaces of corundum type
antiferromagnetic oxide, a-Fe2 03 (Neel temperature: 950 K). In the measurement, Mossbauer
analysis was made on the 23.8 keY ')'-rays emitted by 119Sn nuclei in the first excited state (119Sn*,
half life : 17.8 ns) arising from 119Sb (half life: 38.0 h) by the Ee decay.
The nature of the chemical bonds formed by 119Sb ions on the oxide surfaces is explicitly
reflected in the emission spectra as the STHF interaction of 119Sn* (~119Sb) with its magnetic
environment.
Experimental procedures and a part of the experimental results have already been reported in
a previous report. 1) The present report is concerned with the results of subsequent detailed
research.
Emission Mossbauer spectra of the "as adsorbed" (A) and 2 h heat-treated (B to E)
a-Fe2
03
- 119Sb5+ specimens at liquid nitrogen temperature are shown in Fig. 1. The
temperatures of heat treatments were 200°C (B), 4000 e (e), 5000 e (D), and 700°C (E). The
spectrum of a specimen (F), obtained by coprecipitating carrier-free 119Sb5+ with Fe3+ from an
aqueous solution with subsequent calcination in air at 7000 e for 2 h, is also given in Fig. 1.
Even in the "as adsorbed" specimen (Fig. 1 A), there can be seen a remarkably broadened
emission line, which transforms gradually into the six-line magnetic hyperfine pattern (B - E) with
elevation of temperature of the isochronal heat treatment. We attribute the observed broadening
and splitting to magnetic interaction of the 119Sn (~119Sb) ions with the magnetically ordered Fe3+
ions of the a-Fe2 0 3 substrate. The distributions of hyperfine magnetic fields (Hhf) obtained by
analyzing the spectra by means of the method of Hesse2) are shown in Fig. 2. The spectra were
also analyzed by the method of Window 3) and the results were in good agreement with those by
the method of Hesse. Measurements at room temperature gave distributions of Hhf similar in
trend to those at liquid nitrogen temperature. This similarity is compatible with the fact that the
Neel temperature of a-Fe2 0 3 (950 K) is much higher than the above two temperatures of
measurement
The other parameters were also derived from Mossbauer emission spectra. From the values
of isomer shift it is certain that the 119Sn ions resulting from 119Sb5+ were tetravalent in all the
a-Fe2 0 3 specimens. The isomer shifts showed a temperature dependence expected from the
second order Doppler shift. The ratios of the adsorption areas of the spectra at room temperature
to that at liquid nitrogen temperature were in the range of 0.7 - 0.8 in the coprecipitated (F), in
the heat-treated (B to E), and even in the "as adsorbed" specimens (A). It means that the
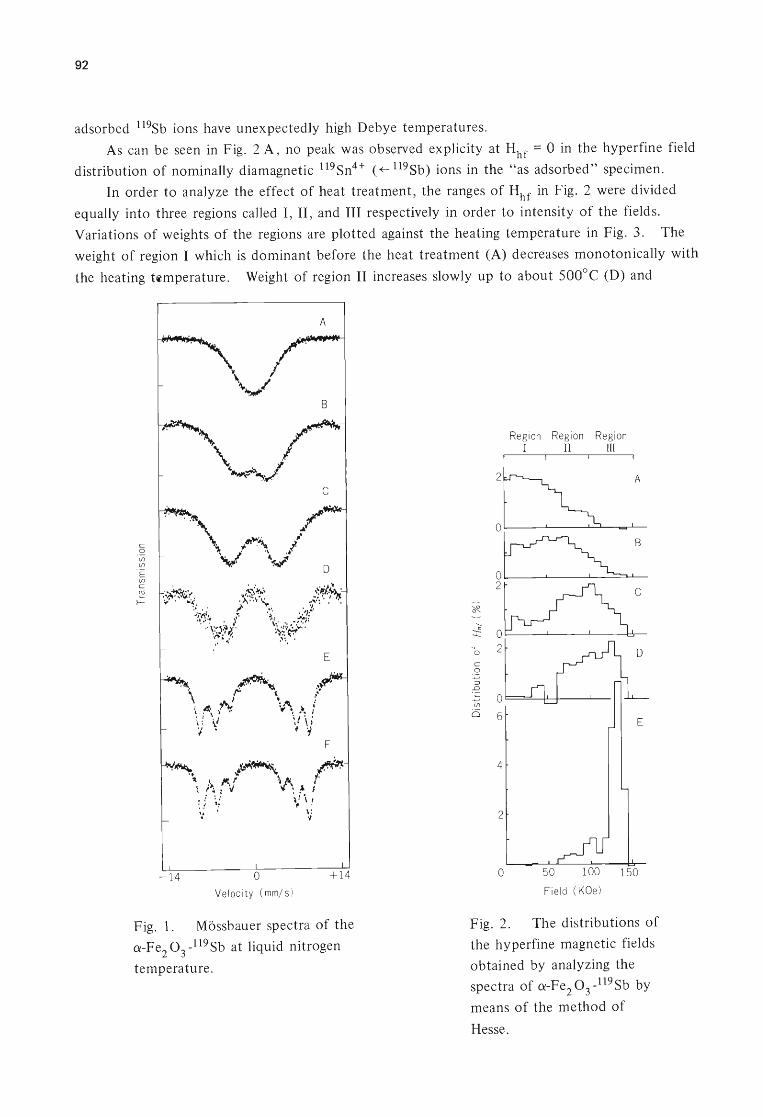
92
adsorbed 119Sb ions have unexpectedly high Debye temperatures.
As can be seen in Fig. 2 A , no peak was observed explicity at Hhf == 0 in the hyperfine field
distribution of nominally diamagnetic 119Sn4+ (+- 119Sb) ions in the "as adsorbed" specimen.
In order to analyze the effect of heat treatment, the ranges of Hh f in Fig. 2 were divided
equally into three regions called I , II , and III respectively in order to intensity of the fields.
Variations of weights of the regions are plotted against the heating temperature in Fig. 3. The
weight of region I which is dominant before the heat treatment (A) decreases monotonically with
the heating h~mperature. Weight of region II increases slowly up to about 500°C (D) and
c .<2 (j) (j)
E (j)
c cu ~
-1 4 o Veloc ity ( mm/ s)
A
B
c
+ 14
Fig. 1. Mossbauer spectra of the
a-Fe2
03 _119 Sb at liquid nitrogen
temperature.
Reg ion Region Reg ion I II III
E
4
2
o 50 100 150
Fi eld ( KOe)
Fig. 2. The distributions of
the hyperfine magnetic fields
obtained by analyzing the
spectra of a-Fe2 03 _119 Sb by
means of the method of
Hesse.

~
* "a'100 o
-.-4
~ 80 o ~
&: 60
o
1m IT ! .. ~" ... --'tj .,.' '\
... , . \
" . \ , , ... ' . ~
/ / I
./\ , ... ,
.. . • /~ I '-.1 •• ---I. __ ...I....-_~ ......
o 400 800 1200 (OC)
Anneal ing Temperature
Fig. 3. Dependence of the relative fraction
of the distribution on the heating temperature.
93
decreases abruptly above it. The decrease in the weight of region II is accompanied with rapid
increase in the weight of region III, which dominated at the heating temperature of 700°C (E).
The distribution of specimen (E) is almost equal to that of the coprecipitated specimen (F), which
means that the adsorbed 119Sb ions diffused into the substrate deep enough by 2 h heat treatment
at 700°C so as to make the daughter 119Sn nuclei to feel the same hyperfine magnetic fields as the
ones on the daughter 119Sn of the coprecipitated 119Sb ions. These variations of hyperfine field
distribution by heat treatment were interpreted in terms of the STHF interactions on 119 Sn4+
(+- 119Sb) ions diffused into various sites of the surface structure of ~-Fe2 °3 . The detailed
discussion on the experimental results will be published elsewhere.
A similar investigation of Cr20 3 _ 119Sb is in progress.
References
1) T. Okada, H. Sekizawa, F. Ambe, and S. Ambe: IPCR Cyclotron Progr. Rep., !±, 86 (1980).
2) J. Hesse and A. Rubartsch: J. Phys. E: Sci. Instrum., 7, ~26 (1974).
3) B. Window: ibid., i, 401 (1971).

94
III -2-16. Angular Correlation Measurements on Nb-Mo System
N. Shiotani, T. Okada, H. Sekizawa, and T. Nakamichi
Niobium and molybdenum have nearly the same electronic band structure, especially at and
below the Fermi level. The Fermi level is higher in Mo than in Nb because of the extra valence
electron per atom. Consequently, measurements of the angular correlation of positron annihilation
radiation in a series of binary Nb-Mo alloys should provide information on how the addition of d
electrons to the unfilled d band changes the geometry of the Fermi surfaces.
Single crystals of Nb8oM02o and NbsoMoso were grown by zone melting in an argon arc
furnace. The angular correlation curves were measured by a parallel slit system at room
temperature. The results are shown in Fig. lea) - l(c). The effects of alloying can be seen in
changes of fine structures of the observed angular correlation curves.
(a )
Nb-Mo TJ, along [100 J
Vl
5
Nbso Moso
Nb
o 2.0
p, in atomic mits
(c )
Nb- Mo p, al ong [ 111 J
Vl
5
Nb;o Moso
Nb
G 1.0 20
P, in atomic uni ts
3.0
3.0
(b )
Nb- Mo p, along [1 1OJ
Nb
o 1.0 2.0 30
P, in at omiC uni ts
Fig. 1. Angular correlation curves
N(pz) of Nb, Nb80M02o ' and NbsoMoso' (a) Pz along [100] ,(b) Pz along [110],
and (c) Pz along [111] .
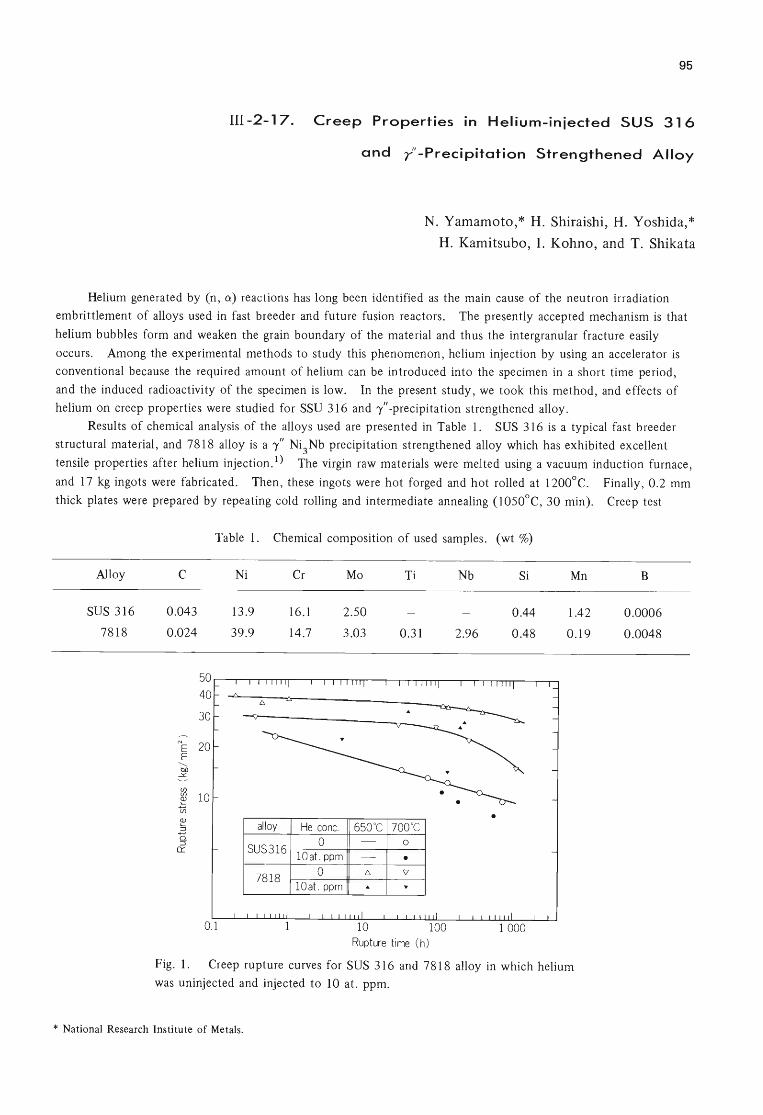
95
1II-2-17. Creep Properties in Helium-injected SUS 316
and ii-Precipitation Strengthened Alloy
N. Yamamoto,* H. Shiraishi, H. Yoshida,*
H. Kamitsubo, 1. Kohno, and T. Shikata
Helium generated by (n, a) reactions has long been identified as the main cause of the neutron irradiation
embrittlement of alloys used in fast breeder and future fusion reactors. The presently accepted mechanism is that
helium bubbles form and weaken the grain boundary of the material and thus the intergranular fracture easily
occurs. Among the experimental methods to study this phenomenon, helium injection by using an accelerator is
conventional because the required amount of helium can be introduced into the specimen in a short time period,
and the induced radioactivity of the specimen is low. In the present study, we took this method, and effects of
helium on creep properties were studied for SSU 316 and 'r" -precipitation strengthened alloy.
Results of chemical analysis of the alloys used are presented in Table 1. SUS 316 is a typical fast breeder
structural material, and 7818 alloy is a ,,/" Ni3 Nb precipitation strengthened alloy which has exhibited excellent
tensile properties after helium injection. I) The virgin raw materials were melted using a vacuum induction furnace,
and 17 kg ingots were fabricated. Then, these ingots were hot forged and hot rolled at 1200°C. Finally, 0.2 mm
thick plates were prepared by repeating cold rolling and intermediate annealing (l050°C, 30 min). Creep test
Alloy
SUS 316
7818
C
0.043
0.024
--.. NE E
'--. tID
..::.:.
~ ~ (f)
~ ~ 0. ::::J
0::
Table 1. Chemical composition of used samples. (wt %)
50
40
30
20
10
0.1
Ni
13.9
39.9
alloy
SUS316
7818
Cr
16.1
14.7
He conc. 0
Mo
2.50
3.03
650°C -
lOat. ppm -0 6.
10at. ppm .
Ti
0.31
700°C 0
• \l .
Rupture time (h)
Nb
2.96
• •
Si
0.44
0.48
Mn
1.42
0.19
Fig. 1. Creep rupture curves for SUS 316 and 7818 alloy in which helium
was uninjected and injected to 10 at. ppm.
* National Research Institute of Metals.
B
0.0006
0.0048

96
Table 2. Creep rupture properties of helium injected SUS 316 and 7818 alloy-.
Test temp. He conc. Stress Rupture Rupture
Alloy time elong. CC) (at. ppm) (kg/mm2) (h) (%)
23.0 0.7 49.7
15.1 33.2 57.2
13.3 73.4 61.4 0
12.5 134.7 55.2
SUS 316 700 11.0 364.2 59.5
9.8 724.2 53.3
{ 11.0 113.5 17.7
10 9.7 185.8 12.7
8.0 552.5 14.5
30.0 0.4 28.6
28.0 29.9 26.1
0 26.5 94.4 24.3
700 22.5 265.0 18.2
15.4 1128.7 11.8
{ 22.5 5.2 6.4 10
14.5 137.6 1.8
7818 40.1 0.2 29.8
38.0 1.0 30.2
36.0 0.5 35.0
35.1 114.9 31.6 0
34.5 135.4 41.8
650 34.0 253.4 31.1
32.5 387.8 28.2
29.0 1134.5 20.7
{ 32.5 38.4 0.8
10 28.0 225.5 4 .7
26.6 202.6 2.9
specimens were die-stamped out from these specimens. The dimension of gauge section was 10 mm long, 4 mm
wide , and 0.2 mm thick. Then, the specimens were solution treated for 30 min at 1050°C for SUS 316 and at
1100°C for 7818 alloy. This treatment resulted in the mean grain size of 46 J.1m and 69 J.1m , respectively.
Helium was injected at constant high temperature (650°C or 700°C), using the cyclotron. The injected helium
content of each specimen was about 10 at . ppm. The creep tests were carried out on the uninjected and injected
specimens at the same temperature with that for helium injection in flowing Ar gas of 99.999 % up purity. The
elongation at rupture was determined after testing by using a profile projector. The fracture surface of ruptured
specimens was examined by a scanning electron microscope. Transmission electron microscope examinations on
the fractured specimens were made mainly to study the morphology of helium bubbles.
The results of creep tests are shown in Table 2. As illustrated in Fig. 1, the decrease of the creep rupture
strength by helium in 7818 alloy was much higher than that in SUS 316 at 700°C, but appreciably improved at
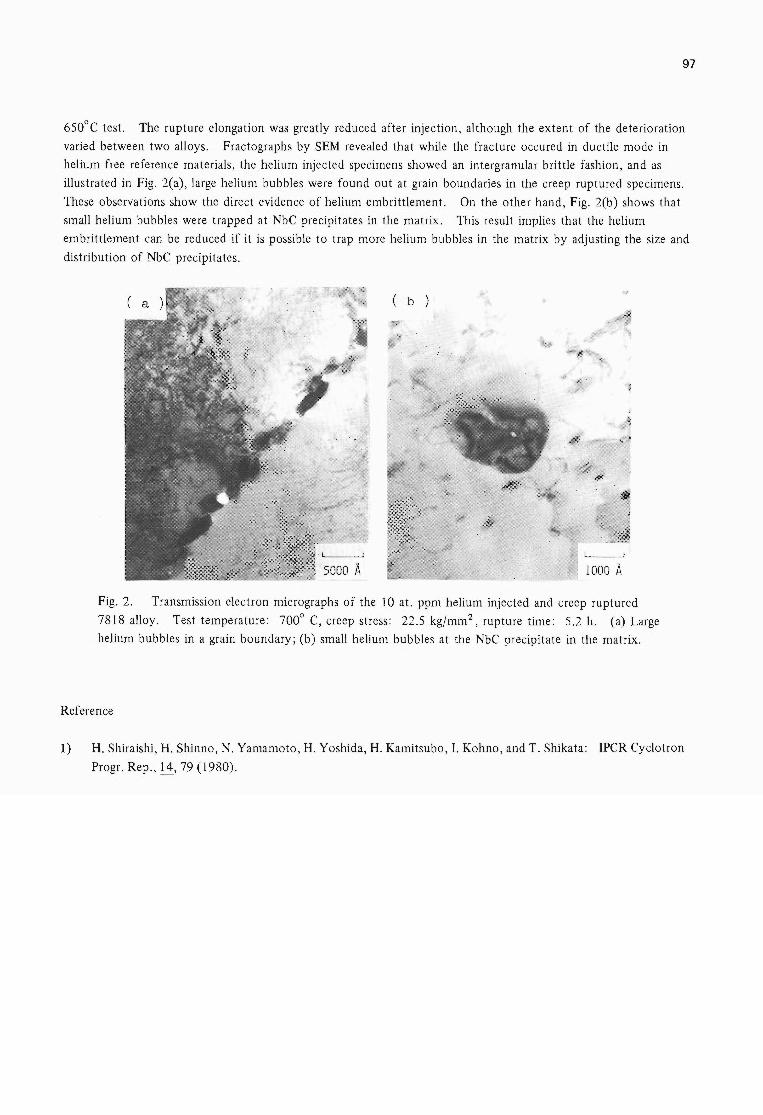
97
650°C test. The rupture elongation was greatly reduced after injection, although the extent of the deterioration
varied between two alloys. Fractographs by SEM revealed that while the fracture occured in ductile mode in
helium free reference materials, the helium injected specimens showed an intergranular brittle fashion, and as
illustrated in Fig. 2(a), large helium bubbles were found out at grain boundaries in the creep ruptured specimens.
These observations show the direct evidence of helium embrittlement. On the other hand, Fig. 2(b) shows that
small helium bubbles were trapped at NbC precipitates in the matrix. This result implies that the helium
embrittlement can be reduced if it is possible to trap more helium bubbles in the matrix by adjusting the size and
distribution of NbC precipitates.
( b )
1000 A
Fig. 2. Transmission electron micrographs of the 10 at. ppm helium injected and creep ruptured
7818 alloy. Test temperature: 700° C, creep stress: 22.5 kg/mm2, rupture time: 5.2 h. (a) Large
helium bubbles in a grain boundary; (b) small helium bubbles at the NbC precipitate in the matrix.
Reference
1) H. Shiraishi, H. Shinno, N. Yamamoto, H. Yoshida, H. Kamitsubo, I. Kohno, and T. Shikata: IPCR Cyclotron
Progr. Rep.,!±, 79 (1980).
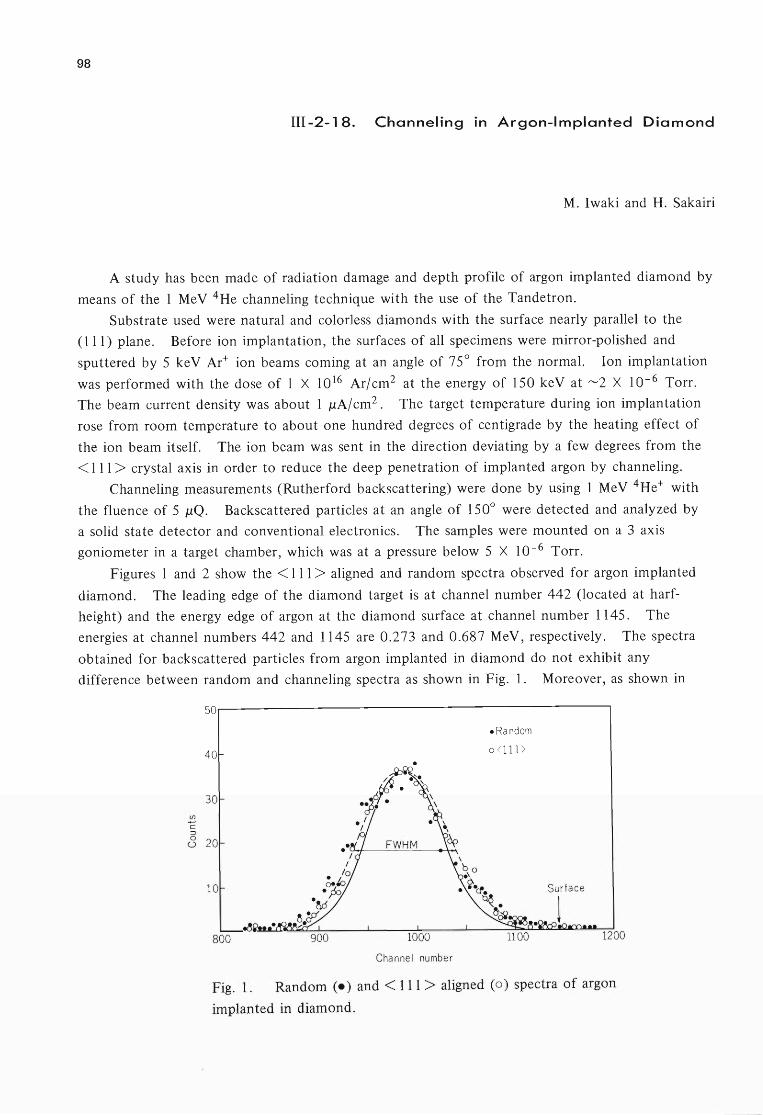
98
III-2-18. Channeling in Argon-Implanted Diamond
M. Iwaki and H. Sakairi
A study has been made of radiation damage and depth profile of argon implanted diamond by
means of the 1 MeV 4He channeling technique with the use of the Tandetron.
Substrate used were natural and colorless diamonds with the surface nearly parallel to the
(111) plane. Before ion implantation, the surfaces of all specimens were mirror-polished and
sputtered by 5 keV Ar+ ion beams coming at an angle of 75° from the normal. Ion implantation
was performed with the dose of 1 X 10¹⁶ Ar/cm2 at the energy of 150 keV at ""'2 X 10- 6 Torr.
The beam current density was about 1 J.1A/cm 2 . The target temperature during ion implantation
rose from room temperature to about one hundred degrees of centigrade by the heating effect of
the ion beam itself. The ion beam was sent in the direction deviating by a few degrees from the
< Ill> crystal axis in order to reduce the deep penetration of implanted argon by channeling.
Channeling measurements (Rutherford backscattering) were done by using 1 MeV 4He+ with
the fluence of 5 J1Q. Backscattered particles at an angle of 150° were detected and analyzed by
a solid state detector and conventional electronics. The samples were mounted on a 3 axis
goniometer in a target chamber, which was at a pressure below 5 X 10⁻⁶ Torr.
Figures 1 and 2 show the < III > aligned and random spectra observed for argon implanted
diamond. The leading edge of the diamond target is at channel number 442 (located at harf
height) and the energy edge of argon at the diamond surface at channel number 1145. The
energies at channel numbers 442 and 1145 are 0.273 and 0.687 MeV, respectively. The spectra
obtained for backscattered particles from argon implanted in diamond do not exhibit any
difference between random and channeling spectra as shown in Fig. 1. Moreover, as shown in
50
- Random
40 0 <111>
30
~ C ::J 0 20 0 FWHM
10 Surface
~~~ 1
800 1200
Channel number
Fig. 1. Random (.) and < III > aligned (0 ) spectra of argon
implanted in diamond.
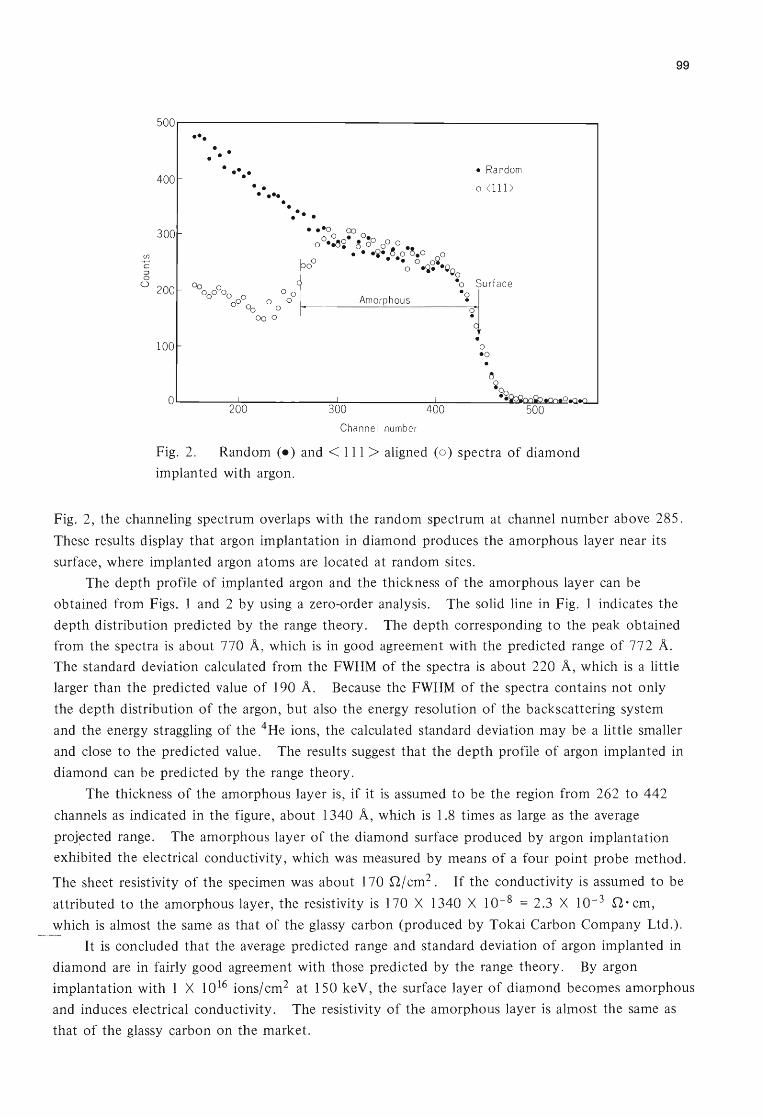
IJ)
C :J o
500.---------------------------------------------------~
•••
400r
300
• • • •
u 200
• 100 o . 0
•
o I 1 I
200 300 400
Channel numb er
Fig. 2. Random (.) and < III > aligned (0 ) spectra of diamond
implanted with argon.
99
Fig. 2, the channeling spectrum overlaps with the random spectrum at channel number above 285.
These results display that argon implantation in diamond produces the amorphous layer near its
surface, where implanted argon atoms are located at random sites.
The depth profile of implanted argon and the thickness of the amorphous layer can be
obtained from Figs. 1 and 2 by using a zero-order analysis. The solid line in Fig. 1 indicates the
depth distribution predicted by the range theory. The depth corresponding to the peak obtained
from the spectra is about 770 A, which is in good agreement with the predicted range of 772 A.
The standard deviation calculated from the FWHM of the spectra is about 220 A, which is a little
larger than the predicted value of 190 A. Because the FWHM of the spectra contains not only
the depth distribution of the argon, but also the energy resolution of the backscattering system
and the energy straggling of the 4He ions, the calculated standard deviation may be a little smaller
and close to the predicted value. The results suggest that the depth profile of argon implanted in
diamond can be predicted by the range theory.
The thickness of the amorphous layer is, if it is assumed to be the region from 262 to 442
channels as indicated in the figure, about 1340 A, which is 1.8 times as large as the average
proj~cted range. The amorphous layer of the diamond surface produced by argon implantation
exhibited the electrical conductivity, which was measured by means of a four point probe method.
The sheet resistivity of the specimen was about 170 n/ cm2 . If the conductivity is assumed to be
attributed to the amorphous layer, the resistivity is 170 X 1340 X 10- 8 = 2.3 X 10- 3 n·cm,
which is almost the same as that of the glassy carbon (produced by Tokai Carbon Company Ltd.).
It is concluded that the average predicted range and standard deviation of argon implanted in
diamond are in fairly good agreement with those predicted by the range theory. By argon
implantation with 1 X 10¹⁶ ions/cm2 at 150 keY, the surface layer of diamond becomes amorphous
and induces electrical conductivity. The resistivity of the amorphous layer is almost the same as
that of the glassy carbon on the market.
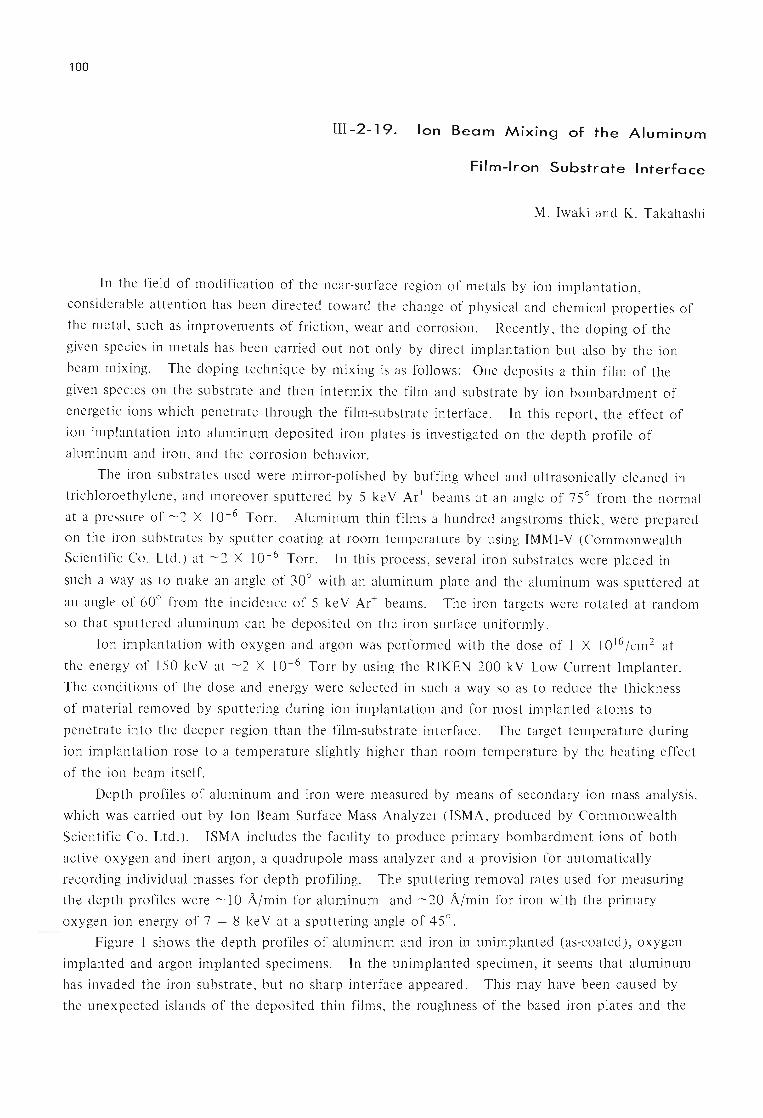
100
III -2-19. Ion Beam Mixing of the Aluminum
Film-Iron Substrate Interface
M. Iwaki and K. Takahashi
In the field of modification of the near-surface region of metals by ion implantation,
considerable attention has been directed toward the change of physical and chemical properties of
the metal, such as improvements of friction, wear and corrosion. Recently, the doping of the
given species in metals has been carried out not only by direct implantation but also by the ion
beam mixing. The doping technique by mixing is as follows: One deposits a thin film of the
given species on the substrate and then intermix the film and substrate by ion bombardment of
energetic ions which penetrate through the film-substrate interface. In this report, the effect of
ion implantation into aluminum deposited iron plates is investigated on the depth profile of
aluminum and iron, and the corrosion behavior.
The iron substrates used were mirror-polished by buffing wheel and ultrasonically cleaned in
trichloroethylene, and moreover sputtered by 5 ke V Ar+ beams at an angle of 75° from the normal
at a pressure of ""'2 X 10⁻⁶ Torr. Aluminum thin films a hundred angstroms thick, were prepared
on the iron substrates by sputter coating at room temperature by using IMMI-V (Commonwealth
Scientific Co. Ltd.) at ""'2 X 10- 6 Torr. In this proce~s, several iron substrates were placed in
such a way as to make an angle of 30° with an aluminum plate and the aluminum was sputtered at
an angle of 60° from the incidence of 5 ke V Ar+ beams. The iron targets were rotated at random
so that sputtered aluminum can be deposited on the iron surface uniformly.
Ion implantation with oxygen and argon was performed with the dose of 1 X 10¹⁶ /cm 2 at
the energy of 150 ke V at ""'2 X 10- 6 Torr by using the RIKEN 200 kV Low Current Implanter.
The conditions of the dose and energy were selected in such a way so as to reduce the thickness
of material removed by sputtering during ion implantation and for most implanted atoms to
penetrate into the deeper region than the film-substrate interface. The target temperature during
ion implantation rose to a temperature slightly higher than room temperature by the heating effect
of the ion beam itself.
Depth profiles of aluminum and iron were measured by means of secondary ion mass analysis,
which was carried out by Ion Beam Surface Mass Analyzer (lSMA, produced by Commonwealth
Scientific Co. Ltd.). ISMA includes the facility to produce primary bombardment ions of both
active oxygen and inert argon, a quadrupole mass analyzer and a provision for automatically
recording individual masses for depth profiling. The sputtering removal rates used for measuring
the depth profiles were ""'10 A/min for aluminum and ""'20 A/min for iron with the primary
oxygen ion energy of 7 - 8 ke V at a sputtering angle of 45° .
Figure I shows the depth profiles of aluminum and iron in unimplanted (as-coated), oxygen
implanted and argon implanted specimens. In the unimplanted specimen, it seems that aluminum
has invaded the iron substrate, but no sharp interface appeared. This may have been caused by
the unexpected islands of the deposited thin films, the roughness of the based iron plates and the
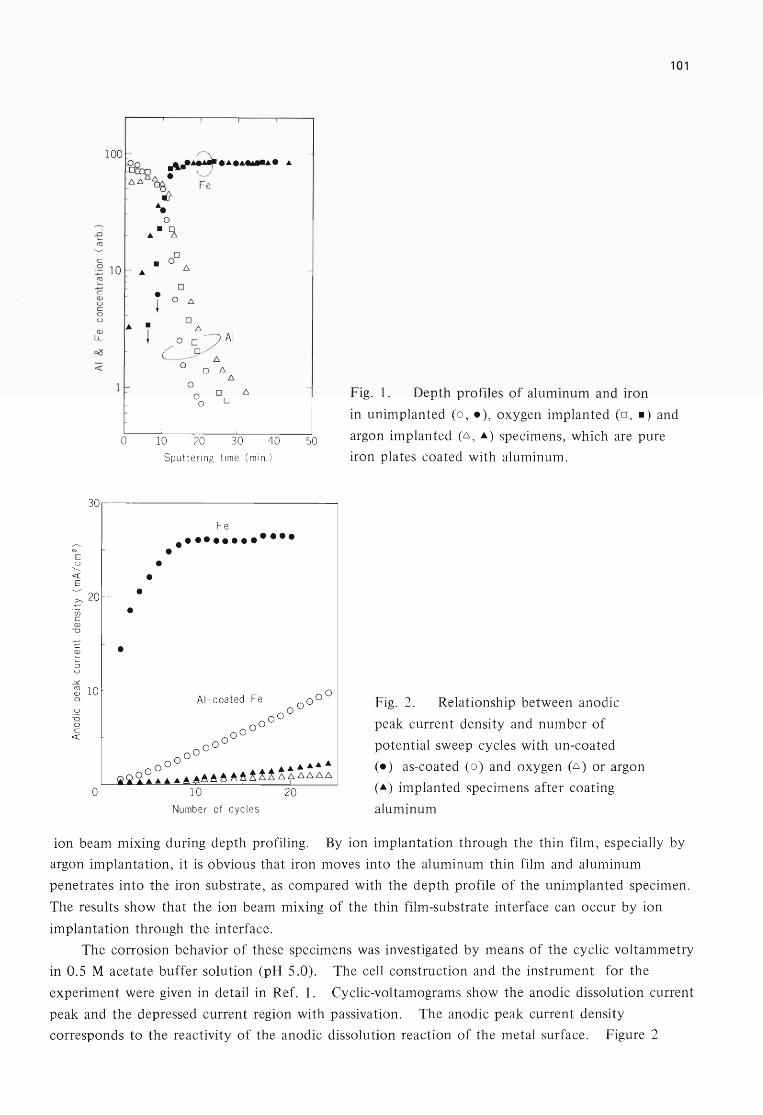
c 0
~ c G)
u c 0 u
G)
LL
c:>(:l
«
I I I
100 - ~ ~? rAJ/' ......... A
c:=g6 • !:;.!:;. 00 Fe ~
10 I- •
•
11-
o
A. o .. ~
0
• 0 !:;.
0
• ~
0 !:;.
• 0 !:;.
~ ~AI 0
0 6 6
0
0 0 6
0 0
I I
10 20 30 40 Sputtering t ime (m i n )
-
-
50
30.-----------------------------~
'" E u ~
« E
:: 20 -(J) c G)
u
c ~ :::J U
-'1.
~ lO -a.
.~ u o c «
o
• •
•
• •
Fe •••••••••••••
•
101
Fig. 1. Depth profiles of aluminum and iron
in unimplanted (0 , .), oxygen implanted (0, .) and
argon implanted (1"', ... ) specimens, which are pure
iron plates coated with aluminum.
Fig. 2. Relationship between anodic
peak current density and number of
potential sweep cycles with un-coated
(.) as-coated (0 ) and oxygen (6 ) or argon
( ... ) implanted specimens after coating
Number of cyc les aluminum
ion beam mixing during depth profiling. By ion implantation through the thin film, especially by
argon implantation, it is obvious that iron moves into the aluminum thin film and aluminum
penetrates into the iron substrate, as compared with the depth profile of the unimplanted specimen.
The results show that the ion beam mixing of the thin film-substrate interface can occur by ion
implantation through the interface.
The corrosion behavior of these specimens was investigated by means of the cyclic voltammetry
in 0.5 M acetate buffer solution (pH 5.0). The cell construction and the instrument for the
experiment were given in detail in Ref. 1. Cyclic-voltamograms show the anodic dissolution current
peak and the depressed current region with passivation. The anodic peak current density
corresponds to the reactivity of the anodic dissolution reaction of the metal surface . Figure 2
102
shows the relationship between anodic peak current density and number of potential sweep cycles,
which shows the change of reactivity of the surface with repeat of the potential sweep cycles. The
peak current density of iron is relatively high and that of aluminum is very low. By depositing
aluminum on iron the anodic peak current density becomes low, and even lower by subsequent
ion implantation. The results show that the ion beam mixing is an important technique for the
improvement of corrosion.
In conclusion, ion implantation through the deposited thin film results in making the sharp
interface of the thin film-substrate dispersed and improving the corrosion resistance.
Reference
1) K. Takahashi, Y. Okabe, and M. Iwaki: Nucl. Instr. and Methods, 182,1009 (1981).
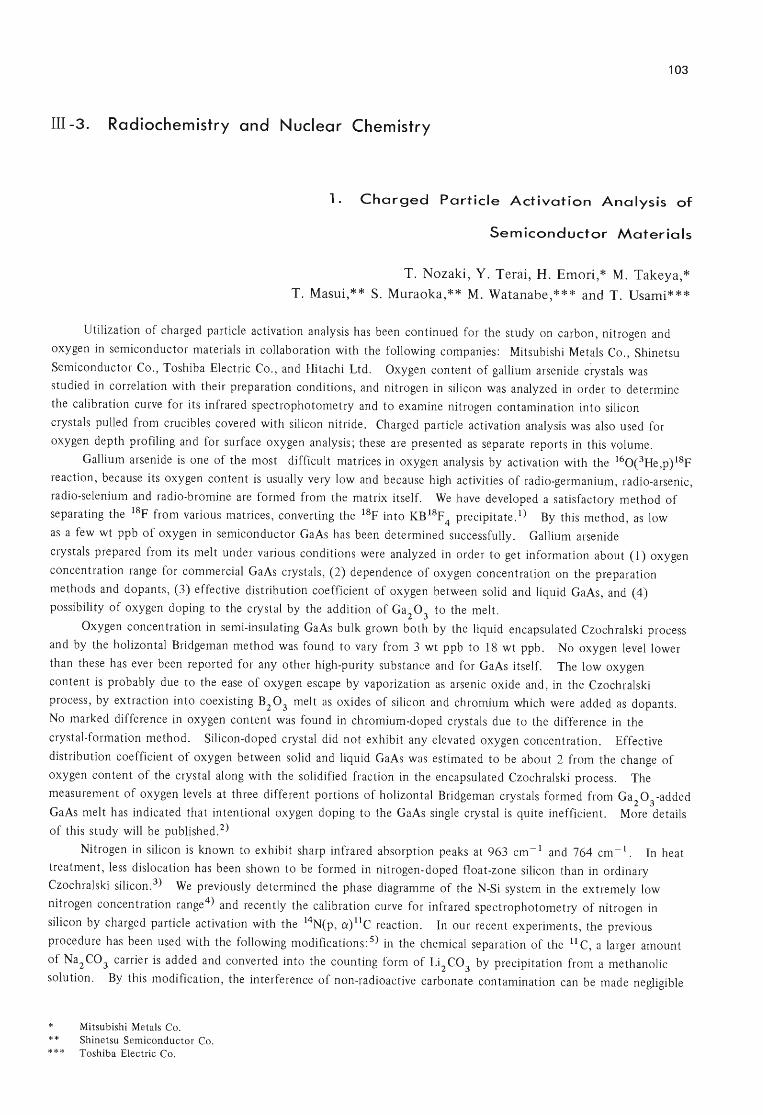
103
III -3. Radiochemistry and Nuclear Chemistry
1 . Charged Particle Activation Analysis of
Semiconductor Materials
T. Nozaki, Y. Terai, H. Emori,* M. Takeya,*
T. Masui,** S. Muraoka,** M. Watanabe,*** and T. Usami***
Utilization of charged particle activation analysis has been continued for the study on carbon, nitrogen and
oxygen in semiconductor materials in collaboration with the following companies: Mitsubishi Metals Co., Shinetsu
Semiconductor Co., Toshiba Electric Co. , and Hitachi Ltd. Oxygen content of gallium arsenide crystals was
studied in correlation with their preparation conditions, and nitrogen in silicon was analyzed in order to determine
the calibration curve for its infrared spectrophotometry and to examine nitrogen contamination into silicon
crystals pulled from crucibles covered with silicon nitride. Charged particle activation analysis was also used for
oxygen depth profiling and for surface oxygen analysis ; these are presented as separate reports in this volume.
Gallium arsenide is one of the most difficult matrices in oxygen analysis by activation with the 160eHe,p )18p
reaction , because its oxygen content is usually very low and because high activities of radio-germanium, radio-arsenic,
radio-selenium and radio-bromine are formed from the matrix itself. We have developed a satisfactory method of
separating the 18p from various matrices, converting the 18p into KB 18p 4 precipitate. I) By this method, as low
as a few wt ppb of oxygen in semiconductor GaAs has been determined successfully. Gallium arsenide
crystals prepared from its melt under various conditions were analyzed in order to get information about (1) oxygen
concentration range for commercial GaAs crystals, (2) dependence of oxygen concentration on the preparation
methods and dopants , (3) effective distribution coefficient of oxygen between solid and liquid GaAs , and (4)
possibility of oxygen doping to the crystal by the addition of Ga2
0 3 to the melt.
Oxygen concentration in semi-insulating GaAs bulk grown both by the liqUid encapsulated Czochralski process
and by the holizontal Bridgeman method was found to vary from 3 wt ppb to 18 wt ppb. No oxygen level lower
than these has ever been reported for any other high-purity substance and for GaAs itself. The low oxygen
content is probably due to the ease of oxygen escape by vaporization as arsenic oxide and, in the Czochralski
process, by extraction into coexisting B2
0 3 melt as oxides of silicon and chromium which were added as dopants.
No marked difference in oxygen content was found in chromium-doped crystals due to the difference in the
crystal-formation method. Silicon-doped crystal did not exhibit any elevated oxygen concentration. Effective
distribution coefficient of oxygen between solid and liquid GaAs was estimated to be about 2 from the change of
oxygen content of the crystal along with the solidified fraction in the encapsulated Czochralski process. The
measurement of oxygen levels at three different portions of holizontal Bridgeman crystals formed from Ga2 03 -added
GaAs melt has indicated that intentional oxygen doping to the GaAs single crystal is quite inefficient. More details
of this study will be published. 2)
Nitrogen in silicon is known to exhibit sharp infrared absorption peaks at 963 cm- l and 764 cm- l. In heat
treatment , less dislocation has been shown to be formed in nitrogen-doped float-zone silicon than in ordinary
Czochralski silicon. 3) We previously determined the phase diagramme of the N-Si system in the extremely low
nitrogen concentration range4) and recently the calibration curve for infrared spectrophotometry of nitrogen in
silicon by charged particle activation with the 14N(p, a)l1C reaction. In our recent experiments , the previous
procedure has been used with the following modifications: 5) in the chemical separation of the 11 C, a larger amount
of Na2 C03 carrier is added and converted into the counting form of Li2 C03 by precipitation from a methanolic
solution. By this modification, the interference of non-radioactive carbonate contamination can be made negligible
* Mitsubishi Metals Co. ** Shinetsu Semiconductor Co. *** Toshiba Electric Co.
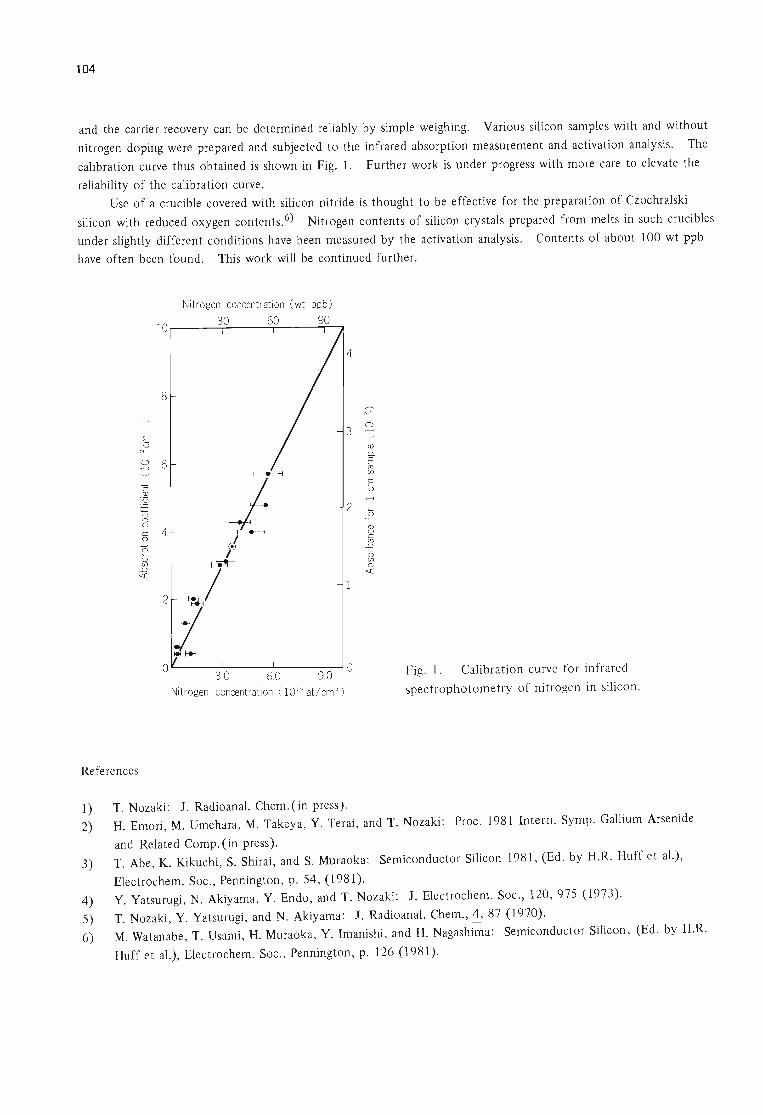
104
and the carrier recovery can be determined reliably by simple weighing. Various silicon samples with and without
nitrogen doping were prepared and subjected to the infrared absorption measurement and act ivation analysis. The
calibration curve thus obtained is shown in Fig. 1. Further work is under progress with more care to elevate the
reliability of the calibration curve.
Use of a crucible covered with silicon nitride is thought to be effective fo r the preparation of Czochralski
silicon with reduced oxygen contents.6 ) Nitrogen contents of silicon crystals prepared from melts in such crucibles
under slightly different conditions have been measured by the activation analysis. Contents of about 100 wt ppb
have often been found. This work will be continued further.
Nitrogen concent rat ion (wt ppb )
10~ ____ 3~0 _____ 6TO _____ 9~0~
4
8 ----:--'" I ,.
3 0 .........
E u
~ I 0. 0 6 E ......... cu
f------+---' (f)
C
~ E
OJ u
Q 2
OJ -2 0 u
OJ c 4 u Q f
c cu
Q -D
0 0 ~
(f) (f) -D -D
~/ <{ <{
2
i 0 0 Fig. 1. Calibration curve for infrared 3.0 6.0 9.0
Nitrogen concentration ( 10 15 at/cm 3) spectrophotometry of nitrogen in silicon.
References
1) T. Nozaki: 1. Radioanal. Chem.(in press). 2) H. Emori, M. Umehara, M. Takeya, Y. Terai, and T. Nozaki: Proc. 1981 Intern. Symp. Gallium Arsenide
and Related Compo (in press).
3) T. Abe, K. Kikuchi , S. Shirai , and S. Muraoka: Semiconductor Silicon 1981, (Ed. by H.R. Huff et al.) ,
Electrochem. Soc., Pennington, p. 54, (1981).
4) Y. Yatsurugi, N. Akiyama, Y. Endo , and T. Nozaki: 1. Electrochem. Soc., 120, 975 (1973).
5) T. Nozaki, Y. Yatsurugi , and N. Akiyama: 1. Radioanal. Chern.,.±. 87 (1970).
6) M. Watanabe , T. Usami, H. Muraoka, Y. Imanishi , and H. Nagashima: Semiconductor Silicon , (Ed. by H.R.
Huff et al.) , Electrochem. Soc. , Pennington , p. 126 (1981).
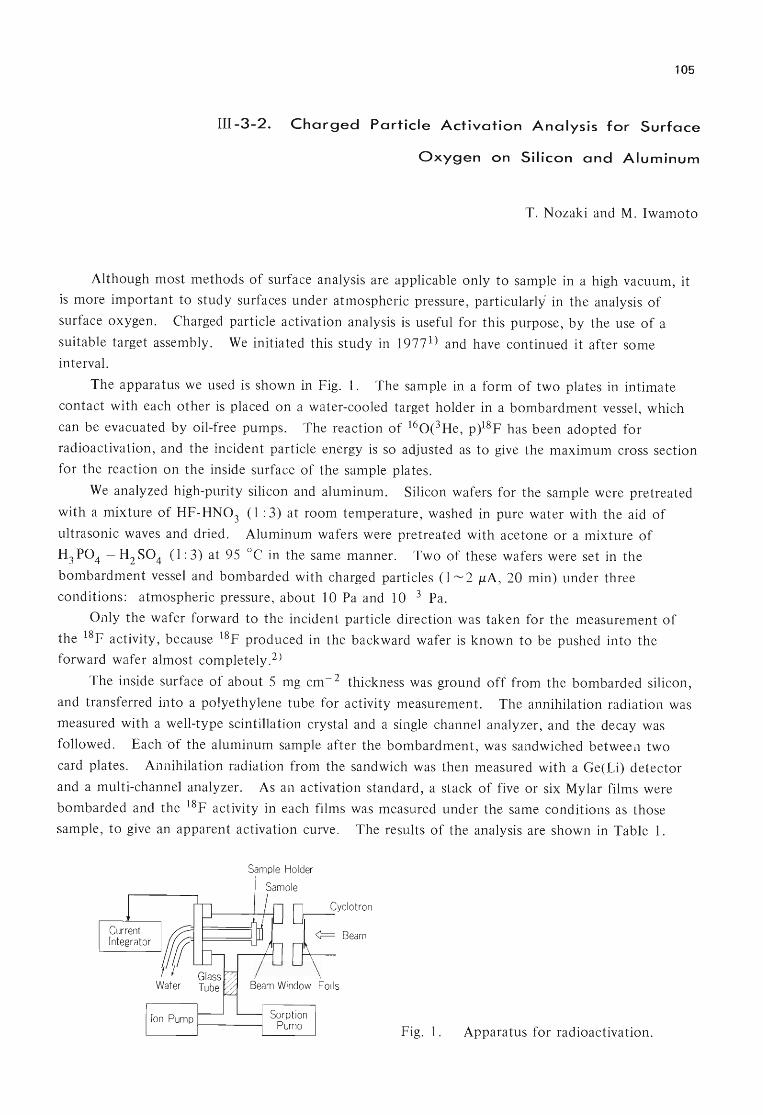
105
111-3-2. Charged Particle Activation Analysis for Surface
Oxygen on Silicon and Aluminum
T. Nozaki and M. Iwamoto
Although most methods of surface analysis are applicable only to sample in a high vacuum, it
is more important to study surfaces under atmospheric pressure, particularly in the analysis of
surface oxygen. Charged particle activation analysis is useful for this purpose, by the use of a
suitable target assembly. We initiated this study in 1977 1) and have continued it after some
interval.
The apparatus we used is shown in Fig. 1. The sample in a form of two plates in intimate
contact with each other is placed on a water-cooled target holder in a bombardment vessel, which
can be evacuated by oil-free pumps. The reaction of 160eHe, p)18F has been adopted for
radioactivation, and the incident particle energy is so adjusted as to give the maximum cross section
for the reaction on the inside surface of the sample plates.
We analyzed high-purity silicon and aluminum. Silicon wafers for the sample were pretreated
with a mixture of HF-HN03 (1: 3) at room temperature, washed in pure water with the aid of
ultrasonic waves and dried. Aluminum wafers were pretreated with acetone or a mixture of
H3 PO 4 - H2 SO 4 (1: 3) at 95°C in the same manner. Two of these wafers were set in the
bombardment vessel and bombarded with charged particles (1 ""'2 JiA, 20 min) under three
conditions: atmospheric pressure , about 10 Pa and 10- 3 Pa.
Only the wafer forward to the incident particle direction was taken for the measurement of
the 18F activity, because 18F produced in the backward wafer is known to be pushed into the
forward wafer almost completely.2)
The inside surface of about 5 mg cm- 2 thickness was ground off from the bombarded silicon,
and transferred into a polyethylene tube for activity measurement. The annihilation radiation was
measured with a well-type scintillation crystal and a single channel analyzer, and the decay was
followed. Each 'of the aluminum sample after the bombardment, was sandwiched betweea two
card plates. Annihilation radiation from the sandwich was then measured with a Ge(Li) detector
and a multi-channel analyzer. As an activation standard, a stack of five or six Mylar films were
bombarded and the 18F activity in each films was measured under the same conditions as those
sample, to give an apparent activation curve. The results of the analysis are shown in Table 1.
Sample Holder
Sample
Fig. 1. Apparatus for radioactivation.
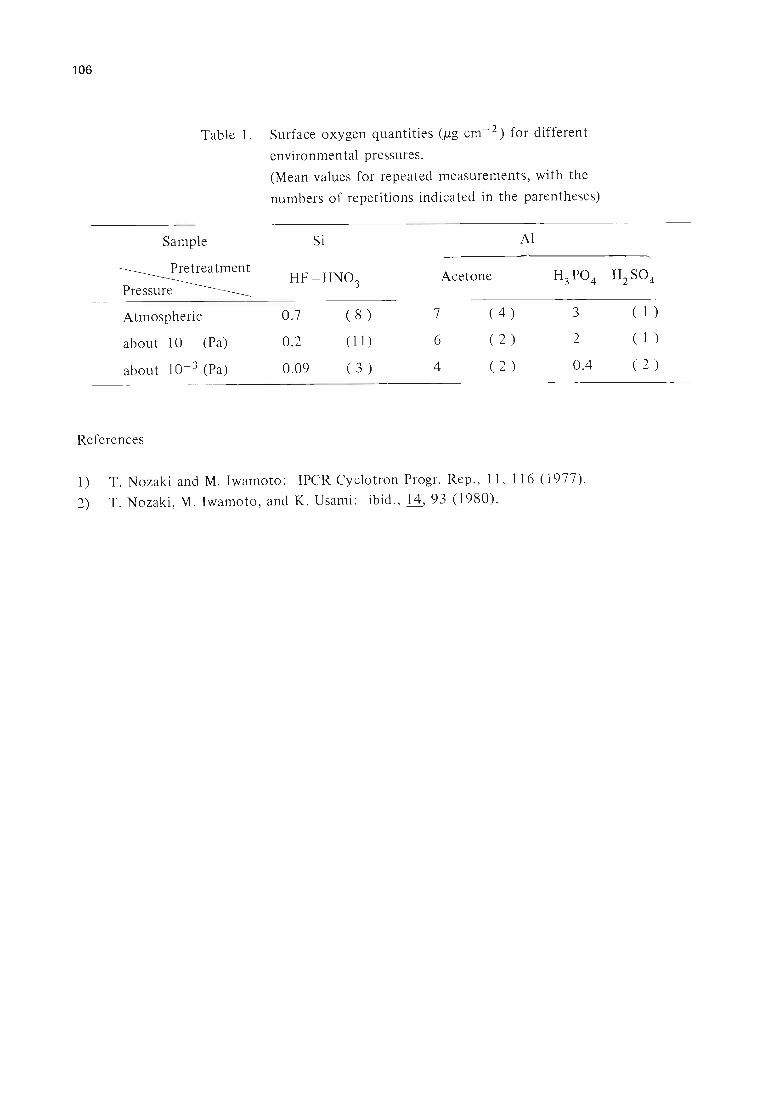
106
Table l. Surface oxygen quantities (/lg cm - 2) for different
environmental pressures.
Sample
(Mean values for repeated measurements, with the
numbers of repetitions indicated in the parentheses)
Si Al
~ HF-HN03 Acetone H3 P04 -H2 S04
Pressure
Atmospheric 0.7 ( 8 ) 7 ( 4 ) 3 ( I )
about 10 (Pa) 0.2 (11 ) 6 ( 2 ) 2 ( 1 )
about 10- 3 (Pa) 0.09 ( 3 ) 4 ( 2 ) 0.4 ( 2 )
References
1) T. Nozaki and M. Iwamoto: IPCR Cyclotron Progr. Rep., 1L 116 (1977).
2) T. Nozaki, M. Iwamoto, and K. Usami: ibid.,.!±, 93 (1980).
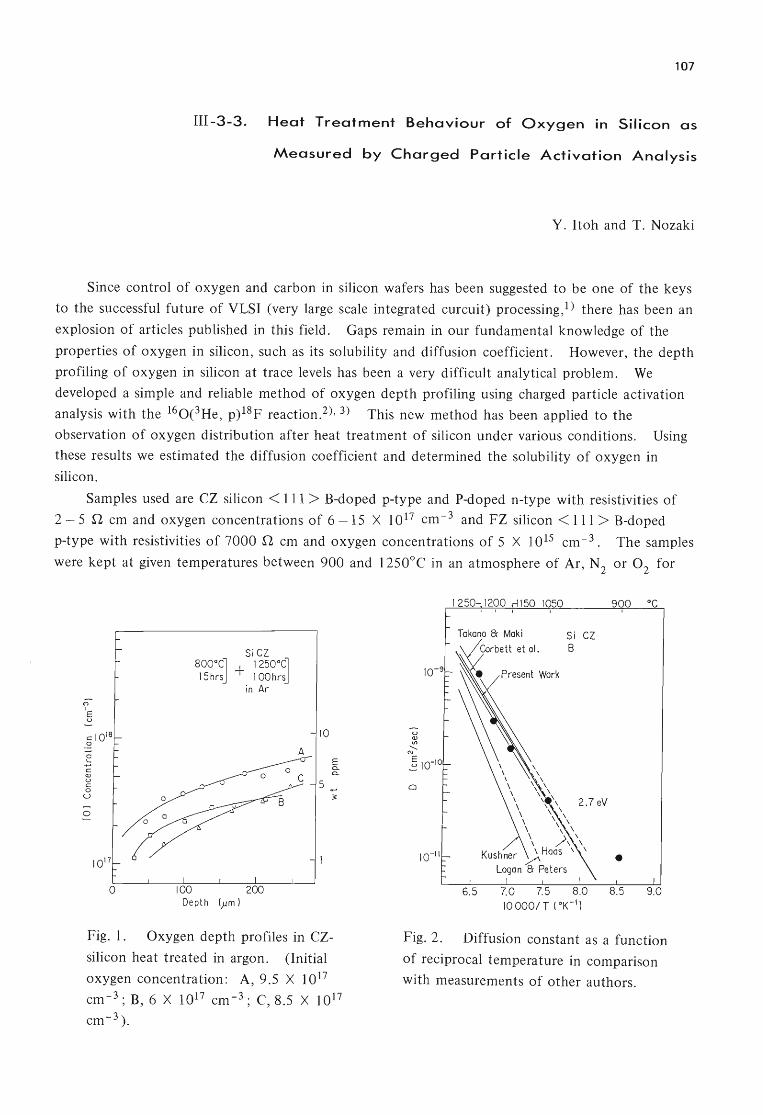
107
111-3-3. Heat Treatment Behaviour of Oxygen in Silicon as
Measured by Charged Particle Activation Analysis
Y. Itoh and T. Nozaki
Since control of oxygen and carbon in silicon wafers has been suggested to be one of the keys
to the successful future of VLSI (very large scale integrated curcuit) processing,l) there has been an
explosion of articles published in this field. Gaps remain in our fundamental knowledge of the
properties of oxygen in silicon, such as its solubility and diffusion coefficient. However, the depth
profiling of oxygen in silicon at trace levels has been a very difficult analytical problem. We
developed a simple and reliable method of oxygen depth profiling using charged particle activation
analysis with the 160CHe, p) 18 p reaction.2), 3) This new method has been applied to the
observation of oxygen distribution after heat treatment of silicon under various conditions. Using
these results we estimated the diffusion coefficient and determined the solubility of oxygen in
silicon.
Samples used are CZ silicon < III > B-doped p-type and P-doped n-type with resistivities of
2 - 5 n cm and oxygen concentrations of 6 - 15 X 1017 cm - 3 and PZ silicon < III > B-doped
p-type with resistivities of 7000 n cm and oxygen concentrations of 5 X 1015 cm - 3. The samples
were kept at given temperatures between 900 and l250°C in an atmosphere of Ar, N2 or 02 for
~ ~ c o
U
o
Si CZ 800°C] I I 250 0 cl 15hrs T 100hrsj
in Ar
100 200 Depth (pm)
10
E a.. a..
5+-;:
Pig. 1. Oxygen depth profiles in CZ-
silicon heat treated in argon. (Initial
oxygen concentration: A, 9.5 X 10¹⁷
cm- 3 ; B, 6 X 1017 cm- 3 ; C,8.5 X 1017
cm- 3 ).
o
10-11
1250-1200 .-1150 1050
Takano 8: Maki
Corbett et 01. Si CZ B
2.7 eV
6.5 7.0 7.5 8.0 10000/ T (oK-I)
900 °c
•
Fig. 2. Diffusion constant as a function
of reciprocal temperature in comparison
with measurements of other authors.
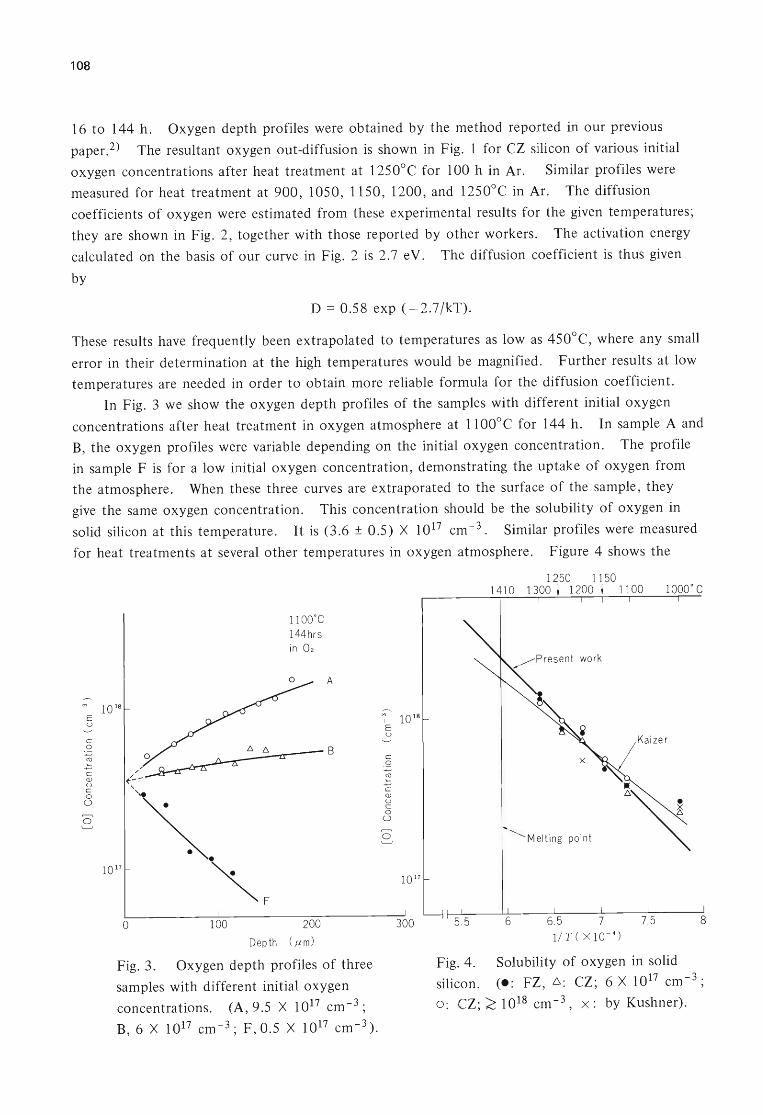
108
16 to 144 h. Oxygen depth profiles were obtained by the method reported in our previous
paper. 2) The resultant oxygen out-diffusion is shown in Fig. 1 for CZ silicon of various initial
oxygen concentrations after heat treatment at 1250°C for 100 h in Ar. Similar profiles were
measured for heat treatment at 900, 1050, 1150, 1200, and 1250°C in Ar. The diffusion
coefficients of oxygen were estimated from these experimental results for the given temperatures;
they are shown in Fig. 2, together with those reported by other workers. The activation energy
calculated on the basis of our curve in Fig. 2 is 2.7 eV. The diffusion coefficient is thus given
by
D = 0.58 exp (-2.7/kT).
These results have frequently been extrapolated to temperatures as low as 450°C, where any small
error in their determination at the high temperatures would be magnified. Further results at low
temperatures are needed in order to obtain more reliable formula for the diffusion coefficient.
In Fig. 3 we show the oxygen depth profiles of the samples with different initial oxygen
concentrations after heat treatment in oxygen atmosphere at 1100°C for 144 h. In sample A and
B, the oxygen profiles were variable depending on the initial oxygen concentration. The profile
in sample F is for a low initial oxygen concentration, demonstrating the uptake of oxygen from
the atmosphere. When these three curves are extraporated to the surface of the sample, they
give the same oxygen concentration. This concentration should be the solubility of oxygen in
solid silicon at this temperature. It is (3.6 ± 0.5) X 10 17 cm- 3 . Similar profiles were measured
for heat treatments at several other temperatures in oxygen atmosphere. Figure 4 shows the
1100°C 144hrs in 02
A
7 10 18
E u
c o
~ c Cl)
u c o o
B
/
{--,
~. ~F
o 100 200
Depth Cum )
Fig. 3. Oxygen depth profiles of three
samples with different initial oxygen
concentrations. (A,9.5 X 1017 cm- 3 ;
B, 6 X 1017 cm - 3 ; F, 0.5 X 1 017 cm - 3 ).
'" I E u
c Q
~ c Cl)
u c 0
0
2
10 18
10 17
300
~Meltin g point
7 1/ T (X lO - 4
)
Fig. 4. Solubility of oxygen in solid
silicon. (e: FZ, 6: CZ; 6 X 1017 cm- 3 ;
0: CZ;:< 1018 cm -3, x : by Kushner).
109
oxygen solubility as a function of the reciprocal temperature. The results obtained by the present
experiments are slightly different from the results of Kaiser obtained by IR spectrophotometry
and those of Kushner by charged particle activation analysis with the 180(p, n)18F reaction.
Further experiments will be needed to confirm our results.
References
1) l.R. Patel: Proc. 3rd Intern. Symp. on Si Mater. Sci. and Tech., p. 521 (1977);
Proc. 4th Intern. Symp. on Si Mater. Sci. and Tech., p. 189 (1981).
2) T. Nozaki and Y. Itoh: IPCR Cyclotron Progr. Rep., 1..1., 94 (1980).
3) Y. Itoh and T. Nozaki: l. Radioanal. Chern., 1.Q, 329 (1982).
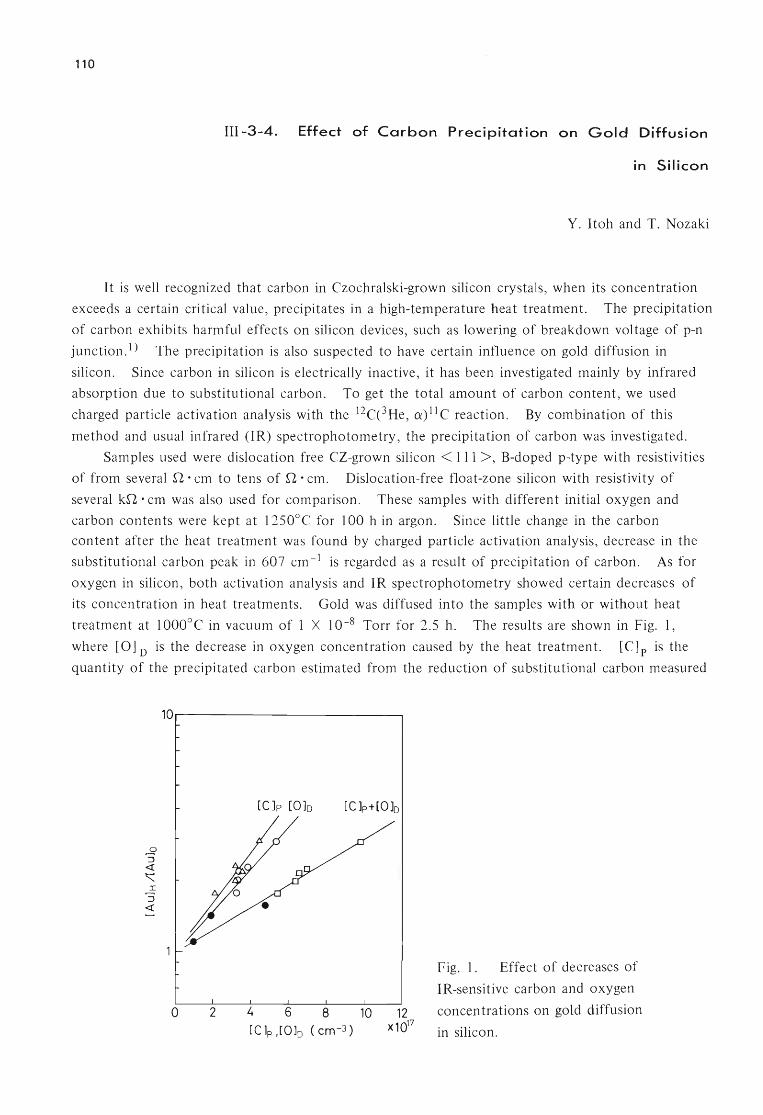
110
III -3-4. Effect of Carbon Precipitation on Gold Diffusion
in Silicon
Y. Itoh and T. Nozaki
It is well recognized that carbon in Czochralski-grown silicon crystals, when its concentration
exceeds a certain critical value, precipitates in a high-temperature heat treatment. The precipitation
of carbon exhibits harmful effects on silicon devices, such as lowering of breakdown voltage of p-n
junction. 1) The precipitation is also suspected to have certain influence on gold diffusion in
silicon. Since carbon in silicon is electrically inactive, it has been investigated mainly by infrared
absorption due to substitutional carbon. To get the total amount of carbon content, we used
charged particle activation analysis with the 12CeHe, ~)11C reaction. By combination of this
method and usual infrared OR) spectrophotometry, the precipitation of carbon was investigated.
Samples used were dislocation free CZ-grown silicon < 111 >, B-doped p-type with resistivities
of from several n· cm to tens of n . cm. Dislocation-free float-zone silicon with resistivity of
several kn· cm was also used for comparison. These samples with different initial oxygen and
carbon contents were kept at 1250°C for 100 h in argon. Since little change in the carbon
content after the heat treatment was found by charged particle activation analysis, decrease in the
substitutional carbon peak in 607 cm -1 is regarded as a result of precipitation of carbon. As for
oxygen in silicon, both activation analysis and IR spectrophotometry showed certain decreases of
its concentration in heat treatments. Gold was diffused into the samples with or without heat
treatment at 1000°C in vacuum of I X 10-8 Torr for 2.5 h. The results are shown in Fig. I,
where [0] D is the decrease in oxygen concentration caused by the heat treatment. [C] p is the
quantity of the precipitated carbon estimated from the reduction of substitutional carbon measured
10.-------------------------~
o 2
[C]p [010 [C ]p+[OJo
4 6 8 10 [C lp ,[0]0 (cm-3 )
12 Xl017
Fig. 1. Effect of decreases of
IR-sensitive carbon and oxygen
concentrations on gold diffusion
in silicon.
111
by IR spectrophotometry, and [Au]H and [Au]a are the central gold concentrations of the samples
with and without heat treatment, respectively. The ratios of [Au]H to [Au]a are plotted against
[C] p and [0] D in Fig. 1, by !:::. and 0, respectively. The plots. are for [0] D in samples with
low-carbon contents. A linear relationship exists between [C]p + [OlD and [Au]H/[Au]a as
shown in Fig. I (plotted by D), indicating that both precipitation of carbon and escape of oxygen
have similar acceleration effect on the gold diffusion. Details of this study will be presented
elsewhere in the near future.
Reference
I) N. Akiyama, Y. Yatsurugi, Y. Endo, Z. Imayoshi, and T. Nozaki: Appl. Phys. Lett., 22, 630
(1973).
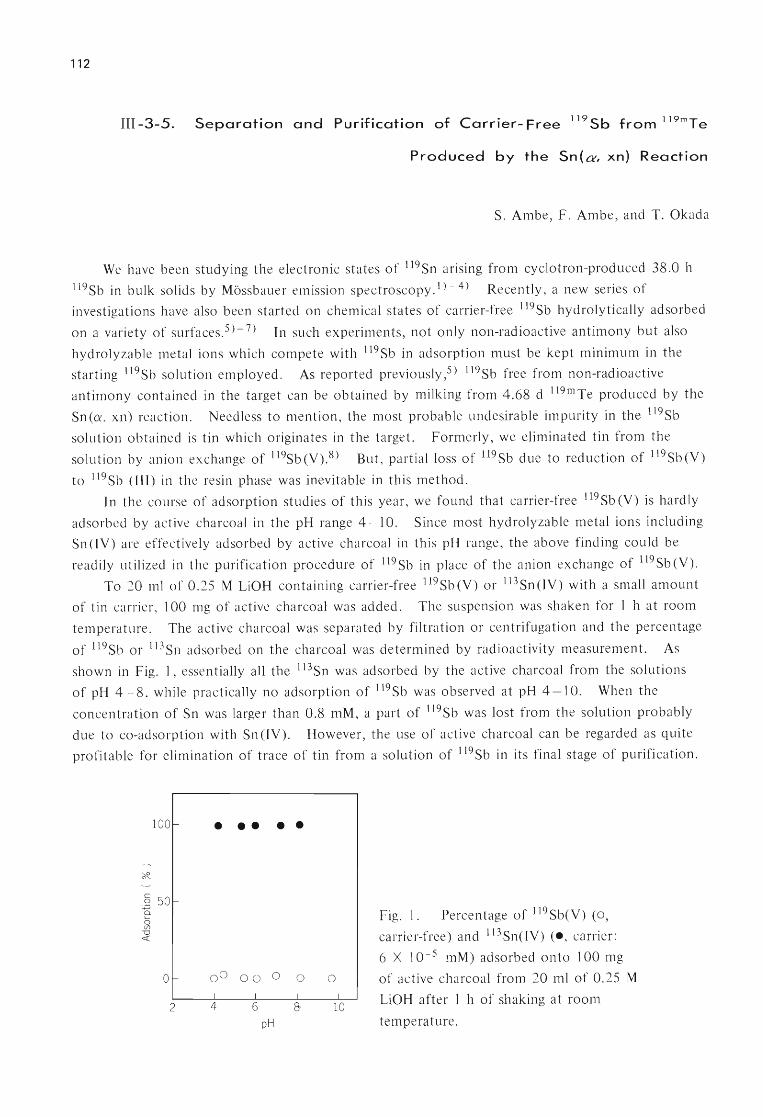
112
III -3-5. Separation and Purification of Carrier- Free 119 Sb from 119mTe
Produced by the Sn(a, xn} Reaction
S. Ambe, F . Ambe, and T. Okada
We have been studying the electronic states of 119Sn arising from cyclotron-produced 38.0 h
11 9Sb in bulk solids by Mossbauer emission spectroscopy.1) - 4) Recently , a new series of
investigations have also been started on chemical states of carrier-free 119Sb hydrolytically adsorbed
on a variety of surfaces.5)-7) In such experiments, not only non-radioactive antimony but also
hydrolyzable metal ions which compete with 119Sb in adsorption must be kept minimum in the
starting 119Sb solution employed. As reported previously,5) 119Sb free from non-radioactive
antimony contained in the target can be obtained by milking from 4.68 d 119mTe produced by the
Sn(O' , xn) reaction . Needless to mention, the most probable undesirable impurity in the 119Sb
solution obtained is tin which originates in the target. Formerly, we eliminated tin from the
solution by anion exchange of 119Sb (V).8) But, partial loss of 119Sb due to reduction of 119Sb (V)
to 119Sb (III) in the resin phase was inevitable in this method.
In the course of adsorption studies of this year , we found that carrier-free 119Sb (V) is hardly
adsorbed by active charcoal in the pH range 4 - 1 O. Since most hydrolyzable metal ions including
Sn (IV) are effectively adsorbed by active charcoal in this pH range, the above finding could be
readily utilized in the purification procedure of 119Sb in place of the anion exchange of 119Sb (V).
To 20 ml of 0.25 M LiOH containing carrier-free 119Sb (V) or 113Sn (IV) with a small amount
of tin carrier, 100 mg of active charcoal was added. The suspension was shaken for 1 h at room
temperature. The active charcoal was separated by filtration or centrifugation and the percentage
of 119Sb or I \3Sn adsorbed on the charcoal was determined by radioactivity measurement. As
shown in Fig. 1, essentially all the l\3Sn was adsorbed by the active charcoal from the solutions
of pH 4 - 8 , while practically no adsorption of 119Sb was observed at pH 4 -10. When the
concentration of Sn was larger than 0.8 mM, a part of 119Sb was lost from the solution probably
due to co-adsorption with Sn (IV). However, the use of active charcoal can be regarded as quite
profitable for elimination of trace of tin from a solution of 119Sb in its final stage of purification.
100- •••• •
. 2 50~ Q o (f)
-0 <t
O ~
2
00 00 0 o I I I
4 6 &
pH
o I
10
Fig. 1. Percentage of 119Sb(V) (0,
carrier-free) and 113 Sn(IV) (e, carrier:
6 X 10⁻⁵ mM) adsorbed onto 100 mg
of active charcoal from 20 ml of 0.25 M
LiOH after 1 h of shaking at room
temperature.
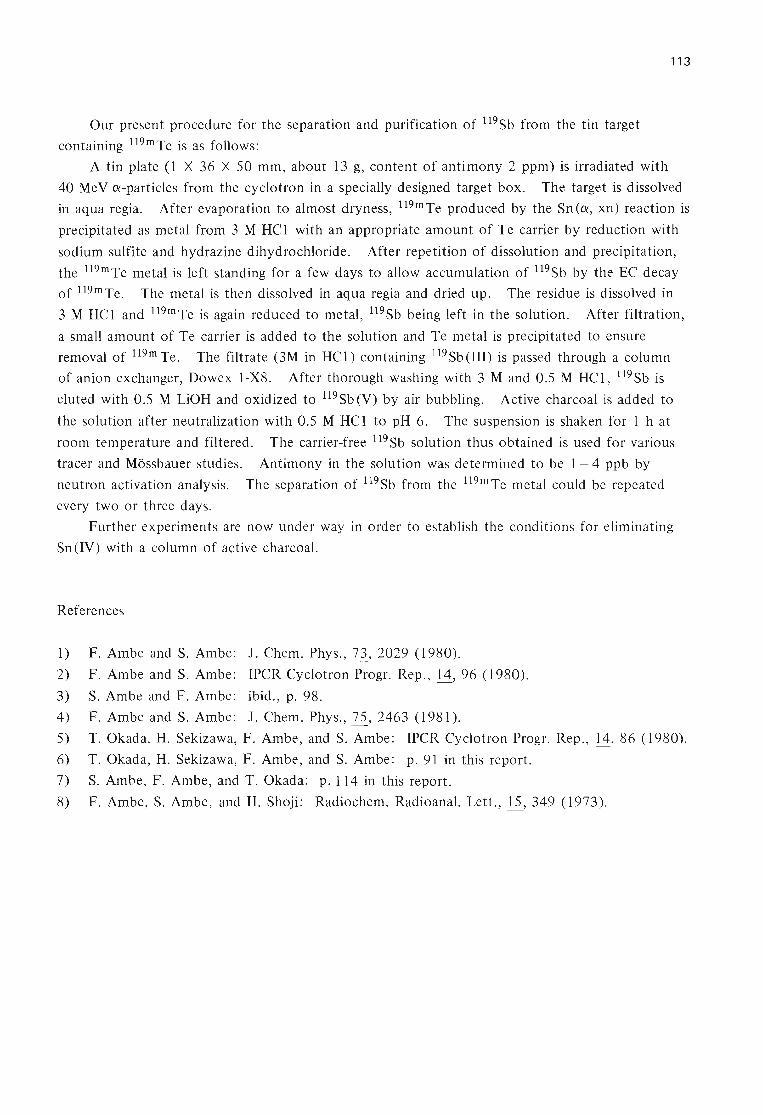
Our present procedure for the separation and purification of 119Sb from the tin target
containing 119mTe is as follows:
A tin plate (1 X 36 X 50 mm, about 13 g, content of antimony 2 ppm) is irradiated with
113
40 MeV ~.-particles from the cyclotron in a specially designed target box. The target is dissolved
in aqua regia. After evaporation to almost dryness, 119mTe produced by the Sn (~, xn) reaction is
precipitated as metal from 3 M He 1 with an appropriate amount of Te carrier by reduction with
sodium sulfite and hydrazine dihydrochloride. After repetition of dissolution and precipitation,
the 119mTe metal is left standing for a few days to allow accumulation of 119Sb by the Ee decay
of 119mTe. The metal is then dissolved in aqua regia and dried up. The residue is dissolved in
3 M He 1 and 119mTe is again reduced to metal, 119Sb being left in the solution. After filtration,
a small amount of Te carrier is added to the solution and Te metal is precipitated to ensure
removal of 119m Te. The filtrate (3M in He 1) containing 119 Sb (III) is passed through a column
of anion exchanger, Dowex l-X8. After thorough washing with 3 M and 0.5 M HCI, 119Sb is
eluted with 0.5 M LiOR and oxidized to 119Sb (V) by air bubbling. Active charcoal is added to
the solution after neutralization with 0.5 M Hel to pH 6. The suspension is shaken for 1 h at
room temperature and filtered. The carrier-free 119Sb solution thus obtained is used for various
tracer and Mossbauer studies. Antimony in the solution was determined to be I - 4 ppb by
neutron activation analysis. The separation of 119Sb from the 119mTe metal could be repeated
every two or three days.
Further experiments are now under way in order to establish the conditions for eliminating
Sn (IV) with a column of active charcoal.
References
1) F. Ambe and S. Ambe: J. Chern. Phys., 73, 2029 (1980).
2) F. Ambe and S. Ambe: IPCR Cyclotron Progr. Rep., 11, 96 (1980).
3) S. Ambe and F. Ambe: ibid., p. 98.
4) F. Ambe and S. Ambe: J. Chern. Phys., 75, 2463 (1981).
5) T. Okada, H. Sekizawa, F. Ambe, and S. Ambe: IPCR Cyclotron Progr. Rep., 14, 86 (1980).
6) T. Okada, H. Sekizawa, F. Ambe, and S. Ambe: p. 91 in this report.
7) S. Ambe, F. Ambe, and T. Okada: p. 114 in this report.
8) F. Ambe, S. Ambe, and H. Shoji: Radiochem. Radioanal. Lett., ~, 349 (1973).

114
III -3-6. Adsorption Kinetics of Carrier- Free 119Sb(V)
S. Ambe, F. Ambe, and T. Okada
Recently , we have clarified chemical states of 119Sb(V) adsorbed on ~-Fe2
03 surfaces by
Mbssbauer emission spectroscopy .1),2) Here, the adsorption kinetics of carrier-free 119Sb(V) ions
from an aqueous solution onto ~-Fe2 03 is reported.
Kinetic study on hydrolytic adsorption of metal ions from aqueous solutions has been
payed little attention because of rapid precipitation of hydrolyzed metal ions after neutralization
of the solutions. Antimony(V) ion is one of the most hydrolyzable metal ions and gives various
hydrolyzed species dependending on the pH of the solution and the concentration of the ion. 3 ), 4)
In this work, the troublesome hydrolytic precipitation of antimony(V) ions was avoided by using a
carrier-free radioisotope of antimony. Its adsorption onto ~-Fe2 03 surfaces has been shown to
obey an unexpectedly simple kinetic law.
As the tracer, 119Sb was separated from 119mTe produced by ~-particle irradiation of tin by
the cyclotron. 5 ) Suspension of ~-Fe2 03 in 0.25 M LiCI solution containing carrier-free 119Sb(V)
ions was shaken at constant temperatures. An aliquot of the suspension was taken in everyone
minute for determination of the fraction of 119Sb adsorbed. ~-Fe2 03 in the aliquot was separated
by filtration with glass fiber paper. The radioactivities of 119Sb in each filtrate were counted with
an NaI scintillation counter.
Percentage of adsorbed 119Sb after I and 3 h is plotted against pH value in Fig. 1. Maximum
adsorption was observed at pH around 4, showing almost 100 % adsorption after 1 h shaking.
Adsorption process of 119Sb(V) from the solutions of pH 4.1 at 30 , 40,50, and 60 °C is
100 - oo~ ~ 0 •• 0
0 • • 0
• ~
0 c: S? Q 50 - • 0 • (/)
-0 <r::
• 0 I I
0 5 10 pH
Fig. 1. pH dependence of adsorption
of 119Sb(V) on ~-Fe2 03 at 50 °C: • 1 h
shaking 0 3 h shaking.
100
• • • • 0 0
• 0 0 • 0
~ • 0 • • 0
• 0 0
• 0 • 0 c: 0 S? 50 r- • 0
-+-' 0 0. 0 0 • 0 (/) • -0 0
<r:: . 0
0 I I I I I
0 2 4 6 8 10
Time ( min )
Fig. 2 Increase in percentage of adsorbed
119Sb(V) on ~-Fe2 03 with time.
Adsorption temperature: • 60 °C, D 50
°c, • 40°C, 0 30 °C.
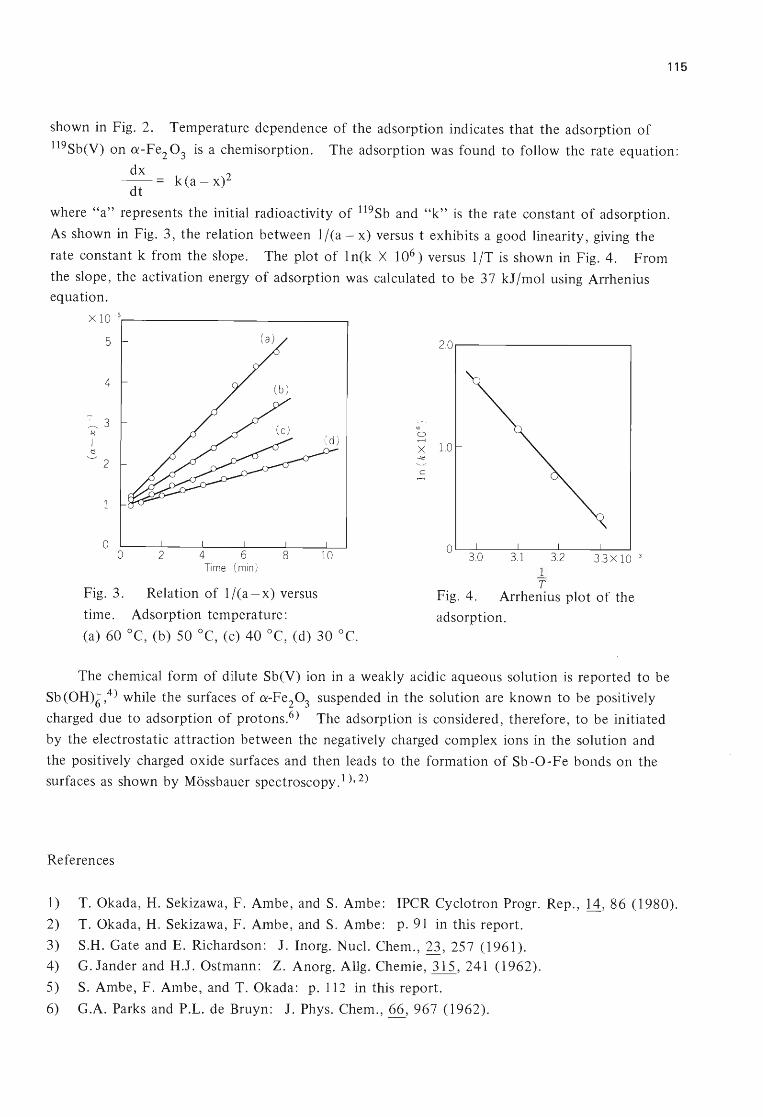
115
shown in Fig. 2. Temperature dependence of the adsorption indicates that the adsorption of
119Sb(V) on a-Fe2 0 3 is a chemisorption. The adsorption was found to follow the rate equation:
dx -- = k(a - x)2
dt
where "a" represents the initial radioactivity of 119Sb and "k" is the rate constant of adsorption.
As shown in Fig. 3, the relation between 1 I(a - x) versus t exhibits a good linearity, giving the
rate constant k from the slope. The plot of I n(k X 106 ) versus 1 IT is shown in Fig. 4. From
the slope, the activation energy of adsorption was calculated to be 37 kllmol using Arrhenius equation.
x 10 - 5r--____________ ----.
5
4
~ 3 ~ ,
::: 2
o o 2 4
Time
Fig. 3. Relation of l/(a-x) versus
time. Adsorption temperature:
(a) 60°C, (b) 50 °c, (c) 40°C, (d) 30 °C.
o .........
2.0.----------------,
x 1.0 -.!C
O L-~-~--L---L-~ 3.0 3.1 3.2 3.3 x 10 - 3
1 T
Fig. 4. Arrhenius plot of the
adsorption.
The chemical form of dilute Sb(V) ion in a weakly acidic aqueous solution is reported to be
Sb(OH)6" ,4) while the surfaces of a-Fe20
3 suspended in the solution are known to be positively
charged due to adsorption of protons.6) The adsorption is considered, therefore, to be initiated
by the electrostatic attraction between the negatively charged complex ions in the solution and
the positively charged oxide surfaces and then leads to the formation of Sb -0.;. Fe bonds on the
surfaces as shown by Mossbauer spectroscopy. 1), 2)
References
1) T. Okada, H. Sekizawa, F. Ambe, and S. Ambe: IPCR Cyclotron Progr. Rep., 14,86 (1980).
2) T. Okada, H. Sekizawa, F. Ambe, and S. Ambe: p.91 in this report.
3) S.H. Gate and E. Richardson: 1. Inorg. Nuc!. Chern., 23, 257 (1961).
4) G.lander and H.l. Ostmann: Z. Anorg. AUg. Chemie, 315, 241 (1962).
5) S. Ambe, F. Ambe, and T. Okada: p. 112 in this report.
6) G.A. Parks and P.L. de Bruyn: 1. Phys. Chern., 66, 967 (1962).
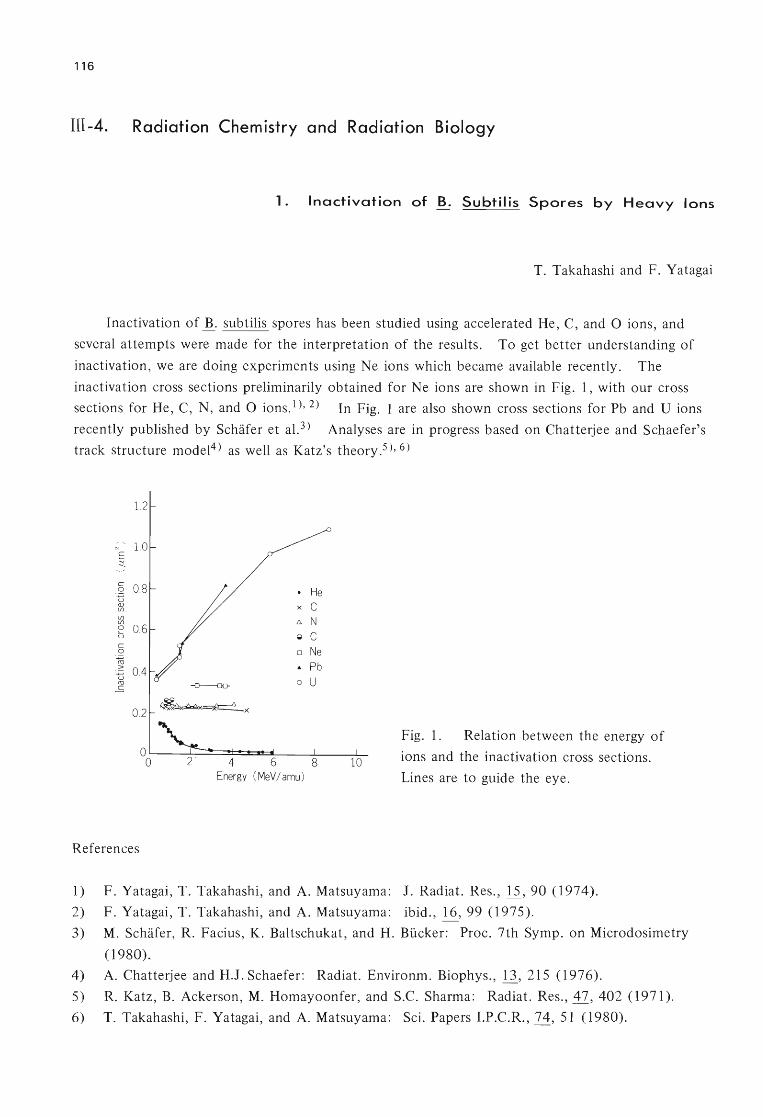
116
III -4. Radiation Chemistry and Radiation Biology
1. Inactivation of B. Subtilis Spores by Heavy Ions
T. Takahashi and F. Yatagai
Inactivation of~. subtilis spores has been studied using accelerated He, C, and 0 ions, and
several attempts were made for the interpretation of the results. To get better understanding of
inactivation , we are doing experiments using Ne ions which became available recently. The
inactivation cross sections preliminarily obtained for Ne ions are shown in Fig. 1, with our cross
sections for He, C, N, and 0 ions.1), 2) In Fig. I are also shown cross sections for Pb and U ions
recently published by Schafer et al. 3) Analyses are in progress based on Chatterjee and Schaefer's
track structure model4 ) as well as Katz's theory.S), 6)
1.2
.......... 1.0 N
E ::t
c Q U Q) (j)
(j) (j)
0 0.6 b c Q m 2: 0.4 u <U
.E
0.2
References
. x
6.
Q
0
&
0
4 6 Energy (MeV/ amu )
He C N
C Ne Pb U
Fig. 1. Relation between the energy of
ions and the inactivation cross sections.
Lines are to guide the eye.
1) F. Yatagai, T. Takahashi, and A. Matsuyama: J. Radiat. Res., 11,90 (1974).
2) F. Yatagai , T. Takahashi, and A. Matsuyama: ibid. , .!i.: 99 (1975).
3) M. Schafer, R. Facius, K. Baltschukat, and H. Bucker: Proc. 7th Symp. on Microdosimetry
(1980).
4) A. Chatterjee and H.J. Schaefer: Radiat. Environm. Biophys., 11, 215 (1976).
5) R. Katz, B. Ackerson, M. Homayoonfer, and S.C. Sharma: Radiat. Res. , 47, 402 (1971).
6) T. Takahashi, F. Yatagai, and A. Matsuyama: Sci. Papers I.P.C.R., 74, 51 (1980).
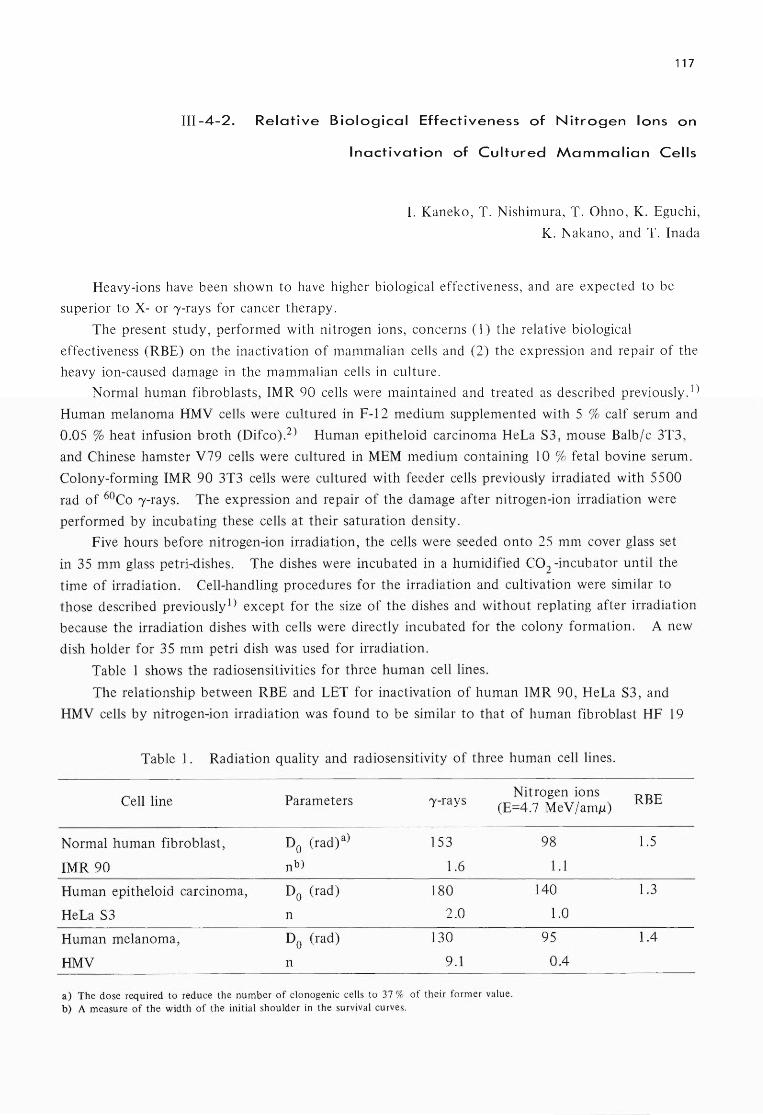
117
III-4-2. Relative Biological Effectiveness of Nitrogen Ions on
Inactivation of Cultured Mammalian Cells
1. Kaneko, T. Nishimura, T. Ohno, K. Eguchi,
K. Nakano, and T. Inada
Heavy-ions have been shown to have higher biological effectiveness, and are expected to be
superior to X- or 'Y-rays for cancer therapy.
The present study, performed with nitrogen ions, concerns (1) the relative biological
effectiveness (RBE) on the inactivation of mammalian cells and (2) the expression and repair of the
heavy ion-caused damage in the mammalian cells in culture.
Normal human fibroblasts, IMR 90 cells were maintained and treated as described previously. 1)
Human melanoma HMV cells were cultured in F-12 medium supplemented with 5 % calf serum and
0.05 % heat infusion broth (Difco).2) Human epitheloid carcinoma HeLa S3, mouse Balb/c 3T3 ,
and Chinese hamster V79 cells were cultured in MEM medium containing 10 % fetal bovine serum.
Colony-forming IMR 90 3T3 cells were cultured with feeder cells previously irradiated with 5500
rad of 60Co 'Y-rays. The expression and repair of the damage after nitrogen-ion irradiation were
performed by incubating these cells at their saturation density.
Five hours before nitrogen-ion irradiation, the cells were seeded onto 25 mm cover glass set
in 35 mm glass petri-dishes. The dishes were incubated in a humidified CO2 -incubator until the
time of irradiation. Cell-handling procedures for the irradiation and cultivation were similar to
those described previously}) except for the size of the dishes and without replating after irradiation
because the irradiation dishes with cells were directly incubated for the colony formation. A new
dish holder for 35 mm petri dish was used for irradiation.
Table 1 shows the radiosensitivities for three human cell lines.
The relationship between RBE and LET for inactivation of human IMR 90, HeLa S3, and
HMV cells by nitrogen-ion irradiation was found to be similar to that of human fibroblast HF 19
Table 1. Radiation quality and radiosensitivity of three human cell lines.
Cell line Parameters 'Y-rays Nitrogen ions
RBE (E=4.7 MeV /amfJ)
Normal human fibroblast, Do (rad)a) 153 98 1.5
IMR 90 nb) 1.6 1.1
Human epitheloid carcinoma, Do (rad) 180 140 1.3
HeLa S3 n 2.0 1.0
Human melanoma, Do (rad) 130 95 1.4
HMV n 9.1 0.4
a) The dose required to reduce the number of clonogenic cells to 37 % of their fo rm er value. b) A measure of the width of the initial shoulder in the survival curves.

118
and Chinese hamster V79 cells. 3)
The patterns4) of the recovery from the potentially lethal damage in IMR 90 and Chinese
hamster V79 cells after nitrogen-ion irradiation were found to be different from the well-known
pattern for the recovery from the potentially lethal damage after ,),-ray irradiation. Studies on the
potentially lethal damage repair of HeLa S3, HMV, and Balbi c 3T3 cells after nitrogen-ion
irradiation are under way.
References
1) 1. Kaneko, T. Ohno, K. Nakano, and F. Yatagai: IPCR Cyclotron Progr. Rep., !.±' 102
( 1980).
2) T. Inada, K. Kawachi, T. Kanai, and I. Nojiri: J. Radiat. Res., 22, 143 (1981).
3) R. Cox and W. K. Masson: Int. J. Radiat. Bioi., 36, 149 (1979).
4) I. Kaneko, T. Ohno, I. Suzuki, T. Taira, K. Nakano, and F. Y. Yatagai: J. Radiat. Res., 22,
26 (1981).

119
III -5. Instrumentation
1. Gamma-Ray Circular Polarimeter
K. Ieki and M. Ishihara
[
NUCLEAR INSTRUMENT Forward scattering type Compton 1 polarimeter; conical shape magnet , variable detection angle of emitted
particle, calculated analyzing power and transmission
In an attempt to study heavy ion reaction mechanism , several methods have been employed
to determine spin polarizations of residual nuclei. These methods utilize ~-decay asymmetry of
12B,1) double scattering of protons2 ) and circular polarization of ,),-rays.3) Much knowledge was
given to light fragment polarization by the first two methods, whereas information on heavy
fragment polarization can be taken only via the third method.
In order to pursue the study of heavy fragment polarization , we are now constructing forward
scattering type Compton circular polarimeter. The main features of the setup are similar to those
of Trautmann et al.,3) but following modifications have been incorporated:
1) Trautmann et al. detected emitted particles with ionization chamber and Si detector at
fixed angle. To study reaction mechanism, however , detection at variable angles is favorable. In
our setup counter telescopes can be set symmetrically with beam axis in vacuum chamber at varied
angles. Setting angle can be changed in 5° step. To gain detection efficiency , the telescope with
solid angle of 20 - 40 msr can be installed and serveral sets of the telescopes can be set at the
same time.
ta rget
+
Fig. 1.
~ Pb
~ Fe
L: .... <·.·:·.:.:.:.:.I AI
NaI6"X6"
! ! ! ! , J ! [ , [ I
o 50 100mm
Cross sectional view of the polarimeter.
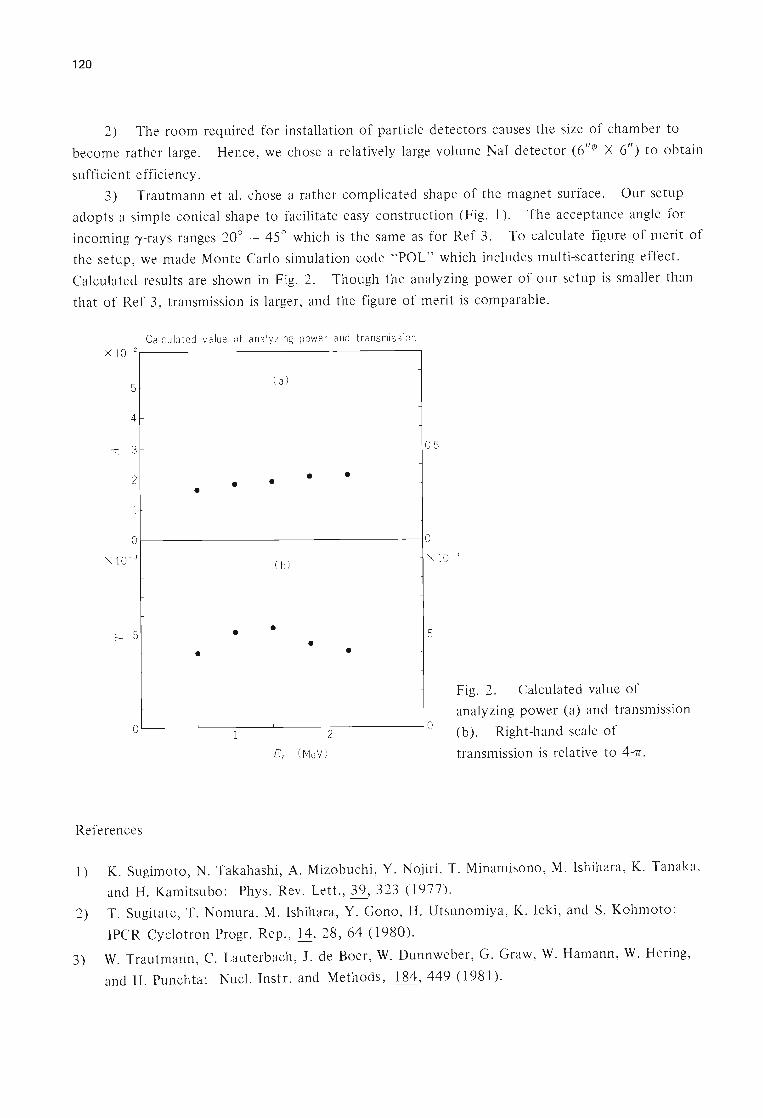
120
2) The room required for installation of particle detectors causes the size of chamber to
become rather large. Hence , we chose a relatively large volume NaI detector (6" rjJ X 6") to obtain
sufficien t efficiency.
3) Trautmann et al. chose a rather complicated shape of the magnet surface. Our setup
adopts a simple conical shape to facilitate easy construction (Fig. I). The acceptance angle for
incoming ')'-rays ranges 20° - 45 ° which is the same as for Ref 3. To calculate figure of merit of
the setup , we made Monte Carlo simulation code "POL" which includes multi-scattering effect.
Calculated results are shown in Fig. 2. Though the analyzing power of our setup is smaller than
that of Ref 3 , transmission is larger , and the figure of merit is comparable.
Calc ula ted value of ana lyz ing power and transmi ssion X I0- 2 ~---------------------------------.
51-
41-
"::t:: 3.- - 0.5
I
21- • • • • •
11-
0 ~--------------------------------~O
X 10- 3 X 10- 4
5r- • • - 5 h • • •
Fig. 2. Calculated value of
analyzing power (a) and transmission 0 I I 0
1 2 (b). Right-hand scale of
Er (MeV) transmission is relative to 4-7T.
References
1) K. Sugimoto, N. Takahashi, A. Mizobuchi , Y. Nojiri, T. Minamisono, M. Ishihara, K. Tanaka,
and H. Kamitsubo: Phys. Rev. Lett., 39, 323 (1977).
2) T. Sugitate , T. Nomura, M. Ishihara, Y. Gono, H. Utsunomiya, K. Ieki , and S. Kohmoto:
IPCR Cyclotron Progr. Rep. , 14,28 , 64 (1980).
3) W. Trautmann, C. Lauterbach , 1. de Boer, W. Dunnweber, G. Graw, W. Hamann , W. Hering,
and H. Punchta: Nucl. Instr. and Methods, 184, 449 (1981) .
121
III -5-2. Neutron Detection in In-Beam Spectroscopy
A. Hashizume, H. Kumagai, Y. Tendow, and
T. Katou
To study the states in neutron deficient nuclei excited by (HI , xn'Y) reactions by in-beam 'Y-ray
spectroscopy, it is important to distinguish other types of reactions such as charged particle
emitting reactions. The n-')' coincidence technique is a useful means to define the neutron emitting
reaction channel. A liquid plastic scintillation neutron detector has been successfully used for this purpose.
The detector consists of a RCA 8854 photomultiplier optically coupled to liquid plastic scintillator
of 5" diam.X3" NE213. To distinguish the neutrons from 'Y-rays a pulse shape discrimination
technique has been used. The block diagram used for the n-')' coincidence is shown in Fig. 1.
The selection of pulses caused by neutrons from those by 'Y-rays is made by the difference of
zero -crossing time of pulses. A typical time spectrum from the pulse shape discriminator system
C.F.D. : Constant fraction discriminator
P.S.D. : Pul se shape discr iminator
T.F.A. : Timing fi lter amplifi er
Computer
OK!
4500
Fig. 1. The block diagram of the electronic system to obtain n-')'
coincidence spectrum.
is shown in Fig. 2. Californium 252 was used for the 'Y-ray and neutron source. The time
resolution was considerably improved when the liquid scintillator and the photomultiplier were
cooled to 0° C.
Figure 3 shows 'Y-ray energy spectra in coincidence with neutrons obtained when 147 Sm was
bombarded by 100 MeV 160. For comparison a 'Y-ray singles spectrum is also shown. If one
takes the ratios of peak areas between 'Y-ray singles and n-')' coincidence for the 2+ 0+ transition in
e60, 3n) and the 17/2+ 13/2+ transition in e60, 4n) reactions, the peak of the 17/2+ 13/2+
transition is 1.3 times larger than that of 2+ 0+ transition in the n-')' coincidence spectrum. This
fact reflects the emission of one more neutron in cI60, 4n) than in cI60, 3n) reaction. Thus, to
observe the change of intensity of peaks in singles and n-'Y spectrum is a good means to distinguish
a (HI , xn) reaction from (HI, (x-l )n) or other charged particle emitting reactions.
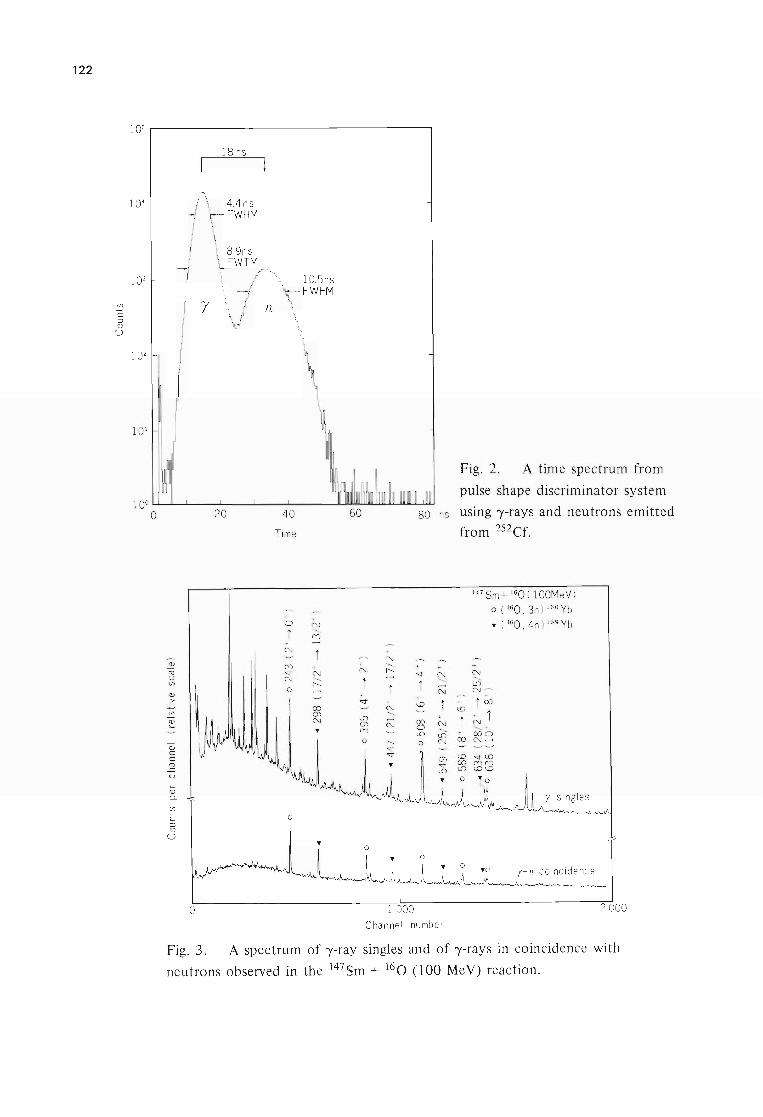
122
~ c: :::J 0
u
105
18 ns
104 '~4ns - FWHM
89ns FWTM
103
Y \1 n
10.5ns FWHM
102
Fig. 2. A time spectrum from
pulse shape discriminator system 100 ~~~--~----~--~----~~~uallL~UU~
o 20 40 60 80 ns using ')'-rays and neutrons emitted
Time
0 + N
------(Y)
~
~ (Y) + <U .q N u N
------(f) I"-
0 G.J
::: <U
co (J)
~ N
~
G.J c: c: <U
..c: u
~ 0..
(f)
C :::J 0
U
o
+ N
~
------N I"- + + .q N
------....... + .q t
N
N + '-0 i
------Lf) ....... (J) N (Y)
co + N 0
------LO Lf)
0 I"- 0 N .q .q I
(J) .q LO
1 000 Channel number
from 252Cf.
-'-0
i + co
147 Sm + 160 ( 100MeV) o ( 160, 3n) 160 Yb ~ ( 160 , 4n) 159 Yb
+ N
------LO N ~
i~ N
i ------+ co 0 N .......
.q'-O (Y) (Y)
'-0 '-0
y-n coincidence
2000
Fig. 3. A spectrum of ,),-ray singles and of ,),-rays in coincidence with
neutrons observed in the 147Sm + 16 0 (lOa MeV) reaction.
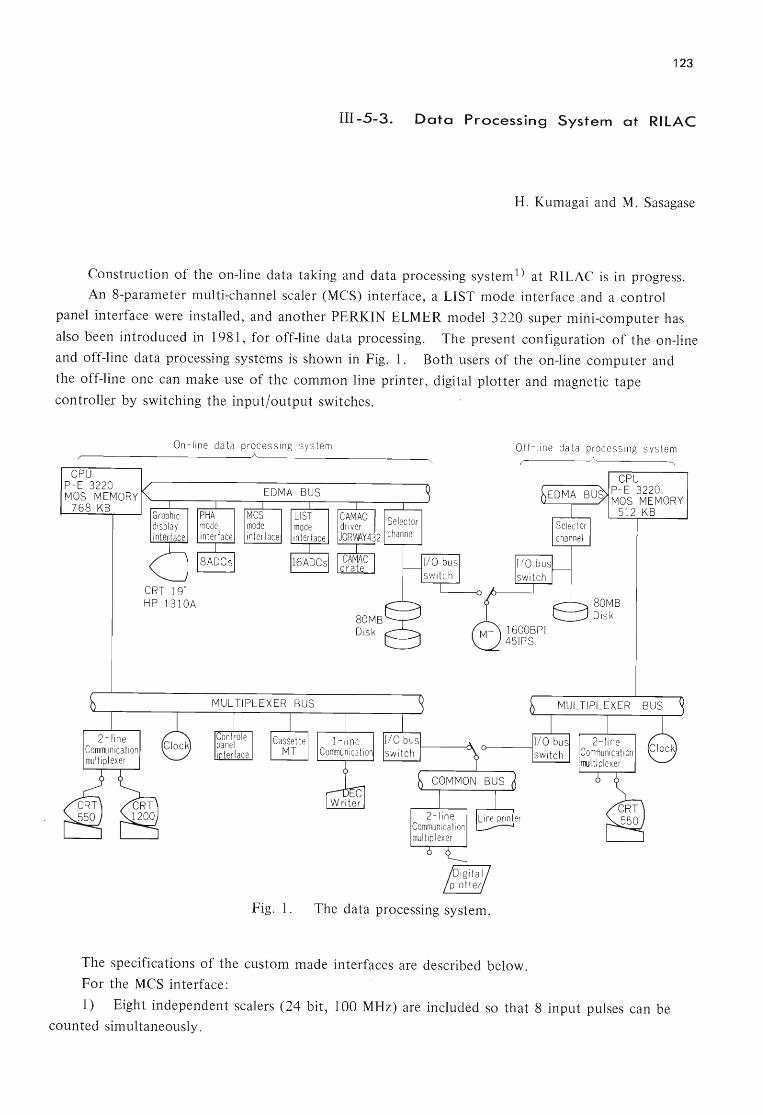
123
III -5-3. Data Processing System at RllAC
H. Kumagai and M. Sasagase
Construction of the on-line data taking and data processing system 1) at RILAC is in progress.
An 8-parameter multi-channel scaler (MCS) interface, a LIST mode interface and a control
panel interface were installed, and another PERKIN ELMER model 3220 super mini-computer has
also been introduced in 1981 , for off-line data processing. The present configuration of the on-line
and off-line data processing systems is shown in Fig. 1. Both users of the on-line computer and
the off-line one can make use of the common line printer, digital plotter and magnetic tape
controller by switching the input/output switches.
On-line data processing system Off - li ne data processing sys tem ~ ____________________ ~A~ ____________________ ~
CPU P- E 3220 MOS MEM ORY
768 KB
Fig. 1. The data processing system.
The specifications of the custom made interfaces are described below.
For the MCS interface:
CPU P- E 3220 MOS MEMORY
512 KB
I) Eight independent scalers (24 bit, 100 MHz) are included so that 8 input pulses can be
counted simultaneously.
124
2) Data address on the main memory is appointed with a universal logic interface (ULI).
3) Readout and modification of the contents of the main memory are performed with DMA
channel.
4) It is possible for a user-written program to control the interface ignoring the condition of
several switches on the front panel.
For the LIST mode interface:
1) Maximum 15 NIM-ADC's can be connected and coincidence data are sent to the main
memory event by event.
2) There are two coincidence modes, the internal coincidence mode and the external
coincidence mode. For the internal coincidence mode, coincident data are taken into the interface
when some ADC signals are input within a coincidence time, which is previously defined by a user.
For the external coincidence mode, gate signals for each ADC are generated by supplying an external
coincidence signal to the interface. Coincident data are simultaneously taken into the interface for
maximum 16 combinations of the ADC's in this mode.
3) Coincidence data are sent to the main memory from the interface through DMA channel.
4) There are two buffer areas of 16 k byte on the main memory. The data on the buffer
area are recorded on a magnetic tape or a disk when one of these buffer areas is filled up with
data.
For the control panel interface:
1) This interface is designed to enable a user to control the PHA, MCS, and LIST interfaces
and to do I/O operation to a disk, the magnetic tape, the line printer or the plotter by pressing the
butten switches on the panel.
Development of softwares to control the above-mentioned interfaces is in progress. Because
many functions are required to the system, these functions are shared with many separated tasks
and care is taken so that close communication is possible among these tasks. The on-line data
processing system is planned to be accomplished by the end of February in 1982.
Reference
1) H. Kumagai and T. Wada: IPCR Cyclotron Progr. Rep., .!.i: 156 (1980).

125
N . ACCELERATOR DEVELOPMENT
1. New Gas-Feed System and Acceleration Test of
Heavy Ions with Gas Mixing
K. Ikegami , K. Ogiwara, and I. Kohno
A gas-feed system was improved for stable operation of the ion source. A method of mixing
gas l ) through the gas-feed system was applied in the production and acceleration of heavy ions such
as C4+, 0 5 + , N4+ , N5+ or Ne6+ ions, to increase beam intensity and stability of source operation.
Figure I shows a block diagram of the new gas-feed system. This system consists of four
reservoirs, additional valves and two gas-feed lines having a gas flow controller. The reservoirs and
additional valves are placed in the control room. Two gas controllers are installed in the
underground room of the cyclotron vault, because the ion source must respond quickly to the
change of gas flow without picking up RF noise. Figure 2 shows a block diagram of a gas flow
controller system. This system is composed of a piezoelectric valve2 ) PV-10 made by VEECO, a
gas flow controller made by RIKEN and a mass flow meter by HASTING. The valve PV -lOis
operated by an electric pulse with a repetition rate of 300 Hz and an amplitude of 80 - 100 V
supplied by a controller. By varying the pulse duration from 0 to 6 % one gas flow controller
can be remotely controlled over a range of 0 to 10 cc/min and the other from 0 to 5 cc/min.
In the case of mixed gas, the main gas was supplied to the ion source through one gas-feed
line and the support gas was supplied through the other line. Rare gases, such as He, Ne , Ar, Kr,
and Xe, were mainly used as the support gas. To investigate the gas mixing effect, heavy ion
source of electron-bombarded hot cathode type3) was used. In the test run the electron
bombarding power was switched off after the source was ignited to avoid effect the other than the
E.M.V
Yellow
Gas Flow Controller
Ion Source E.M.v
Blue Gas Flow Controller
Control Room Cyclotron Room
Fig. 1. A block diagram of the gas-feed system. Yellow line indicates
a path of the main gas and blue line a path of the supporting gas.
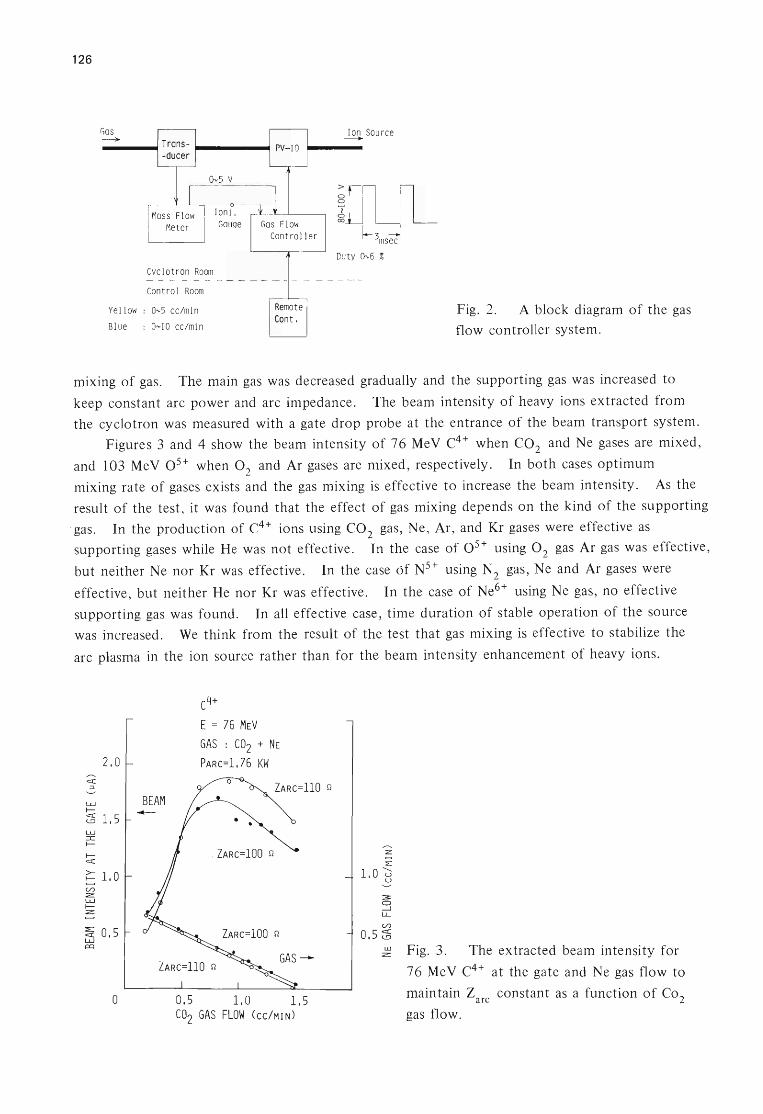
126
Gas -Ov5V
Cyclo t ron Room
Control Room
Yell ow : O~5 cc /min
Bl ue : 0-1 0 cc/min
Ion Sou rce -
iJUL ~ 3mset
Duty Gv6 %
Fig. 2. A block diagram of the gas
flow controller system.
mixing of gas. The main gas was decreased gradually and the supporting gas was increased to
keep constant arc power and arc impedance. The beam intensity of heavy ions extracted from
the cyclotron was measured with a gate drop probe at the entrance of the beam transport system.
Figures 3 and 4 show the beam intensity of 76 MeV C4 + when CO2 and Ne gases are mixed,
and 103 MeV 0 5 + when 02 and Ar gases are mixed, respectively. In both cases optimum
mixing rate of gases exists and the gas mixing is effective to increase the beam intensity. As the
result of the test , it was found that the effect of gas mixing depends on the kind of the supporting
gas. In the production of C4 + ions using CO2 gas, Ne, Ar, and Kr gases were effective as
supporting gases while He was not effective. In the case of 0 5 + using 02 gas Ar gas was effective ,
but neither Ne nor Kr was effective. In the case of N5+ using N2 gas, Ne and Ar gases were
effective , but neither He nor Kr was effective. In the case of Ne6+ using Ne gas, no effective
supporting gas was found. In all effective case, time duration of stable operation of the source
was increased. We think from the result of the test that gas mixing is effective to stabilize the
arc plasma in the ion source rather than for the beam intensity enhancement of heavy ions.
L1.J ~
2.0
~ 1.5 L1.J = ~ ~ c::r:
~ 1.0 (/)
= L1.J ~
=
~ 0.5 L1.J p:)
o
BEAM --
C4+
E = 76 MEV GAS : CO2 + NE PARc=1.76 KW
.ZARc=lOO n
0.5 1.0 1.5 CO2 GAS FLOW (CC/MIN)
:E:
1.0'0 u
w = Fig. 3. The extracted beam intensity for
76 MeV C4 + at the gate and Ne gas flow to
maintain Z constant as a function of CO2 arc
gas flow.

0.7
0,6
~ 0 5 '-' . l1.J I-c::::x:: <..!:J
l1.J 0.4 = I--
I-c::::x::
~ 0.3 (/) = W I--= - 0.2 :E c::::x:: W !Xl
0,1
o
05+
E = 103 MEV GAS : O2 + AR
o
PARC=2.49 KW Z=87 [I
PARC=2,5 KW Z=lOO [I
0,5 1,0 1,5 O2 GAS FLOW (CC!MIN)
2.0
Fig. 4. The extracted beam intensity for
0.3 ~
O.l~ <..!:J
103 MeV 0 5+ at the gate and Ar gas flow to
maintain Z constant as a function of 02 arc
gas flow.
References
1) E.D. Hudson, G.A. Palmer, and C.L. Haley: IEEE Trans. Nucl. Sci., NS-24, 1950 (1977).
2) Y. Sakurada, G.D. Deharen, W.J. Walterscheid, S.M. Rielamowicz, R.L. Haisler, and H.W.
Peeler: ibid., NS-26, 2175 (1975).
3) T. Kageyama, K. Ikegami, and 1. Kohno: IPCR Cyclotron Progr. Rep., l.±, 4 (1980).
127
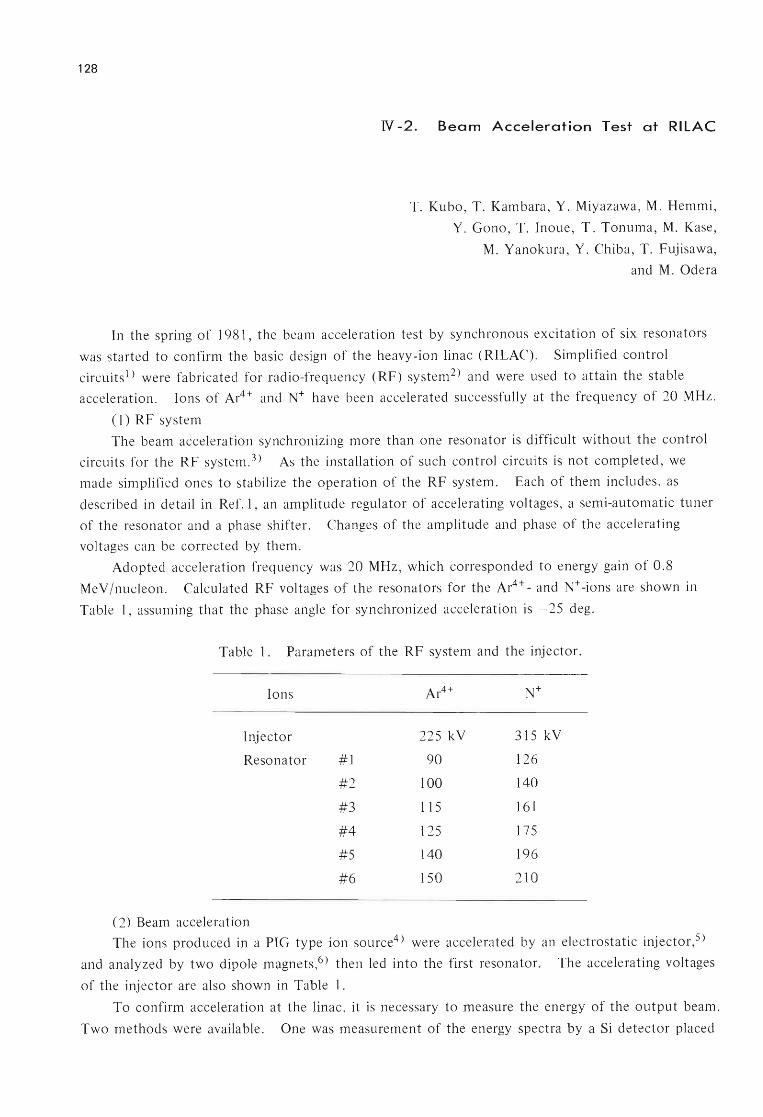
128
N -2. Beam Acceleration Test at RllAC
T. Kubo , T. Kambara, Y. Miyazawa, M. Hemmi,
Y. Gono, T. Inoue, T. Tonuma, M. Kase,
M. Yanokura, Y. Chiba, T. Fujisawa,
and M. Odera
In the spring of 1981 , the beam acceleration test by synchronous excitation of six resonators
was started to confirm the basic design of the heavy-jon linac (RILAC). Simplified control
circuitsl) were fabricated for radio-frequency (RF) system2) and were used to attain the stable
acceleration. Ions of Ar4+ and N+ have been accelerated successfully at the frequency of 20 MHz.
( I) RF system
The beam acceleration synchronizing more than one resonator is difficult without the control
circuits for the RF system. 3) As the installation of such control circuits is not completed, we
made simplified ones to stabilize the operation of the RF system. Each of them includes , as
described in detail in Ref. I, an amplitude regulator of accelerating voltages , a semi-automatic tuner
of the resonator and a phase shifter. Changes of the amplitude and phase of the accelerating
voltages can be corrected by them.
Adopted acceleration frequency was 20 MHz , which corresponded to energy gain of 0.8 Me V /nucleon. Calculated RF voltages of the resonators for the Ar4+ - and N+ -ions are shown in
Table 1, assuming that the phase angle for synchronized acceleration is - 25 deg.
Table 1. Parameters of the RF system and the injector.
Ions Ar4+ N+
Injector 225 kV 315 kV
Resonator #1 90 126
#2 100 140
#3 115 161
#4 125 175
#5 140 196
#6 150 210
(2) Beam acceleration
The ions produced in a PIG type ion source4) were accelerated by an electrostatic injector,S)
and analyzed by two dipole magnets ,6) then led into the first resonator. The accelerating voltages
of the injector are also shown in Table 1.
To confirm acceleration at the linac , it is necessary to measure the energy of the output beam.
Two methods were available. One was measurement of the energy spectra by a Si detector placed
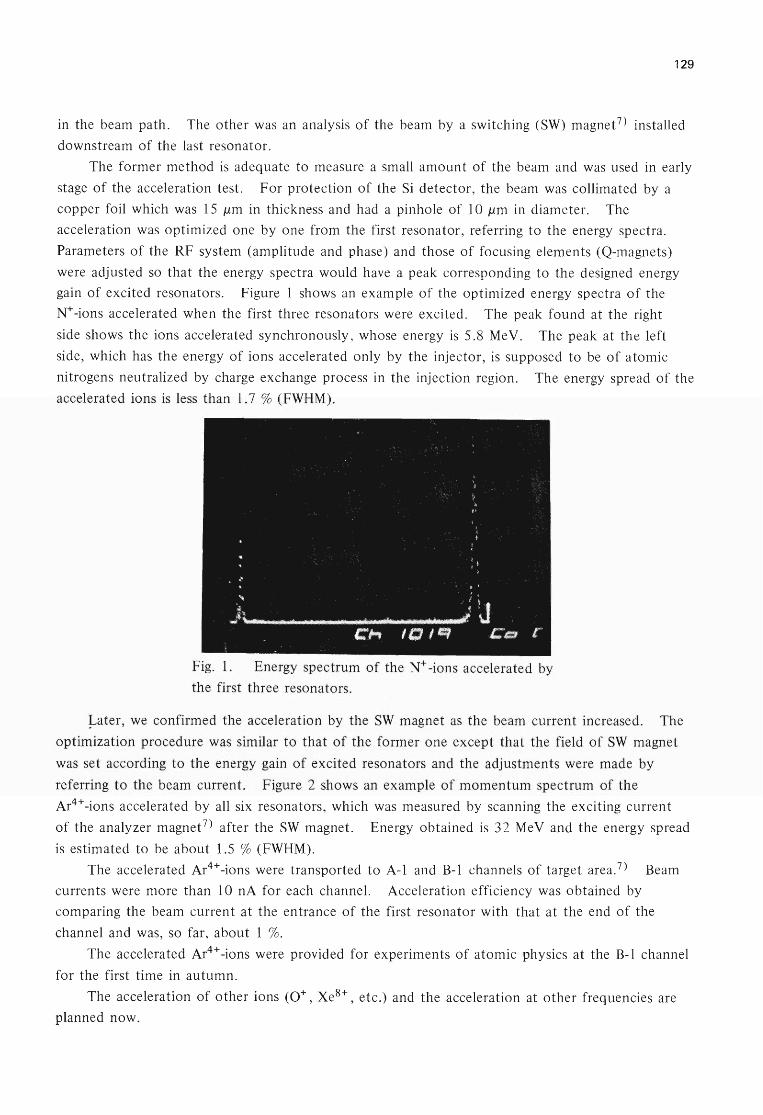
129
in the beam path. The other was an analysis of the beam by a switching (SW) magnet 7) installed
downstream of the last resonator.
The former method is adequate to measure a small amount of the beam and was used in early
stage of the acceleration test. For protection of the Si detector , the beam was collimated by a
copper foil which was 15 11m in thickness and had a pinhole of 10 11m in diameter. The
acceleration was optimized one by one from the first resonator, referring to the energy spectra.
Parameters of the RF system (amplitude and phase) and those of focusing elements (Q-magnets)
were adjusted so that the energy spectra would have a peak corresponding to the designed energy
gain of excited resonators. Figure I shows an example of the optimized energy spectra of the
N+ -ions accelerated when the first three resonators were excited. The peak found at the right
side shows the ions accelerated synchronously , whose energy is 5.8 Me V. The peak at the left
side, which has the energy of ions accelerated only by the injector, is supposed to be of atomic
nitrogens neutralized by charge exchange process in the injection region. The energy spread of the
accelerated ions is less than 1.7 % (FWHM).
Fig. 1. Energy spectrum of the N+ -ions accelerated by
the first three resonators.
~ater, we confirmed the acceleration by the SW magnet as the beam current increased. The
optimization procedure was similar to that of the former one except that the field of SW magnet
was set according to the energy gain of excited resonators and the adjustments were made by
referring to the beam current. Figure 2 shows an example of momentum spectrum of the
Ar4+ -ions accelerated by all six resonators , which was measured by scanning the exciting current
of the analyzer magnet?) after the SW magnet. Energy obtained is 32 MeV and the energy spread
is estimated to be about 1.5 % (FWHM).
The accelerated Ar4+ -ions were transported to A-I and B-1 channels of target area.7) Beam
currents were more than 10 nA for each channel. Acceleration efficiency was obtained by
comparing the beam current at the entrance of the first resonator with that at the end of the
channel and was, so far , about 1 %. The accelerated Ar4+ -ions were provided for experiments of atomic physics at the B-1 channel
for the first time in autumn.
The acceleration of other ions (0+ , Xe8+ , etc.) and the acceleration at other frequencies are
planned now.
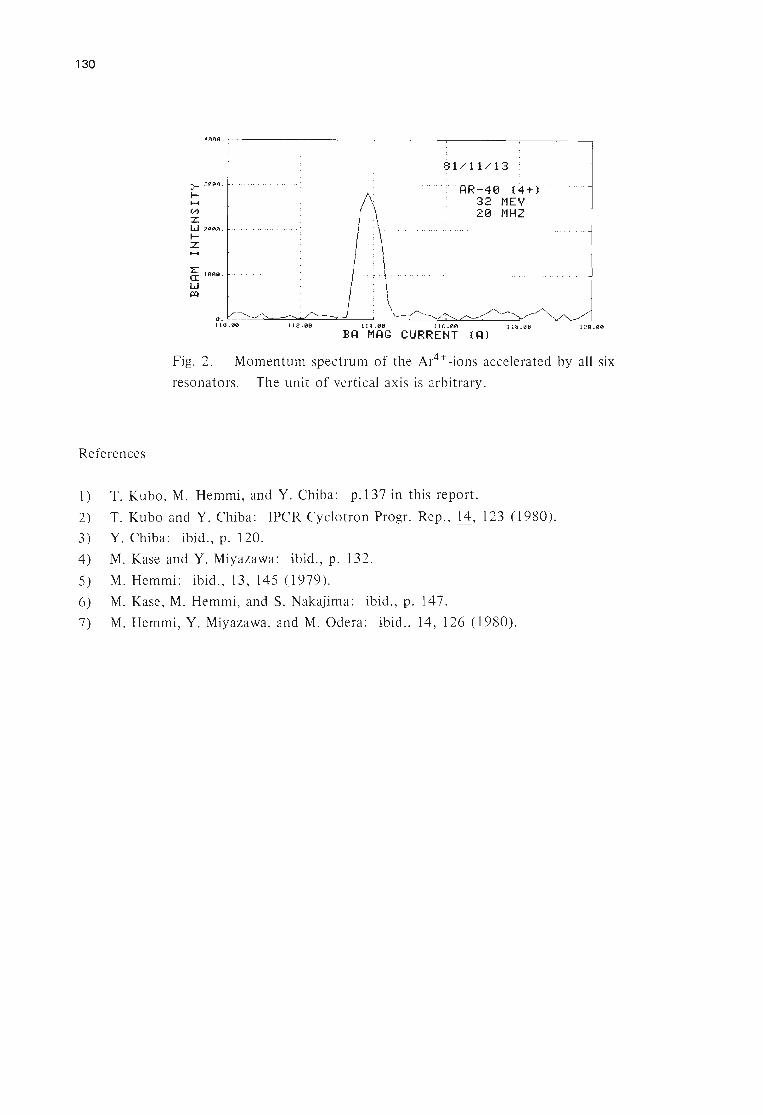
130
References
488\3 . ,--~----.--~--r--~--.--~---''--------~-~
>- 3B8t;1.
I/)
Z W 2888.
t-Z
~ 1888.
W ~
81/11/13
· AR-40 (4+) 32 MEV 20 MHZ
114.99 116.06 1:8 .89 12 9.88
BR MRG CURRENT (R)
Fig. 2. Momentum spectrum of the Ar4+ -ions accelerated by all six
resonators. The unit of vertical axis is arbitrary.
1) T. Kubo, M. Hemmi, and Y. Chiba: p.137 jn this report.
2) T. Kubo and Y. Chiba: IPCR Cyclotron Progr. Rep., 14, 123 (1980).
3) Y. Chiba: ibid., p. 120.
4) M. Kase and Y. Miyazawa: ibid., p. 132.
5) M. Hemmi: ibid., 11, 145 (1979).
6) M. Kase, M. Hemmi, and S. Nakajima: ibid., p. 147.
7) M. Hemmi, Y. Miyazawa, and M. Odera: ibid., 14, 126 (1980).
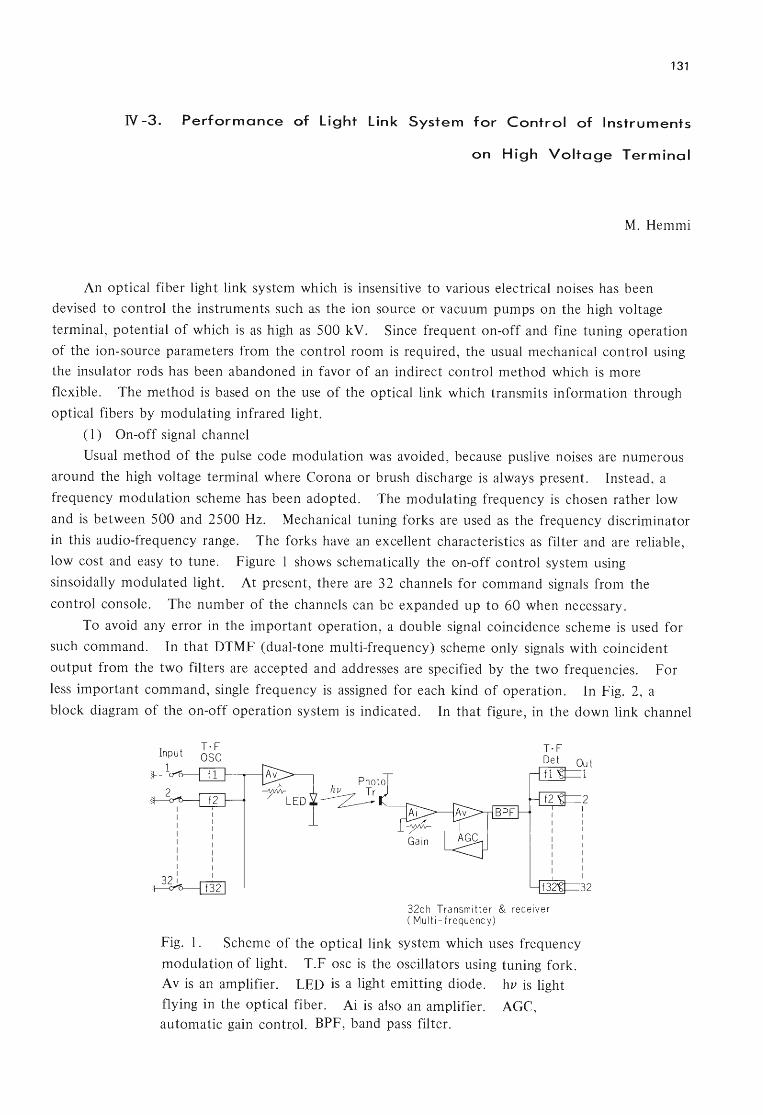
131
N -3. Performance of Light Link System for Control of Instruments
on High Voltage Terminal
M. Hemmi
An optical fiber light link system which is insensitive to various electrical noises has been
devised to control the instruments such as the ion source or vacuum pumps on the high voltage
terminal , potential of which is as high as 500 kV. Since frequent on-off and fine tuning operation
of the ion-source parameters from the control room is required , the usual mechanical control using
the insulator rods has been abandoned in favor of an indirect control method which is more
flexible. The method is based on the use of the optical link which transmits information through
optical fibers by modulating infrared light.
(1) On-off signal channel
Usual method of the pulse code modulation was avoided , because puslive noises are numerous
around the high voltage terminal where Corona or brush discharge is always present. Instead , a
frequency modulation scheme has been adopted. The modulating frequency is chosen rather low
and is between 500 and 2500 Hz. Mechanical tuning forks are used as the frequency discriminator
in this audio-frequency range. The forks have an excellent characteristics as filter and are reliable,
low cost and easy to tune. Figure I shows schematically the on-off control system using
sinsoidally modulated light. At present , there are 32 channels for command signals from the
control console. The number of the channels can be expanded up to 60 when necessary.
To avoid any error in the important operation, a double signal coincidence scheme is used for
such command. In that DTMF (dual-tone multi-frequency) scheme only signals with coincident
output from the two filters are accepted and addresses are specified by the two frequencies. For
less important command, single frequency is assigned for each kind of operation. In Fig. 2, a
block diagram of the on-off operation system is indicated. In that figure, in the down link channel
Input
~
T·F OSC
/'- h Ph oto
-rLED ~ -,----------,""",",---I I I I I I I I I I
2
,-,-===-=--32
32ch Transmitter & rece iver ( Mu lti - frequency)
Fig. 1. Scheme of the optical link system which uses frequency
modulation of light. T.F osc is the oscillators using tuning fork.
Av is an amplifier. LED is a light emitting diode. hv is light
flying in the optical fiber. Ai is also an amplifier. AGC, automatic gain contr.ol. BPF, band pass filter.

132
500kV Terminal
Trans mitter
32ch
IIso la ti on Earth level
m c::
.~ I-
Control desk
Fig. 2. Block diagram of the light link system for on-off operation.
which conveys the status information on the terminal , single frequency characterization scheme is
solely used.
(2) Analog signal channel
We have not used the sophisticated multiplexer and ADC (analog to digital converter)
combination. We have set up a simple and straight forward system using V /F (voltage to frequency
converter) and F /V (frequency to voltage converter) circuits together with the LED (light emitting
diode) and Photo-transistors. Each channel carries only one kind of analog signals as shown in
Fig. 3. The scheme is very simple and its maintenance and expansion work needs no sophisticated
technology. The conversion coefficients in this system are 100 mV/lO kHz for V/F and 10
kHz/ 1 0 V for F /V, accuracy being 10 bits.
+~v~ l~Om V V/F ~.~ Com
;EF~ I I I I I I
~: :::LJ~~
lJ 500kV Iso lati on
Fig. 3. High voltage isolation amplifier
scheme for transmission of analog signals,
using V/F and F/V converters.
(3) Selection of the optical fibers and mating of the connectors
Among the numerous brands of the fibers in the market , those having a large numerical
aperture and of low cost were selected. Mating the connectors to the ends of the fiber cable was
made by ourselves without difficulty.
As stated above, our optical data link system uses only standard parts found in the market
and maintenance or expansion of the system is easy. Its structure is very simple and a high degree
of reliability has been achieved. The system is found free of misoperation by virtue of the
frequency modulation scheme using the tuning forks, especially, the DTMF method guarantees
transmission of the important command without receiving perturbation from the electrical noises
present in the injector room.
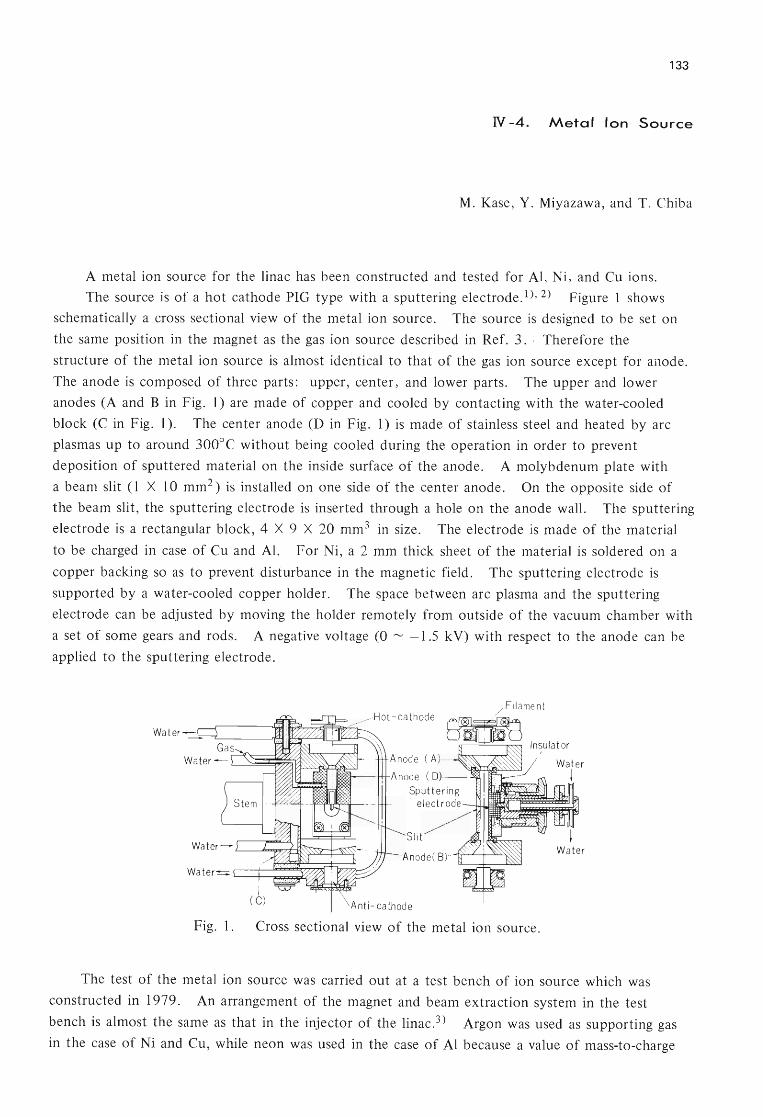
133
N -4. Metal Ion Source
M. Kase, Y. Miyazawa, and T. Chiba
A metal ion source for the linac has been constructed and tested for AI, Ni, and Cu ions.
The source is of a hot cathode PIG type with a sputtering electrode.!)' 2) Figure 1 shows
schematically a cross sectional view of the metal ion source. The source is designed to be set on
the same position in the magnet as the gas ion source described in Ref. 3 . . Therefore the
structure of the metal ion source is almost identical to that of the gas ion source except for anode.
The anode is composed of three parts: upper, center, and lower parts. The upper and lower
anodes (A and B in Fig. 1) are made of copper and cooled by contacting with the water-cooled
block (C in Fig. 1). The center anode (D in Fig. I) is made of stainless steel and heated by arc
plasmas up to around 300°C without being cooled during the operation in order to prevent
deposition of sputtered material on the inside surface of the anode. A molybdenum plate with
a beam slit (1 X 10 mm2 ) is installed on one side of the center anode. On the opposite side of
the beam slit, the sputtering electrode is inserted through a hole on the anode wall. The sputtering
electrode is a rectangular block, 4 X 9 X 20 mm3 in size. The electrode is made of the material
to be charged in case of Cu and AI. For Ni, a 2 mm thick sheet of the material is soldered on a
copper backing so as to prevent disturbance in the magnetic field. The sputtering electrode is
supported by a water-cooled copper holder. The space between arc plasma and the sputtering
electrode can be adjusted by moving the holder remotely from outside of the vacuum chamber with
a set of some gears and rods. A negative voltage (0 '" -1.5 kV) with respect to the anode can be
applied to the sputtering electrode.
Fil ament
Water
Fig. 1. Cross sectional view of the metal ion source.
The test of the metal ion source was carried out at a test bench of ion source which was
constructed in 1979. An arrangement of the magnet and beam extraction system in the test
bench is almost the same as that in the injector of the linac. 3) Argon was used as supporting gas
in the case of Ni and Cu, while neon was used in the case of Al because a value of mass-to-charge
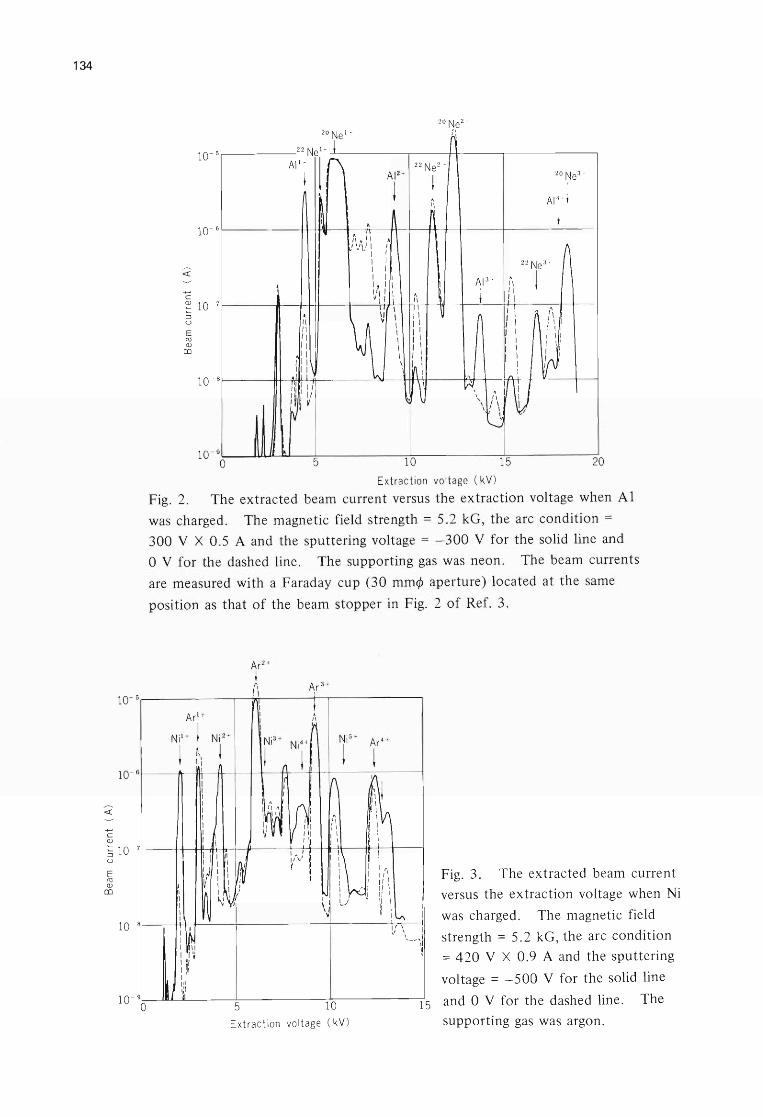
134
10- 5 22Ne l +J n AI'; I r1 AI2+
22 Ne2 +
10- 6
c ~ 10- 7
:::l U
E CU Q)
CO
10- 8
10- 9
o
t
I 1-.
A 1\ 1\ II 1\ I \
II I I I 1\ .1
1\11\, ,i ll II d ~ v rv
5
. ~ ~ ~ A
tl • II ( ~ VI) I
I I I I I I I ~ I 11\ I ~ I I
\1 I
~: \
\
I 20 Ne3+
AI 4+1
n I
22 Ne3 + A AI3+ tl I
~ I I II
1\ 1 '\ \
~ I' : A "~I I n III " \ ii, I II I II I I I I
h Ij(J , r\
U ~\ 'IV \ , , 'I
\ '\ \ j/ ~ '-J
10 15 20
Ext rac tion voltage ( kV )
Fig. 2. The extracted beam current versus the extraction voltage when Al
was charged. The magnetic field strength = 5.2 kG, the arc condition = 300 V X 0.5 A and the sputtering voltage = -300 V for the solid line and
o V for the dashed line. The supporting gas was neon. The beam currents
are measured with a Faraday cup (30 mm¢ aperture) located at the same
position as that of the beam stopper in Fig. 2 of Ref. 3.
Ar 2 +
t (\ A
lr 3 +
10- 5~-----------'~rr-------r-'-----------~
r \ ! Ar
l+ \ K
Ni1+ I Ni 2+ I Ni 5+
j i'; j r+" Nr I r 10- 6~--_~.-11~'-1~~~+4--;+--~~----~----~
I' ! f\ ~;Ij Ilm/\"\~: I, I I I 1",
I I II C 'I I IJ I I Q) I I 11 I I ~10 - 7~--11-4~~/~~----~~-r~---#~1 -r--~
u I r N ~r) l i~ I E iJ II I : r, ~ I V I II \
OJ \ ~" ~ , \ ' ~ \ ~ 10 - 8~--4+I~WI+-----~-----------r------~~~:-\-11
I '---'Ii : I ~ ~ I II
Fig. 3. The extracted beam current
versus the extraction voltage when Ni
was charged. The magnetic field
strength = 5.2 kG, the arc condition
= 420 V X 0.9 A and the sputtering I~
~ [,I voltage = - 500 V for the solid line 1O - 90L--..J.IIIUI_ liiLl,1 ------'-5----- -
1.J.....0---- ---,J15 and 0 V for the dashed line. The
Extract ion voltage (kV) supporting gas was argon.
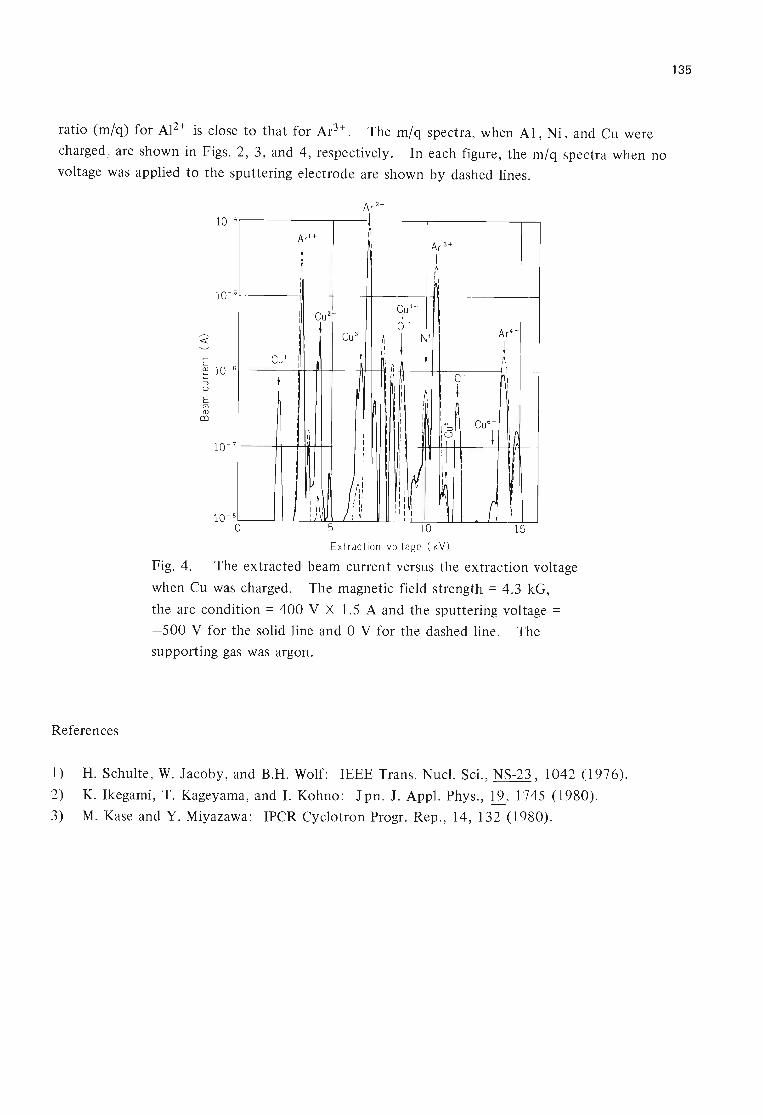
ratio (m/q) for A12+ is close to that for Ar3+ . The m/q spectra, when AI, Ni , and Cu were
charged ) are shown in Figs. 2, 3, and 4, respectively. In each figure, the m/q spectra when no
voltage was applied to the sputtering electrode are shown by dashed lines.
References
E cu Q)
co
10- 4
10- 7
10- 8
o
I ~
Ar 1+ II I
Ar 3+ ~
I . I II ~ II '1 I' 'I I I ,
I Cu 4+ I Cu 2+ I
~ 0+ I , Cu 3+ t1 I
W
! Ii
~ C~l + I '1
ft I ,~ I
+ i '1 JI
I I I I ,
'I II +
I I I"S ~
, , II I 1° , I I
I
\J I ,
t ' :It- ~ : 1\ "1 /11
Ii: i ' I,
: :\!\.I ' I, I ' Y
II I , 5 10
Extraction voltage ( kV )
Ar 4+
~ . II
I
C+ n +
Cu 6 +
~ 1\ 1-1
n ~ 15
Fig. 4. The extracted beam current versus the extraction voltage
when Cu was charged. The magnetic field strength = 4.3 kG,
the arc condition = 400 V X 1.5 A and the sputtering voltage =
- 500 V for the solid line and 0 V for the dashed line. The
supporting gas was argon.
1) H. Schulte, W. Jacoby, and B.H. Wolf: IEEE Trans. Nucl. Sci., NS-23 , 1042 (1976).
2) K. Ikegami, T. Kageyama, and I. Kohno: J pn. J. Appl. Phys., !2., 1745 (1980).
3) M. Kase and Y. Miyazawa: IPCR Cyclotron Progr. Rep., 14, 132 (1980).
135

136
N -5. Construction of ECR Ion Source
M. Yanokura and M. Odera
Development of an electron-cyclotron resonance (ECR) ion source has been started to get
multiply charged ions or high intensity beams of low-charge light ions. Figure I shows the test
stand of the ECR ion source. The ion source has only one ECR cavity which is insulated from
the other components and is kept at a positive high voltage up to 10 kV.
an UHF power source and its output power is 1.6 kW (CW) at 2.45 GHz.
A magnetron is used as
The UHF power is
supplied to the ECR cavity through an isolater, power monitor , EH tuner and RF window. Three
diffusion pumps are installed in the test stand. One pump evacuates mainly the volume of the
ECR cavity , and the other two pumps evacuate the volume of the beam extraction and analyzing
systems. These systems, pumps and the UHF power source , are at the ground potential, and are
insulated from the ECR cavity. The beam extracted from the ion source is focused by an einzel
lense and analyzed by a magnet having a maximum Bp of 94.5 kGauss· cm. After analyzing, the
beam current is measured with a Faraday C11p.
7
Fig. 1. Plan of the ECR ion source test stand. 1: 2.45 GHz
magnetron , 2: isolater , 3: power monitor , 4: EH tuner ,
5: RF window , 6: gas valve , 7: 600 Lis diffusion pump ,
8: insulater, 9: main coil , 10: ECRcavity , 11: extractor
and einzel lense , 12: 1500 Lis diffusion pump , 13: analyzing
magnet, 14: Faraday cup.
This ECR ion source was tested using Ar gas. When Ar gas was fed into the ECR cavity at a
flow rate of I cm3 /min , the pressure in the cavity was observed to be around 10- 4 Torr. Plasma
is seen to be formed in the cavity at a relatively low power level when the UHF power was
supplied , and a few nA Ar2+ beam was measured at the Faraday cup. However, the plasma
formed was not such that one would have expected in its distribution in the cavity. It is supposed
that this result is due to the inadequate position and geometry of the vacuum window in the
wave-guide. Improvement of the window is supposed to be necessary.
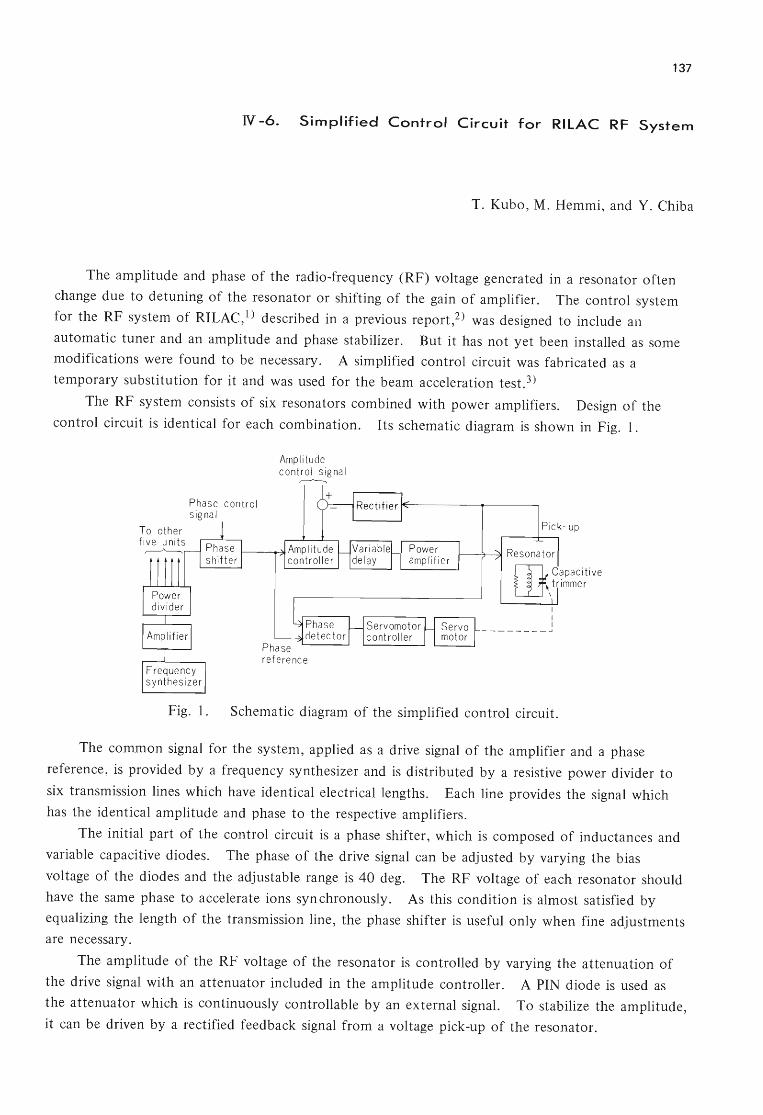
137
N -6. Simplified Control Circuit for RllAC RF System
T. Kubo, M. Hemmi, and Y. Chiba
The amplitude and phase of the radio-frequency (RF) voltage generated in a resonator often
change due to detuning of the resonator or shifting of the gain of amplifier. The control system
for the RF system of RILAC,1) described in a previous report,2) was designed to include an
automatic tuner and an amplitude and phase stabilizer. But it has not yet been installed as some
modifications were found to be necessary. A simplified control circuit was fabricated as a
temporary substitution for it and was used for the beam acceleration test. 3)
The RF system consists of six resonators combined with power amplifiers. Design of the
control circuit is identical for each combination. Its schematic diagram is shown in Fig. 1.
Phase control signal
Amplitu de control signa l ~
I I I ________ ...J
Fig. 1. Schematic diagram of the simplified control circuit.
The common signal for the system, applied as a drive signal of the amplifier and a phase
reference , is provided by a frequency synthesizer and is distributed by a resistive power divider to
six transmission lines which have identical electrical lengths. Each line provides the signal which
has the identical amplitude and phase to the respective amplifiers.
The initial part of the control circuit is a phase shifter, which is composed of inductances and
variable capacitive diodes. The phase of the drive signal can be adjusted by varying the bias
voltage of the diodes and the adjustable range is 40 deg. The RF voltage of each resonator should
have the same phase to accelerate ions syn chronously. As this condition is almost satisfied by
equalizing the length of the transmission line, the phase shifter is useful only when fine adjustments
are necessary.
The amplitude of the RF voltage of the resonator is controlled by varying the attenuation of
the drive signal with an attenuator included in the amplitude controller. A PIN diode is used as
the attenuator which is continuously controllable by an external signal. To stabilize the amplitude,
it can be driven by a rectified feedback signal from a voltage pick-up of the resonator.
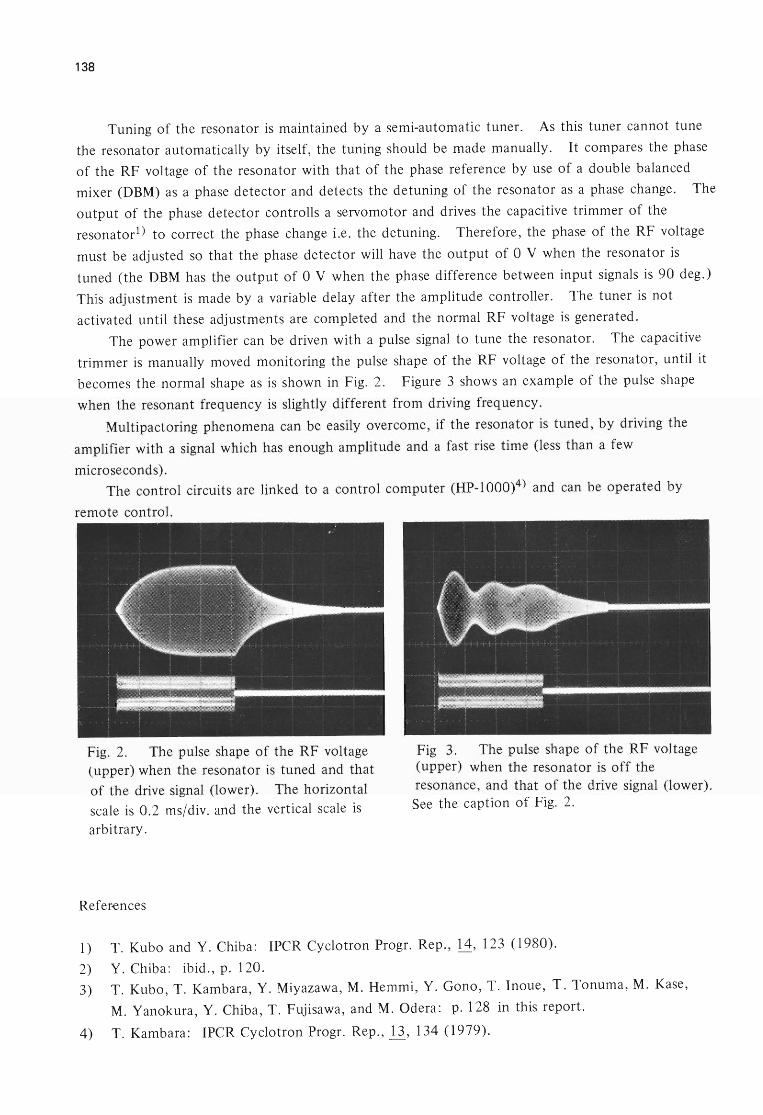
138
Tuning of the resonator is maintained by a semi-automatic tuner. As this tuner cannot tune
the resonator automatically by itself, the tuning should be made manually. It compares the phase
of the RF voltage of the resonator with that of the phase reference by use of a double balanced
mixer (DBM) as a phase detector and detects the detuning of the resonator as a phase change. The
output of the phase detector controlls a servomotor and drives the capacitive trimmer of the
resonatorl) to correct the phase change i.e. the detuning. Therefore, the phase of the RF voltage
must be adjusted so that the phase detector will have the output of 0 V when the resonator is
tuned (the DBM has the output of 0 V when the phase difference between input signals is 90 deg.)
This adjustment is made by a variable delay after the amplitude controller. The tuner is not
activated until these adjustments are completed and the normal RF voltage is generated.
The power amplifier can be driven with a pulse signal to tune the resonator. The capacitive
trimmer is manually moved monitoring the pulse shape of the RF voltage of the resonator, until it
becomes the normal shape as is shown in Fig. 2. Figure 3 shows an example of the pulse shape
when the resonant frequency is slightly different from driving frequency.
Multipactoring phenomena can be easily overcome, if the resonator is tuned, by driving the
amplifier with a signal which has enough amplitude and a fast rise time (less than a few
microseconds).
The control circuits are linked to a control computer (HP-I 000)4) and can be operated by
remote control.
Fig. 2. The pulse shape of the RF voltage (upper) when the resonator is tuned and that
of the drive signal (lower). The horizontal
scale is 0.2 ms/div. and the vertical scale is arbitrary.
References
Fig 3. The pulse shape of the RF voltage (upper) when the resonator is off the resonance, and that of the drive signal (lower). See the caption of Fig. 2.
1) T. Kubo and Y. Chiba: IPCR Cyclotron Progr. Rep., 14, 123 (1980).
2) Y. Chiba: ibid., p. 120.
3) T. Kubo , T. Kambara, Y. Miyazawa, M. Hemmi, Y. Gono, T. Inoue, T. Tonuma, M. Kase,
M. Yanokura, Y. Chiba, T. Fujisawa, and M. Odera: p. 128 in this report.
4) T. Kambara: IPCR Cyclotron Progr. Rep., 11, 134 (1979).

139
N -7. Design of Compact Quadrupole Magnet
Y. Miyazawa and M. Hemmi
A compact quadrupole magnet of a moderate strength is frequently desired so that it can be
inserted in the narrow space of the beam line to modify the orbit dynamics. One of the examples
of such requirement is the change of beam characteristics on the targets. Another is the change
of the beam property by a possible replacement of the ion source by a new type of source.
Figure 1 shows a design which has an integrated strength of 75 kG for pole to pole gap of 25.4 mm
and a pole length of 15 cm. The tape coil technique which has been improved and used
extensively in the linear accelerator project is also used for this magnet. Table 1 is the
specification of the magnet designed.
456 228 150
228 150
o L.O N
~Lr---4---,---L-------- -L..----++---.'-- ---r-----'-
Fig. 1. Cross section of the doublet quadrupole magnet designed.
Table 1. Design specification of the quadrupole magnet.
Field gradient
Pole length
Aperture (pole to pole)
Outer diameter
Maximum ampere-turn
Power consumption
Weight
5 kG/cm (maximum)
15 cm
25.4 mm
20.4 cm
4000 AT
0.75 kW (maximum)
50 kg
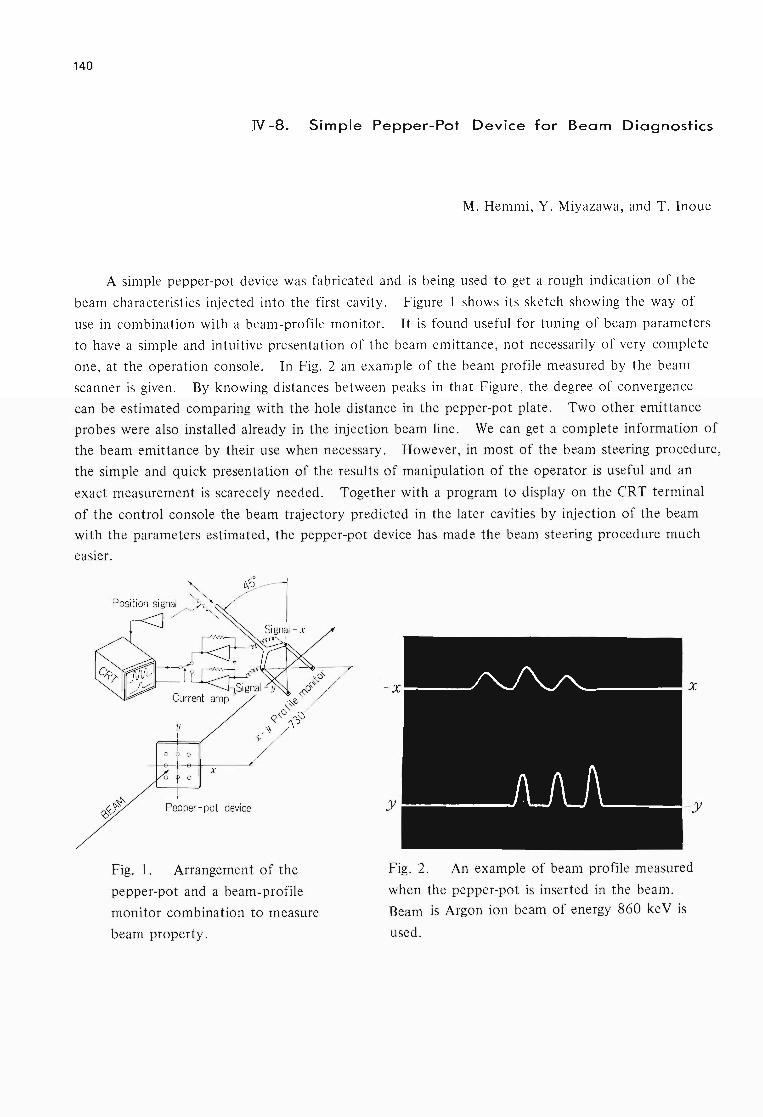
140
N -8. Simple Pepper-Pot Device for Beam Diagnostics
M. Hemmi, Y. Miyazawa, and T. Inoue
A simple pepper-pot device was fabricated and is being used to get a rough indication of the
beam characteristics injected into the first cavity. Figure 1 shows its sketch showing the way of
use in combination with a beam-profile monitor. It is found useful for tuning of beam parameters
to have a simple and intuitive presentation of the beam emittance, not necessarily of very complete
one, at the operation console. In Fig. 2 an example of the beam profile measured by the beam
scanner is given. By knowing distances between peaks in that Figure, the degree of convergence
can be estimated comparing with the hole distance in the pepper-pot plate. Two other emittance
probes were also installed already in the injection beam line. We can get a complete information of
the beam emittance by their use when necessary. However, in most of the beam steering procedure,
the simple and quick presentation of the results of manipulation of the operator is useful and an
exact measurement is scarecely needed. Together with a program to display on the CRT terminal
of the control console the beam trajectory predicted in the later cavities by injection of the beam
with the parameters estimated, the pepper-pot device has made the beam steering procedure much
easier.
Pepper - pot device
Fig. 1. Arrangement of the
pepper-pot and a beam-profile
monitor combination to measure
beam property.
Fig. 2. An example of beam profile measured
when the pepper-pot is inserted in the beam.
Beam is Argon ion beam of energy 860 ke V is
used.
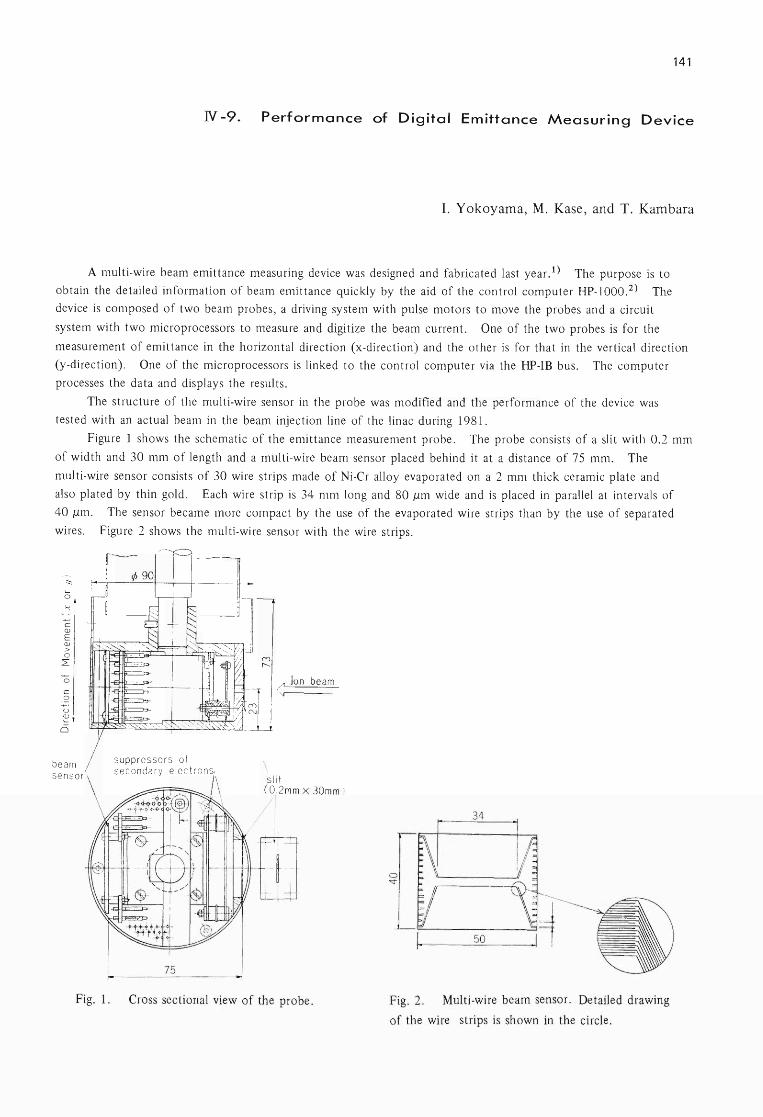
141
N-9. Performance of Digital Emittance Measuring Device
I. Yokoyama, M. Kase, and T. Kambara
A multi-wire beam emittance measuring device was designed and fabricated last year .1) The purpose is to
obtain the detailed information of beam emittance quickly by the aid of the control computer HP-IOOO.2) The
device is composed of two beam probes, a driving system with pulse motors to move the probes and a circuit
system with two microprocessors to measure and digitize the beam current. One of the two probes is for the
measurement of emittance in the horizontal direction (x-direction) and the other is for that in the vertical direction
(y-direction). One of the microprocessors is linked to the control computer via the HP-IB bus. The computer
processes the data and displays the results.
The structure of the multi-wire sensor in the probe was modified and the performance of the device was
tested with an actual beam in the beam injection line of the linac during 1981.
Figure 1 shows the schematic of the emittance measurement probe. The probe consists of a slit with 0.2 mm
of width and 30 mm of length and a multi-wire beam sensor placed behind it at a distance of 75 mm. The
multi-wire sensor consists of 30 wire strips made of Ni-Cr alloy evaporated on a 2 mm thick ceramic plate and
also plated by thin gold. Each wire strip is 34 mm long and 80 pm wide and is placed in parallel at intervals of
40 pm. The sensor became more compact by the use of the evaporated wire strips than by the use of separated
wires. Figure 2 shows the multi-wire sensor with the wire strips.
C <lJ E <lJ > o
L
c .S2 u 2: o
beam se nso r
¢90~ t--it--------'--t---,--if-----H- +-j
suppressors of secondary elec tronsV
75
< Ion beam
\ \
sl it ( O.2mm X 30mm )
Fig. 1. Cross sectional view of the probe.
34
50
Fig. 2. Multi -wire beam sensor. . Detailed drawing
of the wire strips is shown in the circle.
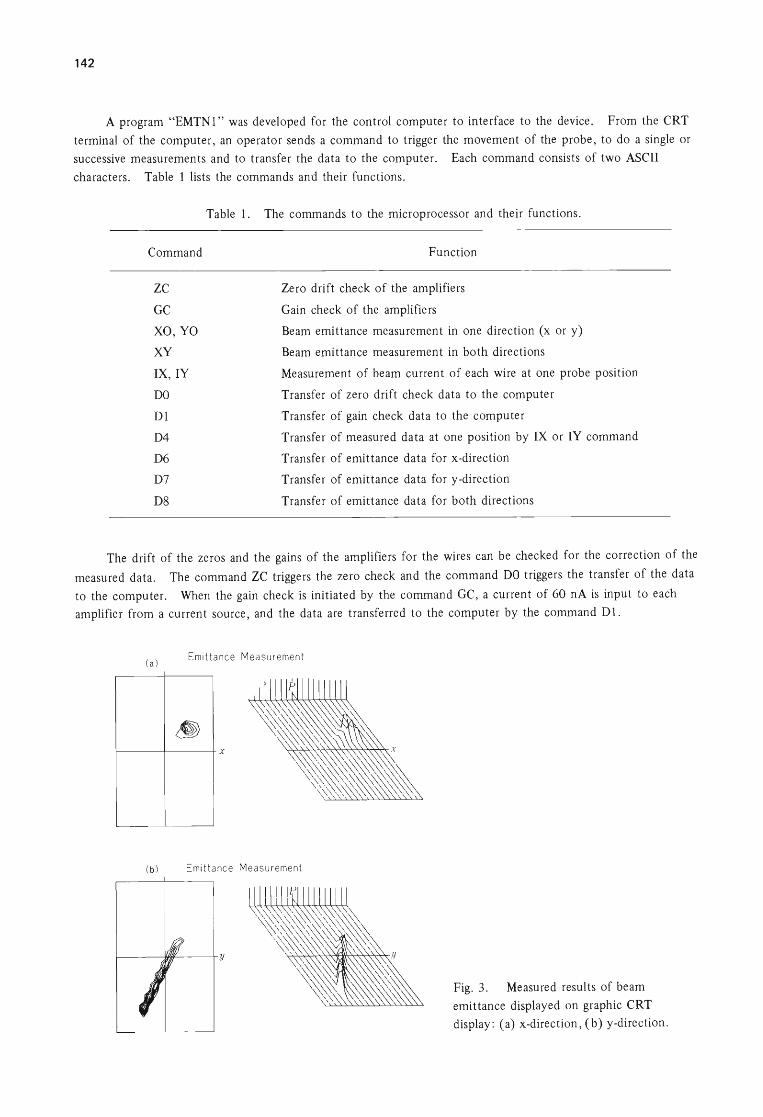
142
A program "EMTNl" was developed for the control computer to interface to the device. From the CRT
terminal of the computer, an operator sends a command to trigger the movement of the probe, to do a single or
successive measurements and to transfer the data to the computer. Each command consists of two ASCII
characters. Table 1 lists the commands and their functions.
Table 1. The commands to the microprocessor and their functions.
Command Function
ZC Zero drift check of the amplifiers
GC Gain check of the amplifiers
XO , YO Beam emittance measurement in one direction (x or y)
XY Beam emittance measurement in both directions
IX, IY Measurement of beam current of each wire at one probe position
DO Transfer of zero drift check data to the computer
Dl Transfer of gain check data to the computer
D4 Transfer of measured data at one position by IX or IY command
D6 Transfer of emittance data for x-direction
D7 Transfer of emittance data for y-direction
D8 Transfer of emittance data for both directions
The drift of the zeros and the gains of the amplifiers for the wires can be checked for the correction of the
measured data. The command ZC triggers the zero check and the command DO triggers the transfer of the data
to the computer. When the gain check is initiated by the command GC, a current of 60 nA is input to each
amplifier from a current source, and the data are transferred to the computer by the command Dl.
(a) Emittance Measurement
1-----+-----+ X
(b ) Emittance Measurement
1--------IW1'--- --+y
Fig. 3. Measured results of beam
emittance displayed on graphic CRT
display: ( a) x -direction, (b) y -direction.
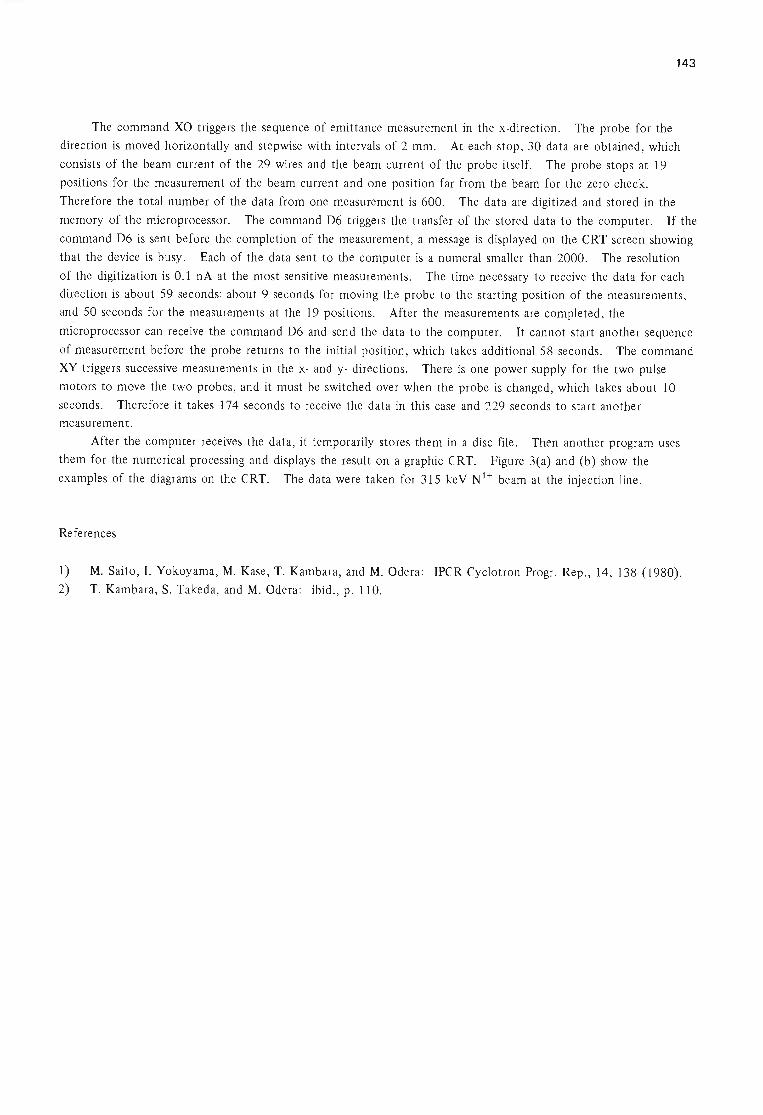
143
The command XO triggers the sequence of emittance measurement in the x-direction. The probe for the
direction is moved horizontally and stepwise with intervals of 2 mm. At each stop, 30 data are obtained, which
consists of the beam current of the 29 wires and the beam current of the probe itself. The probe stops at 19
positions for the measurement of the beam current and one position far from the beam for the zero check.
Therefore the total number of the data from one measurement is 600. The data are digitized and stored in the
memory of the microprocessor. The command D6 triggers the transfer of the stored data to the computer. If the
command D6 is sent before the completion of the measurement, a message is displayed on the CRT screen showing
that the device is busy. Each of the data sent to the computer is a numeral smaller than 2000. The resolution
of the digitization is 0.1 nA at the most sensitive measurements. The time necessary to receive the data for each
direction is about 59 seconds: labout 9 seconds for moving the probe to the starting position of the measurements,
and 50 seconds for the measurements at the 19 positions. After the measurements are completed, the
microprocessor can receive the command D6 and send the data to the computer. It cannot start another sequence
of measurement before the probe returns to the initial position, which takes additional 58 seconds. The command
XY triggers successive measurements in the x- and y- directions. There is one power supply for the two pulse
motors to move the two probes, and it must be switched over when the probe is changed, which takes about 10
seconds. Therefore it takes 174 seconds to receive the data in this case and 229 seconds to start another
measurement.
After the computer receives the data, it temporarily stores them in a disc file. Then another program uses
them for the numerical processing and displays the result on a graphic CRT. Figure 3(a) and (b) show the
examples of the diagrams on the CRT. The data were taken for 315 keY Nl+ beam at the injection line.
References
1) M. Saito, I. Yokoyama, M. Kase, T. Kambara, and M. Odera: IPCR Cyclotron Progr. Rep., !±, 138 (1980).
2) T. Kambara, S. Takeda, and M. Odera: ibid., p. 110.
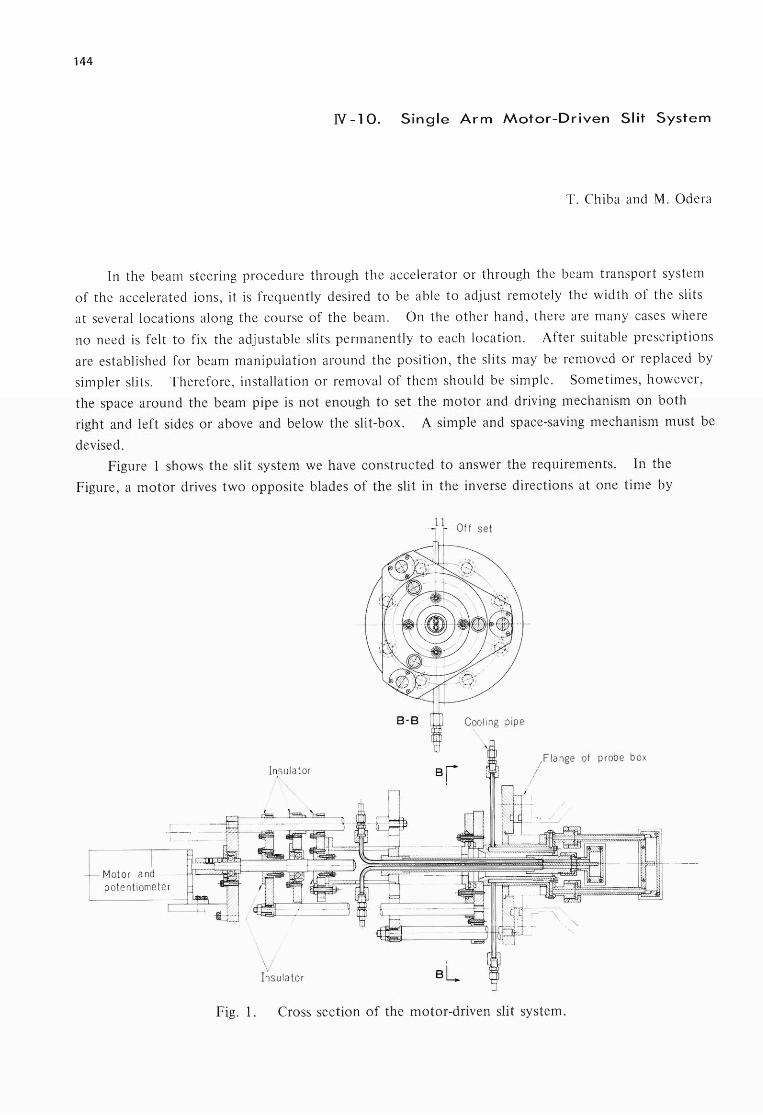
144
N -10. Single Arm Motor-Driven Slit System
T. Chiba and M. Odera
In the beam steering procedure through the accelerator or through the beam transport system
of the accelerated ions, it is frequently desired to be able to adjust remotely the width of the slits
at several locations along the course of the beam. On the other hand, there are many cases where
no need is felt to fix the adjustable slits permanently to each location. After suitable prescriptions
are established for beam manipulation around the position, the slits may be removed or replaced by
simpler slits. Therefore, installation or removal of them should be simple. Sometimes, however,
the space around the beam pipe is not enough to set the motor and driving mechanism on both
right and left sides or above and below the slit-box. A simple and space-saving mechanism must be
devised.
Figure I shows the slit system we have constructed to answer the requirements. In the
Figure, a motor drives two opposite blades of the slit in the inverse directions at one time by
11 Off set
Cooling pipe
\ Insul ator
t~
/ Fla nge of probe box
/ I
LR~~~Rni Mot or and - ~
\;' I nsulator
Fig. 1. Cross section of the motor-driven slit system.

145
rotating a shaft which has a right-handed screw cut on its half length and a left-handed screw on
the other half. Therefore, only one side of the slit box is occupied by the driving motor to move
two blades. Vacuum seals of the moving parts have welded bellows. The slit system is machined
carefully so that the center of the slits or the closed position of the blades coincides with the
center of the probe box accurately. The two blades move always symmetrically about this
position. There is also an adjusting screw to allow shift of this position by a small amount. Each
blade is cooled separately by circulating deionized water through the stem and the cylinder
supporting blades. The axis of the driving shaft is offset from the center of the vacuum flange,
so that two such slit assemblies can be inserted into the same probe box through the vertical and
horizontal ports. The two pairs of slit together define a remotely adjustable rectangular window
to the beam.
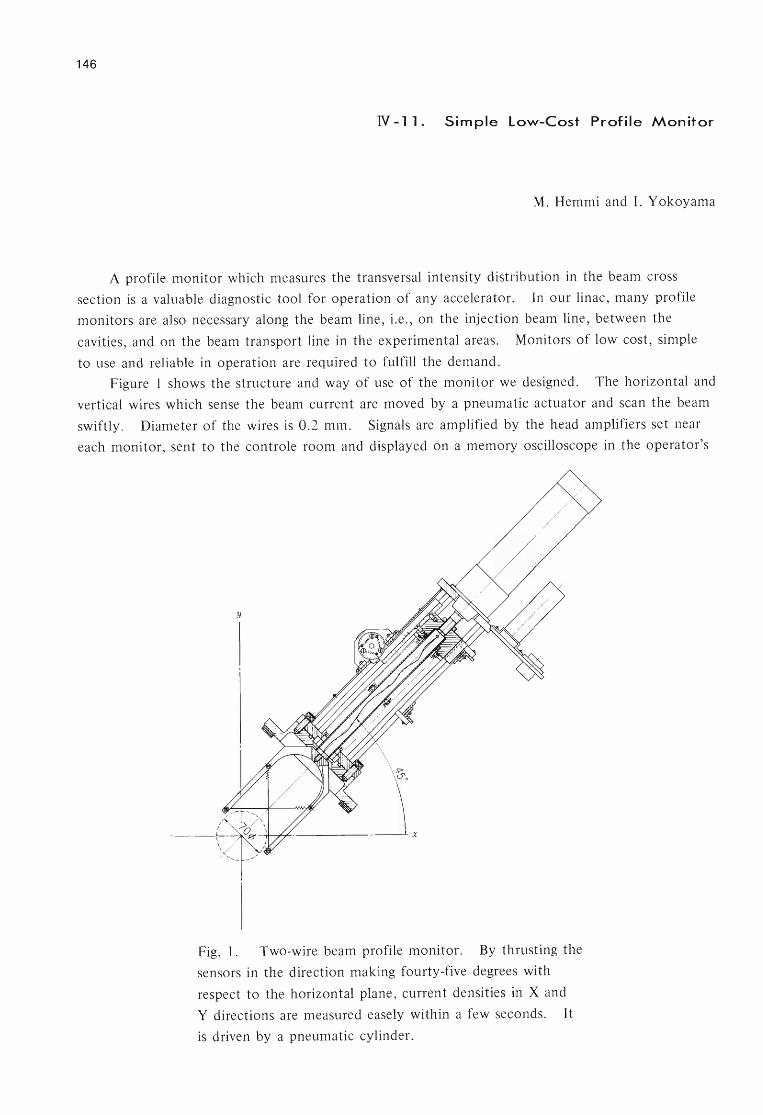
146
N -11. Simple low-Cost Profile Monitor
M. Hemmi and I. Yokoyama
A profile monitor which measures the transversal intensity distribution in the beam cross
section is a valuable diagnostic tool for operation of any accelerator. In our linac, many profile
monitors are also necessary along the beam line , i.e. , on the injection beam line, between the
cavities , and on the beam transport line in the experimental areas. Monitors of low cost, simple
to use and reliable in operation are required to fulfill the demand.
Figure I shows the structure and way of use of the monitor we designed. The horizontal and
vertical wires which sense the beam current are moved by a pneumatic actuator and scan the beam
swiftly. Diameter of the wires is 0.2 mm. Signals are amplified by the head ampiifiers set near
each monitor , sent to the controle room and displayed on a memory oscilloscope in the operator's
Fig. 1. Two-wire beam profile monitor. By thrusting the
sensors in the direction making fourty-five degrees with
respect to the horizontal plane , current densities in X and
Y directions are measured easely within a few seconds. It
is driven by a pneumatic cylinder.
147
console. The sensitivity of the amplifiers are adjustable remotely from the control room by four
decades. Wider range of sensitivity is obtainable by locally attaching current shunt resistor to the
amplifiers. Positions of the wires in the aperture of the beam pipe is given by an encoder made of
a conductive plastic potentiometer mechanically coupled to the rod of the pneumatic actuator.
The signal wires from the monitors in the various locations are connected to a switcher circuit in
the control room. The interface circuit can receive up to 31 signals. Figure 2 shows the signal
processing scheme schematically. Selection of the monitors to be displayed is made remotely by
use of a microprocessor whose control sequence is given by a program written in its EPROM.
Table I shows the specifications of the monitor.
Fig. 2. Scheme of measurement and display. Fig. 3. An example of the beam
profile at the entrance of first cavity.
Table 1. Specifications of the profile monitor.
Maximum sensitivity: 5 X 10-11 A per div. of CRT vertical scale
Response time of the head amplifiers: 5 msec in rising up to 90 % of the maximum
Drift of the amplifier system: less than 2 X 10-11 A
Scanning area: 70 mm</>
Maximum error in position: less than 2 mm
Time required for single measurement: a few seconds (between 0.5 - 3 seconds)
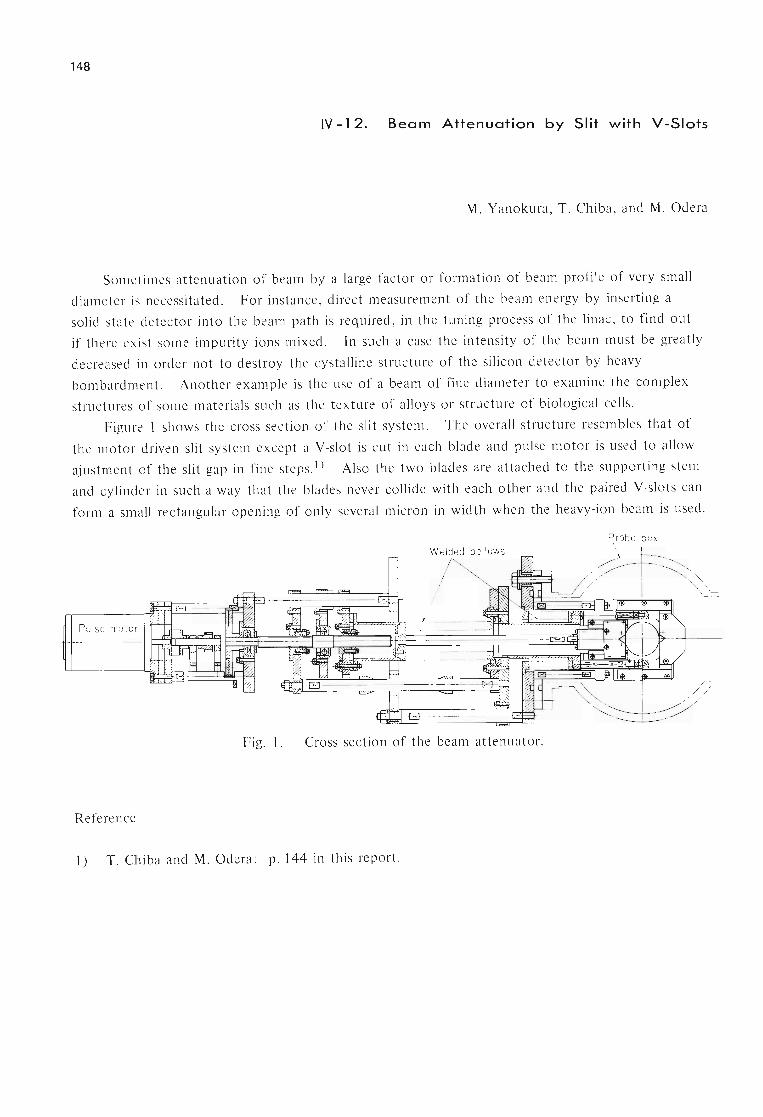
148
N -12. Beam Attenuation by Slit with V-Slots
M. Yanokura, T. Chiba, and M. Odera
Sometimes attenuation of beam by a large factor or formation of beam profile of very small
diameter is necessitated. For instance, direct measurement of the beam energy by inserting a
solid state detector into the beam path is required, in the tuning process of the linac, to find out
if there exist some impurity ions mixed. In such a case the intensity of the beam must be greatly
decreased in order not to destroy the cystalline structure of the silicon detector by heavy
bombardment. Another example is the use of a beam of fine diameter to examine the complex
structures of some materials such as the texture of alloys or structure of biological cells.
Figure 1 shows the cross section of the slit system . The overall structure resembles that of
the motor driven slit system except a V-slot is cut in each blade and pulse motor is used to allow
ajustment of the slit gap in fine steps.l) Also the two blades are attached to the supporting stem
and cyl inder in such a way that the blades never collide with each other and the paired V -slots can
form a small rectangular opening of only several micron in width when the heavy-ion beam is used.
Probe box Welded bellows
Pu lse motor
Fig. 1. Cross section of the beam attenuator.
Reference
1) T. Chiba and M. Odera: p. 144 in this report.
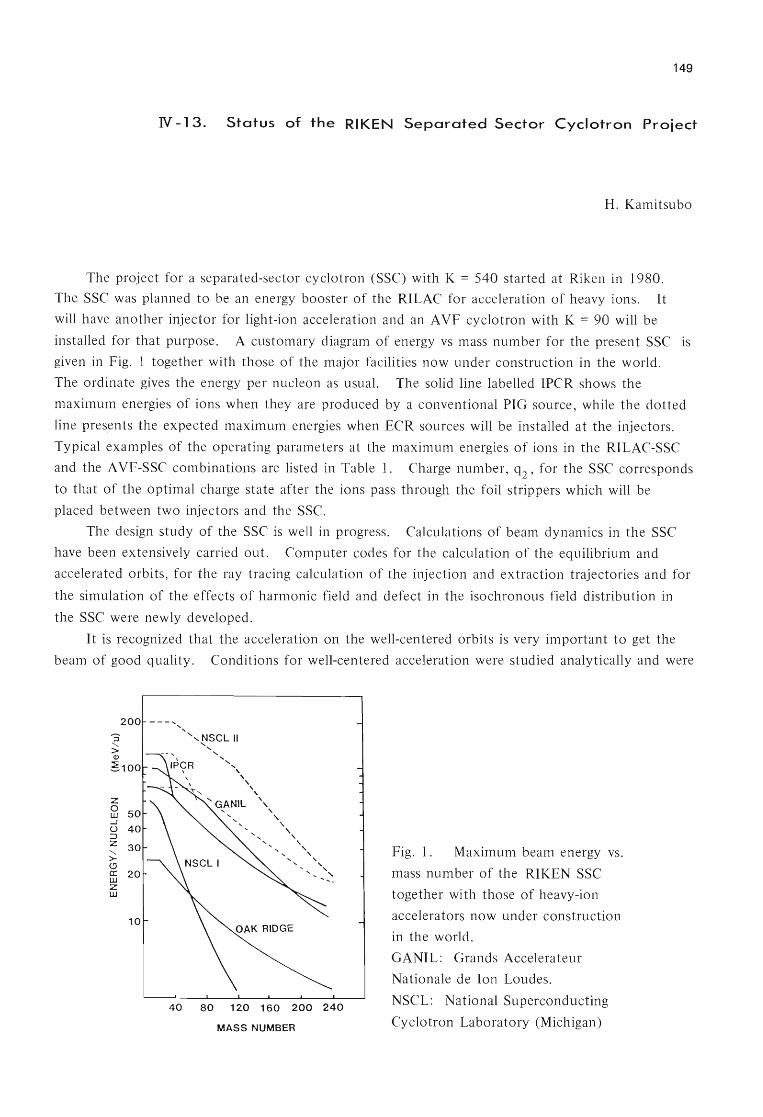
149
N -13. Status of the RIKEN Separated Sector Cyclotron Project
H. Kamitsubo
The project for a separated-sector cyclotron (SSC) with K = 540 started at Riken in 1980.
The SSC was planned to be an energy booster of the RILAC for acceleration of heavy ions. It
will have another injector for light-ion acceleration and an A VF cyclotron with K = 90 will be
installed for that purpose. A customary diagram of energy vs mass number for the present SSC is
given in Fig. I together with those of the major facilities now under construction in the world.
The ordinate gives the energy per nucleon as usual. The solid line labelled IPCR shows the
maximum energies of ions when they are produced by a conventional PIG source, while the dotted
line presents the expected maximum energies when ECR sources will be installed at the injectors.
Typical examples of the operating parameters at the maximum energies of ions in the RILAC-SSC
and the A VF-SSC combinations are listed in Table 1. Charge number, q2' for the SSC corresponds
to that of the optimal charge state after the ions pass through the foil strippers which will be
placed between two injectors and the SSC.
The design study of the SSC is well in progress. Calculations of beam dynamics in the SSC
have been extensively carried out. Computer codes for the calculation of the equilibrium and
accelerated orbits, for the ray tracing calculation of the injection and extraction trajectories and for
the simulation of the effects of harmonic field and defect in the isochronous field distribution in
the SSC were newly developed.
It is recognized that the acceleration on the well-centered orbits is very important to get the
beam of good quality. Conditions for well-centered acceleration were studied analytically and were
200
z 0 W ...J () :::J Z
" >-'-' 0: 20 w z w
10
--- ..... , ",NSCL II .... ....
' .... ' ....
" , " , ,
.... GANIL " , , , , .... , ,
, , , " , " ,
" " " " .... , "
".
40 80 120 160 200 240
MASS NUMBER
Fig. I. Maximum beam energy vs.
mass number of the RIKEN SSC
together with those of heavy-ion
accelerators now under construction
in the world.
GANIL: Grands Accelerateur
Nationale de Ion Loudes.
NSCL: National Superconducting
Cyclotron Laboratory (Michigan)
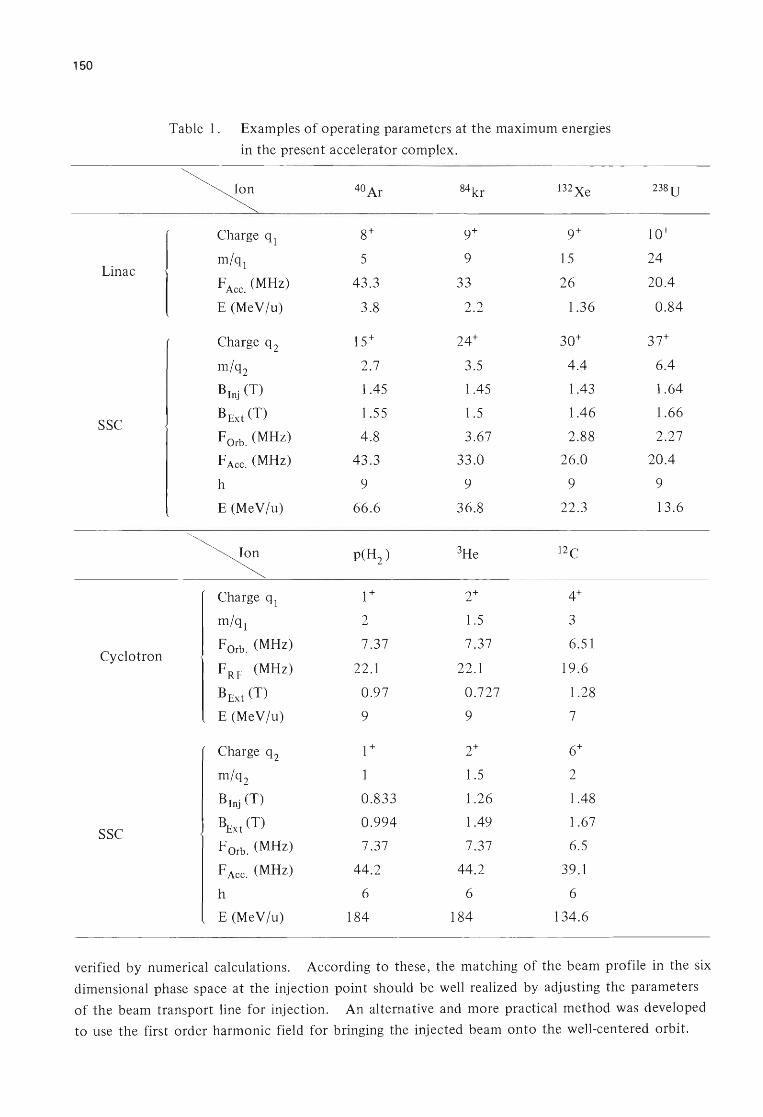
150
Table 1. Examples of operating parameters at the maximum energies
in the present accelerator complex.
~ 40Ar 84kr 132Xe 238U
Charge ql 8+ 9+ 9+ 10+
m/ql 5 9 15 24 Linac
FAce. (MHz) 43.3 33 26 20.4
E(MeV/u) 3.8 2.2 1.36 0.84
Charge q2 15+ 24+ 30+ 37+
m/q2 2.7 3.5 4.4 6.4
B1nj (T) 1.45 1.45 1.43 1.64
BExt (T) 1.55 1.5 1.46 1.66 SSC
FOrb. (MHz) 4.8 3.67 2.88 2.27
FAce. (MHz) 43.3 33.0 26.0 20.4
h 9 9 9 9
E(MeV/u) 66.6 36.8 22.3 13.6
~ p(H2) 3He 12C
Charge ql 1+ 2+ 4+
m/ql 2 l.5 3
FOrb . (MHz) 7.37 7.37 6.51 Cyclotron
FR F (MHz) 22.1 22.1 19.6
BExt (T) 0.97 0.727 1.28
E (MeV/u) 9 9 7
Charge q2 1+ 2+ 6+
m/q2 1 1.5 2
B1nj (T) 0.833 1.26 1.48
~xt (T) 0.994 1.49 1.67 SSC
F Orb. (MHz) 7.37 7.37 6.5
F Ace. (MHz) 44.2 44.2 39.1
h 6 6 6
E(MeV/u) 184 184 134.6
verified by numerical calculations. According to these, the matching of the beam profile in the six
dimensional phase space at the injection point should be well realized by adjusting the parameters
of the beam transport line for injection. An alternative and more practical method was developed
to use the first order harmonic field for bringing the injected beam onto the well-centered orbit.
151
Two of the sector magnets were ordered to Sumitomo Heavy Industry Co. The final design
of the magnets was finished in last June after extensive calculations by the computer code TRIM
and field measurements on the 1/4 scale model magnet. Number of the trim coils and the shape
of their winding were so determined that the difference between the actual and ideal isochronous
field distributions can be reduced to give no significant effects on the beam quality in the SSC.
The first sector magnet will be completed at the end of next March and the second one in June.
Field distributions inside the gaps of the magnets and in the valley region between both magnets
will be measured next summer. Then the calculations of the beam dynamics in the SSC will be
pursued again by using the measured field maps. The final design of the injection beam line will
be done after that.
There will be installed two bending magnets, two magnetic inflection channels and an
electrostatic inflector to bring the beam to the injection point in the SSC. A bending magnet is
placed very close to the sector magnets. It should produce magnetic field up to l. 7 5 T and should
be as small as possible. A full scale model was made and its performance characteristics were measured.
Design of the RF cavity is also in progress. It was decided that a half wave length resonator
will be adopted for the RF system of the SSC. Characteristics such as resonance frequency, RF
voltage distributions along the accelerating gap and the quality factor were measured for the half
scale model. In order to analyze numerically the fundamental characteristics for cavities of the
various shapes, a computer code has been developed to solve the Maxwell equations directly in
three dimensional case.
Design of the vacuum system has been pursued during the past year. The chamber will be
devided into eight sub-chambers and seals between them are amongst the most critical vacuum
components of the SSC. Because of the space limitations, pneumatic seals will be adopted as
vacuum seals between sub-chambers. Three 1/3 scale model of the pneumatic seal were made and
have been tested to determine their performance characteristics.
Layout of the experimental area and the beam transport system was almost fixed. Radiation
shielding has been extensively studied for the proposed layout. The beam transport lines to the
experimental halls were designed to bring the beam in the achromatic or highly dispersive modes,
and also in the isochronous mode. Detailed calculations of their characteristics were made using
the computer code TRANSPORT.

152
N -14. Some Results Obtained from Orbit Calculations
N. Nakanishi , A. Goto, and Y. Yano
Orbit calculations for beam dynamics in the RIKEN sse have been done to study accelerated
beam properties. Some results are presented on the resonance effect in focusing frequencies, the
imperfection effect in isochronous fields, and the effect of dee angle on the acceleration efficiency.
Focusing properties for various particles to be accelerated in the sse are examined in the
betatron frequency space. The sector angle of 50° was determined so as to give optimum focusing
to various particles in the space . A 9 MeV proton beam , however, crosses two resonance lines:
v = 2 v and 3 v = 4.1) It is known that the former is a quadratic, non-linear , coupling resonance, r z r
and the latter a quadratic, non-linear , intrinsic resonance in the four-sector sse. The proton beam
encounters these resonances at energies of about 128 MeV and 165 MeV. Radial and axial half
widths of the beam on the mid-line of an open valley are shown in Fig. 1. Only a slight change
in width is observed through the acceleration process . The behavior of the phase space patterns
at the vicinity of the v = 2 v (Walkinshaw) resonance is also examined , but harmful distortion in r z the patterns was not observed. According to these facts the influence by these resonances on
beam qualities is considered to be very small at least in the case of 20 mm . mrad emittance. It is
considered that the influence of these resonances is small because of a large energy gain per turn.
The influence of imperfection in isochronous fields has been investigated again .2 ) Two types
of isochronous field are adopted: a concentric type and a Gordon type. The concentric-type
isochronous field which is calculated by program EQUIOT3) is formed by multiplying a factor to
the base field along a concentric circle which corresponds to a concentric-type trim coil. The
~ -E E E E
~ N <l<l
Wal k i nshaw 4 Vr = 3" vz= 0.5
! .. . .. -.....
5.0 I:.· .................................... :. : ... : ..................... : .......... : .. : ......... . x x x
x )( x x x x x XXXX)(XXX
x x x
2.5 x x X x x x x
x x
o 0 40 80 120 160 200 ( Turns )
x x
x x x x x x x )( x X x X x x
- 2 . 5 x )( x
x x x x X x x x
... 5 0 • • •• ••••• ••••••••• • •••••••••••••• - . i·· . . . . .. .. .. ... .-.-.. .. -.... . ......................... . .- .. -..... -...
Fig. 1. Radial (.) and axial (X) half widths of 9 MeV proton beams.
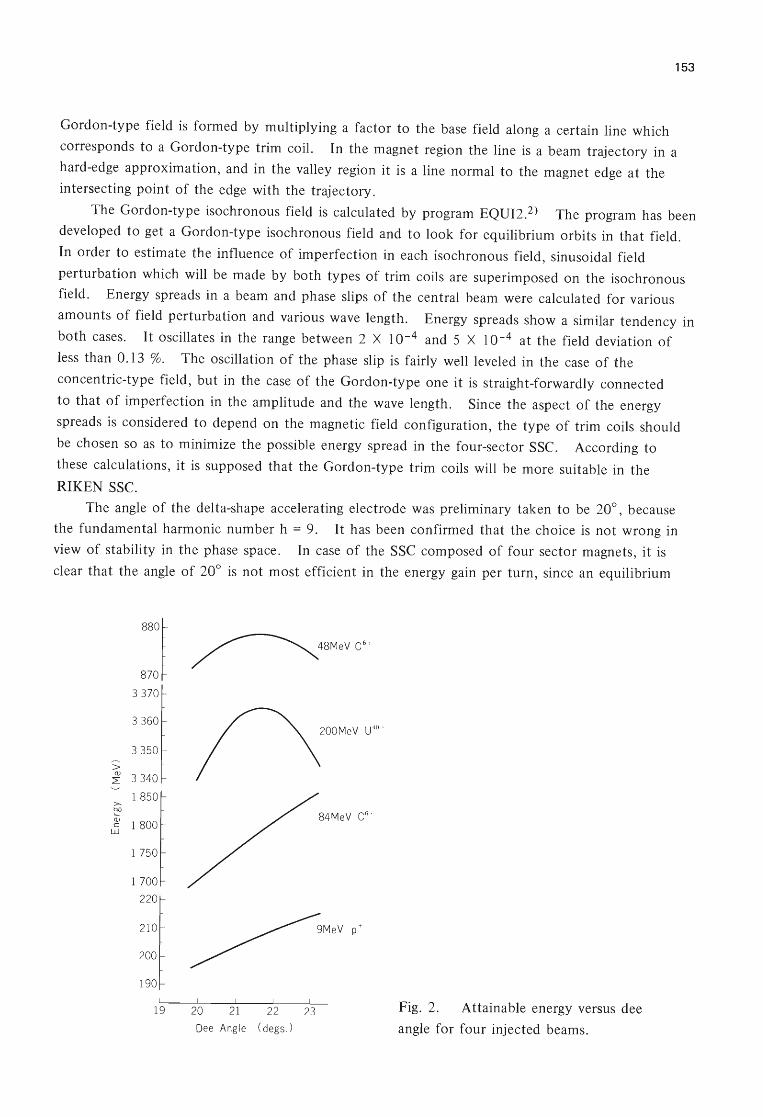
153
Gordon-type field is formed by multiplying a factor to the base field along a certain line which
corresponds to a Gordon-type trim coil. In the magnet region the line is a beam trajectory in a
hard-edge approximation, and in the valley region it is a line normal to the magnet edge at the
intersecting point of the edge with the trajectory.
The Gordon-type isochronous field is calculated by program EQUI2.2 ) The program has been
developed to get a Gordon-type isochronous field and to look for equilibrium orbits in that field .
In order to estimate the influence of imperfection in each isochronous field, sinusoidal field
perturbation which will be made by both types of trim coils are superimposed on the isochronous
field. Energy spreads in a beam and phase slips of the central beam were calculated for various
amounts of field perturbation and various wave length. Energy spreads show a similar tendency in
both cases. It oscillates in the range between 2 X 10- 4 and 5 X 10- 4 at the field deviation of
less than 0.13 %. The oscillation of the phase slip is fairly well leveled in the case of the
concentric-type field, but in the case of the Gordon-type one it is straight-forwardly connected
to that of imperfection in the amplitude and the wave length. Since the aspect of the energy
spreads is considered to depend on the magnetic field configuration, the type of trim coils should
be chosen so as to minimize the possible energy spread in the four-sector sse. According to
these calculations, it is supposed that the Gordon-type trim coils will be more suitable in the
RIKEN sse. The angle of the delta-shape accelerating electrode was preliminary taken to be 20°, because
the fundamental harmonic number h = 9. It has been confirmed that the choice is not wrong in
view of stability in the phase space. In case of the sse composed of four sector magnets, it is
clear that the angle of 20° is not most efficient in the energy gain per turn, since an equilibrium
880t
870
~48Mevc"
3370
3360 200MeV U40
-
3350
> Q)
3340 L
1850 >,
~ Q)
1 800 c w
84MeV C6-1
1 750
1 700
220
210
200
190 I
19 Fig. 2. Attainable energy versus dee 20 21 22 23
Dee Angle ( degs .) angle for four injected beams.

154
orbit has a squared shape. Therefore, a numerical calculation was made in order to obtain the
most suited angle. Figure 2 shows attainable energies for four typical beams of 48 Me V C6+, 200
MeV U40+, 9 MeV p+, and 84 MeV C6+ at the turn numbers of 140,80,230, and 330, respectively.
An accelerating voltage is assumed to be 250 kV. The harmonic number of the first two is 9 and
that of the others is 6. It may be seen that the angle of 21.6° is most efficient. The change
from 20° to 21.6° of angle brings about energy-gain increase of 0.8 % and 5.5 % for each
acceleration mode. Accordingly the turn number can be reduced. Extensive examinations are now
in progress.
References
1) N. Nakanishi, A. Goto, Y. Yano, and T. Wada: Proc. 9th Intern. Conf. on Cyclotron and
their Applications, Caen (1981).
2) N. Nakanishi, A. Goto, and Y. Yano: Sci. Papers I.P.C.R.,~, 136 (1981).
3) N. Nakanishi: Reports I.P.C.R., (in Japanese), 57 , 189 (1981).

155
N -15. Formulation of Beam Centering Equation in
a Separated Sector Cyclotron
Y. Yano, A. Goto, and N. Nakanishi
In order that a beam of good quality can be extracted from a separated sector cyclotron (SSC),
the beam should be accelerated along a well-centered orbit inside the sse. This well-centered orbit
acceleration can be achieved when the central particle of the beam moves in the sse as shown in
Fig. 1. The essential feature of the motion is that the particle crosses the equilibrium orbit (E.O.)
corresponding to its kinetic energy every time it reaches the mid-line of open valley, e.g. points A
and D. R(i) and R(i + I) represent the radial distances measured from the machine center to the
i-th and (i + 1) -th E.O., respectively. In the case of a single-gap acceleration system, the particle
would reach point B and leave the same point after gaining the energy. In our double-gap
acceleration system, however, the particle is deflected by the accel. gap I and then is inflected by
the accel. gap 2 as shown in the inset (Fig. I). Because these deflection and inflection angles are
almost the same, the treatment of this double-gap acceleration process can be simplified by describing
the process in such a way that the particle reaches the point B and then leaves the point C after it
gains the energy which is to be obtained by the passage of two acceleration gaps. The radial
shift of the point C from the point B is given by E(i).
Now let us consider the motion of the well-centered particle mentioned above on the radial
phase space. The fact that eigen-ellipses for a certain E.O. given at mid-lines of four valleys are
identical and they are erect ellipses makes the description much simpler. We can transform these
( i + I) - th E, 0 ,
i-th E,O./
D(R( i+l)) - ----
Fig. 1. Well-centered acceleration
orbit (thick solid line). A particle
moves clockwise and is accelerated
by a couple of gaps in one dee (see
the inset). The i-th and (i + I) -th
equilibrium orbits are also drawn.
Leave the details to the text.
R' (i - th E. 0 . ) R' (i+l-th E.O.)
a (i) A D a(i+l)
R
R(i+l)
Fig. 2. Diagram describing motion of a
well-cen tered particle on the radial phase
space. Points (A-D) correspond to those
in Fig. 1. Leave the details to the text.
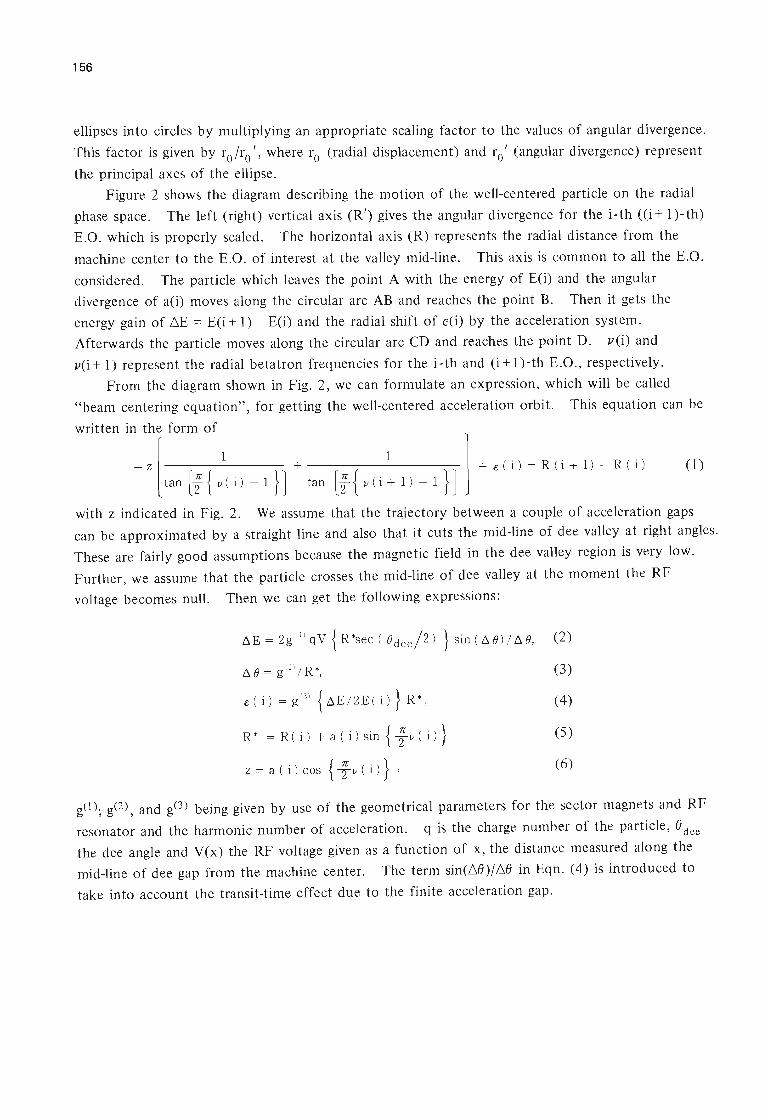
156
ellipses into circles by multiplying an appropriate scaling factor to the values of angular divergence.
This factor is given by ro Iro', where ro (radial displacement) and ro' (angular divergence) represent
the principal axes of the ellipse.
Figure 2 shows the diagram describing the motion of the well-centered particle on the radial
phase space. The left (right) vertical axis (R') gives the angular divergence for the i-th ((i + l)-th)
E.O. which is properly scaled. The horizontal axis (R) represents the radial distance from the
machine center to the E.O. of interest at the valley mid-line. This axis is common to all the E.O.
considered. The particle which leaves the point A with the energy of E(i) and the angular
divergence of a(i) moves along the circular arc AB and reaches the point B. Then it gets the
energy gain of 6E = E(i + 1) - E(i) and the radial shift of e(i) by the acceleration system.
Afterwards the particle moves along the circular arc CD and reaches the point D. v(i) and
v(i+ 1) represent the radial betatron frequencies for the i-th and (i+l)-th E.O., respectively.
From the diagram shown in Fig. 2, we can formulate an expression, which will be called
"beam centering equation", for getting the well-centered acceleration orbit. This equation can be
written in the form of
-z[ 1 + 1 +c:(i)=R ( i+l ) -R ( i ) (1) tan [; { v ( i) - 1 }] tan [; { v ( i + 1 ) - 1 } ]
with z indicated in Fig. 2. We assume that the trajectory between a couple of acceleration gaps
can be approximated by a straight line and also that it cuts the mid-line of dee valley at right angles.
These are fairly good assumptions because the magnetic field in the dee valley region is very low.
Further, we assume that the particle crosses the mid-line of dee valley at the moment the RF
voltage becomes null. Then we can get the following expressions:
~E=2g ( l ) qV{R*seC ( fJdee/2 ) } sin ( !:lfJ ) / !:lfJ, (2)
~ fJ = g (2) I R *, (3)
c: ( i ) = g (3) {~E / 2E( i)} R*, (4)
R * = R ( i) + a ( i) sin { ; v ( i) } (5)
z = a ( i ) cos {1- v ( i ) } , ( 6)
gO); g(2), and g(3) being given by use of the geometrical parameters for the sector magnets and RF
resonator and the harmonic number of acceleration. q is the charge number of the particle, 8 dee
the dee angle and Vex) the RF voltage given as a function of x, the distance measured along the
mid-line of dee gap from the machine center. The term sin(68)/68 in Eqn. (4) is introduced to
take into account the transit-time effect due to the finite acceleration gap.
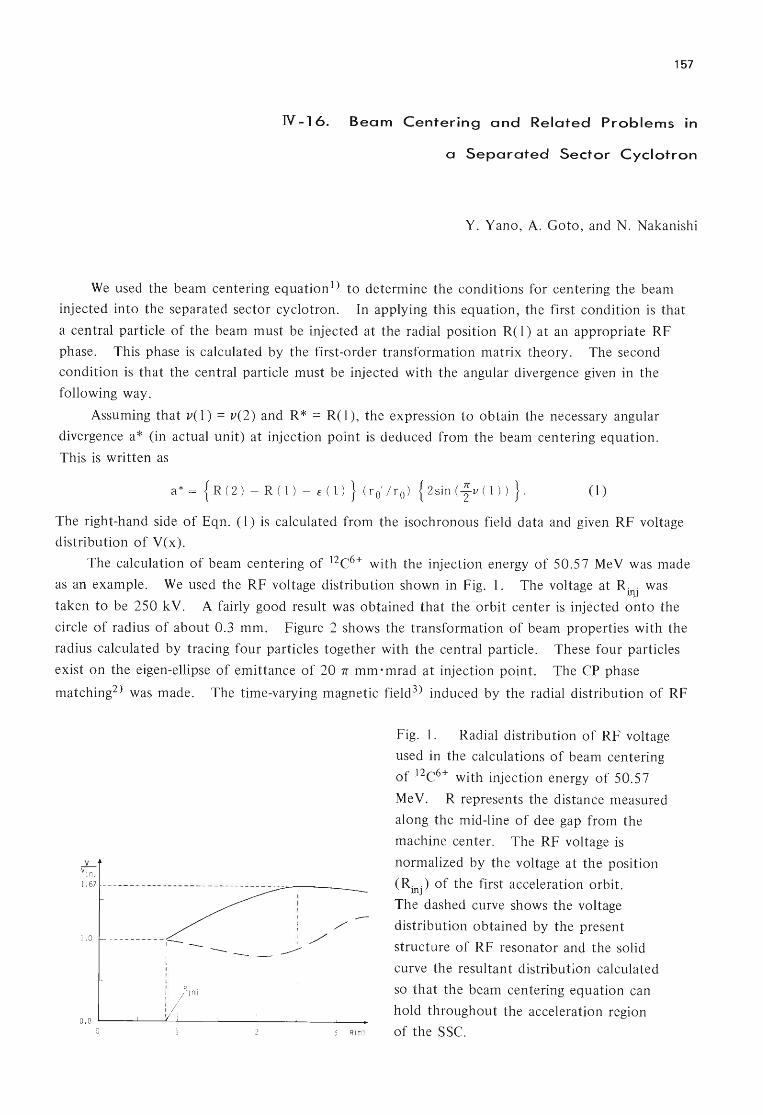
157
N -16. Beam Centering and Related Problems in
a Separated Sector Cyclotron
Y. Yano, A. Goto , and N. Nakanishi
We used the beam centering equation 1) to determine the conditions for centering the beam
injected into the separated sector cyclotron. In applying this equation, the first condition is that
a central particle of the beam must be injected at the radial position R(1) at an appropriate RF
phase. This phase is calculated by the first-order transformation matrix theory. The second
condition is that the central particle must be injected with the angular divergence given in the
following way.
Assuming that v( I) = v(2) and R * = R( I) , the expression to obtain the necessary angular
divergence a* (in actual unit) at injection point is deduced from the beam centering equation.
This is written as
a * = {R ( 2) - R ( 1 ) - c ( 1) } ( r 0' / r 0) {2 s in ( ; v ( 1 ) ) } . (1)
The right-hand side of Eqn. (I) is calculated from the isochronous field data and given RF voltage
distribution of Vex).
The calculation of beam centering of 12c6+ with the injection energy of 50.57 MeV was made
as an example. We used the RF voltage distribution shown in Fig. I. The voltage at RiI1j
was
taken to be 250 kV. A fairly good result was obtained that the orbit center is injected onto the
circle of radius of about 0.3 mm. Figure 2 shows the transformation of beam properties with the
radius calculated by tracing four particles together with the central particle. These four particles
exist on the eigen-ellipse of emittance of 20 1T mm ·mrad at injection point. The CP phase
matching2 ) was made. The time-varying magnetic field 3 ) induced by the radial distribution of RF
v V i nj
1. 67 -- ------------ - -- - - - - --- - - ----- -:.;:.--;-- -,--__ _
1.0 - - - -------1- _
1 --
0.0 -----'---<--'-------'---"------'-__ .1.....-_
o 3 R(n)
Fig. 1. Radial distribution of RF voltage
used in the calculations of beam centering
of 12C6+ with injection energy of 50.57
MeV. R represents the distance measured
along the mid-line of dee gap from the
machine center. The RF voltage is
normalized by the voltage at the position
(Rinj ) of the first acceleration orbit.
The dashed curve shows the voltage
distribution obtained by the present
structure of RF resonator and the solid
curve the resultant distribution calculated
so that the beam centering equation can
hold throughout the acceleration region
of the SSC.
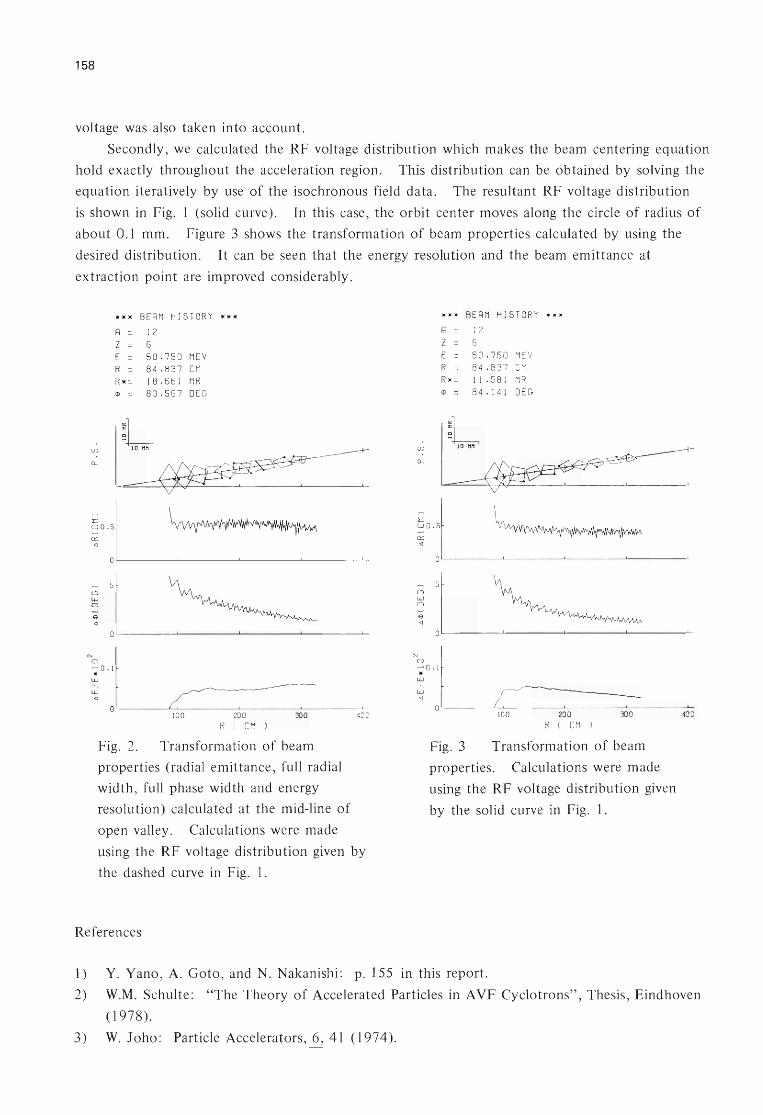
158
voltage was also taken into account.
Secondly, we calculated the RF voltage distribution which makes the beam centering equation
hold exactly throughout the acceleration region. This distribution can be obtained by solving the
equation iteratively by use of the isochronous field data. The resultant RF voltage distribution
is shown in Fig. 1 (solid curve). In this case, the orbit center moves along the circle of radius of
about 0.1 mm. Figure 3 shows the transformation of beam properties calculated by using the
desired distribution. It can be seen that the energy resolution and the beam emittance at
extraction point are improved considerably.
lIElIElIE BERM HISTORY lIElIElIE
R 12 Z = 6 E = 50.750 MEV R = 84 . 837 eM RlIE = 18.66 1 MR <!> = 80.567 OEG
:L :I~ ~o :1 ~
~ :1 L---------'------'-_-----'---------------'---
l ~ I'----------'----'----ce=----'-----==-------L---~ 100 20 0 300 400
R ( eM )
Fig. 2. Transformation of beam
properties (radial emittance, full radial
width, full phase width and energy
resolution) calculated at the mid-line of
open valley. Calculations were made
using the RF voltage distribution given by
the dashed curve in Fig. 1.
References
BERM HISTORY lIElIElIE
R 12 Z = 6 E = 50 . 750 MEV R = 8 4 . 837 eM RlIE = 11.58 1 MR <!> = 84 .1 41 OEG
~L
: I~~ ~o:1 ~
~ :1 L---------'------'-_-----'---------------'---
N~o~L-1 --------L....J~ _ __'_ _ ____'_! _ ____'_
100 200 300
R ( eM )
Fig. 3 Transformation of beam
properties. Calculations were made
using the RF voltage distribution given
by the solid curve in Fig. 1.
40 0
1) Y. Yano, A. Goto, and N. Nakanishi: p. 155 in this report.
2) W.M. Schulte: "The Theory of Accelerated Particles in AVF Cyclotrons", Thesis, Eindhoven
(1978).
3) W. Joho: Particle Accelerators, 6, 41 (1974).
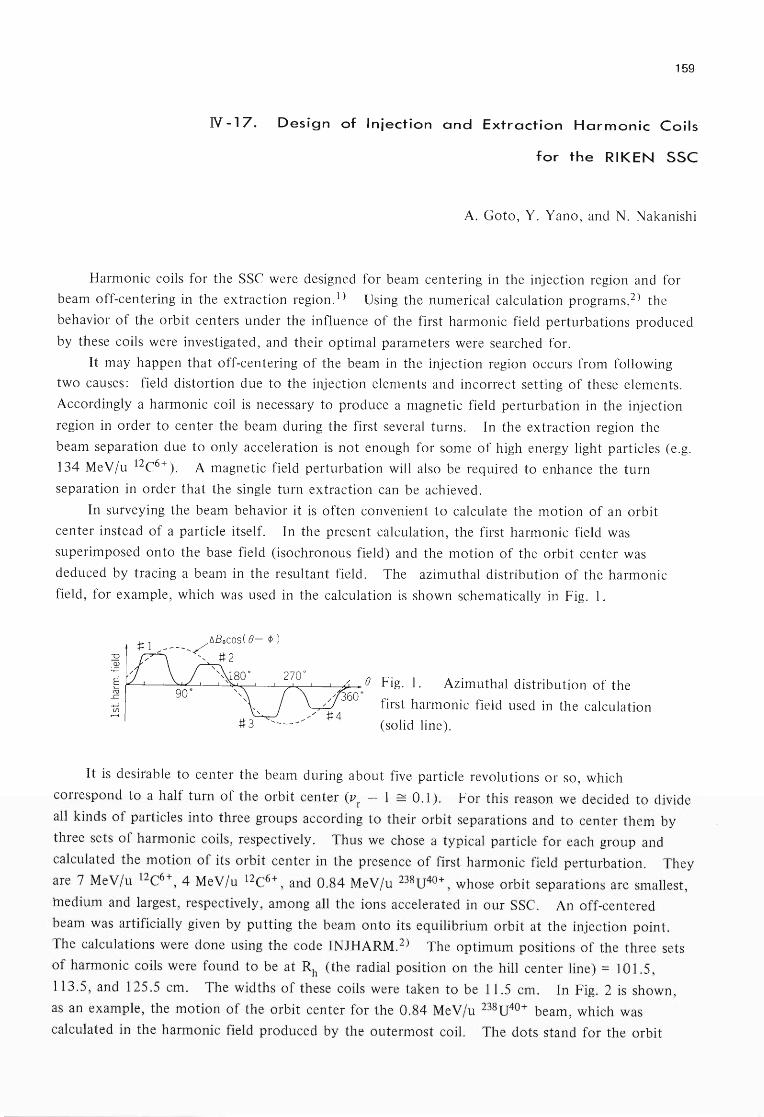
159
N -17. Design of Injection and Extraction Harmonic Coils
for the RIKEN SSC
A. Goto, Y. Yano, and N. Nakanishi
Harmonic coils for the sse were designed for beam centering in the injection region and for
beam off-centering in the extraction region.1) Using the numerical calculation programs,2) the
behavior of the orbit centers under the influence of the first harmonic field perturbations produced
by these coils were investigated, and their optimal parameters were searched for.
It may happen that off-centering of the beam in the injection region occurs from following
two causes: field distortion due to the injection elements and incorrect setting of these elements.
Accordingly a harmonic coil is necessary to produce a magnetic field perturbation in the injection
region in order to center the beam during the first several turns. In the extraction region the
beam separation due to only acceleration is not enough for some of high energy light particles (e.g.
134 Me V lu 12e6+). A magnetic field perturbation will also be required to enhance the turn
separation in order that the single turn extraction can be achieved.
In surveying the beam behavior it is often convenient to calculate the motion of an orbit
center instead of a particle itself. In the present calculation, the first harmonic field was
superimposed onto the base field (isochronous field) and the motion of the orbit center was
deduced by tracing a beam in the resultant field. The azimuthal distribution of the harmonic
field, for example, which was used in the calculation is shown schematically in Fig. 1.
Fig. 1. Azimuthal distribution of the
first harmonic field used in the calculation
(solid line).
It is desirable to center the beam during about five particle revolutions or so, which
correspond to a half turn of the orbit center (v - 1 ~ 0.1). For this reason we decided to divide r
all kinds of particles into three groups according to their orbit separations and to center them by
three sets of harmonic coils, respectively. Thus we chose a typical particle for each group and
calculated the motion of its orbit center in the presence of first harmonic field perturbation. They
are 7 Me V lu 12e6+ , 4 Me V lu 12e6+ , and 0.84 MeV lu 238U40+ , whose orbit separations are smallest,
,medium and largest, respectively, among all the ions accelerated in our sse. An off-centered
beam was artificially given by putting the beam onto its equilibrium orbit at the injection point.
The calculations were done using the code INJHARM.2) The optimum positions of the three sets
of harmonic coils were found to be at Rh (the radial position on the hill center line) = 101.5,
113.5, and 125.5 cm. The widths of these coils were taken to be 11.5 cm. In Fig. 2 is shown,
as an example, the motion of the orbit center for the 0.84 MeV/u 238U40+ beam, which was
calculated in the harmonic field produced by the outermost coil. The dots stand for the orbit

160
Y( MM J
SP
10
-15 -1 0 -5 10 15
X(MMl
- 10
- 15
1ST HRR M.
Fig. 2. Motion of the orbit center
for the 0.84 MeV/u 238U40+ beam
in the injection region under the
influence of the first harmonic field.
The injection point is on the x-axis.
The dots stand for the orbit centers
and SP their starting point.
Y(M Ml
j 5
10
-15 -1 0 - 5 15
X(MMl
- 5
1S T HRRM. -10
-15
Fig. 3. Motion of the orbit center
for the 134 MeV/u 12C6+beam in
the extraction region under the
influence of the first harmonic
field. The entrance of EDC is
positioned at about IS°. The dots
stand for the orbit centers.
centers and the azimuthal position of the injection point is set to be 0°. One can see that the
orbit center starting at the position about 15 mm apart from the cyclotron center is centered after
about five particle revolutions. The strengths of the harmonic fields (and the azimuthal positions
of their maximums) which are needed for centering the three beams were 10 Gauss (260°) , 12
Gauss (255°) , and 24 Gauss (250°), respectively.
We aimed to extract a beam before v = 1 resonance in order to avoid the strong radial r
defocusing of the extracted beam due to the fringe field of the sector magnets. The study was
concentrated on the extraction of the 134 MeV/u 12C6+ beam (the injection energy of 7 MeV/u)
whose orbit separation is the smallest among all kinds of accelerated particles. The calculation was
made using the code EXTHARM.2) At first the well-centered orbit of the 12C6+ beam was
calculated using the code ACCEL 2) from the injection point up to the region where its radial
distance is less than the extraction radius (373 cm on the hill center line) by about ten revolutions.
The orbit center continues to stay at the cyclotron center during this acceleration. The beam
parameters thus calculated were inputted into the code EXTHARM and then the parameters of the
harmonic coil - its radial position, its field strength and direction - were searched for in order to
obtain the beam separation large enough for single turn extraction. The optimum position of this
harmonic coil was found to be at Rh = 372 cm, which is just inside the extraction radius. The
orbit separation becomes larger, the steeper the field rise is; thus the narrower harmonic coil is
more desirable. It was decided, therefore, to use the coil of 1.2 cm in width, which is made of a
copper hollow conductor. Figure 3 shows the motion of the orbit center for the 134 Me V /u
12C6+ beam, which was calculated in the first harmonic field produced by this coil. The dots
stand for the orbit centers and the azimuthal position of the extraction point is set to be 0° . The
entrance of the electric deflection channel (EDC) is positioned at about 15°. One can see that the
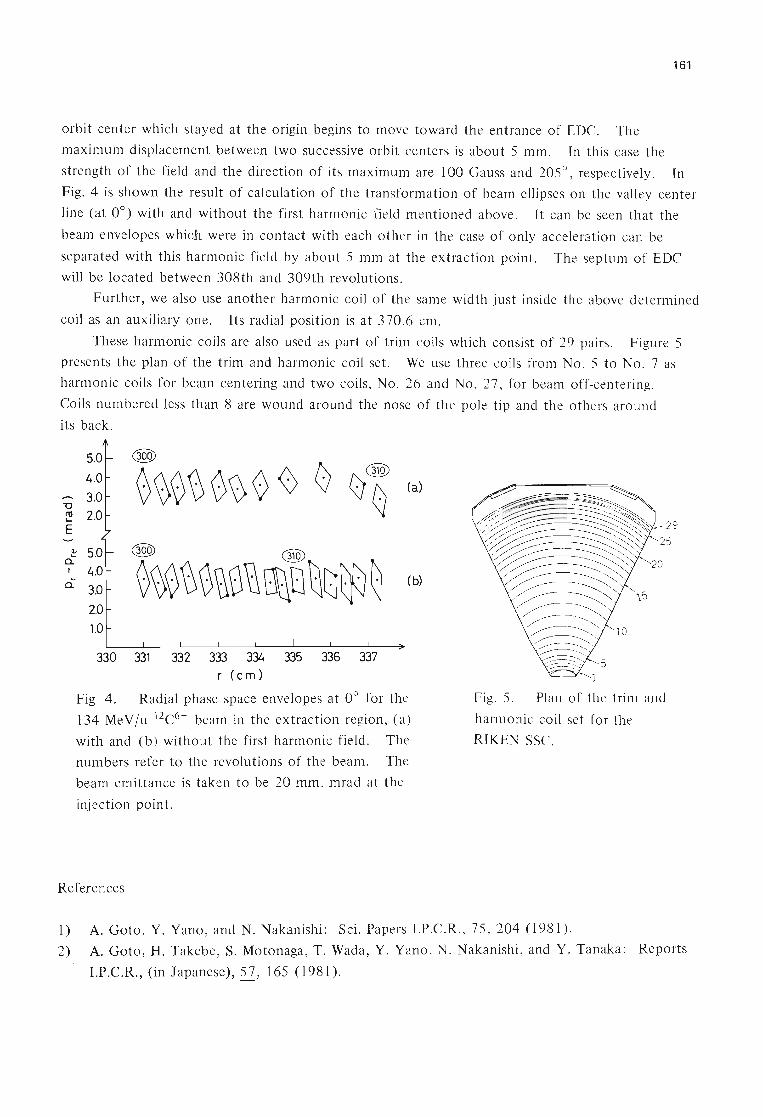
161
orbit center which stayed at the origin begins to move toward the entrance of EDC. The
maximum displacement between two successive orbit centers is about 5 mm. In this case the
strength of the field and the direction of its maximum are 100 Gauss and 205°, respectively. In
Fig. 4 is shown the result of calculation of the transformation of beam ellipses on the valley center
line (at 0°) with and without the first harmonic field mentioned above. It can be seen that the
beam envelopes which were in contact with each other in the case of only acceleration can be
separated with this harmonic field by about 5 mm at the extraction point. The septum of EDC
will be located between 308th and 309th revolutions.
Further, we also use another harmonic coil of the same width just inside the above determined
coil as an auxiliary one. Its radial position is at 370.6 cm.
These harmonic coils are also used as part of trim coils which consist of 29 pairs. Figure 5
presents the plan of the trim and harmonic coil set. We use three coils from No.5 to No.7 as
harmonic coils for beam centering and two coils, No. 26 and No. 27, for beam off-centering.
Coils numbered less than 8 are wound around the nose of the pole tip and the others around
its back.
1J
"' \...
E
tJ
~ I ~
a.
5.0 @)
4.0 0~0\) 0\) 0 <) I:) °0 (a) 3.0 2.0
5.0 QQ9> @) 4.0 0~0\)0u0~ \l1D ~QlfJ~ (b) 3.0
2.0 1.0
330 331 332 333 334 335 336 337 r (c m)
Fig 4. Radial phase space envelopes at 0° for the
134 Me V lu 12C6+ beam in the extraction region, (a)
with and (b) without the first harmonic field. The
numbers refer to the revolutions of the beam. The
beam emittance is taken to be 20 mm. mrad at the
injection point.
References
Fig. 5. Plan of the trim and
harmonic coil set for the
RIKEN SSC.
1) A. Goto , Y. Yano, and N. Nakanishi: Sci. Papers I.P.C.R., 75, 204 (1981).
2) A. Goto, H. Takebe, S. Motonaga, T. Wada, Y. Yano, N. Nakanishi, and Y. Tanaka: Reports
I.P.C.R., (in Japanese), 57,165 (1981).
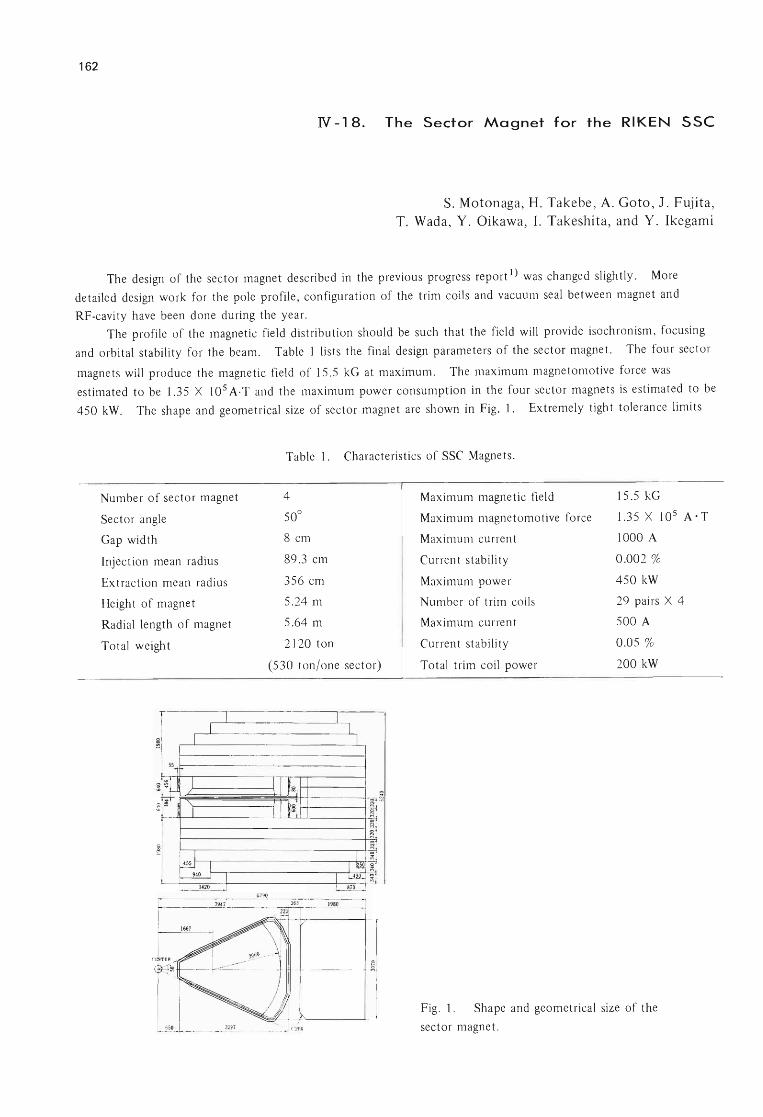
162
N -18. The Sector Magnet for the RIKEN sse
S. Matanaga, H. Takebe , A. Gata , J. Fujita, T. Wada, Y. Oikawa, 1. Takeshita, and Y. Ikegami
The design of the sector magnet described in the previous progress report 1) was changed slightly. More
detailed design work for the pole profile , configuration of the trim coils and vacuum seal between magnet and
RF-cavity have been done during the year.
The profile of the magnetic field distribution should be such that the field will provide isochronism , focusing
and orbital stability for the beam. Table 1 lists the final design parameters of the sector magnet. The four sector
magnets will produce the magnetic field of 15.5 kG at maximum. The maximum magnetomotive force was
estimated to be 1.35 X 10⁵ A·T and the maximum power consumption in the four sector magnets is estimated to be
450 kW. The shape and geometrical size of sector magnet are shown in Fig. 1. Extremely tight tolerance limits
Table 1. Characteristics of SSC Magnets.
Number of sector magnet 4 Maximum magnetic field 15.5 kG
Sector angle 50° Maximum magnetomotive force 1.35 X I0 5 A-T
Gap width 8 cm Maximum current 1000 A
Injection mean radius 89.3 cm Current stability 0.002 %
Extraction mean radius 356 cm Maximum power 450 kW
Height of magnet 5.24 m Number of trim coils 29 pairs X 4
Radial length of magnet 5.64 m Maximum current 500 A
Total weight 2] 20 ton Current stability 0.05 %
(530 ton/ one sector) Total trim coil power 200 kW
1 , I
I 1
I
, ,
55
1
~ L' :;;1
~ "- ~I ;;; , ~
~
~
~ I T ~l ~ , ,~~ ~ I I Lill... ~ I
1420 ~ ,...---____ ~6290
1980
Fig. 1. Shape and geometrical size of the
sector magnet.
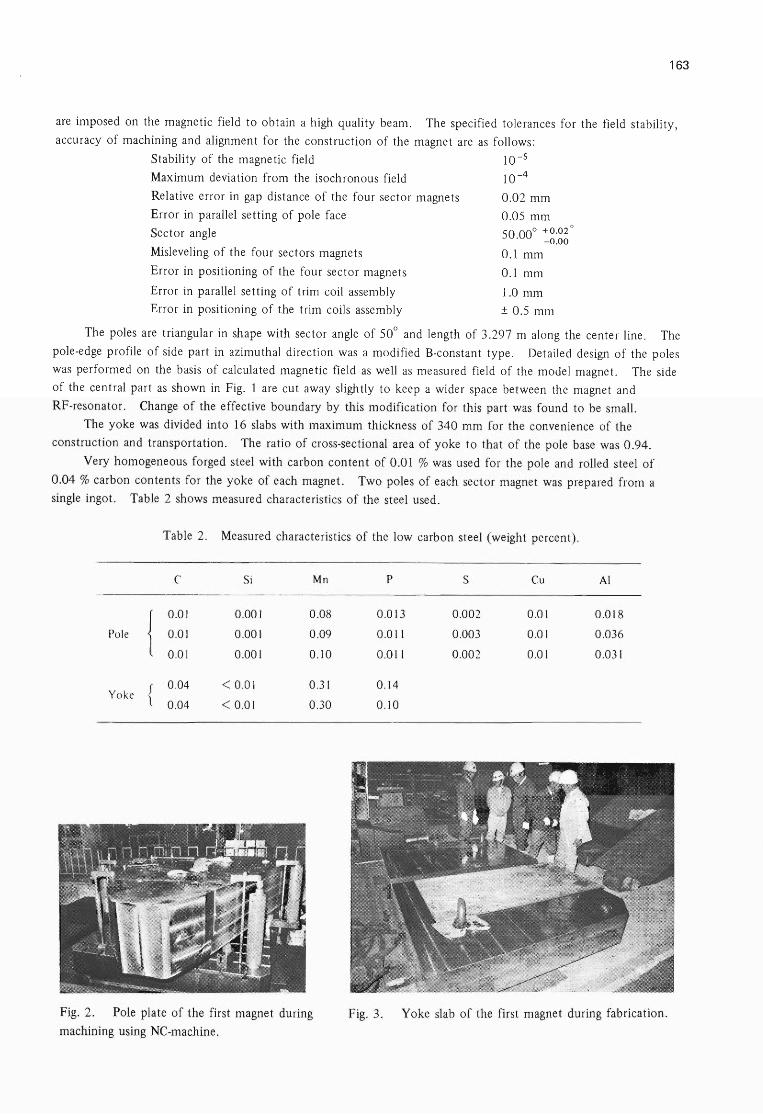
163
are imposed on the magnetic field to obtain a high quality beam. The specified tolerances for the field stability,
accuracy of machining and alignment for the construction of the magnet are as follows:
Stability of the magnetic field 10-s
Maximum deviation from the isochronous field
Relative error in gap distance of the four sector magnets
Error in parallel setting of pole face
Sector angle
Misleveling of the four sectors magnets
Error in positioning of the four sector magnets
Error in parallel setting of trim coil assembly
Error in positioning of the trim coils assembly
10-4
0.02 mm
0.05 mm 50 00° +0.02
0
. -0.00
0.1 mm
0.1 mm
1.0 mm
± 0.5 mm
The poles are triangular in shape with sector angle of 50° and length of 3.297 m along the center line. The
pole-edge profile of side part in azimuthal direction was a modified B-constant type. Detailed design of the poles
was performed on the basis of calculated magnetic field as well as measured field of the model magnet. The side
of the central part as shown in Fig. 1 are cut away slightly to keep a wider space between the magnet and
RF-resonator. Change of the effective boundary by this modification for this part was found to be small.
The yoke was divided into 16 slabs with maximum thickness of 340 mm for the convenience of the
construction and transportation. The ratio of cross-sectional area of yoke to that of the pole base was 0.94.
Very homogeneous forged steel with carbon content of 0.01 % was used for the pole and rolled steel of
0.04 % carbon contents for the yoke of each magnet. Two poles of each sector magnet was prepared from a
single ingot. Table 2 shows measured characteristics of the steel used.
Table 2. Measured characteristics of the low carbon steel (weight percent).
C Si Mn P S Cu Al
{ 0.01 0.001 0.08 0.013 0.002 0.01 0.018
Pole 0.01 0.001 0.09 0.011 0.003 0.01 0.036
0.01 0.001 0.10 0.011 0.002 0.01 0.031
f 0.04 < 0.01 0.31 0.14 Yoke l 0.04 < 0.01 0.30 0.10
Fig. 2. Pole plate of the first magnet during Fig. 3. Yoke slab of the first magnet during fabrication.
machining using NC-machine.
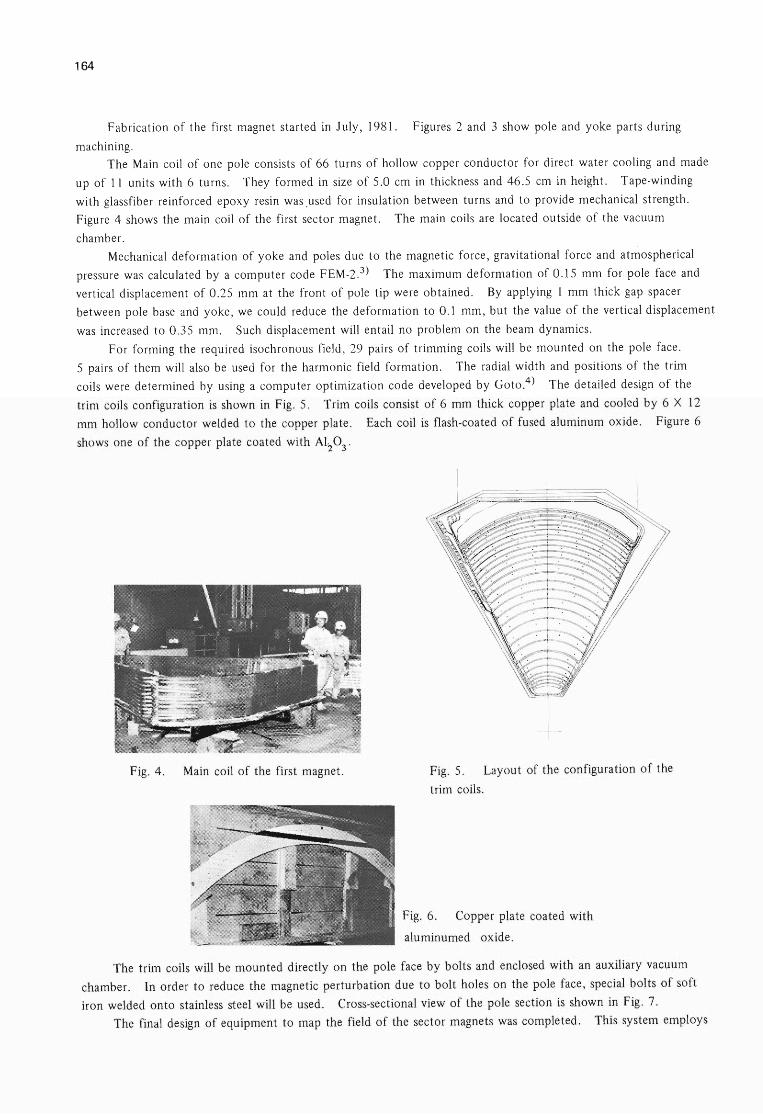
164
Fabrication of the first magnet started in July, 1981. Figures 2 and 3 show pole and yoke parts during
machining.
The Main coil of one pole consists of 66 turns of hollow copper conductor for direct water cooling and made
up of 11 units with 6 turns. They formed in size of 5.0 cm in thickness and 46.5 cm in height. Tape-winding
with glassfiber reinforced epoxy resin was ,used for insulation between turns and to provide mechanical strength.
Figure 4 shows the main coil of the first sector magnet. The main coils are located outside of the vacuum
chamber.
Mechanical deformation of yoke and poles due to the magnetic force, gravitational force and atmospherical
pressure was calculated by a computer code FEM-2,3) The maximum deformation of 0.15 mm for pole face and
vertical displacement of 0.25 mm at the front of pole tip were obtained. By applying 1 mm thick gap spacer
between pole base and yoke, we could reduce the deformation to 0.1 mm, but the value of the vertical displacement
was increased to 0.35 mm. Such displacement will entail no problem on the beam dynamics.
For forming the required isochronous field, 29 pairs of trimming coils will be mounted on the pole face.
5 pairs of them will also be used for the harmonic field formation. The radial width and positions of the trim
coils were determined by using a computer optimization code developed by Goto.4) The detailed design of the
trim coils configuration is shown in Fig. 5. Trim coils consist of 6 mm thick copper plate and cooled by 6 X 12
mm hollow conductor welded to the copper plate. Each coil is flash-coated of fused aluminum oxide. Figure 6
shows one of the copper plate coated with Ali 0 3.
Fig. 4. Main coil of the first magnet. Fig. 5. Layout of the configuration of the
trim coils.
Fig. 6. Copper plate coated with
aluminumed oxide.
The trim coils will be mounted directly on the pole face by bolts and enclosed with an auxiliary vacuum
chamber. In order to reduce the magnetic perturbation due to bolt holes on the pole face, special bolts of soft
iron welded onto stainless steel will be used. Cross-sectional view of the pole section is shown in Fig. 7.
The final design of equipment to map the field of the sector magnets was completed. This system employs

165
Fe
T rim co il co ver sus
Fig. 7. Detailed cross-sectional view of the pole edge section .
21 Hall probes radially arranged, which measure the magnetic field between minimum and maximum radius as a
function of the azimuthal position in the range of 3600
with stepping mode. Operation of this system will be
controlled by computer.
Fabrication of the sector magnets are progressing satisfactorily at present. In order to finalize the pole
contour, preliminary measurement of edge field in the azimuthal direction will be performed at Sumitomo Heavy
Industry's Work Shop in April, 1982.
References
1) S. Motonaga, H. Takebe, T. Wada, Y. Obana, J. Fujita, and Y. Ikegami: IPCR Cyclotron Progr. Rep., 14, 164
(1980).
2) H. Kumagai: Nucl. Instr. and Methods, §.., 213 (1960); S. Motonaga, Y. Miyazawa, N. Nakanishi, T. Tonuma,
M. Hemmi, and T. Karasawa: Reports I.P.C.R., (in Japanese), 40, 1 (1964); T. Karasawa, S. Motonaga, Y.
Miyazawa, and M. Hemmi: Proc. 1st Intern. Conf. on Magnet Technology, p. 239 (1965).
3) Y. Ikegami, T. Wada, M. Hara, and S. Motonaga: Reports I.P.C.R., (in Japanese), 57, 177 (1981).
4) A. Goto H. Takebe, S. Motonaga, T. Wada, Y. Yano, N. Nakanishi, and Y. Tanaka: ibid., p. 165.
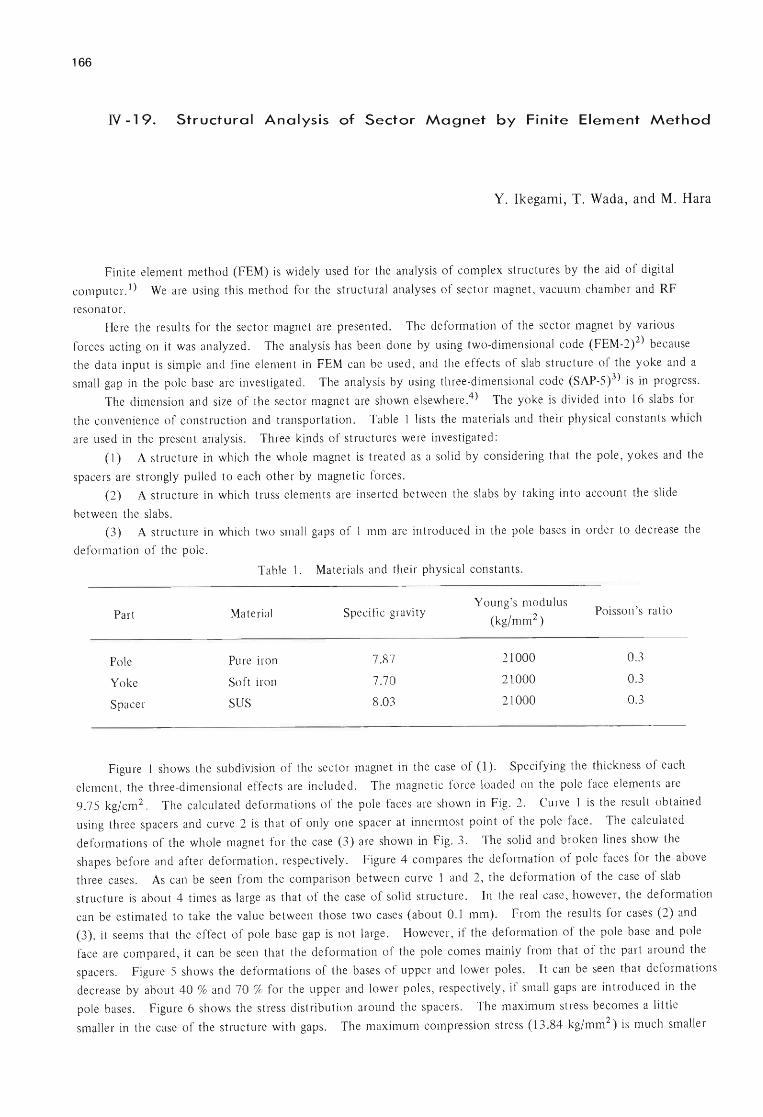
166
N -19. Structural Analysis of Sector Magnet by Finite Element Method
Y. Ikegami, T. Wada, and M. Hara
Finite element method (FEM) is widely used for the analysis of complex structures by the aid of digital
computer. i) We are using this method for the structural analyses of sector magnet, vacuum chamber and RF
resonator.
Here the results for the sector magnet are presented. The deformation of the sector magnet by various
forces acting on it was analyzed. The analysis has been done by using two-dimensional code (FEM-2)2) because
the data input is simple and fine element in FEM can be used, and the effects of slab structure of the yoke and a
small gap in the pole base are investigated. The analysis by using three-dimensional code (SAP-5)3) is in progress.
The dimension and size of the sector magnet are shown elsewhere.4 ) The yoke is divided into 16 slabs for
the convenience of construction and transportation. Table 1 lists the materials and their physical constants which
are used in the present analysis. Three kinds of structures were investigated:
(1) A structure in which the whole magnet is treated as a solid by considering that the pole, yokes and the
spacers are strongly pulled to each other by magnetic forces.
(2) A structure in which truss elements are inserted between the slabs by taking into account the slide
between the slabs.
(3) A structure in which two small gaps of 1 mm are introduced in the pole bases in order to decrease the
deformation of the pole.
Table 1. Materials and their physical constants.
Part Material Specific gravity Young's modulus
Poisson's ratio (kg/mm2)
Pole Pure iron 7.87 21000 0.3
Yoke Soft iron 7.70 21000 0.3
Spacer SUS 8.03 21000 0.3
Figure 1 shows the subdivision of the sector magnet in the case of (1). Specifying the thickness of each
element, the three-dimensional effects are included. The magnetic force loaded on the pole face elements are
9.75 kg/cm 2. The calculated deformations of the pole faces are shown in Fig. 2. Curve 1 is the result obtained
using three spacers and curve 2 is that of only one spacer at innermost point of the pole face. The calculated
deformations of the whole magnet for the case (3) are shown in Fig. 3. The solid and broken lines show the
shapes before and after deformation, respectively. Figure 4 compares the deformation of pole faces for the above
three cases. As can be seen from the comparison between curve 1 and 2, the deformation of the case of slab
structure is about 4 times as large as that of the case of solid structure. In the real case, however, the deformation
can be estimated to take the value between those two cases (about 0.1 mm). From the results for cases (2) and
(3), it seems that the effect of pole base gap is not large. However, if the deformation of the pole base and pole
face are compared, it can be seen that the deformation of the pole comes mainly from that of the part around the
spacers. Figure 5 shows the deformations of the bases of upper and lower poles. It can be seen that deformations
. decrease by about 40 % and 70 % for the upper and lower poles, respectively, if small gaps are introduced in the
pole bases. Figure 6 shows the stress distribution around the spacers. The maximum stress becomes a little
smaller in the case of the structure with gaps. The maximum compression stress (13.84 kg/mm2) is much smaller
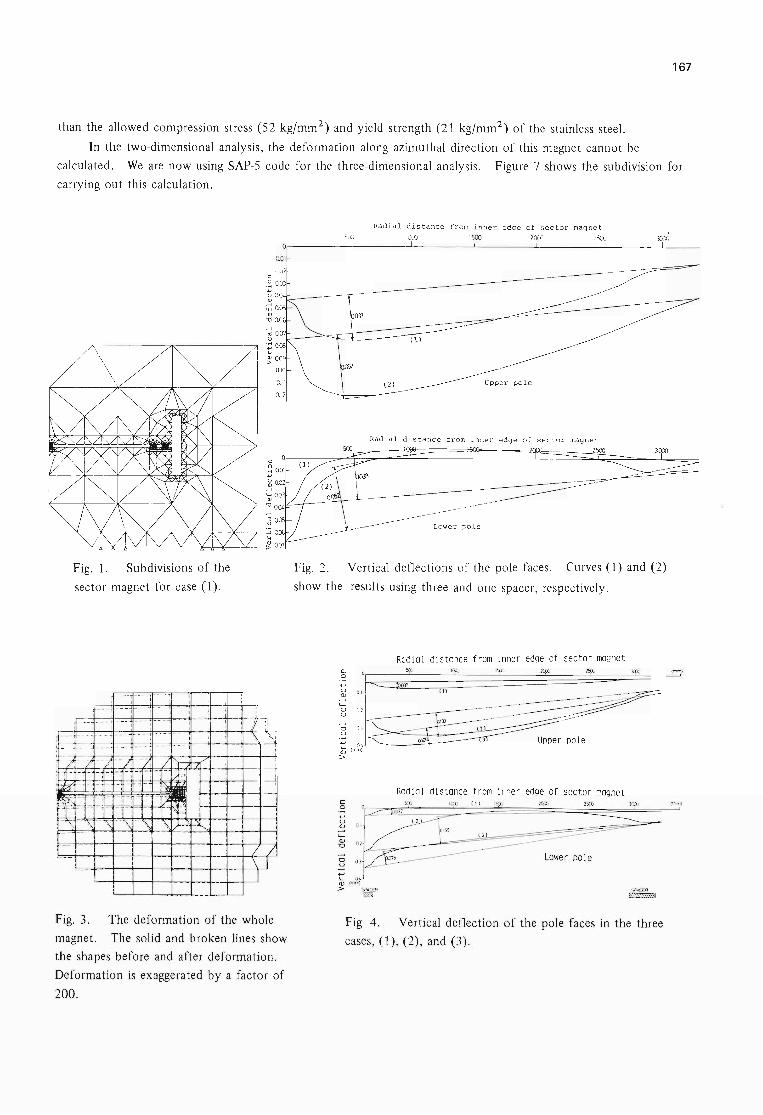
167
than the allowed compression stress (52 kg/mm2 ) and yield strength (21 kg/mm2 ) of the stainless steel.
In the two-dimensional analysis, the deformation along azimuthal direction of this magnet cannot be
calculated. We are now using SAP-5 code for the three-dimensional analysis. Figure 7 shows the subdivision for
carrying out this calculation.
Fig. 1. Subdivisions of the
sector magnet for case (1).
-- , --- - - -I 1
- -- ,. - ., , , , ,
, ~+- = _-_~'-- -_i - - ,-
: -i-)- j --j; -7; -/NP7/~ , -1- - -, -~ ,-, -, , -, 1)=1
0.01
o.
.I :1
'\ '\J
~ ~~ - ,- , ,' , :~ 'ifo--+--: .-+-11--+----------;1
~ ., -; : I 1 : I~ I"f----<f:-+--+--+--l 1 : i I . 1 : 1 I I 1N=4 I I
/ / \1
Fig. 3. The deformation of the whole
magnet. The solid and broken lines show
the shapes before and after deformation.
Deformation is exaggerated by a factor of
200.
Radial distance from inner edge of sector magnet
500 1000 1500 2000 2500
Radial distance fr om inner edge of sector magnet
2500
Lower pole
Fig. 2 . Vertical deflections of the pole faces. Curves (1) and (2)
show the results using three and one spacer, respectively.
Radial distance from inner edge of sec tor magnet c ~).); 1M 1'»., l:p: (mm)
0
.j..J or> u (1) (]J
4-(]J 01 '0
'0 OJ U
.j..J 0 Upper pole
~ (rnm)
>
Radial distance from inner edge of sector magnet c .s ICO 1000 ( 1) IICO 1000 = (mm)
.j..J
u 0 1
~ 4-(]J '0
8 OJ
.j..J
L 0 .4 (]J Imm)
> SAlCER sPoCER Iml ~
Fig 4. Vertical deflection of the pole faces in the three
cases, (1), (2), and (3).
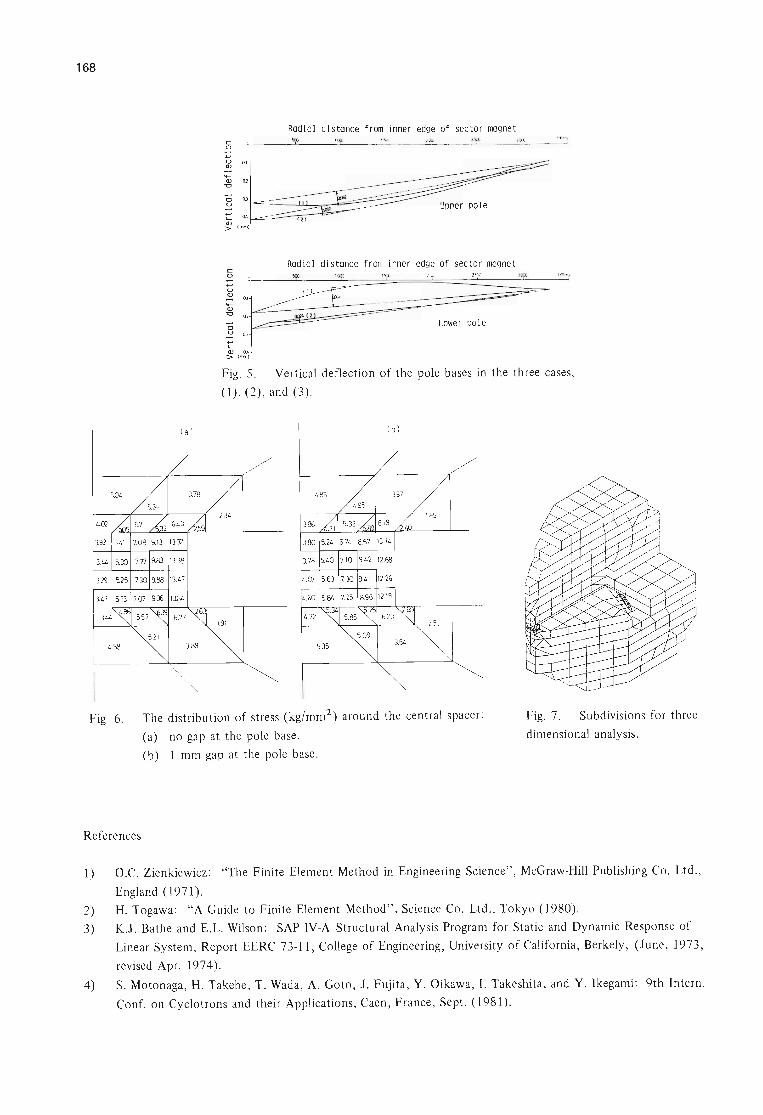
168
c: o
c: o +-' U Q)
~ Q)
"'CJ
'0 u
t Q) > (rr.-n)
Radial distance from Inner edge of sector magnet
Radial distance from inner edge of sector magnet
Lower pole
Fig. 5. Vertical deflection of the pole bases in the three cases,
(1) , (2), and (3) .
(a ) ( b)
1..02 3.86
3.92
3.4
3.29
3.1.3
3.4 1.72
Fig 6. The distribution of stress (kg/mm2) around the central spacer:
(a) no gap at the pole base.
(b) 1 mm gap at the pole base.
References
Fig. 7. Subdivisions for three
dimensional analysis .
1) O.C. Zienkiewicz: "The Finite Element Method in Engineering Science" , McGraw-Hill Publishing Co. Ltd.,
England (1971).
2) H. Togawa: "A Guide to Finite Element Method", Science Co. Ltd., Tokyo (1980).
3) K.J. Bathe and E.L. Wilson : SAP IV-A Structural Analysis Program for Static and Dynamic Response of
Linear System, Report EERC 73-11, College of Engineering, University of California, Berkely , (June, 1973,
revised Apr. 1974).
4) S. Motonaga, H. Takebe, T. Wada, A. Goto, J. Fujita, Y. Oikawa, I. Takeshita, and Y. Ikegami: 9th Intern.
Conf. on Cyclotrons and their Applications , Caen, France, Sept. (1981).
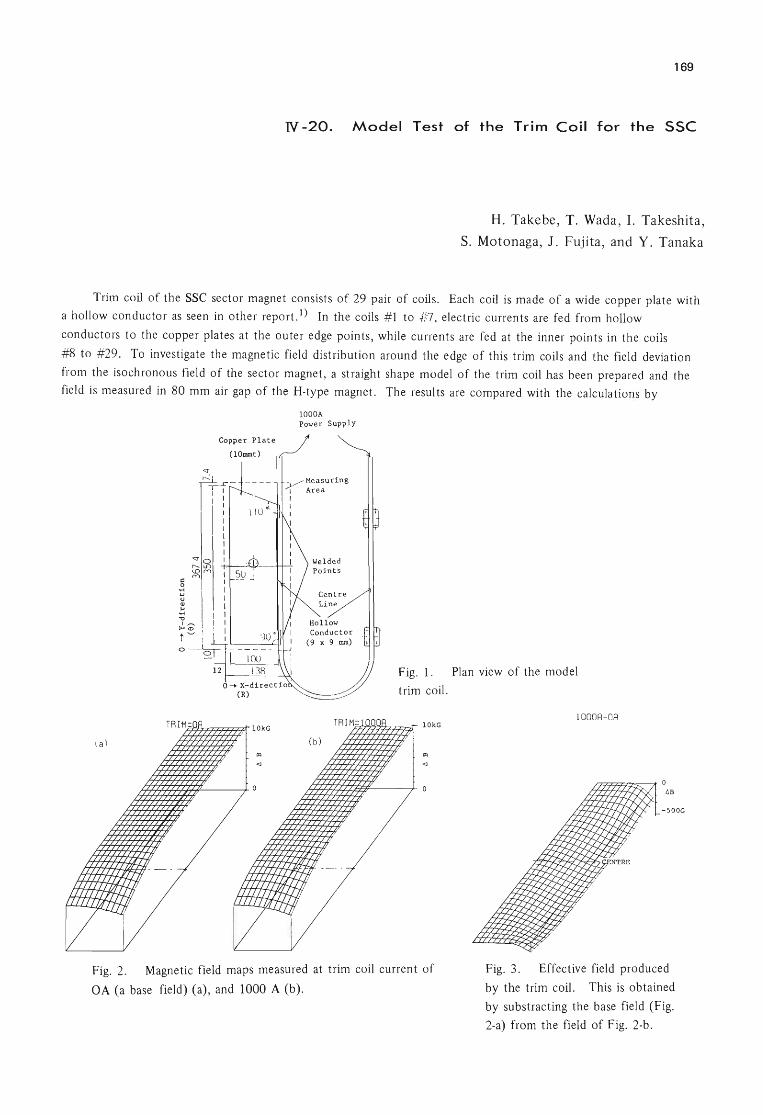
169
N -20. Model Test of the Trim Coil for the SSC
H. Takebe, T. Wada, I. Takeshita,
S. Motonaga, J. Fujita, and Y. Tanaka
Trim coil of the sse sector magnet consists of 29 pair of coils. Each coil is made of a wide copper plate with
a hollow conductor as seen in other report. l) In the coils #1 to #7, electric currents are fed from hollow
conductors to the copper plates at the outer edge points, while currents are fed at the inner points in the coils
#8 to #29. To investigate the magnetic field distribution around the edge of this trim coils and the field deviation
from the isochronous field of the sector magnet, a straight shape model of the trim coil has been prepared and the
field is measured in 80 mm air gap of the H-type magnet. The results are compared with the calculations by
TRIM=
( a )
lOOOA Power Supply
Copper Plate t (lOmmt) ~
lOkG
y Measuring I Area I
Conductor (9 x 9 rom)
TRIM=
( b)
Fig. 1. Plan view of the model
trim coil.
IOOOR-OR lOkG
6B
- SOOG
Fig. 2. Magnetic field maps measured at trim coil current of Fig. 3. Effective field produced
OA (a base field) (a), and 1000 A (b). by the trim coil. This is obtained
by substracting the base field (Fig.
2-a) from the field of Fig. 2-b.
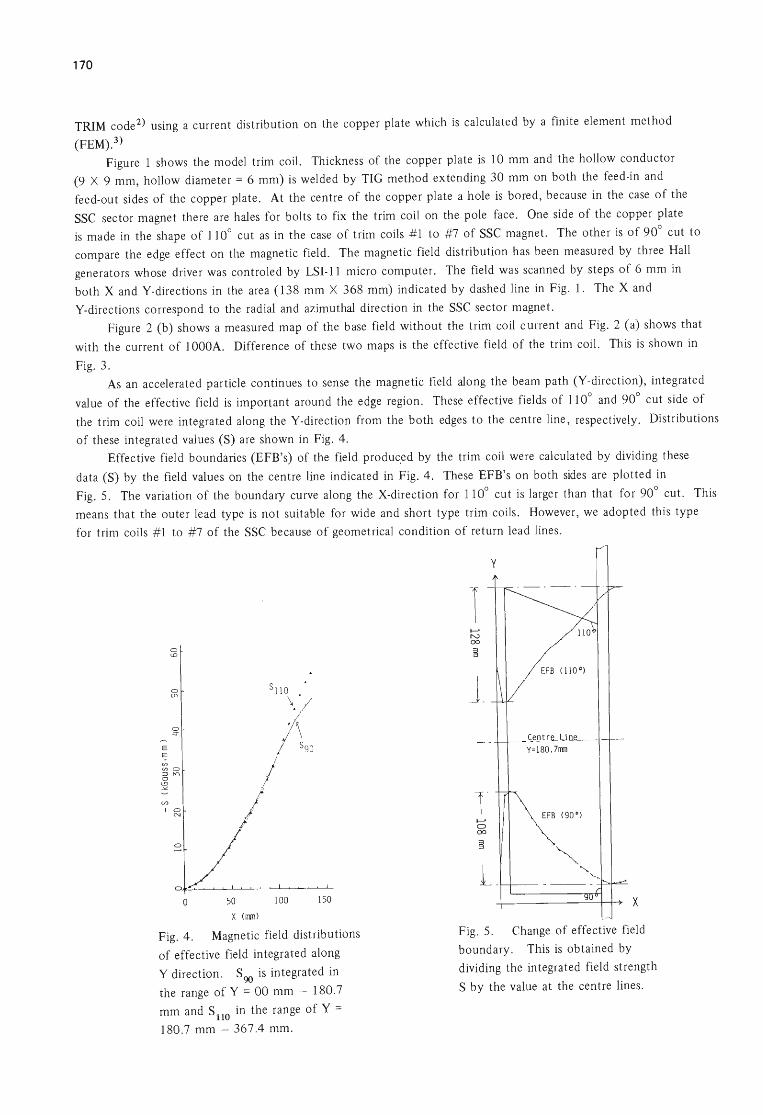
170
TRIM code 2) using a current distribution on the copper plate which is calculated by a finite element method
(FEM).3)
Figure 1 shows the model trim coil. Thickness of the copper plate is 10 mm and the hollow conductor
(9 X 9 mm, hollow diameter = 6 mm) is welded by TIG method extending 30 mm on both the feed-in and
feed-out sides of the copper plate. At the centre of the copper plate a hole is bored, because in the case of the
SSC sector magnet there are hales for bolts to fix the trim coil on the pole face. One side of the copper plate
is made in the shape of 110° cut as in the case of trim coils #1 to #7 of SSC magnet. The other is of 90° cut to
compare the edge effect on the magnetic field. The magnetic field distribution has been measured by three Hall
generators whose driver was controled by LSI-II micro computer. The field was scanned by steps of 6 mm in
both X and V-directions in the area (138 mm X 368 mm) indicated by dashed line in Fig. 1. The X and
V-directions correspond to the radial and azimuthal direction in the SSC sector magnet.
Figure 2 (b) shows a measured map of the base field without the trim coil current and Fig. 2 (a) shows that
with the current of 1000A. Difference of these two maps is the effective field of the trim coil. This is shown in
Fig. 3.
As an accelerated particle continues to sense the magnetic field along the beam path (Y-direction), integrated
value of the effective field is important around the edge region. These effective fields of 110° and 90° cut side of
the trim coil were integrated along the V-direction from the both edges to the centre line, respectively. Distributions
of these integrated values (S) are shown in Fig. 4.
Effective field boundaries (EFB's) of the field produc,ed by the trim coil were calculated by dividing these
data (S) by the field values on the centre line indicated in Fig. 4. These EFB's on both sides are plotted in
Fig. 5. The variation of the boundary curve along the X-direction for 110° cut is larger than that for 90° cut. This
means that the outer lead type is not suitable for wide and short type trim coils. However, we adopted this type
for trim coils #1 to #7 of the SSC because of geometrical condition of return lead lines.
0 cO
0 U"\
0 .::r
E E§' if)
if) 0 ::l ~ 0 t!)
:= I' (/)
1 0 N
S
0
0 50 100 150
X (1Ml)
Fig. 4. Magnetic field distributions
of effective field integrated along
Y direction. S90 is integrated in
the range of Y = 00 mm - 180.7
mm and S 110 in the range of Y =
180.7 mm - 367.4 mm.
1 I-' N 00
~
I-' c:> 00
y
C_e!!lLe...-lIlli'-- _ y= 180.7rrm
EFB (90°)
x
Fig. 5. Change of effective field
boundary. This is obtained by
dividing the integrated field strength
S by the value at the centre lines.
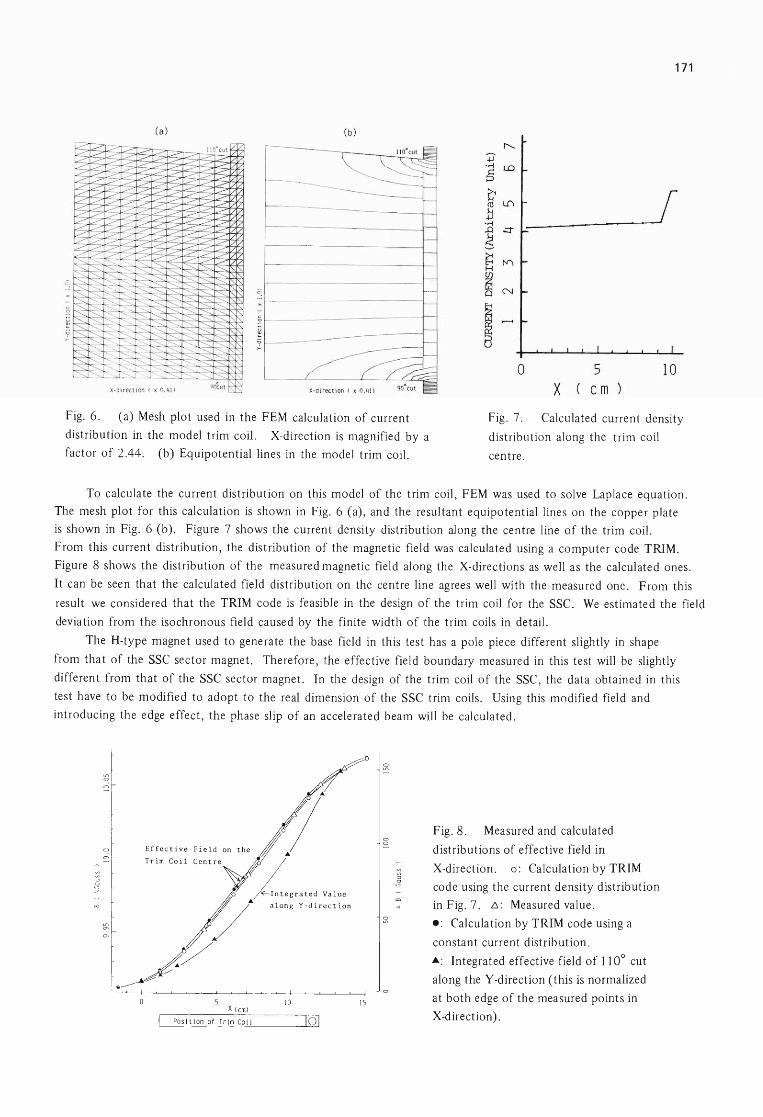
(a) ( b)
r-::;. .--11 0' cut k .c -- ----~ ~~ c -- ~ ?
l:?~ c -- ----.c ..-- /"
---- /'" t:?-k ~ ---- ---...; -----------=== ~~~ ~
---- ----:;::>
I-<:: -<::: -- ----:;::>
i-<::::: .c::::: -- -- ----/"
Ie:::::: .c:::::1 __ ---- /'"
Ie:::::: .c::::: -- .7
i-<::::: .c::::: .c' -- ---- -- ---- 7 i-<::::: L. .,-- -- --- ---- 7 k::::: ..----- -- ---- -- ..?" k::::: L -- -- ----
/" k::::: .,-- -- --- --- -- /'"
S:~~~~:::: " ----;7
" " ~ .:::::".::::::" ~ " ~" " " " "-" " " " ::::::" '--.. " " " " "
::::::" ::-:--.. ". "- " " " " " ~ ::::::" ::::::,., ' '- "-,, '-" " " " " " ~ ~~~::::::,,::::::,.,'--.. " " " ~"~:::::: " " ~ ~ " ~ ~"-~""""---~~ ::::::,., ~ "- '" ~ '-- " ------ ~ ~ ::::::"'~ ~----::::::",----- ~,,------~ I ~,;:> - " ~ " ~ ~ " ~r~~ '" ',,, ~ " ~_T "'~:''::::-::-:::
·t~r-:~ ::::::,., ',- " " L.... ~~:o,.._-:- ~ - J -. " ~ ______ ~
X-direct ion ( x 0, 41) aOeut
Fig. 6. (a) Mesh plot used in the FEM calculation of current
distribution in the model trim coil. X-direction is magnified by a
factor of 2 .44. (b) Equipotential lines in the model trim coil.
171
t'-..
4J • ..-1 ill §
~ l.['\
b • ..-1 ..Q .::t -----! ~ ~ 1'1\ H
~ N
I 0 5 10
X em
Fig. 7. Calculated current density
distribution along the trim coil
centre.
To calculate the current distribution on this model of the trim coil , FEM was used to solve Laplace equation.
The mesh plot for this calculation is shown in Fig. 6 (a), and the resultant equipotential lines on the copper plate
is shown in Fig. 6 (b). Figure 7 shows the current density distribution along the centre line of the trim coil.
From this current distribution, the distribution of the magnetic field was calculated using a computer code TRIM.
Figure 8 shows the distribution of the measured magnetic field along the X-directions as well as the calculated ones.
It can be seen that the calculated field distribution on the centre line agrees well with the measured one . From this
result we considered that the TRIM code is feasible in the design of the trim coil for the SSC. We estimated the field
deviation from the isochronous field caused by the finite width of the trim coils in detail.
The H-type magnet used to generate the base field in this test has a pole piece different slightly in shape
from that of the SSC sector magnet. Therefore, the effective field boundary measured in this test will be slightly
different from that of the SSC sector magnet. In the design of the trim coil of the SSC, the data obtained in this
test have to be modified to adopt to the real dimension of the SSC trim coils. Using this modified field and
introducing the edge effect, the phase slip of an accelerated beam will be calculated.
'" C)
o
o <:>
W"' i vo Fi old on <ho /1" Trim Co il Centre 'i>/ /
I ~I n teg r a t e d Va lue
~. ,lon g Y-dim"o,
~/ I I o 10
X (em)
C!'OSTtion of Tr im Coil 10 1 15
o o
Fig. 8. Measured and calculated
distributions of effective field in
X-direction. 0 : Calculation by TRIM
code using the current density distribution
in Fig. 7. .6 : Measured value.
e: Calculation by TRIM code using a
constant current distribution.
A: Integrated effective field of 110° cut
along the Y -direction (this is normalized
at both edge of the measured points in
X-direction).

172
References
1) H. Takebe, A. Goto, S. Motonaga, T. Wada, Y. Oikawa, and I. Takeshita: p.173 in this report.
2) J.S. Colonais and J.H. Porst: Magnet Design Applications of the Magnetostatic Problem, called TRIM,
UCRL-16382 (1965).
3) O.C. Zienkiewicz: The Finite Element Method in Engineering Science, McGrow-Hill Publishing Co. Ltd.
(1971 ).
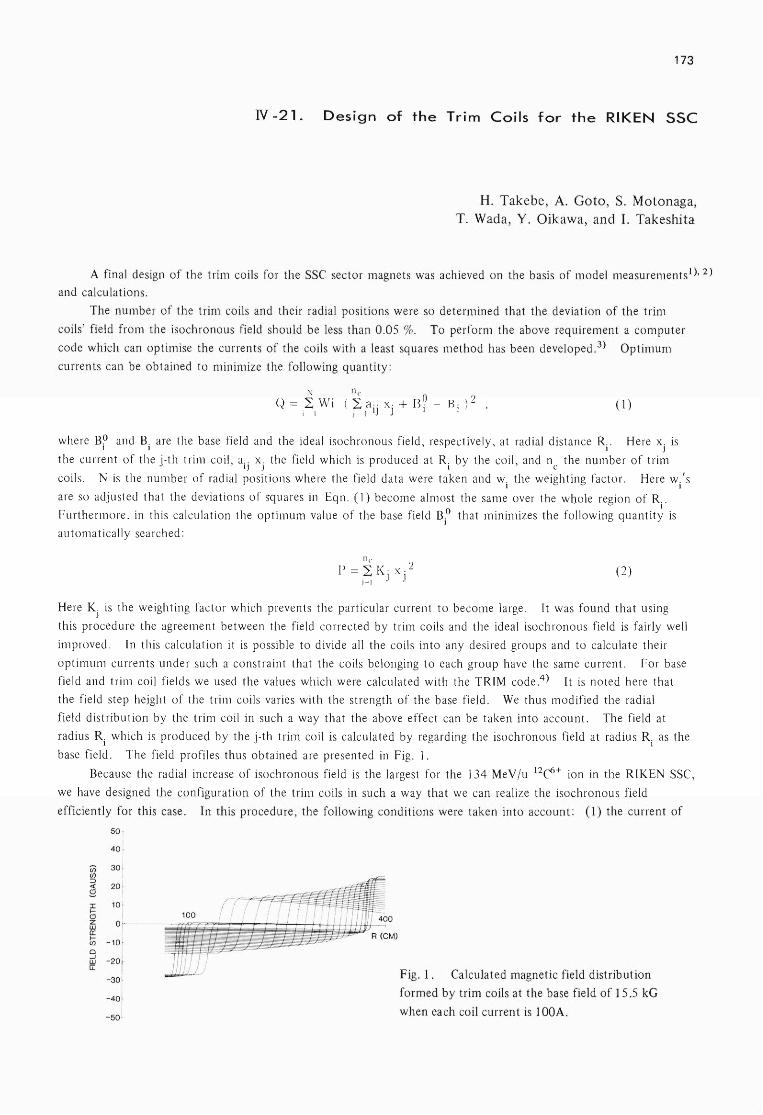
173
N -21. Design of the Trim Coils for the RIKEN SSC
H. Takebe, A. Goto , S. Motonaga, T. Wada, Y. Oikawa, and I. Takeshita
A final design of the trim coils for the SSC sector magnets was achieved on the basis of model measurements l ), 2)
and calculations.
The number of the trim coils and their radial positions were so determined that the deviation of the trim
coils' field from the isochronous field should be less than 0.05 %. To perform the above requirement a computer
code which can optimise the currents of the coils with a least squares method has been developed. 3) Optimum
currents can be obtained to minimize the following quantity:
.'\ . n c 0 2 Q = ~ W I ( ~a ·· x · + Bi - B i ) ,
i = I j = I IJ J (1)
whe re B~ and B. are the base field and the ideal isochronous field , respectively , at radial distance R.. Here x. is \ \ \ J
the current of the j-th trim coil , a .. x. the field which is produced at R. by the coil , and n the number of trim \] ] \ c
coils. N is the number of radial positions where the field data were taken and w. the weighting factor. Here w.' s 1 1
are so adjusted that the deviations of squares in Eqn. (I) become almost the same over the whole region of R.. - \
Furthermore. in this calculation the optimum value of the base field B.o that minimizes the following quantity is \
automatically searched :
I1c
P = J~ KJ x · 2 (2)
Here K. is the weighting factor which prevents the particular current to become large. It was found that using J
this procedure the agreement between the field corrected by trim coils and the ideal isochronous field is fairly well
improved . In this calculation it is possible to divide all the coils into any desired groups and to calculate their
optimum currents under such a constraint that the coils belonging to each group have the same current. For base
field and trim coil fields we used the values which were calculated with the TRIM code.4) It is noted here that
the field step hejght of the trim coils varies with the strength of the base field. We thus modified the radial
field distribution by the trim coil in such a way that the above effect can be taken into account. The field at
radius R. which is produced by the j-th trim coil is calculated by regarding the isochronous field at radius R. as the \ 1
base field. The field profiles thus obtained are presented in Fig. 1.
Because the radial increase of isochronous field is the largest for the 134 MeV/u 12Ci+ ion in the RIKEN SSC ,
we have designed the configuration of the trim coils in such a way that we can realize the isochronous field
efficiently for this case. In this procedure , the following conditions were taken into account: (1) the current of
en U) ::J <t: 8
SO l
::1 20 f
10 1 I or--
- 10
-20 ~
:l -50
Fig. 1. Calculated magnetic field distribution
formed by trim coils at the base field of 15.5 kG
when each coil current is 100A.
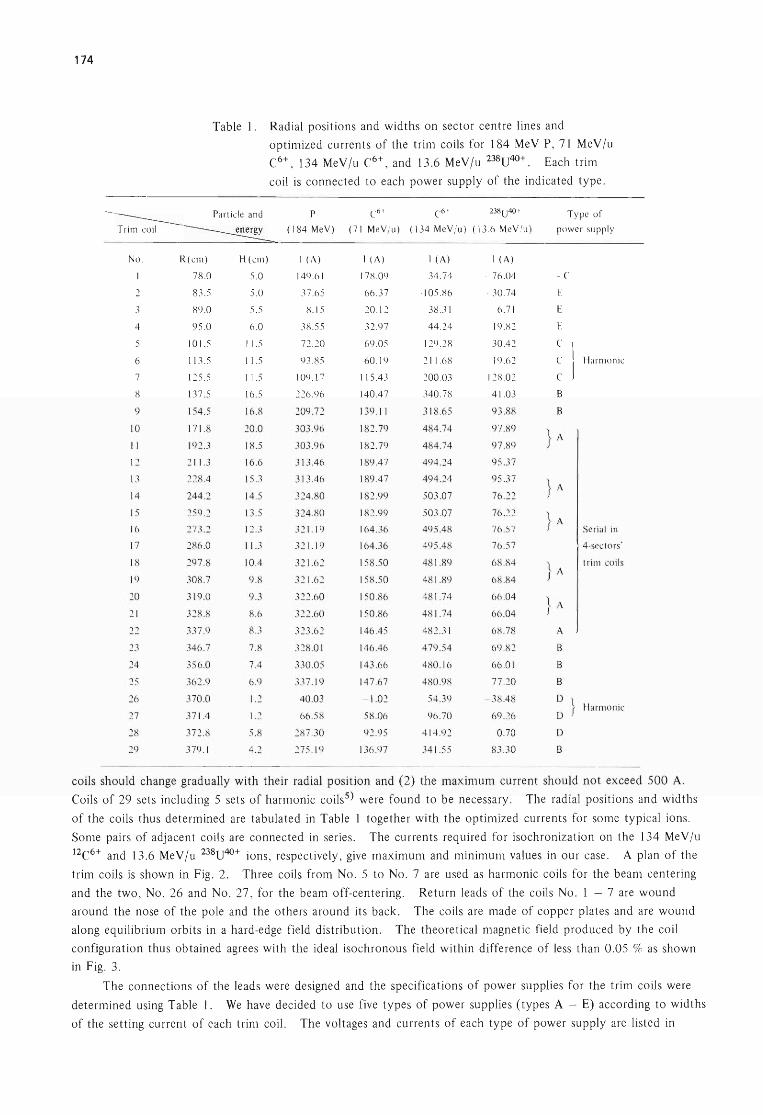
174
No.
2
3
4
5
6
7
8
9
10
II
12
13
14
15
16
17
18
19
20
21
22
23
24
25
26
27
28
29
R(cm)
78.0
83.5
89.0
95.0
10 l.5
11 3.5
125 .5
137.5
154 .5
171.8
192.3
2 11.3
228.4
244 .2
259 .2
273 .2
286.0
297.8
308.7
3 19.0
328.8
337.9
346.7
356.0
362.9
370.0
371.4
372.8
379.1
Table 1. Radial positions and widths on sector centre lines and
optimized currents of the trim coils for 184 MeV P, 71 MeV/u
C6+, 134 MeV/u C6+, and 13.6 MeV/u 238U40+. Each trim
coil is connected to each power supply of the indicated type.
H (cm)
5.0
5.0
5.5
6.0
11. 5
11.5
11 .5
16.5
16 .8
20.0
18.5
16.6
15.3
14.5
13.5
12.3
11.3
10.4
9.8
9.3
8.6
8.3
78
7.4
69
1.2
1. 2
5.8
4.2
P
( 184 MeV)
I (A)
- 149.61
37 .65
- 8.15
38.55
72.20
93.85
109. 17
226 .96
209.72
303.96
303.96
313.46
313.46
324.80
324.80
321.19
321. 19
321.62
321.62
322.60
322.60
323.62
328 .01
330.05
337. 19
40.03
66.58
287.30
275. 19
(71 MeV/u) (134 MeV/u) (13.6 MeV/u)
1 (A)
- 178.09
66.37
- 20.12
32.97
69.05
60 .1 9
115.43
140.4 7
139.11
182.79
182.79
189.4 7
189.4 7
182.99
182.99
164.36
164.36
158.50
158 .50
150.86
150.86
146.45
146.46
143.66
147.67
- 1.02
58 .06
92.95
136.97
1 (A)
34.74
- 105.86
38.31
44.24
129.28
21 1.68
200.03
340.78
3 18.65
484.74
484.74
494.24
494.24
503.07
503.07
495.48
495.48
48 1.89
481.89
481.74
48 1.74
482.31
479.54
480.16
480.98
54 .3 9
96.70
414.92
341.55
1 (A)
- 76.04
- 30.74
- 6.71
- 19.82
30.42
19.62
128 .02
41.03
93.88
97.89
97.89
95.37
95 .37
76.22
76.22
76 .57
7657
68.84
68 .84
66.04
66.04
68.78
69.82
66.01
77 .20
- 38.48
69 .26
0.70
83.30
Type of
power supply
-c E
E
E
C
C
C
B
B
A
B
B
B
Harmonic
Serial in
4-sectors
trim coi ls
~ } Harmonic
o B
coils should change gradually with their radial position and (2) the maximum current should not exceed 500 A.
Coils of 29 sets including 5 sets of harmonic coils5) were found to be necessary. The radial positions and widths
of the coils thus determined are tabulated in Table 1 together with the optimized currents for some typical ions.
Some pairs of adjacent coils are connected in series. The currents required for isochronization on the 134 Me V /u
12C6+ and 13.6 MeV/u 238U40+ ions, respectively, give maximum and minimum values in our case. A plan of the
trim coils is shown in Fig. 2. Three coils from No.5 to No.7 are used as harmonic coils for the beam centering
and the two, No. 26 and No. 27, for the beam off-centering. Return leads of the coils No.1 - 7 are wound
around the nose of the pole and the others around its back. The coils are made of copper plates and are wound
along equilibrium orbits in a hard-edge field distribution. The theoretical magnetic field produced by the coil
configuration thus obtained agrees with the ideal isochronous field within difference of less than 0.05 % as shown
in Fig. 3.
The connections of the leads were designed and the specifications of power supplies for the trim coils were
determined using Table 1. We have decided to use five types of power supplies (types A - E) according to widths
of the setting current of each trim coil. The voltages and currents of each type of power supply are listed in

I
MochinT Cent re
-"L Sector Centre li ne
I ....
17 . 0
I KGI
16 . 0
. I SO - - - BASE - CAL
<Cl --- -- -- ------ -- -Z
~ 15 · 0
(j)
S W 14 . 0 ;:;::
13 . 0
100 200 300 R ( eM)
175
40 0
Fig. 2. Plan of the trim coils for the sector magnet. Fig. 3 . Comparison of the magnetic field distribution
formed by the trim coils with the isochronous field
for acceleration of C6 + to 134 Me V lu.
Table 2. Specifications of five types fo power supplies for the trim coils
of the four sector magnets. The number of total parameters to be set
by computer is 71. Total power of the trim coils is estimated to be 192 kW.
Min . Max. Max. Power By l'~' s Number Number Tota l
Type Curr. (A) Volt. (kW) Curr o (A) o f blanchs o f P.S. power (kW)
A } Bypass 50 ~ 500 205 103 30 7 I 103
B control system 30 ~ 500 51 25.5 100 12 2 5 1
C with - 75 ~ 315 2 .6 0.82 16 13 .1
0 polarity - 500 ~ 500 4 2.0 12 24
E switch - 100 ~ 70 0.9 0.1 12 1.2 .. _- . ....... .. ... -. ... . . ....... .
Total Paramete rs: 7 1 192
Table 2. The power supply of type A is used for the coils from No. 10 to No. 22 . Coils No . 10 and No. 11,
No 12, and No . 13, No. 14 and No. 15 , No. 16 , and No. 17 , No. 18 and No. 19, No . 20, and No. 21 are each
connected in series. Each of the above pairs and coil No. 22 are also connected in series through four sectors'
trim coils, because the disturbance in the region from NO . 8 to No. 22 coils due to the injection or extraction
elements or the harmonic coils will be small enough. Furthermore, the differences of the currents between the
adjacent pairs of these coils are less than 30 A. Therefore the currents of all these pairs are adjusted by a bypass
control circuits as shown in Fig. 4. The number and the length of thick cables can be decreased in this method ,
resulting in an appreciable saving in power losses. This type of power supply has a transisterized regulator and a
saturatable reactor.
One power supply of type B is used for coils No.8, No.9 , and No. 29, and the other of type B for coils
from No. 23 to No. 25. These coils are connected through bypass circuits in the same manner as in the case of
type A power supply but are not in series through the four sectors' trim coils.
The other coils are excited by power supplies of types C, D and E with a polarity switch. They are
connected to each power supply independently, because their currents differ by a large amount.
The currents are controlled by a computer with a 12 bits DI A converter using CAMAC system. The detailed
specification of above power supplies will be written according to the results of field measurement for the real
sector magnets and the trim coils.
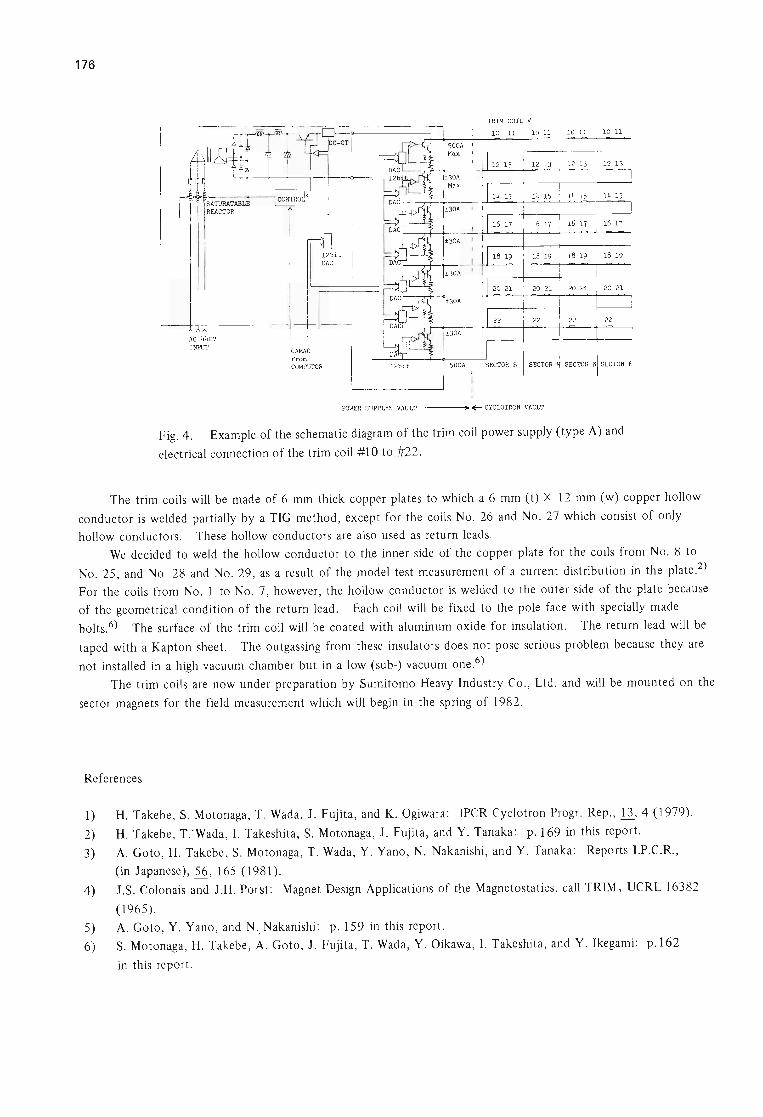
176
I ~ ~ 4l-' Iii ~-
I Ilt'O JE"--SATURA--<'-T~ABLE =----'---t-1----<I>-----o REACTOR
AC 440v INPUT
CAMAC f r om COMPUTOR
POWER SUPPLYS VAULT
TRIM COIL #
10 11 10 11 10 11
, SECTOR S I SECTOR ~ SECTOR NI SECTOR E
I --~~ ~ CYCLOTRON VAULT
Fig. 4. Example of the schematic diagram of the trim coil power supply (type A) and
electrical connection of the trim coil #10 to #22.
The trim coils will be made of 6 mm thick copper plates to which a 6 mm (t) X 12 mm (w) copper hollow
conductor is welded partially by a TIG method , except fo r the coils No . 26 and No. 27 which consist of only
hollow conductors. These hollow conductors are also used as return leads.
We decided to weld the hollow conductor to the inner side of the copper plate for the coils from No. 8 to
No. 25 , and No. 28 and No. 29 , as a result of the model test measurement of a current distribution in the plate .2 )
For the coils from No.1 to No.7 , however, the hollow conductor is welded to the outer side of the plate because
of the geometrical condition of the return lead. Each coil will be fixed to the pole face with specially made
bolts.6) The surface of the trim coil will be coated with aluminum oxide for insulation. The return lead will be
taped with a Kapton sheet. The outgassing from these insulators does not pose serious problem because they are
not installed in a high vacuum chamber but in a low (sub-) vacuum one .6)
The trim coils are now under preparation by Sumitomo Heavy Industry Co. , Ltd . and wjll be mounted on the
sector magnets for the field measurement which will begin in the spring of 1982 .
References
1) H. Takebe , S. Motonaga , T. Wada, J . Fujita, and K. Ogiwara : IPCR Cyclotron Progr. Rep. , ll.., 4 (1979).
2) H. Takebe, T:Wada, I. Takeshita, S. Motonaga, J. Fujita, and Y. Tanaka: p. 169 in this report.
3) A. Goto , H. Takebe, S. Motonaga, T. Wada, Y. Yano , N. Nakanishi, and Y. Tanaka: Reports I.P.C.R. ,
(in Japanese), 56 , 165 (1981) .
4) J.S. Colonais and J.H. Porst: Magnet Design Applications of the Magnetostatics , call TRIM, UCRL-16382
(1965) .
5) A. Goto , Y. Yano, and N .. Nakanishi: p. 159 in this report.
6) S. Motonaga, H. Takebe , A. Goto , J . Fujita , T. Wada, Y. Oikawa, 1. Takeshita , and Y. Ikegami: p.162
in this report.
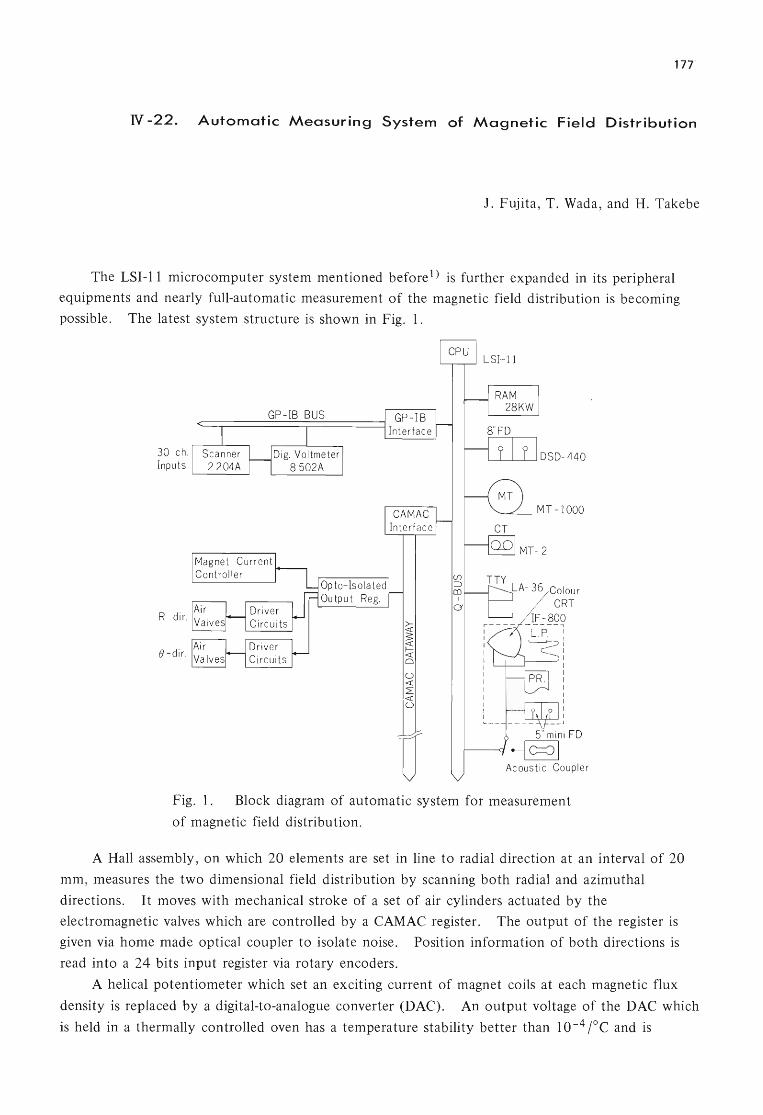
177
N -22. Automatic Measuring System of Magnetic Field Distribution
J . Fujita , T. Wada, and H. Takebe
The LSI-II microcomputer system mentioned before l ) is further expanded in its peripheral
equipments and nearly full-automatic measurement of the magnetic field distribution is becoming
possible. The latest system structure is shown in Fig. 1.
30 ch. Inputs
R - dir.
g - dir.
GP - IB BUS
L--__ --.J
Mag net Curre nt Con tro ller
>--~ ~ « o
u « L « u
u
(J)
~ co
I
a
L....L----L.....!.- DSD- 440
TTY
MT - 1000
LA- 36 Co lour CRT
IF - 800 -C.P~ - :
I I I I I I I
5" mi ni FD
f------cJ -1 C=81 Acoustic Couple r
Fig. 1. Block diagram of automatic system for measurement
of magnetic field distribution.
A Hall assembly, on which 20 elements are set in line to radial direction at an interval of 20
mm, measures the two dimensional field distribution by scanning both radial and azimuthal
directions. It moves with mechanical stroke of a set of air cylinders actuated by the
electromagnetic valves which are controlled by a CAMAC register. The output of the register is
given via home made optical coupler to isolate noise. Position information of both directions is
read into a 24 bits input register via rotary encoders.
A helical potentiometer which set an exciting current of magnet coils at each magnetic flux
density is replaced by a digital-to-analogue converter (DAC). An output voltage of the DAC which
is held in a thermally controlled oven has a temperature stability better than 10-4 tc and is
178
controlled by two serial pulses of Up/Down and Clock from the above mentioned CAMAC output
register.
Very small analogue voltages derived from 20 Hall elements, Pt-wire thermal sensors in the
Hall assembly and a DC -CT transducer of the magnet coil current are multiplexed by a relay
scanner FLUKE 2204A with 30 input channels and switching speed less than 14 msec, and
measured by a digital voltmeter FLUKE 8502A. The scanner and voltmeter are serially connected
on a common GP-IB bus.
A magnetic tape unit TEAC MT -1000 with a tape speed of 45 IPS and a record density of
1600 BPI is added to the LSI-II bus in order to increase data storage capacity necessiated by
progress of the automatic measuring system. A cassette tape unit with 15 IPS tape speed and 800
BPI record density can also be used.
An OKI IF-800 intelligent terminal is used for processing simple graphic demands and also
serves as a tool for development of application programs. It can work also as a second terminal in
the RT-ll multi-terminal monitor. The components of the IF-800 are 64 KB MOS RAM, dual 5
inch mini-floppy disks, a video display with graphic resolution of 200 X 640 dots, eight colour
description and a light pen, and a keyboard printer. The IF -800 is connected to the LSI-II by
RS-232C serial lines. Signal transfer rate is selectable with a switch at 300 or 9600 Baud. The
serial port in the IF-800 can be connected to a telephone via an acoustic coupler and make an
exchange of data and programs with remote stations. The IF-800 is provided with BASIC and
CP/M as operating system, and also utilities such as a screen editor and C-compiler which are
developed by Dr. T. Soma of the Information Science Laboratory of our Institute to fit with the
IF-800. The screen editor makes coding and change of source programs easy and speedy.
We are developing whole programs for various arrangements of measurement. The main
part of the programs is written in FORTRAN and the remainders, especially for CAMAC modules,
are written in Macro-assembly language as the subroutines of the FORTRAN programs. Those
programs are expected to relieve one from the tedious work of measurements such as the watch of
the instruments for hours.
Reference
I) J. Fujita, T. Wada, and H. Takebe: IPCR Cyclotron Progr. Rep., !±, 179 (1980).
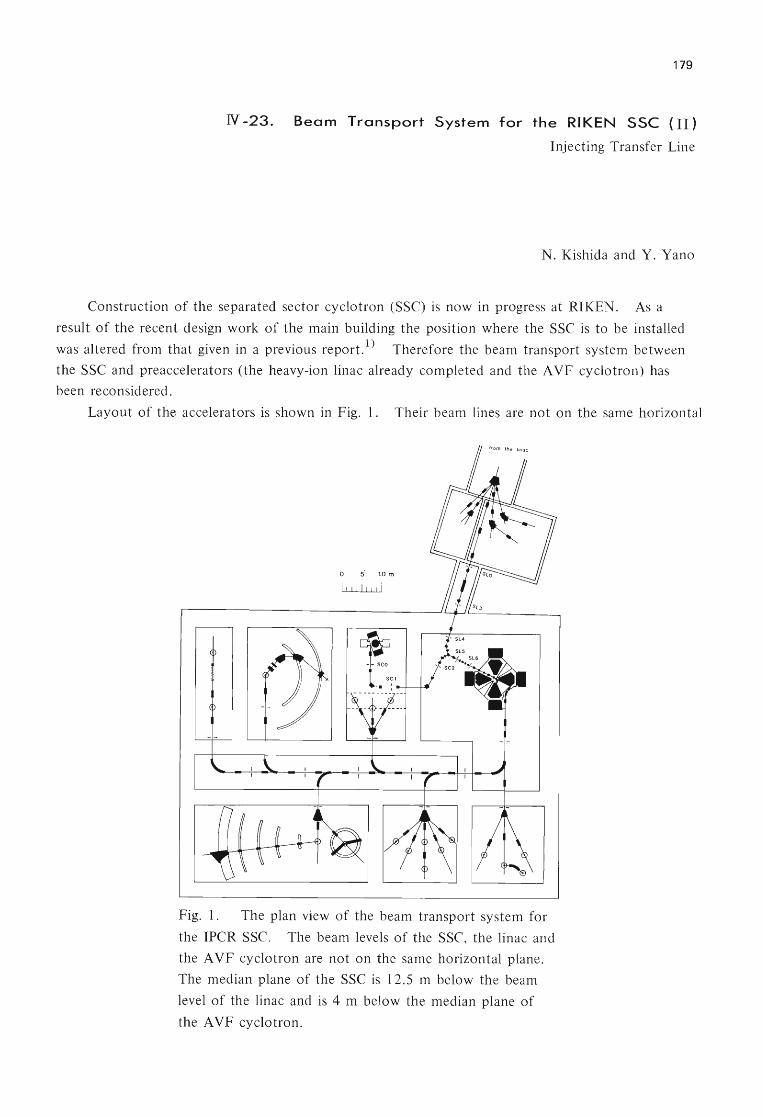
179
N -23. Beam Transport System for the RIKEN sse (II)
Injecting Transfer Line
N. Kishida and Y. Yano
Construction of the separated sector cyclotron (SSC) is now in progress at RIKEN. As a
result of the recent design work of the main building the position where the SSC is to be installed
was altered from that given in a previous report. 1 ) Therefore the beam transport system between
the SSC and pre accelerators (the heavy-ion linac already completed and the A VF cyclotron) has
been reconsidered.
Layout of the accelerators is shown in Fig. 1. Their beam lines are not on the same horizontal
Fig. 1. The plan view of the beam transport system for
the IPCR SSC. The beam levels of the SSC, the linac and
the A VF cyclotron are not on the same horizontal plane.
The median plane of the SSC is 12.5 m below the beam
level of the linac and is 4 m below the median plane of
the A VF cyclotron.
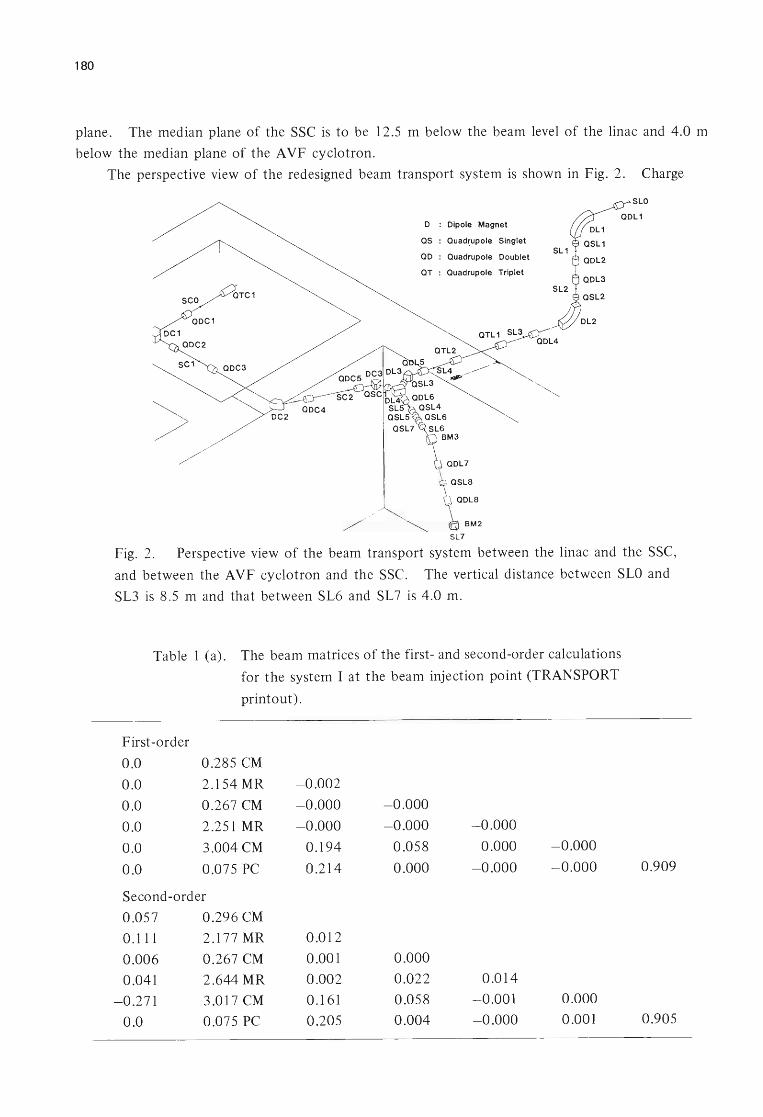
180
plane. The median plane of the SSC is to be 12.5 m below the beam level of the linac and 4.0 m
below the median plane of the A VF cyclotron.
The perspective view of the redesigned beam transport system is shown in Fig. 2. Charge
SCO
QOC1
DC1 QDC2
SC1
>
QTC1
o : Dipole Magnet
QS : Quad~upoJe Singlet
QD : Quadrupole Doublet
QT : Quadrupole Triplet
SL7
SLO
Fig. 2. Perspective view of the beam transport system between the linac and the SSC,
and between the A VF cyclotron and the SSC. The vertical distance between SLO and
SL3 is 8.5 m and that between SL6 and SL 7 is 4.0 m.
Table 1 (a). The beam matrices of the first- and second-order calculations
for the system I at the beam injection point (TRANSPORT
printout).
First-order
0.0 0.285 CM
0.0 2.154 MR - 0.002
0.0 0.267 CM -0.000 -0.000
0.0 2.251 MR -0.000 - 0.000 -0.000
0.0 3.004 CM 0.194 0.058 0.000 -0.000
0.0 0.075 PC 0.214 0.000 -0.000 - 0.000 0.909
Second-order
0.057 0.296 CM
0.111 2.177 MR 0.012
0.006 0.267 CM 0.001 0.000
0.041 2.644 MR 0.002 0.022 0.014
- 0.271 3.017 CM 0.161 0.058 - 0.001 0.000
0.0 0.075 PC 0.205 0.004 -0.000 0.001 0.905

Table 1 (b). The beam matrices of the first- and second-order calculations
for the system II at the beam injection point (TRANSPORT
printout).
First-order
0.0 0.285 eM
0.0 2.154 MR -0.002
0.0 0.267 CM -0.000 0.000
0.0 2.251 MR -0.000 0.000 0.000
0.0 3.995 CM 0.156 -0.078 - 0.000 -0.000
0.0 0.075 PC 0.214 -0.000 - 0.000 -0.000
Second ~rder
0.080 0.301 CM
-0.526 2.238 MR -0.055
0.001 0.274 CM 0.001 -0.002
0.000 2.756 MR -0.002 -0.002 0.041
- 0.520 4.013 CM 0.141 - 0.045 -0.000 -0.000
0.0 0.075 PC 0.222 0.004 0.000 -0.000
181
0.755
0.752
stripping and charge selection parts are installed between SLO and SL3 and between SCO and SC 1
to decrease the magnetic rigidity of preaccelerated ions and to increase the attainable maximum
energy of the SSC. The transverse phase-space matching is performed in the section between SL5
and SL6 , where the beam is achromatic. The dispersive beam from the AVF cyclotron is
achromatized through the section between SC 1 and SC2. In the following explanation we refer
to the beam transport system from the linac (the AVF cyclotron) to the SSC as system I (system
II). The calculation of ion-optics in this system has been made to the second-order with the aid
of the computer program TRANSPORT.2) Table 1 presents the beam parameters (TRANSPORT
outputs) at the beam injection point to the extent of the first- and second-order calculations for
the system I and II. The ratios of the phase-space area of the first-order calculations to that of
the second-order ones are tabulated in Table 2.
Table 2. The ratios of the phase-space area of the
first-order calculations to that of the second
order ones for the system I and II at the beam
injection point.
System I
System II
On midplane
1.05
1.10
Off midplane
1.17
1.26

182
It is found that the first moments of the beams (centroid shift) are negligibly small.
Furthermore the extents of the enlargements of the phase-space ellipses will give no troubles for
the beam acceleration in the SSC.
The full discussion of this work has been published in Ref. 3.
References
1) N. Kishida, Y. Yano, and T. Wada: Sci. Papers I.P.C.R., 74, 105 (1980).
2) K.L. Brown, F. Rothacker, D.C. Carey, and C. Iselin: SLAC Report, No. 91, Rev. 1(1974).
3) N. Kishida and Y. Yano: Sci. Papers I.P.C.R.,]!i, 214 (1981).
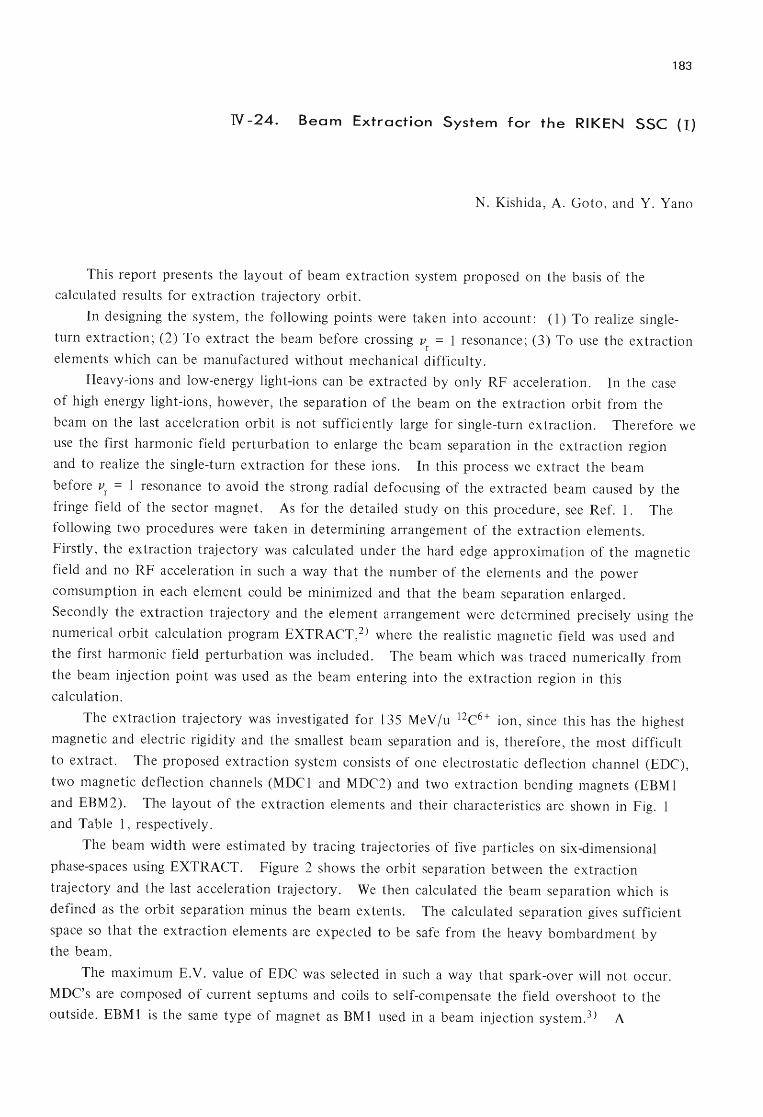
183
N -24. Beam Extraction System for the RIKEN sse (I)
N. Kishida, A. Goto, and Y. Yano
This report presents the layout of beam extraction system proposed on the basis of the
calculated results for extraction trajectory orbit.
In designing the system, the following points were taken into account: (1) To realize single
turn extraction; (2) To extract the beam before crossing v = 1 resonance; (3) To use the extraction r
elements which can be manufactured without mechanical difficulty.
Heavy-ions and low-energy light-ions can be extracted by only RF acceleration. In the case
of high energy light-ions, however, the separation of the beam on the extraction orbit from the
beam on the last acceleration orbit is not suffici ently large for single-turn extraction. Therefore we
use the first harmonic field perturbation to enlarge the beam separation in the extraction region
and to realize the single-turn extraction for these ions. In this process we extract the beam
before v = 1 resonance to avoid the strong radial defocusing of the extracted beam caused by the r
fringe field of the sector magnet. As for the detailed study on this procedure, see Ref. 1. The
following two procedures were taken in determining arrangement of the extraction elements.
Firstly , the extraction trajectory was calculated under the hard edge approximation of the magnetic
field and no RF acceleration in such a way that the number of the elements and the power
comsumption in each element could be minimized and that the beam separation enlarged.
Secondly the extraction trajectory and the element arrangement were determined precisely using the
numerical orbit calculation program EXTRACT,2) where the realistic magnetic field was used and
the first harmonic field perturbation was included. The beam which was traced numerically from
the beam injection point was used as the beam entering into the extraction region in this
calculation.
The extraction trajectory was investigated for 135 Me V lu 12C6+ ion, since this has the highest
magnetic and electric rigidity and the smallest beam separation and is , therefore , the most difficult
to extract. The proposed extraction system consists of one electrostatic deflection channel (EDC) ,
two magnetic deflection channels (MDC 1 and MDC2) and two extraction bending magnets (EBM 1
and EBM2). The layout of the extraction elements and their characteristics are shown in Fig. 1
and Table I , respectively.
The beam width were estimated by tracing trajectories of five particles on six-dimensional
phase-spaces using EXTRACT. Figure 2 shows the orbit separation between the extraction
traj ectory and the last acceleration traj ectory . We then calculated the beam separation which is
defined as the orbit separation minus the beam extents. The calculated separation gives sufficient
space so that the extraction elements are expected to be safe from the heavy bombardment by
the beam.
The maximum E.V. value of EDC was selected in such a way that spark-over will not occur.
MDC's are composed of current septums and coils to self-compensate the field overshoot to the
outside. EBMI is the same type of magnet as BMI used in a beam injection system. 3 ) A
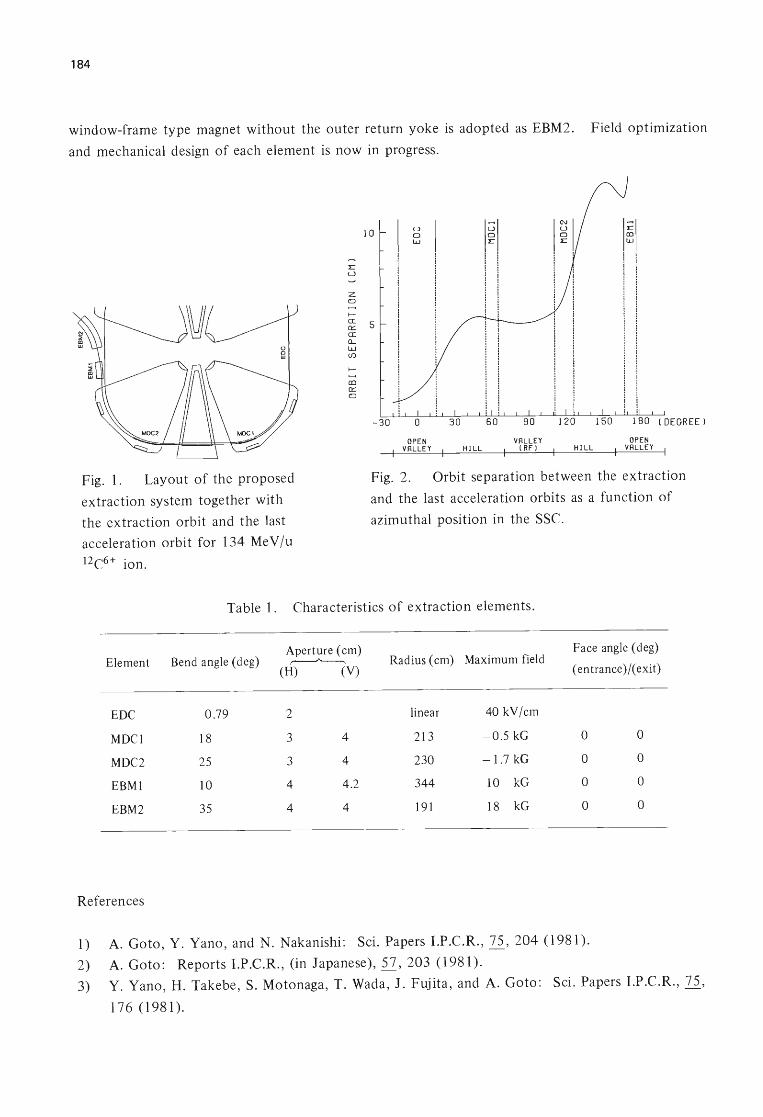
184
window-frame type magnet without the outer return yoke is adopted as EBM2. Field optimization
and mechanical design of each element is now in progress.
Fig. 1. Layout of the proposed
extraction system together with
the extraction orbit and the last
acceleration orbit for 134 Me V lu 12e6+ ion.
~
L U
Z <::) ....... t-CI 0::: CI a.... w (f)
t-....... co 0::: <::)
10 u CJ w
5
-30
OPEN VALLEY HILL
I~I ! i i i I 1
i i i i ! i . :
VALLEY IRFJ HILL
~I I i
i (DEGREE)
OPEN VALLEY I
Fig. 2. Orbit separation between the extraction
and the last acceleration orbits as a function of
azimuthal position in the sse.
Table 1. Characteristics of extraction elements.
Element
EDC
MDCl
MDC2
EBMI
EBM2
References
Bend angle (deg)
0.79
18
25
10
35
Aperture (cm) ~
(H) (V)
2
3
3
4
4
4
4
4.2
4
Radius (cm) Maximum field
linear
213
230
344
191
40 kV/cm
- 0.5 kG
- 1.7 kG
10 kG
18 kG
F ace angle (deg)
(entrance )/( exit)
o
o o
o
o o o
o
1) A. Goto, Y. Yano, and N. Nakanishi: Sci. Papers I.p.e.R., 75, 204 (1981).
2) A. Goto: Reports I.p.e.R., (in Japanese), 57, 203 (1981).
3) Y. Yano, H. Takebe, S. Motonaga, T. Wada, J. Fujita, and A. Goto: Sci. Papers I.p.e.R., 75,
176 (1981).

185
N -25. Model Study of Magnetic Inflection Channel for the SSC
H. Takebe, Y. Yano, S. Motonaga, T. Wada,
J. Fujita, Y. Ikegami, and M. Hosoyama
A couple of magnetic inflection channels (MIC 1 and MIC2) , which are used as the beam injection elements
for the SSC , are inserted into a 50 mm available gap between the sector magnet poles. 1) They have to give field
increases in ratios (Ao) of 8 % (MIC 1) and 23 % (MIC2), respectively , to the sector field. They have not to give
a large disturbance to the sector field.
A basic design of the MIC was made by using a computer code Trim.2) We constructed a straight-shaped
I/l-scale model and tested it in the gap of an H-type magnet, which was a 1/3-scale model of the present 160 cm
ordinary type cyclotron. The gap length was modified to 80 mm from 87 mm by placing a 7 mm thick iron plate
on the lower pole.
A photograph of a top view of the model MIC is shown in Fig. 1, and a cross sectional view in Fig. 2. The
iron shims are replaceable and their thickness can be selected to be 1 mm , 3 mm , and 5 mm. Four turns of the
coils are divided into two pairs, each of which has two turns. The inner two turns compose coil A and the outer
ones coil B. The compensation coil of four turns are wound on the left side of the MIC. The coils and iron shims
are contained in a brass coil holder.
The coils are made of a 9 mm X 9 mm copper hollow conductor which has a water path of 6 mm in
diameter. At the maximum current of 3 kA , the flow rate of cooling water amounts up to about 10 e/min to
keep the coil temperature at a moderate value. The conductors are insulated by Kapton film .
The magnetic field was measured by Hall generators of BHT -910 series (F.W. Bell Inc.). Three Hall
generators were placed at intervals of 6 mm on a Hall assembly, as is shown in Fig. 3. As the temperature of the
Fig. 1. A top view of the model MIC,
which has a straight shape of 230 mm in
length. The MIC coils are wound on the
right side.
Compensation coil ,----A-----,
Iron shim
MIC coil / Copper hollow conductor ~/, 9x9-6¢
rT""''''~~~~~--r'C...".....,......,......,.~...".....,."""","*~ Insula tor
r--..:...:::......-+--_~ __ --t--------'3"-".5_'----l Brass coil hal der
I I ) -9 9 rrrn 41 X-direc ti on
Fig. 2. Cross section of the Ill-scale model MIC; dimensions
in mm. Middle two turns of the MIC coils compose coil A,
and top and bottom ones coil B.
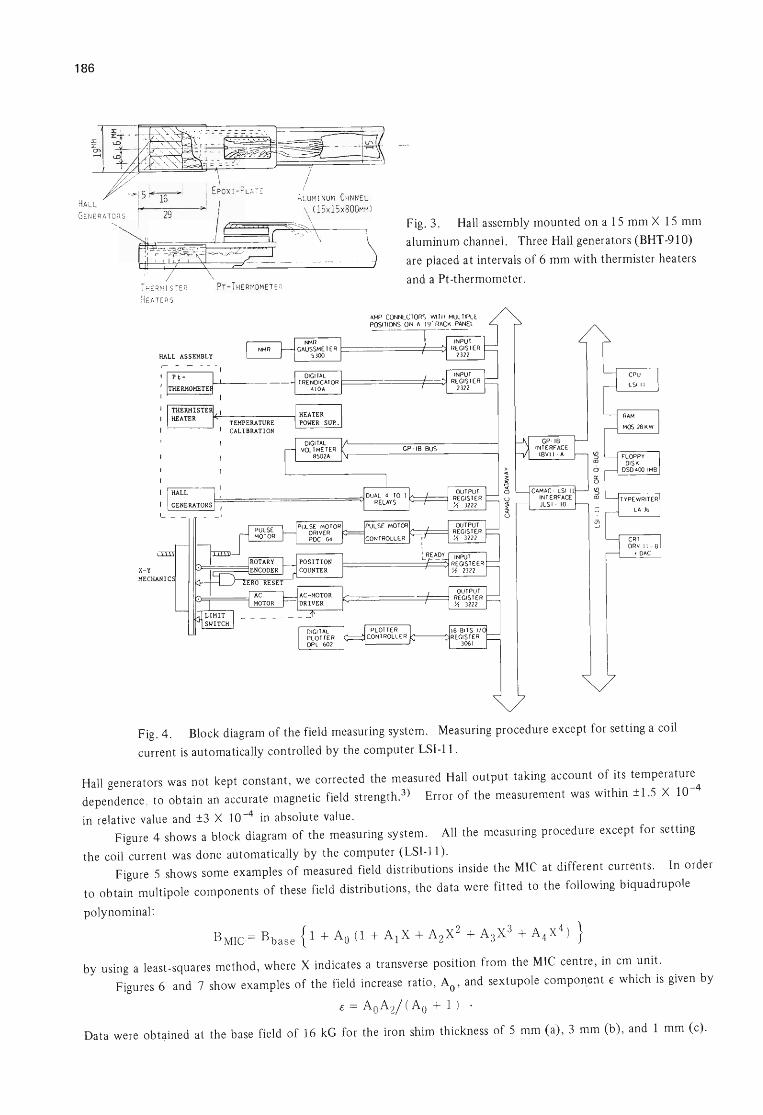
186
T H E R~' I STE R
HEATERS
PT -THERr10METER
x-Y
HALL ASSEMBLY
,- - - - - -I
: 1~~O~TEJ1--'-1 - --I I
TEMPERATURE I CALIBRATION
ALUMINU~' CHN NEL
\ (l5x15x800Mr-,)
Fig. 3. Hall assembly mounted on a 15 mm X 15 mm
aluminum channel. Three Hall generators (BHT -910)
are placed at intervals of 6 mm with thermister heaters
and aPt-thermometer.
Fig. 4. Block diagram of the field measuring system. Measuring procedure except for setting a coil
current is automatically controlled by the computer LSI-II.
Hall generators was not kept constant, we corrected the measured Hall output taking account of its temperature
dependence , to obtain an accurate magnetic field strength. 3) Error of the measurement was within ±1 .S X 10-4
in relative value and ±3 X 10 -4 in absolute value.
Figure 4 shows a block diagram of the measuring system. All the measuring procedure except for setting
the coil current was done automatically by the computer (LSI-II).
Figure S shows some examples of measured field distributions inside the MIC at different currents. In order
to obtain multipole components of these field distributions , the data were fitted to the following biquadrupole
polynominal:
by using a least-squares method, where X indicates a transverse position from the MIC centre, in cm unit.
Figures 6 and 7 show examples of the field increase ratio, Ao ' and sextupole compon.ent € which is given by
c. = Ao A 2/ ( Ao + 1 ) .
Data were obtained at the base field of 16 kG for the iron shim thickness of 5 mm (a) , 3 mm (b) , and I mm (c).
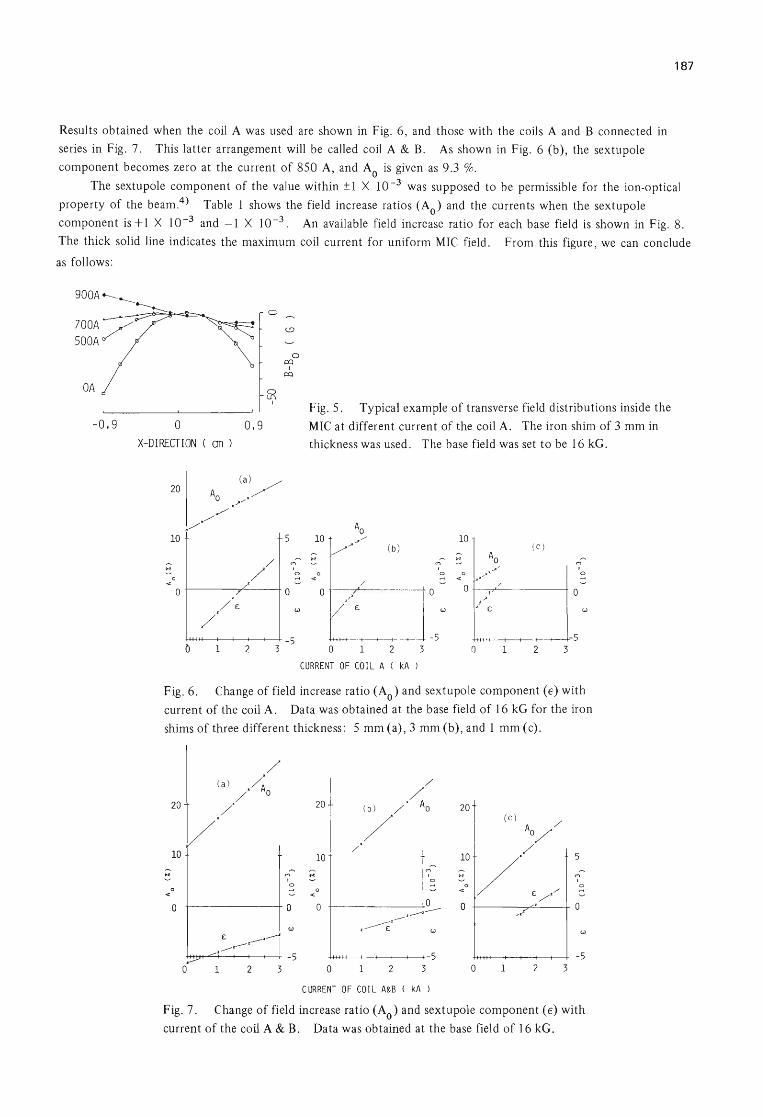
Results obtained when the coil A was used are shown in Fig. 6, and those with the coils A and B connected in
series in Fig. 7. This latter arrangement will be called coil A & B.. As shown in Fig. 6 (b) , the sextupole
component becomes zero at the current of 850 A, and Ao is given as 9.3 %.
187
The sextupole component of the value within ± 1 X 10⁻³ was supposed to be permissible for the ion-optical
property of the beam.4) Table 1 shows the field increase ratios (Ao) and the currents when the sextupole
component is + 1 X 10⁻³ and -1 X 10 -3. An available field increase ratio for each base field is shown in Fig. 8.
The thick solid line indicates the maximum coil current for uniform MIC field. From this figure, we can conclude
as follows:
900A __ ______.
----- c
700A/ 50DA
DA
-0.9 o X-DIRECTION ( an )
N
0 «
0 ,/
/ £
/
0.9
/ / '
~ I
/
o 0::)
I 0::)
5
.... I 0
0
w
+t+H1-+-+---+--+---+--+ - 5 012 3
Fig. 5. Typical example of transverse field distributions inside the
MIC at different current of the coil A. The iron shim of 3 mm in
thickness was used. The base field was set to be 16 kG.
10 10 (b )
Ao .... N
(c) .... ...,
. -' ,
I
1
0 «
0 . ... ..... ___ _ _ -1. 0 0
J , " w £
0 .-<
0
W
« 0
/
0 ",
/ £
+H+<I-+--+--+---+---+--+ - 5 -5 o 1 3 o 2 3
CURRENT OF COIL A ( kA )
Fig. 6. Change of field increase ratio (Ao) and sextupole component (e) with
current of the coil A. Data was obtained at the base field of 16 kG for the iron
shims of three different thickness: 5 mm (a), 3 mm (b), and 1 mm (c).
/ (a) '/~o
20
1
/
,/ / 20 / (b ) / Ao 20
V / (c )
/ Ao/
10 / 1 /
10
I ~~ 10
/ 5
N .... N N .... I 0
I
0 0 < 0
,/ 0
< « c / ,
0 0 0 .0 0 0
'-'1-- "r'
w , --------E w w £ ,---'-'~ i
."----5 -5 -5
0 2 3 0 1 2 3 0 1 2 3
CURRENT OF COI L A&B ( kA )
Fig. 7. Change of field increase ratio (Ao) and sextupole component (e) with
current of the coil A & B. Data was obtained at the base field of 16 kG.

188
Fig. 8. Field increase ratio (Ao) corresponding to the case of
E = ± 1 X 10⁻³ at different base-field strengths (Bb ) . Data were ase
obtained for coil A (a) and coil A & B (b). The shaded region
o 6 indicates the values of Ao which can be changed independently
THICKNESS OF IRON SH IM (MM) of the base field under the condition of -1 X 10⁻³ < E < 1 X 10 -3 .
Table 1. Field increase ratios corresponding to the case of E = +10 - 3 and -10-3 .
Coil A
Iron shim 5mm 3mm Imm ~ (kG) E + 1 X 10⁻³ - 1 X 10⁻³ +1 X 10⁻³ - 1 X 10⁻³ +1 X 10⁻³ - 1 X 10⁻³
( 18.5% 16.2 10.4 8.4 3.8 1.8 6.209 t 660A 390A 380A 150A 230A OA
~ 19.1 16.7 10.7 8.6 5.0 1.8 ]0.022
580A \. 1200A 770A 670A 270A OA
{ 19.0 16.6 10.7 8.5 4.8 2.3 12.924
1600A ]OOOA 880A 330A 680A 90A
{ 18.4 16.3 10.2 8.4 5.0 2.7 16.017
2150A 1450A 1150A 550A 950A 300A
Coil A & B
Iron shim 3mm Imm ~ (kG) E + 1 X ] 0-3 0.0 - 1 X 10⁻³ +1 X 10⁻³ - 1 X 10⁻³
{ 38 .0% 19 .4 31.7 6.8 6.209
2000A 760A 2000A 330A
{ (38.2) 25.2 23.0 13.4 10.022
3400A 1940A 2300A 1220A
~ (38.7) 30.8 22.5 19.0 12.4 12.924
\. 3900A 2800A 1660A 2400A 1450A
( (37) (28.5) 20.0 14.5 9.3 16.017 t 5500A 3700A 2400A 2350A 1320A

189
The MICI should be composed of 2.6 mm thick iron shim and the coil A in order to get the field increase
ratio of 8 %. The optimum current at base field of 16 kG is estimated to be 800 A.
On the other hand , MIC2 needs the field increase ratio of 23 %. Then it is necessary to use a 6 mm thick
iron shim and the coil A. The maximum current is estimated to be about 2800 A. However it is also possible
to use a 2.2 mm thick iron shim and the coil A & B. The maximum current is estimated to be of a similar value.
The ampere-turns for the latter is twice as large as those for the former.
A disturbance outside the MIC and an effective field boundary change of the MIC are discribed elsewhere. S)
References
1) A. Goto , Y. Yano , T. Wada, and N. Nakanishi: Sci. Papers I.P.C.R. , 74, 124 (1980).
2) J.S. Colonais and J .H. Porst: Magnet Design Applications of the Magnetostatic Problem , called TRIM
UCRL-16382 (1965).
3) H. Takebe, Y. Yano, T. Wada , J. Fujita , Y. Obana, and S. Motonaga: IPCR Cyclotron Progr. Rep. , 14, 176
(1980) .
4) Y. Yano: Sci. Papers I.P.C.R., 74, 13 (1980).
5) H. Takebe , Y. Yano , S. Motonaga, T . Wada , J. Fujita, and Y . Ikegami: ibid. , 75, 193 (1981).
190
N -26. Calculation of RF Electromagnetic Field
by Finite Element Method
M. Hara, T. Wada, and F. Kikuchi
In designing the RF resonators for accelerators, it is usual to evaluate RF characteristics on the basis of
transmission line approximation or to depend on the experiments with scale models. Because the transmission line
approximation is essentially one dimensional one, it is not useful to estimate the field distribution along the
accelerating gap and to estimate the microscopic current density. In the model studies, it takes long time and
requires large expense to build models.
In order to get a detailed analysis, we are now developing a computer code to calculate the electromagnetic
field in an arbitrary three dimensional cavity resonator. As a first step we have developed two computer codes to
evaluate the resonance frequency, electromagnetic field and other pertinent quantities by solving directly the
Maxwell equations using finite element method.1) One is for the field in a straight resonator with arbitrary cross
section (H2DB) and the other for the axisymmetric field (HAX). In the former, scalar Helmholtz equation
is solved with Dirichlet and/or Neumann boundary conditions. In the latter, axisymmetric Helmholtz equation
a 1 a a2He 2 ---(rHe) + -- +k H 0 ar r ar az 2 e
is solved with Dirichlet and/or Neumann boundary conditions. In both cases, these equations reduce to the
eigenvalue problems and both E and H modes can be treated. Resonance frequencies can be obtained from the
eigenvalues, and the electromagnetic fields can be obtained from the eigenvectors or the derivatives of the
eigenvectors. Several automatic mesh generation programs (MESH2D) are also developed for several typical
problems. Using plot program (H2DPLOT), calculated results are displayed by the lines of electric or magnetic
force. These codes, H2DB and HAX, are checked by calculating simple cases which can be solved analytically.
For the axisymmetric case, calculated results by HAX are also compared with those by SUPERFISH.2 ) As for
the resonance frequency and the pattern of the lines of electric force, sufficient agreement is confirmed between
HAX and SUPERFISH. The computation time by the code HAX was shorter than that by the code SUPERFISH.
Figure 1 shows the calculated results for single gap type resonator for the RIKEN SSe. Cut-off frequency
and the RF electric field distribution along the accelerating gap are shown.
Recently, radio frequency quadrupole (RFQ) linear accelerator has attached much attention because of new
focusing, bunching and accelerating structure. Model tests for the RFQ linac resonator were done at the Institute
for Nuclear Study,3) and we calculated the resonance frequencies and the lines of electric force. Figure 2 shows
the results.
Alvarez type linac resonator was also investigated and the results are shown in Fig. 3.
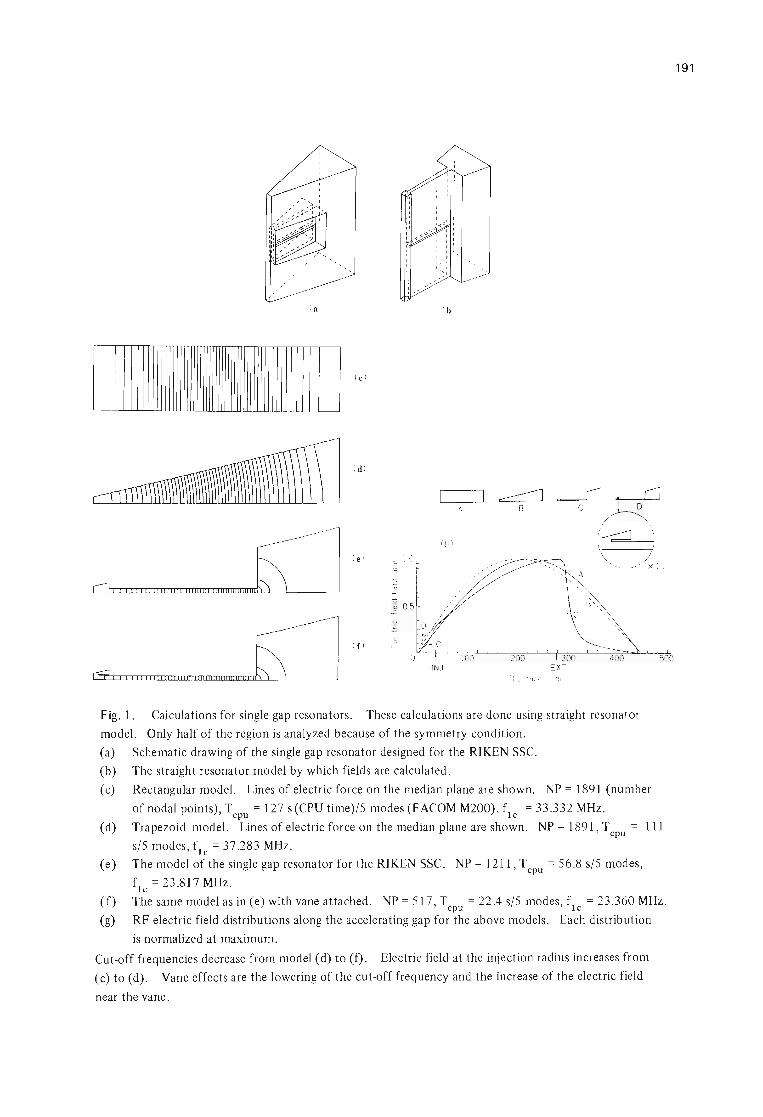
I r 1 "./ 1
" I
: '
( a ) ( h )
I 11111111111111111111111111111111111111111111111111 I ( c 1
( d l
~ c1 r1 A B C
@IC c"",ygoggggyygoyggggyggggggggygg""""""yU
( 9)
( e i -= 1. 0 c ::>
-e '"
rJ'y y y""gggg,ggggggggyggggygggg"q""""",yU
u
u ClJ
( fl w
500 INJ
DI S I'lnC~ ( e m )
Fig. 1. Calculations for single gap resonators. These calculations are done using straight resonator
model. Only half of the region is analyzed because of the symmetry condition.
(a) Schematic drawing of the single gap resonator designed for the RIKEN SSC.
(b) The straight resonator model by which fields are calculated.
(c) Rectangular model. Lines of electric force on the median plane are shown. NP = 1891 (number
of nodal points), T = 127 s (CPU time)/5 modes (FACOM M200), fl = 33.332 MHz. cpu c
(d) Trapezoid model. Lines of electric force on the median plane are shown. NP = 1891, T = III cpu
(e)
(f)
(g)
siS modes, ftc = 37.283 MHz.
The model of the single gap resonator for the RIKEN SSC. NP = 1211, T = 56.8 siS modes, cpu f1c
= 23 .817 MHz.
The same model as in (e) with vane attached. NP = 517, T = 22.4 siS modes, fl = 23.360 MHz. ~u c
RF electric field distributions along the accelerating gap for the above models . Each distribution
is normalized at maximum.
Cut-off frequencies decrease from model (d) to (f). Electric field at the injection radius increases from
(c) to (d). Vane effects are the lowering of the cut-off frequency and the increase of the electric field
near the vane.
191
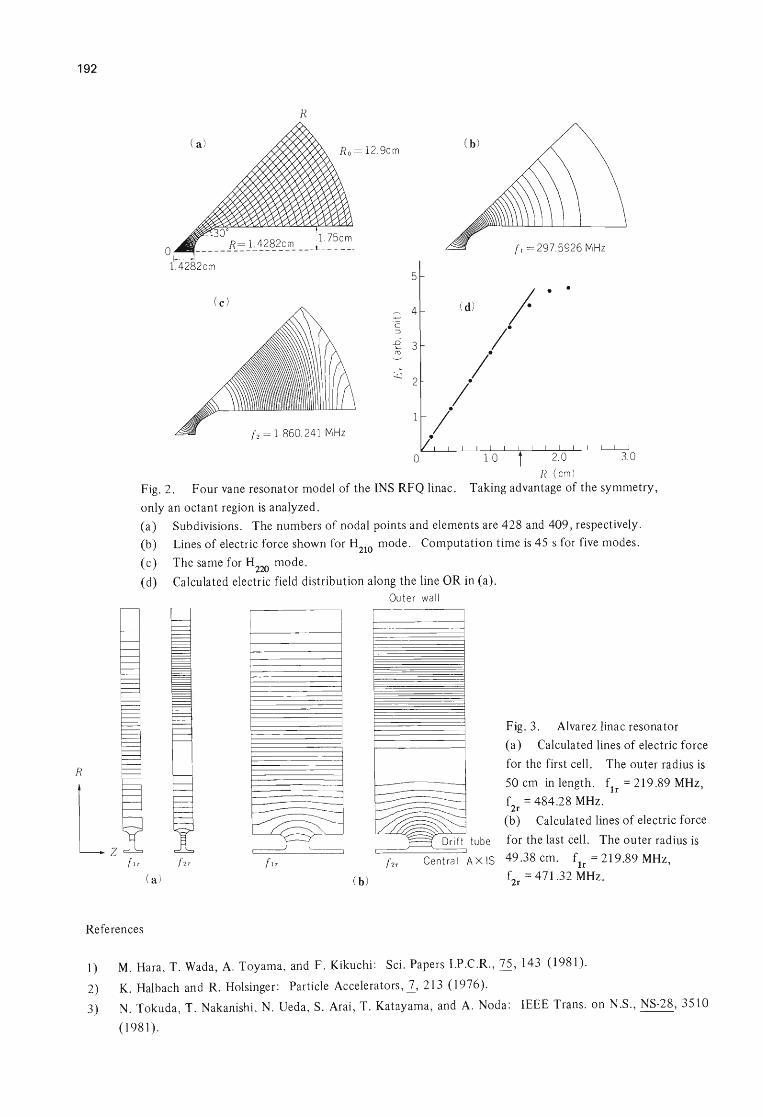
192
R
R
o (1 = 297.5926 MHz
1.4282em 5
•
4
--e 3 CD
cJ 2
( 2 = 1 860.241 MHz
R ( em)
Fig. 2. F our vane resonator model of the INS RFQ linac. Taking advantage of the symmetry,
only an octant region is analyzed.
(a) Subdivisions. The numbers of nodal points and elements are 428 and 409, respectively.
(b) Lines of electric force shown for H210 mode. Computation time is 45 s for five modes.
(c) The same for H220 mode.
(d) Calculated electric field distribution along the line OR in (a). Outer wa ll
r---- -t===:::- ~
~ (zr Central AXIS
References
Fig. 3. Alvarez linac resonator
(a) Calculated lines of electric force
for the first cell. The outer radius is
50 cm in length. fIr = 219.89 MHz,
f2r = 484.28 MHz.
(b) Calculated lines of electric force
for the last cell. The outer radius is
49.38 cm. f = 21989 MHz lr . ,
f2r = 471.32 MHz.
1) M. Hara, T. Wada, A. Toyama, and F. Kikuchi: Sci. Papers I.P.C.R., 75, 143 (1981).
2) K. Halbach and R. Holsinger: Particle Accelerators, 2, 213 (1976).
3) N. Tokuda, T. Nakanishi, N. Ueda, S. Arai, T. Katayama, and A. Noda: IEEE Trans. on N.S., NS-28 , 3510
(1981).

193
N -27. Model Study of RF Resonator for the RIKEN sse
K. Ogiwara , M. Rara , and T. Fujisawa
The resonator for the RIKEN sse is required to work in the frequency range of 17 to 45 MHz
at the voltage of 250 kV (Maximum). In this resonator , the radial distribution of dee voltage is
desired to be constant or radially increasing in order to realize good beam quality. The radial
length of the accelerating gap should be more than 2.6 m corresponding to injection and extraction
radji. In order to find the best structure of the resonator that satisfies the above conditions,
calculations with transmission line approximation were carried out for half wave-length type
resonator. From the calculations, it was found that the resonator satisfies the above conditions.
On the basis of these calculations, a half scale model was constructed and the resonance frequencies ,
Q-values and radial distributions of RF electric field at the accelerating gap were measured.l) To
realize good radial distribution of RF electric field at the accelerating gap and also to make the
size of the resonator small, earth panels were attached in the model resonator. Figure I shows
the schematic view of the earth panels inside the model resonator. The resonance frequencies ,
Q-values and the radial distributions of RF electric field at the accelerating gap were measured.
Figure 2 shows the radial distributions of RF electric field at the accelerating gap measured by
perturbation method. 2) Fairly good radial distributions were obtained at low frequencies (less than
50 MHz for the model) when the earth panels were used.
Ou te r co nduc tor
Short pla te
Pic k up Stem loop
o N (Y)
A' o o co (Y)
Sect ion A- A'
Fig. 1. Schematic view of the earth panels inside the model
resonator. The earth panels were made of 0.3 mm- thick copper
plates .
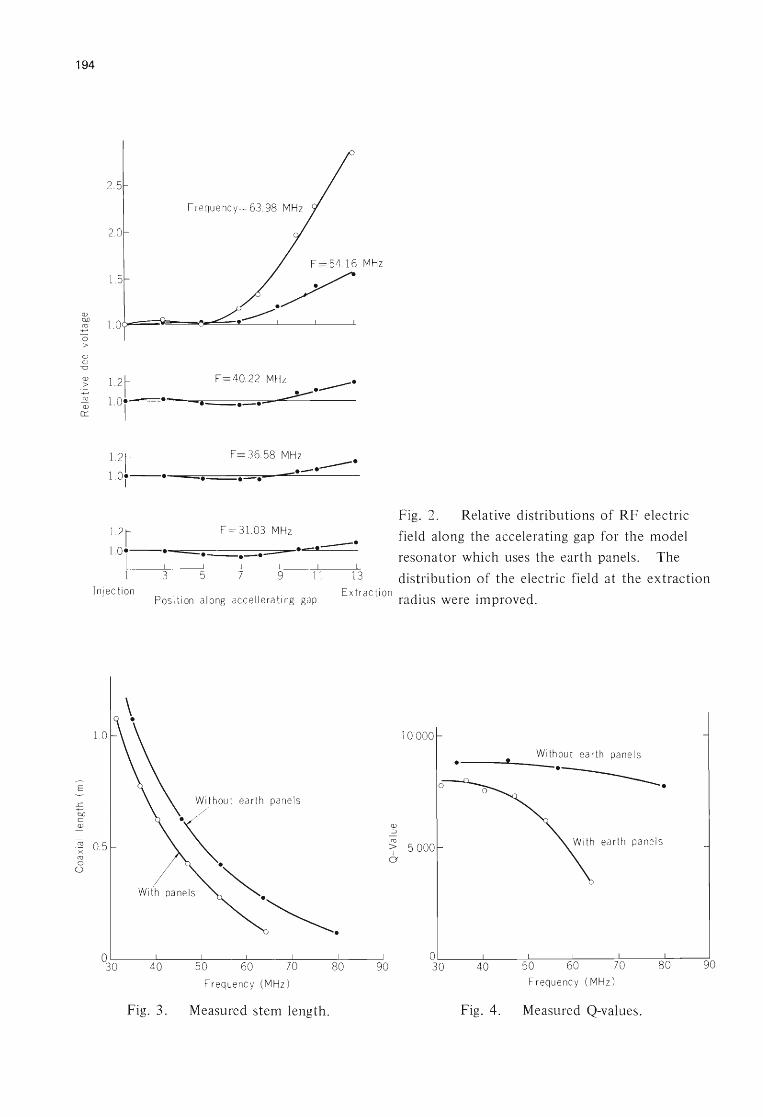
194
2.5
Frequency = 63.98 MH z
2.0
1.5
Q)
.& 1.0o-==",~~~~=~------.l--~--------.l
o > Q) Q)
-0
Q)
>
~ Q)
0:::
1. 2 ~ F=40.22 MHz •
I ~.----1. 0r-=·=--""~--.=---==.=""'-""""'------
121 F=36.58 MHz · ----. 10.----.---===~~===---~~·----·------· I •• •
F = 31. 03 MH z 12r 1 0.----.--==~----~--,·~·-----· · I I ~-~-.~
I I
1 3 5 7 9 11 13
Fig. 2. Relative distributions of RF electric
field along the accelerating gap for the model
resonator which uses the earth panels. The
distribution of the electric field at the extraction I njec ti on
Pos i t ion along acc ell era ting gap Extract ion. .
radIUS were Improved.
1.0
E
-:5 earth panels
no c Q)
.~ 0.5 >< <tl 0
U
With pane ls
~~0----~----~----7-----~----~--~
Frequency (MH z)
Fig. 3 . Measured stem length.
Q) :::)
<tl
10000
With out ea rth pa nels .---.... ~-~ .------------•
~ 5000 a
OL-____ L-__ ~L---~~--~~----~--~ 30 40 80 90
Freq uency ( MHz )
Fig. 4. Measured Q-values.

195
Figure 3 shows the stem length as a function of radio frequency. The stem length could be
reduced by about 40 cm in this model by using the earth panels. This is equal to the 80 cm
reduction in full-scale resonator.
Figure 4 shows the frequency dependence of the Q-values. The Q-value has maximum value
at the lowest frequency when the earth panels are used and makes slow decrease as the frequency
increases as shown in Fig. 4. From the result of these measurement, it was found that a half-wave
type resonator using the movable shorting plates along with movable earth panels for frequency
variation is desirable.
References
1) M. Hara, K. Ogiwara, and T. Fujisawa: IPCR Cyclotron Progr. Rep., 14, 182 (1980) .
2) L.C. Maier, Jr. and J.C. Slater: J. Appl. Phys., 23, 68 (1952).

196
N -28. New Method to Vary Resonant Frequency of
Resonator for sse
T. Fujisawa
The resonator for the IPCR SSC has been designed and the results of study by a model have
, been reported previously.1) The resonator designed, however, has some disadvantages as follows:
1) The height of the resonator is very high (7 m).
2) The distance which the shorting plate must travel is long (2 m) . Consequently , the total
length of resonator including the mechanism to move the shorting plate becomes more than 11 m.
3) The maximum current density at the contact fingers of the shorting plate is estimated to
be 70 A/cm at V dee (voltage of dee) = 250 kV for 45 MHz. It is difficult to fabricate the fingers
which endure such high current density.
Therefore, a new method to vary the resonant frequency is investigated. In Fig. 1, the new
type resonator is shown. The resonant frequency is varied from 17 MHz to 45 MHz by moving
the "movable box". The box does not make contact with the stem but contact only with the
outer wall.
I B
A- A Cross sect ion
o ~ Movab le
o (Y)
box
I I I I I I! ! ! I I B- B Cross sec ti on o 1000
Fig. 1. Schematic view of the new type
resonator.
The gap between the stem and box is 4 cm. This resonator has following merits:
1) The height is less than 3 m.
2) The distance which the box is moved is short (0.6 m).
3) The contact fingers are not at the location where the current density is maximum.
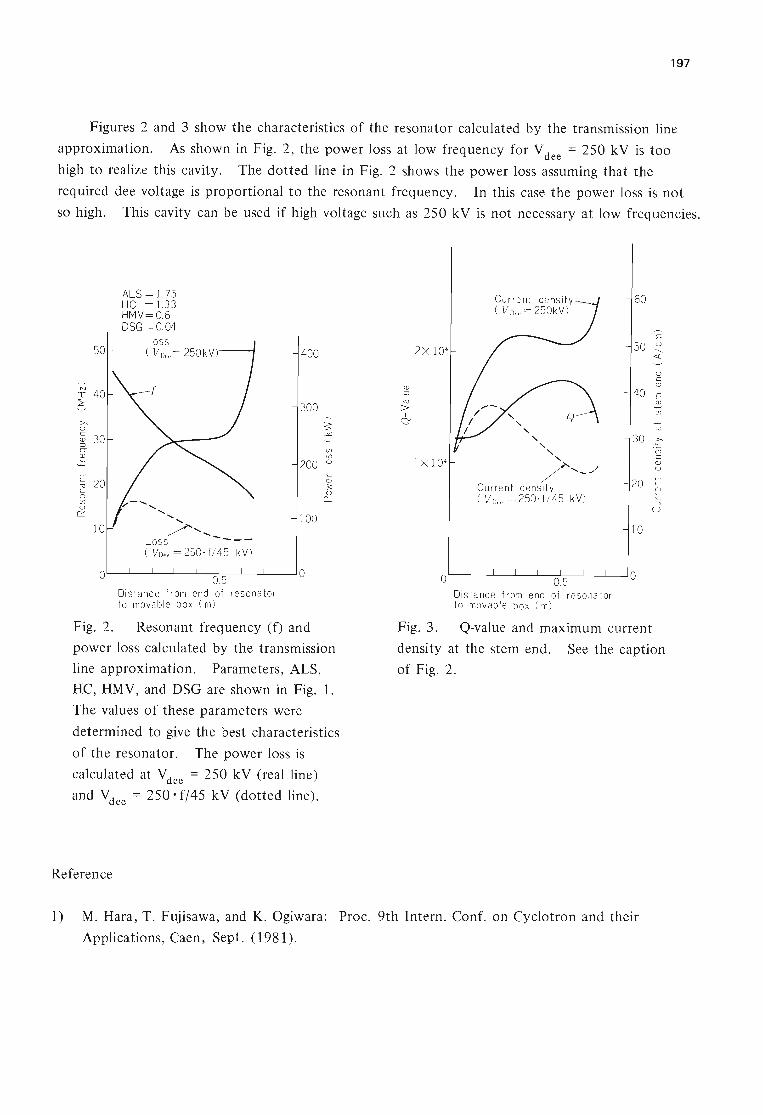
197
Figures 2 and 3 show the characteristics of the resonator calculated by the transmission line
approximation. As shown in Fig. 2 , the power loss at low frequency for V dee = 250 kV is too
high to realize this cavity. The dotted line in Fig. 2 shows the power loss assuming that the
required dee voltage is proportional to the resonant frequency. In this case the power loss is not
so high. This cavity can be used if high voltage such as 250 kV is not necessary at low frequencies.
50
~ 20 c o (j)
<lJ 0:::
Fig. 2.
ALS = 1.75 He = 1. 33 HMV = 0.6 DSG=0.04
Loss ( VDee= 250kV)
.... - .......... ............
......
LOSS/ .......... ---( VDee = 250 · f / 45 kV )
Di stance from end of resonator to movable box (m )
400
300
(j) (j)
200 ~
100
<lJ ~ o
CL
Resonant frequency (f) and
power loss calculated by the transmission
line approximation. Parameters, ALS,
HC, HMV, and DSG are shown in Fig. 1.
The values of these parameters were
determined to give the best characteristics
of the resonator. The power loss is
calculated at Vdee = 250 kV (real line)
and Vdee = 250· f/45 kV (dotted line) .
Reference
2x 10⁴
<lJ
-=: <U
> I
Qj
1 X 10⁴
Curre nt de nsity ( V Dee = 250k V)
" " " " " " "-_/ / ...... /
Curren t density (V Dee = 250· f/ 45 kV)
Di stance from end of resonator to movable box (m)
60
E 50 u
------<t:
-0 C <lJ
40 E 2 (j)
~ 30 ?:;
(j)
C <lJ -0
20 C ~ ::J
U
10
Fig. 3. Q-value and maximum current
density at the stem end. See the caption
of Fig. 2.
1) M. Hara, T. Fujisawa, and K. Ogiwara: Proc. 9th Intern. Conf. on Cyclotron and their
Applications, Caen , Sept. (1981).
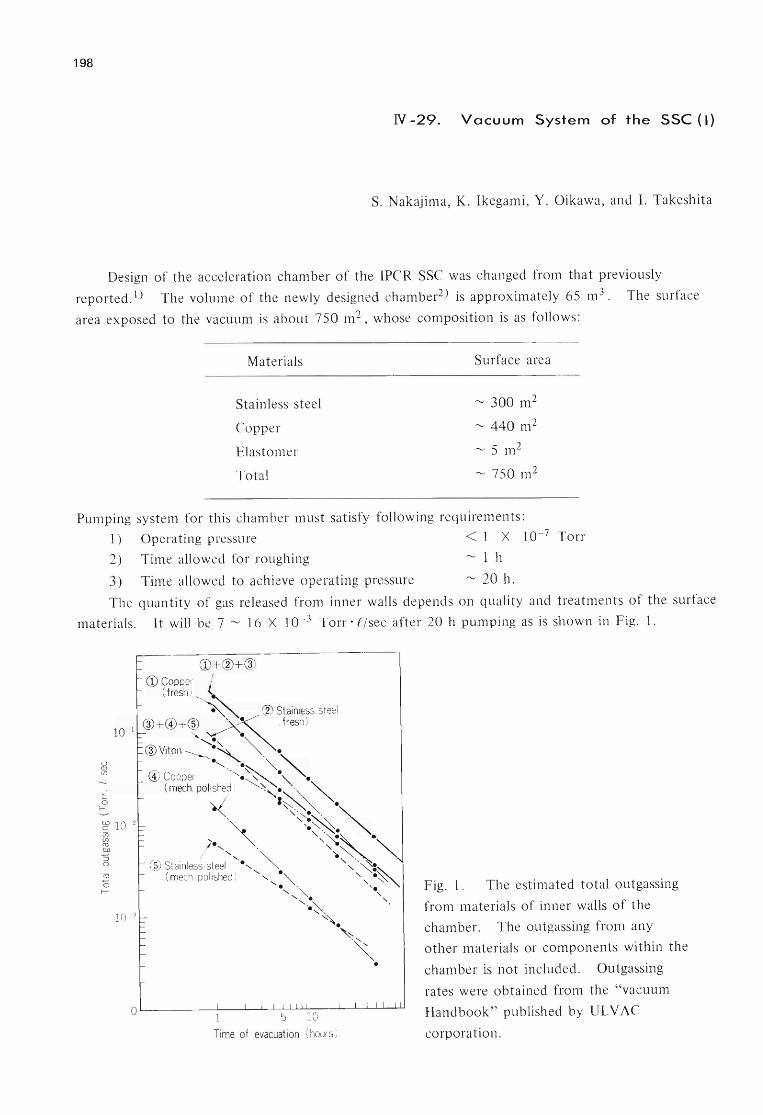
198
N -29. Vacuum System of the sse (I)
S. Nakajima, K. Ikegami, Y. Oikawa, and I. Takeshita
Design of the acceleration chamber of the IPCR SSC was changed from that previously
reported. 1) The volume of the newly designed chamber2 ) is approximately 65 m 3 . The surface
area exposed to the vacuum is about 750 m2 , whose composition is as follows:
Materials Surface area
Stainless steel "-' 300 m2
Copper "-' 440 m2
Elastomer ~ 5 m2
Total ~ 750 m2
Pumping system for this chamber must satisfy following requirements:
1) Opera ting pressure < 1 X 10 -7 Torr
2) Time allowed for roughing "-' 1 h
3) Time allowed to achieve operating pressure "-' 20 h.
The quantity of gas released from inner walls depends on quality and treatments of the surface
materials. It will be 7 '" 16 X 10 - 3 Torr· P/sec after 20 h pumping as is shown in Fig. l.
10 I
o I-
~102 ' (J) (f) <U tl()
:J o ro o I-
10 3
O L---------~~~~~~~~~~~~
5 10 Time of evacuation (hours )
Fig. 1. The estimated total outgassing
from materials of inner walls of the
chamber. The outgassing from any
other materials or components within the
chamber is not included. Outgassing
rates were obtained from the "vacuum
Handbook" published by UL V AC
corporation.
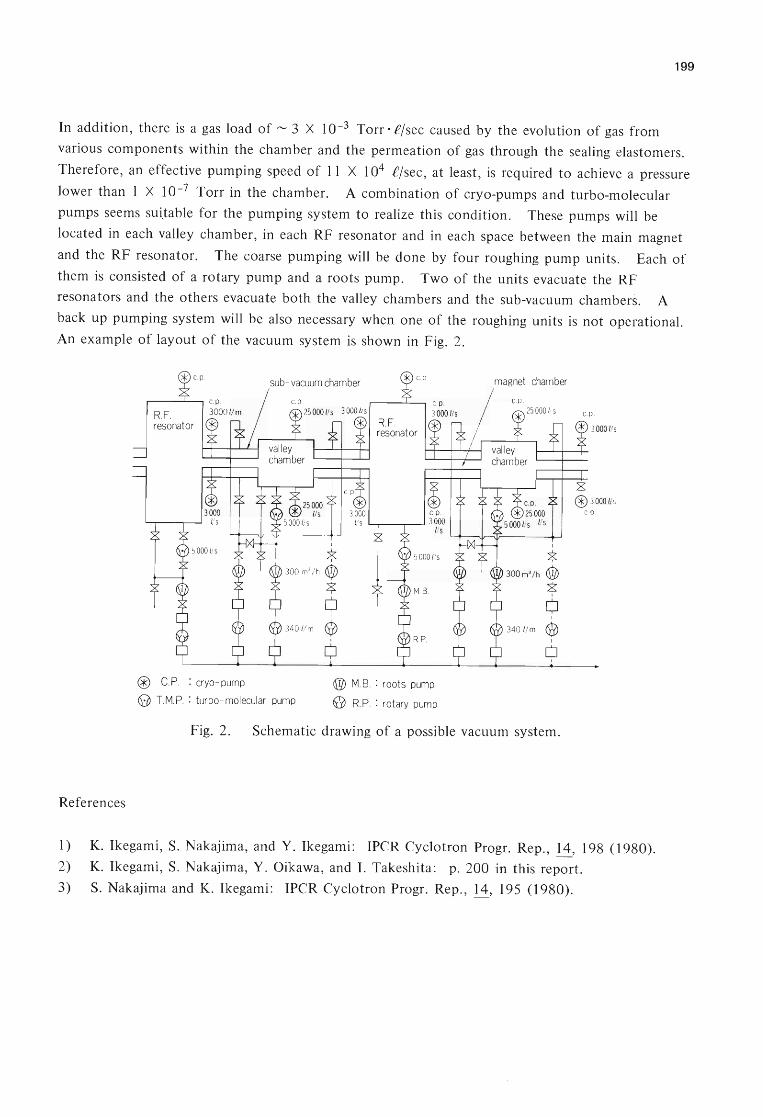
199
In addition, there is a gas load of '" 3 X I 0-3 Torr· f/sec caused by the evolution of gas from
various components within the chamber and the permeation of gas through the sealing elastomers.
Therefore, an effective pumping speed of 11 X 104 l/sec, at least, is required to achieve a pressure
lower than 1 X 10⁻⁷ Torr in the chamber. A combination of cryo-pumps and turbo-molecular
pumps seems sui,table for the pumping system to realize this condition. These pumps will be
located in each valley chamber, in each RF resonator and in each space between the main magnet
and the RF resonator. The coarse pumping will be done by four roughing pump units. Each of
them is consisted of a rotary pump and a roots pump. Two of the units evacuate the RF
resonators and the others evacuate both the valley chambers and the sub-vacuum chambers. A
back up pumping system will be also necessary when one of the roughing units is not operational.
An example of layout of the vacuum system is shown in Fig. 2.
References
® c. P. : cryo- pump
sub- vacuum chamber
I I
* I 300 m3 / h ~
~ Q $
I
Q
~ T. M. P. : turbo- molecular pump
0lJJ M. B. : roots pump
@ R. P. : rotary pump
magnet chamber
I
~ I 300m3 / h @
Z
o I
® I
[] I
Fig. 2. Schematic drawing of a possible vacuum system.
1) K. Ikegami, S. Nakajima, and Y. Ikegami: IPCR Cyclotron Progr. Rep., li., 198 (1980).
2) K. Ikegami, S. Nakajima, Y. Oikawa, and I. Takeshita: p. 200 in this report.
3) S. Nakajima and K. Ikegami: IPCR Cyclotron Progr. Rep., !±, 195 (1980).
200
N -30. Vacuum System of the sse (II)
K. Ikegami, S. Nakajima, Y. Oikawa, and I. Takeshita
(1) Vacuum chamber for the sse The design of the vacuum chamber for the sse was changed from the monolithic structure 1)
to the structure divided into 8 sections. One reason is that the RF resonators must be withdrawn
backwards from the stationary position so that tuning and repair can be done easily, and another
reason is that the operational equipment of the magnetic and electric injection channels, and of the
beam diagnostic device of the injection system must be installed at the central region in the
atmosphere.
In narrowly restricted space where bolt-nuts cannot be used, a sealing method with a
pneumatic expansion seal2) was considered to allow reasonable dimensional tolerances and to
simplify the connecting and disconnecting procedures. This seal is especially adopted for sealing
between RF resonator sections and magnet sections. Valley sections are connected to the magnet
sections by using pneumatic expansion seal or lip welding.
The problem in evacuation is the evolution of gas from the surfaces of the chamber and
equipments in it. Because a large quantity of gas is supposed to evolve from the pole faces, the
main coils, and the field trimming coils, these components are placed outside of the chamber.
As the space available for the chamber in the pole gap is restricted, the chamber wall in that
space could not be made thick enough to withstand atmospheric pressure. The chamber at the
magnet sections is therefore surrounded with a sub-vacuum chamber which is evacuated to about
10- 1 Torr to lessen the pressure difference on both sides of the wall. The thickness of the wall
is 4 mm. The wall is fixed to the pole piece with O-ring seal interposed, by special bolts made
of stainless steel and iron. The analysis of this structural behaviour is in progress using a finite
element method.
The plan view of the chamber is shown in Fig. 1 and the vertical cross sectional view showing
the connection between the magnet and the RF resonator sections in shown in Fig. 2. The
chamber at the magnet section is also seen in this figure.
Geometric characteristics of the chamber are as follows:
total diameter
heights: the valley section
the RF resonator section
the magnet section
the sub-vacuum chamber
9m 60 cm
740 cm
5 cm
38 cm
total volume 65 m 3
(2) Test of the pneumatic expansion seal
Three different types of 1/3 scale model of the seal were constructed to investigate the
performance. Figure 3 shows a photograph of one of the model pneumatic expansion seals. The
seal is fabricated by welding together two thin stainless-steel plates shaped like a race-track.

Fig. 1. Plan view of the vacuum chamber for the sse.
- MEDIAN PLANE _. - -----
Fig. 2. Vertical cross section of the
vacuum chamber showing the method of
sealing between the magnet and the RF
resonator sections.
Fig. 3. A photograph of 1/3 scale model
pneumatic expansion seal.
201
We measured the expanding length and the applied pressure required for the seal. Force
applied to the O-ring is about 9 kg/ cm when a single O-ring is used to seal. It was checked
whether there is any leakage by using a He detector. Figure 4 shows the expanding length of each
seal versus applied pressure. The expanding length of the seal was measured while the pressure was
first increased gradually and then decreased gradually.
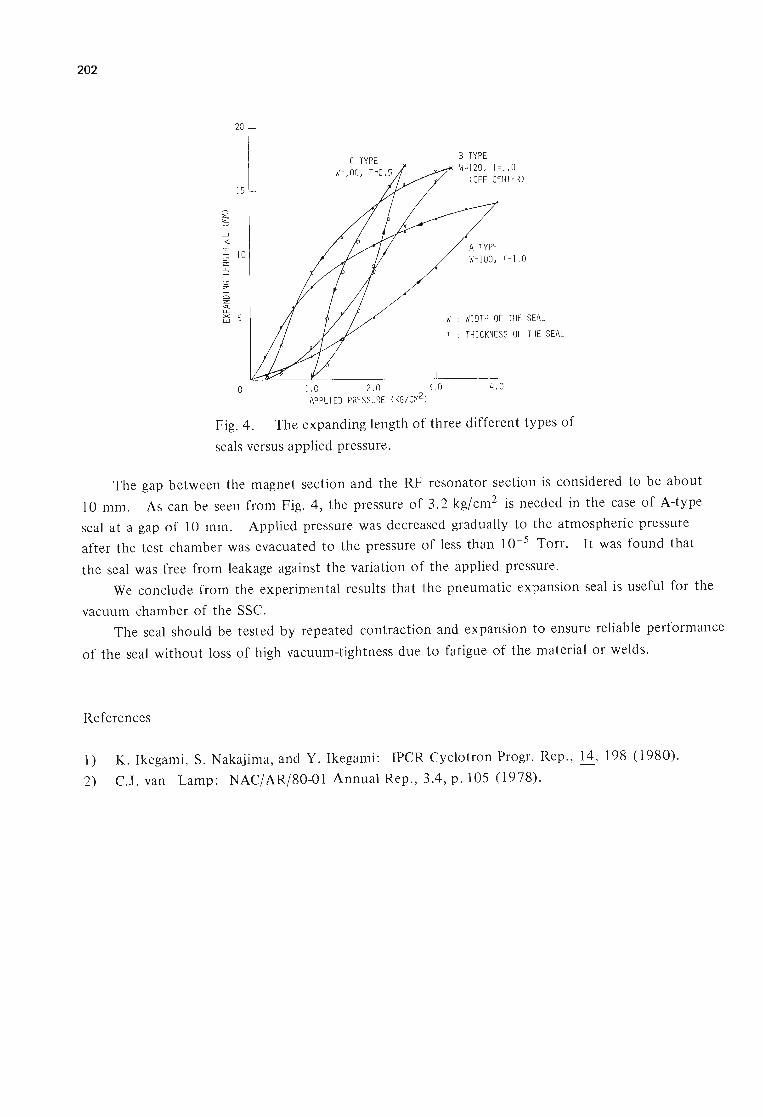
202
20
B TYPE 10/=120, T=I. 0
(OFF CENTER) 15
i: ~ -.J
<l :r:
10 -f--L'1 W=100, T=I. 0 :z:: w -.J
(.!J :!:
;; Z c::( a... x 5 - W : WI DTH OF THE SEAL w
T : TH I CKNESS OF THE SEAL
o 1. 0 2. 0 3. 0 4. 0 APPLI ED PRESSURE (KG/CM2)
Fig. 4. The expanding length of three different types of
seals versus applied pressure.
The gap between the magnet section and the RF resonator section is considered to be about
10 mm. As can be seen from Fig. 4 , the pressure of 3.2 kg/cm2 is needed in the case of A-type
seal at a gap of 10 mm. Applied pressure was decreased gradually to the atmospheric pressure
after the test chamber was evacuated to the pressure of less than 10-5 Torr. It was found that
the seal was free from leakage against the variation of the applied pressure.
We conclude from the experimental results that the pneumatic expansion seal is useful for the
vacuum chamber of the SSC.
The seal should be tested by repeated contraction and expansion to ensure reliable performance
of the seal without loss of high vacuum-tightness due to fatigue of the material or welds.
References
I) K. Ikegami, S. Nakajima, and Y. Ikegami: IPCR Cyclotron Progr. Rep. , 14, 198 (1980).
2) C.l. van Lamp: NAC/AR/80-01 Annual Rep., 3.4, p . 105 (1978).
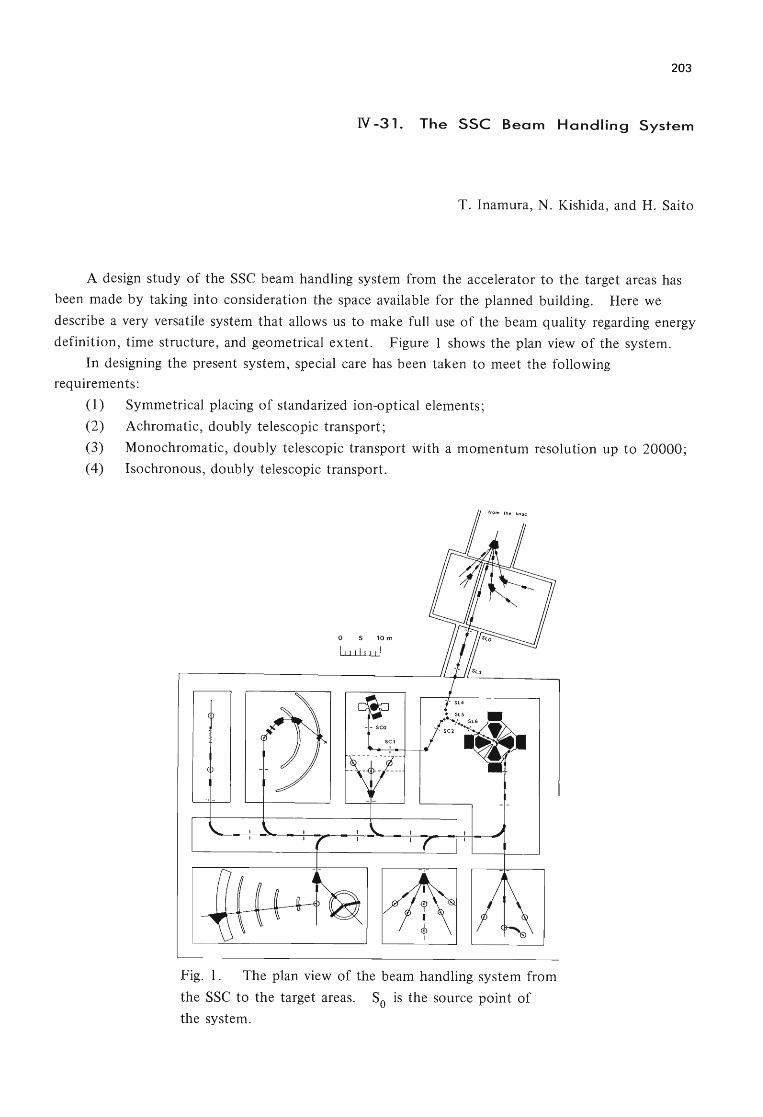
203
N -31. The sse Beam Handling System
T. Inamura, N. Kishida, and H. Saito
A design study of the sse beam handling system from the accelerator to the target areas has
been made by taking into consideration the space available for the planned building. Here we
describe a very versatile system that allows us to make full use of the beam quality regarding energy
definition, time structure, and geometrical extent. Figure I shows the plan view of the system.
In designing the present system, special care has been taken to meet the following
requirements:
(1) Symmetrical placing of standarized ion-optical elements;
(2) Achromatic, doubly telescopic transport;
(3) Monochromatic, doubly telescopic transport with a momentum resolution up to 20000;
(4) Isochronous, doubly telescopic transport.
Fig. 1. The plan view of the beam handling system from
the sse to the target areas. So is the source point of
the system.

204
The first requirement obviously makes it easy to design the system and to calculate ion-optics.
This assures that one can easily get any beam at any target station without making further
calculations once he has got a certain beam at a target station. What he needs to know is only
the magnetic rigidity of the beam. One must make every effort to avoid background radiation due
to the stray beam produced during the beam preparation in the sse Facilities. Because of this,
it is essential to have an arrangement which allows easy preparation of the beam for any target
station.
An achromatic, doubly telescopic system is most useful to get a high-intensity beam with a
clearly defined geometrical extent at the target. In this mode the momentum spread of the initial
beam does not affect the phase ellipse at the end of the system.
Much higher energy resolution than provided by the sse will be needed, for example, in the
experiments with a high resolution spectrometer. Therefore monochromator systems should be
available for several target areas.
Time-of-flight experiments require sharp beam pulses. This means that the beam handling
system should be isochronous so as to avoid the spreading out in time of the beam pulse due to the
finite momentum distribution.
The design of the beam handling system is based on the following specifications of the beam
from the sse. Particles: Protons through 238U, maximum magnetic rigidity Bp = 34.58 kG·m
which corresponds to the case of 134.5 Me V /u 12C6+;
Emittance: Between 1 1T and 15 1T mm . mrad in both planes;
Energy resolution: E/6E <: 1000;
Time structure: Repetition rate of beam pulses 17 - 45 MHz, depending on the type of beam;
time spread::::::: 200 ps.
Numerical calculations of the system were carried out using the computer code
TRANSPORT. I)
The system consists of 90° bending magnets (B), quadrupole triplets (Q), and switching
magnets (SW). It has mirror or anti-mirror symmetry, depending on the target area. Except in
the case of the target area 2, the system works as a double monochromator whose energy
resolution is 13000, i.e. 26000 in terms of momentum, when the slit width is 1 mm at the source
point So (See Fig. 1). Isochronous transport to the target areas 3, 4, and 5 is possible. For
example, the time spread due to the flight from So to the target area 3 is about 70 ps. Achromatic,
doubly telescopic transport is guaranteed except to the target area 1. Figure 2 shows horizontal
and vertical beam envelope plots for a 134.5 MeV /u 12C beam in the case of achromatic, doubly
telescopic transport to the target area 2.
The present design will be modified to meet shielding requirements, to provide more target
stations, and to facilitate future expansion.
Technical data on the ion-optical elements are
(1) Bending magnets (B): 90° bending angle, radius p = 2.66 m, pole-face rotation = 26.6° for
both entrance and exit sides, pole gap = 7.62 cm, homogeneous field:::; 13 kG;
(2) Quadrupole triplets (Q): outer magnetic quadrupoles of effective length 25 cm, inner magnetic
quadrupoles of effective length 45 cm, drift space between elements = 20 cm, aperture radius
= 3.81 cm, maximum field gradient = 1.5 kG/cm;
(3) Switching magnets (SW): double-focussing switching magnets with 0° pole-face rotation and
curved exit face are under consideration.
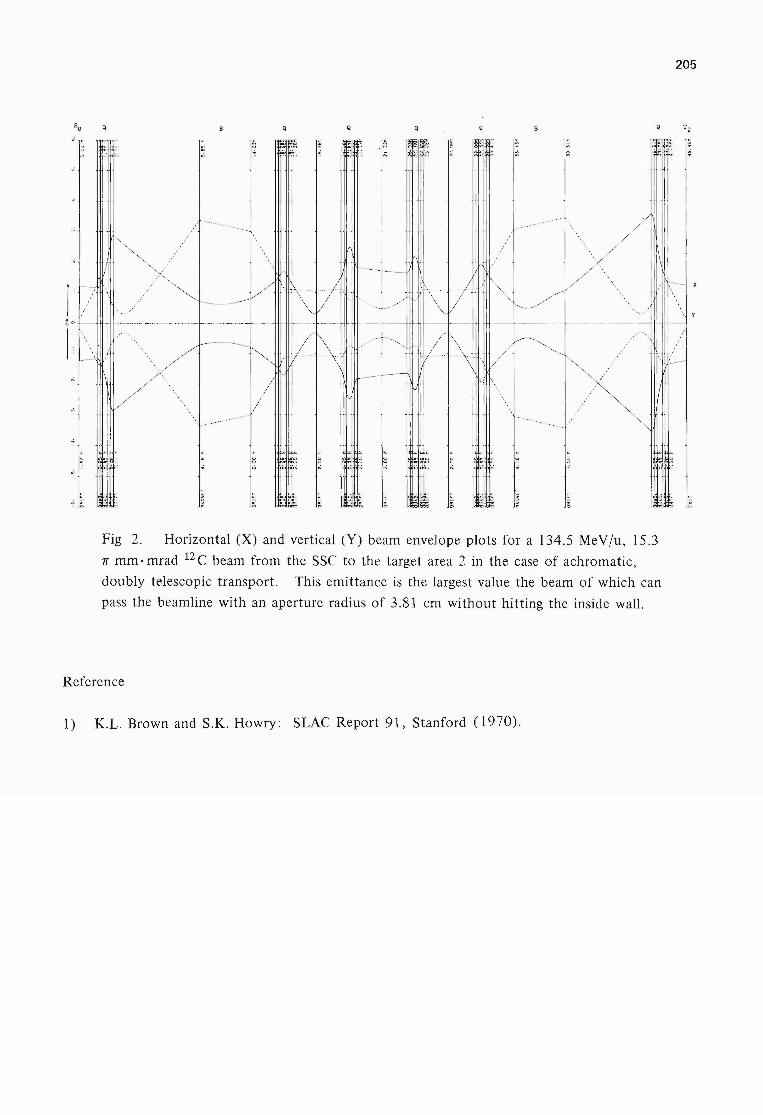
'f ~
0 ~ ~ . . ,.; - ~ '" .,
, ,
g g N N N
~ ~
Fig 2. Horizontal (X) and vertical (Y) beam envelope plots for a 134.5 Me V lu, 15.3
7r mm· mrad 12 C beam from the SSC to the target area 2 in the case of achromatic,
doubly telescopic transport. This emittance is the largest value the beam of which can
pass the beamline with an aperture radius of 3.81 cm without hitting the inside wall.
Reference
1) K.L. Brown and S.K. Howry: SLAC Report 91, Stanford (1970).
205
'- y
~
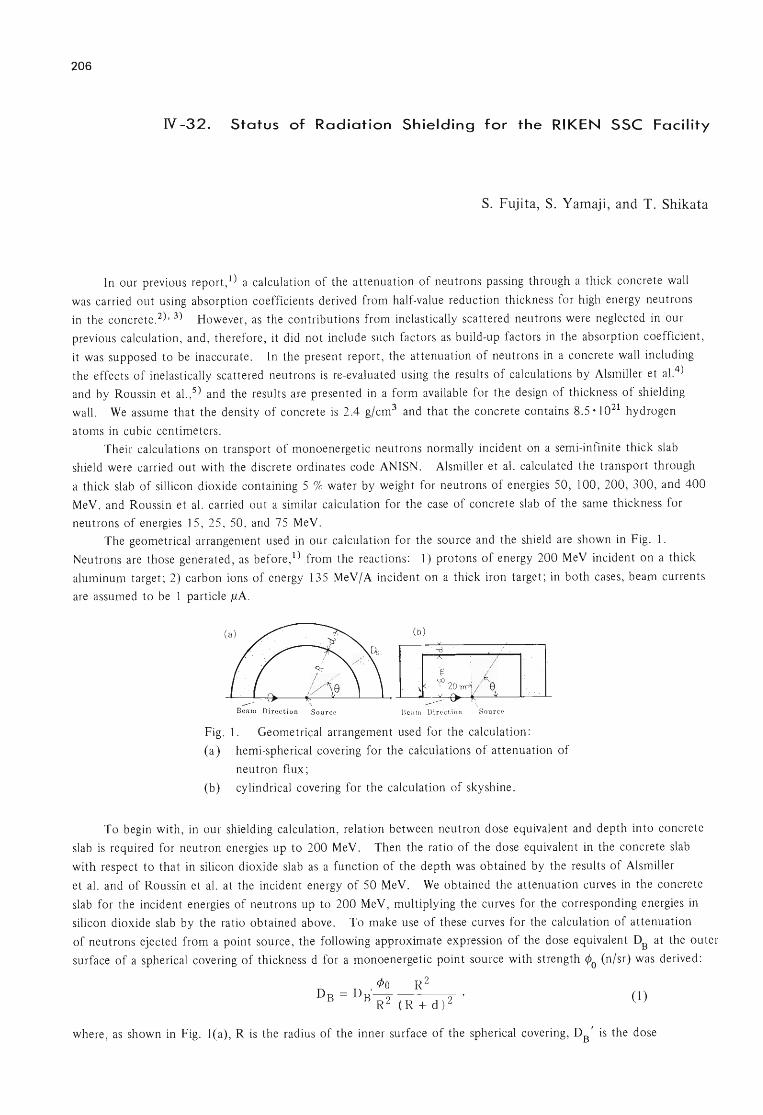
206
N-32. Status of Radiation Shielding for the RIKEN sse Facility
S. Fujita, S. Yamaji , and T. Shikata
In our previous report ,1) a calculation of the attenuation of neutrons passing through a thick concrete wall
was carried out using absorption coefficients derived from half-value reduction thickness for high energy neutrons
in the concrete .2), 3) However , as the contributions from inelastically scattered neutrons were neglected in our
previous calculation , and , therefore , it did not include such factors as build-up factors in the absorption coefficient ,
it was supposed to be inaccurate. In the present report , the attenuation of neutrons in a concrete wall including
the effects of inelastically scattered neutrons is re-evaluated using the results of calculations by Alsmiller et a1.4)
and by Roussin et aI. , 5) and the results are presented in a form available for the design of thickness of shielding
wall. We assume that the density of concrete is 2.4 g/cm3 and that the concrete contains 8.5 0 1021 hydrogen
atoms in cubic centimeters.
Their calculations on transport of monoenergetic neutrons normally incident on a semi-infinite thick slab
shield were carried out with the discrete ordinates code ANISN. Alsmiller et a1. calculated the transport through
a thick slab of sillicon dioxide containing 5 % water by weight for neutrons of energies 50, 100, 200, 300 , and 400
MeV , and Roussin et a1. carried out a similar calculation for the case of concrete slab of the same thickness for
neutrons of energies 15 , 25 , 50 , and 75 MeV.
The geometrical arrangement used in our calculation for the source and the shield are shown in Fig . 1.
Neutrons are those generated, as before ,1) from the reactions: 1) protons of energy 200 MeV incident on a thick
aluminum target ; 2) carbon ions of energy 135 MeV / A incident on a thick iron target; in both cases, beam currents
are assumed to be 1 particle pA .
(a) ( b)
------ \ Beam Direc tion Source \
Beam Direct ion Sou r ce
Fig. 1. Geometrical arrangement used for the calculation:
(a) hemi-spherical covering for the calculations of attenuation of
neutron flux;
(b) cylindrical covering for the calculation of skyshine.
To begin with, in our shielding calculation , relation between neutron dose equivalent and depth into concrete
slab is required for neutron energies up to 200 MeV. Then the ratio of the dose equivalent in the concrete slab
with respect to that in silicon dioxide slab as a function of the depth was obtained by the results of Alsmiller
et a1. and of Roussin et a1. at the incident energy of 50 MeV. We obtained the attenuation curves in the concrete
slab for the incident energies of neutrons up to 200 MeV , multiplying the curves for the corresponding energies in
silicon dioxide slab by the ratio obtained above. To make use of these curves for the calculation of attenuation
of neutrons ejected from a point source, the following approximate expression of the dose equivalent DB at the outer
surface of a spherical covering of thickness d for a monoenergetic point source with strength ¢o (n/sr) was derived:
cPO R2 DB = DB'RZ (R + d ) 2 ' (1)
where, as shown in Fig. l(a), R is the radius of the inner surface of the spherical covering, DB' is the dose
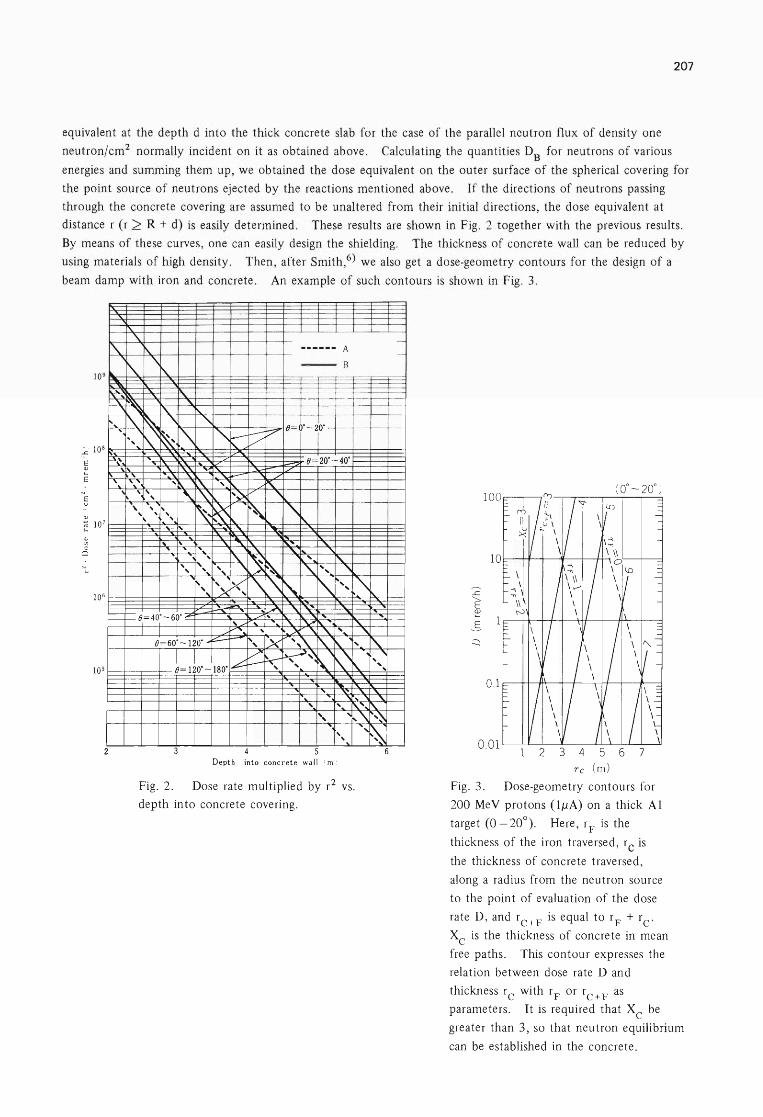
207
equivalent at the depth d into the thick concrete slab for the case of the parallel neutron flux of density one
neutron/cm2 normally incident on it as obtained above. Calculating the quantities DB for neutrons of various
energies and summing them up , we obtained the dose equivalent on the outer surface of the spherical covering for
the point source of neutrons ejected by the reactions mentioned above. If the directions of neutrons passing
through the concrete covering are assumed to be unaltered from their initial directions, the dose equivalent at
distance r (r 2 R + d) is easily determined. These results are shown in Fig. 2 together with the previous results.
By means of these curves, one can easily design the shielding. The thickness of concrete wall can be reduced by
using materials of high density . Then, after Smith,6) we also get a dose-geometry contours for the design of a
beam damp with iron and concrete. An example of such contours is shown in Fig. 3.
"\.. '\.
C\. I\. ------ A
" 'i\. --- B
~ ,,'\."\.. "\.. , ~ 1'1\. , 1', I\, ~ '\ " 8= 0'-20'
"'" ' 1\." ~ '\ " ---V p-I ' ... ~' ,
8 20' 40' , '\. '\.'\. "''I"'\. ~ ./ , ."\.. "\.. " ....-- " ./
' .. ' ... '. ,~ .'\. , I'\.. ... ... " , 'V '~/ "' " ... ... \; ~~ ~, "\ ... .. ... ... ,
... I' '\. -,.. '\.. 1'\..', '\. '. " ' .. "\.. " " ...
" ~, ,
'I\. ... , " ... " ,> ~~ '\.. , '\ ,
1', ~, k" " .'\ l'- 1\ ~, '\r\. X ,
" , - ~8-40' 60' ..- / .. , '. - , " ' .. "\.. Y""I\.. " """ ... .. -'" '" ' ... '\
8=60'-120' ... ~- ~, X '.l\. r\.~ , I\.
1-1JO' ::::: ~ ~ ...,,, ,
1\.' . ,
" ~ " , ... 180'
, , ,
, '\.'. '\.. '\.. .... '. ,r .. "\.. , ' ... 1'1\.',,, , , '1'0 , ,~ " "~ ...
' ... '..:
Depth into concrete wall ( m )
Fig. 2. Dose rate multiplied by r2 vs.
depth into concrete covering.
-
-
O. }I---+-I--It+---+-+-+--.-++--+-----,p.-----l
0.01 L....-...!....L..--l.2-3L..-...I..4----'-J5--'--~6 .L--J..
7--'"
Tc (m)
Fig. 3 . Dose-geometry contours for
200 MeV protons (lJ.lA) on a thick Al
target (0 _20°). Here, rF
is the
thickness of the iron traversed, re is
the thickness of concrete traversed,
along a radius from the neutron source
to the point of evaluation of the dose
rate D, and rC + F is equal to rF + rc'
Xc is the thickness of concrete in mean
free paths. This contour expresses the
relation between dose rate D and
thickness rc with rF or rC
+ F as
parameters. It is required that Xc be
greater than 3, so that neutron equilibrium
can be established in the concrete .
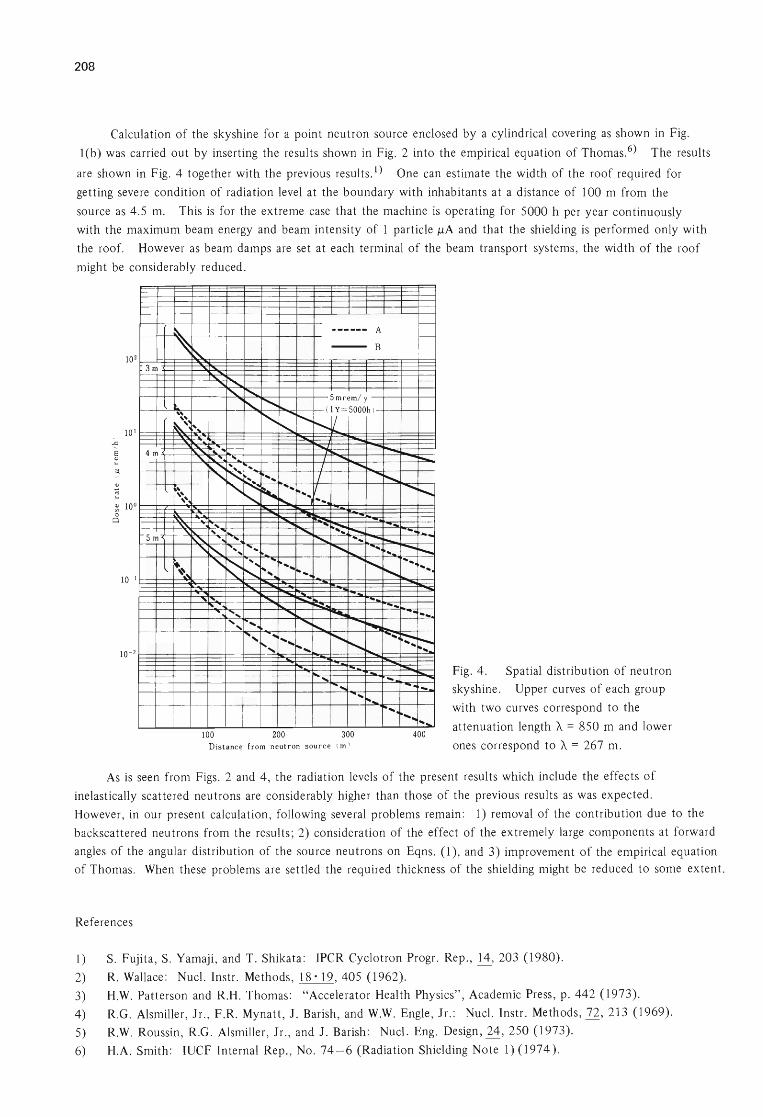
208
Calculation of the sky shine for a point neutron source enclosed by a cylindrical covering as shown in Fig.
1 (b) was carried out by inserting the results shown in Fig. 2 into the empirical equation of Thomas.6) The results
are shown in Fig. 4 together with the previous results.!) One can estimate the width of the roof required for
getting severe condition of radiation level at the boundary with inhabitants at a distance of 100 m from the
source as 4.5 m. This is for the extreme case that the machine is operating for 5000 h per year continuously
with the maximum beam energy and beam intensity of 1 particle IlA and that the shielding is performed only with
the roof. However as beam damps are set at each terminal of the beam transport systems , the width of the roof
might be considerably reduced.
10
10
~ 10 a
2
I
0
I
2
3m
4m
5m
~
~
" ,~. ~'
... " " " "
ft.~ ';,.,
------ A
~ --- B
........... 1"0... ........
5 mrem/ y
"- .........
"-..... , ( 1 y = 5000h )
,I :' ... .......... ..... , .... ... -"- '" .... '. .......
............. ... / ........
" :"~ ... ~ .... / ................
" ~ , ..... .. ... , / ~ ....
-... -.. ~ ... ... ....... .. :-.... ~, .... , 1""'0... ..... -~ " ~
I ..... ... .. I't.....
..... , ".
" ~ ' ... ....
too .... ""'", ~ 10- .... ~ .... '" " ....... ...... ~
1'- ~ ~ .. ..... '. ... ... ....... ~ , , .... ........ t-..... -~ .... "', ' .. ........ "'-
.... , ' .... ""' .... ~t.....
.... -....... .. r.. ....
1'" .....
100 200 300 Distance from neut r on sourc e (m )
~
;-
--....... .........
..... """'-r-... .. ...
, .....
. ...... ::::: ::::--
..... - -.... .. ...
400
Fig. 4. Spatial distribution of neutron
skyshine. Upper curves of each group
with two curves correspond to the
attenuation length A = 850 m and lower
ones correspond to A = 267 m .
As is seen from Figs. 2 and 4, the radiation levels of the present results which include the effects of
inelastically scattered neutrons are considerably higher than those of the previous results as was expected.
However , in our present calculation , following several problems remain: 1) removal of the contribution due to the
backscattered neutrons from the results; 2) consideration of the effect of the extremely large components at forward
angles of the angular distribution of the source neutrons on Eqns . (1), and 3) improvement of the empirical equation
of Thomas. When these problems are settled the required thickness of the shielding might be reduced to some extent.
References
1) S. Fujita , S. Yamaji, and T. Shikata: IPCR Cyclotron Progr. Rep., .!.±, 203 (1980).
2) R. Wallace: Nucl. Instr. Methods, 18-19,405 (1962).
3) H.W. Patterson and R.H. Thomas: "Accelerator Health Physics", Academic Press, p. 442 (1973) .
4) R.G. Alsmiller, Jr. , F.R. Mynatt, J. Barish, and W.W. Engle , Jr.: Nucl. Instr. Methods, 72, 213 (1969).
5) R.W. Roussin , R.G . Alsmiller , Jr. , and J . Barish: Nuc!. Eng. Design , 24, 250 (1973).
6) H.A. Smith: IUCF Internal Rep. , No. 74 - 6 (Radiation Shielding Note 1) (1974) .
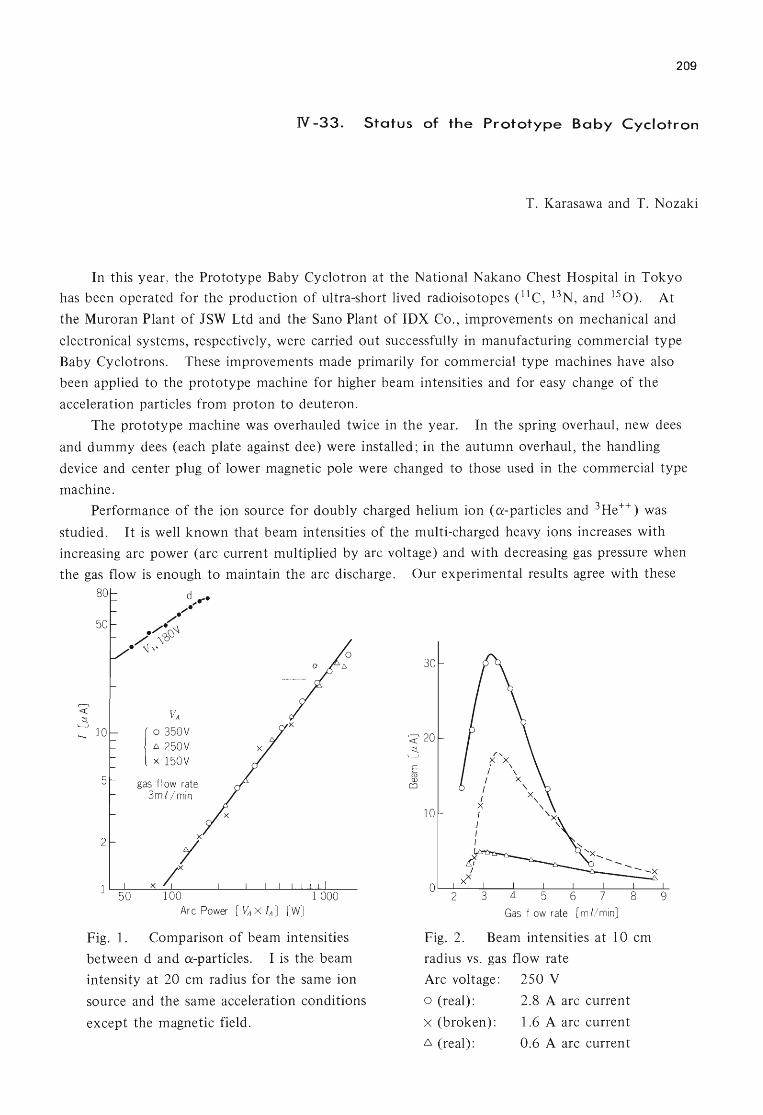
209
N -33. Status of the Prototype Baby Cyclotron
T. Karasawa and T. Nozaki
In this year) the Prototype Baby Cyclotron at the National Nakano Chest Hospital in Tokyo
has been operated for the production of ultra-short lived radioisotopes (ll C, 13N, and 150). At
the Muroran Plant of JSW Ltd and the Sano Plant of IDX Co. , improvements on mechanical and
electronical systems, respectively , were carried out successfully in manufacturing commercial type
Baby Cyclotrons. These improvements made primarily for commercial type machines have also
been applied to the prototype machine for higher beam intensities and for easy change of the
acceleration particles from proton to deuteron.
The prototype machine was overhauled twice in the year. In the spring overhaul , new dees
and dummy dees (each plate against dee) were installed; in the autumn overhaul, the handling
device and center plug of lower magnetic pole were changed to those used in the commercial type
machine.
Performance of the ion source for doubly charged helium ion (~-particles and 3He++) was
studied. It is well known that beam intensities of the multi-charged heavy ions increases with
increasing arc power (arc current multiplied by arc voltage) and with decreasing gas pressure when
the gas flow is enough to maintain the arc discharge. Our experimental results agree with these 80
50
5
2
1 50
VA
1 0 350V l::. 250 V x 150 V
gas f I ow rate 3mt/min
x
7 x IX
100 Arc Power
-I x
[VAX ]A] [W]
Fig. 1. Comparison of beam intensities
between d and ex-particles. I is the beam
intensity at 20 cm radius for the same ion
source and the same acceleration conditions
except the magnetic field.
30
':? 20 .::t
E <"IJ OJ
OJ
10
Fig. 2.
Gas f low rate [ ml/min]
Beam intensities at 10 cm
radius vs. gas flow rate
Arc voltage: 250 V
o (real): 2.8 A arc current
X (broken): 1.6 A arc current
6. (real): 0.6 A arc current
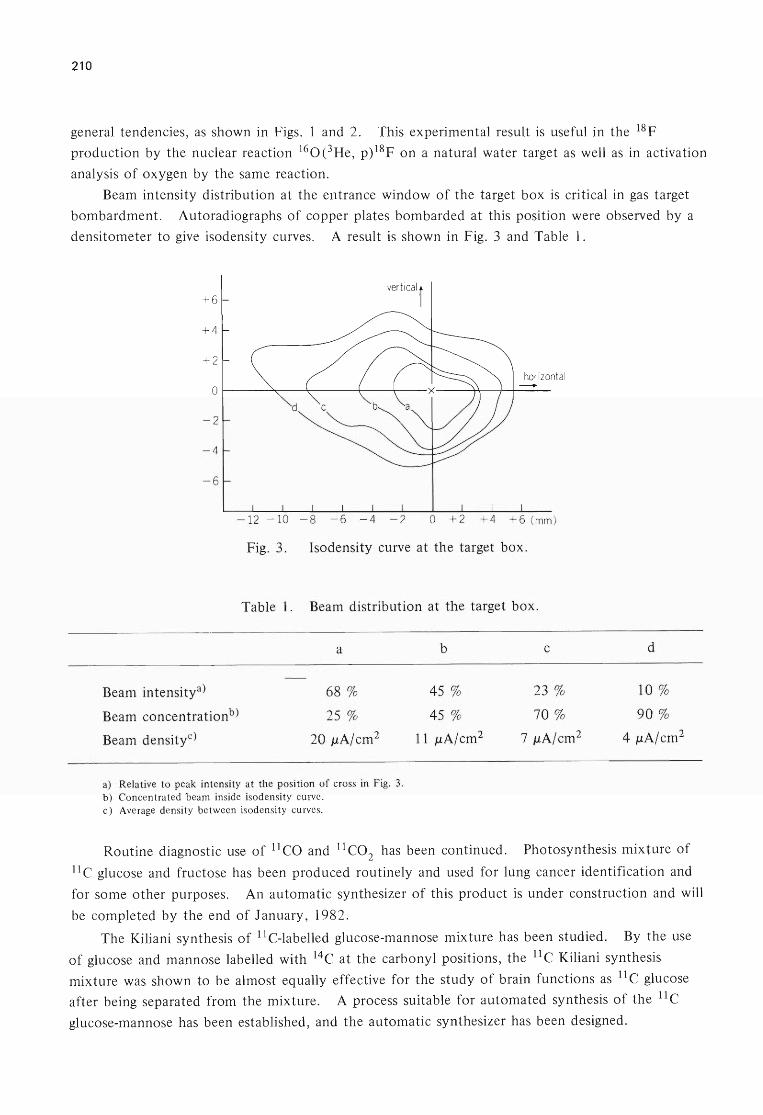
210
general tendencies, as shown in Figs. 1 and 2. This experimental result is useful in the 18F
production by the nuclear reaction 160eHe, p)18F on a natural water target as well as in activation
analysis of oxygen by the same reaction.
Beam intensity distribution at the entrance window of the target box is critical in gas target
bombardment. Autoradiographs of copper plates bombarded at this position were observed by a
densitometer to give isodensity curves. A result is shown in Fig. 3 and Table 1.
+6 ver t ical\j
+4
+ 2 horizontal
0 -- 2
-4
-6
+ 4 +6 (mm )
Fig. 3. Isodensity curve at the target box.
Table l. Beam distribution at the target box.
a
68 %
25 %
Beam in tensi tya)
Beam concentrationb )
Beam densityc) 20 /lA/cm 2
a) Relative to peak intensity at the position of cross in Fig. 3. b) Concentrated beam inside isodensity curve. c) Average density between isodensity curves.
b
45 %
45 %
11 /lA/cm 2
c
23 %
70 %
7 /lA/cm 2
d
10 %
90 %
4/lA/cm2
Routine diagnostic use of l1eo and l1eo2
has been continued. Photosynthesis mixture of
l1e glucose and fructose has been produced routinely and used for lung cancer identification and
for some other purposes. An automatic synthesizer of this product is under construction and will
be completed by the end of January, 1982.
The Kiliani synthesis of l1e-labelled glucose-mannose mixture has been studied. By the use
of glucose and mannose labelled with 14e at the carbonyl positions, the l1e Kiliani synthesis
mixture was shown to be almost equally effective for the study of brain functions as l1e glucose
after being separated from the mixture. A process suitable for automated synthesis of the l1e
glucose-mannose has been established, and the automatic synthesizer has been designed.

211
Preparation of (l1C-methyl)-stearic acid from 11CH3
I by the malonic acid synthesis has been
studied. Hexacosanoic acid labelled with 11e at the carboxylic carbon was prepared both by the
Grignard reaction and the nitrile synthesis. The behaviour of this compound was studied for its
possible use as a diagnostic tool for adenoleukodistrophy. 1)
Aspartic acid labelled with no-carrier-added 11e was prepared by the following two-step
enzymatic synthesis: (1) reaction of 11e02 and phosphoenolpyruvic acid in the presence of
phosphoenolpyruvate carboxylase to give 11e oxaloacetic acid, and (2) conversion of the oxaloacetic
acid into aspartic acid-11 e with the aid of glutamic acid and glutamate-oxaloacetate transaminase.
In vivo distribution of this compound and catabolic rate of the HC atom into expired air were
studied. Its diagnostic use is under consideration.
Reference
I) N. Sakuragawa, A. Matsui, M. lio, S. Eda, T. Nozaki, M. Arima, E. Satoyoshi, and T. Karasawa:
Intern. Symp. Leukodistrophy and Allied Diseases, Tokyo, Sept. (1981).

212
V. RADIA liON MONITORING
1. Routine Monitoring
M. Koyama, K. Igarashi, 1. Usuba,
S. Fujita, and 1. Sakamoto
Results of routine radiation monitoring carried out on the cyclotron from April 1980 to
March 1981 are described.
No remarkable change in leakage radiation and residual activities was observed during this
period. Some aspects of the leakage radiation are described in the following report.
(1) Surface and air contamination
The surface contamination has been kept below 10 - 6 pCi/ cm2 on the floor of cyclotron room
and the underground passage, and below 10- 7 pCi/cm2 in the experimental areas, hot laboratory
and chemical laboratories. The contamination was wiped off twice a year, and immediately after
this decontamination, the contamination on the floor of cyclotron room and the underground
passage had been reduced to a value below 10-7 pCi/cm2 .
When the accelerating chamber was opened, slight contamination of the air in the cyclotron
room was observed. The value of radioactivity concentration (beta-gamma) was 10-12 pCi/ cm3 .
(2) Drainage
The radioactivity concentration of the drain water from the cyclotron building was found to
Table 1. Annual exposure dose received by the cyclotron
workers from April 1980 to March 1981.
Number of persons
Workers Dose 10 -1 00 101-300
undetectable (mrem) (mrem)
Operators
Nuclear physicists
Accelerator physicists
Physicists in other fields
Nuclear chemists
Biological chemists
Health physicists
Total
A verage annual dose per person: 19.4 mrem.
12
17
25
6
6
5
72
Maximum individual annual dose: 310 mrem.
7
3
3
2
4
19
5
5
>300
(mrem)
Total
8
15
20
28
15
6
5
97
Collective
dose
(man-mrem)
220
30
120
340
1170
1880

213
be of the order of 10-6 - 10- 7 J.1Ci/cm3 • The total quantity of activities in the aqueous effluents
in this period was about 50 J.1Ci, and the radioactive nuclides found by the ')'-ray spectrometry were
mainly 65 Zn, 22Na, and 58Co.
(3) Personnel monitoring
The external exposure dose to personnel was measured with ,),-ray and neutron film badges.
The dose received during the present period by all the cyclotron workers is shown in Table 1.
The collective ,),-ray dose to all workers was 1880 man-mrem, while the collective dose owing to
thermal and fast neutron exposures was too small to be detected. The collective dose to the
cyclotron workers is about 82 % of the value in the preceding period.
In this period the average annual dose per person was 19.4 mrem, and the maximum
individual annual dose was 310 mrem.

214
V -2. leakage-Radiation Measurement at the
Underground Passage
I. Sakamoto
Leakage radiation during operation of the cyclotron at the underground passage of the
cyclotron building was measured. Leakage doses received from April 1980 to March 1981 by
Table 1. Leakage radiation dose (in mrem) at the underground
passage from April 1980 at March 1981.
Radiation
I-rays (mrem)
Thermal neutrons (mrem)
Fast neutrons (mrem)
Total (mrem)
a) See the figure shown below.
Experimental area (L) I
2490
650
740
3880
: 2 x-l..----..........,...... ................ I I I I
Underground passage~ I
Hand foot cloth monitor
I
Control room
! ! ! ! ! !
o 1 2 345m
2
60
10
60
130

216
'Y-ray and neutron film badges which were left at the underground passage, are shown in Table 1.
The machine time allotted for deuteron acceleration was 36 h in this period.
As to the dose values at point No. I measured every month, the maximum dose of 790 mrem
was observed in November. In this case, the values of gamma dose, thermal neutron dose and fast
neutron dose were 460 mrem, 80 mrem and 250 mrem, respectively.
The neutron doses observed at point No. I in October, November, and March were larger than
those in other months. The sum of neutron doses measured in the three months was 770 mrem ,
which was 55 % of the total neutron dose in this period. As a result of investigation, it was
concluded that the increase of the neutron dose was mainly due to the 40 MeV a-particle
bombardment on a GaAs and Sn plate at about 5 - 15 IlA in the beam course No.2, where 5 -10
mCi of radioisotopes were produced in each month above mentioned by 75 As(a, 211) 77Br and
117Sn(a, 2n)119mTe reactions.
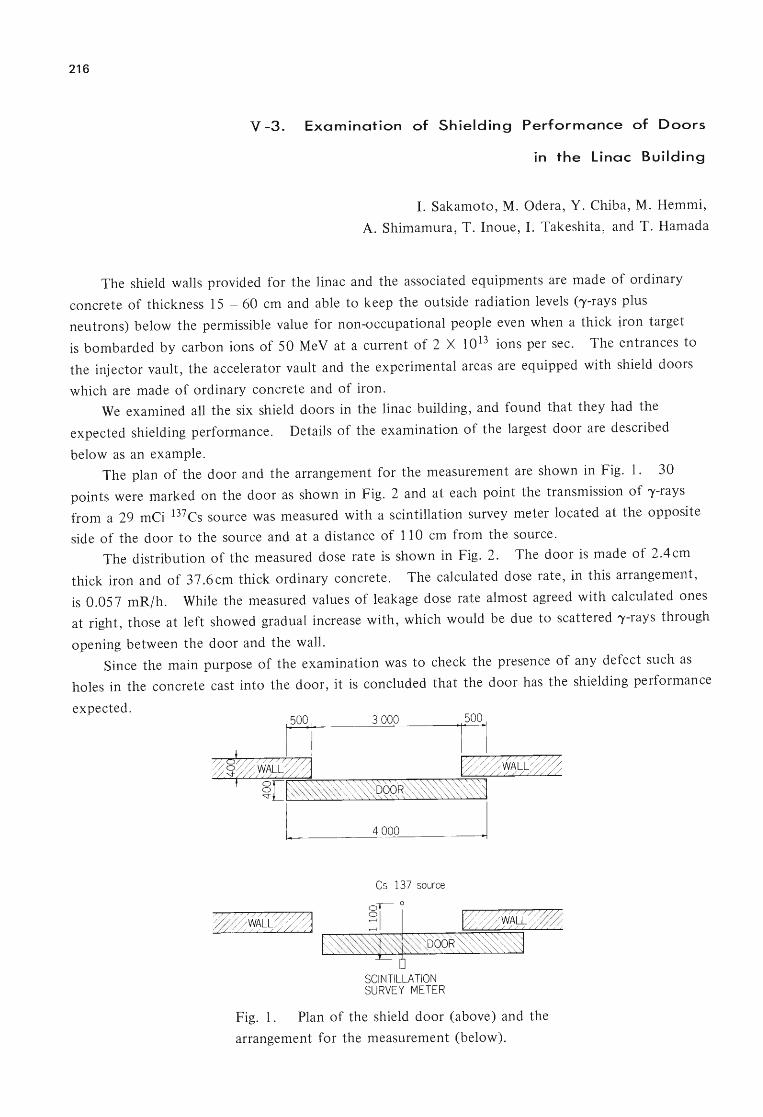
216
V -3. Examination of Shielding Performance of Doors
in the Linac Building
I. Sakamoto, M. Odera, Y. Chiba, M. Hemmi,
A. Shimamura, T. Inoue, I. Takeshita, and T. Hamada
The shield walls provided for the linac and the associated equipments are made of ordinary
concrete of thickness 15 - 60 cm and able to keep the outside radiation levels ('Y-rays plus
neutrons) below the permissible value for non-occupational people even when a thick iron target
is bombarded by carbon ions of 50 MeV at a current of 2 X 10¹³ ions per sec. The entrances to
the injector vault, the accelerator vault and the experimental areas are equipped with shield doors
which are made of ordinary concrete and of iron.
We examined all the six shield doors in the linac building, and found that they had the
expected shielding performance. Details of the examination of the largest door are described
below as an example.
The plan of the door and the arrangement for the measurement are shown in Fig. 1. 30
points were marked on the door as shown in Fig. 2 and at each point the transmission of 'Y-rays
from a 29 mCi 137 Cs source was measured with a scintillation survey meter located at the opposite
side of the door to the source and at a distance of 110 cm from the source.
The distribution of the measured dose rate is shown in Fig. 2. The door is made of 2.4cm
thick iron and of 37.6cm thick ordinary concrete. The calculated dose rate, in this arrangement,
is 0.057 mR/h. While the measured values of leakage dose rate almost agreed with calculated ones
at right, those at left showed gradual increase with, which would be due to scattered 'Y-rays through
opening between the door and the wall.
Since the main purpose of the examination was to check the presence of any defect such as
holes in the concrete cast into the door, it is concluded that the door has the shielding performance
expected.
15001 3~0 15001
"'T/~~~""/"7""7"7H~/7""((:h-7-7-i~ ,..,....,.~~W~&~L-r"'7;L~~ §[~~Q?f~
[ 4 000 [
Cs- 137 source
D SCINTILLATION SURVEY METER
Fig. 1. Plan of the shield door (above) and the
arrangement for the measurement (below).

217
6 Unit: mR/ h X : measured points
x x
4 x x x x
E x x x x
1: 3 I .~ Q)
I
x x x x
2
x\x ~J \ cs
x x x
0° ~~ ~ x X x x Fig. 2. Distribution of the
0 0 2 3 4 measured dose rate of the shield
Width (m) door.
218
VI. LIST OF PUBLICATIONS
1. Machine development and accelerator physics
1) H. Kamitsubo: "IPCR Heavy Ion Accelerator Project. The Design of the Riken
Separated Sector Cyclotron", Reports I.P.C.R., 57,131 (1981).
2) Y. Obana, S. Motonaga, T. Wada, Y. Tanaka, and H. Takebe: "Design of the Sector
Magnet for the RIKEN SSC (II)", Reports I.P.C.R., 57, 147 (1981).
3) S. Motonaga, T. Wada, Y. Obana, Y. Tanaka, and H. Takebe: "Design of the Sector
Magnet for the RIKEN SSC (Ill). Final Design of the Magnet Pole Using a Computer
Code Trim in 2-dimensional Approximation", Reports I.P.C.R., 57,156 (1981).
4) A. Goto, H. Takebe, S. Motonaga, T. Wada, Y. Yano, N. Nakanishi, and Y. Tanaka:
"Optimization of Currents and Configurations of Trim Coils for Sector Magnet",
Reports I.P.C.R., 57, 165 (1981).
5) H. Takebe, T. Wada, I. Takeshita, S. Motonaga, 1. Fujita, and Y. Tanaka: "Model Test
of Trim Coils for Sector Magnet", Reports I.P .C.R., 57, 171 (1981).
6) Y. Ikegami, T. Wada, M. Hara, and S. Motonaga: "Structural Analyses of Sector Magnet
by a Finite Element Method", Reports I.P.C.R., 57, 177 (1981).
7) N. Nakanishi: "Programs for Calculating Beam Orbits in Cyclotron (I)", Reports
I.P.C.R., 57,189 (1981).
8) A. Goto: "Programs for Calculating Beam Orbits in Cyclotron (II)", Reports I.P.C.R.,
57,203 (1981).
9) K. Ogiwara, M. Hara, and T. Fujisawa: "Design Study and Model Test of RF Resonator
for the RIKEN SSC", Reports I.P.C.R., 57, 222 (1981).
10) S. Nakajima, K. Ikegami, Y. Oikawa, and I. Takeshita: "Design of the Vacuum System
of the RIKEN SSC", Reports I.P.C.R., 57, 232 (1981).
11) S. Fujita, S. Yamaji, and T. Shikata: "Neutron Shielding for the RIKEN SSC", Reports
I.P .C.R., 57, 239 (1981).
12) N. Nakanishi, A. Goto, and Y. Yano: "Isochronous Magnetic Field in a SSC and the
Effect of Field Imperfection", Sci. Papers I.P.C.R., 75, 136 (1981).
13) M. Hara , T. Wada, A. Toyama, and F. Kikuchi: "Calculation of RF Electromagnetic
Field by Finite Element Method", Sci. Papers I.P.C.R., 75, 143 (1981).
14) Y. Yano, H. Takebe, S. Motonaga, T. Wada, 1. Fujita, and A. Goto: "Design and Model
Study of Injection Bending Magnet for the RIKEN SSC", Sci. Papers I.P.C.R., 75,176
(1981).
15) H. Takebe, Y. Yano, S. Motonaga, T. Wada, J. Fujita, and Y. Ikegami: "Model Study
of Magnetic Inflection Channel for the RIKEN SSC", Sci. Papers I.P.C.R., 75,193 (1981).
16) A. Goto, Y. Yano, and N. Nakanishi: "Design of Injection and Extraction Harmonic
Coils for the RIKEN SSC", Sci. Papers I.P.C.R., 75, 204 (1981).
17) N. Kishida and Y. Yano: "Beam Transport System for the RIKEN SSC (II)", Sci. Papers
I.P.C.R., 75, 214 (1981).
18) T. Inamura, N. Kishida, H. Saito, and M. Watanabe: "The RIKEN SSC Beam Handling
System", Sci. Papers I.P.C.R., 12 236 (1981).

19) S. Motonaga, T. Wada, Y. Yano, H. Takebe, J. Fujita, Y. Ikegami, and N. Nakanishi:
"The Sector Magnet for the IPCR SSC", IEEE Trans. Mag., MAG-17, 1836 (1981).
2. Nuclear physics and nuclear instrumentation
1) M. Ichimura, E. Takada, T. Yamaya, and K. Nagatani: "Reaction Mechanism of
12C(160, a): 12C Transfer to Nuclear Molecular Resonances", Phys. Lett., 101B, 31
(1981).
2) H. Utsunomiya, T. Nomura, M. Ishihara, T. Sugitate, K. Ieki, and S. Kohmoto:
"'Angular-Momentum Transfer and Alignment Following Preequilibrium a-Particle
Emission in the Reaction 209Bi + 14N", Phys. Lett., 105B, 135 (1981).
3) S. Yamaji, A. Iwamoto, K. Harada, and S. Yoshida: "Microscopic Calculation of the
Mass Diffusion Coefficient Using Linear Response Theory", Phys. Lett., 1 06B, 443
(1981).
219
4) Y. Gono, K. Hiruta, T. Nomura, M. Ishihara, H. Utsunomiya, T. Sugitate, and K. Ieki:
"In-Beam a- and 'Y-Ray Spectroscopy for 214Rn", J. Phys. Soc. Japan, 50, 377 (1981).
5) T. Fujisawa, N. Kishida, T. Kubo, T. Wada, Y. Toba, T. Hasegawa, M. Sekiguchi, N.
Ueda, M. Yasue, F. Soga, H. Kamitsubo, M. Nakamura, K. Hatanaka, Y. Wakuta, T.
Tanaka, and A. Nagao: "Analyzing Power-Polarization Inequality in the Inelastic
Scattering of Protons on 12C for Incident Energies from 22.0 to 29 .0 MeV", J. Phys.
Soc. Japan,2Q, 3198 (1981).
6) H. Amakawa, A. Mori, H. Nishioka, K. Yazaki, and S. Yamaji: "Adiabatic
Approximation for Deuteron Breakup Effect", Phys. Rev. C 23, 583 (1981).
7) M. Koike, K. Komura, H. Kawakami, M. Kanbe, G. Madiueme, S. Shibata, T. Fujisawa,
and T. Wada: "Electric Monopole Transitions between 0+ States in 102Ru", Phys. Rev.
C 24,1611 (1981).
8) A. Ichimura and M. Ichimura: "Coupled Channel Analysis for the Anomaly of the
(180, 180*) Reaction", Prog. Theoret. Phys., 66, 913 (1981).
9) M. Kawai, M. Ichimura, and N. Austern: "On the Relation between the Method of
Coupled Channels and the Truncated Channel Coupling Array Formalism for
Rearrangement Reactions", Z. Phys. A - Atom and Nuclei, 303, 215 (1981).
10) T.Inamura: "Is Massive Transfer Preequilibrium ?", Soryushiron Kenkyu, 63, CI09
(1981).
3. Atomic and solid-state physics
1) H. Tawara, K. Ishii, and Y. Awaya: "Excitation, Ionization and Charge Transfer
Processes about Inner-Shell Electrons", Atomic Physics by Using Accelerators, Study
Group of Fundamental Atomic Process, p.25 (1981).
2) Y. Awaya: "Table of Accelerators Used for the Study of Atomic Physics", Atomic
Physics by Using Accelerators, Study Group of Fundamental Atomic Process, p. 91
(1981).
3) Y. Awaya, H. Kumagai, and Y. Tendow: "An X-ray Crystal Spectrometer", The
Handbook of Atomic Collisions - Apparatus -, Study Group of Fundamental Atomic
Process, p. 194 (1981).
220
4) T. Tonuma, A. Yagishita , M. Kase, T. Kambara , Y. Awaya , and I. Kohno: "Multiple
Ionization of Gas Targets by Ion Bombardment" , Atomic Collision Research in Japan
Progress Report, No.7, p . 76 (1981).
5) T. Kambara , Y. Awaya , A. Hitachi, M. Kase , I. Kohno , and T. Tonuma: "X-Rays from
Radiative Electron Capture Induced 110-MeV Ne-Ions", Atomic Collision Research in
Japan Progress Report, No.7 , p. 78 (1981).
6) E. Vagi , A. Koyama, H. Sakairi, M. Iwaki , and R.R. Hasiguti: "Lattice Location of
Ni Atoms Implanted into Al Crystals as Investigated by Means of Channeling Method" ,
J. Phys. Soc. Japan, 50 , 873 (1981) .
7) H. Sakairi , E. Vagi, A. Koyama, and R.R. Hasiguti: "Atomic Replacement in Ordered
Cu3Au Alloy Irradiated with Protons, a-Particles and Carbon Ions from a Cyclotron" ,
J. Phys. Soc. Japan, 50 , 3023 (1981).
8) H. Kirihata and M. Uda: "Externally Quenched Air Counter for Low-energy Electron
Emission Measurements", Rev. Sci. Instr. , 52 , 68 (1981).
9) E. Vagi , H. Bossy , K.P. Doring, M. Gladisch , D. Herlach, M. Matsui , H. Orth , G. zu
Putlitz , A. Seeger, and 1. Vetter: "Longitudinal Muon Spin Relaxation in a-Iron in
High Magnetic Fields" , Hyperfine Interaction , ~, 553 (1981).
10) H. Endo. M. Uda, and K. Maeda : "Influence of the Chemical Bond on the Intensities
of F Ka X-Ray Satellites Produced by Electron and Photon Impacts" , Phys. Rev. A 22,
1436 (1981).
11) M. Uda , H. Endo , K. Maeda , Y. Sasa , and M. Kobayashi: "Chemical Effect on F Ka
X-Ray Satellites Produced by 6 MeV/amu P, 0: and C4+" , Z. Phys. A - Atom and Nuclei ,
300, 1 (1981).
12) A. Yagishita: "Ionization Cross Sections of Krypton M-Subshells by Electron Impact" ,
Phys. Lett. , 87A, 30 (1981).
13) A. Yagishita , H. Hanashiro, S. Ohtani, and H. Suzuki: "The Kr M2, 3M4SN23 Coster
Kronig Processes Following Electron Impact Ionization", J. Phys. B, i±, L 777 (1981).
4. Radiochemistry , radiation chemistry and radiation biology
1) T. Nozaki, T. Karasawa, M. 10, K. Imamura, S. !ida, and H. Yoshida: "Present Status
in the Use of the Prototype Baby Cyclotron", J. Label. Compo & Radiopharm. , !..§., 181 (1981).
2) T. Nozaki and M. Iwamoto: "Some Fundamental Data Concerning the Formation of
Low Z Radionuclides", J. Label. Compo & Radiopharm., ~, 230 (1981).
3) T. Nozaki and M. Iwamoto: "Yield of 140 for the Reactions 14N(p, n) 140 ,
12CeHe, n) 140 and 12C(a, 2n) 140" , Radiochim. Acta, 29, 57 (1981). 4) H. Muramatsu, H. Nakahara, and M. Yanokura: "Production of 119mSn by Alpha
Particle Bombardment of 116Cd and Its Carrier-free Separation" , J. Inorg. Nucl. Chern.,
43 , 1727 (1981).
5) F. Ambe and S. Ambe: "A Site Distribution of Dilute 119Sb and 119m Te on
Solidification of SnTe and SnSb by Mossbauer Emission Spectroscopy of 119Sn", J.
Chern. Phys., 75, 2463 (1981).
221
6) T. Tonuma, Y. Awaya, T. Kambara, H. Kumagai, M. Kase, A. Yagishita , and I Kohno:
"Krypton KB/K(X Intensity Ratios for 6 MeV /amu Ion Bombardment", Inner-Shell and
X-ray Physics of Atoms and Solids , Prenum Press, New York and London , p. 153 (1981).
(Papers Presented at Meetings)
1. Machine development and accelerator physics
1) N. Nakanishi , T. Wada , A. Goto, Y. Yano, S. Motonaga, and H. Kamitsubo: " Orbit
Analysis 4 in the IPCR SSC", 36th Ann. Meeting of the Phys. Soc. Japan, Hiroshima,
Mar. (1981).
2) A. Goto, Y. Yano, T. Wada , and N. Nakanishi: "Orbit Calculation of the Injection
System for the RIKEN SSC", 36th Ann. Meeting of the Phys. Soc. Japan, Hiroshima,
Apr. (1981).
3) M. Hara, T. Wada, T. Fujisawa, and K. Ogiwara: "Three Dimensional Analysis of RF
Electromagnetic Field by Finite Element Method" , 36th Ann. Meeting of the Phys. Soc.
Japan, Hiroshima, Apr. (1981).
4) M. Hara, T. Wada, M. Odera, and F . Kikuchi: "Calculation of RF Cavities with Axial
Symmetry by Finite Element Method", 6th Meeting on Linear Accelerator in Japan,
Sapporo, July (1981).
5) Y. Yano, N. Kishida, H. Takebe , A. Goto , T. Wada, and S. Motonaga: "Beam Injection
and Extraction System for the IPCR SSC", 9th Intern. Conf. on Cyclotrons and their
Applications, Caen, France, Sept. (1981).
6) A. Goto, Y. Yano, N. Kishida, N. Nakanishi, and T. Wada: "Calculation of Injection
and Extraction Orbits for the IPCR SSC", 9th Intern. Conf. on Cyclotron and their
Applications, Caen, France, Sept. (1981).
7) S. Motonaga, H. Takebe, T. Wada, A. Goto, J. Fujita, Y. Oikawa, I. Takeshita, and Y.
Ikegami: "The Sector Magnet for the IPCR SSC", 9th Intern. Conf. on Cyclotron and
their Applications, Caen, France, Sept. (1981).
8) N. Nakanishi, A. Goto, Y. Yano, and T. Wada: "Beam Dynamics for the IPCR SSC" ,
9th Intern. Conf. on Cyclotron and their Applications, Caen, France , Sept. (1981).
9) M. Hara, T. Fujisawa, and K. Ogiwara: "The RF System for the IPCR SSC", 9th
Intern. Conf. on Cyclotron and their Applications, Caen, France, Sept. (1981).
10) T. Fujisawa, M. Hara, and K. Ogiwara: "Method to Vary Resonant Frequency of
Resonator of IPCR SSC", 1981 Fall Meeting of the Phys. Soc. Japan, Matsue, Sept.
(1981).
11) N. Nakanishi , A. Goto, and Y. Yano: "Orbit Analysis 5",1981 Fall Meeting of the
Phys. Soc. Japan, Matsue, Oct. (1981).
12) A. Goto, H. Takebe, S. Motonaga, T. Wada, Y. Yano, and Y. Tanaka: "Design of the
Trim Coils for the RIKEN SSC", 1981 Fall Meeting of the Phys. Soc. Japan, Matsue,
Oct. (1981).
13) M. Hara, T. Wada, T. Fujisawa, K. Ogiwara, and F. Kikuchi: "Calculation of RF
Electromagnetic Field by Finite Element Method", 1981 Fall Meeting of the Phys. Soc.
Japan, Matsue, Oct. (1981).
222
14) T. Inamura, N. Kishida, and H. Saito: "A Design Study of the RIKEN SSC Beam Handling
System", 1981 Fall Meeting of the Phys. Soc. Japan, Matsue, Oct. (1981).
15) Y. Yano, A. Goto , N. Nakanishi, T. Wada , and N. Kishida: "Beam Centering in the SSC",
1981 Fall Meeting of the Phys. Soc. Japan, Matsue, Oct. (1981).
16) M. Hara , T. Wada , and A. Toyama: "Calculation of RF Electromagnetic Field by Finite
Element Method", Meeting on Calculation of Electromagnetic Field by Computer, Wako,
Nov. (1981).
2. Nuclear physics and nuclear instrumentation
1) T. Inamura : "Is Massive Transfer Preequilibrium?" , Symp. on Transport Phenomena in
Heavy-Ion Reactions, INS , Tokyo , Feb. (1981).
2) T. Nomura: "Fast Light-Particle Emission and Preequilibrium Phenomena", Symp. on
Heavy-Ion Nuclear Reaction, Tsukuba, Mar. (1981).
3) T. Inamura: "Massive Transfer" , Symp. on Heavy-Ion Nuclear Reactions , Tsukuba,
Mar. (1981).
4) T. Fujisawa, N. Kishida, T. Kubo, T. Wada, T. Hasegawa, M. Sekiguchi, N. Ueda, M.
Yasue, F. Soga, H. Kamitsubo , M. Nakamura, K. Hatanaka, Y. Wakuta , T. Tanaka,
A. Nagao, and Y. Toba: "Analyzing Power-Polarization Inequality in the Inelastic
Scattering of Protons on 12C for Incident Energies from 22.0 to 29.0 MeV", 36th Ann.
Meeting of the Phys. Soc. Japan, Hiroshima, Mar. (1981).
5) A. Ichimura and M. Ichimura: The Normalization of the Channel Coupling Effect to
the Optical Potential in Heavy-Ion Inelastic Scattering", 36th Ann. Meeting of the
Phys. Soc. Japan , Hiroshima, Mar. (1981).
6) S. Yamaji, A. Iwamoto , K. Harada , and S. Yoshida: "Numerical Analysis of the 63Cu
+ 197 Au Reaction", 36th Ann. Meeting of the Phys. Soc. Japan , Hiroshima, Apr. (1981).
7) Y. Nagame, 1. Kohno, M. Yanokura, H. Nakahara, H. Kudo , and K. Sueki: "Heavy
Particle Emissions in Reactions between 20Ne + sOCr(ll)", 36th Ann. Meeting of the
Phys. Soc. Japan, Hiroshima, Apr. (1981).
8) K. leki , M. Ishihara, T. Nomura , S. Kohmoto, H. Utsunomiya , and T. Sugitate: "Light
Particle Emission in Heavy-Ion Reaction", 36th Ann. Meeting of the Phys. Soc. Japan,
Hiroshima, Apr. (1981).
9) T. Nomura: "Preequilibrium Phenomena in Heavy-Ion Reactions", Symp. on Nucleus
Nucleus Collision and Cluster Structure, Kyoto, Aug. (1981) .
10) Y. Nagame, 1. Kohno, H. Nakahara, M. Yanokura, H. Kudo, K. Sueki, and M. Takahashi:
"Heavy Particle Emissions in Reactions between 20Ne and sOCr, s4Cr(lII)" , 1981 Fall
Meeting of the Phys. Soc. Japan, Matsue, Oct. (1981).
11) S. Yamaji, A. Iwamoto, K. Harada, and S. Yoshida: "Mass Diffusion Coefficients in
the Adiabatic Approximation", 1981 Fall Meeting of the Phys . Soc. Japan, Matsue,
Oct. (1981).
12) H. Muramatsu , T. Miura, H. Nakahara, M. Fujioka, E. Tanaka, Y. Arai, and A.
Hashizume: "Conversion Electron Measurements of 119Sb Implanted Samples", 1981
Fall Meeting of the Phys. Soc. Japan, Matsue , Oct. (1981).
13) T. Inamura and M. Wakai: "Calculation of Gamma-Ray Multiplicity Moments
Associated with Massive Transfer Reactions", 1981 Fall Meeting of the Phys. Soc.
Japan, Matsue, Oct. (1981).
223
14) M. Sasagase, Y. Gono, T. Kubo, Y. Itoh, S. Hayashibe, and M. Sugawara: "Search for
the a-Particle Emission from High Spin Yrast Region", 1981 Fall Meeting of the Phys.
Soc. Japan, Matsue, Oct. (1981).
15) M. Sasagase, H. Kumagai, M. Odera, T. Wada, and T. Inamura: "Data Processing System
at RILAC", 1981 Fall Meeting of the Phys. Soc. Japan, Matsue, Oct. (1981).
16) K. Ieki, M. Ishihara, T. Inamura, and S. Kohmoto: "Light Particle Emission in Heavy
Ion Reaction 2", 1981 Fall Meeting of the Phys. Soc. Japan, Matsue, Oct. (1981).
17) A. Ichimura and M. Ichimura: "Extended Brink Model and its Derivation from Distorted
Wave Born Approximation", 1981 Fall Meeting of the Phys. Soc. Japan, Matsue, Oct.
(1981).
18) H. Muramatsu, T. Miura, H. Nakahara, M. Fujioka, E. Tanaka, Y. Arai, and A.
Hashizume: "Chemical Effect on Outer-Shell Internal Conversion in 119Sn", 25th Symp.
on Radiochemistry, Tsukuba, Oct. (1981).
19) Y. Nagame, H. Kudo, K. Sueki, M. Takahashi, H. Nakahara, I. Kohno, and M.
Yanokura: "Heavy-Ion Reactions between 20Ne and sOCr, S4Cr", 25th Symp. on
Radiochemistry, Tsukuba, Oct. (1981).
20) K. Sueki, Y. Nagame, M. Takahashi, H. Nakahara, and I. Kohno: "Heavy-Ion Reaction
between 14N and 62 Ni", 25th Symp. on Radiochemistry, Tsukuba, Oct. (1981).
3. Atomic and solid-state physics
1) T. Nomura: "Fast Light-Particle Emission and Its Polarization", Proc. of Joint Meeting
on Atomic Collision and Heavy-Ion Nuclear Reactions, Wako, Feb. (1981).
2) Y. Awaya: "On the Multiple Inner-Shell Ionization", Proc. of Joint Meeting on
Atomic Collisions and Heavy-Ion Nuclear Reactions, Wako, Mar. (1981).
3) E. Yagi, H. Bossy, K.P. Doring, M. G1adisch, D. Herlach, H. Matsui, H. Orth, G. zu
Putlitz, A. Seeger, and 1. Vetter: "Diffusion of Positive Muons in a-Iron", Ann. Meeting
of the Phys. Soc. Japan, Hiroshima, Mar. (1981).
4) A. Yagishita and T. Nakamura: "Design of Auger-Electron Spectrometer", Ann. Meeting
of the Phys. Soc. Japan, Hiroshima, Mar. (1981).
5) A. Hitachi, H. Kumagai, and Y. Awaya: "A X-ray Crystal Spectrometer by Adopting a
Position Sensitive Proportional Counter", Symp. of Position-Sensitive Radiation
Detectors and Their Applications, Wako, Mar. (1981).
6) A. Hitachi, H. Kumagai, T. Katou, and Y. Awaya: "A Broad Range X-ray Crystal
Spectrometer", Ann. Meeting of the Phys. Soc. Japan, Hiroshima, Apr. (1981).
7) A. Yagishita, H. Suzuki, S. Ohtani, and H. Hanashiro: The Kr M2, 3M4SN23 and Ar
Ll L23 M23 Coster-Kronig Processes Following Electron Impact Ionization", XII Intern.
Conf. on the Physics of Electronic and Atomic Collisions, Gatlinburg, July (1981).
8) Y. Awaya, A. Hitachi, H. Kumagai, T. Tonuma, T. Kambara, M. Kase, and A.
Yagishita~ "A Broad Range Crystal Spectrometer and X-rays Following Multiple Inner
Shell Ionizations", XII Intern. Conf. on the Physics of Electronic and Atomic
Collisions, Gatlinburg, July (1981).

224
9) M. Uda, K. Maeda, Y. Sasa, and A. Koyama: "Chemical Effect on X-ray Spectra
Produced by 2.4 MeV He++", XII Intern. Conf. on the Physics of Electronic and
Atomic Collisions, Gatlinburg, July (1981).
10) N. Shiotani, H. Narumi, H. Arai, K. Wakatsuki, Y. Sasa, and T. Mizoguchi:
"Crystallization Processes of Amorphous Mg-Zn Alloys", 4th Intern. Conf. on Rapidly
Quenched Metals, Sendai, Aug. (1981).
11) N. Shiotani, S. Tanigawa, H. Iriyama, and T. Mizoguchi: "Crystallization of Amorphous
Mg70 Zn30 Studied by Positron Annihilation", Intern. Conf. on Amorphous System
Investigated by Nuclear Methods, Balatonfured, Sept. (1981).
12) A. Hitachi, H. Kumagai, Y. Awaya, M. Kase, T. Kambara, T. Tonuma, and A.
Yagishita: "The Measurement of X-rays Following Inner-Shell Ionizations by using a
Broad Range Crystal Spectrometer", Fall Meeting of the Phys. Soc. Japan, Niigata, Oct.
(1981).
13) A. Yagishita, H. Suzuki, S. Ohtani, and H. Hanashiro: "Read Effects on Kr MMN
Coster- Kronig Processes Following Electron Impact Ionization", Fall Meeting of the
Phys. Soc. Japan, Niigata, Oct. (1981).
14) A. Yagishita: "Ionization Cross Sections of Kr 3p- and 3d-subshells by Electron
Impact", Fall Meeting of the Phys. Soc. Japan, Niigata, Oct. (1981).
15) K. Maeda, Y. Sasa, K. Fuwa, and M. Uda: "Chemical Effect on 0 Kcx Spectra Induced
by He Ions", Ann. Meeting of the Phys. Soc. Japan, Niigata, Oct. (1981).
16) M. Uda, K. Maeda, Y. Sasa, and A. Koyama: "Chemical Effect on Multiply Ionized
X-ray Spectra", Ann. Meeting of the Phys. Soc. Japan, Niigata, Oct. (1981).
17) K. Fuwa, K. Fujima, and M. Uda: "Intensity Analysis of F Kcx Satellites for Fluorine
Compounds", Ann. Meeting of the Phys. Soc. Japan, Niigata, Oct. (1981).
18) M. Iwaki, O. Yoshio, T. Matsuda, K. Takahashi, and K. Yoshida: "Ion Implantation
through Aluminum Deposited Iron Plates", 42th Fall Meeting of the Japan Soc. Appl.
Phys., Fukui, Oct. (1981).
19) S. Sato, M. Iwaki, H. Sakairi, and I. Akiyama: "Ion Implantation in Diamond (I)", 42th
Fall Meeting of the Japan Soc. Appl. Phys., Fukui, Oct. (1981).
20) K. Hirose, N. Yokoyama, N. Imajo, I. Odomari, K. Fuwa, and M. Uda: "Electronic
Structures of Pd2 Si and PtSi Observed with ESCA", 42th Fall Meeting of the Japan
Soc. Appl. Phys., Fukui, Oct. (1981).
21) T. Takahashi, Y. Awaya, T. Tonuma, H. Kumagai, K. Izumo, A. Hitachi, and A.
Hashizume: "Energy Straggling of 5 - 7 MeV /amu C and He Ions", 42th Fall Meeting
of the Japan Soc. Appl. Phys., Fukui, Oct. (1981).
22) Y. Awaya: "X-ray Spectroscopy and Ion-Induced X-rays", Symp. of Atomic
Spectroscopy and Atomic Structure, Wako, Oct. (1981).
23) T. Takahashi: "Straggling of Heavy Ions", Symp. of Ion Beam Analysis, Wako, Oct.
(1981).
24) N. Yamamoto, H. Shiraishi, H. Yoshida, H. Kamitsubo, I. Kohno, and T. Shikata:
"Creep Properties in Helium Injected SUS 316 and ," Precipitation Strengthened
Alloy", 1981 Autumn Meeting of the Japan Institute of Metals, Kyoto, Nov. (1981).
25) H. Sakairi, E. Yagi, A. Koyama, and R.R. Hasiguti: "The Damage Function Based on

225
the Focusing Collision Model", Intern. Conf. (Yamada Conf. V) on Point Defects and
Defect Interactions in Metals, Kyoto, Nov. (1981).
26) Y. Awaya: "Studies of Atomic Physics by Using Accelerators of Riken", Symp. of
Studies by Using Accelerators, Wako, Dec. (1981).
4. Radiochemistry, radiation chemistry and radiation biology
1) S. Ambe and F. Ambe: "Mossbauer Emission Study of Defect 119Sn Atoms in
a-Irradiated SnSe", 43th National Meeting of the Chern. Soc. Japan, Tokyo, Apr.
(1981).
2) T. Nozaki: "Charged Particle Activation Analysis" , Japan-Taiwan Cojoint Meeting on
the Use of Small Accelerators, Taipei, May (1981) .
3) T. Nozaki: "Chemical Separation of 18F as KBF 4 in Oxygen Analysis by the
160eHe, p)18 F Reaction", Intern. Symp. Modern Trends in Activation Analysis,
Toronto, June (1981).
4) Y. Itoh and T. Nozaki: "Depth Profiling of Oxygen by Activation with the 160 eHe, p )18F Reaction", Intern. Symp. Modern Trends in Activation Analysis,
Toronto, June (1981).
5) H. Emori, M. Umehara, M. Takeya, K. Nomura, Y. Terai, and T. Nozaki:
"Determination of Oxygen in by 3He Activation Analysis" , 1981 Intern. Symp. on
Gallium Arsenide and Related Compounds, Oiso, Sept. (1981).
6) S. Ambe, F. Ambe, and T. Okada: "Adsorption Kinetics of Carrier-free 119Sb(V) onto
a-Fe2 0 3", 25th Symp. on Radiochem., Tsukuba, Oct. (1981).
7) T. Masui, S. Muraoka, and T. Nozaki: "Determination of IR Absorption Coefficient
of Nitrogen in Silicon by Charged Particle Activation", 25th Symp. on Radiochem.,
Tsukuba, Oct. (1981).
8) Y. Itoh and T. Nozaki: "Heat Treatment Behavior of Oxygen in Silicon as Measured by
Charged Particle Activation Analysis", l60th Fall Meeting of the Electrochem.
Soc., Denver, Oct. (1981).

226
VIT. LIST OF OUTSIDE USERS AND THEIR THEMES
(Jan. - Dec. 1981)
1) M. Watanabe and T. Usami
"Radiochemical Analysis of Band 14N in
Si Crystal"
2) T. Abe
"Radiochemical Analysis of C and 160 in
Si Crystal"
3) H. Emori
"Radiochemical Analysis of 160 in GaAs"
4) H. Nakahara and M. Takahashi
"Production of 59Co"
5) K. Yuita
"Production of 77Br"
6) Y. Homma
"Production of 87 my"
7) Y. Higashiguchi
"Development of Ferritic Stainless Steel
for Reactor"
8) K. Fukai and T . Furuta
"Helium Implantation Effect on Creep
Repture Properties of Modified 316
Stainless Steel for Reactor Material
9) T. Matsutani
"Study of Effect by Bombarding High
Energy Proton on a Solar Cell"
Toshiba R&D Center
Shinetsu Semiconductor Co., Ltd.
Mitsubishi Metal Co., Ltd.
Faculty of Science, Tokyo
Metropolitan Univ.
National Inst. of Agricultural Sciences
Kyoritsu College of Pharmacy
Research Inst. for Iron, Steel and Other
Metals, Tohoku Univ.
Japan Atomic Energy Research Inst.
Electronic Parts Div. ,
Sharp Co., Ltd.

10) S. Yoshida
"Study of Effect by Bombarding High Energy
Proton on a Solar Cell"
11) T. Fukushima
"Study of Effect by Bombarding High Energy
Proton on I.C. and Transistor"
12) M. Hiranuma
"Photograph of Cyclotron Beam"
LSI Research and Development Lab.,
Mitsubishi Electric Co., Ltd.
Kamakura Factory,
Mitsubishi Electric Co., Ltd.
Nomura Research Inst.
227
228
VIll. LIST OF SEMINARS
(Jan. - Dec. 1981)
1) S. Yoshida, Tohoku Univ. (Sendai), 13 January
"Nuclear Reactions to Continuum Final States"
2) H. Ikegami, RCNP (Osaka), 24 January
"High Resolution Momentum - Mass Analyzer"
3) K. Shima, Tsukuba Univ. (Tsukuba), 17 February
"Charge Changing of Energetic Heavy Ions"
4) N. Onishi, Univ. of Tokyo (Tokyo), 24 February
"Wobbling Mode in High Spin States"
5) J. Grosset, Saclay (France), 3 March
"Time-Projection Counter for H.I. Reactions"
6) A. Policarpo, Univ. of Coimbra (Portugal), 9 March
"Photo-Ionization and Proportional Scintillation in Nuclear Radiation Detection"
7) T. Doke and T. Hayashi, Waseda Univ. (Tokyo), 9 March
"Isotope Identification by CR-39 Plastic Track Detectors"
8) 1. Suzuki, Agency of Industrial Science and Technology (Tsukuba), 10 March
"Spectroscopy of (e, 2e) in Atomic and Molecular Physics"
9) F. Kikuchi, Univ. of Tokyo (Tokyo), 13 March
"On the Problems of the Finite Element Method"
10) K. Otsuka, JAERI (Tokai), 24 March
"Particle Emissions from the Preequilibrium States in the Heavy Ion Reactions and Recent
Topics on the Application of IBM to Rotational Nuclei"
11) N. Takahashi , Texas A & M Univ. (USA), 8 April
"Massive Transfer Reactions on Light Targets on Their Relation to Molecular Resonances"
12) T. Watanabe, Univ. of Tokyo (Tokyo), 21 April
"Theory of Ion-Atom Collision"
13) R.D. Levine, The Hebrew Univ. Jerusalem (Israel), 28 April
"Surprisal Analysis: A Constrained Phase - Space Approach to Heavy Ion Collisions"

14) K. Sato, INS (Tokyo), 13 May
"RF System (MOPA) of the INS SF-Cyclotron"
15) H. Ohnuma, Tokyo Institute of Technology (Tokyo), 10 June
"Excitations to GT -States by (p, n) Reactions"
16) F. Soga, INS (Tokyo), 17 June
"Near-Threshold Pion Production from Nuclei by Proton Bombardment"
17) D.A. Swenson, LASL (USA), 24 June
"RFQ Linacs for Light- and Heavy-Ion Acceleration"
18) N. Takigawa, Tohoku Univ. (Sendai), 27 July
"Charge Equilibration in Deep Inelastic Heavy Ion Collision"
19) S. Honma, INS (Tokyo), 26 August
"Deuteron Emission from Reactions Induced by High Energy ')'-Rays"
20) S. Ohtani, Nagoya Univ. (Nagoya), 8 September
229
"EBIS Ion Source and Atomic Collision Experiment using the Ion Source at Institute of
Plasma Physics"
21) H. Hamagaki, INS (Tokyo), 9 September
"Present Status of the Experiment using HISS"
22) T. Fujita, Nihon Univ. (Tokyo), 13 October
"Projectile Fragmentation in High Energy Nucleus - Nucleus Collision"
23) D. Diamond, LBL (USA), 23 October
"Spectroscopy on High-Spin States with Continuum and Discrete ')'-Rays"
24) I. Hamamoto, Nordita (Denmark), 26 October
"Rotation Properties of High-Spin States in Deformed Nuclei"
25) A. Iwamoto, JAERI (Tokai), 20 November
"Energy Spectra of ~-Particles Emitted in the Preequilibrium Process"
26) I. Tanihara, INS (Tokyo), 25 November
"Two-Particle Correlations in High Energy Heavy Ion Collisions"
27) S. Ban, KEK (Tsukuba), 3 December
"On the Neutron Shielding"

230
IX. LIST OF PERSONNEL
Members of the Board
HAMADA Tatsuji ~ EEl :@ - HASHIZUME Akira ~ m AA IMAMURA Masashi A M E3 KAMITSUBO Hiromichi I ii¥ 7.i. -, E3
KOHNO Isao iUI !T Jj]
NOZAKI Tadashi !T dffij 1£ (Chairman) SAKAIRI Hideo jJj A ~ m SHIMA Makoto ~ ~
Cyclotron Operation and Maintenance Group
FUJITA Shin Wi EEl ~JT
KAGEYAMA Tadashi ~ UJ 1£ KOHNO Isao iOJ !T Jj]
TAKEBE Hideki lit {ff"S ~ ;fM
Linac Operation and Maintenance Group
CHIBA Y oshiaki T * !It Iff{
HEMMI Masatake ~ 5'! i& lEt INOUE Toshihiko #- I ~ ~
KASE Masayuki 110 i*1i l§ ~
MIY AZA WAY oshitoshi g iR it ~
Y ANOKURA Minoru 1fi:.!T ~ ~
Scientific and Engineering Personnel
Cyclotron Laboratory
FUJISA WA Takashi WM iR ~ ~.;
GOTO Akira ~ iIi ~;
ICHIMURA Atsushi $ M INAMURA Takashi fffi t>.t KAMITSUBO Hiromichi I KISHIDA Norio J¥ EEl ~Ij
KOHNO Isao iOJ !T Jj]
iJf.
.$.
ii¥ 7.i. (±
NAKAJIMA Shunji cP m ~, -NOMURA Toru !f M 7-
SHIKAT A Takashi ~ 15 I~ 5: Y AMAJI Shuhei UJ ~~ {~ ~
(Visitors)
;@
MORI Kazuo ~ :jc
ODERA Masatoshi IJ\ ~ 1£ f!;f
SEKIZAWA Hisashi I*l iR ~
UDA Masayuki ¥ EEl £t ~
IKEGAMI Kumio iili 1:-. 11 .=. 1=)3 KOHARA Shigeo , j, Dit m * OGIWARA Kiyoshi ~ mt m
GONO Yasuyuki ~~ e ~ z IKEZA WA Eiji iili iR !Jf: = KAMBARA Tadashi t$ &i 1£ KUBO Toshiyuki 7-... 1* ~ :$ TONUMA Tadao P m 1£ m
FUJITA liro Jii EEl = &~
HARA Masahiro mI ~ "51.
IKEGAMI Yuji iili -.t f:tj 5]
ISHIHARA Masayasu :tr mt 1£ KARAS A W A Takashi @= iR 4-KOHMOTO Susumu iOJ * ~
MOTONAGA Shoshichi 7C 71<- BH NAKANISHI Noriyoshi cP ~ $2
SAITO Haruko * iIi ~ T WADA Takeshi fD EEl m Y AN 0 Yasushige Ifo:. !T 'IX. ~
HA Y AKA W A Shunichiro !f! J II {!;f - &~ (Dept. Phys., Waseda Univ.) HIRUTA Kotaro ft EEl :$* &~ (Dept. Phys., Tokyo Gakugei Univ.)
~
;@
t ~
~
ICHIMURA Munetake $ M * lEt (lnst. Phys., College General Education, Univ. of Tokyo)
NAKAHARA Hiromichi cP Jjji 51. :@: (Dept . Chern. , Tokyo Metropolitan Univ.) SATO Kenichi 1ti: 1fi ~ - (Dept. Phys., Tohoku College of Pharmacy) SHIRAISHI Haruki B E ~ W (Nat . Res. Inst. for Metals) TAKEMASA Tadashi fFt iJ& J3" ± (Dept. Phys., Saga Univ.) TAKIGAWA Noboru ~ JII §f. (Dept . Phys. , Tohoku Univ.) YOSHIDA Shiro 6" EB }~'- a~ (Dept. Phys. , Tohoku Univ.) UTSUNOMIYA Hiroaki ~ t~ g 51. * (lnst. Nucl. Phys. , Univ. of Tokyo)
(Students)
BAN Mitsuo 1* 7t ~ (Facul. Sci. and Eng. , Chuo Univ.) HOSOYAMA Michio *fB UI = -=f~ (Facul. Sci. and Eng. , Chuo Univ.) IEKI Kazuo * W< :to :;t;:. (Dept. Phys. , Kyoto Univ.) MASHIY AMA Tsuguo t~ UJ ?!x -!J3 (College of Hum. and Sci., Nihon Univ.) NAGAME Yuichiro 7k El ~- a~ (Dept. Chern. , Tokyo Metropolitan Univ.) OBANA Yoshiki IJ\ TE 7i * (Dept. Phys. , Chiba Univ.) SUGITATE Toru ;f~ 1L 1fiX (Dept. Phys. , Tokyo Inst. Technol.) TANAKA Yasushi EB cP 1* ,~ (Facul. Sci. and Eng. , Chuo Univ.) TOY AMA Akifumi :7t UJ Btl )( (College of Hum. and Sci. , Nihon Univ.) WATANABE Mitsuyuki iN. ill * ~ (College of Hum. and Sci. , Nihon Univ.)
Linac Laboratory
CHIBA Y oshiaki -=f ~ H Bfj CHIBA Toshiya HEMMI Masatake INOUE Toshihiko
-=f m f lJ ~ GONO Yasuyuki ~~ III ITfi z ~ 9[ iJ& tEl::
ft- J:. fiN 1ft KASE Masayuki 110 i*~ I§ z
231
HOSHINO Kiichi ~ ff *2 KAMBARA Tadashi t~l Jjji if
KUBO Toshiyuki ~ 1* ~ ~ MIY AZA WAY oshitoshi '@ iR {t fijj(
ODERA Masatoshi IJ\ ~ if {~ SASAGASE Masaji 1ft T i*~ if TONUMA Tadao p iB if m Y AGISHIT A Akira fYD T BjJ
YANOKURA Minoru ~ff e '#;
(Visitors)
DOKE Tadayoshi @ * ,~, :R (Sci. and Eng. Res. Lab ., Waseda Univ.) EJIRI Hiroyasu iI JfL 7i. ~ (Dept. Phys. , Osaka Univ.) FUKUZAWA Fumio f~ /R )( a (Dept. Nucl. Eng. , Kyoto Univ.) HARADA Kichinosuke Jjji EB ~ z M (Japan Atomic Energy Res. Inst.) HAYASHIBE Shogo ** $ Btl ?fi (Dept. Phys. , Tohoku Univ.) HISATAKE Kazuo ~ tEl:: fO :;t;:. (Tokyo Inst. Technol.) ISHII Keishi E ft- ~ Z (Dept. Nucl. Eng., Kyoto Univ.) ITO Noriaki fft 1fi J!J BB (Dept. Crystalline Materials , Nagoya Univ.) KAWAI Nanao 1iiJ ~ -t a (Osaka Univ.) MASUDA Kozo :fI- EE 0. = (Tsukuba Univ.) MATSUI Masao f~ ft- 1E :;t;:. (Nagaoka Sci. and Tech. Univ.) MORITA Susun1u ~ EE 1J (College of Eng., Hosei Univ.) OHNO Shinichi 1\. ff ~JT (Japan Atomic Energy Res. Inst.) OZAWA Kunio IJ\ /R I~ :;t;:. (Japan Atomic Energy Res. Inst.) SAKISAKA Masakatsu IPJ :t)X if 1m (Dept. Nucl. Eng. , Kyoto Univ.) TAKEDA Shigeru it EE ~ (Nat. Lab. High Energy Phys.)

232
TAW ARA Hiroyuki f~
TSURUBUCHI Seiji i.~
YOSHIZA WA Yasukazu
t~ ~ (Dept. Nucl. Eng., Kyushu Univ.) V:i EJR - (Dept. Eng., Tokyo Univ. Agric. Tech.) 6" v~ r~t fD (Dept. Phys., Hiroshima Univ.)
Radiation Laboratory
AWAY A Yohko ~ ~ {}:
HASHIZUME Akira ~ m IZUMO Koichi ill '!l: -Jr: KONNO Satoshi ~ illf
-f
Wi
'kn II
HAMADA Tatsuji i~ III
HITACHI Akira fl tJ'l
KATOU Takeo 110 Iii If\: KUMAGAI Hidekazu jl~
OKANO Masaharu ~(,J illf ~ it TAKAHASHI Tan I;::J m TENDOW Yoshihiko A ill 7i ®:
(Visitors)
DOKE Tadayoshi ill * ,~ .:N: (Sci. and Eng. Res. Lab ., Waseda Univ.) FUJIOKA Manabu Tfii fIliJ ''[: (Dept. Phys., Tohoku Univ.) HA Y ASHIBE Shogo H §g O{{ g (Dept. Phys. , Tohoku Univ.)
ISHII Keizo 11 i-l M :@ (Cyclotron, Tohoku Univ.) MIURA Taichi _. iffi A -- (Dept. Chern., Tokyo Metropolitan Univ.)
ii -!¥t Mt
/.\:. I-l ~
Ji
MURAMATSU Hisakazu :Ft fl ~ fu (Dept. Chern., Tokyo Metropolitan Univ.) MORITA Susumu ~ 83 -;fi (College of Eng., Hosei Univ.) NAGAHARA Teruaki 7"k Js;'[ q~
TAWARA Hiroyuki 1* tWo ~
WATANABE Tsutomu ilfr ill.
Thermonuclear Fusion Laboratory
ANDO Kozo 12 fli I I{~ IJ ~.
Metal Physics Laboratory
BJj (lnst. Atomic Energy, Rikkyo Univ .) (Dept. Nucl. Eng., Kyushu Univ.)
-}] (Dept. Eng., Univ. of Tokyo)
MORI Kazuo ~ - -*
fD
KOYAMA Akio IJ\ I I I OR m Y AGI Eiichi /\ :;}: *
SHIOT ANI Nobuhiro tr;JI :& § ~b
Magnetic Materials Laboratory
ASAI Kichizo r~ if ~ Jil SAKAI Nobuhiko t& ,1-1: {i--i' @:
Solid-State Chemistry Laboratory
ENDO Hiroshi :i8t ~ ~
MAEDA Kuniko HI} III F~ }-UDA Masayuki ¥ III }J ~; Z
(Visitor)
ODOMARI I wao 1\. iB lit
OKADA Takuya )ili]
SEKIZA W A Hisashi
KOBA Y ASHI Masayoshi /J\ 1';/\ H ~
SASA Y oshihiko {iL q ~ ®:
(Students)
FUWA Koh ~ &l m (School of Sci. Eng. , Waseda Univ.) HIROSE Kazuyuki Jt ~~ :to z (School of Sci. Eng., Waseda Univ.)
IMAJO Nobuhiko ~ jJt< 1§" "& (School of Sci. Eng., Waseda Univ.) YOKOYAMA Natsuki tit UJ ~ ;fit (School of Sci. Eng., Waseda Univ.)
Radiochemistry Laboratory
AMBE Fumitoshi '!i!: $ X fill. ARATANI Michi m ~ ~ ~
IWAMOTO Masako :'fi * 1I =r-
AMBE Shizuko '!i!: M) fIt =r-ITO Y oshiko {:=Jj * jj T NOZAKI Tadashi ff ~ 1I
TERAI Yoshiro ~ j:j: ~ f!~
(Visitors)
SUGITA Yoshimitsu f5 B3 -=2i ft (Dept. Phys., Toyama Univ.) T AKI Ko ;1[ ¥ (Dept. Hygen., Ki taza to U niv.) USAMI Katsuhisa '¥fi: ~ IJ~ ~ (Hitachi Res. Lab., Hitachi Ltd.)
Radiation Chemistry Laboratory
IMAMURA Masashi ~ if1 EI E I KIMURA Kazuie * if1 - '¥
Radiobiology Laboratory
HATTORI Yukihiko m~ till fj- ~ KANEKO Ichiro ~ T KITAYAMA Shigeru :it tlJ m NAKANO Kazushiro r:p NISHIMURA Tetsuji ~ if1 tJT tEl YATAGAI Fumio Cl
(Visitor)
OHNO Tadao j( ff ,'i!7, :k (National Inst. Radiological Sciences)
(Students)
EGUCHI Kiyomi il 0 m ~ (Dept. Medicine, Tsukuba Univ.) INADA Tetsuo fill B3 :rg m (Dept. Medicine, Tsukuba Univ.)
Safety Control Affairs Office
~B3~
- f!1~
~ :to X *-
IGARASHI Kazui 3i +m rt KOYAMA Masashi IJ\ UJ i& 92.
jJt<
MIYAGAWA Makoto g ) 11 ffi! is SAKAMOTO Ichiro t& * f!~ USUBA Isao ri ~ ~
Beam Analysis Center
IWAKI Masaya :'fi * 1I ~ SAKAIRI Hideo t& A ~ m
233

AUTHOR INDEX
AGATA Katsutoshi ~ IJ9J flJ 83 HOSOY AMA Michio f.1B W ~ + ~ 185
AMBE Fumitoshi * $ )( fit 91, 112, 114 ICHIMURA At sushi -m Ft if!- 28
AMBE Shizuko * $ 'Mt T 91, 112, 114 ICHIMURA Munetake -m Ft * it 17,28
ANDO Kozo * IIi ~IJ = 85 IEKI Kazuo * :/Jt( :fO 7R. 45,48, 119
AWAYA Yohko ~ l¥. ~ T 66,69,70,71 IGARASHI Kazui E+~ - B<: 212
CHIBA Toshiya
CHIBA Y oshiaki
EGUCHI Kiyomi
EMORI Haruo
FUJIOKA Manabu IIi 1m}
FUJISA W A Takashi
133, 144, 148
128, 137, 216
117
103
$ 51
128, 193, 196
IKEGAMI Kumio itB J::. 1t = ~
IKEGAMI Yuji it!! J: tt ~
IMAJO Nobuhiko !f ~ {§" ~
INADA Tetsuo ffB EB rg- fit
11, 125, 198, 200
162, 166, 185
79
117
IN AMURA Takashi ffB Ft !j! 45, 57, 203
INOUE Toshihiko 128, 140, 216
FUJITA Jiro Ii EH = ~B 162, 169, 177, 185 ISHIHARA Masayasu 1) Jw: iE ~ 40, 43, 45, , 48, 86, 119
FUJITA Shin Ii EH fJT 11, 206, 212 ITOH Y oshiko fJt * 7i T 107, 110
FUKUDA Tomokazu tM 83 ;!t fD 40, 43 ITOH Yoshinori fJt * 7i *2 61, 64
FUW A Koh ;If' Ml
GONO Yasuyuki
GOTO Akira ~ IIi
m 75,79
61,64,86, 128
152, 155, 157, 159, 162, 173, 183
HAMADA Tatsuji ~ 83 :i! = 216
IWAKI Masaya ;g * iE ~ 7,98,100
IWAMOTO Akira 20
IWAMOTO Masako ;g * iE T 105
KAGEY AMA Tadashi ~ UJ iE 11
HARA Masahiro 166, 190, 193 KAMBARA Tadashi t$ Jw: iE 69, 70, 71, 128, 141
HARADA Kichinosuke Jw: 83 E L J!jj 20
HASHIZUME Akira 51,54, 121
KAMITSUBO Hiromichi J::. Pf 7.i. i
KISHIDA Norio i¥ 83 ~IJ ~ 179, 183,203 NOZAKI Tadashi !f dffi:l 1£ 103, 105, 107 110, 209
KOHARA Shigeo IJ\ JJjt m ~ 11
KOHMOTO Susumu jiiJ * itt 45 , 48 , 60, 86 ODOMARI Iwao 1\. 1S mt 79
KOHNO Isao 2, 11 , 30, 33, 37 70, 71, 95 , 125 OGATA Hiroshi j[ 40, 43
KOYAMA Akio IJ\ UJ BE Ht 16, 73 , 87 , 88 OGIWARA Kiyoshi T1( JJjt m 11 , 125, 193
KOYAMA Masashi IJ\ ill iI& ~ 212 OHNO Tadao 1\. !f ,~ ~ 117
KUBO Toshiyuki (A. f* iirt ¥ ~h64, 128 OIKAWA Yoshifumi :?t JII ~ 1f~ ~~6' 173, 198
KUBONO Shigeru fA f*!f a; 50 OKADA Takuya IiYiJ 83 !j! ill 91 , 94, 112,114
KUDO Hisaaki I JIi :A. BE 33 SAITO Haruko g JIi BW T 203
KUMAGAI Hidekazu 54,66, 69
rm -tt ~ fo 70, 71 , 121 SAITO Motozou ~ jJi ~{:j = 81 123
MAEDA Kuniko niT 83 :J:~ T 73 , 75 , 77
MASUI Tsumoru m # fl 103
MIURA I wao - 1m :E 40, 43
MIURA Taichi = 1m * 51
SAKAIRI Hideo t& A ~ a 6,16 , 87,88 98
SAKAMOTO Ichiro t& * fl~ 212 , 214, 216
SASA Yoshihiko 16: I:t ~ ~ 73 , 75,77,79
SASAGASE Masaji m T ~Jj iE -60, 61 , 64, 86 , 123
MIY AZA WAY oshitoshi ¢7 ·iO J± ~Jr 128, 133 SATO K . h ' i:5 U\. l± tID<. 139, 140 enlC 1 23
MORI Kazuo ~ ~ 85 SEKIZAWA Hisashi ~ lR · 101 91,94
MORITA Kohsuke ~ EB 1* 11' 50 SHIKATA Takashi ~ 15 ~ ~ 88,95,206
MOTONAGA Shoshichi JC 7]( BE t ~~~: ~~~ SHIMAMURA Akira ~ fj ~ 216
MURAMATSU Hisakazu fj fl (A. fo 51 SHIMODA Tadashi T 83 1£ 40, 43
MURAOKA Shozo fj Iffij 1£ ~ 103 SHIOTANI Nobuhiro i][ ~ g ~L 94
NAGAME Yuichiro 7]( § ~ -fl~ 30,33,37 SHIRAISHI Haruki 8 13 # fM 95
NAKAHARA Hiromichi ¢ JJjt 5b ji ~~ : n SUEKI Keisuke * * ~ 11' 30, 33, 37
NAKAJIMA Shunji cp 8i, g~ - 198, 200 SUGAWARA Masahiko ~ JJjt l§ ~ 61 , 64
NAKAMICHI Takuro r:p ji W fl~ 9'4 SUGITANI Michio :f~ -tt ji AA 50
NAKANISHI Noriyoshi r:p ~ *2 -* i~~; i~~ SUGITATE Toru :f~ 1L W 48
NAKANO Kazushiro r:p !f fO ~ 117 TAKAHASHI Katsuo ~ m ~ ~ 100
NISHI Katsuo e§ R: ~ 81 TAKAHASHI Masato ~ m 1£ A 30, 33, 37
NISHIMURA Tetsuji g§ fj rg jiJ 117 TAKAHASHI Tan ~ m .§. 116
NOMURA Toru !f fj 7- 48, 50, 60, 64, 86 T AKEBE Hideki Jf\ $ ~ ;fit 11, 162, 169 173,177,185

T AKEMASA Tadashi jf\ i& jt ± 26 WADA Takeshi f D EI3 -f:H: 162, 166, 169, 173, 177, m 185,190
TAKESHITA Isao ~ 162, 169, 173, WAKAI Masamichi 198, 200, 216 57
T AKEY A Minoru ¥r .fr ~ 103 WATANABE Masaharu i1t ill iE ew 103
TAKIGAWA Noboru ~ JII :1f 23 Y AGI Eiichi /\ ;1( * - 16, 87, 88
TANAKA Eiji EI3 cp ~ = 51 YAGISHITA Akira WP T BJl 69, 70, 81, 83
TANAKA Masahiko EI3 cp ~ ~ 50 YAMADA Yutaka w EI3 :!I: 16
-------TANAKA Masayoshi EI3 cP iE ~ 40, 43 Y AMAH Shuhei t1J ~ f~ ~ 20, 2-8, 206
TANAKA Yasushi EB cp ~ J~' 169
TENDOW Yoshihiko 7( ~ 7!i ~ 54, 121
TERAI Yoshiro ~ :# ~ fiB 103 <=l
TONUMA Tadao p its iE a 69 , 70, 71, 128
UCHIY AMA Toshihiro pg UJ ~~sb 23
UDA Masayuki ¥ EI3 fG L 73 , 75 , 77, 79
URAl Teruo i1Ii :# 1$ ~ 16
USAMI Toshiro ¥ 1tr: ~ f!i &B 103
USUBA Isao ~ ~ ~ 212
UTSUNOMIY A Hiroaki ¥ ~ '8 sb ~ :~' 50,
YAMAMOTO Norikazu t1J :;$: fIR{ fD 95
Y ANO Yasushige m 152, 155, 157, 159, 179, 183, 185
Y ANOKURA Minoru *- !f ~ ~ 33 , 128, 136, 148
YATAGAI Fumio ~EI3~ X ~ 116
YOKOYAMA Ichiro :fit t1J - &B 141,146
YOKOYAMA Natsuki :fit t1J ~ W 79
YOSHIDA Heitaro 95
YOSHIDA Shiro ~ EI3 JI!:I, &B 20

RI KEN Accelerator Progress Report
!!11::~iff~pJi:IJlljlfiif.~.iS- ~ 15~ (1981)
t:f] .lj;ti atH'0 57~ (1982 ) 3 ~ 25 B
~ l y alHo57~ (1 982 ) 3 Ji 31 B ~ff* t:l 1 t ~ ;pJf JE pJT
1~$:~ g ~ T 351 J:{J-.:E.WH'O:!trti}:trR 2 " 1 ~
1[~ (0484 ) 62- 1 1 1 1
~~* t:l1t~ ;pJfJE PJT:JJD ~~~'8~ j{ ~
t:f] .Ij; IJ fiJi- 1L £ ~n ~Ij f* :A; ~ t± T130 **~~?!£ffilRtI!. rR 1 TEl 3 " 3 ~
~fiffi 4, OOO fI.!

埼玉県 和光市 広沢
理化学研究所