Embed Size (px)
Citation preview
SDP LOCAL MONITORING AND CONTROL DESIGN
Document number SKATELSDP0000026
Document type DRE
Revision 02
Author S. Ratcliffe, I. Emsley, S. Gounden, Y. Grange, R. Lakhoo, C. Wu, A. DeMarco
Release Date 20160720
Document Classification Unrestricted
Status Released
Lead Author Designation Affiliation
Shagita Gounden LMC Team Lead SKASA
Signature & Date:
Owned by Designation Affiliation
Bojan Nikolic SDP Project Engineer University of Cambridge
Signature & Date:
Approved by Designation Affiliation
Paul Alexander SDP Project Lead University of Cambridge
Signature & Date:
Released by Designation Affiliation
Paul Alexander SDP Project Lead University of Cambridge
Signature & Date:
Version Date of Issue Prepared by Comments
0.95 LMC Lead et al. Release for PDR
1.0 LMC Lead et al. Updated with
Document No: SKATELSDP0000026 Unrestricted
Revision: 02 Author: S. Ratcliffe et al.
Release Date: 20160720 Page 2 of 57
observations from OAR.
01C 20160331 LMC Lead et al. Release for dPDR
02 20160720 LMC Lead et al. Updated with deltaPDR OARs.
ORGANISATION DETAILS
Name Science Data Processor Consortium
Address Astrophysics
Cavendish Laboratory
JJ Thomson Avenue
Cambridge CB3 0HE
Website http://skasdp.org
Email skasdp[email protected]
Document No: SKATELSDP0000026 Unrestricted
Revision: 02 Author: S. Ratcliffe et al.
Release Date: 20160720 Page 3 of 57
1 Table of Contents
ITEM PAGE
1 Table of Contents 4
2 List of Figures 4
3 List of Tables 6
4 List of Abbreviations 6
5 References 8
5.1 Applicable Documents 8
5.2 Reference Documents 8
6 Introduction 9
6.1 Purpose of the document 9
7 LMC 9
7.1 Configuration and Control 15
7.1.1 Master Controller 15
7.1.2 Discovery 16
7.1.3 Configuration / Deployment 17
7.1.4 Execution 17
7.1.5 Teardown 17
7.1.6 Simulation 18
7.1.7 Target of Opportunity 18
7.1.8 States and Modes 18
7.1.9 Standby 21
7.2 Health and Status Monitoring 23
7.2.1 Standard Monitoring Points 23
7.2.2 Logging 23
7.2.3 Alarms and Events 26
7.3 Error Handling 26
7.3.1 Error Detection 26
7.3.2 Error Recovery 27
7.4 Quality Assessment (QA) 27
7.4.1 Metrics 27
7.4.2 Visualisation 28
7.4.3 QA Interface and Data Flow 29
7.5 Telescope State Information 31
7.5.1 Telescope State 31
7.5.2 State Information Categories 31
7.5.3 Simulated State Information 32
7.5.4 Lifespan 32
7.6 Local Telescope State (LTS) Manager 32
7.7 Local Sky Model (LSM) Manager 34
7.8 Fast Telescope State Producer 35
Document No: SKATELSDP0000026 Unrestricted
Revision: 02 Author: S. Ratcliffe et al.
Release Date: 20160720 Page 4 of 57
7.9 LMC Resource and Workflow Manager 36
7.9.1 SDP Resource and Workflow Manager 36
7.10 Workload Characterisation Framework 37
7.10.1 WCF External Interfaces 38
7.11 Managing Science Events 40
7.12 Interfaces 40
7.12.1 External Interfaces 40
7.12.2 Internal interfaces 42
7.13 Implementation 42
7.14 Infrastructure 43
7.15 Logical Data Store 44
7.16 Configuration Management 44
7.17 Software 44
8 Prototyping Plan and Associated Risks 45
9 Function to Requirements Traceability 46
2 List of Figures
Figure Page
Figure 1: LMC Functional breakdown 10
Figure 2: LMC Product Tree breakdown 11
Figure 3: The diagram shows the component relationships between the
internal components of the LMC, the internal SDP components and external
interfaces.
12
Figure 4: Top level state transition diagram for the SDP 20
Figure 5: State Transitions within a single SDP capability 21
Figure 6: Sample interface showing an aggregate of the spectrum for each
autocorrelation with average
29
Figure 7: Quality Assurance (QA) data flow. 30
Figure 8: Local Telescope State (LTS) architectural focus. 33
Figure 9: Local Sky Model (LSM) architectural focus. 35
Document No: SKATELSDP0000026 Unrestricted
Revision: 02 Author: S. Ratcliffe et al.
Release Date: 20160720 Page 5 of 57
Figure 10: Workload Characterisation framework 37
Figure 11: WCF External interfaces 38
Figure 12: Level 1 functional flow diagram of the SDP 41
Figure 13: LMC SDP Internal interfaces 42
3 List of Tables
Table Page
Table 1: Log levels as proposed by the LMC Interface Guidelines 25
Table 2: Function to Product Traceability 45
Table 3: Function to L2 Requirements Traceability 46
4 List of Abbreviations
API Application Programming Interface
CDR Critical Design Review
CPU Central Processing Unit
CSP Central Signal Processor
CTRL Configuration and Control
FLOP FloatingPoint Operations
FOV Field of view
GSM General Sky Model
GTS General Telescope State
GUI Graphical User Interface
HM Health and Status Monitoring
Document No: SKATELSDP0000026 Unrestricted
Revision: 02 Author: S. Ratcliffe et al.
Release Date: 20160720 Page 6 of 57
I/O Input/Output
ICD Interface Control Document
JSON JavaScript Object Notation
LHC Large Hadron Collider
LMC Local Monitoring and Control
LOM Lightsoutmanagement
LSM Local Sky Model Manager
LTS Local Telescope State
PDG Physical Deployment Graph
PDR Preliminary Design Review
PIP Pipelines
QA Quality Assurance
SDBS SDP Deployable Benchmark Suite
SDP Science Data Processor
SPEAD Streaming Protocol for Exchanging Astronomical Data
SSD Solid State Drive
TM Telescope Manager
ToO Targets of Opportunity
WCF Workload Characterisation Framework
Document No: SKATELSDP0000026 Unrestricted
Revision: 02 Author: S. Ratcliffe et al.
Release Date: 20160720 Page 7 of 57
5 References
5.1 Applicable Documents The following documents are applicable to the extent stated herein. In the event of conflict between
the contents of the applicable documents and this document, the applicable documents shall take precedence.
Ref No Doc No Document Title
AD01 SKATELSKODD001 SKA1 SYSTEM BASELINE DESIGN
AD02 MISCELLANEOUS CORRECTIONS TO THE BASELINE DESIGN
AD03 SKATELSKO0000008
SKA PHASE 1 SYSTEM (LEVEL 1) REQUIREMENTS SPECIFICATION
AD04 300000000029 SKA1 INTERFACE CONTROL DOCUMENT SDP TO TM MID
AD05 300000000002 SKA1 MID SDPCSP INTERFACE CONTROL DOCUMENT
AD06 SKATEL.SADT.SETEL.SDP.SEICD
SKATEL.SADT.SETEL.SDP.SEICD001_Rev_D.docx
AD07 SKATELSDP.0000013
PDR.01 SDP Architecture
AD08 PDR0305 Requirements Matrix
5.2 Reference Documents
The following documents are referenced in this document. In the event of conflict between the
contents of the referenced documents and this document, this document shall take precedence.
Reference Number Reference
RD01 LMC Scope and Responsibilities document SKATELTM0000030LMC Scope and Responsibilities Document.docx Revision: 01 Dated: 20151124
RD02 LMC Interface Guidelines document SKATELTM0000031LMC Interface
Guidelines Document.docx Revision: 01 Dated: 20151124
RD03 SDP Architecture SKATELSDP0000013 Revision: 02C Dated: 20160324
RD04 SDP Execution Framework Design SKATELSDP0000015 Revision: 01C
Dated: 20160324
RD05 SDP Pipelines Design SKATELSDP0000027 Revision: 01C Dated:
20160324
Document No: SKATELSDP0000026 Unrestricted
Revision: 02 Author: S. Ratcliffe et al.
Release Date: 20160720 Page 8 of 57
RD06 SDP Data Processor Platform Design SKATELSDP0000018 Revision: 01C
Dated: 20160324
Document No: SKATELSDP0000026 Unrestricted
Revision: 02 Author: S. Ratcliffe et al.
Release Date: 20160720 Page 9 of 57
6 Introduction
In any large and complex engineering effort, proper definition of interfaces and clearly delineated
functional elements are essential. The phase 1 design effort of the SKA has been split into a number of
elements, each of which with a distinct functional scope.
These elements are controlled by a central Telescope Manager (TM) which requires each element to
provide a welldefined interface to allow monitoring and control of the element. This Local Monitor
and Control (LMC) function promotes an interface led design and allows segmented simulation and
integration of telescope components.
In the context of the Science Data Processor (SDP), the LMC also provides toplevel control over the
SDP resources, both hardware and software, to ensure that the required capabilities can be realised.
The LMC thus encompasses both the internal control and monitoring of the individual components of
the SDP and the interface(s) between the SDP and other telescope subsystems, directly in the case of
TM, and by proxy via the TM in the case of other elements.
6.1 Purpose of the document The purpose of this document is to describe the SDP LMC architecture and design. The roles of the
LMC are to:
● Monitor and control hardware of the various SDP subsystems
● Raise alarms and events to inform external entities on the state of the SDP
● Run/Schedule data processing pipelines
● Run maintenance workflows
● Routinely perform status and diagnostic checks
● Expose maintenance functionality for fault finding, mitigation and correction
● Interact with the primary user of SDP, which is TM, through a defined interface
● Save any data required by the LMC subsystem to a local store
● Manage quality assurance (QA) of the SDP subsystems
● Control and manage the Local Sky Model
● Control and manage the Local Telescope Model
7 LMC The LMC performs the following functions:
● Configuration and Control (CTRL) Controls the high level capabilities provided by the SDP,
including commands required for availability and schedule planning, and exposes this control
to the TM. This function is performed by the LMC Master Controller.
● Health and Status Monitoring (HM): Performs health, alarms and status monitoring and
provides this information to the TM and internal elements as required. This function will be
carried out by the LMC Master Controller.
Document No: SKATELSDP0000026 Unrestricted
Revision: 02 Author: S. Ratcliffe et al.
Release Date: 20160720 Page 10 of 57
● Aggregate QA metrics: Provides aggregate quality assessment metrics to the end user to allow
verification of the quality of science data as it is processed through the SDP.
● Visualise Quality Assessment: This element is responsible for the visualisation of the produced
metrics, and their encapsulation within an appropriate web deliverable container. An
accessible reference to this will then be passed to Telescope Manager, to allow the
visualisation to be displayed within the general user interface framework.
● Manage Local Telescope State (LTS): A repository of telescope state that is accessible by the
subelements of the SDP. This includes static configuration, external dynamic state such as
antenna pointing, and internally generated state such as calibration tables.
● Manage Local Sky Model(LSM): A repository of sources e.g. point sources and Gaussian
extended sources. Sources can be grouped into socalled patches.
● Produce Fast Telescope State: The element responsible for ensuring timely delivery of critical
telescope state information from the Telescope Manager to the SDP Receiver.
● Manage Science Events: The element is responsible for alerting TM to transient events.
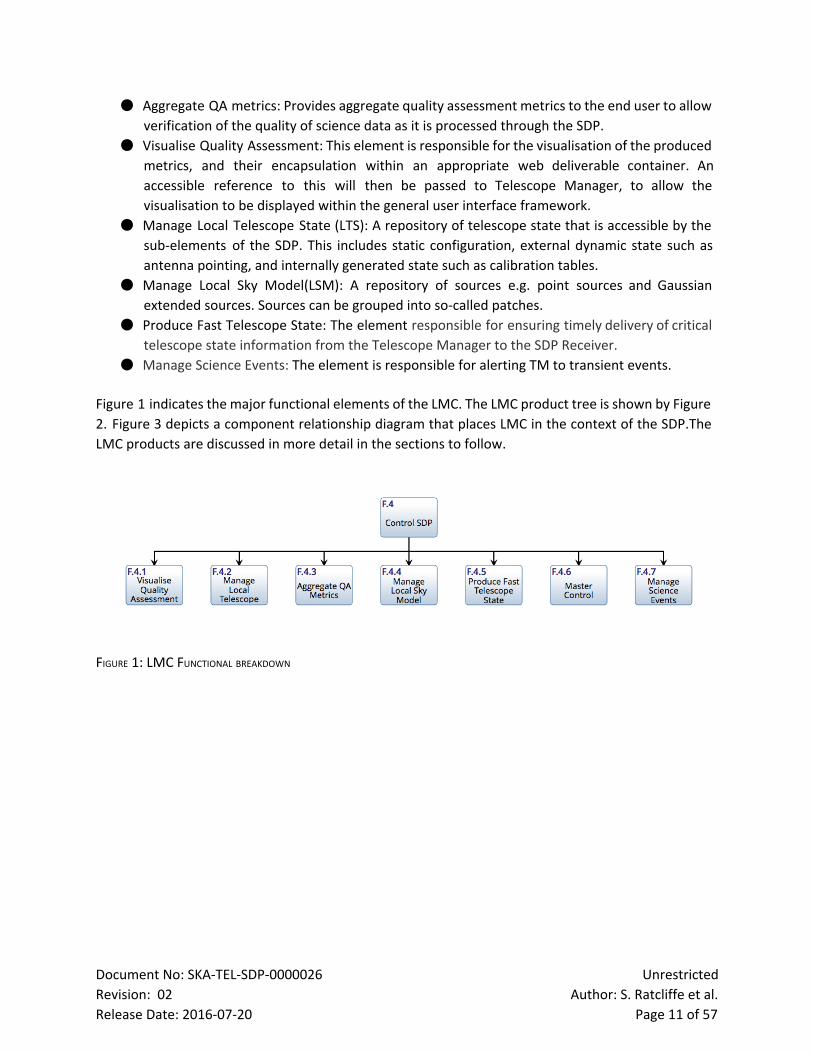
Figure 1 indicates the major functional elements of the LMC. The LMC product tree is shown by Figure
2. Figure 3 depicts a component relationship diagram that places LMC in the context of the SDP.The
LMC products are discussed in more detail in the sections to follow.
FIGURE 1: LMC FUNCTIONAL BREAKDOWN
Document No: SKATELSDP0000026 Unrestricted
Revision: 02 Author: S. Ratcliffe et al.
Release Date: 20160720 Page 11 of 57
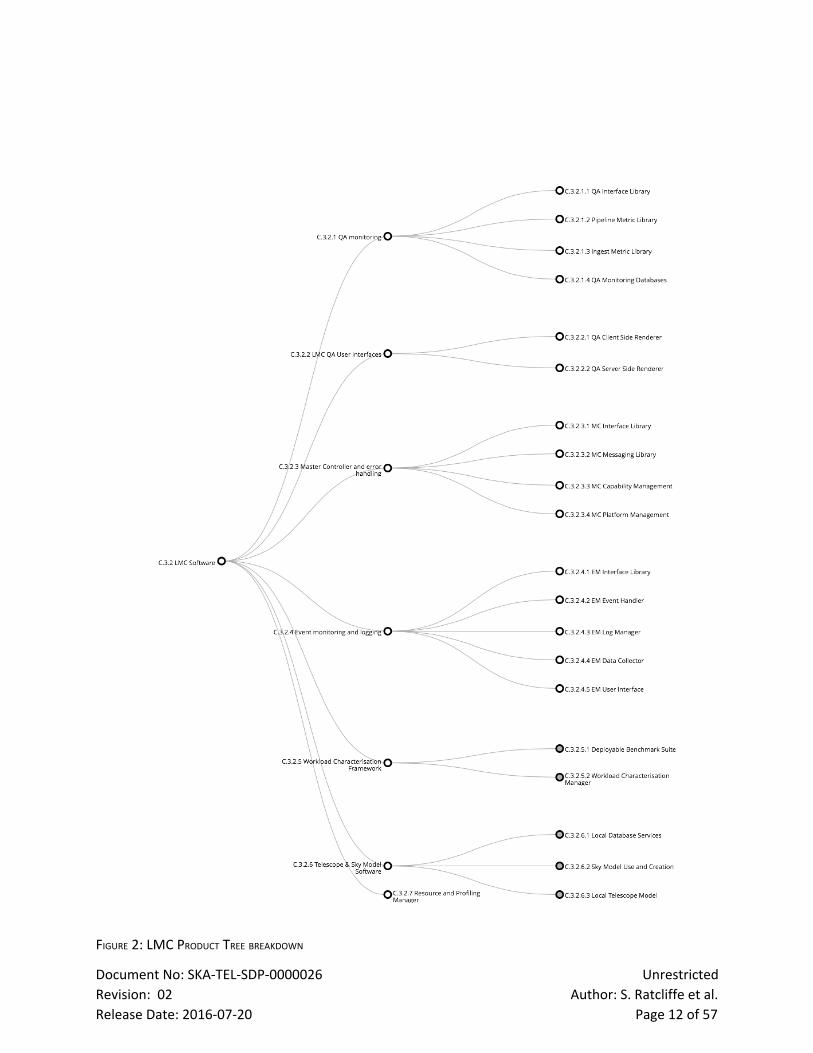
FIGURE 2: LMC PRODUCT TREE BREAKDOWN
Document No: SKATELSDP0000026 Unrestricted
Revision: 02 Author: S. Ratcliffe et al.
Release Date: 20160720 Page 12 of 57
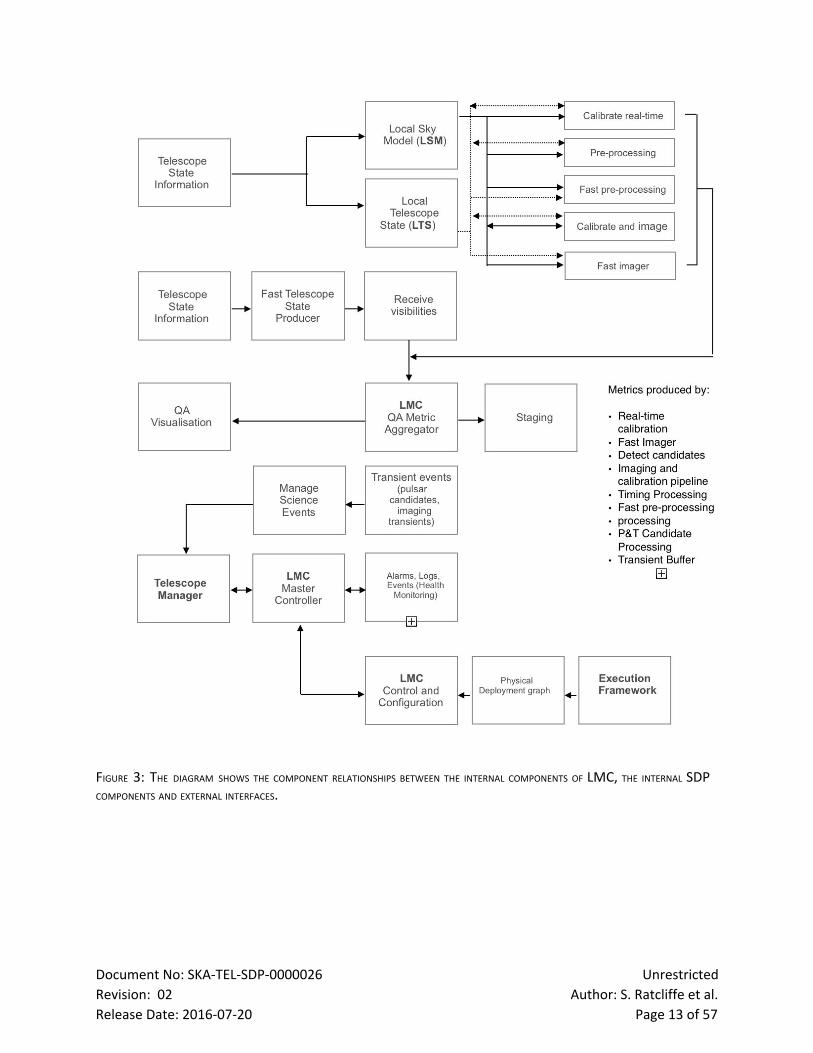
FIGURE 3: THE DIAGRAM SHOWS THE COMPONENT RELATIONSHIPS BETWEEN THE INTERNAL COMPONENTS OF LMC, THE INTERNAL SDP COMPONENTS AND EXTERNAL INTERFACES.
Document No: SKATELSDP0000026 Unrestricted
Revision: 02 Author: S. Ratcliffe et al.
Release Date: 20160720 Page 13 of 57
Fundamentally the role of the LMC is to present a single, unified view of the SDP element to the rest
of the observatory. This black box view of the each element is central to the design of the Telescope
Manager, which has published a set of documents outlining the scope and responsibilities of each of
the LMC element functions (see RD01, RD02).
This single view encompasses a wide variety of interactions, including:
● Resource discovery, reservation and control
● System health monitoring and status reports
● Science payload quality control and integrity monitoring
● Operator visibility into various element level details
● Element activation from a power off state
In addition to this outward facing role, the LMC has the primary internal control responsibility for
configuration and preparation of resources. The concept of a capability is central to the architectural
approach adopted in the LMC component of the SDP. This fundamental definition is chosen to align
with the current description of a capability given by the Telescope Manager.
In general, a capability is a grouping of SDP components and products to provide a particular pipeline
analysis function (see RD03). In the context of the SDP, a capability maps directly to a particular
analysis or engineering task. More specifically for SDP:
● A capability is the minimumsized task which can be scheduled by TM – TM does not control
what happens within a capability;
● Capabilities do not share information directly, but information (e.g. Telescope State
information) may be made available between capabilities via TM;
● A capability is defined by a set of configuration parameters, functions and products which are
required to produce a defined product;
● When a capability is executed, further parameters may be defined that refine the behaviour
of the capability and the SDP resources are allocated for execution;
● The SDP will support multiple simultaneous executing capabilities – this will be a standard
situation with for example one executing capability being responsible for receiving data for
the current observation while another executing capability is processing data stored within
the Buffer.
A capability may further be regarded as a package of functions which are required for a given
operation: not all of this functionality may be required for every capability. In the SDP architecture,
pipelines are executed within a datadriven framework (see RD03). The data dependencies and their
execution within this framework are graph driven and socalled ‘logical graphtemplates’ provide a
basic description of this functionality. A capability may also be constructed internally by SDP from one
or more logical graph templates, each describing an aspect of the capability, which are then formed
Document No: SKATELSDP0000026 Unrestricted
Revision: 02 Author: S. Ratcliffe et al.
Release Date: 20160720 Page 14 of 57
into a single graph execution framework. Not all SDP functions are associated with individual
capabilities. We define those functions that exist independently of capabilities as “singleton
functions”.
Capabilities are the minimalsized tasks which can be scheduled by TM, as stated above. The
relationship between capabilities, which are exposed to TM by SDP, and the scheduling block used by
TM needs further definition and clarity. As currently envisaged, the SDP capabilities are not formally
exposed to observers, but rather TM translates project requirements into a series of scheduled SDP
capabilities. Further systemlevel consideration needs to be undertaken to decide if this overall
architectural approach is optimal.
In the context of this document, an observation is a specific instance of an SDP capability. In other
words, an observation involves executing a particular SDP capability for a defined period of time. This
then naturally defines the basic unit of control, scheduling and availability monitoring of the SDP as a
system.
As an example, “continuum imaging” is a particular capability supported by the SDP. When combined
with appropriate parameters such as desired field of view, number of channels, number of major
cycles etc. an observation is defined. Thus, multiple observations using the same underlying capability
may operate in parallel as long as the resource pool of the SDP is sufficient.
7.1 Configuration and Control The SDP control concept is a combination of centrally orchestrated control by the Master Controller
and devolved control by the Execution Framework (see RD03, RD04). The boundaries of this control
concept are established by the definition of an SDP capability. All singleton functions and associated
processes not within capabilities are managed directly by the Master Controller and the Master
Controller has the responsibility for triggering the setup and execution of a capability. Within an
executing capability, the execution framework manages processes which are instantiated by the
requirements of the graphdriven execution framework. Within an executing capability, processes
have access to services provided by components under the direct control of the Master Controller
(e.g. the LTS, LSM and metric aggregation).
Configuration and control is handled on a per capability basis. To the outside world, the various
capabilities are presented as completely parallel SDP instances, controlled through a single point.
Physically this single point is implemented in a redundant masterslave configuration, which
duplicates internal state across two nodes. Should the master fail, the slave will take over the
connection to TM. Commands in progress during the failure will return an error code and TM will
need to reissue them.
This failure behaviour could be mitigated through the use of virtual lockstep techniques that allow a
slave to be run in complete synchronisation with the master. This approach may yield significant
benefits with respect to the overall SDP availability allocation, however no formal requirement exists
Document No: SKATELSDP0000026 Unrestricted
Revision: 02 Author: S. Ratcliffe et al.
Release Date: 20160720 Page 15 of 57

as yet for a seamless LMC handover on failure. The formal analysis of the availability requirements will
be concluded during the CDR phase, which will in turn provide guidance to LMC on this topic.
From the perspective of the TM, a particular observation has several phases that make up the overall
operational model, namely: Discovery, Configuration/Deployment, Execution and Teardown. These
are described in the sections to follow.
7.1.1 Master Controller
TheMaster Control function encompasses a wide variety of functionality that is needed to ensure that
the appropriate emergent behaviour of the SDP system is achieved in response to command requests
originating from the Telescope Manager. In general, this will involve the receipt of a command to
activate a particular capability, the setup and initial control of which is the responsibility of the Master
Controller. The Master Control function will also include functionality to estimate resource usage of a
particular capability to allow both internal planning and external scheduling by the Telescope
Manager.
In our datadriven system, fine grained control of components does not require direct overview from
the Master Controller. It simply plays a supervisory role, ensuring that all needed components have
been started with an appropriate configuration, and that such components persist in a functional
state for the duration of the requested capability.
For many of the components of the SDP, the control from the Master Controller will be very
lightweight and will simply ensure component availability, base configuration and health monitoring.
The Master Control function is also responsible for maintaining the overall SDP state machine, and in
particular handles the critical power on to idle and power off transitions.
7.1.2 Discovery In the discovery phase, the TM attempts to construct a view of the telescope resources available for a
particular observation, and the health state of these resources.
In the LMC context, this discovery phase is supported by queries received from TM relating to the
availability of particular capabilities. A query will thus be issued by TM against a particular, predefined
capability model. The LMC will then populate this model with a potential physical set of resources and
report on the availability of this set to TM.
This provides no particular guarantee of availability at the specific time of observation, but is a crucial
general purpose planning tool.
7.1.3 Configuration / Deployment Once TM has ascertained the availability of a particular capability from a systemwide perspective, the
next step is to configure the SDP to activate the specified capability in preparation for data flow.
The TM will issue a configuration command to the SDP that contains a sufficiently complete set of
capability parameters to allow a physical graph to be constructed. The PDG describes each physical
Document No: SKATELSDP0000026 Unrestricted
Revision: 02 Author: S. Ratcliffe et al.
Release Date: 20160720 Page 16 of 57
node that is to be used to process this observation, what will be run on it, where it gets its data from
and where it passes its results to.
In general this list of parameters will be quite large as it encompasses all of the system and user
supplied settings needed to perform the full set of reduction steps specified by the capability. The set
of parameters will be referred to as the Observation Configuration.
LMC then queries the processing platform to determine the availability of the specific group of
resources as determined by the combination of the logical graph template and the observation
configuration. The logical graph template is precomputed for each particular SDP capability.
At this stage, due to failures or other unexpected events, there may be insufficient resources available
for this configuration to proceed. This will be reported back to TM as a configuration failure. TM has
requested that this failure include sufficient information to allow TM to modify the configuration
appropriately to allow a new observation to proceed. This will then be used to issue a modified
observation request to SDP. The request should be sure to leave some margin on the resources
required to prevent churn.
Once the pool of available compute resources has been confirmed, the LMC will then construct a final
PDG that fully encodes all of the resources and connections needed. The nodes identified in the PDG
are then started and the required software and configuration deployed to them via the scheduling
capability of the SDP.
More detail on the construction of the physical graph is provided in the Execution Framework
Document (see RD04).
7.1.4 Execution The execution phase for a generic observation also has two distinct phases. The first is synchronous
data ingest and realtime processing, in which raw scientific data is ingested, flagged and marked up
before being stored in buffer data drops and made available to the realtime pipelines.
The realtime processing aspects of the system will include service processing such as gain calibration
for beamformer use and the image plane transient detection pipeline which runs at the correlator
dump rate. Results that are required by the wider telescope will be fed back to TM via the Local
Telescope State repository.
All other downstream processing runs in an asynchronous mode by using data which have
accumulated for some period in the buffer.
The starting of the reduction / scientific pipelines will be triggered automatically by the buffer DOs.
No further direct control from LMC is envisaged as the actual processing proceeds purely based on
the availability of data for each node in the execution graph.
Document No: SKATELSDP0000026 Unrestricted
Revision: 02 Author: S. Ratcliffe et al.
Release Date: 20160720 Page 17 of 57
Generally, the synchronous and asynchronous execution phases will be running simultaneously, but
for different observations i.e. one or more observations will be buffering, whilst the others are
processing.
Execution progress will be monitored via LMC as the data triggers that drive progression through the
execution graph will be aggregated through the various levels of data managers and reported as
monitoring data.
7.1.5 Teardown Explicit teardown of an observation is triggered in a number of ways:
● A stop packet in the input data stream is encountered (issued by CSP)
● The TM terminates the observation ahead of schedule
● A sufficiently severe error occurs (i.e. error state is entered)
In all cases the initial step is a graceful shutdown by simply terminating the data input and allowing
the graph to halt in a steady state. The state of the graph must then be interrogated to determine if
an appropriate point in the data reduction, processing and storage has been reached i.e. is there a
complete, viable data product available.
If not, the graph must be backed out to the nearest termination point. These will be predefined
breakpoints in the processing chain that have been identified by the initial static analysis. Effectively
they describe the points at which the processing is in a suitable state to have a checkpoint issued.
At this point the state of the observation is communicated to the TelescopeManager, which can make
decisions about how to proceed.
For example, an observation could be terminated whilst the visibility buffer is still being filled. In this
case it is quite likely that allowing the graph to terminate will result in a structurally viable visibility
buffer, albeit one that contains less data than the observation initially intended. The operator (or an
automated TM process) may then decide to discard the buffer, or go ahead anyway and produce a
science product from it.
More information on errors and error handling can be found in section 6.3.
Implicit teardown on normal observation completion is handled by the DOs and nodes themselves.
7.1.6 Simulation The LMC will also provide simulation capabilities for use by the TM and internal components. For TM
it will allow them to test out a control sequence that will generate appropriate timings, state changes
and log messages.
Document No: SKATELSDP0000026 Unrestricted
Revision: 02 Author: S. Ratcliffe et al.
Release Date: 20160720 Page 18 of 57
For internal use it will allow testing of system components without a real TM present. For this use
case a simple web delivered interface will be developed to allow the execution of fake observations,
tweaking of observational parameters and monitoring of logs and events.
7.1.7 Target of Opportunity In general, telescope observations are planned and scheduled ahead of time and can thus afford a
modest setup and configuration time. Targets of Opportunity (ToO) on the other hand typically
require reaction time of order 10 seconds from a subordinate system such as the SDP.
Practically this requires a stripped down startup capability that at minimum will start the ingest
pipeline and allow data to be recorded to the buffer. Once recording has begun, other startup can be
done in a more orderly fashion.
LMC will provide a ToO capability that has a preconfigured data flow graph allowing a minimal set of
ingest capability. This will be periodically refreshed by LMC so that the bulk of the required resources
are always available.
In practice, it may be necessary to mandate that ToO events reuse the existing ingest configuration
(channelization, baselines, etc…) to ensure sufficiently reactivity to the event. In this case, the SDP
can effectively respond in near zero time to the requirement to capture data to the buffer.
7.1.8 States and Modes
The overall state of the SDP is directly controlled, and expressed to TM, by the master controller.
Three types of transitions can occur:
● Normal: A commanded (or automatic) transition from one state to another.
● Error: An error condition may result in the transition to another state or prevent a normal
state transition from occurring.
● Recovery: On resolution of error conditions (either through direct intervention or automated
recovery) a state transition may occur.
Figure 4 shows the main states expressed at the top level of the SDP. A brief description of each state
follows:
● Off: Complete shutdown of the entire SDP system. In normal operation transition out of this
state will require an external system to apply power to the essential components required to
start the master controller.
● Standby: In this state the master controller is fully powered and operational and sufficient
platform elements are started to allow the master controller to enact further state transitions.
● Error: A special state used purely to handle the case in which the master controller fails to
start and suffers catastrophic failure. Recovery from this state to Standby is possible.
● Unconfigured: This is a transition state used when the full SDP system is being started or
stopped. Once complete the system will transition into some form of availability state or be
back in standby.
● Available: In this state all capabilities of the SDP are available for configuration and use by the
TM. In general it is not required that every component of the SDP is available for the overall
Document No: SKATELSDP0000026 Unrestricted
Revision: 02 Author: S. Ratcliffe et al.
Release Date: 20160720 Page 19 of 57
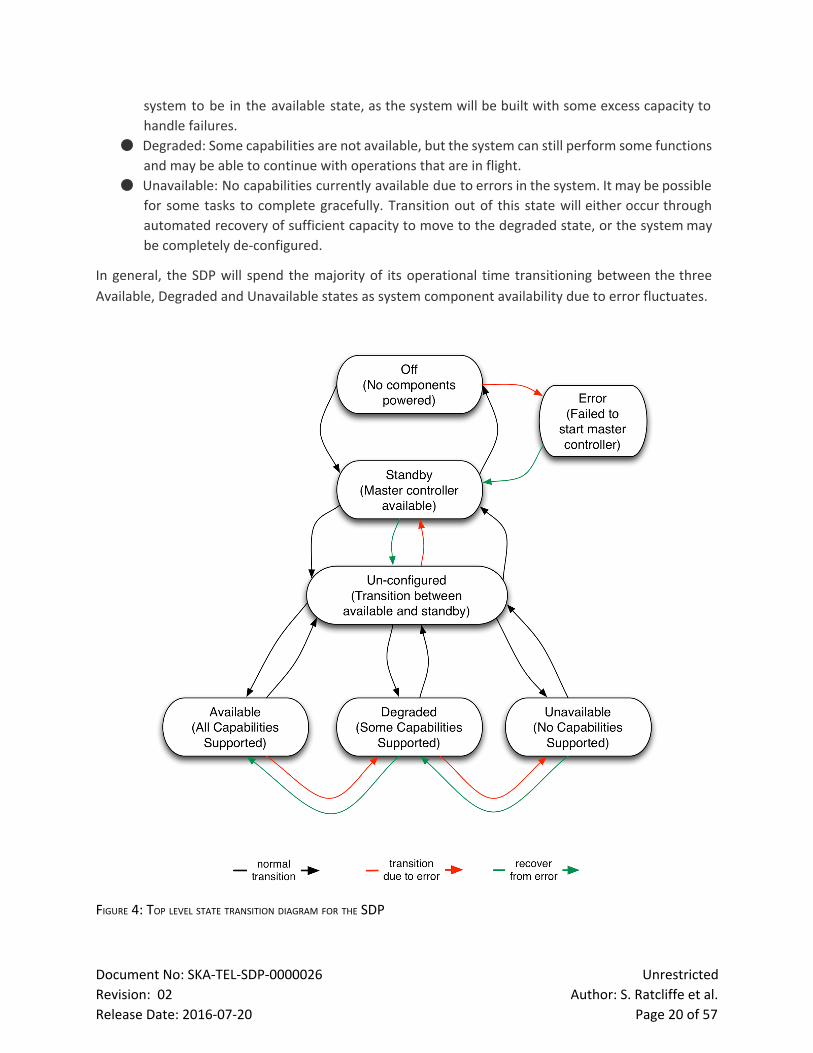
system to be in the available state, as the system will be built with some excess capacity to
handle failures.
● Degraded: Some capabilities are not available, but the system can still perform some functions
and may be able to continue with operations that are in flight.
● Unavailable: No capabilities currently available due to errors in the system. It may be possible
for some tasks to complete gracefully. Transition out of this state will either occur through
automated recovery of sufficient capacity to move to the degraded state, or the systemmay
be completely deconfigured.
In general, the SDP will spend the majority of its operational time transitioning between the three
Available, Degraded and Unavailable states as system component availability due to error fluctuates.
FIGURE 4: TOP LEVEL STATE TRANSITION DIAGRAM FOR THE SDP
Document No: SKATELSDP0000026 Unrestricted
Revision: 02 Author: S. Ratcliffe et al.
Release Date: 20160720 Page 20 of 57
Figure 5 shows the state transitions within a single SDP capability. These state machines are
maintained per capability by the master controller. A brief description of each state follows:
● Unallocated capability: A virtual state used to represent a capability that has not been
configured as yet.
● Idle: A capability that has been configured by TM but does not have SDP capacity allocated as
yet. In terms of the data flow system this represents a fully populated logical graph that has
not been allocated to actual hardware yet.
● Ready: The capability is fully allocated to SDP hardware and is ready to receive observational
data from CSP and TM.
● Buffering: An intermediate state used to indicate that data is being received from the CSP and
stored in the buffer.
● Processing: In this state, no further data is expected from the CSP, but further processing by
the SDP is occurring.
● Stopped: The graph for this capability has completed successfully and the system will
transition back to Idle.
● Capability Error: Indicates that a critical error has occurred in one of the required processing
steps and the capability could not continue without external intervention. Recovery could
include a transition back to Idle (i.e. discarding the capability) or back to Ready which could
allow the capability to resume.
Document No: SKATELSDP0000026 Unrestricted
Revision: 02 Author: S. Ratcliffe et al.
Release Date: 20160720 Page 21 of 57
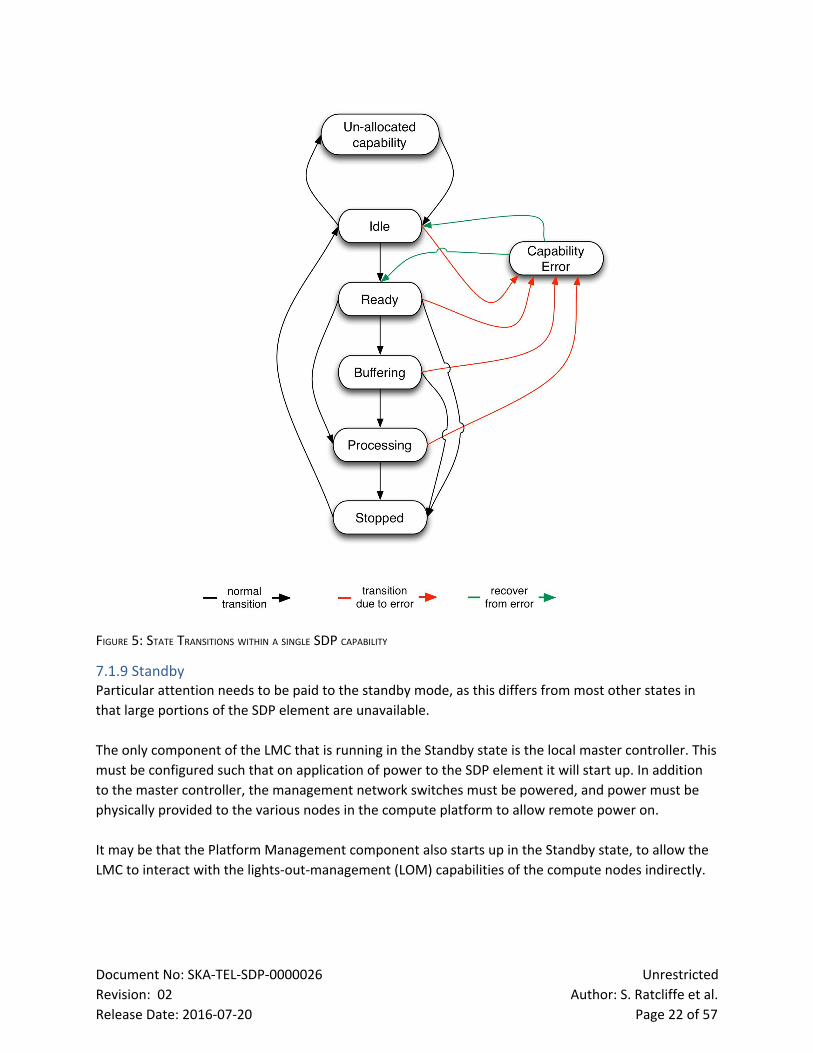
FIGURE 5: STATE TRANSITIONS WITHIN A SINGLE SDP CAPABILITY
7.1.9 Standby Particular attention needs to be paid to the standby mode, as this differs from most other states in
that large portions of the SDP element are unavailable.
The only component of the LMC that is running in the Standby state is the local master controller. This
must be configured such that on application of power to the SDP element it will start up. In addition
to the master controller, the management network switches must be powered, and power must be
physically provided to the various nodes in the compute platform to allow remote power on.
It may be that the Platform Management component also starts up in the Standby state, to allow the
LMC to interact with the lightsoutmanagement (LOM) capabilities of the compute nodes indirectly.
Document No: SKATELSDP0000026 Unrestricted
Revision: 02 Author: S. Ratcliffe et al.
Release Date: 20160720 Page 22 of 57
The master controller contains a boot configuration database component that provides initial boot
and startup information, so that on a request from TM to transition to the unconfigured state, the
remainder of the SDP (both hardware and software) can be instructed to start.
This will likely be a significant step, that requires close monitoring of component states and precise
sequencing of operations. Lessons from the operation of large scale compute facilities and other
projects such as the LHC will be valuable here.
Document No: SKATELSDP0000026 Unrestricted
Revision: 02 Author: S. Ratcliffe et al.
Release Date: 20160720 Page 23 of 57
7.2 Health and Status Monitoring To support the configuration and control capabilities provided to TM by the LMC, a broad range of
sensors and events are supported to provide a continuous view of the functional status of the SDP
element.
This section details some of the most important types of information provided by the LMC, but a full
accounting of the individual sensors and event types is only provided in the referenced ICD [AD04].
7.2.1 Standard Monitoring Points Each element LMC is expected to provide a wide range of standard monitoring points to allow the TM,
and by proxy, the telescope operators, to have sufficient system wide visibility to make informed
decisions on the operation of the telescope.
SDP is no exception and will provide monitoring information in the following broad categories:
Health
● Rolledup Element health
● Rolledup Capability health
Status
● Operational, Usage, Capability, etc.
● Version and build (overall and per subelement)
The SDP LMC will handle monitoring using a defined push based strategies from lower level
components. It is expected that many components will include some local aggregation of subordinate
components, to reduce the operating volume of metadata. In an error or diagnosis scenario, more
detailed monitoring from these components will be enabled. Internal distribution of this information
is likely to use the same communication protocol as to be proposed by TM for the top level LMC
monitoring distribution. TM has decided to use TANGO as their control and communication protocol.
Having a common protocol in use for LMC operations, both internally and externally will be a
significant risk reduction, especially in the early phases of commissioning.
7.2.2 Logging LMC will provide both remote and local (but downloadable) logging of the various internal SDP
components.
Internally all log messages will be collected via a central component provided by the LMC. This will
create local, rotating log files based on the specified log levels and retention settings. Sensible
defaults will be in place, but can be overridden by TM.
Document No: SKATELSDP0000026 Unrestricted
Revision: 02 Author: S. Ratcliffe et al.
Release Date: 20160720 Page 24 of 57
This central component will also buffer a portion of the log messages in memory and allow remote
connections to this log buffer for the purposes of online logging. It will also allow remote users to
request changes to the log levels of internal components for the purposes of debugging.
This feature will be extremely useful to both SDP and TM during the early phases of integration and
settowork activities. In addition to allowing log retrieval via the TM interface, a simple web based UI
will be provided for early work.
At present, the products that produce logging information are (see RD05):
● Visibility Receiver (C.1.2.1.4)
● Flagging Components (C.1.2.2.1.3.1)
● Strong Source Removal (C.1.2.2.1.3.2)
● Calibration Components (C.1.2.2.1.4)
● Source Finding Components (C.1.2.2.1.5)
● Imaging Components (C.1.2.2.1.6)
In addition to standard logging level controls (as defined by the LMC Interface Guidelines document –
extract shown below), it is likely that the underlying architecture will be amenable to very fine grained
logging control, to the extent that individual nodes within the overall execution graph can be targeted
to enable logging output. This, coupled with a filtering and rate limiting system, will allow precision
logging to be used as a powerful debugging tool.
In terms of the logging of processing platform components, each compute island will have its own log
server, which will collect routine system logs for the components in the island. A condensed log will
be collected centrally by the a LMC controlled logging service (see RD06). This central service will send
an even further condensed log summary to TM. At node or switch level access to performance
counters and integrated sensors will be available upon request from LMC, subject to data rate
limitations in the relevant networks.
Document No: SKATELSDP0000026 Unrestricted
Revision: 02 Author: S. Ratcliffe et al.
Release Date: 20160720 Page 25 of 57
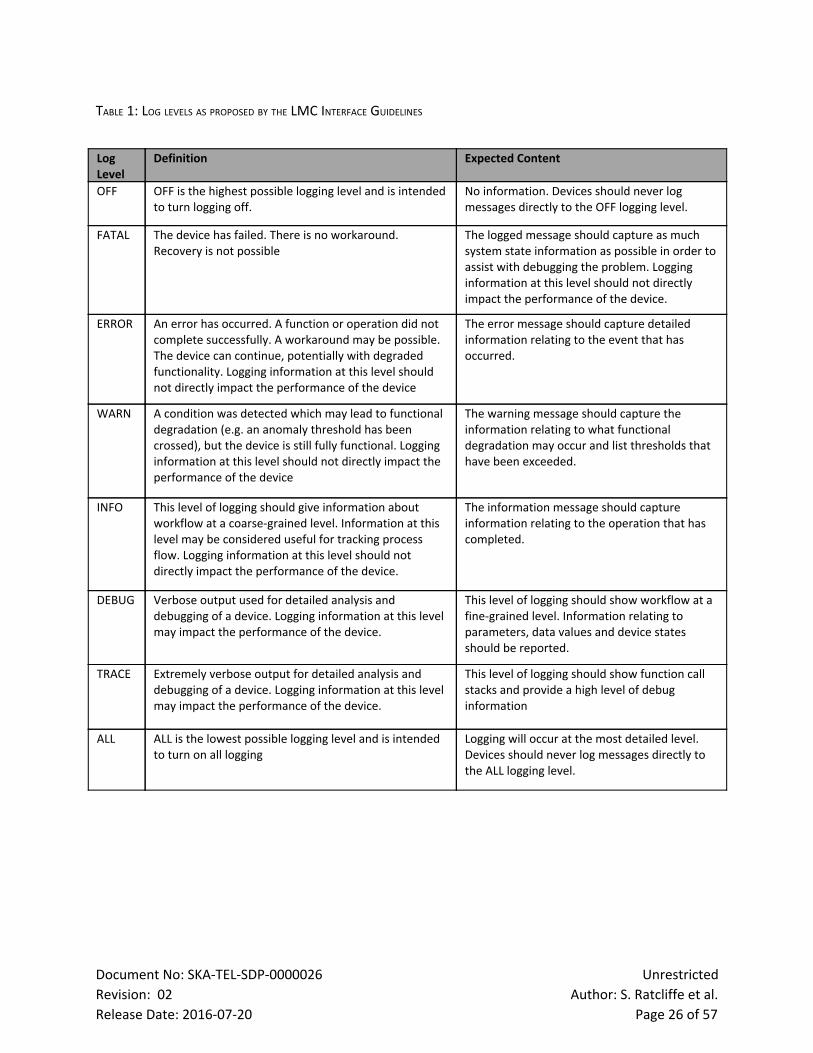
TABLE 1: LOG LEVELS AS PROPOSED BY THE LMC INTERFACE GUIDELINES
Log Level
Definition Expected Content
OFF OFF is the highest possible logging level and is intended to turn logging off.
No information. Devices should never log messages directly to the OFF logging level.
FATAL The device has failed. There is no workaround. Recovery is not possible
The logged message should capture as much system state information as possible in order to assist with debugging the problem. Logging information at this level should not directly impact the performance of the device.
ERROR An error has occurred. A function or operation did not complete successfully. A workaround may be possible. The device can continue, potentially with degraded functionality. Logging information at this level should not directly impact the performance of the device
The error message should capture detailed information relating to the event that has occurred.
WARN A condition was detected which may lead to functional degradation (e.g. an anomaly threshold has been crossed), but the device is still fully functional. Logging information at this level should not directly impact the performance of the device
The warning message should capture the information relating to what functional degradation may occur and list thresholds that have been exceeded.
INFO This level of logging should give information about workflow at a coarsegrained level. Information at this level may be considered useful for tracking process flow. Logging information at this level should not directly impact the performance of the device.
The information message should capture information relating to the operation that has completed.
DEBUG Verbose output used for detailed analysis and debugging of a device. Logging information at this level may impact the performance of the device.
This level of logging should show workflow at a finegrained level. Information relating to parameters, data values and device states should be reported.
TRACE Extremely verbose output for detailed analysis and debugging of a device. Logging information at this level may impact the performance of the device.
This level of logging should show function call stacks and provide a high level of debug information
ALL ALL is the lowest possible logging level and is intended to turn on all logging
Logging will occur at the most detailed level. Devices should never log messages directly to the ALL logging level.
Document No: SKATELSDP0000026 Unrestricted
Revision: 02 Author: S. Ratcliffe et al.
Release Date: 20160720 Page 26 of 57

7.2.3 Alarms and Events The LMC is responsible for first level monitoring of all the equipment and services that comprise the
SDP element. In particular detecting and reporting critical conditions, both those affecting operations
and those that compromise the telescope mission, is an important role within the LMC.
In addition to these predefined critical conditions, the TM may wish to define run time specifications
for particular conditions to aid in debugging and commissioning.
The LMC will handle this requirement through a generic event framework, which will describe and
maintain a set of centralised rules that reside within the monitoring component. Events will be
generated with a specific destination, criticality level and sufficient information to accurately convey
intent.
Escalation and repeat event thresholds can be specified per criticality level so as to prevent alarm
swamping of upstream components.
7.3 Error Handling Perhaps the most challenging aspect, from a control perspective, of a largescale facility such as the
SDP will be error handling. When dealing with extreme scale, it is a certainty that a fraction of the
overall facility will be unavailable at any one time. More challengingly, we can expect multiple failures
throughout the system during the processing of any particular observation run.
Some of these failures will be amenable to trend prediction and can be preemptively dealt with, but
those that occur without warning need to be dealt with in near realtime, especially in the front end
of the SDP.
7.3.1 Error Detection Of the three broad categories of error (hard, soft, silent), errors which are undetectable through
standard OS level tools will be the hardest to deal with. This includes memory and transport
problems, which introduce subtle, bit level errors that can at the worst lead to completely unexpected
operation of the processing chain.
A cohesive, introspective error detection system that combines system tools that monitor the
platform and applications, coupled with the detailed automated QC system that provides realtime
monitoring to the end user will allow the most detailed view of errors possible.
In a system of the eventual complexity of the SKA, it will be essential to have aggregate, hierarchical
reporting to avoid users becoming swamped with low level error messages. This is handled via a
number of mechanisms.
Firstly, errors and state information are broadly classified into alarms and events. Alarms are events,
that without further scope broadening represent a critical telescope fault and require operator
notification (although intervention may still be automatic within the element). Events are points of
Document No: SKATELSDP0000026 Unrestricted
Revision: 02 Author: S. Ratcliffe et al.
Release Date: 20160720 Page 27 of 57
interest, that when taken in a broader system view, perhaps via automatic aggregation, could reveal a
higher level issue.
It is also important to be able to mark alarms, and other errors, with a variety of states, such as
'known failure', to manage and prioritize faults. This is especially important for alarms that get
triggered at a regular cadence – the systemmust be able to suppress further warnings when directed,
but still track the alarm events themselves.
7.3.2 Error Recovery The primary assumption of the SDP is that sufficient parallelism exists at every level of the processing
chain to allow scale out without becoming limited by any particular serial process. This tenet is also
fundamental to resilience and error recovery. In effect, and where possible, errors will be detected,
and that particular parallel thread (typically a frequency channel) will simply be discarded until such
time as the error can be corrected. If the system will have data that is deemed critical to a particular
reduction (so called ‘precious’ data), or indeed operation of the SDP itself, this data will be tagged as
such and protection mechanisms will be used to prevent data loss. This will likely include redundant
copies of the data stored on multiple nodes, allowing easy failover.
The major design outcome of this is to ensure that all data reception points are amenable to missing,
or corrupt (and flagged as such) data. In the most simplistic view, missing data will be covered by the
existing flagging mechanisms.
In general we expect a significant portion of the data to be flagged due to science quality issues.
Adding a few percent of additional flagging based on system errors is not a significant cost.
Some of the critical paths will be explicitly covered in the execution graph by including redundant
paths. Other errors may require sections of the graph to be discarded, and later nodes redistributed
to hardware not originally assigned to the physical graph.
7.4 Quality Assessment (QA) Whilst the functional health of the SDP element is exposed to TM by the health monitoring function,
the quality and integrity of the scientific payload is monitored separately. LMC is responsible for two
primary aspects of QA, namely metric aggregation and visualization.
7.4.1 Metrics Internal QA reporting is achieved through the production of a range of predefined metrics that are
calculated within various stages of the SDP processing pipeline. These range from lowlevel indicators
such as closure quantities generated in the Ingest phase, to high level indicators such as snapshot
images produced from the various imaging pipelines.
In general, these metrics do not stand on their own, and may require merging with other metrics or
telescope state information in order to allow complete and accurate interpretation by the end user.
The LMC is responsible for this aggregation and sanitization function, and provides the single point of
contact for end users and other elements wishing to receive these QA metrics.
Document No: SKATELSDP0000026 Unrestricted
Revision: 02 Author: S. Ratcliffe et al.
Release Date: 20160720 Page 28 of 57
At this stage it is assumed that the SDP will provide both a programmatic and a web based human
interface to allow examination of QA information. This will be clarified once the observatory wide user
interface policy has been completed, and the human interface could be incorporated into the central
user interfaces delivered by TM.
QA information is provided per capability, although it may be possible to produce cross capability
aggregate metrics in certain cases. A wide variety of metrics will be provided; these will be detailed in
the L2/L3 SDP Requirements which will be delivered at element PDR.
The following broad categories of metrics are included:
Interferometric Measures – These represent a near realtime view on telescope performance and
include metrics such as visibility phase per baseline as a function of time.
Instrumental Calibration – These show the state of dynamic calibration of the instrument and include
metrics such as bandpass calibration.
Performance Metrics – These are higher level, derived metrics that show the overall current
performance of the instrument in terms of quantities such as astrometry (showing deviation of source
position from known standards).
7.4.2 Visualisation In the current system breakdown, it is proposed that the SDP handles the visualisation of the
produced metrics, and their encapsulation within an appropriate web deliverable container. An
accessible reference to this will then be passed to TelescopeManager, to allow the visualisation to be
displayed within the general user interface framework.
This approach also allows optimisation of the outbound network traffic from the SDP element, by
using an adaptive mix of server and client side rendering to suit the particular metric under display.
Many of the metrics under consideration will have a substantial number of individual components
(e.g. phase per baseline), and thus the visualisation of these in a human digestible form is a significant
challenge.
Care needs to be taken that the data that is presented is both sufficient for diagnostic needs, and
minimal enough to prevent data fatigue for the operator.
Document No: SKATELSDP0000026 Unrestricted
Revision: 02 Author: S. Ratcliffe et al.
Release Date: 20160720 Page 29 of 57
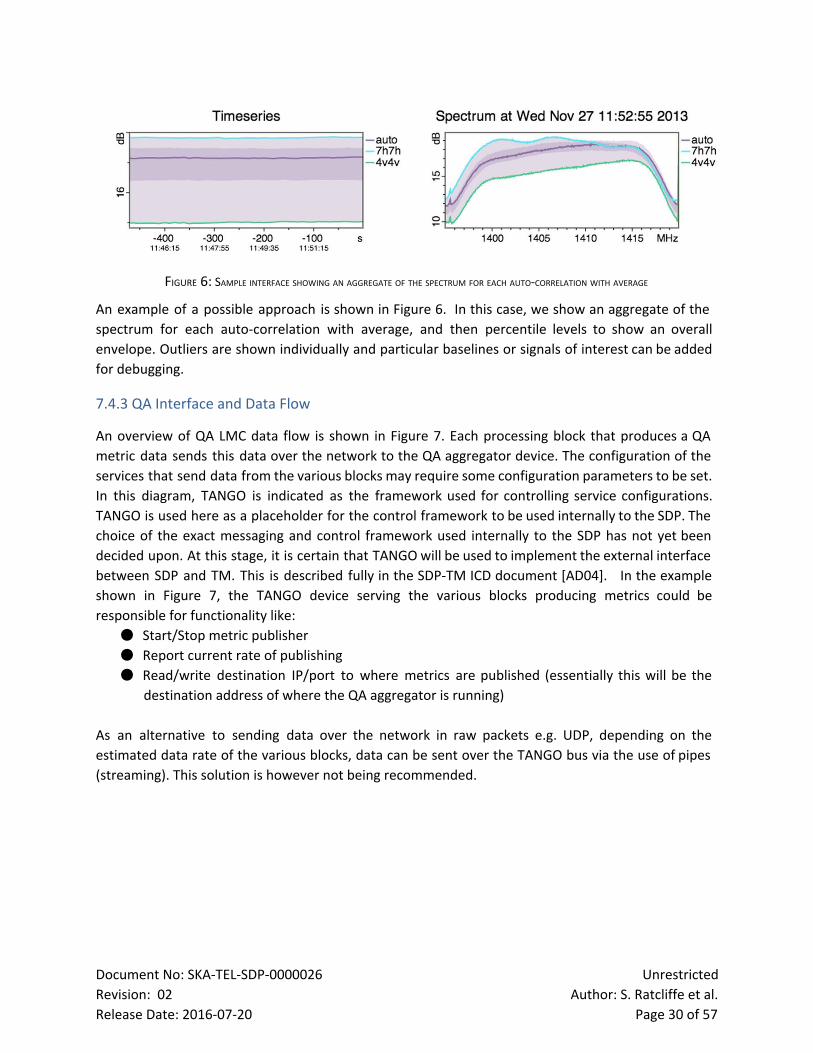
FIGURE 6: SAMPLE INTERFACE SHOWING AN AGGREGATE OF THE SPECTRUM FOR EACH AUTOCORRELATION WITH AVERAGE
An example of a possible approach is shown in Figure 6. In this case, we show an aggregate of the
spectrum for each autocorrelation with average, and then percentile levels to show an overall
envelope. Outliers are shown individually and particular baselines or signals of interest can be added
for debugging.
7.4.3 QA Interface and Data Flow
An overview of QA LMC data flow is shown in Figure 7. Each processing block that produces a QA
metric data sends this data over the network to the QA aggregator device. The configuration of the
services that send data from the various blocks may require some configuration parameters to be set.
In this diagram, TANGO is indicated as the framework used for controlling service configurations.
TANGO is used here as a placeholder for the control framework to be used internally to the SDP. The
choice of the exact messaging and control framework used internally to the SDP has not yet been
decided upon. At this stage, it is certain that TANGOwill be used to implement the external interface
between SDP and TM. This is described fully in the SDPTM ICD document [AD04]. In the example
shown in Figure 7, the TANGO device serving the various blocks producing metrics could be
responsible for functionality like:
● Start/Stop metric publisher
● Report current rate of publishing
● Read/write destination IP/port to where metrics are published (essentially this will be the
destination address of where the QA aggregator is running)
As an alternative to sending data over the network in raw packets e.g. UDP, depending on the
estimated data rate of the various blocks, data can be sent over the TANGO bus via the use of pipes
(streaming). This solution is however not being recommended.
Document No: SKATELSDP0000026 Unrestricted
Revision: 02 Author: S. Ratcliffe et al.
Release Date: 20160720 Page 30 of 57
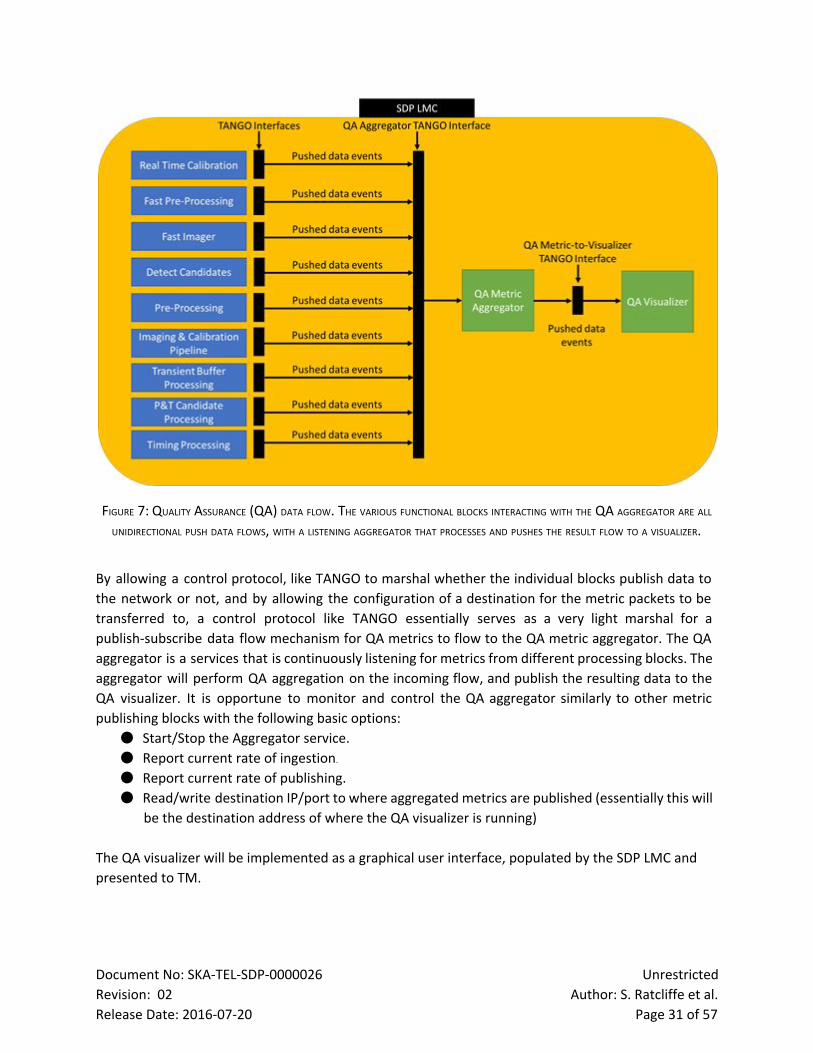
FIGURE 7: QUALITY ASSURANCE (QA) DATA FLOW. THE VARIOUS FUNCTIONAL BLOCKS INTERACTING WITH THE QA AGGREGATOR ARE ALL
UNIDIRECTIONAL PUSH DATA FLOWS, WITH A LISTENING AGGREGATOR THAT PROCESSES AND PUSHES THE RESULT FLOW TO A VISUALIZER.
By allowing a control protocol, like TANGO to marshal whether the individual blocks publish data to
the network or not, and by allowing the configuration of a destination for the metric packets to be
transferred to, a control protocol like TANGO essentially serves as a very light marshal for a
publishsubscribe data flow mechanism for QA metrics to flow to the QA metric aggregator. The QA
aggregator is a services that is continuously listening for metrics from different processing blocks. The
aggregator will perform QA aggregation on the incoming flow, and publish the resulting data to the
QA visualizer. It is opportune to monitor and control the QA aggregator similarly to other metric
publishing blocks with the following basic options:
● Start/Stop the Aggregator service.
● Report current rate of ingestion. ● Report current rate of publishing.
● Read/write destination IP/port to where aggregated metrics are published (essentially this will
be the destination address of where the QA visualizer is running)
The QA visualizer will be implemented as a graphical user interface, populated by the SDP LMC and
presented to TM.
Document No: SKATELSDP0000026 Unrestricted
Revision: 02 Author: S. Ratcliffe et al.
Release Date: 20160720 Page 31 of 57
7.5 Telescope State Information The additional metadata required by the SDP to fulfil its mission, over and above the scientific payload
received from the CSP, can become a serious complication in the design of the facility.
This is due to two factors. Firstly, the metadata itself is very varied, drawn from multiple sources at
multiple cadences, and in many cases requires interpretation through a computational model before
it can be used. Secondly, the complexity of these interpretive models themselves is very varied, and
thus their computational cost is as well.
At scale, this means careful attention must be paid to reduce the complexity of the interfaces to
external sources of metadata, and ensure that the correct models are running in the optimal location
(which may be internal or external).
7.5.1 Telescope State The SKAO is currently in discussions with a number of parties regarding the use of a central telescope
model. This would be a single, telescope wide, repository of not only telescope state metadata but
also computational models.
The clear benefit of this approach is that there is a single source of truth and updating and versioning
models is very easy. It also avoids the distribution of metadata which may be extraneous to a
particular task, as only the specifically required information is pulled into a task.
The potential downside, especially at scale, is that the model becomes a bottleneck, and the
computational load of the modelling becomes too great.
For now, the baseline design for the SDP includes a local telescope state repository that will contain a
copy of the system metadata needed for correct operation of the SDP. This repository will also be
used for the storage and distribution of internally generated metadata, particularly metadata that
needs to be exposed upstream to the Telescope Manager. This is described in more detail in section
6.6.
More commentary on this will be included in the SDP CDR design documents once the discussions
around the Telescope Model have concluded.
7.5.2 State Information Categories The following broad categories of state information are likely, and are presented here to enhance
clarity on the role played by this information:
● Data Identification – Information directly needed to interpret the scientific payload structure
(e.g. baseline indexing).
● Pointing – Information related to physical (antenna) and virtual (beamformer) positions,
modes and targets.
● Telescope State / Configuration – The static configuration of the telescope as it describes the
environment in which a particular capability is to be executed (e.g. channel bandwidth).
Document No: SKATELSDP0000026 Unrestricted
Revision: 02 Author: S. Ratcliffe et al.
Release Date: 20160720 Page 32 of 57
● Environment – Factors within the telescope environment used for further scientific analysis
(e.g. wind speed).
● SDP Calibration Data Data products required in near realtime by other parts of the
telescope (e.g. beamformer gain solutions) will need to be passed to the TelescopeManager
through the Telescope State repository. Further description of these products is made in the
SDPTM ICD [AD04], and in current form appears to be quite manageable (as the overall
update rate required is relatively low). However, additional use cases may well emerge and
very careful attention will need to be paid to the resultant requirements in terms of data
volumes and latency.
7.5.3 Simulated State Information Standalone operation of the SDP processing chain is highly desirable during commissioning and
debugging. To support this, a facility to simulate Telescope State Information is required. This can be
done either from an extant observation, to allow recreation of a particular test, or from a purely
simulated source. In both cases a telescope model is populated, and this is then either serialized to a
stream or accessed directly.
7.5.4 Lifespan In all cases it is assumed that at least the local portion of the telescope model persists for the duration
of a particular observation. Once an observation has been completed, the telescope model will be
serialized and stored in the archive alongside the standard scientific products output by the SDP.
This is a critical aspect of producing a fully marked up data product, and will ensure that post
processing investigations can determine the full operating context of the telescope without resorting
to additional queries.
7.6 Local Telescope State (LTS) Manager Two categories of data exist within the confines of the Local Telescope State (LTS):
● Data that is relatively static and can be simply distributed to ensure uniform access times
across the full compute platform.
● Working data that may be highly localised, with intensive access in these locales, which will
likely have intense periods of local read/write accesses marked by transaction boundaries that
align with iteration boundaries within the processing pipeline.
The static data for the Local Telescope State (LTS) contains the static metadata of an observation,
more or less the information contained in the subtables of the MeasurementSet. The LTS has to offer
functionality to let the applications obtain the metadata. An interface to the LTS will provide access to
the LTS in one of three forms:
1. Through getter methods e.g. “getXXX” functions, where XXX is more or less the name of the
metadata item to be obtained.
2. The metadata is stored as a dictionary in keyvalue pairs (where the value can be an array). A
generic getter method can then provide the value to a given metadata key. The advantage is
that it is simple and open (any item can be obtained). A possible disadvantage is that the user
needs to know the name of the key (but that is not very much different from having to know
Document No: SKATELSDP0000026 Unrestricted
Revision: 02 Author: S. Ratcliffe et al.
Release Date: 20160720 Page 33 of 57
the name of a function). Another disadvantage is that the return type has to be somewhat
abstract to be able to handle all possible data types.
3. A richer way would be to provide a data structure for a given key which includes the actual
data, and metadata about the data such as the datatype of the data etc. This could be in the
form of a JSON result.
It should be possible to query for data from the LTS at various granularity levels. Requests could either
return singular values for a singular key, or else effectively return a collection of metadata with the
entire configuration of an antenna (names, positions, diameters etc.). In this case, the third option
above is more suitable, as an entire document with a hierarchical structure could be returned.
The working data is highly localized to the various processes that are interfacing with the LTS,
performing updates on the fly. For this kind of application the data flow is more intensive, and an
inmemory data store of sorts can be used.
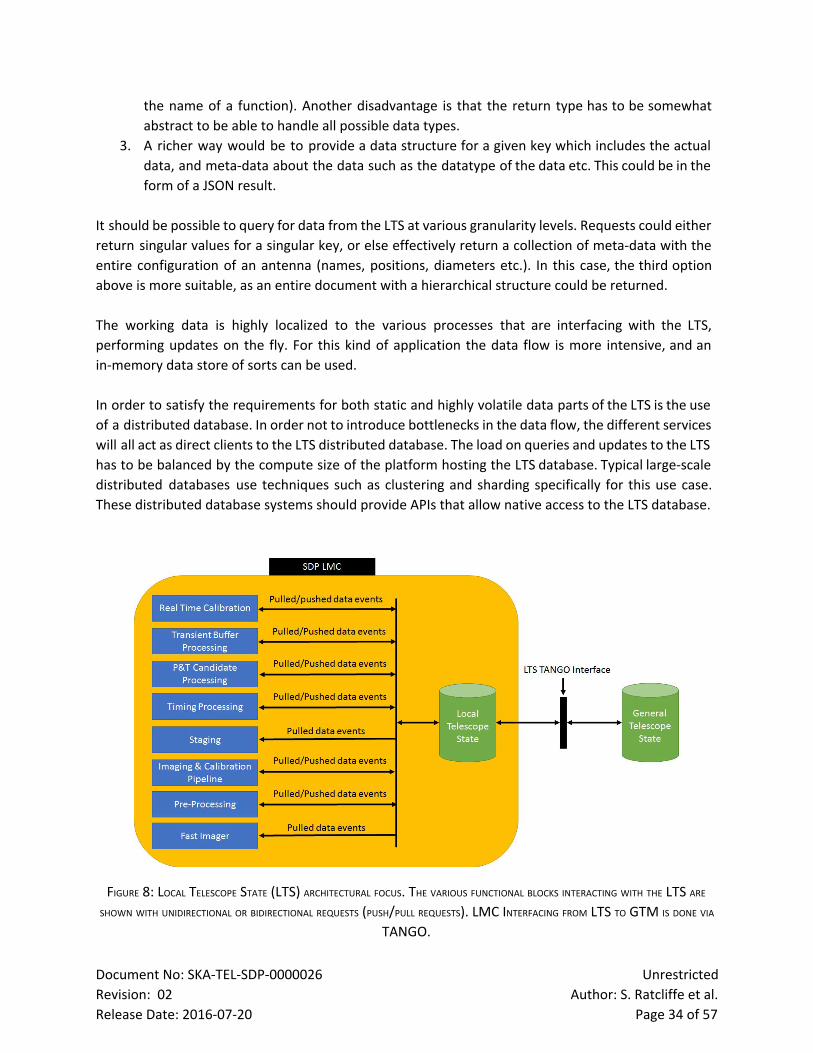
In order to satisfy the requirements for both static and highly volatile data parts of the LTS is the use
of a distributed database. In order not to introduce bottlenecks in the data flow, the different services
will all act as direct clients to the LTS distributed database. The load on queries and updates to the LTS
has to be balanced by the compute size of the platform hosting the LTS database. Typical largescale
distributed databases use techniques such as clustering and sharding specifically for this use case.
These distributed database systems should provide APIs that allow native access to the LTS database.
FIGURE 8: LOCAL TELESCOPE STATE (LTS) ARCHITECTURAL FOCUS. THE VARIOUS FUNCTIONAL BLOCKS INTERACTING WITH THE LTS ARE
SHOWN WITH UNIDIRECTIONAL OR BIDIRECTIONAL REQUESTS (PUSH/PULL REQUESTS). LMC INTERFACING FROM LTS TO GTM IS DONE VIA
TANGO.
Document No: SKATELSDP0000026 Unrestricted
Revision: 02 Author: S. Ratcliffe et al.
Release Date: 20160720 Page 34 of 57
In the case of static data, the values from this data store will be wrapped into higher—level
descriptions as described earlier, through a higherlevel “getter” API. An overview of the data flow for
LTS within SDP LMC is shown in Figure 8. The different blocks interacting with the LTS inside the SDP
LMC system will connect directly to an API for the distributed database providing LTS services. In turn,
the LTS store can be configured to push/pull from the General Telescope State.A TANGO interface will
exist between LTS and GTS so that the GTS can possibly notify LTS of updates, as well as any other
control parameters required. It is possible, if required, to have other modules in the system hook up
to the LTS manager to listen for any particular notifications or control information, such as the current
state of the LTS (e.g. is it available or not) etc.
7.7 Local Sky Model (LSM) Manager
The Local Sky Model (LSM) will constitute a collection of sources, such as point sources and Gaussian
extended sources. Possibly other source types could be needed as well, most notably shapelets.
Sources can and should be grouped into socalled patches. A patch is mainly used to model an Ateam
source in a detailed manner, such as with a group of 1000 or more point sources. Alternatively, this
can be done as a shapelet. A number of operations are envisaged to be performed on the LSM:
● Creation of the LSM from the GSM given the field of view (FOV). The LSM should also contain
the strong sources outside the FOV possibly entering through the sidelobes.
● Addition of newly found sources/clean components. Each addition could have a fidelity metric
associated with it.
● Tesselation of the sources into facets; this should be sufficiently smart that sources don't cross
facets.
● Stepping through the facets in order of total flux, so faceted calibration can process the facets
in order of flux.
● Obtain the strongest source from a facet (to be used as directional calibrator).
● Get all sources of a facet.
● Update sources for improved flux and/or position.
● Merge the final sources into the GSM.
It is yet undecided whether the LSM will exist physically within SDP LMC, or whether it is a logical
reference to a centralized LSM store, owned by TM. In any case, the first and last operations above
are the point of contact with the General Sky Model (GSM). Possibly, the source information is kept
per frequency band. It is envisaged that the data I/O can occur in bursts of high cadence; the data
processing will be in parallel in frequency bands, and could be occurring at the same time. It would
then be possible to store the solutions in an indexed fashion e.g. by antenna, frequency, time etc. and
in turn, fetched as such.
Document No: SKATELSDP0000026 Unrestricted
Revision: 02 Author: S. Ratcliffe et al.
Release Date: 20160720 Page 35 of 57
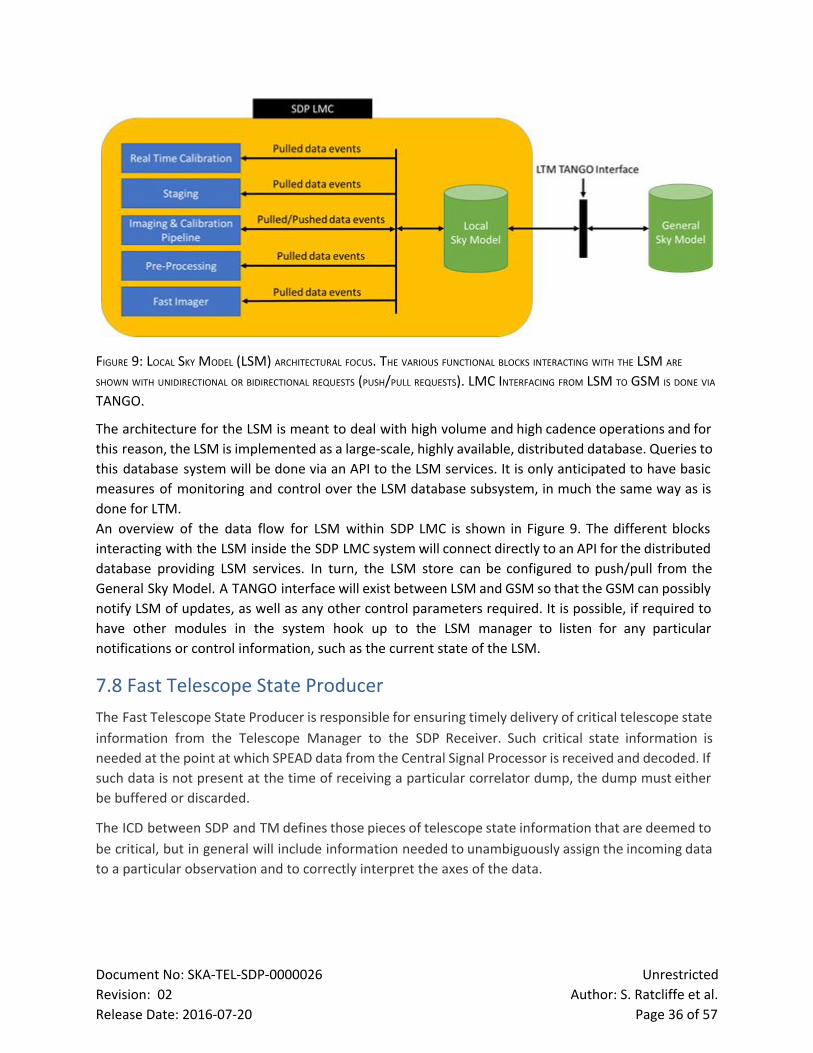
FIGURE 9: LOCAL SKY MODEL (LSM) ARCHITECTURAL FOCUS. THE VARIOUS FUNCTIONAL BLOCKS INTERACTING WITH THE LSM ARE
SHOWN WITH UNIDIRECTIONAL OR BIDIRECTIONAL REQUESTS (PUSH/PULL REQUESTS). LMC INTERFACING FROM LSM TO GSM IS DONE VIA
TANGO.
The architecture for the LSM is meant to deal with high volume and high cadence operations and for
this reason, the LSM is implemented as a largescale, highly available, distributed database. Queries to
this database system will be done via an API to the LSM services. It is only anticipated to have basic
measures of monitoring and control over the LSM database subsystem, in much the same way as is
done for LTM.
An overview of the data flow for LSM within SDP LMC is shown in Figure 9. The different blocks
interacting with the LSM inside the SDP LMC systemwill connect directly to an API for the distributed
database providing LSM services. In turn, the LSM store can be configured to push/pull from the
General Sky Model. A TANGO interface will exist between LSM and GSM so that the GSM can possibly
notify LSM of updates, as well as any other control parameters required. It is possible, if required to
have other modules in the system hook up to the LSM manager to listen for any particular
notifications or control information, such as the current state of the LSM.
7.8 Fast Telescope State Producer
The Fast Telescope State Producer is responsible for ensuring timely delivery of critical telescope state
information from the Telescope Manager to the SDP Receiver. Such critical state information is
needed at the point at which SPEAD data from the Central Signal Processor is received and decoded. If
such data is not present at the time of receiving a particular correlator dump, the dump must either
be buffered or discarded.
The ICD between SDP and TM defines those pieces of telescope state information that are deemed to
be critical, but in general will include information needed to unambiguously assign the incoming data
to a particular observation and to correctly interpret the axes of the data.
Document No: SKATELSDP0000026 Unrestricted
Revision: 02 Author: S. Ratcliffe et al.
Release Date: 20160720 Page 36 of 57
7.9 LMC Resource and Workflow Manager The resources of the LMC hardware platform can technically be managed separately on a node per
node basis, such that the job submission system as well as the administrators need to know how the
cluster is configured. An abstraction over this is to aggregate all the available resources as a single
entity, such that the LMC hardware platform is viewed as a single large node. These tools implement a
level of abstraction on top of operating systems, and can be viewed as a cluster operating system. It is
suggested that an opensource toolkit to manage the LMC platform is selected. The LMC platform will
require a level of redundancy and reliability, especially when a master node fails.
7.9.1 SDP Resource and Workflow Manager Similarly to the above, it is envisaged that the SDP as a whole will be composed of a number of
compute islands, forming the bulk of the SDP compute cluster. It will be required for this cluster to
have its resources managed, with a number of strict criteria for the resource manager selected,
namely:
● Scalability to tens of thousands of nodes
● Faulttolerant replicated master and slave nodes
● Support for stacks like containers and other virtualization technologies
● Isolation between the task being performed and the physical node executing the operation
● An API that allows interfacing from the LMC controller.
The internal interface between the SDP data processing platform and the LMC is responsible for the
subscription of events, listening for alarms, reporting health and monitoring information, initiating
and running pipelines etc. But the role of the LMC here is strictly as an interface to monitor and
control the processing platform at a very high level of abstraction. The complex platform
management is handled by one of the very highly specialized toolkits available for this task. It is
suggested, again, to utilize an open source framework that is designed to handle the data processing
usecases of the SDP e.g. OpenStack, Mesos etc.
In general, such a framework running on top of the processing platform cluster nodes consists of two
components: a scheduler that registers with the master nodes to be offered resources, and an
executor process that is launched on slave nodes to run the framework’s tasks. Much more is
required, such as routing of data, software defined networking etc, and it is not being suggested to
have this directly controlled via TANGO.
The framework, or unit within the framework for job scheduling and execution will run applications
and services across the shared pool of machines, and is responsible for keeping them running, forever
if needed. When machines experience failure, the framework shall intelligently reschedule those jobs
onto healthy machines.
While the selected framework core focuses on distributing individual tasks across nodes in a cluster,
typical services consist of dozens or hundreds of replicas of tasks. As a service scheduler, the
framework will provides the abstraction of a "job" to bundle and manage these tasks/pipelines. We
can think of many key functionalities centered around a job, including: definition, the concept of an
Document No: SKATELSDP0000026 Unrestricted
Revision: 02 Author: S. Ratcliffe et al.
Release Date: 20160720 Page 37 of 57
instance and the serverset, deployment and scheduling, health checking, and introspection. It also
allows crosscutting concerns to be handled like observability and log collection.
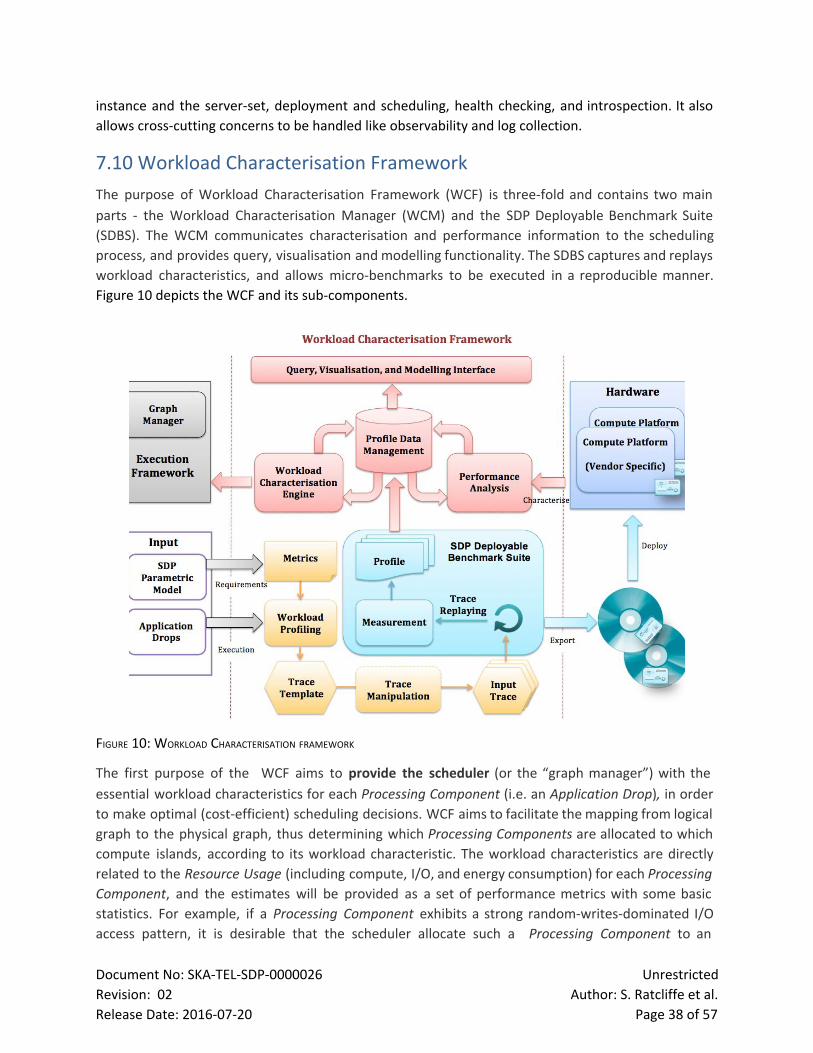
7.10 Workload Characterisation Framework
The purpose of Workload Characterisation Framework (WCF) is threefold and contains two main
parts the Workload Characterisation Manager (WCM) and the SDP Deployable Benchmark Suite
(SDBS). The WCM communicates characterisation and performance information to the scheduling
process, and provides query, visualisation and modelling functionality. The SDBS captures and replays
workload characteristics, and allows microbenchmarks to be executed in a reproducible manner.
Figure 10 depicts the WCF and its subcomponents.
FIGURE 10: WORKLOAD CHARACTERISATION FRAMEWORK
The first purpose of the WCF aims to provide the scheduler (or the “graph manager”) with the
essential workload characteristics for each Processing Component (i.e. an Application Drop ), in order
to make optimal (costefficient) scheduling decisions. WCF aims to facilitate the mapping from logical
graph to the physical graph, thus determining which Processing Components are allocated to which
compute islands, according to its workload characteristic. The workload characteristics are directly
related to the Resource Usage (including compute, I/O, and energy consumption) for each Processing
Component , and the estimates will be provided as a set of performance metrics with some basic
statistics. For example, if a Processing Component exhibits a strong randomwritesdominated I/O
access pattern, it is desirable that the scheduler allocate such a Processing Component to an
Document No: SKATELSDP0000026 Unrestricted
Revision: 02 Author: S. Ratcliffe et al.
Release Date: 20160720 Page 38 of 57
adequate SSDbacked storage I/O buffer. The WCF is designed with low system overheads, to provide
information with minimal application and performance impact, including energy consumption, for
continuous performance monitoring. Figure 5, in the SDP Execution Framework Design document (see
RD04), depicts the sequence of interactions between TM, LMC and the WCF.
The WCF aims to provide a framework, for developers and vendors alike, in this subarea, as a
common consistent platform for testing, optimisation and verification. The microbenchmarks
emulate specific, intrinsic workload characteristics of processing pipelines. Existing and custom tools
can be executed by WCF that can be used to model and replay I/O transactions to mimic behaviours
(for example), without having to compile, deploy and execute entire pipeline processing software
stack on vendors’ hardware platform. It is an efficient method for both developers and vendors to
evaluate, design, and compare hardware platforms in the relevant context of pipelines in a scalable,
modular, consistent and reproducible manner.
Secondly, the WCF aims to assist SDP developers / deployers of Pipeline Processing Components to
obtain a quantitative understanding of the compute and data access behaviours exhibited by various
radio astronomy data processing pipelines, components and algorithms, especially in production
environments. Developers can compare results in a reproducible manner, across different
hardware/software platforms, aiding them to make informed decisions about their implementations.
Finally, the WCF aims to enable SDP platform vendors to microbenchmark their platforms and
derive standardised performance statistics, which can be used to optimise and compare platforms
that will be tendered during the procurement process.
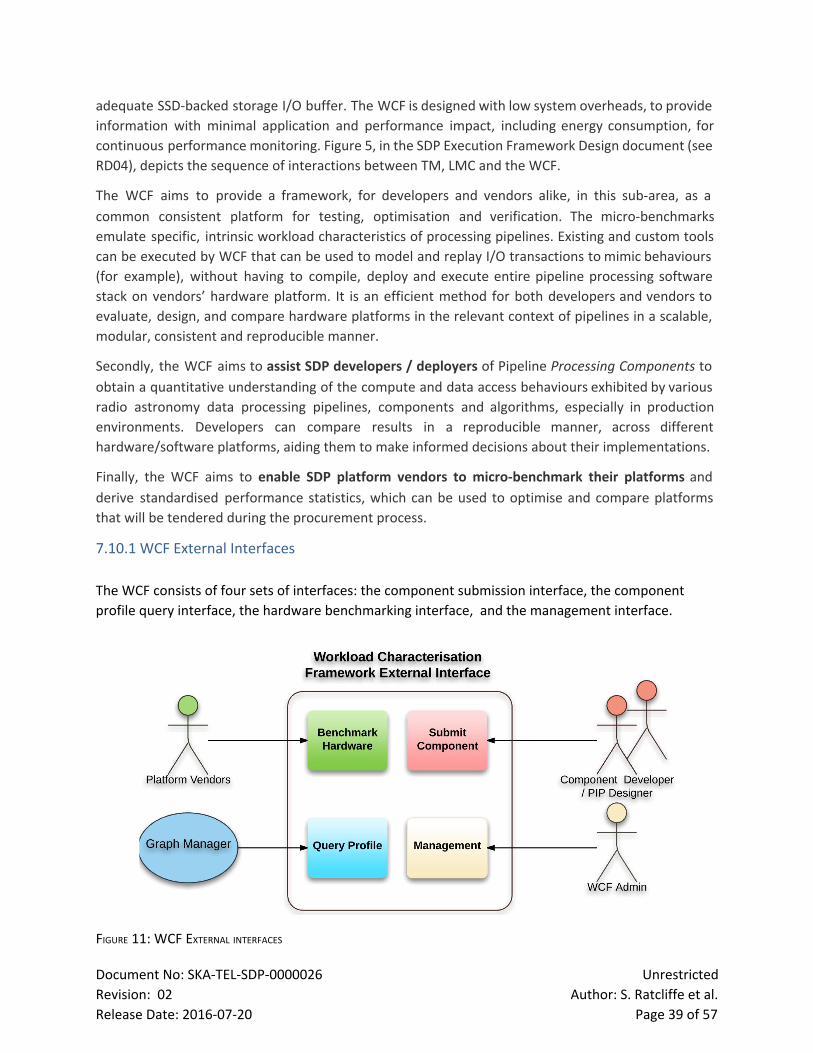
7.10.1 WCF External Interfaces
The WCF consists of four sets of interfaces: the component submission interface, the component
profile query interface, the hardware benchmarking interface, and the management interface.
FIGURE 11: WCF EXTERNAL INTERFACES
Document No: SKATELSDP0000026 Unrestricted
Revision: 02 Author: S. Ratcliffe et al.
Release Date: 20160720 Page 39 of 57
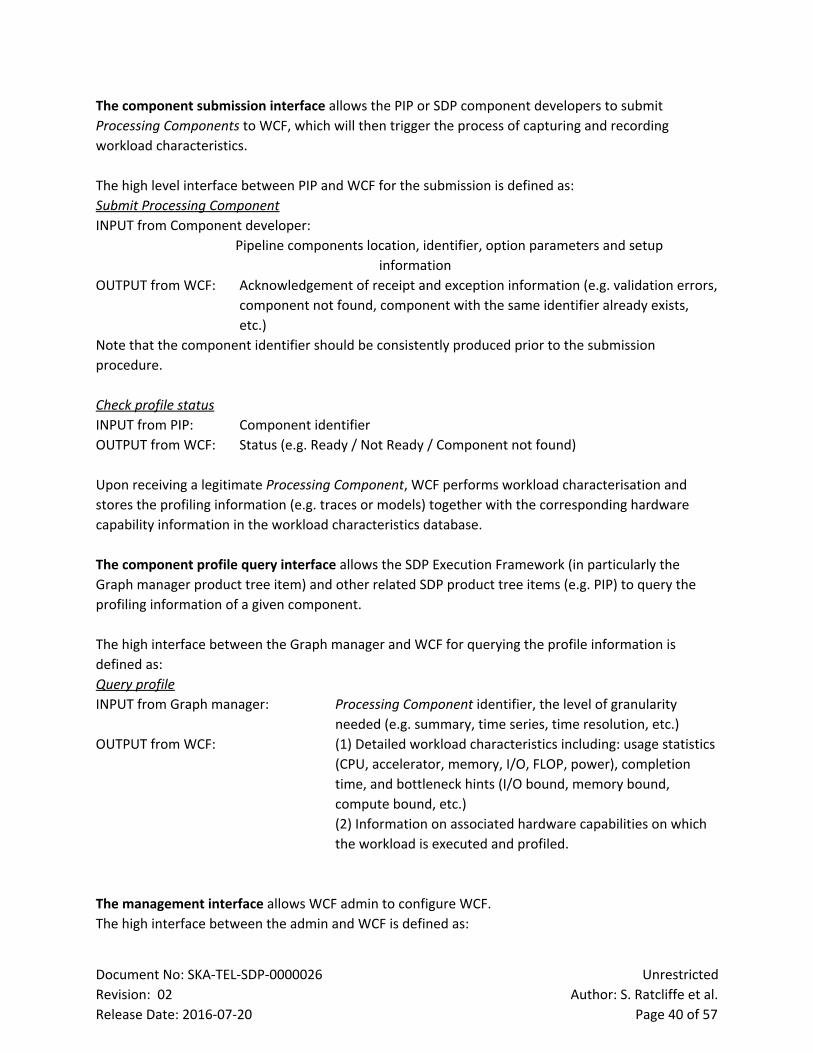
The component submission interface allows the PIP or SDP component developers to submit
Processing Components to WCF, which will then trigger the process of capturing and recording
workload characteristics.
The high level interface between PIP and WCF for the submission is defined as:
Submit Processing Component
INPUT from Component developer:
Pipeline components location, identifier, option parameters and setup
information
OUTPUT from WCF: Acknowledgement of receipt and exception information (e.g. validation errors,
component not found, component with the same identifier already exists,
etc.)
Note that the component identifier should be consistently produced prior to the submission
procedure.
Check profile status
INPUT from PIP: Component identifier
OUTPUT from WCF: Status (e.g. Ready / Not Ready / Component not found)
Upon receiving a legitimate Processing Component , WCF performs workload characterisation and
stores the profiling information (e.g. traces or models) together with the corresponding hardware
capability information in the workload characteristics database.
The component profile query interface allows the SDP Execution Framework (in particularly the
Graph manager product tree item) and other related SDP product tree items (e.g. PIP) to query the
profiling information of a given component.
The high interface between the Graph manager and WCF for querying the profile information is
defined as:
Query profile
INPUT from Graph manager: Processing Component identifier, the level of granularity
needed (e.g. summary, time series, time resolution, etc.)
OUTPUT from WCF: (1) Detailed workload characteristics including: usage statistics
(CPU, accelerator, memory, I/O, FLOP, power), completion
time, and bottleneck hints (I/O bound, memory bound,
compute bound, etc.)
(2) Information on associated hardware capabilities on which
the workload is executed and profiled.
The management interface allows WCF admin to configure WCF.
The high interface between the admin and WCF is defined as:
Document No: SKATELSDP0000026 Unrestricted
Revision: 02 Author: S. Ratcliffe et al.
Release Date: 20160720 Page 40 of 57
INPUT from admin: CRUD of metrics to be included in the profile report
CRUD of hardware capabilities with which component will be profiled
OUTPUT from WCF: Acknowledgement of receipt and exception information
The hardware benchmark interface allows hardware vendors to collect performance measurements
on their platforms by running and profiling submitted Processing Components in order to either
optimise their platforms, or compare different configurations of the same platform. Upon specific
benchmark requests from a vendor, the interface produces the parameterised benchmark software
package to vendors, who will deploy the package on their vendorspecific hardware platform. The
benchmark package in turn sets up performance capturing mechanism on the targeted platform,
executes Input Traces, microbenchmarks or Processing Components and collects performance
measurement that will be sent back to WCF, to be displayed and visualised via the query profile
interface.
7.11 Managing Science Events The LMC function, ‘Manage Science Events’, is responsible for alerting TM to the following transient
events:
a) detection of an imaging transient
b) detection of a single pulse transient
c) Pulsar Timing accuracy is achieved
7.12 Interfaces
7.12.1 External Interfaces The Level 1 functional flow diagram of the SDP is shown by Figure 12. As depicted in Figure 12, the
LMC interfaces with Telescope Manager (TM). This interface is fully described by the SDPTM Interface
Control Document [AD04].
Document No: SKATELSDP0000026 Unrestricted
Revision: 02 Author: S. Ratcliffe et al.
Release Date: 20160720 Page 41 of 57
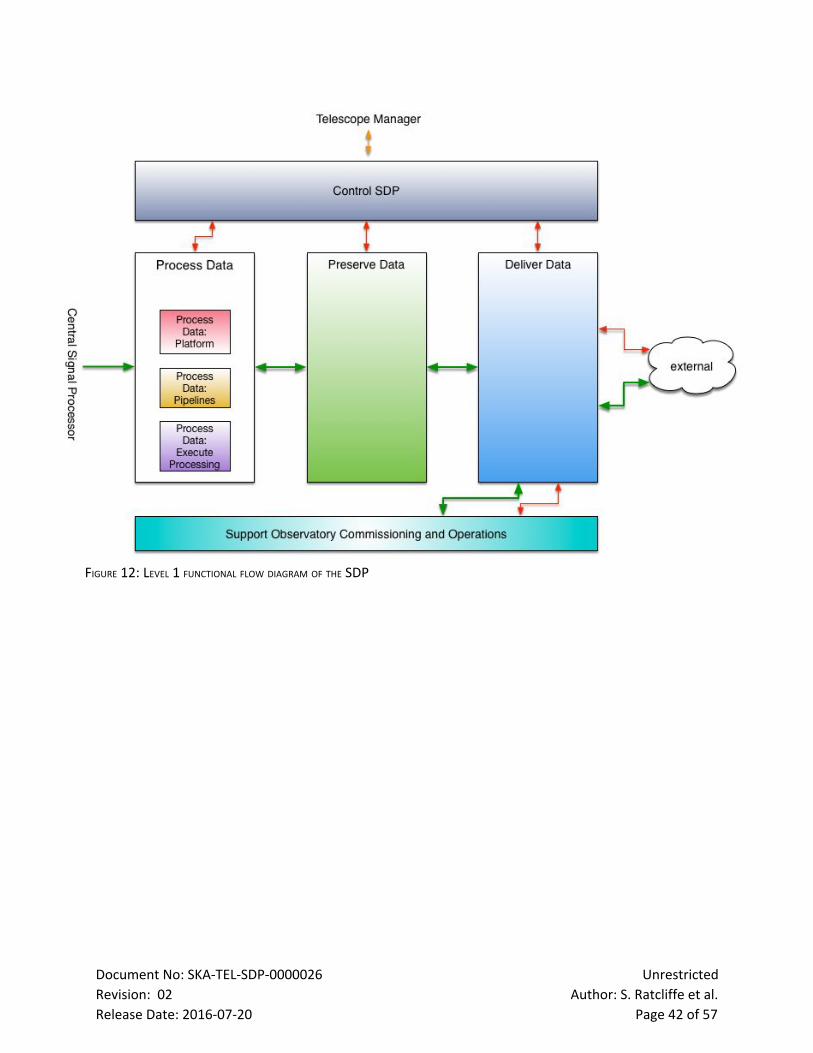
FIGURE 12: LEVEL 1 FUNCTIONAL FLOW DIAGRAM OF THE SDP
Document No: SKATELSDP0000026 Unrestricted
Revision: 02 Author: S. Ratcliffe et al.
Release Date: 20160720 Page 42 of 57
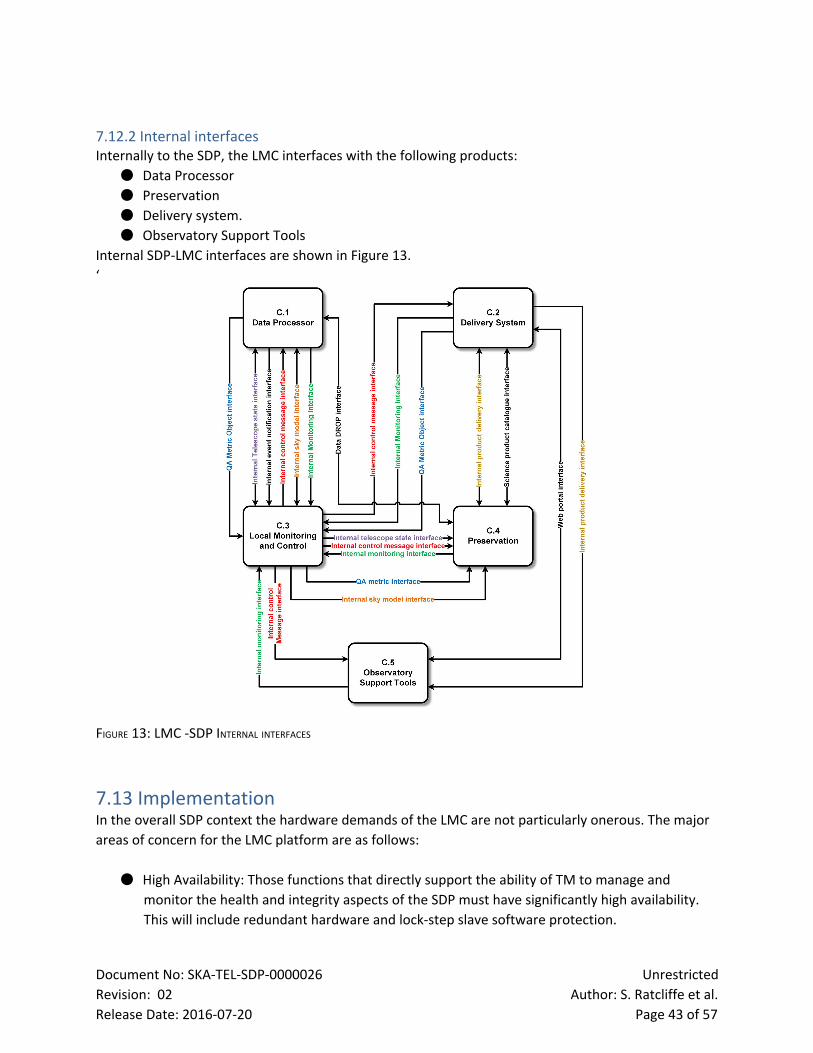
7.12.2 Internal interfaces Internally to the SDP, the LMC interfaces with the following products:
● Data Processor
● Preservation
● Delivery system.
● Observatory Support Tools
Internal SDPLMC interfaces are shown in Figure 13.
‘
FIGURE 13: LMC SDP INTERNAL INTERFACES
7.13 Implementation In the overall SDP context the hardware demands of the LMC are not particularly onerous. The major
areas of concern for the LMC platform are as follows:
● High Availability: Those functions that directly support the ability of TM to manage and
monitor the health and integrity aspects of the SDP must have significantly high availability.
This will include redundant hardware and lockstep slave software protection.
Document No: SKATELSDP0000026 Unrestricted
Revision: 02 Author: S. Ratcliffe et al.
Release Date: 20160720 Page 43 of 57
● PDG Generation: The generation and management of the PDG could become a significant
challenge as the number of graph nodes could extend into the millions. Fortunately the
process of generation is amenable to parallelisation and thus can be tackled in a traditional
HPC fashion. A small cluster is envisioned for this function. The final graph size is influenced
directly by the likely axes of parallelism that get used. If we assume 100k channels and 10s of
facets, this already gives us 1m nodes for a single step of the imager. Combined with multiple
imaging steps this number will grow out substantially.
● Log handling: In such a large, and distributed system, log handling can quickly grow into a
major concern. This risk area will be covered through the use of distributed, hierarchical
loggers that rate limit upward events to prevent tree pollution. As mentioned earlier, the fine
grained control over logging should allow most debugging events to generate only targeted
logs rather than a system wide storm of logging.
● Local telescope model: Some aspects of the LTM will require careful design, in particular
aspects such as the Local Sky Model which will need to field a large number of parallel reads
and writes and must have sufficient performance to avoid becoming a bottleneck to any of
the pipeline processing.
● Documentation: As the single point of contact for SDP, it is important that the LMC document
set is complete and accurate. This will be particularly key for startup and shutdown
sequencing, which is likely to be significantly complex.
Apart from these areas, the remainder of the LMC is fairly straightforward and can be deployed into
an environment that prioritises ease of deployment and management over outright performance.
As with other subelements of the SDP, the LMC will have a distinct instance per telescope (Mid, Low).
This allows completely independent operation of each facility with no particular dependencies
between them. Coordinated activities around maintenance of the common codebase will be
undertaken.
7.14 Infrastructure
At PDR stage, we do not specify any particular hardware platform in detail, but rather list any
requirements on it that are deemed to be significant drivers of cost or complexity. It is highly likely
that the LMC will be deployed in a distributed, componentised form using containerised virtualisation
techniques such as Docker (https://www.docker.com/). This technique will carry significant
deployment and testing benefits as it allows containers to be easily migrated and used by a variety of
team members in a variety of locations. Deployment of containers into testing environments, and the
subsequent migration of these directly to production will also significantly ease the testing to
production loop. Hypervisor virtualisation is likely to be used in conjunction with containerisation
techniques to enable virtual lockstep slave takeover functions that are likely to be employed in the
master controller high availability solution. A number of excellent deployment management tools
have emerged over the last few years, particularly in response to the rise of cloud and virtualised
deployment. A tool such as Chef (https://www.chef.io/chef/) is well suited to our needs at
exceedingly modest cost.
Document No: SKATELSDP0000026 Unrestricted
Revision: 02 Author: S. Ratcliffe et al.
Release Date: 20160720 Page 44 of 57
7.15 Logical Data Store It is possible that SDP LMC will require the use of a logical volume that caters for storing LMCrelated
data. It is probable that this data store will be a distributed file system (or a partition of full SDP
storage resources), or a distributed database. However, it is important for this logical store to satisfy a
number of criteria:
● The store has to be efficient at distributed access.
● The store has to be resilient to failure and allow for automatic recovery.
● The store has to allow for data of dynamic and undefined structure to be stored.
While it is not necessary to state, as yet, which particular solution is to be chosen for this purpose, it is
advisable to have an opensource, offtheshelf solution, that provides programmatic (APIbased)
access to the operation of the logical data store. Some valid examples of a filebased store are
GlusterFS and Lustre. An example of a databasebased store are MongoDB.
7.16 Configuration Management Configuration management is a systems engineering process for establishing and maintaining
consistency of a cluster setup, performance, functional and physical attributes with its requirements,
design and operational information throughout its life. The setup of the software platform for SDP will
require quite a lot of configuration. It is anticipated, therefore, that the platform and services for SDP
LMC nodes as well as the SDP cluster in general utilize a toolkit for configuration management to
maintain this deployment. Similarly, it is advisable to have an opensource, offtheshelf solution, that
provides programmatic (APIbased) access to the operation. An example of such a toolkit is Ansible.
7.17 Software
The bulk of the LMC software implementation is deemed to be relatively low risk. This is based on
both the inherent difficulty as estimated during the costing phase, and on the basis that similar
systems exist in the various precursors facilities, and are currently in near or full operation.
Management of the data flow graphs and graceful error handling are deemed to be the highest risk
items, as they are both inherently complex topics and not very fully addressed by any of the extant
precursors.
For the lower risk, non performance critical components, rapid development and the ability to
leverage existing code (astronomical and other) becomes key.
Significant reuse of code from both TM and the precursors is envisaged. In particular the master
controller, logging framework, internal monitoring and some of the proposed GUIs can be directly
used from the precursor facilities.
Document No: SKATELSDP0000026 Unrestricted
Revision: 02 Author: S. Ratcliffe et al.
Release Date: 20160720 Page 45 of 57
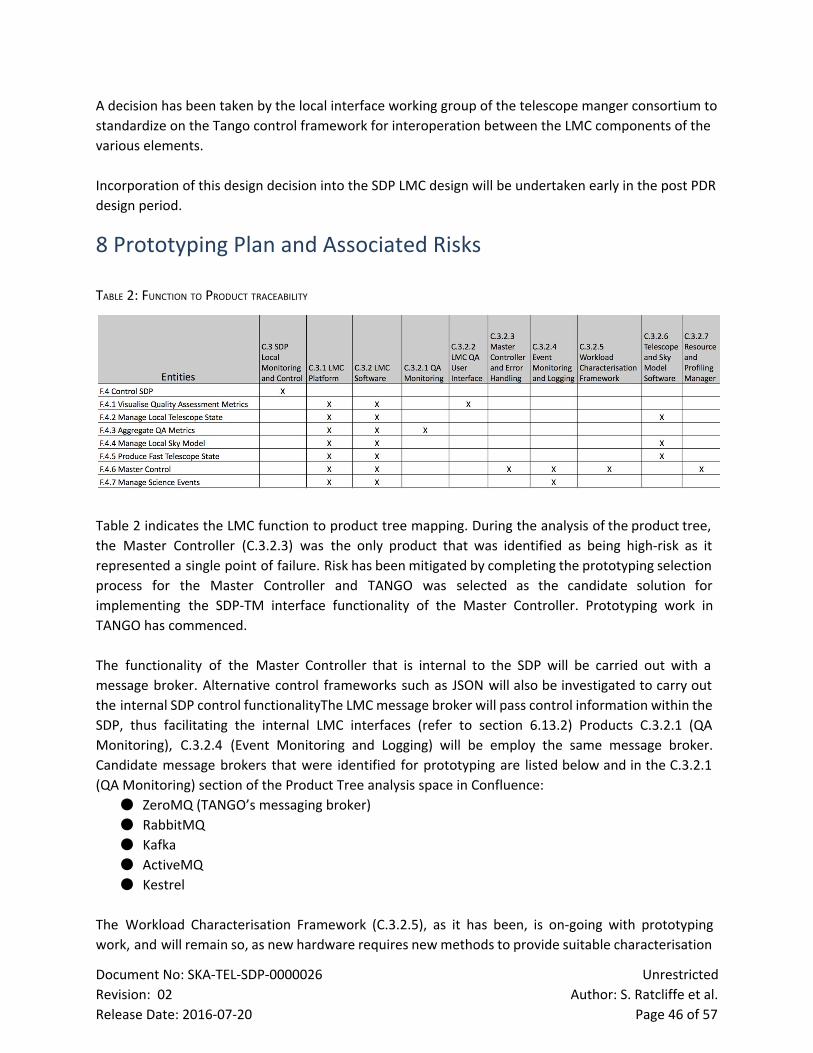
A decision has been taken by the local interface working group of the telescope manger consortium to
standardize on the Tango control framework for interoperation between the LMC components of the
various elements.
Incorporation of this design decision into the SDP LMC design will be undertaken early in the post PDR
design period.
8 Prototyping Plan and Associated Risks
TABLE 2: FUNCTION TO PRODUCT TRACEABILITY
Table 2 indicates the LMC function to product tree mapping. During the analysis of the product tree,
the Master Controller (C.3.2.3) was the only product that was identified as being highrisk as it
represented a single point of failure. Risk has been mitigated by completing the prototyping selection
process for the Master Controller and TANGO was selected as the candidate solution for
implementing the SDPTM interface functionality of the Master Controller. Prototyping work in
TANGO has commenced.
The functionality of the Master Controller that is internal to the SDP will be carried out with a
message broker. Alternative control frameworks such as JSON will also be investigated to carry out
the internal SDP control functionalityThe LMCmessage broker will pass control information within the
SDP, thus facilitating the internal LMC interfaces (refer to section 6.13.2) Products C.3.2.1 (QA
Monitoring), C.3.2.4 (Event Monitoring and Logging) will be employ the same message broker.
Candidate message brokers that were identified for prototyping are listed below and in the C.3.2.1
(QA Monitoring) section of the Product Tree analysis space in Confluence:
● ZeroMQ (TANGO’s messaging broker)
● RabbitMQ
● Kafka
● ActiveMQ
● Kestrel
The Workload Characterisation Framework (C.3.2.5), as it has been, is ongoing with prototyping
work, and will remain so, as new hardware requires newmethods to provide suitable characterisation
Document No: SKATELSDP0000026 Unrestricted
Revision: 02 Author: S. Ratcliffe et al.
Release Date: 20160720 Page 46 of 57
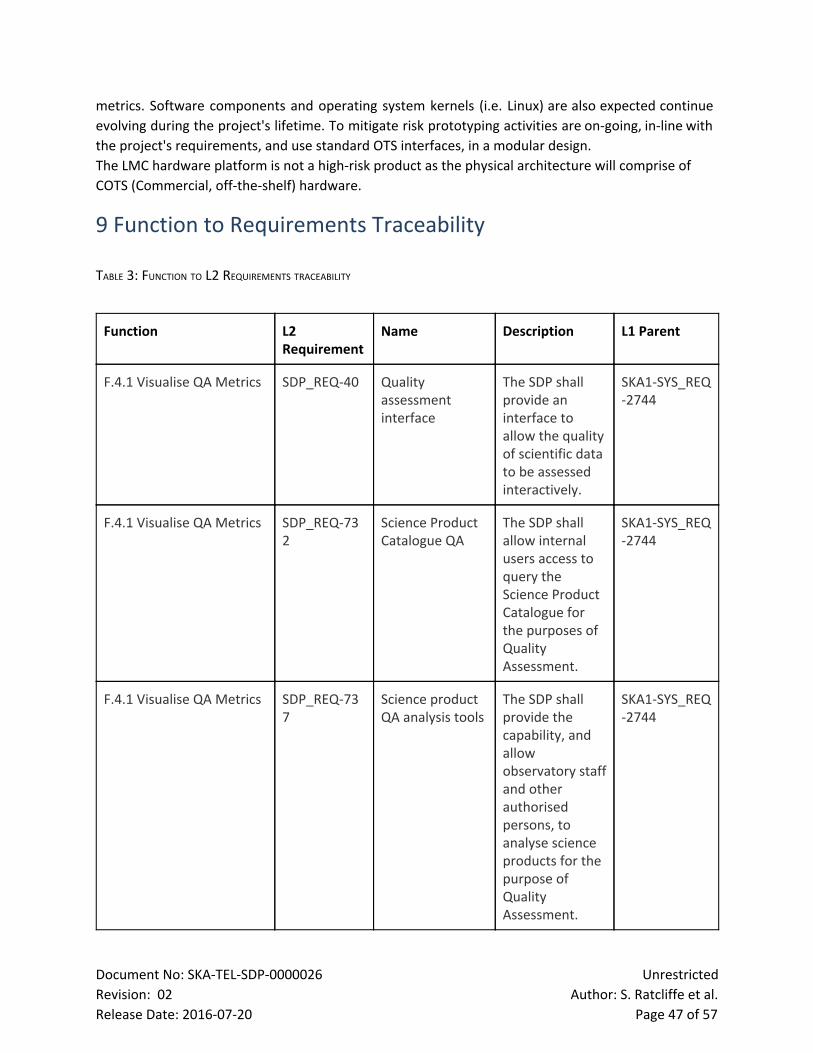
metrics. Software components and operating system kernels (i.e. Linux) are also expected continue
evolving during the project's lifetime. To mitigate risk prototyping activities are ongoing, inline with
the project's requirements, and use standard OTS interfaces, in a modular design.
The LMC hardware platform is not a highrisk product as the physical architecture will comprise of
COTS (Commercial, offtheshelf) hardware.
9 Function to Requirements Traceability
TABLE 3: FUNCTION TO L2 REQUIREMENTS TRACEABILITY
Function L2 Requirement
Name Description L1 Parent
F.4.1 Visualise QA Metrics SDP_REQ40
Quality assessment interface
The SDP shall provide an interface to allow the quality of scientific data to be assessed interactively.
SKA1SYS_REQ2744
F.4.1 Visualise QA Metrics SDP_REQ732
Science Product Catalogue QA
The SDP shall allow internal users access to query the Science Product Catalogue for the purposes of Quality Assessment.
SKA1SYS_REQ2744
F.4.1 Visualise QA Metrics SDP_REQ737
Science product QA analysis tools
The SDP shall provide the capability, and allow observatory staff and other authorised persons, to analyse science products for the purpose of Quality Assessment.
SKA1SYS_REQ2744
Document No: SKATELSDP0000026 Unrestricted
Revision: 02 Author: S. Ratcliffe et al.
Release Date: 20160720 Page 47 of 57
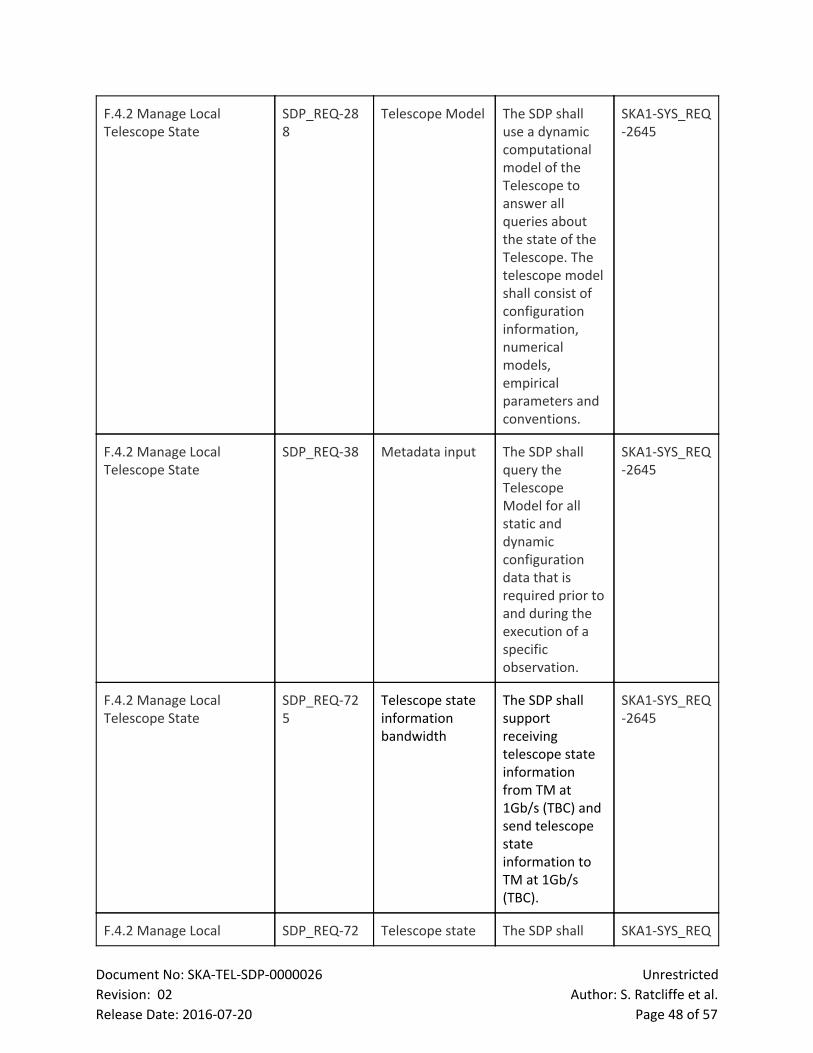
F.4.2 Manage Local Telescope State
SDP_REQ288
Telescope Model The SDP shall use a dynamic computational model of the Telescope to answer all queries about the state of the Telescope. The telescope model shall consist of configuration information, numerical models, empirical parameters and conventions.
SKA1SYS_REQ2645
F.4.2 Manage Local Telescope State
SDP_REQ38 Metadata input The SDP shall query the Telescope Model for all static and dynamic configuration data that is required prior to and during the execution of a specific observation.
SKA1SYS_REQ2645
F.4.2 Manage Local Telescope State
SDP_REQ725
Telescope state information bandwidth
The SDP shall support receiving telescope state information from TM at 1Gb/s (TBC) and send telescope state information to TM at 1Gb/s (TBC).
SKA1SYS_REQ2645
F.4.2 Manage Local SDP_REQ72 Telescope state The SDP shall SKA1SYS_REQ
Document No: SKATELSDP0000026 Unrestricted
Revision: 02 Author: S. Ratcliffe et al.
Release Date: 20160720 Page 48 of 57
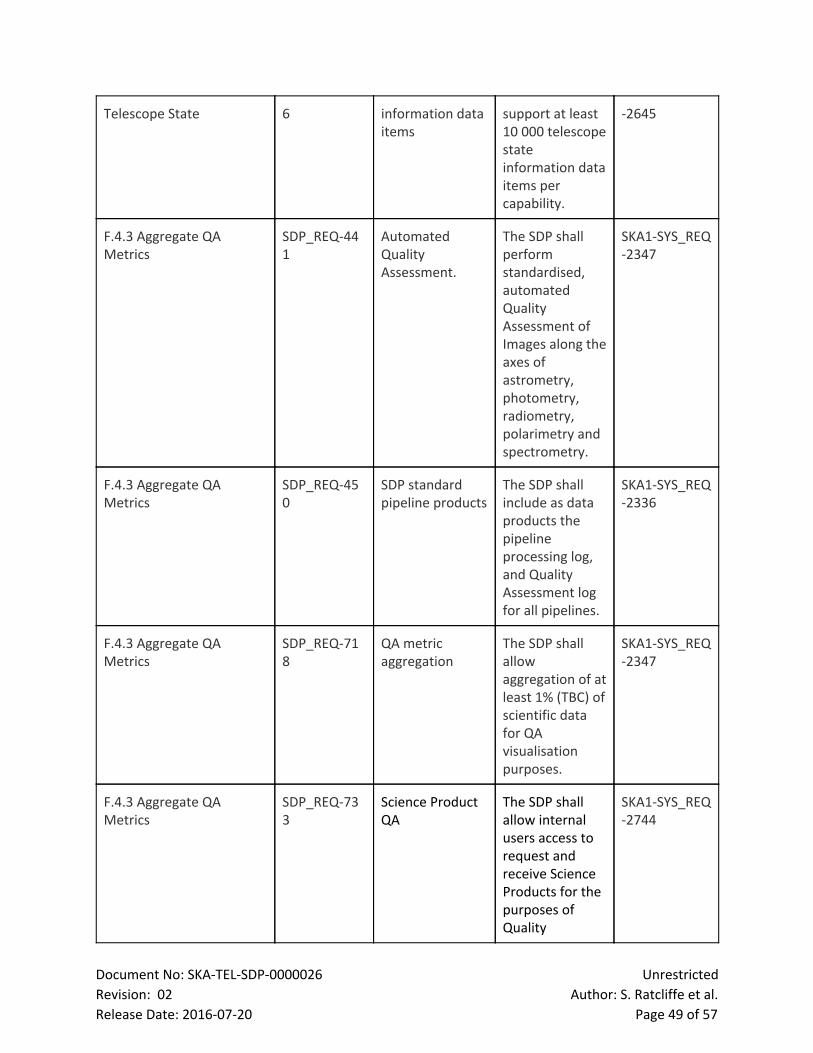
Telescope State 6 information data items
support at least 10 000 telescope state information data items per capability.
2645
F.4.3 Aggregate QA Metrics
SDP_REQ441
Automated Quality Assessment.
The SDP shall perform standardised, automated Quality Assessment of Images along the axes of astrometry, photometry, radiometry, polarimetry and spectrometry.
SKA1SYS_REQ2347
F.4.3 Aggregate QA Metrics
SDP_REQ450
SDP standard pipeline products
The SDP shall include as data products the pipeline processing log, and Quality Assessment log for all pipelines.
SKA1SYS_REQ2336
F.4.3 Aggregate QA Metrics
SDP_REQ718
QA metric aggregation
The SDP shall allow aggregation of at least 1% (TBC) of scientific data for QA visualisation purposes.
SKA1SYS_REQ2347
F.4.3 Aggregate QA Metrics
SDP_REQ733
Science Product QA
The SDP shall allow internal users access to request and receive Science Products for the purposes of Quality
SKA1SYS_REQ2744
Document No: SKATELSDP0000026 Unrestricted
Revision: 02 Author: S. Ratcliffe et al.
Release Date: 20160720 Page 49 of 57
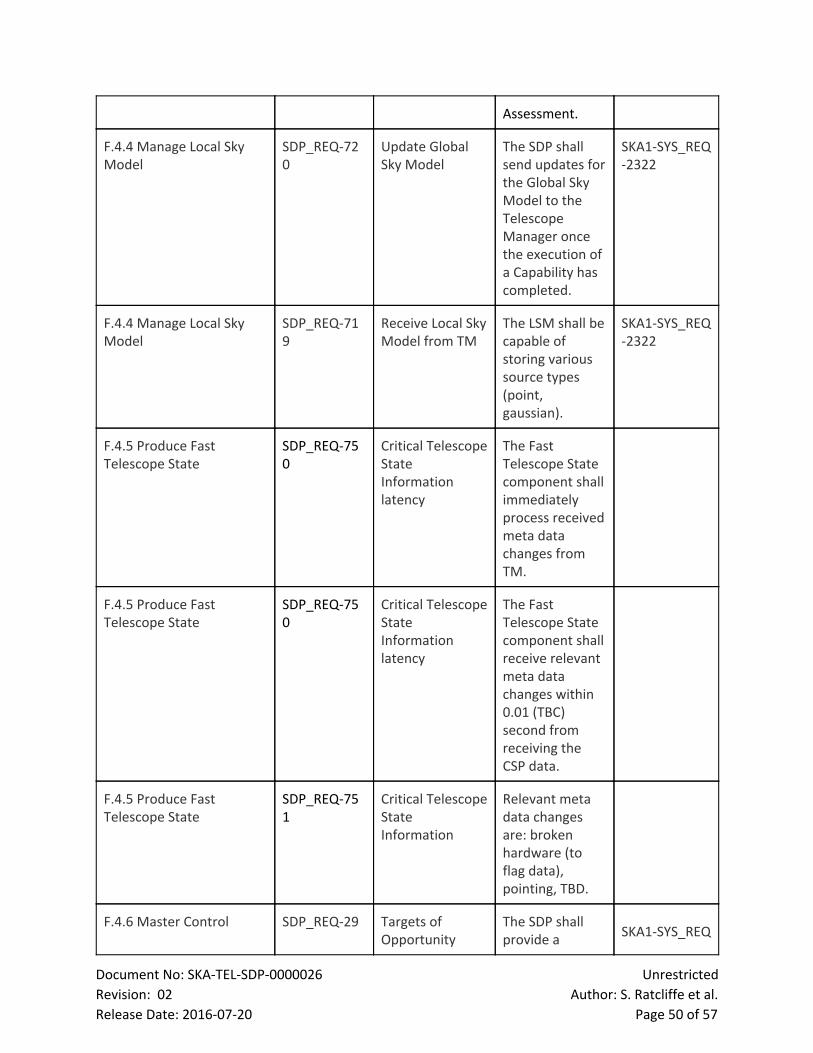
Assessment.
F.4.4 Manage Local Sky Model
SDP_REQ720
Update Global Sky Model
The SDP shall send updates for the Global Sky Model to the Telescope Manager once the execution of a Capability has completed.
SKA1SYS_REQ2322
F.4.4 Manage Local Sky Model
SDP_REQ719
Receive Local Sky Model from TM
The LSM shall be capable of storing various source types (point, gaussian).
SKA1SYS_REQ2322
F.4.5 Produce Fast Telescope State
SDP_REQ750
Critical Telescope State Information latency
The Fast Telescope State component shall immediately process received meta data changes from TM.
F.4.5 Produce Fast Telescope State
SDP_REQ750
Critical Telescope State Information latency
The Fast Telescope State component shall receive relevant meta data changes within 0.01 (TBC) second from receiving the CSP data.
F.4.5 Produce Fast Telescope State
SDP_REQ751
Critical Telescope State Information
Relevant meta data changes are: broken hardware (to flag data), pointing, TBD.
F.4.6 Master Control SDP_REQ29 Targets of Opportunity
The SDP shall provide a
SKA1SYS_REQ
Document No: SKATELSDP0000026 Unrestricted
Revision: 02 Author: S. Ratcliffe et al.
Release Date: 20160720 Page 50 of 57
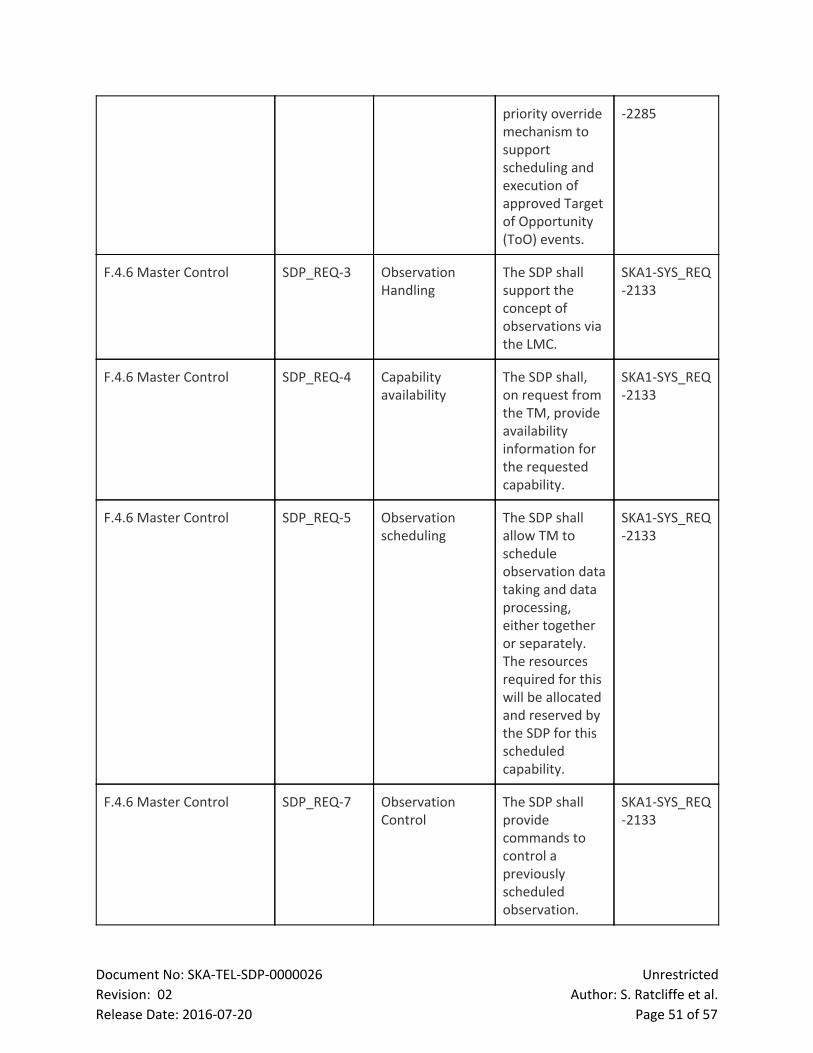
priority override mechanism to support scheduling and execution of approved Target of Opportunity (ToO) events.
2285
F.4.6 Master Control SDP_REQ3 Observation Handling
The SDP shall support the concept of observations via the LMC.
SKA1SYS_REQ2133
F.4.6 Master Control SDP_REQ4 Capability availability
The SDP shall, on request from the TM, provide availability information for the requested capability.
SKA1SYS_REQ2133
F.4.6 Master Control SDP_REQ5 Observation scheduling
The SDP shall allow TM to schedule observation data taking and data processing, either together or separately. The resources required for this will be allocated and reserved by the SDP for this scheduled capability.
SKA1SYS_REQ2133
F.4.6 Master Control SDP_REQ7 Observation Control
The SDP shall provide commands to control a previously scheduled observation.
SKA1SYS_REQ2133
Document No: SKATELSDP0000026 Unrestricted
Revision: 02 Author: S. Ratcliffe et al.
Release Date: 20160720 Page 51 of 57
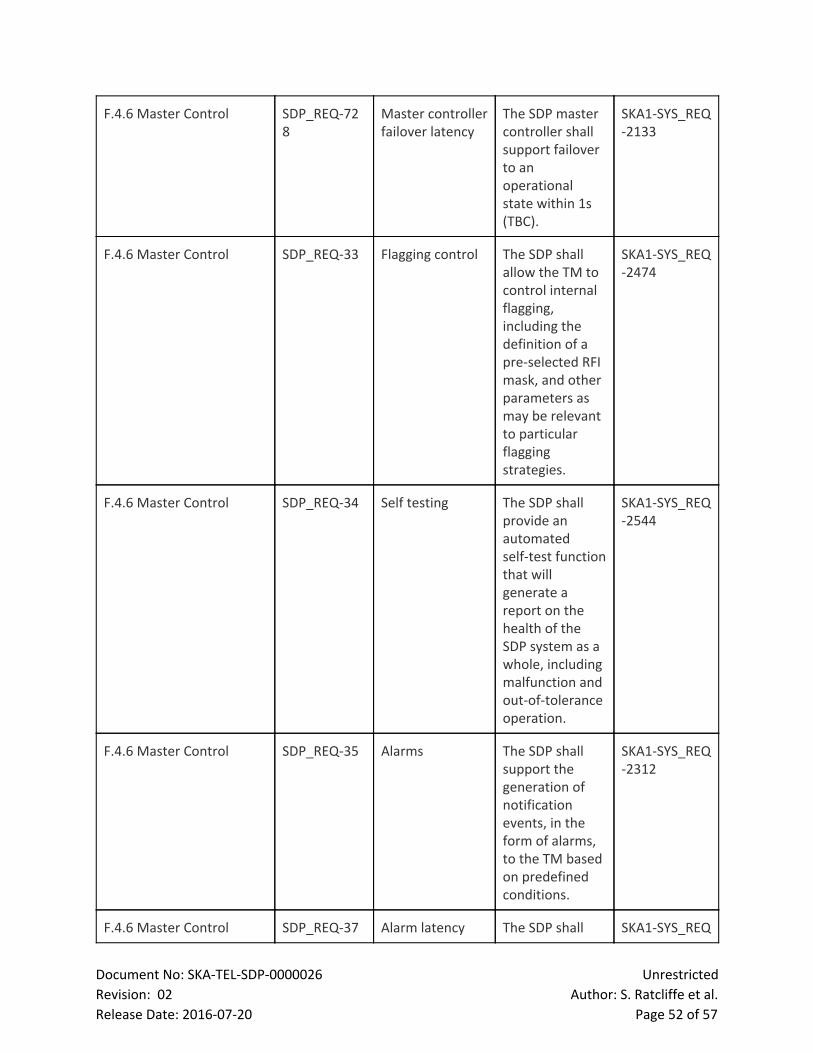
F.4.6 Master Control SDP_REQ728
Master controller failover latency
The SDP master controller shall support failover to an operational state within 1s (TBC).
SKA1SYS_REQ2133
F.4.6 Master Control SDP_REQ33 Flagging control The SDP shall allow the TM to control internal flagging, including the definition of a preselected RFI mask, and other parameters as may be relevant to particular flagging strategies.
SKA1SYS_REQ2474
F.4.6 Master Control SDP_REQ34 Self testing The SDP shall provide an automated selftest function that will generate a report on the health of the SDP system as a whole, including malfunction and outoftolerance operation.
SKA1SYS_REQ2544
F.4.6 Master Control SDP_REQ35 Alarms The SDP shall support the generation of notification events, in the form of alarms, to the TM based on predefined conditions.
SKA1SYS_REQ2312
F.4.6 Master Control SDP_REQ37 Alarm latency The SDP shall SKA1SYS_REQ
Document No: SKATELSDP0000026 Unrestricted
Revision: 02 Author: S. Ratcliffe et al.
Release Date: 20160720 Page 52 of 57
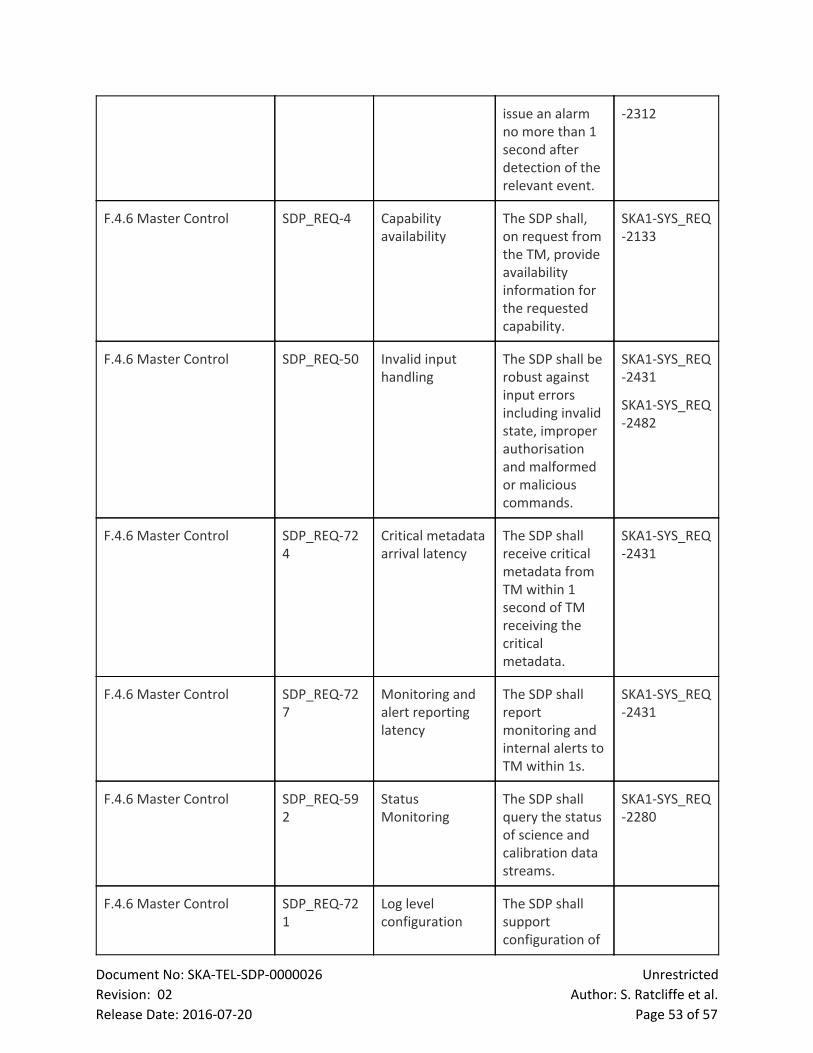
issue an alarm no more than 1 second after detection of the relevant event.
2312
F.4.6 Master Control SDP_REQ4 Capability availability
The SDP shall, on request from the TM, provide availability information for the requested capability.
SKA1SYS_REQ2133
F.4.6 Master Control SDP_REQ50 Invalid input handling
The SDP shall be robust against input errors including invalid state, improper authorisation and malformed or malicious commands.
SKA1SYS_REQ2431
SKA1SYS_REQ2482
F.4.6 Master Control SDP_REQ724
Critical metadata arrival latency
The SDP shall receive critical metadata from TM within 1 second of TM receiving the critical metadata.
SKA1SYS_REQ2431
F.4.6 Master Control SDP_REQ727
Monitoring and alert reporting latency
The SDP shall report monitoring and internal alerts to TM within 1s.
SKA1SYS_REQ2431
F.4.6 Master Control SDP_REQ592
Status Monitoring
The SDP shall query the status of science and calibration data streams.
SKA1SYS_REQ2280
F.4.6 Master Control SDP_REQ721
Log level configuration
The SDP shall support configuration of
Document No: SKATELSDP0000026 Unrestricted
Revision: 02 Author: S. Ratcliffe et al.
Release Date: 20160720 Page 53 of 57
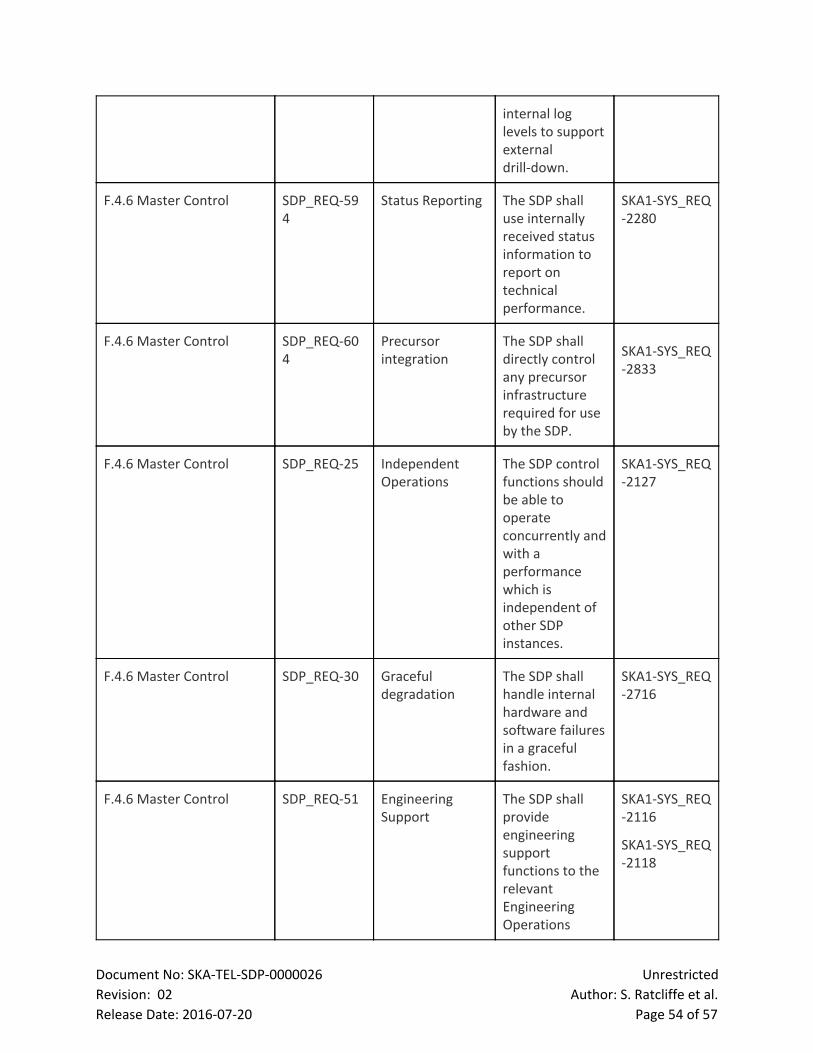
internal log levels to support external drilldown.
F.4.6 Master Control SDP_REQ594
Status Reporting The SDP shall use internally received status information to report on technical performance.
SKA1SYS_REQ2280
F.4.6 Master Control SDP_REQ604
Precursor integration
The SDP shall directly control any precursor infrastructure required for use by the SDP.
SKA1SYS_REQ2833
F.4.6 Master Control SDP_REQ25 Independent Operations
The SDP control functions should be able to operate concurrently and with a performance which is independent of other SDP instances.
SKA1SYS_REQ2127
F.4.6 Master Control SDP_REQ30 Graceful degradation
The SDP shall handle internal hardware and software failures in a graceful fashion.
SKA1SYS_REQ2716
F.4.6 Master Control SDP_REQ51 Engineering Support
The SDP shall provide engineering support functions to the relevant Engineering Operations
SKA1SYS_REQ2116
SKA1SYS_REQ2118
Document No: SKATELSDP0000026 Unrestricted
Revision: 02 Author: S. Ratcliffe et al.
Release Date: 20160720 Page 54 of 57
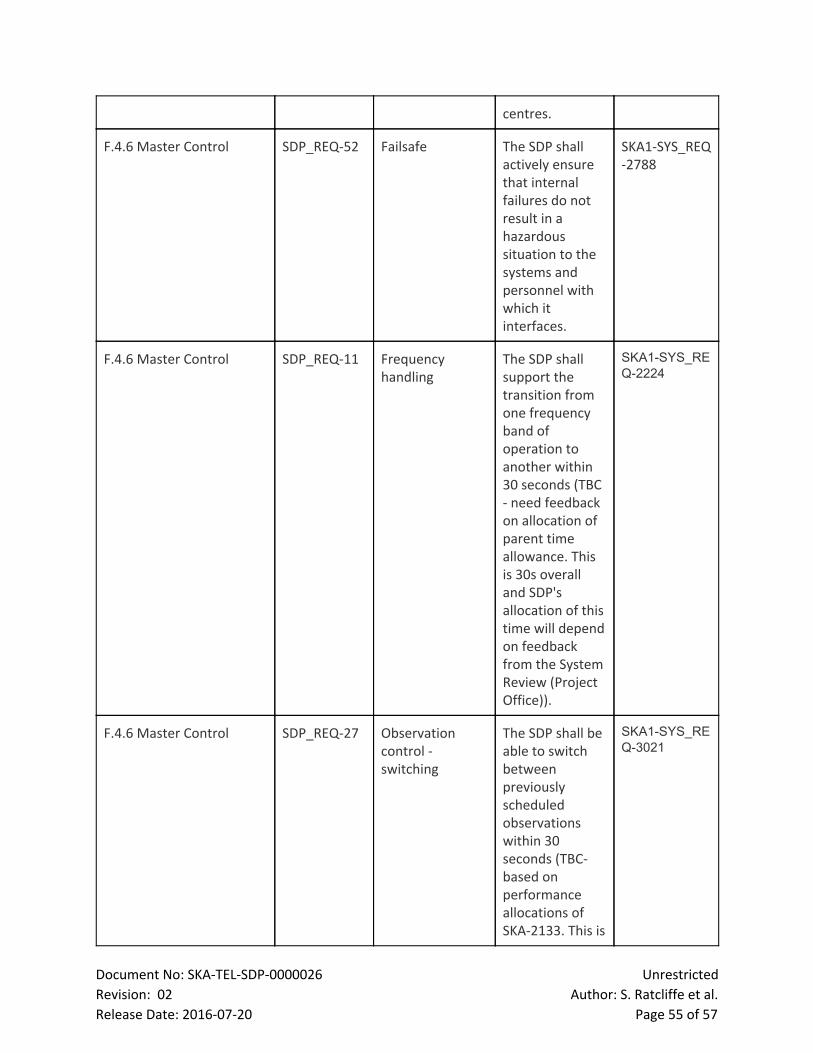
centres.
F.4.6 Master Control SDP_REQ52 Failsafe The SDP shall actively ensure that internal failures do not result in a hazardous situation to the systems and personnel with which it interfaces.
SKA1SYS_REQ2788
F.4.6 Master Control SDP_REQ11 Frequency handling
The SDP shall support the transition from one frequency band of operation to another within 30 seconds (TBC need feedback on allocation of parent time allowance. This is 30s overall and SDP's allocation of this time will depend on feedback from the System Review (Project Office)).
SKA1SYS_REQ2224
F.4.6 Master Control SDP_REQ27 Observation control switching
The SDP shall be able to switch between previously scheduled observations within 30 seconds (TBC based on performance allocations of SKA2133. This is
SKA1SYS_REQ3021
Document No: SKATELSDP0000026 Unrestricted
Revision: 02 Author: S. Ratcliffe et al.
Release Date: 20160720 Page 55 of 57
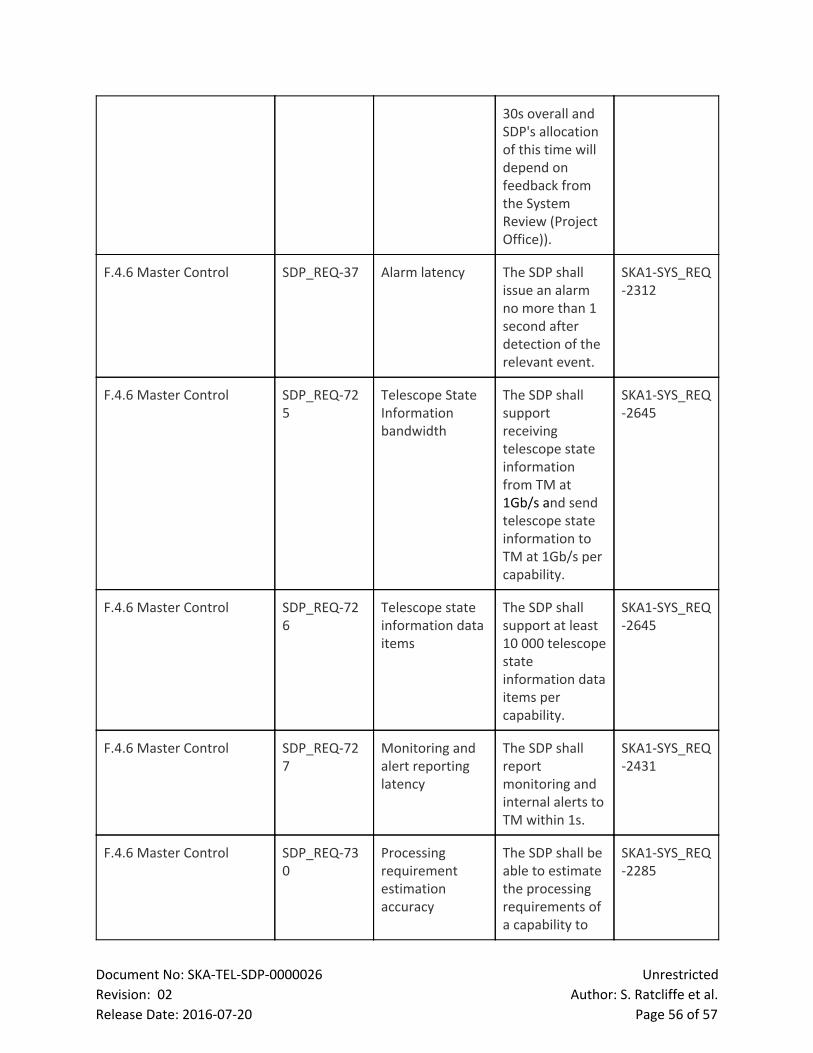
30s overall and SDP's allocation of this time will depend on feedback from the System Review (Project Office)).
F.4.6 Master Control SDP_REQ37 Alarm latency The SDP shall issue an alarm no more than 1 second after detection of the relevant event.
SKA1SYS_REQ2312
F.4.6 Master Control SDP_REQ725
Telescope State Information bandwidth
The SDP shall support receiving telescope state information from TM at 1Gb/s and send telescope state information to TM at 1Gb/s per capability.
SKA1SYS_REQ2645
F.4.6 Master Control SDP_REQ726
Telescope state information data items
The SDP shall support at least 10 000 telescope state information data items per capability.
SKA1SYS_REQ2645
F.4.6 Master Control SDP_REQ727
Monitoring and alert reporting latency
The SDP shall report monitoring and internal alerts to TM within 1s.
SKA1SYS_REQ2431
F.4.6 Master Control SDP_REQ730
Processing requirement estimation accuracy
The SDP shall be able to estimate the processing requirements of a capability to
SKA1SYS_REQ2285
Document No: SKATELSDP0000026 Unrestricted
Revision: 02 Author: S. Ratcliffe et al.
Release Date: 20160720 Page 56 of 57
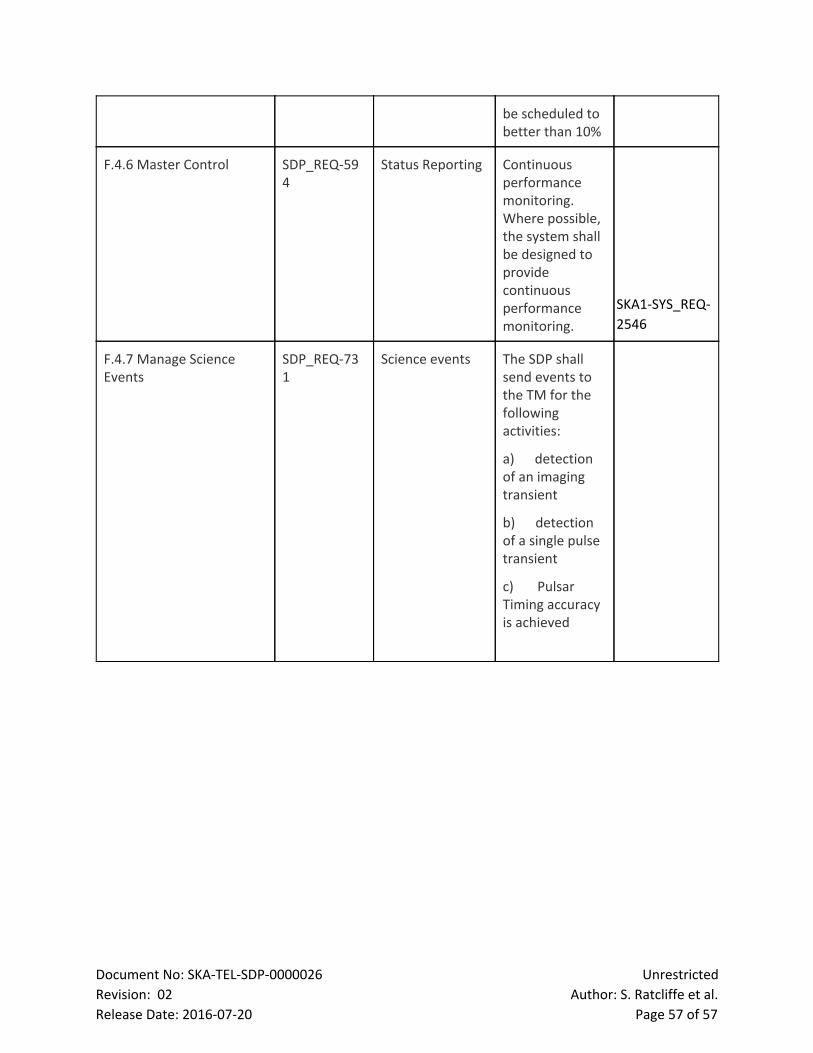
be scheduled to better than 10%
F.4.6 Master Control SDP_REQ594
Status Reporting Continuous performance monitoring. Where possible, the system shall be designed to provide continuous performance monitoring.
SKA1SYS_REQ
2546
F.4.7 Manage Science Events
SDP_REQ731
Science events The SDP shall send events to the TM for the following activities:
a) detection of an imaging transient
b) detection of a single pulse transient
c) Pulsar Timing accuracy is achieved
Document No: SKATELSDP0000026 Unrestricted
Revision: 02 Author: S. Ratcliffe et al.
Release Date: 20160720 Page 57 of 57