Embed Size (px)
Citation preview
Sociology Working PaperPaper Number 2005--01
Preliminary Report: Social Factors in Admission to the University of Oxford
Anthony Heath and Anna Zimdars
Department of SociologyUniversity of Oxford
Manor RoadOxford, OX1 3UQ
www.sociology.ox.ac.uk/swp.html
1

Abstract
This is an interim report. It focuses on the success rate of gaining a conditional offer by ‘pre-A-
level candidates’. It explores whether the differing success rates of various groups of applicantscan be explained by their achieved academic records. Except in the cases of Mathematics andMedicine, results from aptitude testing have not been examined. Nor are we able to investigatethe quality of the submitted written work or of performance in interviews.
In the absence of information on interview performance and most subject-specific tests, we find
that the strongest relationship with admissions decisions is attainment at GCSE. Attained ASgrades, Advanced Extension Awards and predicted A2 grades also play modest roles, butwithout superseding the effect of GCSEs. The centralised Mathematics and Medicine tests arealso strong predictors of gaining a conditional offer.
The study thus finds that admission decisions to the University of Oxford are closely correlated
with achieved academic records and are therefore in line with the criteria laid out by theUniversity’s Educational Standards committee, namely ‘the University seeks to admit the bestapplicants… solely on the basis of academic ability and potential’.
The study finds that working-class candidates experience lower overall success rates of gaining
admission to the University of Oxford but that these poorer success rates can largely beexplained statistically by their slightly lower scores at GCSE.
We also find that female candidates and South Asian candidates experience lower overall
success rates of gaining admission to the University of Oxford. In the case of Mathematics andMedicine where we have access to applicants’ test scores, South Asian and female candidates’slightly poorer performances on these tests go some considerable way to explain their lowersuccess rates of securing a conditional offer.
We also find that candidates from independent schools experience poorer success rates in the
competition for gaining a conditional offer once we take into account attainment at GCSE. It isnot yet clear what the explanation for this finding is.
2

INTRODUCTION
The Oxford Admissions Study aims to contribute to the debate about admissions to universities ingeneral and admissions to the University of Oxford in particular. As a public university, theUniversity of Oxford strives not only to advance its institutional mission of providing the bestpossible education to students and advancing research but also to deliver on its public duty toensure equality of access for all strata of society. The Oxford Admissions Study was therefore set upto assess whether social factors, such as social class origin, gender or ethnicity, influence chances ofgaining entrance to the University of Oxford and if so, why this might be the case. There havebeen a number of high profile individual cases where the University of Oxford has been accused ofunfairness in admissions, but individual cases do not provide a good basis for judging the fairness ofthe admissions process or for making informed policy recommendations. Our concern is to providea more general and thorough investigation into the question of whether particular groups suffersystematic disadvantages in securing admission to the University of Oxford.
There is broad agreement that access to higher education should be determined by academic meritand potential and that it should not be influenced by other factors such as social class and ethnicity.However, there is some disagreement over how to define merit and even more so with regards todefining and measuring ‘potential’ and how to use those concepts in the admissions process. Thebasis for admissions decisions is laid out in the University of Oxford’s Educational Policy andStandard Committee’s Learning and Teaching Strategy:
‘The University seeks to admit the best applicants irrespective of their social, regional,ethnic, or educational background, solely on the basis of academic ability andpotential.’ (Educational Policy and Standard Committee, 2003, p. 7).
Subjects usually elaborate on these broad criteria. In the case of Philosophy, Politics andEconomics (PPE), for instance, published criteria specify that ‘the admissions process as a whole isconcerned with detecting potential for the study of PPE at the University of Oxford. Existingachievements (as revealed in official examinations, predicted examinations results, written work andschool reports) are relied upon mainly as evidence of potential… In the case of candidates whosefirst language is not English, competence in the English language is also a criterion of admissions’(published on the University of Oxford website, 2003).
In the Admissions Study, we focus therefore on whether candidates from different social, regional,ethnic or educational backgrounds have the same chances of gaining admission, taking account oftheir existing academic achievements, as revealed in official examinations, and their predictedexamination results. We have not, however, been able to measure the quality of the submittedwritten work, school reports or performance at interview and in that respect our research does nottake into account all the information available to those carrying out the admissions process. OxfordAdmissions aims to be a ‘holistic’ method (as recommended in the Schwartz report), looking at each
3
candidate in full. The statistical models in our research are, therefore, simplifications of a morecomplex reality.
THE UNIVERSITY OF OXFORD CONTEXT
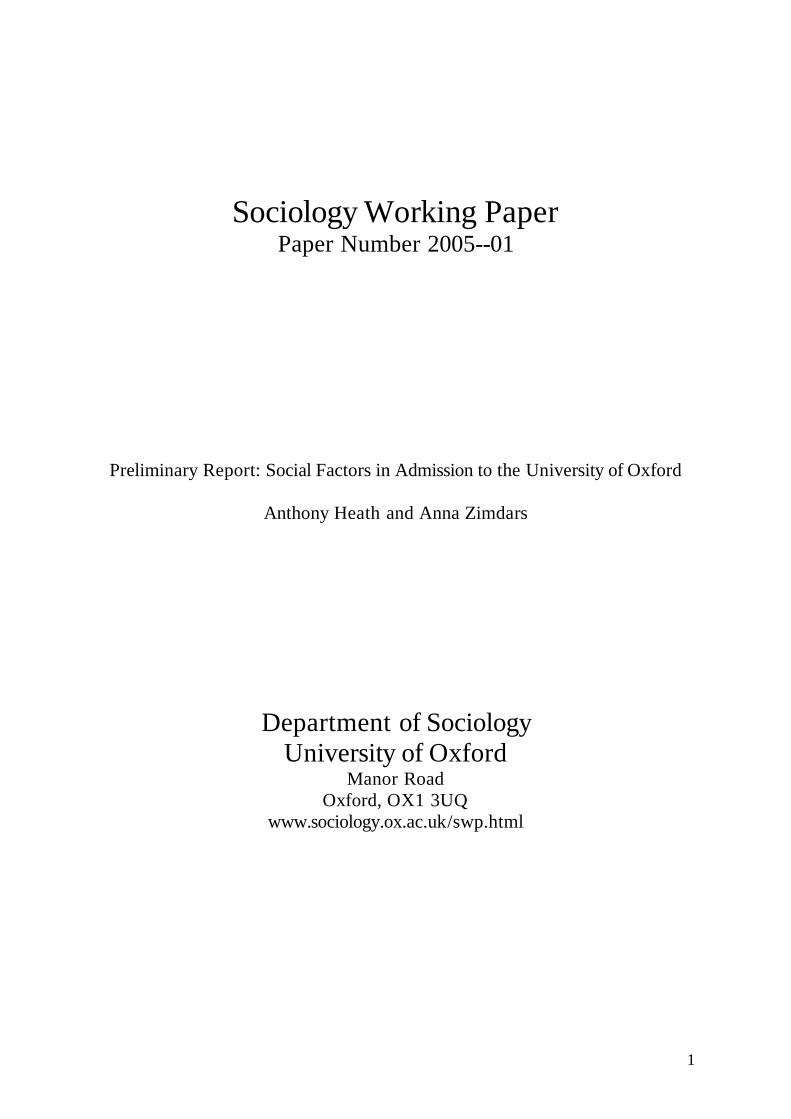
The University of Oxford is a collegiate university consisting of thirty-nine individual colleges –thirty of which admit undergraduate students – and seven permanent private halls. The admissionsprocedure to the University of Oxford as well as admissions to the University of Cambridge(collectively known as ‘Oxbridge’) follow a different pattern to applications to other universities inthe United Kingdom; Oxbridge has an earlier application deadline1 and a supplementaryapplication form. In addition, approximately 90 per cent2 of applicants to Oxbridge from theUnited Kingdom or other European countries are invited to attend an interview at one or morecolleges of the University (see Figure 1).
Figure 1:
PREVIOUS RESEARCH
Previous research has provided some insights into the relation between social background andadmissions decisions in the highly competitive Oxbridge context. The ethnic monitoring
1 Applications including the University of Oxford or the University of Cambridge need to be received by UCAS by the15th of October in the year preceding enrolment whereas the closing date for applications to other institutions is the15th of January for enrolment in the same autumn term.2 In Medicine, only around 40 per cent of applicants are invited for interview.
Pool of Pool of prepreAAlevel level applicants applicants
to to universityuniversity
Actual Actual applications applications
to Oxford to Oxford UniversityUniversity
Invited for Invited for interview interview
Conditional Conditional OfferOffer
new new undergraduateundergraduate
Desummoned(do not meet academic requirements)
No offer
*
Pool of applicants
unlikely to be considered for
a place at Oxford
University
Pool of applicants ‘eligible’ to
apply but fail to do so
*a) Candidate does not meet conditional offer and offer not lowered
b) Candidate rejects offer
Stages in the Admissions Process to the University of OxfordStages in the Admissions Process to the University of Oxford(UK preALevel candidates only)
11 443322Branching points
4

administered by the Oxford Colleges Admissions Office (OCAO) has shown that in the pastmembers of some ethnic minorities have had poorer overall chances of gaining access. However,these published data do not take account of any measures of attainment in official examinationsand so cannot in themselves be taken as evidence of unfairness in the admissions procedure.Boliver’s (2004) analysis of the Universities and Colleges Admissions Service (UCAS) data ofapplicants to the University of Oxford does however include one important measure of merit,namely achieved A2 grades. Boliver’s study shows that, comparing candidates with similar A2scores, those from ethnic minority and working class backgrounds have poorer chances of gainingadmission than white middle-class applicants. Achieved A2 scores are not, however, the idealmeasure of merit since most candidates have not yet taken their A2 examinations at the time thatthey apply: they are ‘pre-A2 candidates’. Admissions tutors cannot therefore make decisions on thebasis of achieved A2 grades but must rely on the information available to them at the time of theinterview such as predicted grades or attainment at GCSE. Unfortunately, however, the UCASdataset used by Boliver is restricted in that it contains no information with regard to candidates’achieved GCSE grades and, in the case of pre-A2 candidates, their predicted grades at A2. (Thisinformation is contained on the individual UCAS forms but is currently not available through theUCAS database). It could also be argued that A2 grades may themselves be influenced by whetheror not a candidate is offered a place at the University of Oxford.
In contrast to previous research, the Oxford Admissions Study will be able to shed more light on theunderlying mechanisms for why applicants with certain social characteristics show a lowerlikelihood of being admitted to the University of Oxford. In particular, we have coded and addedto our database candidates’ attainments at GCSE and their predicted A2 grades. We also haveadditional measures of ‘academic potential’ such as the Alice Heim reasoning test for highachievers, measures of deep and surface learning and insights into candidates’ motivation to pursuetheir chosen degree course. These measures are complemented by information on ‘non-meritocratic’ factors such as family background (social class, parental education), social and culturalcapital and whether the candidate had a familial link with either the University of Oxford or theUniversity of Cambridge (these latter factors will be examined in detail in future papers).
METHODS AND DATA
As laid out above, the research material included a reasoning test and an exercise on deep andsurface learning. The reasoning test made it indispensable to administer part of the research undercontrolled conditions to ensure that candidates spent the same amount of time on the assignments.This could be achieved by conducting the research while candidates were in Oxford to attend theirinterview(s) and a successful pilot study at four Oxford colleges in December 2000 reassured theresearch team and the colleges that this was indeed feasible. Subsequently, the AdmissionsExecutive of the University of Oxford approved a large-scale study at a representative sample ofOxford colleges and a note was added to the University of Oxford Undergraduate Prospectus forentry in 2003 that applicants for admissions ‘may be asked to take part in research to investigate the
5

factors that influence access to the University of Oxford and subsequent academic attainment’(Undergraduate Prospectus, 2002, p.22).
SAMPLING OF COLLEGES
The twenty-nine undergraduate colleges3 of the University of Oxford were stratified by the averagepercentage of offers made to independent school candidates over the last four years and the positionon the Norrington Table over the same period of time. The Norrington Table ranks colleges bydegree outcomes achieved by the college’s undergraduate students. We judged these two measuresto be the most powerful and relevant ways in which to differentiate between colleges. One collegewas to be selected from each cell of the resulting three by three table (Table 1). In actual fact, 11colleges participated in the research as two additional colleges wished to be included. In total, 4539candidates had applied to the selected eleven colleges with the total number of applicants to theUniversity of Oxford as a whole in 2002 being 11,793.
TABLE 1 SAMPLING OF COLLEGES
Position on the Norrington Table
Percentage of Offers toCandidates from Independent
Schools
Top Middle Bottom
High 2 out of 3 1 out of 4 1 out of 2
Medium 1 out of 5 1 out of 2 1 out of 4
Low 1 out of 2 2 out of 4 1 out of 3
RESEARCH
In addition to the note in the undergraduate prospectus, the research team sent a personal letter toall United Kingdom and European applicants4 who had applied to one of the research colleges.Candidates were invited to participate in the surveys but, at the same time, the voluntary characterof the research was emphasised. Letters were also sent to the heads of all educational institutionsthat were sending at least one candidate to a participating college. Candidates and theireducational institutions were informed that whether or not a candidate participated in the researchhad no impact whatsoever on the college’s decision to admit him or her, that all information on
3 Harris Manchester College was excluded from the sample because surveying mature applicants would have requireddifferent survey questions. All Souls College was excluded based on its research college status. 4 Overseas candidates are not required to attend interviews at Oxford. An exception to this rule is Medicine and letterswere sent to overseas applicants to this particular degree programme.
6
individual candidates would be kept confidential to the research team and that all published resultswould be in a form that precluded the possibility of identifying individual candidates or theirschools. The actual research took place in the eleven colleges after dinner between the ninth and theseventeenth of December 2002 and the research was administered by trained invigilators. Allresearch participants took part in a reasoning exercise and completed a questionnaire. In addition,candidates at six colleges also completed a commentary test designed to elicit deep or surfacelearning approaches to learning. The research took between 30 to 75 minutes to complete.
Due to the design of the study, several groups of applicants for admissions to the University ofOxford were excluded from the research. As illustrated in Figure 1, the second stage in theadmissions process of pre-A2 candidates is the shortlisting for interviews. The vast majority of pre-A2 applicants from the United Kingdom ‘survive’ this stage in the selection process but around tenper cent of applicants are deselected at this stage on the basis of their previous academicattainment. This process is known as ‘desummoning’ and desummoned candidates are not coveredin this research. It has also not been possible to cover the majority of candidates to Engineeringand subjects with Engineering in their title in the research. The interview schedule for this subjectarea is designed to allow candidates to return home immediately after their interviews and mostcandidates applying for these subjects did not stay in Oxford overnight and were thus unavailable toparticipate in the research. The voluntary nature of the research, which was emphasised again inthe briefing before the research sessions, meant that not all candidates elected to participate in thestudy. In total, 1929 candidates for admissions from the eleven selected colleges participated in theresearch. This represents an overall response rate of 54 per cent of all candidates5 attending forinterview. We are reassured that the sample is broadly representative of the summoned applicantsto the research colleges in terms of the division they applied to, the type of offers they received andtheir type of school; however we had a slightly higher take up rate among female applicants thanmale applicants (see appendix 4).
Candidates were asked for their permission to link the research material with their examinationresults. Almost all candidates gave their permission, and for these candidates the research materialwas subsequently linked to their results at GCSE and other public examinations, and their results incentralised university tests (see next paragraph). In due course it is planned to link the material withtheir examination results in their first year results at university and eventually with their final degreeoutcome.
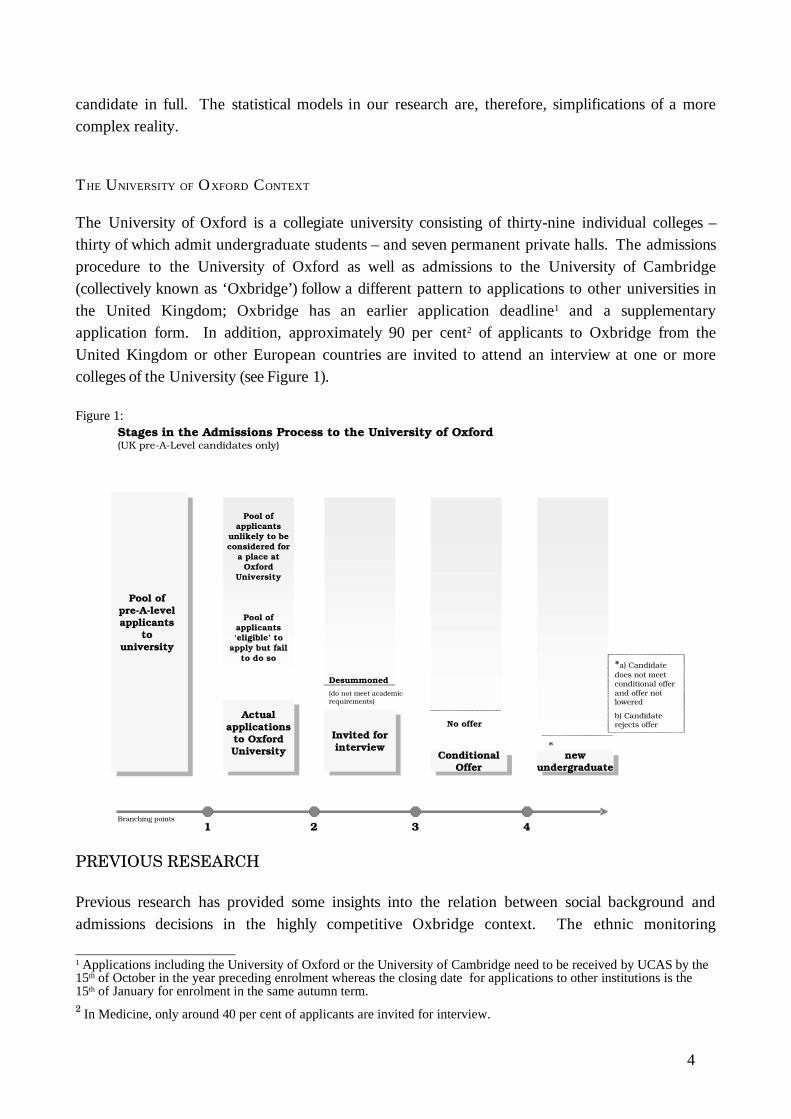
The ‘meritocratic’ measures available to the research team are summarised in Figure 2. GCSEresults are available for all applicants assessed in this paper and predicted A2-grades were alsoavailable for the vast majority of this group. Some candidates or their schools disclosed achievedAS results but this information was not available for all applicants. In addition, eighty onecandidates had taken or were going to take Advanced Extension Awards. Moreover, the majorityof subjects at the University of Oxford collect additional information from candidates. It is
5 This figure is based on all summoned applicants to the research colleges excluding those applying to read EngineeringScience.
7

customary to ask for submissions of recent samples from the candidates’ written work. Severalsubjects also administer tests during the interview period designed to assess abilities directly relatedto the applicants’ chosen course of study. While most of these tests are marked within individualcolleges or small college groups, there are two subject areas that mark their tests centrally: Medicineand Physiological Sciences and Mathematics. The results of these two centralised tests wereincorporated.
FIGURE 2:
ANALYSIS
The research includes candidates from the United Kingdom, the geographic region of Europe aswell as overseas applicants for Medicine and both pre-qualification and post-qualificationapplicants. The qualifications that candidates have, or plan to take, include the InternationalBaccalaureate and Abitur as well as A2 examinations. The largest single group of applicants is thatof the pre-A2 candidates, and in this report we focus on this particular group (1551 candidates inall). In a future report we will compare the chances of gaining a place of pre- and post A2candidates and of those taking other qualifications.
In the analysis, it is crucial to distinguish between what might be termed ‘gross’ differences inchances of acceptance and ‘net’ differences after taking account of candidates’ attained grades atGCSE and A2 predictions. By gross differences we mean the differences in chances of gaining aconditional offer between candidates from different backgrounds before taking account of differences inschool examination results or other relevant criteria. One possibility is that, for example, working classcandidates could have lower scores at GCSE than the middle class candidates and that thisdifference in prior academic achievement can explain their lower ‘gross’ chances of gaining aconditional offer. We therefore need to look at ‘net’ class differences after taking account of
Attainment measures collected by the Admissions Study Attainment measures collected by the Admissions Study (UK preA2 candidates)
A2A2
predictionspredictionsAS AS
attainmentattainment
GCSEGCSE
attainmentattainment
Available only for those who had ‘cashed them in’ (disclosed) which is not
mandatory
A2 A2
actual actual attainment attainment
Advanced Advanced Extension Extension
Awards Awards
Centralised Centralised subject specific subject specific
teststests
8
measured attainment or predicted attainment in public examinations. It is these ‘net’ differencesthat are of primary policy concern.
In this report, then, our first step is to look at the gross differences in chances of receiving an offer.Secondly we look at the net differences after controlling for attainment at GCSE and the otherattainment measures available.
We begin simply by looking at chances of gaining a conditional offer broken down by the majorbackground factors specified in the University’s Learning and Teaching Strategy, namely classorigins, gender, ethnicity, type of school and region. As a rough comparator, the official data fromthe Oxford Colleges Admissions Office are also cited. The comparison is imperfect since oursample does not include desummoned candidates or post-qualification ones. These compositionaldifferences also explain why the conditional offer rate among the pre-A2 research participants washigher than it was among all applicants.
9

TABLE 2: ‘GROSS’ INEQUALITIES: PERCENTAGE OF CONDITIONAL OFFERS AMONG PRE-A2 CANDIDATES BY SOCIO-DEMOGRAPHIC
CHARACTERISTICS
Per cent of pre-A2candidates gainingconditional offer
N Oxfordapplicants
comparator
N
Social ClassProf and managerial 37.6 1339Working class 24.7 85
EthnicityWhite 37.7 1322 31.0 8140South Asian 19.2 99 21.0 501Other Ethnicity 34.4 163 28.0 1082
GenderMale 39.5 698 28.6 5873Female 33.1 852 27.0 5920
Type of SchoolIndependent 37.1 593 32.8 3803Comprehensive 33.3 514 NAOther 37.8 328 NAGrammar 37.0 373 NASubtotal: All state 35.2 948 26.9 5350
RegionDevolved regions 34.4 151 31.9 957South 37.6 700 30.1 5031 Midlands and East 33.1 338 28.7 1998North 36.8 280 30.9 1766Overseas 28.6 42Continental Europe 42.9 21
16.7 2041
Missing 42.1 19 n.a. 0
All candidates 36.0 1551 27.8 11,797
Notes: Bold figures for the Admissions Study indicate a success rate that is significantly different at the .05 level or better from the referencecategory. The reference category for social class is ‘professional and managerial class’; the reference category for ethnicity is ‘white’, the referencecategory for gender is ‘male’, the reference category for type of school is ‘comprehensive school’ and for region it is ‘devolved regions’. Figures forthe Oxford comparator refer to all applicants except in the case of school type where they refer to pre-A2 applicants.
Table 2 shows some clear patterns with applicants from working class and South Asian originshaving markedly lower chances of receiving a conditional offer than middle class or Whiteapplicants. Compared with the overall success rate of 36 per cent in our sample, working-classapplicants had a success rate of 25 per cent and South Asian candidates a success rate of 19 percent.6 Female applicants also had a lower success rate of 33 per cent compared to 39 per cent forthe male applicants. These are substantively large differences. There were smaller differences inthe success rates of candidates from different regions or from different types of school. None of thedifferences by type of school or region were statistically significant.
6 The group of South Asians comprises applicants of Indian, Pakistani and Bangladeshi origin. See appendix for detailson the coding of the ethnicity variable.
10

The patterns found among our sample correspond closely with those found in the full cohort ofapplicants. As we noted earlier, the overall success rate is higher in our sample than in the cohort asa whole because of our exclusion of desummoned candidates. However, the pattern of groupdifferences is reassuringly similar in the sample and the full cohort. The pattern which we find inour sample is also very similar to the gross differences found by Boliver in her study of all applicantsto the University of Oxford in 2000. Boliver’s work confirms a large ‘gross’ disadvantageexperienced by South Asian applicants and a slightly smaller one experienced by working classapplicants. Her research also confirms smaller gender and school-type differences. We feelconfident therefore that the gross pattern of disadvantages found in our sample is a robust one andis not specific to this particular sample or to this particular year.
Our crucial task then is to account for the working-class, South Asian and the gender disadvantages.One possibility is that these candidates simply have lower academic ability and potential asmeasured by the information available to admissions tutors such as GCSE results and predicted A2grades. Another possibility is that working class, female and South Asian applicants have applied tomore competitive subjects such as Medicine where the overall chances of success are lower. We canthink of these as factors that are appropriate to enter into admissions decisions.
TABLE 3A SCORES ON MEASURES OF ACADEMIC ATTAINMENT BY SOCIAL BACKGROUND
11
AverageCGSE score
N=1499
AveragepredictedAS scoreN = 325
AverageAchieved AS
scoreN = 1208
Averagepredicted A2
score(excludingGeneralStudies)
n = 1518
Number ofachieved orpredictedadvancedextensions
awardsN = 81
AverageAchieved A2
score(excludingGeneralStudies)n=1547
Social ClassProfessional/manager 7.4 57.8 57.3 119.1 .06 114.9Clerical 7.2 57.5 56.5 118.6 .06 112.6Working 7.1 59.0 55.4 118.9 .09 110.8Class missing 7.3 59.1 57.6 119.2 .10 114.1
EthnicityWhite 7.4 58.0 57.2 119.1 .06 114.9South Asian 7.3 57.3 56.2 118.9 .15 112.4Other ethnicity
7.2 57.9 57.5 119.1 .07 113.3
GenderMale 7.3 58.0 57.2 118.9 .06 114.1Female 7.4 57.8 57.1 119.2 .07 115.0
Type of SchoolComprehensive 7.3 58.2 56.4 118.8 .05 113.0Independent 7.5 57.8 58.0 119.4 .07 116.2Grammar 7.4 56.9 57.8 119.2 .07 113.9Other 7.3 57.9 56.8 119.0 .08 114.3
Note: bold indicates that the score is significantly different at the .10 level or better from that of the reference category. The reference categoryfor social class is ‘professional and managerial class’; the reference category for ethnicity is ‘white’, the reference category for gender is ‘male’, thereference category for type of school is ‘comprehensive school’.
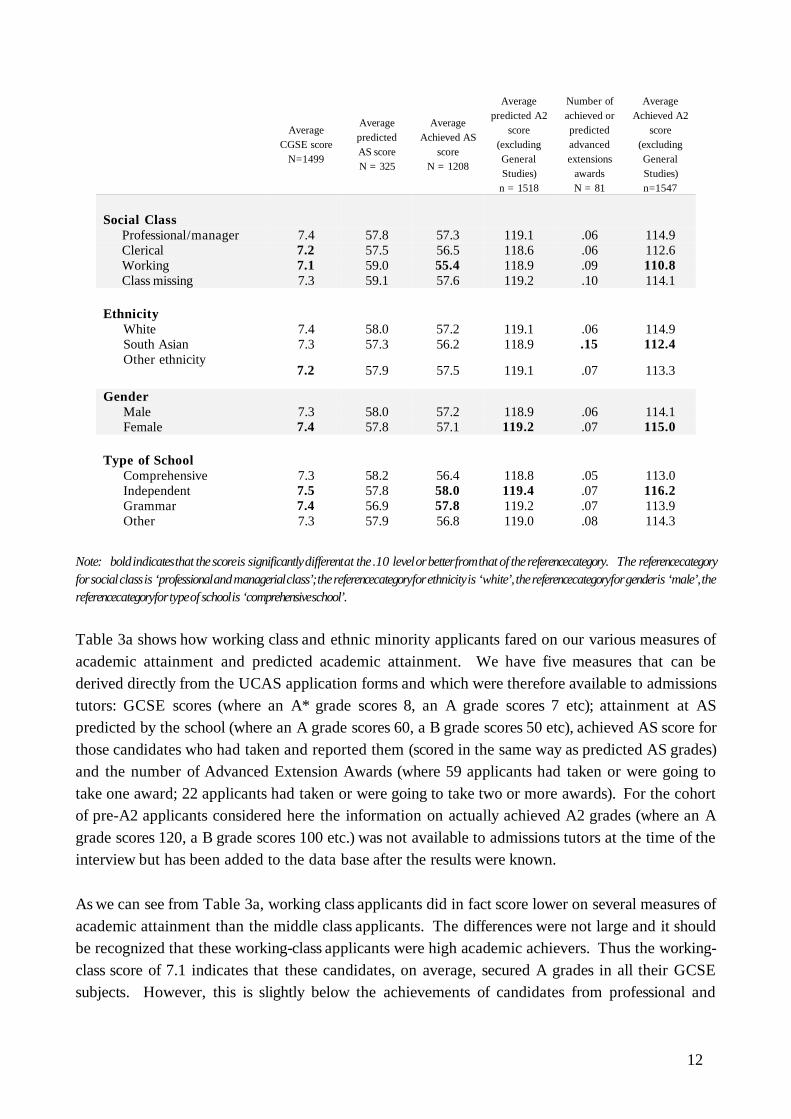
Table 3a shows how working class and ethnic minority applicants fared on our various measures ofacademic attainment and predicted academic attainment. We have five measures that can bederived directly from the UCAS application forms and which were therefore available to admissionstutors: GCSE scores (where an A* grade scores 8, an A grade scores 7 etc); attainment at ASpredicted by the school (where an A grade scores 60, a B grade scores 50 etc), achieved AS score forthose candidates who had taken and reported them (scored in the same way as predicted AS grades)and the number of Advanced Extension Awards (where 59 applicants had taken or were going totake one award; 22 applicants had taken or were going to take two or more awards). For the cohortof pre-A2 applicants considered here the information on actually achieved A2 grades (where an Agrade scores 120, a B grade scores 100 etc.) was not available to admissions tutors at the time of theinterview but has been added to the data base after the results were known.
As we can see from Table 3a, working class applicants did in fact score lower on several measures ofacademic attainment than the middle class applicants. The differences were not large and it shouldbe recognized that these working-class applicants were high academic achievers. Thus the working-class score of 7.1 indicates that these candidates, on average, secured A grades in all their GCSEsubjects. However, this is slightly below the achievements of candidates from professional and
12

managerial backgrounds who, on average, achieved A or A* grades in all their subjects. There isalso a pattern for the working-class candidates to have slightly lower scores on the other measures ofacademic attainment such as achieved AS grades. It could therefore be that these slightly lessbrilliant GCSE scores are what account for their lower rate of conditional offers.
However, this explanation does not look so plausible when we turn to the South Asians, whoseexamination results were broadly in line with those of the White candidates. In the case of theSouth Asians, however, we must consider the possibility that they had disproportionately applied tocompetitive subjects such as Medicine. In Table 3b we classify applicants according to their broadsubject grouping, broadly based on division (see appendix 1 for full details). The numbers in oursample are not sufficiently large for us in general to distinguish individual subjects. However, wemake two exceptions for those taking the centralised tests in either Mathematics or Medicine.
Examination results cannot explain the lower likelihood of acceptance of female applicantscompared to male applicants. In fact, female applicants score higher on the attainment measures inTable 3a. But again, it is possible that this group applies disproportionately for competitivesubjects.
TABLE 3B APPLICATIONS TO DIFFERENT DIVISIONS BY SOCIAL CLASS, ETHNICITY, GENDER AND TYPE OF SCHOOL (COLUMN
PERCENTAGES)
HumanitiesSocial
SciencesMedicine Mathematics
OtherSciences
(Life or noMathematics/Medic
ine test taken)
Social ClassProfessional/manager 86.1 87.1 91.0 80.9 86.1Clerical 6.6 3.2 4.5 5.3 7.2Working 5.1 7.1 2.3 9.9 4.0Class missing 2.3 2.6 2.3 3.8 2.7
13

EthnicityWhite 91.4 76.6 72.2 71.0 86.1South Asian 2.1 10.5 15.8 9.2 4.0Other ethnicity
6.6 12.9 12.0 19.8 9.9
GenderMale 36.8 44.2 34.6 67.9 53.2Female 63.2 55.8 65.4 32.1 46.8
Type of SchoolComprehensive 21.3 34.2 28.6 38.9 37.2Independent 41.7 36.8 43.6 31.3 35.3Grammar 8.6 7.1 7.5 4.6 7.2Other 20.5 21.8 20.3 25.2 20.3
n 528 358 131 117 379
It is possible therefore that the gross inequalities in chances of gaining admission can be explainedby differences in the working-class candidates’ measured academic attainment and by the pattern ofSouth Asian and female applications to more competitive subjects. To investigate these possibilitieswe carry out logistic regressions which control statistically for subject group and for achieved andpredicted examination results. In these logistic regressions the parameter estimates associated withclass background, ethnicity and gender tell us about what we termed earlier the ‘net’ differences inchances of gaining a conditional offer. (Strictly speaking these parameter estimates give the logodds of success for the group in question relative to the log odds of success for the reference group.)
The results of the logistic regressions are shown in Table 4. In the first model we simply include ourmeasures of social and educational background. We have dropped region from this analysisbecause none of the parameter estimates were close to statistical significance. This first model,then, repeats the information about gross differences shown in Table 1 but presents them in logitform, making them comparable with the results of the logistic regressions that include our controlsfor academic attainment and predicted attainment as well as controls for subject grouping.
In the second model we include our measure of subject grouping. The parameter estimatesassociated with the subject groupings show that, compared to the reference category of theHumanities Division, candidates for the Social Sciences (including Law) and even more so forMedicine had poorer chances of acceptance. The Medicine test takers had the least favourableodds of gaining admission; the Social Sciences are the second most competitive subject groupingfollowed by the Mathematics test takers, the Humanities and finally the ‘other’ group. The ‘other’category is comprised of the Life Sciences and those students in the Medical or Mathematical andPhysical Sciences division who do not take the centralised tests. We can also see that the inclusionof subject grouping in model 2 reduces the South Asian parameter estimate from its original -0.83in model 1 to -0.70 in model 2. In other words, the South Asian pattern of application to the mostcompetitive subjects such as Medicine and Law explains about a quarter of their gross
14

disadvantage. However, they remain significantly disadvantaged. The female disadvantage is alsoreduced by around 20 per cent.
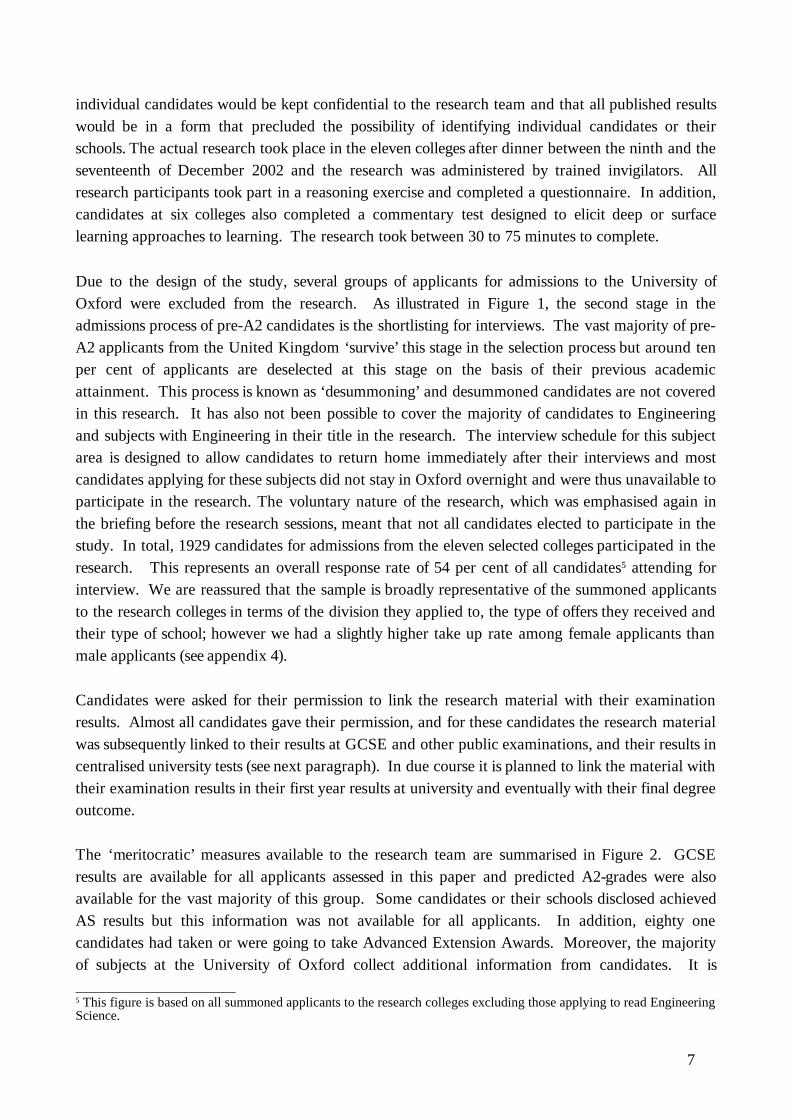
In model 3 we include the first of our measures of academic attainment, namely GCSE scores.GCSE scores have a curvilinear relationship with the chances of gaining admission: chances ofgaining admission are rather low for candidates with an average of C and they only increase slightlywith B grades. They increase more sharply with A grades and improve even more markedly withA* grades. The overall relationship is plotted in Figure 3. To capture this nonlinear relationship,we fit a quadratic term in our logistic regression.
FIGURE 3:
Conditional Offer by GCSE attainment
0
10
20
30
40
50
60
70
80
<=B B/A A A/A* A*
average GCSE attainment
Per
cen
t C
ondi
tion
al O
ffer
Conditional Offer
As we can see from model 3, GCSE grades have a powerful relationship with chances ofacceptance. Bearing in mind that we are unable to take into account all factors that play a role inthe admissions process, most notably the actual interview, the relationship between GCSEs andchances of acceptance is the most powerful relationship that we shall find among all the examinedfactors.
TABLE 4: LOGISTIC REGRESSION MODELS OF PRE-A2 CANDIDATES’ CHANCES OF RECEIVING A CONDITIONAL OFFER
Model 1 Model 2 Model 3 Model 4 Model 6Social Class
Prof/Manager 0 0 0 0 0Clerical -.25
(.24)-.31(.24)
-.12(.26)
-.10(.27)
-.09(.27)
Working -.47(.26)
-.49(.27)
-.23(.29)
-.23(.29)
-.26(.29)
Missing -1.20(.45)
-1.25(.45)
-1.23(.48)
-1.25(.49)
-1.38(.49)
GenderMale 0 0 0 0 0Female -.26
(.11)-.21(.11)
-.49(.12)
-.45(.13)
-.44(.13)
Ethnicity
15

White 0 0 0 0 0South Asian -.83
(.27)-.70(.17)
-.65(.29)
-.58(.29)
-.71(.30)
Other -.09(.17)
-.08(.17)
.27(.21)
.23(.22)
.20(.22)
SchoolComprehensive 0 0 0 0 0
Independent .17(.13)
.19(.13)
-.30(.15)
-.40(.15)
-.43(.16)
Grammar .15(.22)
.17(.22)
-.10(.24)
-.24(.24)
-.27(.24)
Other .20(.15)
.22(.15)
.09(.17)
.05(.17)
.05(.17)
GCSE measuresGCSE score 2.22
(.17)2.00(.17)
1.89(.18)
GCSE score squared .76(.25)
.65(.25)
.65(.25)
AS measures
Achieved AS grade A 0 0
Achieved AS grade lower than A -.93(.15)
-.80(.15)
Achieved AS grades not available -.30(.16)
-.20(.17)
Predicted AS grade A 0 0
Predicted AS gradelower than A -.29(.36)
-.17(.35)
Predicted AS grade predicted not available .21(.17)
.18(.17)
A2 measures etc
Predicted A2 grades A 0
Predicted A2 grades lower than A -.74(.23)
Predicted A2 grades not available 1.06(.44)
Achieved A2 grades A* 0
Achieved A2 grades lower than A* -1.27(.93)
Achieved A2 grades not available* -.44(.30)
Number of Advanced Extension Awards taken(0=base)
.53(.20)
DivisionHumanities 0 0 0 0Social Sciences -.25
(.15)-.28(.16)
-.26(.16)
-.26(.17)
Medicine Test Takers -.55(.23)
-1.03(.24)
-1.10(.25)
-1.07(.25)
Mathematics Test Takers .10(.21)
.04(.24)
-.01(.24)
-.00(.25)
Other(life, no math/med test taken)
.31(.14)
.34(.15)
.34(.16)
.39(.16)
Constant -.44(.12)
-.47(.15)
-.37(.16)
-.07(.23)
.34(.37)
16

Df 9 13 15 19 24
Chi 2 36.35 57.15 261.38 306.48 336.68N 1551 1551 1499 1499 1499
Notes: standard errors are given in parentheses*Some prequalification candidates had already taken one or more A2 examinations. We do not includein this analysis A2 grades that were obtained after the interviews.
The inclusion of GCSE scores in model 3 has had some important consequences for the otherparameters. Most notably, the parameter estimate associated with a working class background fallsfrom -0.49 to -0.23 (less than its standard error). In effect, then, the lower chances of working classcandidates gaining admission can be largely explained by their slightly less brilliant GCSE results.As we had expected, however, GCSE scores do not explain the South Asian disadvantage to anyappreciable extent.
There are also two more surprising findings in model 3. We find that both the parametersassociated with gender and with independent schools increase markedly in model 3. In otherwords, women with the same GCSE scores as men, and candidates from independent schools withthe same scores as those from state schools, have poorer chances of gaining admission. We considerpossible interpretations of these findings in the conclusions to this paper.
In model 4, candidates’ achieved and predicted attainments at AS examinations are added to themodel. This information was not available for all candidates since disclosure of AS grades isoptional. The terms in the model suggest that having achieved an AS grade or grades lower thanA poses a disadvantage in the admissions process, as does failure to disclose AS grades. Adding ASgrades to the model decreases the size of the GCSE parameter estimates slightly.
In model 5 we then add A2 predictions to the model. Some candidates had already taken one ormore A2 examinations despite formally counting as pre-qualification candidates. We thereforeinclude achieved A2 grades in the model. In addition, candidates can take ‘Advanced ExtensionAwards’, which are intended to give students the chance to engage in work that is above A2standard. The Advanced Extension Awards significantly increase the chances of gaining aconditional offer whereas predictions that A2 grades will be below A decrease the chances ofgaining a conditional offer.
While the inclusion of these additional measures of academic achievement and potential improvethe overall fit of the model, they do not materially affect the other parameters of interest. Thus, inthe absence of measures of interview performance or subject specific tests for the majority ofsubjects, GCSEs remain the single most important influence on chances of admission, and SouthAsians, women, and candidates from independent schools continue to show poorer net chances ofgaining acceptance than do white, male and state school candidates respectively.
17
So far we have been assuming that selection processes work in much the same way in the differentdivisions. However, as we have pointed out earlier, Medicine and Mathematics are distinct inhaving centralized tests that may well provide key evidence in making admissions decisions. Theavailability of these tests may give these two subjects more objective measures of potential than isavailable elsewhere and in that sense may make them fairer. The availability of these objectivemeasures may also enable these subjects to place less weight on GCSE grades.
In Table 5, therefore, we carry out separate analyses of the admissions process within each subjectgrouping. Because of the small numbers involved we do not include our additional measures suchas AS grades or A2 predictions but simply focus on GCSEs and the tests taken in Mathematics andMedicine. (We have however constructed a combined measure of all academic attainment andprediction measures and the results of this additional analysis are shown in the appendix 2.) Wetherefore show two models for the Mathematics and Medicine test takers. Model 1 shows the effectof background characteristics on the chances of gaining a conditional offer controlling only forGCSE attainment. In the second model, we also control for the score on the Mathematics andMedicine tests respectively.
18
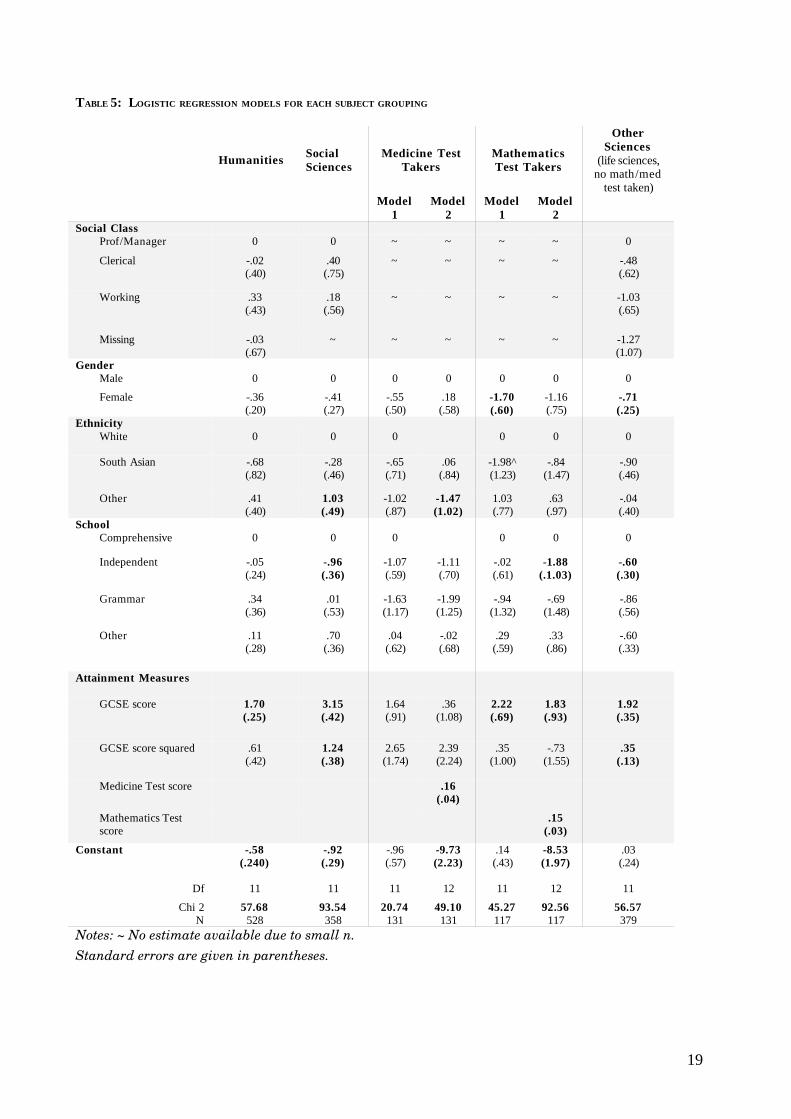
TABLE 5: LOGISTIC REGRESSION MODELS FOR EACH SUBJECT GROUPING
Humanities SocialSciences
Medicine TestTakers
MathematicsTest Takers
OtherSciences
(life sciences,no math/med
test taken)Model
1Model
2Model
1Model
2Social Class
Prof/Manager 0 0 ~ ~ ~ ~ 0
Clerical -.02(.40)
.40(.75)
~ ~ ~ ~ -.48(.62)
Working .33(.43)
.18(.56)
~ ~ ~ ~ -1.03(.65)
Missing -.03(.67)
~ ~ ~ ~ ~ -1.27(1.07)
GenderMale 0 0 0 0 0 0 0
Female -.36(.20)
-.41(.27)
-.55(.50)
.18(.58)
-1.70(.60)
-1.16(.75)
-.71(.25)
EthnicityWhite 0 0 0 0 0 0
South Asian -.68(.82)
-.28(.46)
-.65(.71)
.06(.84)
-1.98^(1.23)
-.84(1.47)
-.90(.46)
Other .41(.40)
1.03(.49)
-1.02(.87)
-1.47(1.02)
1.03(.77)
.63(.97)
-.04(.40)
SchoolComprehensive 0 0 0 0 0 0
Independent -.05(.24)
-.96(.36)
-1.07(.59)
-1.11(.70)
-.02(.61)
-1.88(.1.03)
-.60(.30)
Grammar .34(.36)
.01(.53)
-1.63(1.17)
-1.99(1.25)
-.94(1.32)
-.69(1.48)
-.86(.56)
Other .11(.28)
.70(.36)
.04(.62)
-.02(.68)
.29(.59)
.33(.86)
-.60(.33)
Attainment Measures
GCSE score 1.70(.25)
3.15(.42)
1.64(.91)
.36(1.08)
2.22(.69)
1.83(.93)
1.92(.35)
GCSE score squared .61(.42)
1.24(.38)
2.65(1.74)
2.39(2.24)
.35(1.00)
-.73(1.55)
.35(.13)
Medicine Test score .16(.04)
Mathematics Testscore
.15(.03)
Constant -.58(.240)
-.92(.29)
-.96(.57)
-9.73(2.23)
.14(.43)
-8.53(1.97)
.03(.24)
Df 11 11 11 12 11 12 11
Chi 2 57.68 93.54 20.74 49.10 45.27 92.56 56.57N 528 358 131 131 117 117 379
Notes: ~ No estimate available due to small n.Standard errors are given in parentheses.
19

Table 5 shows some striking findings. Firstly, we can see that the effects of GCSE scores aresomewhat different in the various subject groupings. For ease of interpretation the results areplotted in Figure 4.
FIGURE 4
Figure 4 shows that there is a rather weaker relationship between GCSE scores and the chances ofgaining a conditional offer among the Mathematics test takers and in the Humanities. It may wellbe that admissions tutors in Mathematics and the Humanities are less concerned with overall gradesas in the grades in specific subjects. The Social Sciences stand out in the very substantial premiumassociated with A* grades. This is an interesting observation as the Social Sciences Division(consisting of Law, Politics, Philosophy and Economics and Economics and Management) is theonly division which does not have specific subject requirements at A2-Level and, therefore, it isplausible that tutors in these subjects are most interested in overall achievement at GCSE level.
Returning to Table 5, we see that the Mathematics test and the Medicine test are both highlysignificant predictors of the chances of acceptance, and, in the case of Medicine, the test scoressupersede the linear effect of GCSEs. Most interestingly, we see that the inclusion of these two testslargely accounts for the disadvantage experienced by South Asian candidates in competing forplaces in these subjects. In the case of Medicine, the parameter estimate associated with SouthAsian ethnicity falls from -0.65 to 0.06 when we include the results of the Medicine test. And in thecase of Mathematics, the estimate falls from -1.98 to -0.84. We must be cautious in ourinterpretation of these results, since we are dealing with very small numbers of candidates, but the
Predicted Probabilities of Acceptance by GCSE average
0
10
20
30
40
50
60
70
80
90
100
B B A A A A * A *
GCSE average
Pre
dict
ed P
rob
abili
ty o
f A
ccep
tan
ce
Humanities
Social Sciences
Math Test
Medicine Test
Other
20
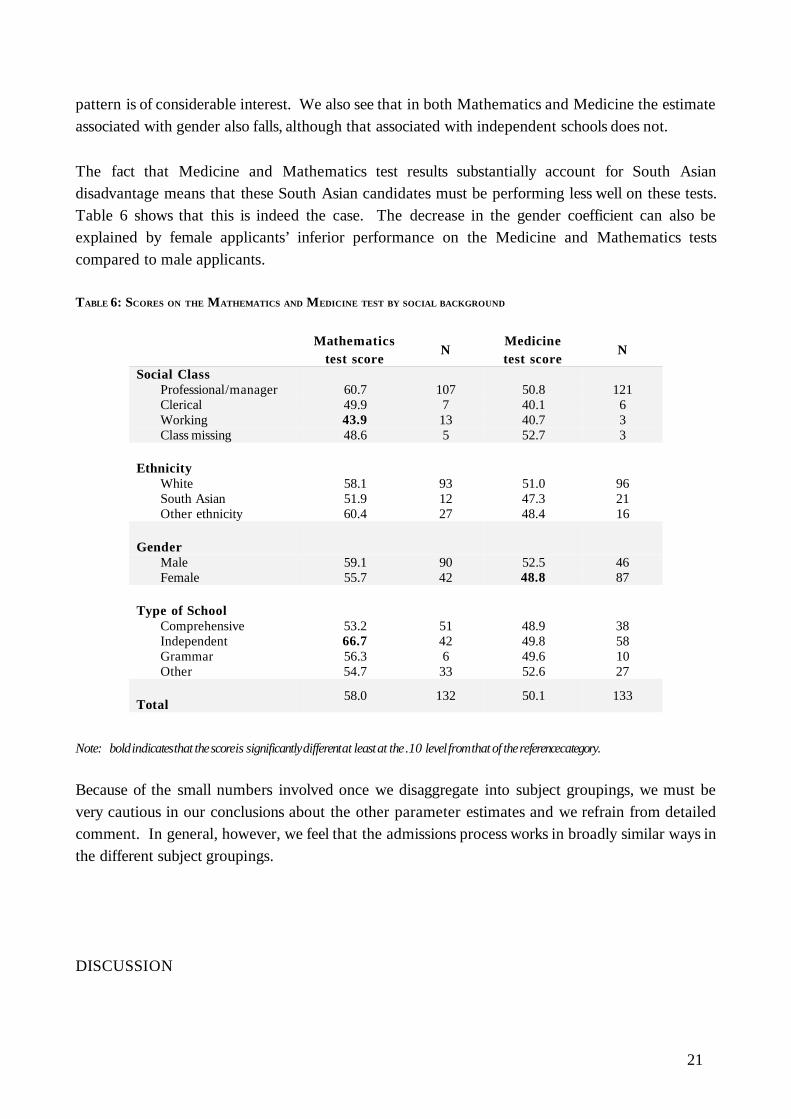
pattern is of considerable interest. We also see that in both Mathematics and Medicine the estimateassociated with gender also falls, although that associated with independent schools does not.
The fact that Medicine and Mathematics test results substantially account for South Asiandisadvantage means that these South Asian candidates must be performing less well on these tests.Table 6 shows that this is indeed the case. The decrease in the gender coefficient can also beexplained by female applicants’ inferior performance on the Medicine and Mathematics testscompared to male applicants.
TABLE 6: SCORES ON THE MATHEMATICS AND MEDICINE TEST BY SOCIAL BACKGROUND
Mathematicstest score
NMedicinetest score
N
Social ClassProfessional/manager 60.7 107 50.8 121Clerical 49.9 7 40.1 6Working 43.9 13 40.7 3Class missing 48.6 5 52.7 3
EthnicityWhite 58.1 93 51.0 96South Asian 51.9 12 47.3 21Other ethnicity 60.4 27 48.4 16
GenderMale 59.1 90 52.5 46Female 55.7 42 48.8 87
Type of SchoolComprehensive 53.2 51 48.9 38Independent 66.7 42 49.8 58Grammar 56.3 6 49.6 10Other 54.7 33 52.6 27
Total58.0 132 50.1 133
Note: bold indicates that the score is significantly different at least at the .10 level from that of the reference category.
Because of the small numbers involved once we disaggregate into subject groupings, we must bevery cautious in our conclusions about the other parameter estimates and we refrain from detailedcomment. In general, however, we feel that the admissions process works in broadly similar ways inthe different subject groupings.
DISCUSSION
21
We should begin the discussion by emphasizing the limitations of our study. In particular weshould remember the small sample sizes, especially when we disaggregate down to subjectgroupings, and the lack of measures based on written work and school reports and other measuresof potential (such as interviews) that tutors may be using.
Turning to the substantive results, we should emphasise just how important measures of academicattainment and predicted attainment are in securing admission to the University of Oxford. GCSEresults bear the strongest relationship with gaining a place, although results in the Mathematics andMedicine tests are also important and results at AS, the Advanced Extension Awards, and predictedgrades are not ignored. To a very large extent, then, admissions to the University of Oxford areindeed based on the kinds of criteria specified in the University’s own guidelines.
Furthermore, these measures of academic attainment and predicted attainment do appear toexplain the ‘gross’ disadvantages experienced by working class applicants and by South Asianapplicants applying for Medicine and Mathematics.
However, having said this, there are a number of points that deserve to be raised. First, our datasuggest that female applicants have lower chances of gaining a place compared to male applicantswith the same attainment at GCSE. Further analysis will take into account the subject choice atGCSE and break down the academic divisions further into individual subject areas to ensure thatthis finding is not driven by systematic differences in subject choice at GCSE or patterns ofapplication. The pattern of lower acceptance rates for female applicants when controlling forGCSEs does, however, raise important questions regarding meritocracy and gender in admissions.Second, we find a similar pattern with regards to applicants from independent schools. Althoughthe gross differences in acceptance between candidates educated at independent schools and theircomprehensive-school educated peers indicate higher chances of gaining an offer for independentschool applicants (.37 and .33 respectively), this pattern changes when attainment at GCSE is takeninto account. The predicted probabilities7 of acceptance are then .26 for applicants fromindependent schools and .33 for state comprehensive schools. In other words, given independentschool applicants’ superior performance at GCSE, an admissions system solely based on GCSEattainment would lead to an even higher acceptance rate for independent school applicants than weobserve in our data.
There is a wide variety of possible explanations for the net disadvantages observed for South Asian,female and independent-school applicants. Thus they could be explained by differences in thequality of submitted written work, performance in interviews and in subject-specific aptitude tests.7 The coefficients from a logistic regression and the means of predictor variables were used to calculate the predictedprobabilities of candidates from different types of school. In addition to controlling for type of school, the variablesgender and attainment at GCSE were included in the model.
22
The aptitude tests which have been included in this study lend support to this explanation: whenperformance in the Medicine and Mathematics tests is taken into account, the disadvantageexperienced by South Asian and female applicants is substantially reduced. However, this does notappear to account for the independent school disadvantage. One possibility here is that admissionstutors are consciously or unconsciously ‘discounting’ the grades of students at independent schoolbecause they believe that teaching at these schools improves the grades of their students but withoutlasting improvements in their academic performance. Research conducted by HEFCE did indeedsuggest that students from independent schools gained slightly poorer degree results than students atstate schools with similar grades at A level, although it was unclear whether this finding held true forstudents of the highest ability levels (HEFCE, 2003, p.21, see also: Naylor and Smith, 2002).
We cannot in our research discover exactly what tutors had in mind when making their decisions,but we do propose to follow up the students who participated in the study and see how they fare insubsequent university examinations. If tutors have been making appropriate discounts, then wewould expect to find that, among those actually admitted, there were no systematic differences inperformance at university examinations. However, if we found that the independent schoolcandidates who were admitted obtained better examination results than those from state schools,this would cast serious doubt on the hypothesis that tutors were making appropriate discounts.Moreover, if we found that the working-class students who were actually admitted obtained betterresults in university examinations than middle-class students, this would suggest that these workingclass candidates should be given a ‘premium’ during the admissions process.
To investigate whether ‘discounts’ or ‘premiums’ are appropriate for different groups of applicantswe need to follow-up the applicants and examine their performance in university examinations. Weshall make this our priority in the next stage of our research.
Clearly, there are a number of other potential explanations for the pattern of our findings. Forexample, it is not possible to rule out prejudice or stereotyping of particular groups of candidates.There might also be indirect discrimination; tutors, for example, may have a preference forteaching mixed groups, with a balance of male and female and ethnic minority students. In subjectswhere female or ethnic minority applicants apply in larger numbers, this may give male or whitecandidates an unintended advantage in the competition for places (Boliver, 2004).
Unfortunately, a survey such as ours cannot provide direct evidence about these possibleexplanations. We cannot definitively rule them in or out. The current report then, does not give usdefinite answers that provide a firm basis for policy but it does raise important questions that needto be resolved.
REFERENCES
Boliver, V. (2004) Admissions to the University of Oxford (forthcoming in the Oxford Review of Education).Available as a Department of Sociology working paper at
23
http:/ /www.sociology.ox.ac.uk/swps/2004-02.pdfCriteria for admissions in PPE: http:/ /www.economics.ox.ac.uk/Undergrad/Admissions/PPEadmissions_criteria.pdf
as viewed on 18.11.03Educational Policy and Standard Committee, Revised Learning and Teaching Strategy 2002 – 2005,
http:/ /www.admin.ox.ac.uk/epsc/guidance/learnteach.doc, published 2003.HEFCE (July 2003) Schooling effects on higher education achievement, Issues paper 32.Naylor, R and Smith, J (2002) Schooling effects on subsequent university performance: evidence for the UK university
population, Warwick Economic Research Papers.The Oxford Colleges Admissions Office (2002), Undergraduate Prospectus, 2003-2004, University of Oxford Public
Relations Office. University of Oxford, Admissions Statistics 2003 entry, Supplement 1 to the Oxford University Gazette, Vol 134
(December 2003).
FUNDINGThe Oxford Admissions Study was carried out by the Department of Sociology, University of Oxford, under thedirection of Professor Anthony Heath. The project was funded by the HEFCE sponsored Widening ParticipationInitiative through the University of Oxford Admissions’ Office.
24
APPENDIX 1
Measures and Coding Information
Ethnicity : in the questionnaire candidates were asked to complete the ethnic self-categorizationdeveloped by ONS for the 2001 Census. We have combined the Census categories of WhiteBritish, White Irish and White Other to form our category of White; we have combined thecategories of Asian or Asian British Indian and Asian or Asian British Pakistani, Asian or AsianBritish Bangladeshi and to form our category of South Asian. All remaining categories have beenassigned to our ‘Other ethnicity’ category. We have to combine the original Census categories intothese broader categories because of the small numbers in most of the original Census categories.Use of the original categories would run the risk of identifying individual applicants.
Social class background : in the questionnaire we used a self-completion measure of social classdeveloped by Anthony Heath and Jean Martin of the Office for National Statistics. For fulltechnical details see ww.statistics.gov.uk/methods. We have combined the categories TraditionalProfessional Occupations, Modern Professional Qualifications, Senior Managers or Administratorsand Middle or Junior Managers to form the category professional and managerial class. Thecategory Clerical and Intermediate occupations was maintained as a separate category. We havecombined the categories Technical and Craft Occupations and Semi-routine manual and serviceoccupations and Routine Manual and Service occupations to form the category working class andwe have combined the categories Don’t know and Not applicable to form the Class Missingcategory.
Region : the regional variable available through UCAS is a detailed breakdown of districts. For ameaningful analysis, these districts were first combined into counties and then combined as follows:Northern Ireland, Scotland and Wales were combined to form the Devolved Regions. The SouthEast, South West and London were combined to form the South region. The Midlands and theEast of England were categorised as Midlands and East. Yorkshire and Humber, the North Westand the North East were combined to form the region North. Non-United Kingdom applicantswere divided into continental European applicants based on the interview summoning list and therest of the world, that is those not summoned for interview (expect for Medicine). We found nosignificant differences in acceptance by region among the UK pre-A2-applicants. Future analysis,however, will look in more detail at the likelihood of being admitted among the continentalEuropean and applicants and at those from the rest of the world.
Type of school : the categorization of type of school is that used by UCAS and is derived from theinformation on the UCAS form. The following categories were created: Comprehensive school(Sixth Form Centre, Sixth Form College, Comprehensive School, City Technical College)Independent School (Independent School), Grammar School (Grammar School) and Other(Tertiary College, Further Education, Grant Maintained Secondary (State), Grant Maintained(Formerly Independent), Grant Maintained (Special Schools), Other Secondary School, Agricultureand Horticulture College, Art Design and Performing Arts).
Gender : information on applicants’ gender was derived from a self-completion question on theAdmissions Study survey.
Division : this variable was coded based on the stratification of the University of Oxford into fivedivisions namely the Humanities Division, the Life and Environmental Sciences Division, the
i
Mathematical and Physical Sciences Division, the Medical Sciences Division and the SocialSciences Division. For the purpose of the research, the classification of subjects in the HumanitiesDivision and the Social Sciences Division were not altered. The wish to include the centrallymarked subject-specific tests, however, meant that only those within the Medical Sciences Divisiontaking the Medicine test and only those in the Mathematical and Physical Sciences Division takingthe mathematics test are presented in the Medical Sciences Division and the Mathematical andPhysical Sciences Division respectively. Those in the Medical Division or Mathematical andPhysical Sciences Division not taking the centralised tests as well as the Life and EnvironmentalSciences Division were categorised as ‘Other’.
GCSE scores : were derived from the applicants’ UCAS forms section 7A ‘Qualificationscompleted or certificated’. In order to arrive at the measure used in the regression model, theGCSE scores were added up and divided by the number of subjects taken by the applicant. An A*was scored as eight points, an A as seven points, a grade B as six points and so forth. A grade Uscored zero points. The average GCSE measure had higher predictive power than using the totalGCSE score.
AS scores : were also derived from applicants’ UCAS forms section 7A ‘Qualifications completedor certificated’ and section 7B ‘Qualifications not yet completed or certified’. These sections of theUCAS form are completed by the candidate but verified by the applicants’ referee. It is someschools’ policy to advise candidates not to disclose their AS results and some candidates are stilltaking examinations at the AS rather than the A2 level in their second year of the Sixth Form. Itwas therefore decided to capture the complex AS information by categorising attainment into‘achieved an A average in all AS levels’, ‘achieved an average lower than A in all AS levels’,‘achieved attainment at AS level missing’. The same concept was applied to predicted AS levelswhich were categorised into ‘predicted to achieve an average of A in AS levels’, ‘predicted toachieve an average lower than A across all AS levels’ and ‘predicted achieved attainment at ASlevel missing’. The AS level grades were scored using the UCAS tariff calculator which givescandidates 60 points for a grade A, 50 points for a grade B, 40 points for a grade C and 30 pointsfor a grade D and 20 points for a grade E.
A2 scores : the predicted A2 scores of pre-A2-candidates were derived from the Reference Sectionof the UCAS application form. In all but a small minority of cases, the referees included theapplicants’ predicted attainment for all A2 subjects in the form. Again, the UCAS tariff calculatorwas used to convert achieved and predicted grades at A2 into numeric value: a grade A equals 120points, a grade B 100 points and so forth. When a candidate had a split prediction such as A/B, themean between the two numerical values was taken, in this case the prediction would be worth 110points.
Advanced Extension Awards: information regarding Advanced Extension Awards and theachieved or predicted outcome was collected from the UCAS application form section 7A and 7Band the personal reference. Due to the small number of applicants in our sample taking AdvancedExtension Awards, the Advanced Extension award variable in this research is merely a measure ofwhether or not the candidate is intending to take or has taken an Advanced Extension Award. Thevariable does not control for the grades achieved or predicted in the Advanced Extension Award
APPENDIX 2
ii

Regression Model: The influence of social background characteristics, an aggregated measure ofacademic attainment and predictions and the Mathematics and Medicine test on the likelihood ofgaining a conditional offer
Humanities
SocialSciences
Medicine Test Takers Mathematics Test TakersOther
(life, no math/medtest taken)
Social ClassProf/Manager 0 0 0 0 0 0 0Clerical -.03
(.44).49(.34)
~ ~ ~ ~ -.97(.49)
Working .28(.44)
.34(.58)
~ ~ ~ ~ -1.01(.72)
Missing -.15(.68)
~ ~ ~ ~ ~ -1.72(.87)
GenderMale 0 0 0 0 0 0 0Female -.35
(.21)-.35(.28)
-.63(.50)
.06(.58)
-1.93(.68)
-1.23(.78)
-.45(.26)
EthnicityWhite 0 0 0 0 0 0 0South Asian -.83
(.86)-.41(.50)
-.71(.70)
-.05(.82)
-2.30(1.30)
-.50(1.45)
-.45(.76)
Other .29(.41)
1.05(.46)
-.87(.84)
-1.45(.82)
1.50(.83)
1.02(1.03)
-.31(.46)
SchoolComprehensive 0 0 0 0 0 0 0
Independent -.13(.25)
-1.20(.37)
-1.11(.60)
-1.16(.71)
-.45(.66)
-1.94(1.00)
-.17(.30)
Grammar .22(.37)
-.42(.55)
-1.00(1.15)
-1.89(1.25)
-1.28(1.33)
-.76(1.47)
-.36(.50)
Other .11(.29)
.57(.37)
.01(.61)
-.04(.68)
.19(.63)
.78(.89)
-.72(.36)
Aggregate academic measure .78(.10)
1.48(.19)
.91(.31)
.58(.36)
1.34(.31)
1.21(.42)
1.16(.14)
Math Test .15(.03)
Medicine Test .16(.04)
Constant -.22(.25)
-.24(.30)
-.57(.55)
-9.43(2.24)
.65(.47)
-8.18(2.73)
.59(.24)
Df 10 10 10 11 10 11 10
Chi 2 77.75 113.85 21.35 49.92 56.86 96.85 111.34N 528 356 131 131 117 117 366
iii
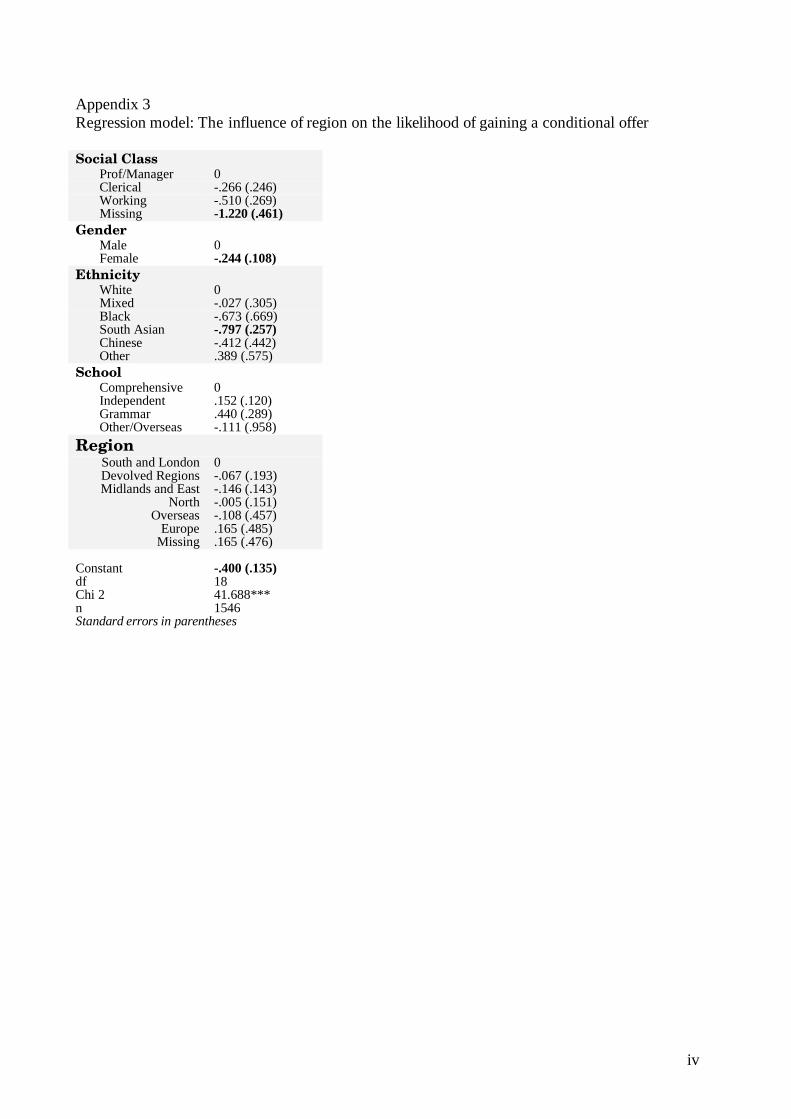
Appendix 3Regression model: The influence of region on the likelihood of gaining a conditional offer
Social ClassProf/Manager 0Clerical -.266 (.246)Working -.510 (.269)Missing -1.220 (.461)
GenderMale 0Female -.244 (.108)
EthnicityWhite 0Mixed -.027 (.305)Black -.673 (.669)South Asian -.797 (.257)Chinese -.412 (.442)Other .389 (.575)
SchoolComprehensive 0Independent .152 (.120)Grammar .440 (.289)Other/Overseas -.111 (.958)
RegionSouth and London 0Devolved Regions -.067 (.193)Midlands and East -.146 (.143)
North -.005 (.151)Overseas -.108 (.457)
Europe .165 (.485)Missing .165 (.476)
Constant -.400 (.135)df 18Chi 2 41.688***n 1546Standard errors in parentheses
iv

Appendix 4: Representativeness of Sample
Allcandidates foradmission
AllsummonedCandidates
Allcandidates at 11researchcolleges
Allsummonedcandidatesat theresearchcolleges
ResearchParticipants
Gender Female 50.1 49.9 51.3 50.5 55.4Type of School 1 Independent 36.0 37.5 36.2 37.7 38.1 Comprehensive 24.6 25.3 24.6 25.0 29.7 Grammar 5.3 5.5 5.1 5.2 6.4 Maintained 13.2 13.7 13.2 13.7 15.4 FE Colleges 4.4 4.1 4.0 3.7 4.0 Overseas 8.0 7.2 8.8 8.1 2.3 Other/Unknown 8.3 6.7 8.1 6.5 4.1
Division Medical Sciences 11.8 11.1 12.3 11.3 12.3 Life/ Environmental Sc. 8.8 9.5 8.0 8.8 8.5 Mathematical/Physical Sc. 19.8 20.8 20.4 21.8 18.3 Humanities 34.9 35.2 34.8 34.6 35.4 Social Sciences 24.6 23.4 24.4 23.4 24.9 Missing .6Offer decision Unconditional 3.7 4.0 3.6 4.0 3.8 Conditional 27.5 30.3 26.7 30.0 33.3 Reject 68.9 65.7 69.7 66.0 63.0
N 11890 10830 4082 3598 1929
v