Embed Size (px)
Citation preview
2008 年 5 月第 11 卷 2 期 • Vol. 11, No. 2, May 2008
Structural Change for the Impact of Tax Imputation on the Changes in Capital
Structure: Evidence from the Electronic Industries in Taiwan
Hosien-Hung Yeh
http://cmr.ba.ouhk.edu.hk

Web Journal of Chinese Management Review • Vol. 11 • No 2 1
Structural Change for the Impact of Tax Imputation on the Changes in Capital Structure: Evidence of the Electronic Industries in Taiwan
Hsien-Hung Yeh*
Abstract This paper applies the partial adjustment model to examine the structural change for the impact of the tax imputation in 1998 on the changes in capital structure of the listed firms in the electronic industries over the last four business cycles in Taiwan. Same as prior studies, this paper found some common determinants of capital structure such as firm size, profitability, non-debt tax shields and asset structure at the firm level. This paper also found structural changes between the periods before and after the tax imputation for the effects of firm size, growth opportunities and asset structure on the determination of capital structure. In addition, the speed of the actual changes in capital structure is slower and the gap between actual and optimal capital structure is greater during the sample years after tax imputation than those before tax imputation. This implies that firms in the electronic industries reserve more debt borrowing capacity due to the tax imputation. Moreover, macroeconomic conditions do not have an impact on the determination of capital structure. Besides, there is no structural change between the periods before and after the tax imputation for the impact of macroeconomic conditions in Taiwan. This paper found a decrease in actual capital structure but an increase in the changes in capital structure after the tax imputation. As a whole, this paper shows further evidence on the determination and determinants of capital structure and, in addition, provides new evidence on the adjustment speed of the changes in capital structure.
Key words: Tax Imputation, Macroeconomic Conditions, Capital Structure, Structural Change, Partial Adjustment Model
Hsien-Hung Yeh, Lecturer of Department of Business Administration, National Pingtung
University of Science and Technology, Taiwan and PhD candidate of Department of Accounting,
Finance and Economics, Griffith Business School, Griffith University, Australia.
Web Journal of Chinese Management Review • Vol. 11 • No 2 2
Introduction After the work of Modigliani and Miller (1958; 1963), most of the prior studies on the choice of capital structure focused on the effects of the factors at firm and industry levels. Rarely the prior studies included macroeconomic conditions in the determination of capital structure except Ferri and Jones (1979), Yeh (2002; 2003) and Korajczyk and Levy (2003). Ferri and Jones (1979) found that capital structure does not appear stable across the periods of economic recession and expansion. In Taiwanese empirical studies, Yeh (2002; 2003) used the ratio of the changes in short-term and long-term debts to total equity to examine the determination of capital structure over the eighth and ninth business cycles. He found variation in the determinants of capital structure across the periods of economic contraction and expansion. Korajczyk and Levy (2003) found that corporate leverage is counter-cyclical for the unconstrained firms.
On the other hand, Flannery and Rangan (2006) applied the partial adjustment model to investigate the adjustment toward target capital structure and found that the speed of adjustment remained constant over time. However, their model for the determination of target or optimal capital structure is not properly specified. They assumed that optimal capital structure is determined only by the factors at firm level without inclusion of macroeconomic conditions in their model. In addition, their research period of their study ranged from 1965 to 2001 including the periods before and after the tax reform in 1981. Pilotte (1990) found that the Economic Recovery Tax Act of 1981 affected firms’ non-debt tax shields through the modifications to the investment tax credit and an extension of the net operation loss carryover time period. Firms financed less debt after the Economic Recovery Tax of 1981. The misspecification might affect the results of their research.
Further, in order to avoid the double taxation on corporate dividends, Taiwan government has imposed 10% tax imputation to corporate retained earnings since January 1, 1998. Due to the tax reform in Taiwan, some taxation benefits such as five-year free taxation and investment tax credit that were commonly beneficiary to the firms in the electronic industries were annulled. Besides, most of firms in the electronic industries commonly reserved their earnings as one of funding sources for future investment. We could expect that the tax imputation to corporate retained earnings will affect the funding sources of the firms and the changes in their capital structure as well. Several Taiwanese empirical studies (Huang 2001; Hung 2006) addressed the impact on the determination of capital structure. However, no study applies the partial adjustment model to examine the impact of tax imputation on the changes in capital structure and the structural change between before and after the tax imputation for the determination of capital structure.

Web Journal of Chinese Management Review • Vol. 11 • No 2 3
Controlling for the industry effect, this paper addressed the issue by focusing on the electronic industries in Taiwan. In addition, this paper includes consideration of macroeconomic conditions on the determination of the changes in capital structure by selecting the years of economic trough and peak over the seventh to tenth business cycles ranging from 1988 to 2001 in Taiwan. This paper continues the direction of prior research but applies the partial adjustment model in a rather different way to investigate the following issues: How are the changes in capital structure is determined? Do the changes in capital structure vary with macroeconomic conditions across the periods before and after the tax imputation and does the impact of macroeconomic conditions on the changes in capital structure vary across the periods before and after the tax imputation? Further, does the speed of the changes in capital structure vary across the periods before and after the tax imputation?
The rest of this paper is organized as follows. Literature review and research hypotheses are discussed in the next section. Empirical methodology and sample data are described in Section Three and empirical results are presented in Section Four. At last, the final section draws conclusions and suggestions.
Literature Review and Research Hypotheses After the fundamental work of Modigliani and Miller (1958) on the determination of capital structure, much research addressed the issue and also concluded some common determinants of capital structure (Harris & Raviv 1991). Most of prior studies examined the determinants of capital structure at the firm and industry levels but they rarely included macroeconomic conditions except Ferri and Jones (1979) and Yeh (2002; 2003). Major prior studies are reviewed and the related research hypotheses are formulated in the following.
Firm-level Factors of Capital Structure
The common determinants at the firm level on the determination of capital structure found in prior studies are discussed as follows.
Firm Size
Warner (1977) found that the ratio of bankruptcy costs to the market value of railroad firms appears to decline as their firm value or size increases. Ang et al. (1982) found that administrative costs of corporate bankruptcy is negatively related to the liquidating values of a firm. Castanias (1983) also found negative relation between total assets i.e. firm size and failure rates. In addition, several empirical studies (Marsh 1982; Rajan & Zingales 1995; Wald 1999; Booth 2001) found positive relationship between capital structure and firm size. Based on the findings in these prior studies, we expect that capital structure will be positively related to firm size. The first research hypothesis is formulated as follows.

Web Journal of Chinese Management Review • Vol. 11 • No 2 4
H1-1: The changes in capital structure will be positively related to firm size.
Growth Opportunities
According to the agency theory of capital structure, if a firm with limited growth opportunity finances risky investments with a new issue of debt, then the existing debt holders bear more risk than they did before the new issue of debt was issued. In such a case, firms can finance with more debt to expropriate the wealth from debt-holders to stockholders due to the conflicts of interest between stockholders and debt-holders. Consequently, capital structure is negatively related to future growth opportunities based on the agency theory of capital structure. Kim and Sorensen (1986) and Rajan and Zingales (1995) found that capital structure is negatively related to growth opportunities. In a Taiwanese empirical research study, Chu et al. (1992) also found a positive relationship between total debt ratios and growth opportunities. However, Kester (1986) found a positive relationship between capital structure and growth opportunities. Based on the agency theory of capital structure, the hypothesis is formulated as follows.
H1-2: The changes in capital structure will be negatively related to growth opportunities.
Profitability
The pecking order theory of financing (Myers & Majluf, 1984) contends that firms tend to use up their internal funds first to finance their investment opportunities and then turn to external capital financing. Their argument implies that the more the profits that a firm earns, the less likely a firm will exhaust its internal funds and finance with external capital. Consequently, other things being equal, the more profits firms can earn, the more funds firms can reserve more earnings as internal funds that can be used to finance their investment or to repay outstanding debts due to lack of investment opportunities. Evidence provided by several empirical studies such as Friend and Lang (1988), Kester (1986) and Titman and Wessels (1988) supports the conclusion of the pecking order theory. In a Taiwanese empirical study, Chu et al. (1992) also found a negative relationship between profitability and capital structure of the listed firms in Taiwan. Based on the pecking order theory of debt financing, capital structure will be negatively related to profitability and the hypothesis is formulated as follows.
H1-3: The changes in capital structure will be negatively related to profitability.
Non-Debt Tax Shields
DeAngelo and Masulis (1980) concluded that non-debt tax shields can be as a substitute for the tax deductibility of debt financing with the existence of corporate and personal income tax. Consequently, other things being equal, the more the non-debt tax shields, the less the benefit of tax deductibility of the debt used by a firm. Several prior studies such as Downs (1993), Chu et al. (1992), Chaplinsky and Niehaus (1993), Wald (1999)

Web Journal of Chinese Management Review • Vol. 11 • No 2 5
and Yeh (2002) shows the crowding-out effect of non-debt tax shields on debt financing. However, Bradley et al. (1984) found a positive relationship between long-term debt ratios and non-debt tax shields. Suggested by DeAngelo and Masulis (1980), it is expected to be a negative relationship between corporate debt financing and non-debt tax shields. The related hypothesis is formulated as follows.
H1-4: The changes in capital structure will be negatively related to non-debt tax shields.
Collateral Value of Asset Structure
Jensen and Meckling (1976) argue that firms can finance with more debt and expropriate the wealth from debt-holders to stockholders. If firms can provide debt-holders with high collateral values of assets, firms can finance with more debt from debt-holders. Several previous studies have confirmed the positive relationship between capital structure and collateral value of asset structure (Marsh 1982; Friend & Lang 1988; Rajan & Zingales 1995; Wald 1999). Based on the above discussion, it is expected to be a positive relationship between capital structure and the collateral value of asset structure and the research hypothesis is formulated as follows.
H1-5: The changes in capital structure will be positively related to collateral value of asset structure.
Earning Volatility
According to the trade-off theory of capital structure, firms trade off the benefits of debt financing against the bankruptcy costs and should use less debt due to high bankruptcy costs. Firms whose earnings are more volatile face greater probability of bankruptcy and tend to lose debt benefits and should finance less debt. Further, Bradley et al. (1984) suggest that capital structure is negatively related to earning volatility if the costs of financial distress are not-trivial. Based on the above discussion, we expect that capital structure will be negatively related to earning volatility and the hypothesis is formulated as follows.
H1-6: The changes in capital structure will be negatively related to earning volatility.
Macroeconomic Conditions and Capital Structure
The agency theory of capital structure contends that firms tend to finance more debt due to the limited growth opportunities. This implies that firms with limited growth opportunity in the future tend to finance with more debt during the periods of economic expansion, particularly at economic peak, and vice versa. Therefore, based on the agency model, we may expect that the changes in the debt level of firms are positively related to macroeconomic conditions in terms of future investment opportunities.
Web Journal of Chinese Management Review • Vol. 11 • No 2 6
Ferri and Jones (1979) found that capital structure of firms does not appear stable in different macroeconomic conditions but they did not provide clear-cut evidence on the impact of macroeconomic conditions on capital structure. In addition, in Taiwanese empirical studies, Yeh (2002; 2003) found variation in the determinants of capital structure over the business cycles, which supports the finding of Ferri and Jones (1979). Moreover, Korajczyk and Levy (2003) found that corporate leverage is lower during the periods of economic expansion and higher during the periods of economic contraction for the unconstrained firms. Their finding does not support the agency theory of capital structure.
Based on the agency theory of capital structure discussed above, the research hypothesis is formulated as follows.
H2: The changes in capital structure will be positively related to macroeconomic conditions.
The Impact of Tax Imputation on Retained Earnings
Since January 1, 1998, the Taiwan government integrated corporate and individual income tax systems together and imposed a 10% tax imputation to corporate retained earnings of firms in order to avoid double taxation and stimulate more investments in this country. However, the 10% tax imputation would reduce the amount of internal funds available for future investment opportunities because the listed firms in the electronic industries in Taiwan usually reserve their retained earnings for corporate investment.
Several studies examined the impact of tax imputation on the capital structure of the listed firms in Taiwan. Huang et al. (2001) extended the dynamic capital structure model to investigate the effect of implementation of tax imputation on firm value, dividend policy and capital structure and found debt ratios decreases in the electronic industries after the tax imputation. Hung et al. (2006) followed the methods of Watson and Wilson (2002) as well as Claggett (1991) to investigate the financing behavior of high-tech and traditional industries in Taiwan and found that neither industries follow the pecking order theory of capital structure after the tax imputation. This paper investigates the impact of the tax imputation in a different way by applying the partial adjustment model to examine the determination of capital structure across the periods before and after the tax imputation.
According to the pecking order theory, firms tend to finance their investment with internal retained earnings first, and then the external debt and finally as a last resort, with equity capital. Therefore, the negative impact of tax imputation would reduce the amount of internal funds available for investment opportunities and firms tend to finance more debt according to the pecking order theory of financing. Based on the above discussion, the related hypothesis is formulated as follows.

Web Journal of Chinese Management Review • Vol. 11 • No 2 7
H3: Other things being equal, firms will finance more debt than equity after the tax imputation than before the tax imputation in 1998.
Empirical Methodology
Theoretical Framework and Empirical Model
The partial adjustment model of Econometrics assumes that there is an optimal or desired level of capital structure under the given state of economic conditions, taxation system, etc. The partial adjustment model permits partial adjustment of debt financing decisions of firms toward their optimal or long-run capital structure over time. Actual capital structure of a firm can deviate from its optimal level. Consequently, the actual change in capital structure in any given time period t is some fraction γ of the desired
change for that period, i.e. the difference between optimal and previous capital structure. Typically, γ is expected to lie between 0 and 1 because the adjustment toward the
desired capital structure is likely to be incomplete (Gujarati 2003).
Suggested by Flannery and Rangan (2006), regression specification used to test corporate tradeoff financing must permit their optimal capital structure to vary over time and, in addition, the deviations of actual capital structure from optimal capital structure are not necessarily offset immediately. The partial adjustment model meets these requirements and, consequently, this paper applies the model to examine the changes in capital structure of the listed firms in the electronic industries of Taiwan. Besides, suggested by prior studies (Ferri & Jones 1979; Yeh 2002; Yeh 2003), this paper incorporates macroeconomic conditions into the partial adjustment model to investigate the changes in capital structure and the structural change in the periods before and after the implementation of tax imputation since January 1, 1998 in Taiwan. The equation for the actual change in capital structure according to the partial adjustment model is written as follows.
ititittitit YYYY εγ +−=− −− )( 1*
1 )1(
Where,
Yit*: the desired or optimal capital structure of firm i at time period t,
itY : the actual capital structure of firm i at time period t,
1−itY : the previous actual capital structure of firm i at time period t,
γ : the proportion of the difference between optimal capital structure and previous
actual capital structure, i.e. the adjustment speed,
itε : error term.
Web Journal of Chinese Management Review • Vol. 11 • No 2 8
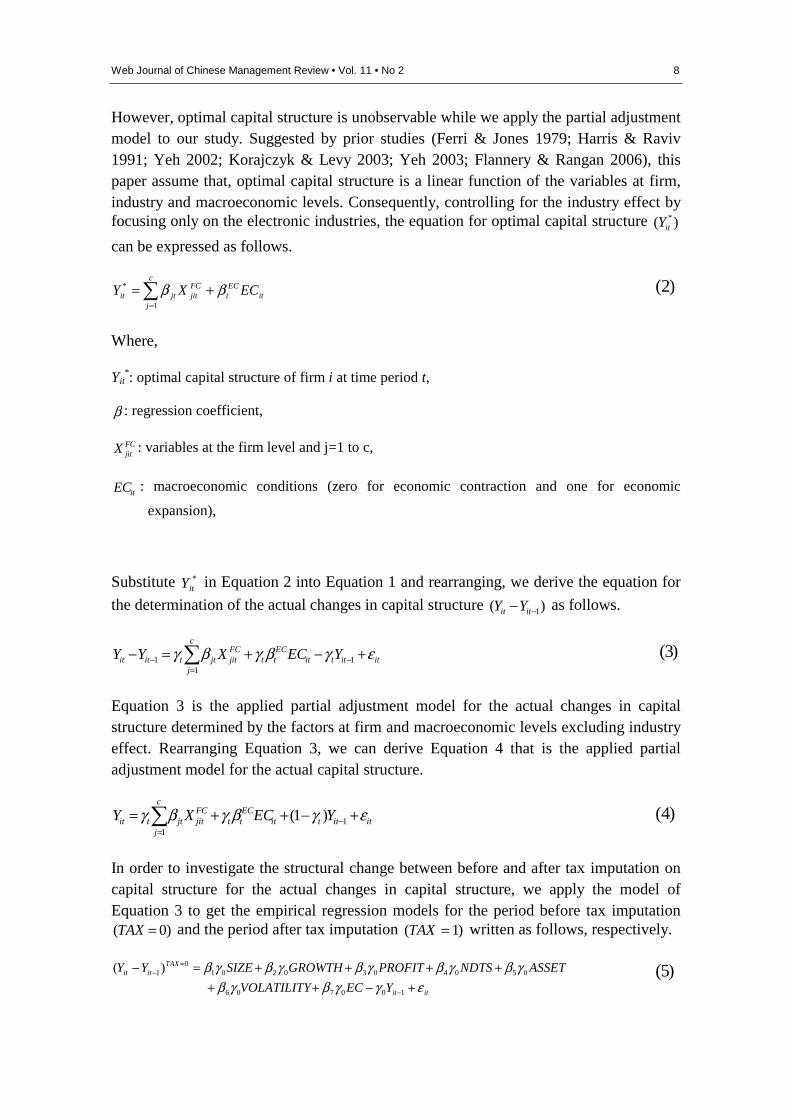
However, optimal capital structure is unobservable while we apply the partial adjustment model to our study. Suggested by prior studies (Ferri & Jones 1979; Harris & Raviv 1991; Yeh 2002; Korajczyk & Levy 2003; Yeh 2003; Flannery & Rangan 2006), this paper assume that, optimal capital structure is a linear function of the variables at firm, industry and macroeconomic levels. Consequently, controlling for the industry effect by focusing only on the electronic industries, the equation for optimal capital structure )( *
itY
can be expressed as follows.
itEC
t
c
j
FCjitjtit ECXY ββ +=∑
=1
* )2(
Where,
Yit*: optimal capital structure of firm i at time period t,
β : regression coefficient,
FCjitX : variables at the firm level and j=1 to c,
itEC : macroeconomic conditions (zero for economic contraction and one for economic
expansion),
Substitute *itY in Equation 2 into Equation 1 and rearranging, we derive the equation for
the determination of the actual changes in capital structure )( 1−− itit YY as follows.
itittitECtt
c
j
FCjitjttitit YECXYY εγβγβγ +−+=− −
=− ∑ 1
11
)3(
Equation 3 is the applied partial adjustment model for the actual changes in capital structure determined by the factors at firm and macroeconomic levels excluding industry effect. Rearranging Equation 3, we can derive Equation 4 that is the applied partial adjustment model for the actual capital structure.
itittitECtt
c
j
FCjitjttit YECXY εγβγβγ +−++= −
=∑ 1
1
)1( )4(
In order to investigate the structural change between before and after tax imputation on capital structure for the actual changes in capital structure, we apply the model of Equation 3 to get the empirical regression models for the period before tax imputation
)0( =TAX and the period after tax imputation )1( =TAX written as follows, respectively.
itit
TAXitit
YECVOLATILITY
ASSETNDTSPROFITGROWTHSIZEYY
εγγβγβγβγβγβγβγβ
+−++++++=−
−
=−
100706
05040302010
1
)( )5(

Web Journal of Chinese Management Review • Vol. 11 • No 2 9
itit
TAXitit
YECVOLATILITY
ASSETNDTSPROFITGROWTHSIZEYY
εγγβγβγβγβγβγβγβ
+−++++++=−
−
=−
111716
15141312111
1
)( )6(
Where
SIZE= firm size, GROWTH= growth opportunities, PROFIT= profitability, NDTS= non-debt tax shields, ASSET= asset structure, VOLATILITY= earning volatility, EC= macroeconomic conditions and 1−itY = previous total debt ratio.
Note that evidence by Flannery and Rangan (2006) shows that the speed of adjustment toward optimal capital structure remains constant over time. Suggested by their conclusion, the regression coefficient on previous total debt ratios in Equations 5 and 6 would be equal, i.e. 10 γγ = . Therefore, we uses dummy variable )(TAX to combine the
above two equations together in order to investigate the structural change between the periods before and after tax imputation for the adjustment speed. The combined empirical regression model is written as follows.
itit
it
itit
Y
ECVOLATILITYASSETNDTSPROFIT
GROWTHSIZETAXYECVOLATILITY
ASSETNDTSPROFITGROWTHSIZEYY
εγγβγβγβγβγβ
γβγβγγβγβγβγβγβγβγβ
+−+++++
+×+−++++++=−
−
−
−
)
()
(
1
1413121110
98176
543211
)7(
Then we can rearrange Equation 7 to derive the empirical models for the actual changes in capital structure and the actual capital structure as follows, respectively. Note that the regression coefficient of financial flexibility in Equation 9 is equal to 1 plus the regression coefficient of financial flexibility in Equation 8.
ititit
itit
TAXYY
TAXECTAXVOLATILITYTAXASSETTAXNDTS
TAXPROFITTAXGROWTHTAXSIZEEC
VOLATILITYASSETNDTSPROFITGROWTHSIZEYY
εγγγβγβγβγβ
γβγβγβγβγβγβγβγβγβγβ
+×−−×+×+×+×+
×+×+×+++++++=−
−−
−
11
14131211
10987
6543211
)8(
ititit
it
TAXYY
TAXECTAXVOLATILITYTAXASSETTAXNDTS
TAXPROFITTAXGROWTHTAXSIZEEC
VOLATILITYASSETNDTSPROFITGROWTHSIZEY
εγγγβγβγβγβ
γβγβγβγβγβγβγβγβγβγβ
+×−−+×+×+×+×+
×+×+×+++++++=
−− 11
14131211
10987
654321
)(1
)9(
However, we have to test the equality of variance of residuals between the two periods before combining these two regression models together to examine the structural change. If variance of residuals were not equal between the periods, we could use the mean of the sum of squared errors in each model to transform the dependent and independent variables to solve the problem of variance inequality. Furthermore, we can use the Chow test to examine the structural changes between the models.

Web Journal of Chinese Management Review • Vol. 11 • No 2 10
Research Period and Sample Data
We collected the data from the listed firms in the financial data bank of the Taiwan Economic Journal and constructed the research sample by selecting the years of 1988, 1989, 1994, 1995 1997, 1999 and 2001 to represent the economic contraction and expansion over the latest four business cycles in Taiwan.1 The periods at the peak and trough over the business cycles are defined as economic expansion and contraction, respectively, according to the reference dates in the Business Indicators published by the Council for Economic Planning and Development of Executive Yuan of Taiwan. Consequently, the years of 1988, 1994, 1997 and 1999 closest to the reference dates of peak and the years of 1989, 1995 and 2001 closest to the reference dates of trough represent the periods of economic expansion and contraction, respectively.
Further, controlling for the industry effect, we address the issue in question only in the electronic industries due to their important role-playing on the trade volume of the Taiwan Stock Exchange in the capital market of Taiwan. Therefore, our research sample includes all of the firms in the electronic industries that are listed on the Taiwan Stock Exchange and has sufficient and complete data over the research period.
Variables and Their Measures
The dependent variable of corporate capital structure and the explanatory variables at the firm and macroeconomic levels are calculated at book value. In addition, we have used product items of the explanatory variables to measure the interaction variables. Further, the dummy variable of tax imputation )(TAX is used in the empirical model for testing
structural changes between the periods before and after the tax imputation in 1998 for the actual changes in capital structure.
The Changes in Capital Structure
Total debt ratios are measured as a proxy for corporate capital structure. Besides, we use the difference between the current and previous debt ratios to measure the actual changes in capital structure. The variables for the factors at firm and macroeconomic levels, corporate financial flexibility and the cross-level interactions are described as follows.
1 Following a Taiwanese study by Hung, J.H., Kuo, Y.P., & Hsiao, W.H. (2006), "Tax
imputation effect on capital structure: A comparison between high-tech and traditional
industries." Fu-Jen Management Review, 13(2), 29-56., this paper excludes 1998 as it is the
first year in which the 10% tax imputation to corporate retained earnings was installed.

Web Journal of Chinese Management Review • Vol. 11 • No 2 11
The Variables at Firm Level
Suggested by prior studies (Harris & Raviv 1991), the major variables at the firm level are firm size, growth opportunity, profitability, non-debt tax shield, asset structure and earning volatility. This paper uses the natural logarithm of net sales as a proxy for firm size. The total capital expenditure over total assets is used as the proxy for growth opportunity. This paper uses the proportion of net operating income of total assets as the proxy for profitability in order to avoid the disturbance of non-operating income. The ratio of depreciation to total assets is measured as a proxy for non-debt tax shields. This paper uses the ratio of inventory plus gross fixed asset to total assets as a proxy for collateral value of asset structure. Furthermore, this paper uses the standard deviation of the proportion of net operating income of total assets over the preceding five years as a proxy for earning volatility.
Macroeconomic Conditions
Suggested by Ferri and Jones (1979) and following Yeh (2002; 2003) of his Taiwanese empirical studies, this paper uses the dummy variable as a proxy for macroeconomic conditions to examine its impact on the actual changes in capital structure.
Empirical Results and Analysis
Data Analysis
The sample in this study includes 822 observations of the firms in the electronic industries that are listed on the Taiwan Stock Exchange and have complete and sufficient data over the last four business cycles from 1988 to 2001. However, the firms that experienced their financial distress or trade suspension on the Taiwan Stock Exchange are excluded. Besides, this paper selects the years of 1988, 1994, 1997 and 1999 closest to the reference dates of peak to represent the periods of economic expansion and the years of 1989, 1995 and 2001 closest to the reference dates of trough to represent the periods of economic contraction. The total debt ratios of the sample firms are less than 0.87 shown in Table 1, which indicates that no firms are in financial distress.
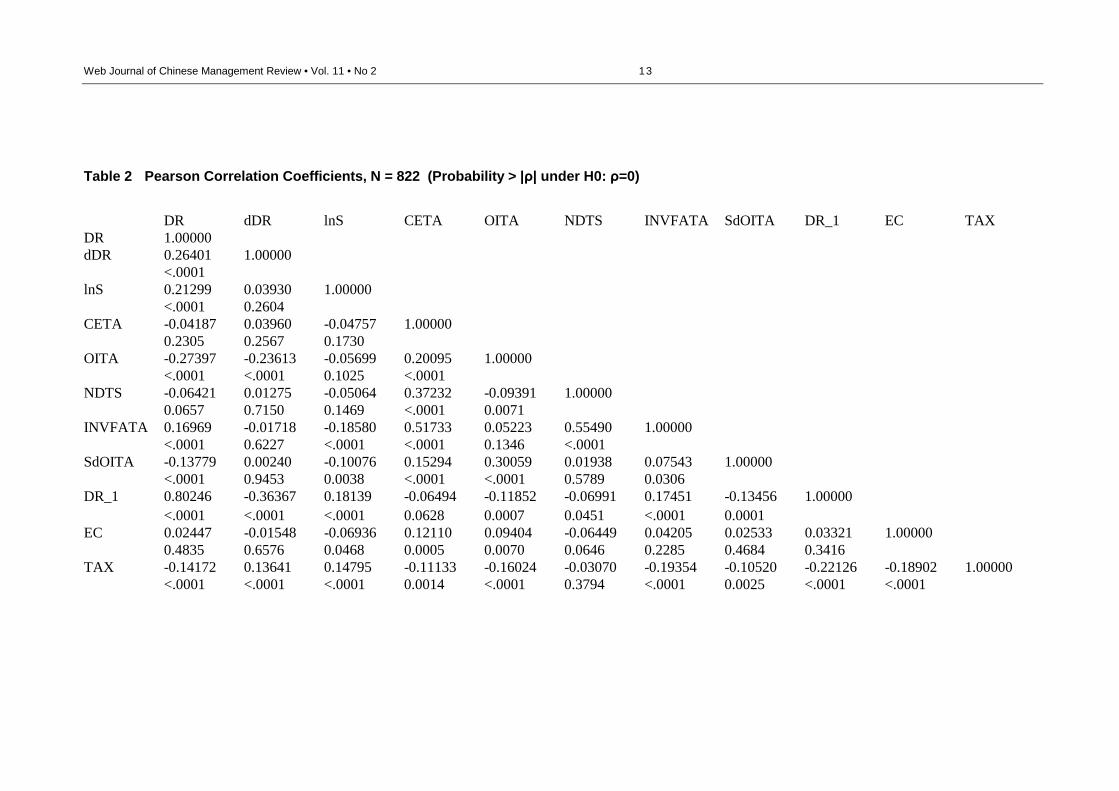
The results of correlation analysis shown in Table 2 indicate that total debt ratios are significantly related to the variables at the firm level and the dummy variable of tax imputation, with the exception of CETA, the proxy for growth opportunities. However, we found that CETA is a better proxy for growth opportunities than annual growth rates of net sales or total assets commonly used by prior studies. Besides, some of the correlation coefficients shown in Table 2 are significantly greater than 0.5 at the significance level of 0.01 such as the correlation between CETA and INVFATA, and the correlation between NDTS and INVFATA. Suggested by Cronbach (1987), this paper applies the ‘centering’ technique to avoid multicollinearity problem in the regression analysis.

Web Journal of Chinese Management Review • Vol. 11 • No 2 12
Table 1 Summary Results of Descriptive Statistics
Variable Observations Mean Std Dev Minimum Maximum
DR 822 0.39895 0.14977 0.04948 0.86696
dDR 822 -0.01302 0.09594 -0.31492 0.29460
lnS 822 14.95772 1.28634 12.16390 19.02057
CETA 822 0.06856 0.07816 -0.16758 0.58814
OITA 822 0.07717 0.07812 -0.24306 0.49391
NDTS 822 0.02622 0.02332 0.00162 0.20549
INVFATA 822 0.39818 0.17271 0.04854 0.89405
SdOITA 822 0.05256 0.04534 0.00385 0.43914
DR_1 822 0.41197 0.15508 0.05122 0.96655
EC 822 0.57299 0.49494 0 1.00000
TAX 822 0.52311 0.49977 0 1.00000 Notes: DR: total debt ratios = total debts/total assets.
dDR: the changes in capital structure = DRt-DRt-1.
lnS: SIZE = natural logarithm of net sales.
CETA: GROWTH = total capital expenditures / total assets.
OITA: PROFIT = net operating income/total assets.
NDTS: NDTS = depreciation/total assets.
INVFATA: ASSET = inventory plus fixed assets/total assets.
SdOITA: VOLATILITY = standard deviation of OITA over proceeding five years.
DR_1: previous total debt ratios.
EC: dummy variable for macroeconomic conditions.
TAX: dummy variable for the periods before and after the tax imputation in 1998.
Web Journal of Chinese Management Review • Vol. 11 • No 2 13
Table 2 Pearson Correlation Coefficients, N = 822 (Probability > |ρ| under H0: ρ=0)
DR dDR lnS CETA OITA NDTS INVFATA SdOITA DR_1 EC TAX DR 1.00000 dDR 0.26401 1.00000 <.0001 lnS 0.21299 0.03930 1.00000 <.0001 0.2604 CETA -0.04187 0.03960 -0.04757 1.00000 0.2305 0.2567 0.1730 OITA -0.27397 -0.23613 -0.05699 0.20095 1.00000 <.0001 <.0001 0.1025 <.0001 NDTS -0.06421 0.01275 -0.05064 0.37232 -0.09391 1.00000 0.0657 0.7150 0.1469 <.0001 0.0071 INVFATA 0.16969 -0.01718 -0.18580 0.51733 0.05223 0.55490 1.00000 <.0001 0.6227 <.0001 <.0001 0.1346 <.0001 SdOITA -0.13779 0.00240 -0.10076 0.15294 0.30059 0.01938 0.07543 1.00000 <.0001 0.9453 0.0038 <.0001 <.0001 0.5789 0.0306 DR_1 0.80246 -0.36367 0.18139 -0.06494 -0.11852 -0.06991 0.17451 -0.13456 1.00000 <.0001 <.0001 <.0001 0.0628 0.0007 0.0451 <.0001 0.0001 EC 0.02447 -0.01548 -0.06936 0.12110 0.09404 -0.06449 0.04205 0.02533 0.03321 1.00000 0.4835 0.6576 0.0468 0.0005 0.0070 0.0646 0.2285 0.4684 0.3416 TAX -0.14172 0.13641 0.14795 -0.11133 -0.16024 -0.03070 -0.19354 -0.10520 -0.22126 -0.18902 1.00000 <.0001 <.0001 <.0001 0.0014 <.0001 0.3794 <.0001 0.0025 <.0001 <.0001

Web Journal of Chinese Management Review • Vol. 11 • No 2 14
Note that the correlations both between macroeconomic conditions and the actual capital structure and between macroeconomic conditions and the changes in capital structure are not statistically significant. Besides, the coefficient of the correlation between total debt ratios and the dummy variable of tax imputation is significantly negative and, on the other hand, the coefficient of the correlation between the changes in capital structure and the dummy variable of tax imputation is significantly positive. This implies that firms finance more debt than equity to meet their financial needs while the total debt ratios of firms in the electronic industries after the tax imputation in 1998. The finding is not consistent with the conclusion of Hung et al. (2006).
Regression Results
Before running a regression analysis for the combined regression model, we ran a regression analysis of each regression model first in order to examine the equality of residual variance between the two regression models for the periods before and after the tax imputation. The F value of the variance equality test for these two regression models is 1.141 greater than 1 at significance level of 0.01. Therefore, we transformed the variables with the mean of the sum of the squared errors in each regression model to eliminate the problem of variance inequality. Subsequently, we ran regression analysis for the combined regression model after assuring the variance equality of the two regression models. The regression results of the combined regression models for the actual capital structure and the actual changes in capital structure are presented in Tables 3 and 4, respectively.
The results shown in Tables 3 and 4 are nearly same, with the exception of regression coefficient on the previous total debt ratios, i.e. DR_1. The regression coefficient on previous total debt ratios in Table 3 is equal to 1 plus the regression coefficient on previous total debt ratios in Table 4. Therefore, regression results for the actual capital structure in Table 3 are discussed only as follows.
First, as shown in Table 3, the actual capital structure is, as expected, significantly related to the factors at the firm level such as firm size, profitability, non-debt tax shields and asset structure. In addition, some of the product items of the factors at the firm level and the dummy variable of tax imputation are significantly related to the actual capital structure. This indicates that there is structural change between the periods before and after the tax imputation for the impact of some factors at the firm level on capital structure such as firm size, growth opportunities and asset structure. It is interesting to note that the regression coefficients on the structural change across the periods before and after the tax imputation for the impacts of firm size and asset structure, i.e. lnSxTAX and INVFATAxTAX, are negative rather than positive, which results in the decrease in actual capital structure after the tax imputation. These findings provide further evidence of the variation in the determination of capital structure across the periods before and after the tax imputation. Besides, the regression coefficient of the structural change between the periods before and after the tax imputation, i.e. CETAxTAX, is positive.

Web Journal of Chinese Management Review • Vol. 11 • No 2 15
This is the reason why the actual changes in capital structure increase after the tax imputation as shown in Table 4.
Table 3 Regression Results of Structural Change between Before and After the Tax Imputation for the Actual Capital Structure
Variable Beta Std. Error t Value Standardized Beta VIF
lnS 0.01019 0.00246 4.14a 0.08747 1.17727
CETA 0.05731 0.04707 1.22 0.02995 1.59538
OITA -0.39944 0.04213 -9.48a -0.20839 1.27400
NDTS -0.54910 0.16998 -3.23a -0.08528 1.83768
INVFATA 0.09051 0.02464 3.67a 0.10430 2.12587
SdOITA 0.07074 0.07311 0.97 0.02149 1.30138
lnSxTAX -0.00071 0.00039 -1.80c -0.03789 1.16390
CETAxTAX 0.01367 0.00746 1.83c 0.04483 1.57754
OITAxTAX 0.00023 0.00661 0.04 0.00076 1.22215
NDTSxTAX -0.00116 0.02740 -0.04 -0.00110 1.80560
INVFATAxTAX -0.00760 0.00394 -1.93c -0.05435 2.09573
SdOITAxTAX -0.05353 0.11659 -0.46 -0.01259 1.98234
DR_1 0.72138 0.02129 33.88a 0.74704 1.28201
DR_1xTAX 0.00666 0.00342 1.95c 0.04302 1.28984
EC 0.04249 0.05025 0.85 0.01725 1.09693
ECxTAX 0.01331 0.00992 1.34 0.03395 1.69062
Note:
1. a, b and c: at the significance level of 1%, 5% and 10%, respectively. 2. Adj R-Square F Value Pr > F DW Chi-Square Pr > Chi-Square N 0.6883 114.44 <.0001 2.05 102.37 0.4711 822
Web Journal of Chinese Management Review • Vol. 11 • No 2 16
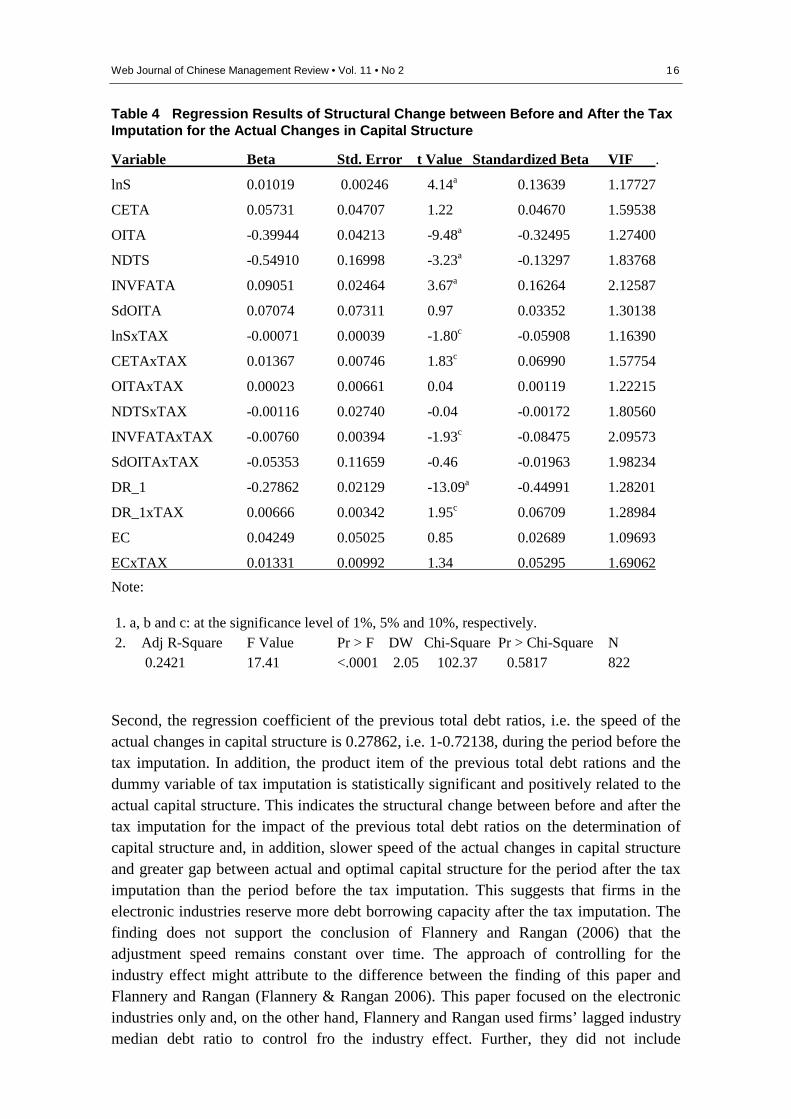
Table 4 Regression Results of Structural Change between Before and After the Tax Imputation for the Actual Changes in Capital Structure
Variable Beta Std. Error t Value Standardized Beta VIF .
lnS 0.01019 0.00246 4.14a 0.13639 1.17727
CETA 0.05731 0.04707 1.22 0.04670 1.59538
OITA -0.39944 0.04213 -9.48a -0.32495 1.27400
NDTS -0.54910 0.16998 -3.23a -0.13297 1.83768
INVFATA 0.09051 0.02464 3.67a 0.16264 2.12587
SdOITA 0.07074 0.07311 0.97 0.03352 1.30138
lnSxTAX -0.00071 0.00039 -1.80c -0.05908 1.16390
CETAxTAX 0.01367 0.00746 1.83c 0.06990 1.57754
OITAxTAX 0.00023 0.00661 0.04 0.00119 1.22215
NDTSxTAX -0.00116 0.02740 -0.04 -0.00172 1.80560
INVFATAxTAX -0.00760 0.00394 -1.93c -0.08475 2.09573
SdOITAxTAX -0.05353 0.11659 -0.46 -0.01963 1.98234
DR_1 -0.27862 0.02129 -13.09a -0.44991 1.28201
DR_1xTAX 0.00666 0.00342 1.95c 0.06709 1.28984
EC 0.04249 0.05025 0.85 0.02689 1.09693
ECxTAX 0.01331 0.00992 1.34 0.05295 1.69062
Note:
1. a, b and c: at the significance level of 1%, 5% and 10%, respectively. 2. Adj R-Square F Value Pr > F DW Chi-Square Pr > Chi-Square N 0.2421 17.41 <.0001 2.05 102.37 0.5817 822
Second, the regression coefficient of the previous total debt ratios, i.e. the speed of the actual changes in capital structure is 0.27862, i.e. 1-0.72138, during the period before the tax imputation. In addition, the product item of the previous total debt rations and the dummy variable of tax imputation is statistically significant and positively related to the actual capital structure. This indicates the structural change between before and after the tax imputation for the impact of the previous total debt ratios on the determination of capital structure and, in addition, slower speed of the actual changes in capital structure and greater gap between actual and optimal capital structure for the period after the tax imputation than the period before the tax imputation. This suggests that firms in the electronic industries reserve more debt borrowing capacity after the tax imputation. The finding does not support the conclusion of Flannery and Rangan (2006) that the adjustment speed remains constant over time. The approach of controlling for the industry effect might attribute to the difference between the finding of this paper and Flannery and Rangan (Flannery & Rangan 2006). This paper focused on the electronic industries only and, on the other hand, Flannery and Rangan used firms’ lagged industry median debt ratio to control fro the industry effect. Further, they did not include
Web Journal of Chinese Management Review • Vol. 11 • No 2 17
macroeconomic conditions in their study that also may result in the conflicting results. Therefore, future research may provide further evidence on the adjustment speed across industries over time.
Contrary to expectations, actual capital structure is not significantly related to macroeconomic conditions and, in addition, there is no structural change between the periods before and after the tax imputation for the impact of macroeconomic conditions on the determination of capital structure. Finally, according to the standardized regression coefficients shown in Tables 3 and 4, the adjustment speed and profitability are two of the most important determinants of the actual capital structure and the changes in capital structure.
Conclusions and Suggestions
We found some common determinants of capital structure at the firm level such as firm size, profitability, non-debt tax shields and asset structure at the firm level same as found in prior studies. Besides, this paper found the structural change between the periods before and after the tax imputation for the impact of some factors at the firm level on the determination of capital structure. Furthermore, this paper found a decrease in actual capital structure and an increase in the changes in capital structure after the tax imputation in 1998. This paper provides further evidence on the variation in the determination and determinants of capital structure. Furthermore, the speed of the actual changes in capital structure is slower and the gap between actual and optimal capital structure is greater for the period after the tax imputation than the period before the tax imputation. This seems to suggest that firms in the electronic industries reserve more debt borrowing capacity due to the tax imputation to the retained earnings. The finding does not support the conclusion of Flannery and Rangan in 2006. The conflicting results might be due to different approaches to controlling for the industry effect and including macroeconomic conditions or not in the study. Finally, the electronic industries include upper-stream, middle-stream and lower-stream sub-industries and, consequently, we may address the intra-industry difference of the determination of capital structure within the electronic industries. On the other hand, future research may include non-electronic industries to investigate the inter-industry differences in the actual changes in capital structure.

Web Journal of Chinese Management Review • Vol. 11 • No 2 18
Reference Ang, J. S., Chua, J. H., & McConnell, J. J. (1982). The administrative costs of corporate bankruptcy: A note. Journal of Finance, 37(1), 219-226.
Booth, L., Aivazian, V. D. K. A., & Maksimovic, V. (2001). Capital structures in developing countries. Journal of Finance, 56(1), 87-130.
Bradley, M., Jarrell, G. A., & Kim, E. H. (1984). On the existence of an optimal capital structure: Theory and evidence. Journal of Finance,39(3, Papers and proceedings, forty-second annual meeting, American Finance Association, San Francisco, CA, December 28-30, 1983), 857-878.
Castanias, R. (1983). Bankruptcy risk and optimal capital structure. Journal of Finance, 38(5), 1617-1635.
Chaplinsky, S., & Niehaus, G. (1993). Do inside ownership and leverage share common determinants? Quarterly Journal of Business and Economics, 32(4), 51-65.
Chu, P. Y., Soushan, W., & Shu, F. C. (1992). The determinants of corporate capital structure choice: Taiwan evidence. Journal of Management Science, 9, 159-177.
Claggett, E. T. (1991). Capital structure: Convergent and pecking order evidence. Review of Financial Economics, 1, 35-48.
Cronbach, L. (1987). Statistical tests for moderator variables: Flaws in analysis recently proposed. Psychological Bulletin, 102, 414-417.
DeAngelo, H., & Masulis, R. W. (1980). Optimal capital structure under corporate and personal taxation. Journal of Financial Economics, 8(1), 3-29.
Downs, T. W. (1993). Corporate leverage and nondebt tax shields: Evidence on crowding-out. The Financial Review, 28(4), 549-583.
Ferri, M. G., & Jones, W. H. (1979). Determinants of financial structure: A new methodological approach. The Journal of Finance, 34(3), 631.
Flannery, M. J., & Rangan, K. P. (2006). Partial adjustment toward target capital structures. Journal of Financial Economics, 79(3), 469-506.
Friend, I., & Lang, L. H. P. (1988). An empirical test of the impact of managerial self-interest on corporate capital structure. Journal of Finance, 43(2), 271-281.
Gujarati, D. N. (2003). Basic econometrics. New York, USA, McGrawHill.
Harris, M., & Raviv, A. (1991). The theory of capital structure. Journal of Finance, 46(1), 297-355.

Web Journal of Chinese Management Review • Vol. 11 • No 2 19
Huang, J. C., David S. S., & Liao, S.L. (2001). Effect of the integration of individual and corporate taxes on the firm value, dividend policy and capital structure: A dynamic capital structure model based analysis and empirical study of Taiwan industries. Management Review, 20(2),43-74.
Hung, J. H., Yi, P. K., & Hsiao, W.H. (2006). Tax imputation effect on capital structure: A comparison between high-tech and traditional industries. Fu-Jen Management Review, 13(2), 29-56.
Jensen, M. C., & Meckling, W. H. (1976). Theory of the firm: Managerial behavior, agency costs and ownership structure. Journal of Financial Economics, 3(4), 305-360.
Kester, W. C. (1986). Capital and ownership structure: A comparison of United States and Japanese manufacturing corporations. Financial Management, 15(1), 5.
Kim, W. S., & Sorensen, E. H. (1986). Evidence on the impact of the agency costs of debt on corporate debt policy. Journal of Financial and Quantitative Analysis, 21(2), 131-144.
Korajczyk, R. A., & Levy, A. (2003). Capital structure choice: Macroeconomic conditions and financial constraints. Journal of Financial Economics, 68(1), 75-109.
Marsh, P. (1982). The choice between equity and debt: An empirical study. Journal of Finance, 37(1),121-144.
Modigliani, F., & Miller, M. H. (1958). The cost of capital, corporation finance and the theory of investment. The American Economic Review, 48(3), 261-297.
Modigliani, F., & Miller, M. H. (1963). Corporate income taxes and the cost of capital: A correction. The American Economic Review, 53(3), 433-443.
Myers, S. C., & Majluf, N. S. (1984). Corporate financing and investment decisions when firms have information that investors do not have. Journal of Financial Economics, 13(2),187-221.
Pilotte, E. (1990). The economic recovery tax act of 1981 and corporate capital structure. Financial Management Winter, 98-107.
Rajan, R. G., & Zingales, L. (1995). What do we know about capital structure? Some evidence from international data. Journal of Finance, 50(5), 1421-1460.
Titman, S., & Wessels, R. (1988). The determinants of capital structure choice. Journal of Finance, 43(1), 1-19.
Wald, J. K. (1999). How firm characteristics affect capital structure: An international comparison. The Journal of Financial Research, 22(2), 161.

Web Journal of Chinese Management Review • Vol. 11 • No 2 20
Warner, J. B. (1977). Bankruptcy costs: Some evidence. Journal of Finance, 32(2, Papers and proceedings of the thirty-fifth annual meeting of the American Finance Association, Atlantic City, New Jersey, September 16-18, 1976), 337-347.
Watson, R., & Wilson, N. (2002). Small and medium size enterprise financing: A note on some of the empirical implications of a pecking order. Journal of Business, Finance and Accounting, 29, 557-578.
Yeh, H. H. (2002). The impact of economic fluctuations on corporate debt financing: empirical evidence from the listed companies in Taiwan. Bulletin of National Pingtung University of Science and Technology, 11(3), 229-237.
Yeh, H. H. (2003). The impact of economic fluctuations and new equity financing on corporate debt financing: Empirical evidence from the listed companies in Taiwan. Web Journal of Chinese Management Review, 6(4), 37-49.