Embed Size (px)
Citation preview
Supplementary figures and tables
Mature erythrocyte membrane homeostasis is compromised by loss of
the GATA1-FOG1 interaction
Atsushi Hasegawa, Ritsuko Shimizu, Narla Mohandas and Masayuki Yamamoto
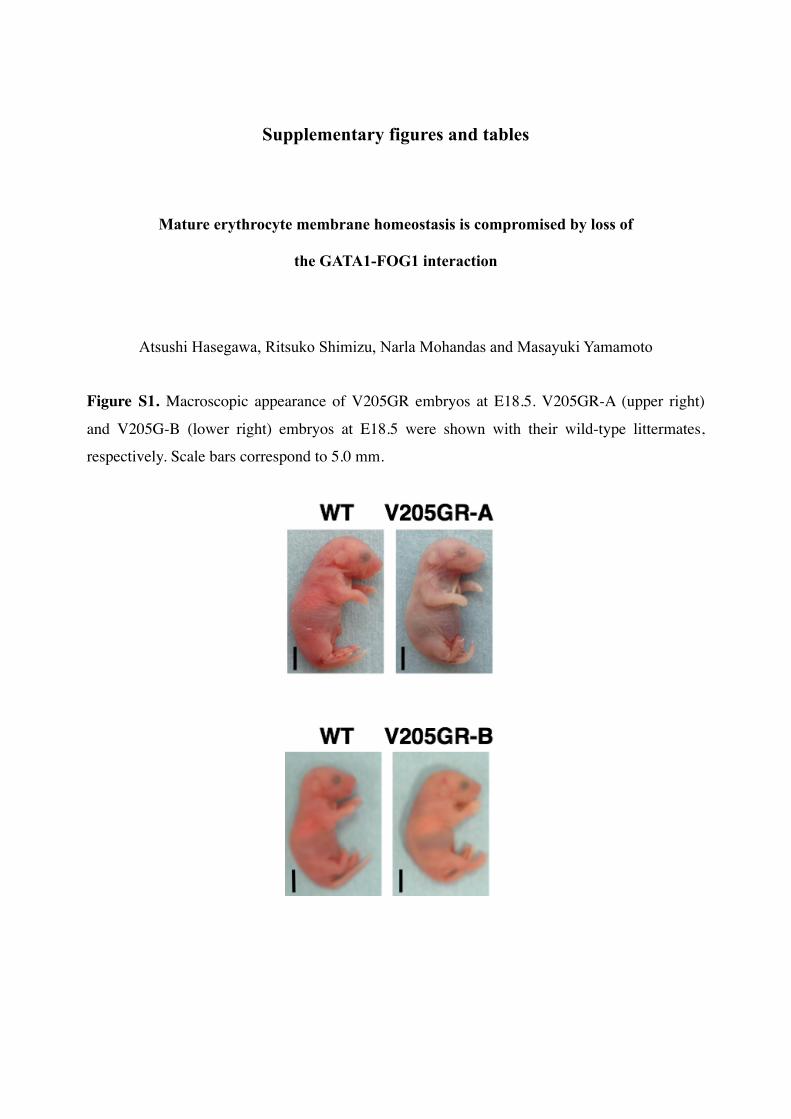
Figure S1. Macroscopic appearance of V205GR embryos at E18.5. V205GR-A (upper right)
and V205G-B (lower right) embryos at E18.5 were shown with their wild-type littermates,
respectively. Scale bars correspond to 5.0 mm.
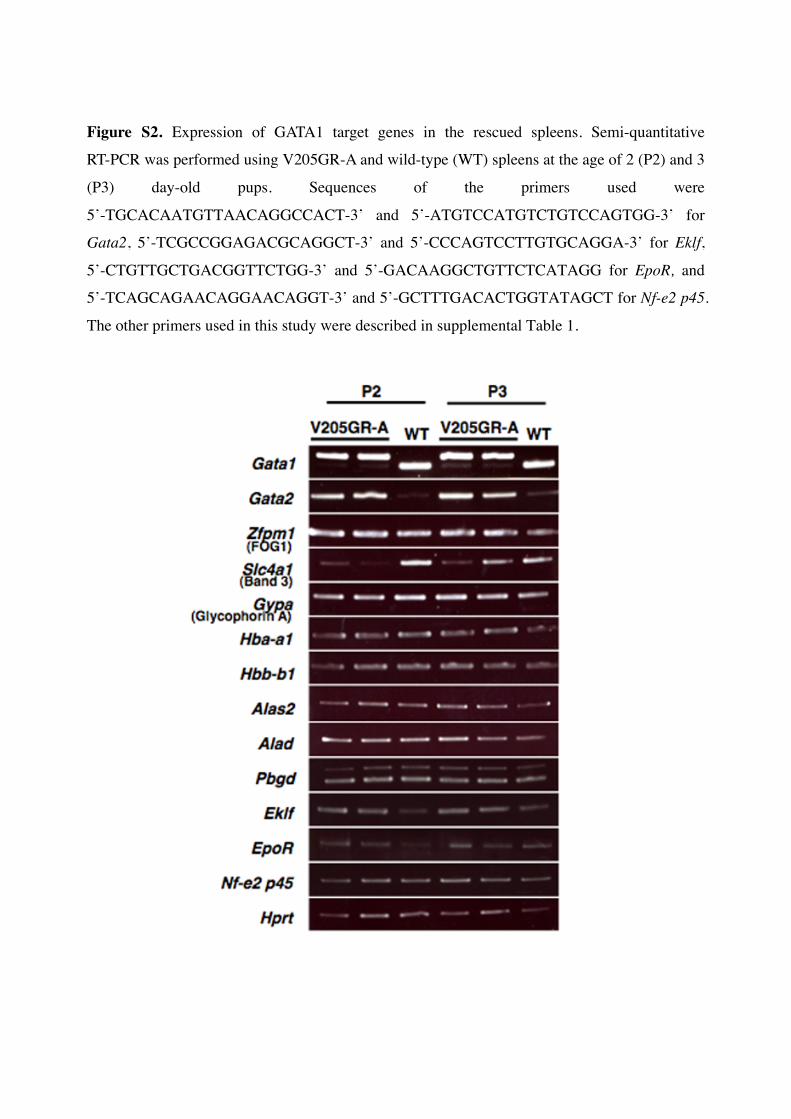
Figure S2. Expression of GATA1 target genes in the rescued spleens. Semi-quantitative
RT-PCR was performed using V205GR-A and wild-type (WT) spleens at the age of 2 (P2) and 3
(P3) day-old pups. Sequences of the primers used were
5’-TGCACAATGTTAACAGGCCACT-3’ and 5’-ATGTCCATGTCTGTCCAGTGG-3’ for
Gata2, 5’-TCGCCGGAGACGCAGGCT-3’ and 5’-CCCAGTCCTTGTGCAGGA-3’ for Eklf,
5’-CTGTTGCTGACGGTTCTGG-3’ and 5’-GACAAGGCTGTTCTCATAGG for EpoR, and
5’-TCAGCAGAACAGGAACAGGT-3’ and 5’-GCTTTGACACTGGTATAGCT for Nf-e2 p45.
The other primers used in this study were described in supplemental Table 1.
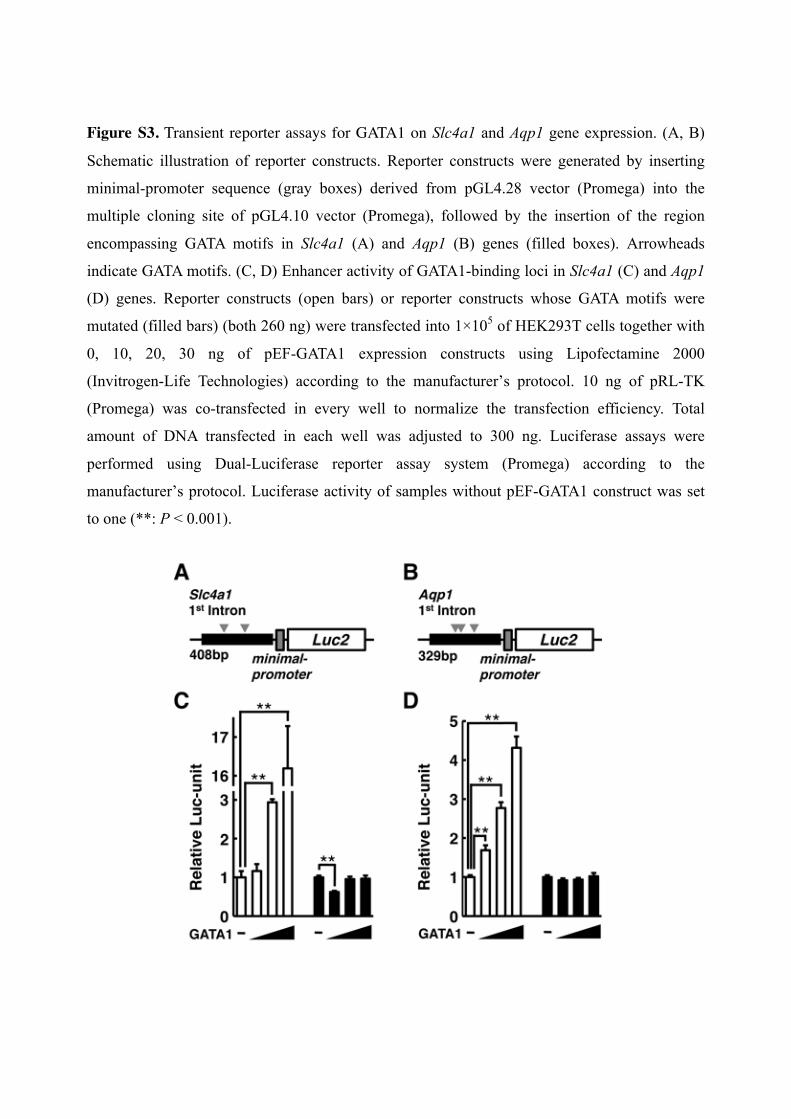
Figure S3. Transient reporter assays for GATA1 on Slc4a1 and Aqp1 gene expression. (A, B)
Schematic illustration of reporter constructs. Reporter constructs were generated by inserting
minimal-promoter sequence (gray boxes) derived from pGL4.28 vector (Promega) into the
multiple cloning site of pGL4.10 vector (Promega), followed by the insertion of the region
encompassing GATA motifs in Slc4a1 (A) and Aqp1 (B) genes (filled boxes). Arrowheads
indicate GATA motifs. (C, D) Enhancer activity of GATA1-binding loci in Slc4a1 (C) and Aqp1
(D) genes. Reporter constructs (open bars) or reporter constructs whose GATA motifs were
mutated (filled bars) (both 260 ng) were transfected into 1×10⁵ of HEK293T cells together with
0, 10, 20, 30 ng of pEF-GATA1 expression constructs using Lipofectamine 2000
(Invitrogen-Life Technologies) according to the manufacturer’s protocol. 10 ng of pRL-TK
(Promega) was co-transfected in every well to normalize the transfection efficiency. Total
amount of DNA transfected in each well was adjusted to 300 ng. Luciferase assays were
performed using Dual-Luciferase reporter assay system (Promega) according to the
manufacturer’s protocol. Luciferase activity of samples without pEF-GATA1 construct was set
to one (**: P < 0.001).
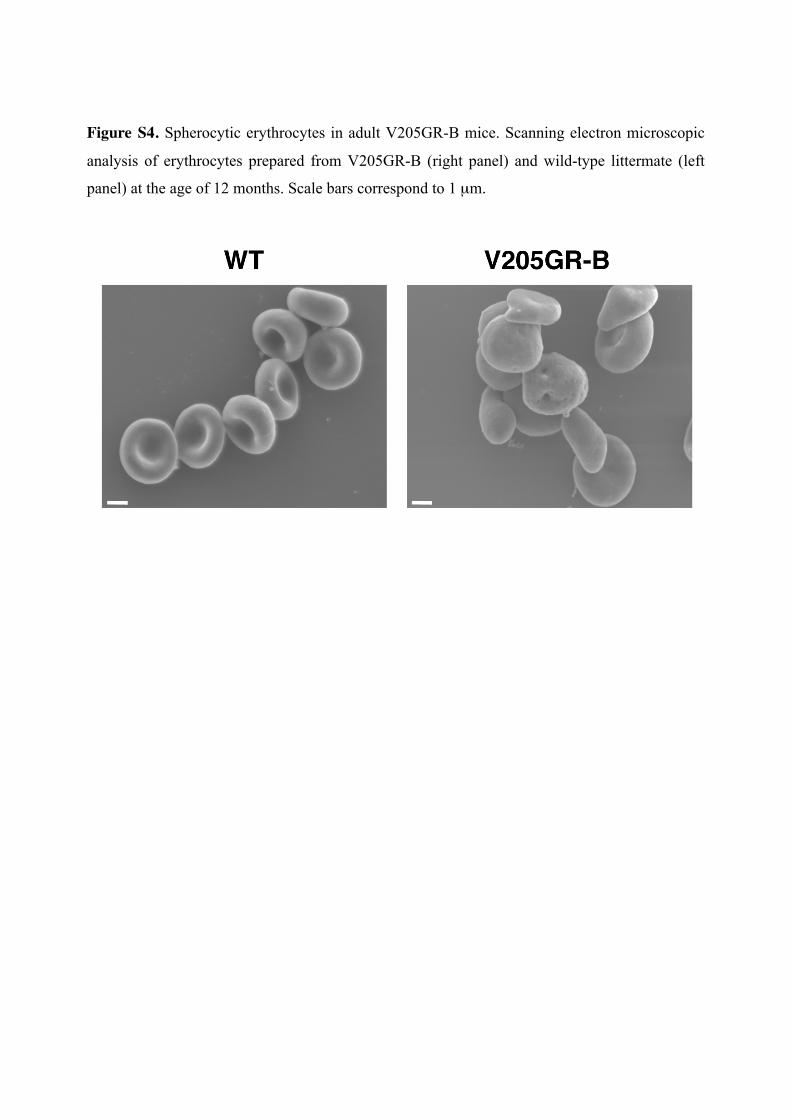
Figure S4. Spherocytic erythrocytes in adult V205GR-B mice. Scanning electron microscopic
analysis of erythrocytes prepared from V205GR-B (right panel) and wild-type littermate (left
panel) at the age of 12 months. Scale bars correspond to 1 µm.
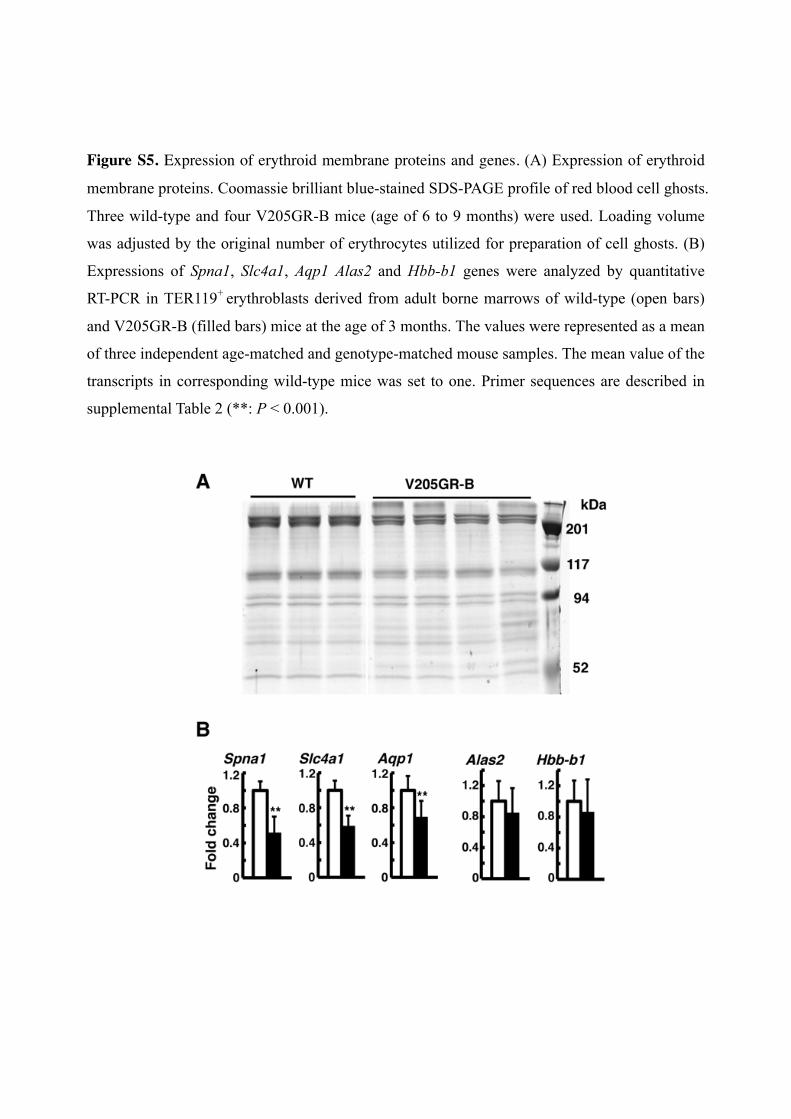
Figure S5. Expression of erythroid membrane proteins and genes. (A) Expression of erythroid
membrane proteins. Coomassie brilliant blue-stained SDS-PAGE profile of red blood cell ghosts.
Three wild-type and four V205GR-B mice (age of 6 to 9 months) were used. Loading volume
was adjusted by the original number of erythrocytes utilized for preparation of cell ghosts. (B)
Expressions of Spna1, Slc4a1, Aqp1 Alas2 and Hbb-b1 genes were analyzed by quantitative
RT-PCR in TER119+ erythroblasts derived from adult borne marrows of wild-type (open bars)
and V205GR-B (filled bars) mice at the age of 3 months. The values were represented as a mean
of three independent age-matched and genotype-matched mouse samples. The mean value of the
transcripts in corresponding wild-type mice was set to one. Primer sequences are described in
supplemental Table 2 (**: P < 0.001).
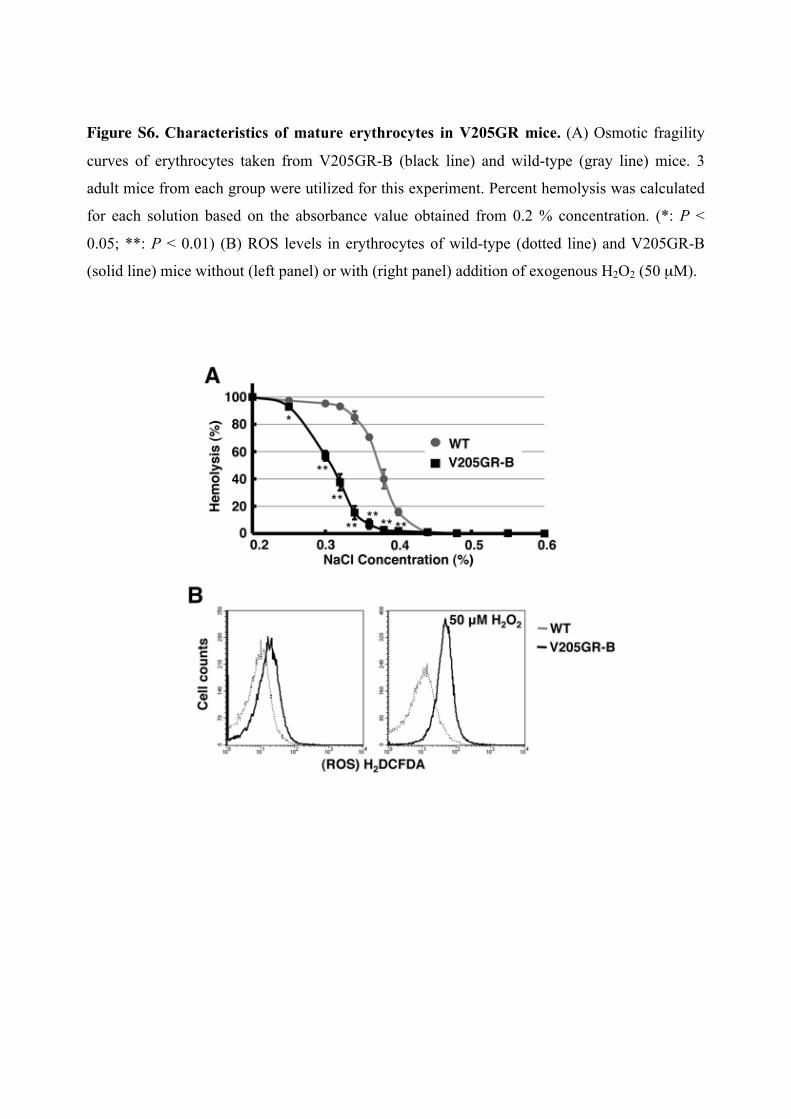
Figure S6. Characteristics of mature erythrocytes in V205GR mice. (A) Osmotic fragility
curves of erythrocytes taken from V205GR-B (black line) and wild-type (gray line) mice. 3
adult mice from each group were utilized for this experiment. Percent hemolysis was calculated
for each solution based on the absorbance value obtained from 0.2 % concentration. (*: P <
0.05; **: P < 0.01) (B) ROS levels in erythrocytes of wild-type (dotted line) and V205GR-B
(solid line) mice without (left panel) or with (right panel) addition of exogenous H2O2 (50 µM).
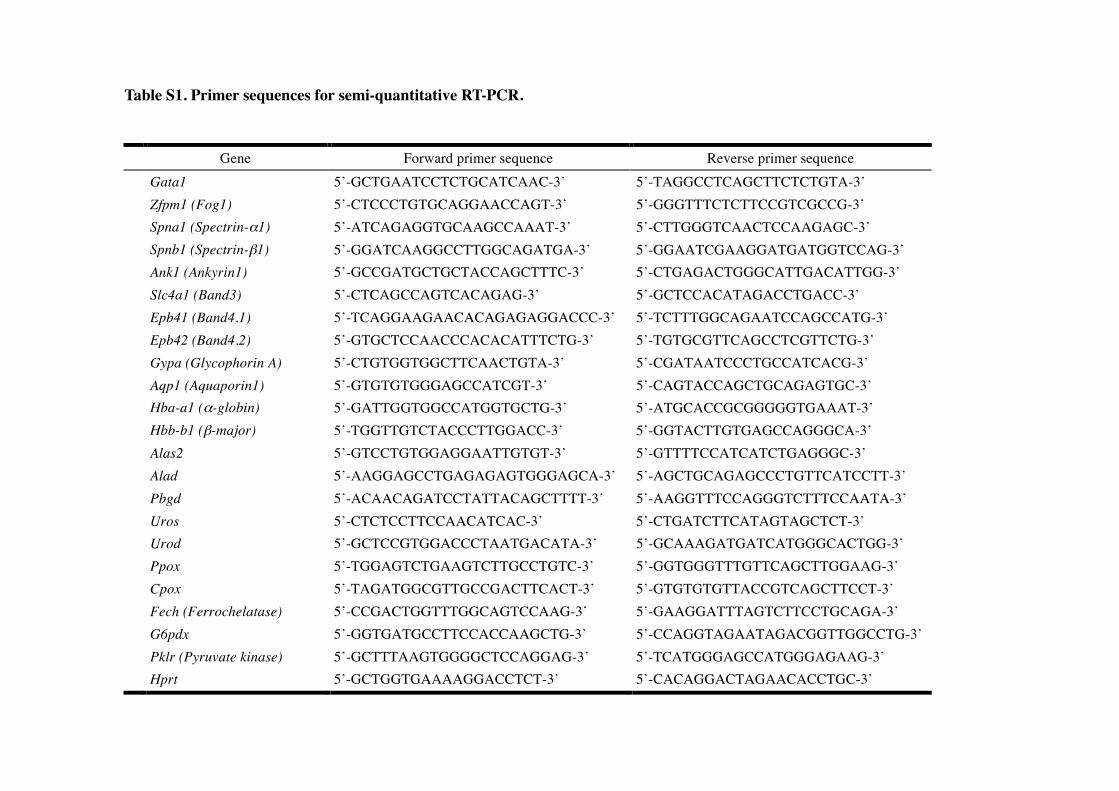
Table S1. Primer sequences for semi-quantitative RT-PCR. Gene Forward primer sequence Reverse primer sequence Gata1 5’-GCTGAATCCTCTGCATCAAC-3’ 5’-TAGGCCTCAGCTTCTCTGTA-3’ Zfpm1 (Fog1) 5’-CTCCCTGTGCAGGAACCAGT-3’ 5’-GGGTTTCTCTTCCGTCGCCG-3’ Spna1 (Spectrin-α1) 5’-ATCAGAGGTGCAAGCCAAAT-3’ 5’-CTTGGGTCAACTCCAAGAGC-3’ Spnb1 (Spectrin-β1) 5’-GGATCAAGGCCTTGGCAGATGA-3’ 5’-GGAATCGAAGGATGATGGTCCAG-3’ Ank1 (Ankyrin1) 5’-GCCGATGCTGCTACCAGCTTTC-3’ 5’-CTGAGACTGGGCATTGACATTGG-3’ Slc4a1 (Band3) 5’-CTCAGCCAGTCACAGAG-3’ 5’-GCTCCACATAGACCTGACC-3’ Epb41 (Band4.1) 5’-TCAGGAAGAACACAGAGAGGACCC-3’ 5’-TCTTTGGCAGAATCCAGCCATG-3’ Epb42 (Band4.2) 5’-GTGCTCCAACCCACACATTTCTG-3’ 5’-TGTGCGTTCAGCCTCGTTCTG-3’ Gypa (Glycophorin A) 5’-CTGTGGTGGCTTCAACTGTA-3’ 5’-CGATAATCCCTGCCATCACG-3’ Aqp1 (Aquaporin1) 5’-GTGTGTGGGAGCCATCGT-3’ 5’-CAGTACCAGCTGCAGAGTGC-3’ Hba-a1 (α-globin) 5’-GATTGGTGGCCATGGTGCTG-3’ 5’-ATGCACCGCGGGGGTGAAAT-3’ Hbb-b1 (β-major) 5’-TGGTTGTCTACCCTTGGACC-3’ 5’-GGTACTTGTGAGCCAGGGCA-3’ Alas2 5’-GTCCTGTGGAGGAATTGTGT-3’ 5’-GTTTTCCATCATCTGAGGGC-3’ Alad 5’-AAGGAGCCTGAGAGAGTGGGAGCA-3’ 5’-AGCTGCAGAGCCCTGTTCATCCTT-3’ Pbgd 5’-ACAACAGATCCTATTACAGCTTTT-3’ 5’-AAGGTTTCCAGGGTCTTTCCAATA-3’ Uros 5’-CTCTCCTTCCAACATCAC-3’ 5’-CTGATCTTCATAGTAGCTCT-3’ Urod 5’-GCTCCGTGGACCCTAATGACATA-3’ 5’-GCAAAGATGATCATGGGCACTGG-3’ Ppox 5’-TGGAGTCTGAAGTCTTGCCTGTC-3’ 5’-GGTGGGTTTGTTCAGCTTGGAAG-3’ Cpox 5’-TAGATGGCGTTGCCGACTTCACT-3’ 5’-GTGTGTGTTACCGTCAGCTTCCT-3’ Fech (Ferrochelatase) 5’-CCGACTGGTTTGGCAGTCCAAG-3’ 5’-GAAGGATTTAGTCTTCCTGCAGA-3’ G6pdx 5’-GGTGATGCCTTCCACCAAGCTG-3’ 5’-CCAGGTAGAATAGACGGTTGGCCTG-3’ Pklr (Pyruvate kinase) 5’-GCTTTAAGTGGGGCTCCAGGAG-3’ 5’-TCATGGGAGCCATGGGAGAAG-3’ Hprt 5’-GCTGGTGAAAAGGACCTCT-3’ 5’-CACAGGACTAGAACACCTGC-3’
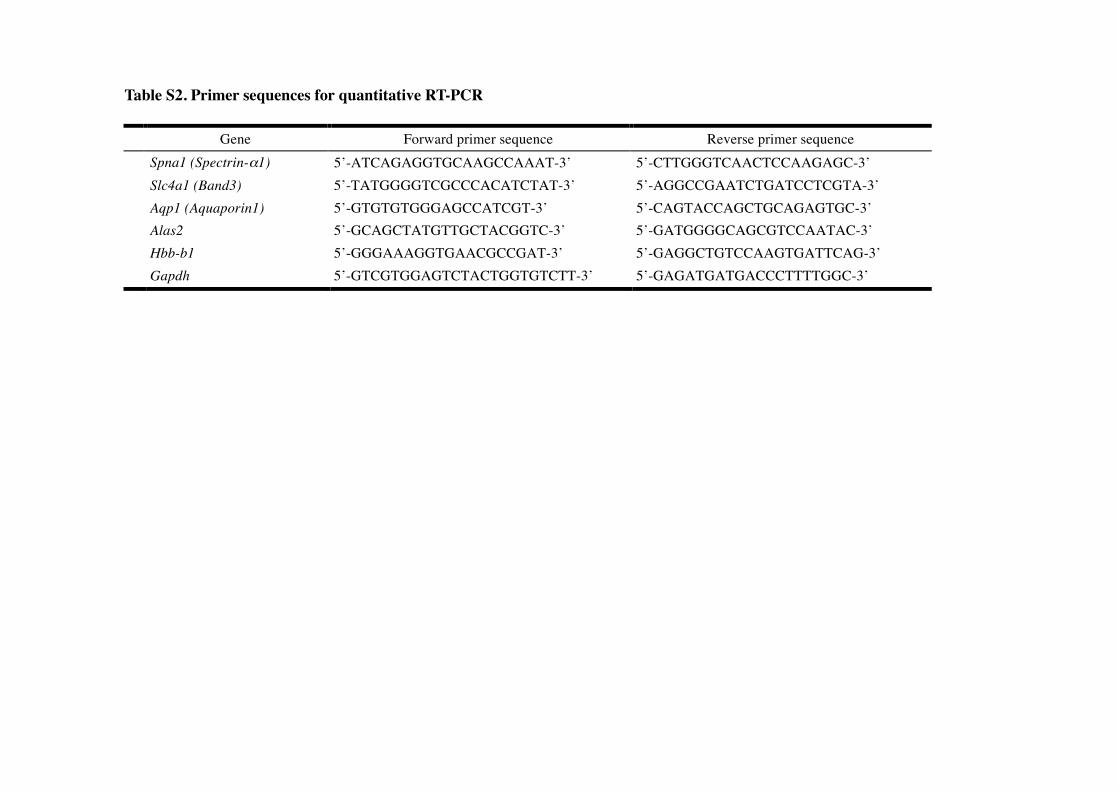
Table S2. Primer sequences for quantitative RT-PCR Gene Forward primer sequence Reverse primer sequence Spna1 (Spectrin-α1) 5’-ATCAGAGGTGCAAGCCAAAT-3’ 5’-CTTGGGTCAACTCCAAGAGC-3’ Slc4a1 (Band3) 5’-TATGGGGTCGCCCACATCTAT-3’ 5’-AGGCCGAATCTGATCCTCGTA-3’ Aqp1 (Aquaporin1) 5’-GTGTGTGGGAGCCATCGT-3’ 5’-CAGTACCAGCTGCAGAGTGC-3’ Alas2 5’-GCAGCTATGTTGCTACGGTC-3’ 5’-GATGGGGCAGCGTCCAATAC-3’ Hbb-b1 5’-GGGAAAGGTGAACGCCGAT-3’ 5’-GAGGCTGTCCAAGTGATTCAG-3’ Gapdh 5’-GTCGTGGAGTCTACTGGTGTCTT-3’ 5’-GAGATGATGACCCTTTTGGC-3’
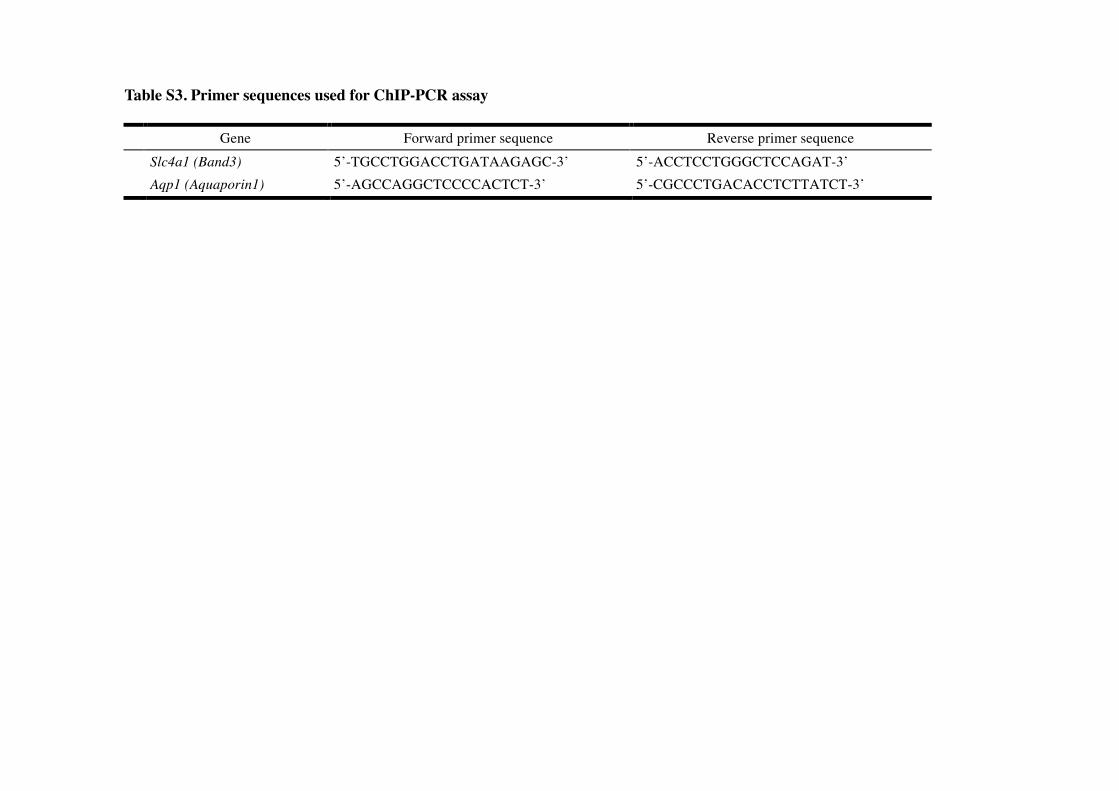
Table S3. Primer sequences used for ChIP-PCR assay Gene Forward primer sequence Reverse primer sequence Slc4a1 (Band3) 5’-TGCCTGGACCTGATAAGAGC-3’ 5’-ACCTCCTGGGCTCCAGAT-3’ Aqp1 (Aquaporin1) 5’-AGCCAGGCTCCCCACTCT-3’ 5’-CGCCCTGACACCTCTTATCT-3’


![[Supplementary materials]](https://img.pdfslide.tips/doc/110x75/56816583550346895dd82b8a/supplementary-materials-56cd0e37cc26b.jpg)
