Embed Size (px)
Citation preview

Tales of Genetic Mapping:From Transcripts to
Complex Traits
Todd Vision
Department of Biology
University of North Carolina at Chapel Hill
Genetic mapping
• To dissect the genetic basis of phenotypic variation
• Particularly important for– Naturally occuring alleles– Complex traits (eg polygenes)– Non-model systems
Experimental Populations
• Most powerful design for measuring the effects of Quantitative Trait Loci (QTL)
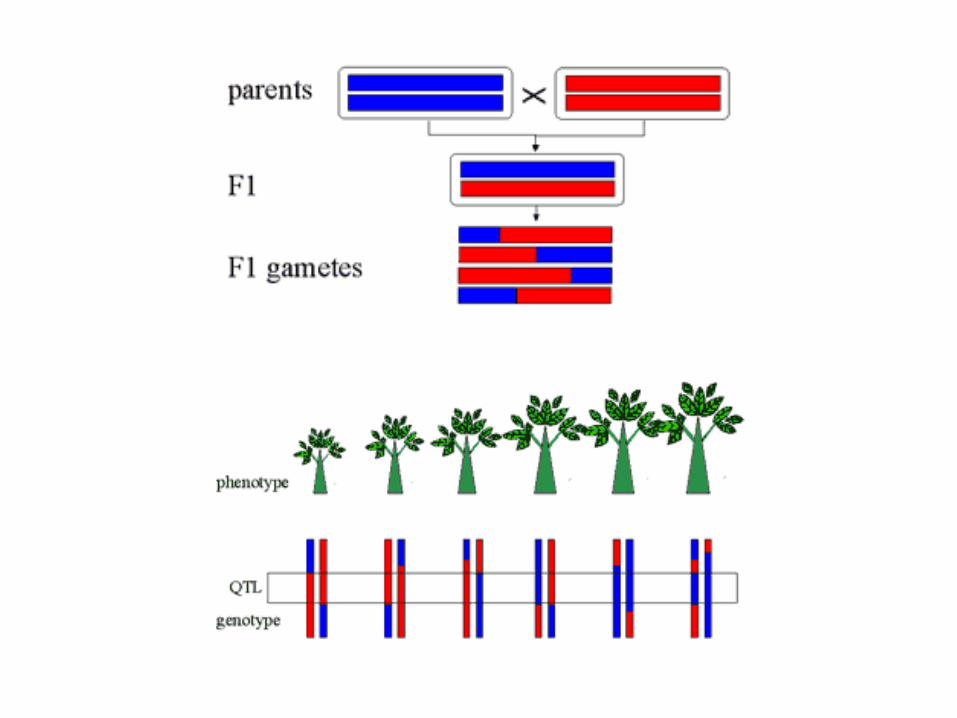
• Cross two inbred lines• In segregating progeny
– Measure the phenotype – Genotype markers throughout the genome
• Model the relationship between genotype and phenotype along the genome
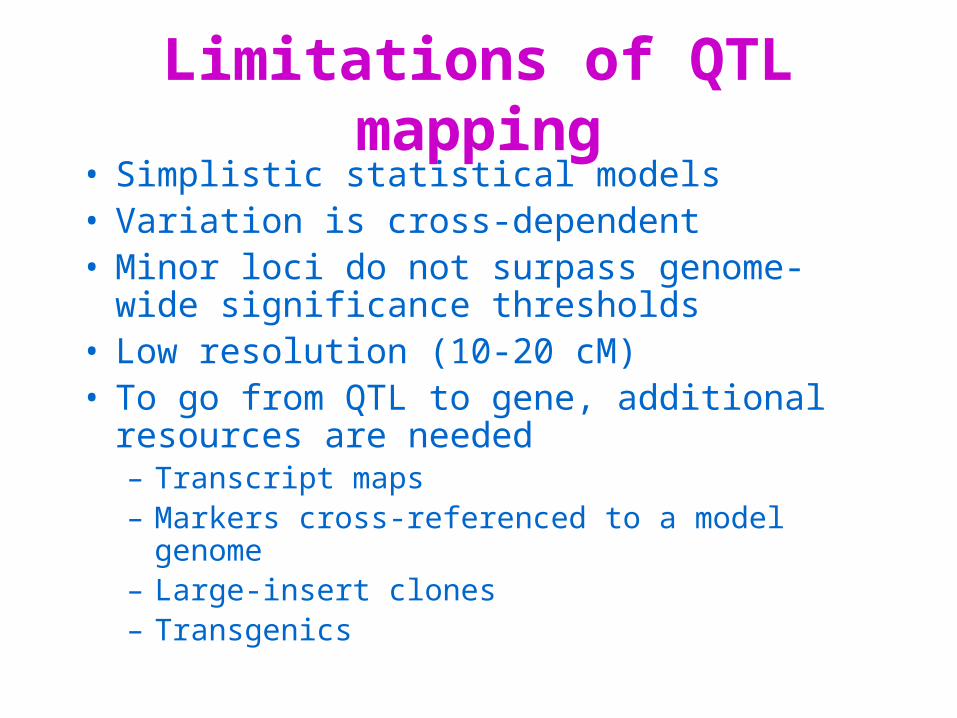
Limitations of QTL mapping• Simplistic statistical models• Variation is cross-dependent• Minor loci do not surpass genome-wide
significance thresholds• Low resolution (10-20 cM)• To go from QTL to gene, additional resources
are needed– Transcript maps– Markers cross-referenced to a model genome– Large-insert clones– Transgenics
Outline
• Design of transcript mapping projects
• QTL mapping of complex plant physiological traits– Aluminum tolerance in Arabidopsis– Carbon-water balance in tomato and rice
Outline
• Designing a transcript mapping project
• QTL mapping of physiological variation in plants– Aluminum tolerance– Carbon-water balance
Transcript mapping
• Uses Expressed Sequence Tags (ESTs) as markers
• Can provide candidate genes for QTL-regions
• Allows comparative mapping between model and non-model species– Anchoring markers can be matched in
silico
Experimental design for transcript mapping
• With Dan Brown (U of Waterloo)• Size of mapping population and number of
markers dictate the number of genotypes one needs to score
• But there are a finite number of crossovers in a population – scoring more markers cannot fix this
• How can we maximize the resolution of our map with minimal genotyping?
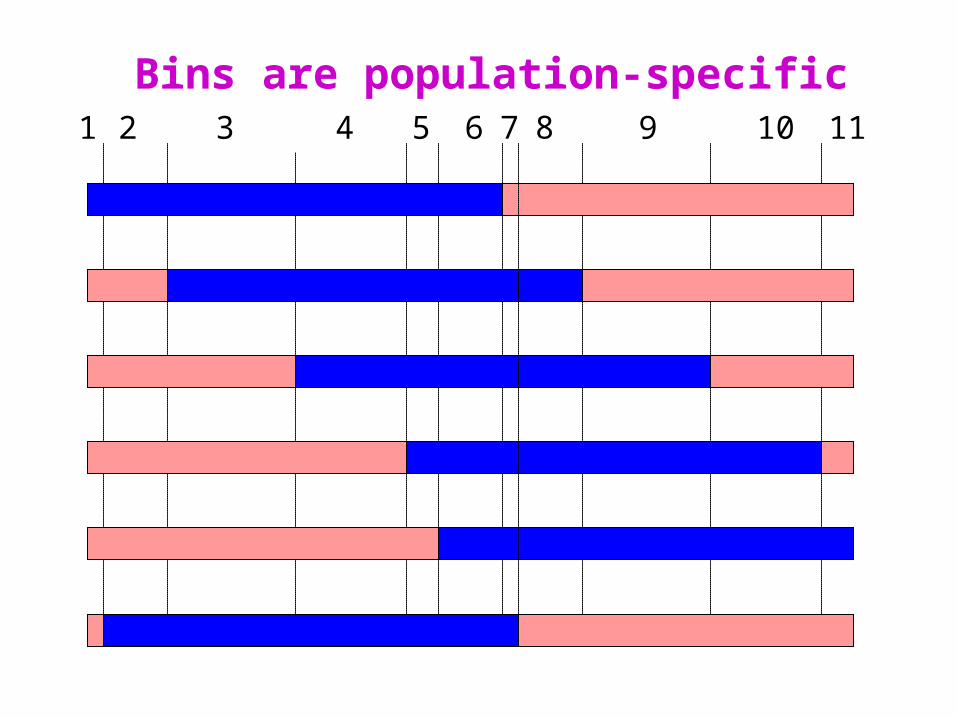
1 2 3 4 5 6 7 9 10 118
Bins are population-specific
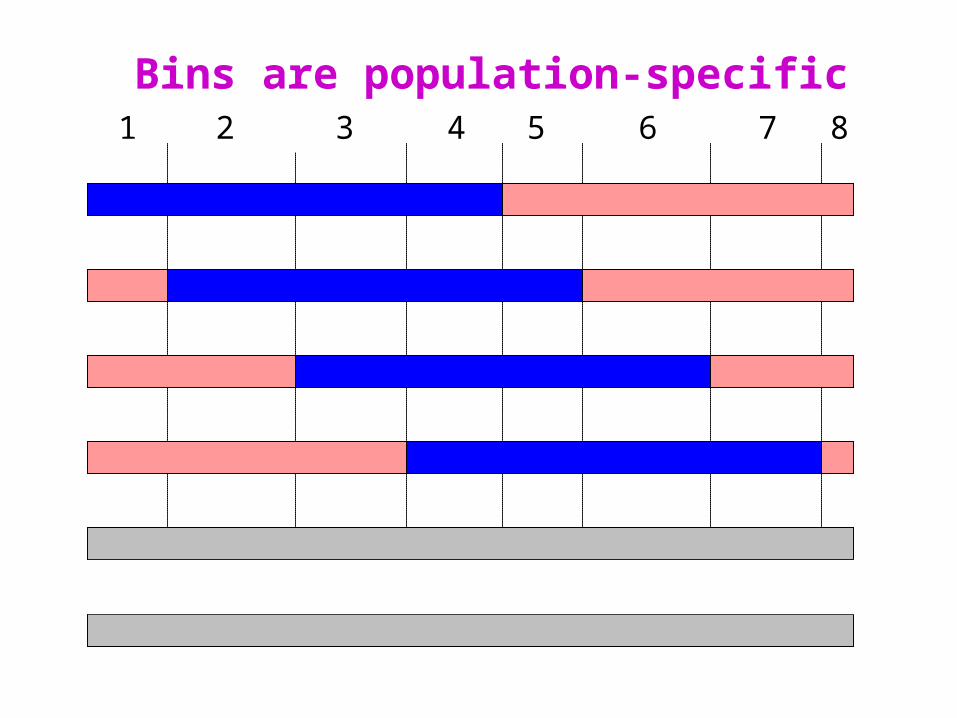
1 2 3 4 5 6 7 8
Bins are population-specific
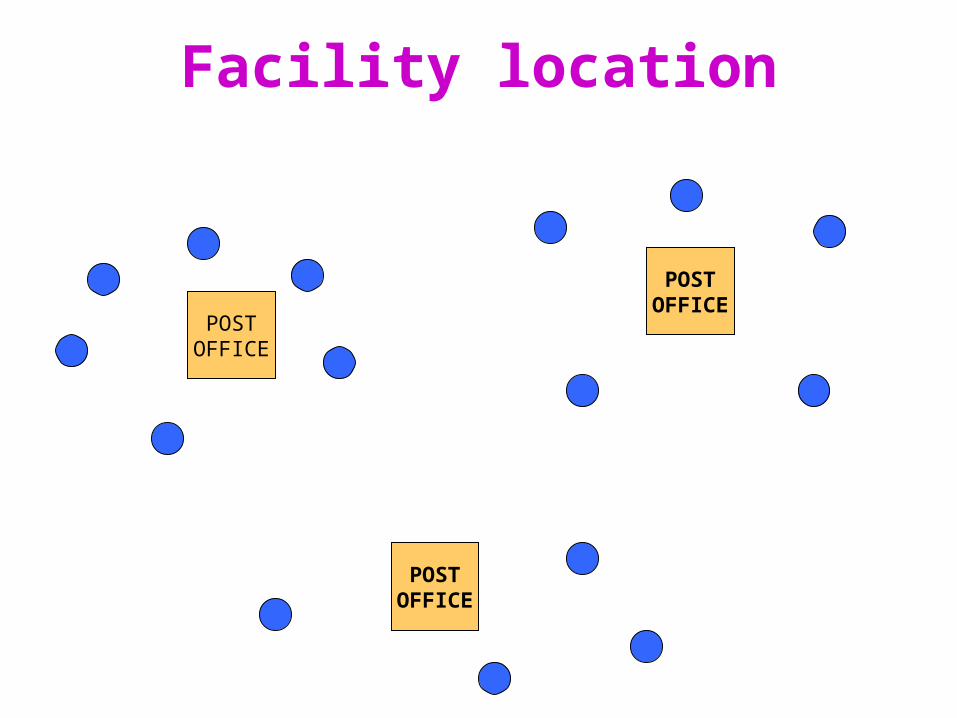
Facility location
POSTOFFICE
POSTOFFICE
POSTOFFICE
Selective Mapping
• Generate a sparse framework map for a large population
• Use adjacent markers to identify crossover-containing intervals
• Computationally select a set of lines that optimize bin length– Maximum– Expected (sum of squares)
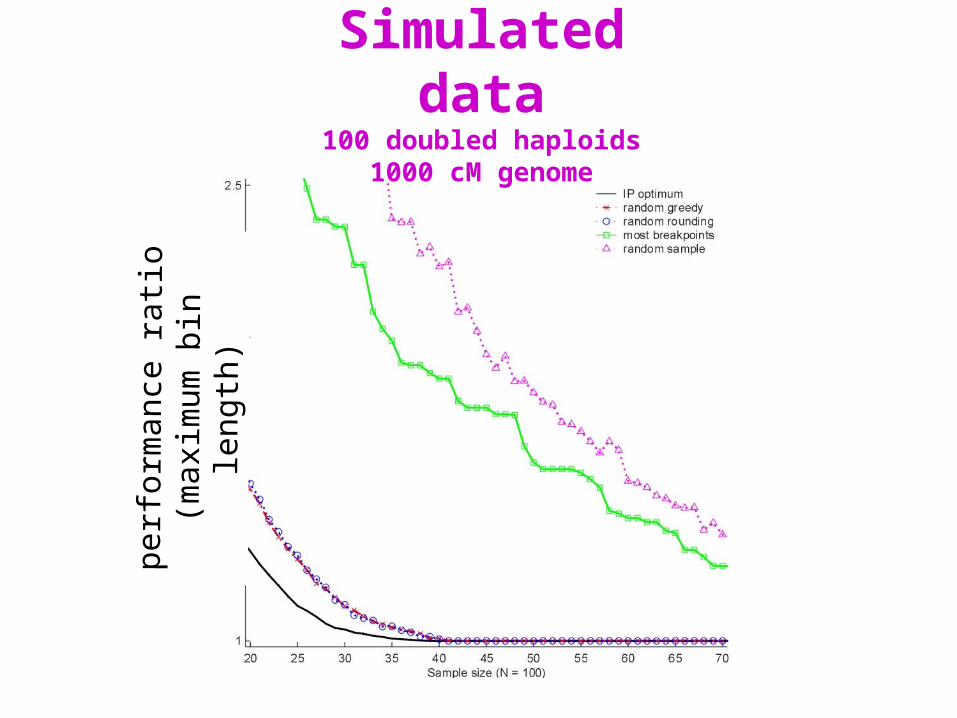
Simulated data100 doubled haploids
1000 cM genomepe
rfor
man
ce r
atio
(m
axim
um b
in le
ngth
)
0
24
6
810
12
1416
18
0 10 20 30 40
Marker Spacing (cM)
Bin
Siz
e (c
M))
MBL perceived
MBL actual
EBL perceived
EBL actual
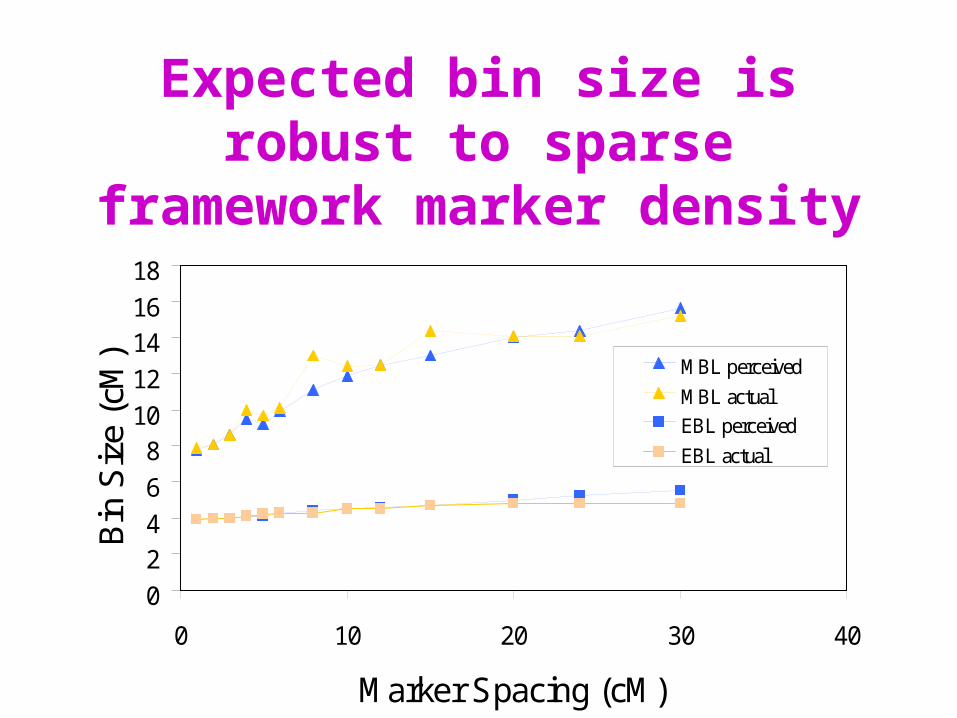
Expected bin size is robust to sparse framework marker
density
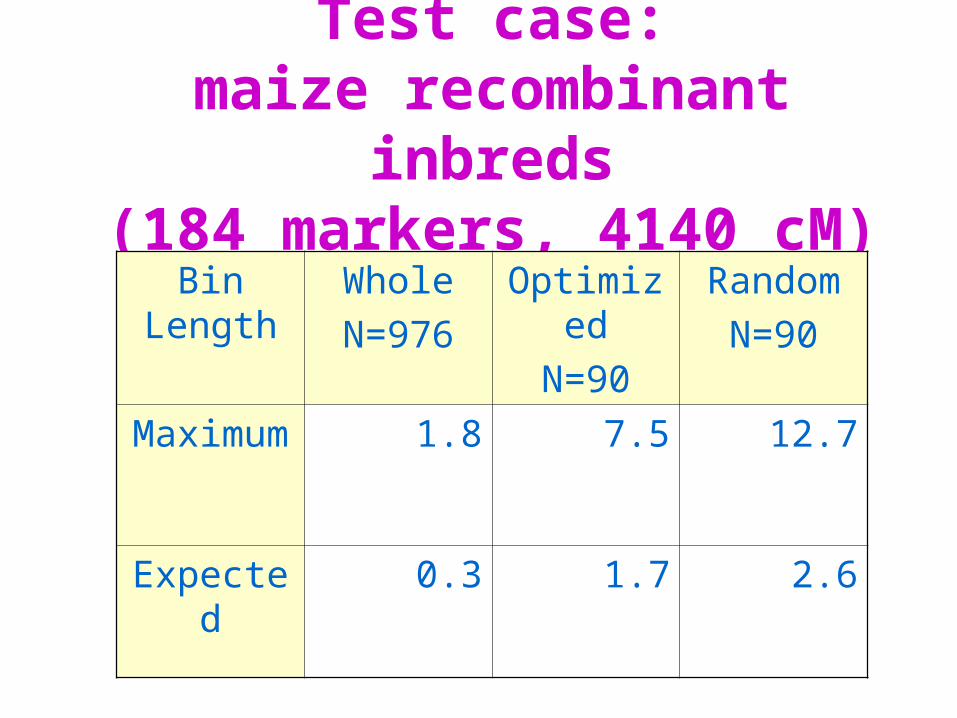
Test case:maize recombinant inbreds
(184 markers, 4140 cM)Bin
LengthWhole
N=976
Optimized
N=90
Random
N=90
Maximum 1.8 7.5 12.7
Expected 0.3 1.7 2.6
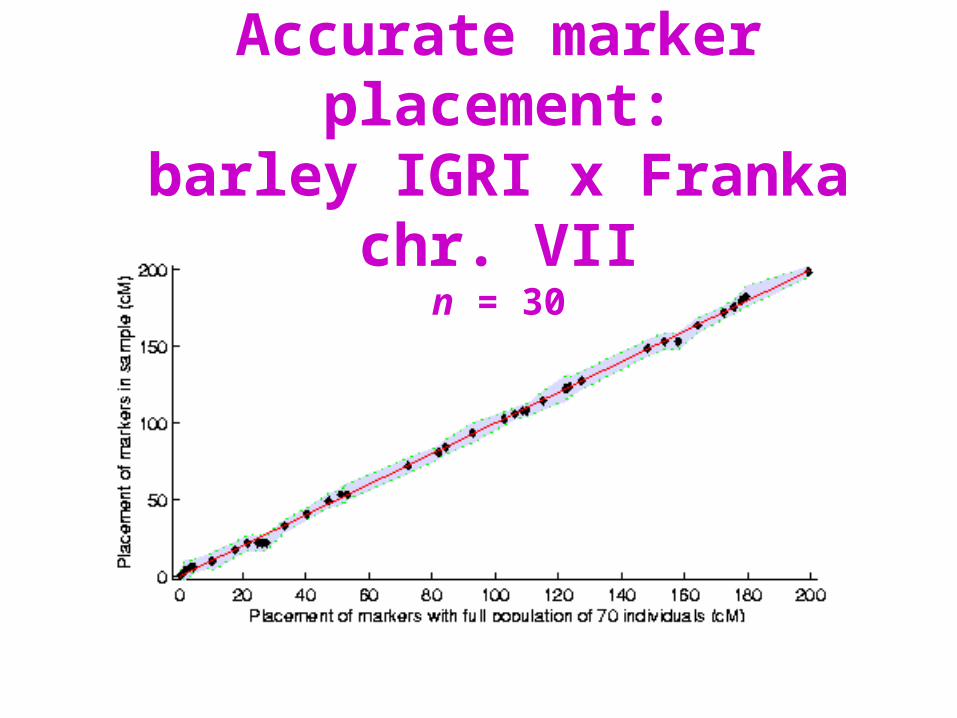
Accurate marker placement:barley IGRI x Franka chr. VII
n = 30
Selective Mapping: a summary• Transcript maps require many genotypes• MapPop algorithm optimizes map
resolution for a fixed number of genotypes
• MapPop locates new markers on a framework map more quickly and accurately than traditional methods
• Selective Mapping has been applied to several large, commercially important populations
Outline
• Design of transcript mapping projects
• QTL mapping of physiological variation in plants– Aluminum tolerance– Carbon-water balance
Why are physiological traits so hard to map?
• Difficult to measure– Low penetrance– Variable expressivity– Assays are often low-throughput
• Sensitive to environmental conditions• A common perception is that they are
more genetically complex than other traits
Aluminum toxicity
• In acid soils (pH < 5.0) Al3+ is solubilized
• Al3+ is a potent inhibitor of root growth
• Al toxicity limits productivity on 30% of all cultivated land on Earth
• Tolerance is a major target of breeders– Most work has focused on cereal grains– No genes have been cloned – yet
Mapping Al tolerance in Arabidopsis
• With Owen Hoekenga (USDA)• Mapping population
– 100 recombinant inbred lines (RIL) from Col x Ler– Col more tolerant– Lines genotyped for 113 markers by AGI
• Phenotypic measurements– Seedling root length in hydroponic culture– With and without added aluminum– Two timepoints (6 and 8 days)– Care to avoid anoxia and to maintain stable pH
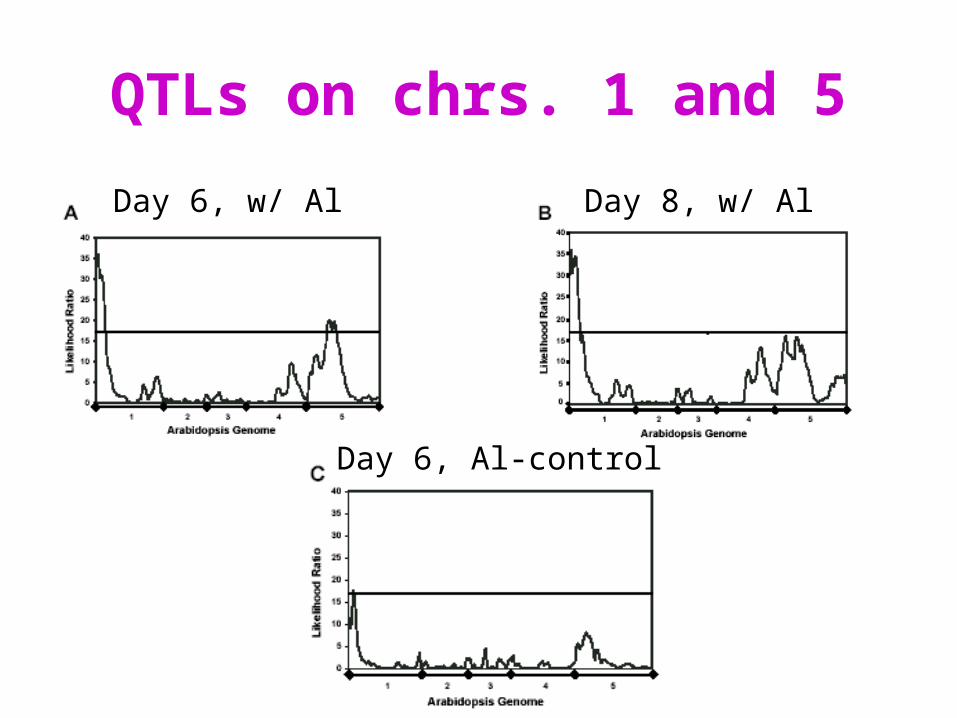
QTLs on chrs. 1 and 5
Day 6, w/ Al Day 8, w/ Al
Day 6, Al-control
Mechanism of QTL action
• Tolerance can occur via – Exclusion– Sequestration– Insensitivity
• Organic acids can act as ligands to exclude or sequester metal ions– Citrate– Malate
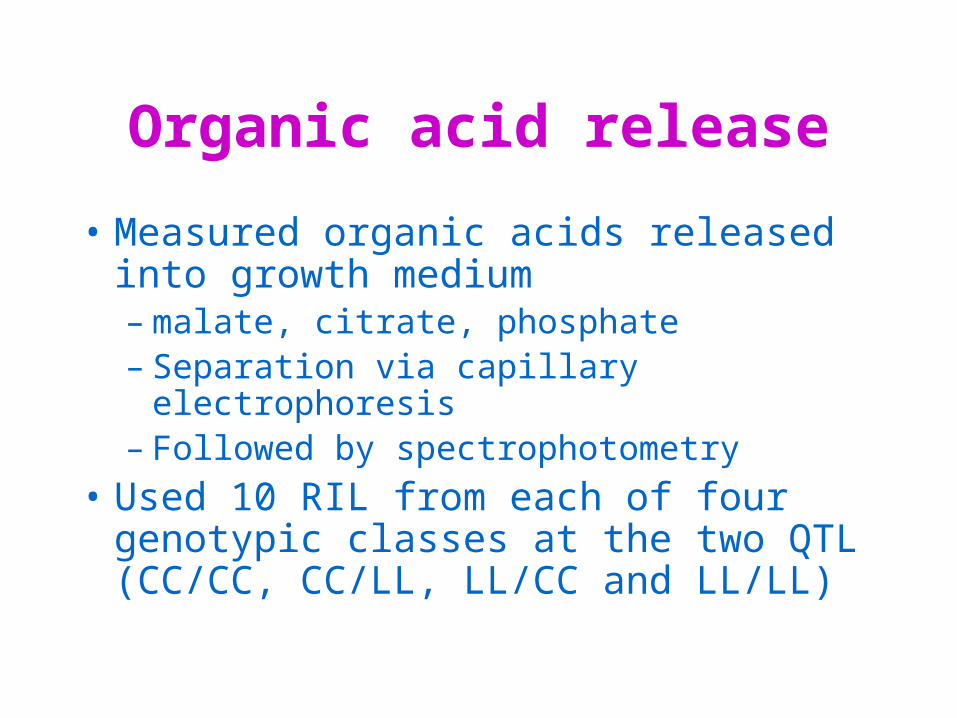
Organic acid release
• Measured organic acids released into growth medium– malate, citrate, phosphate– Separation via capillary electrophoresis– Followed by spectrophotometry
• Used 10 RIL from each of four genotypic classes at the two QTL (CC/CC, CC/LL, LL/CC and LL/LL)
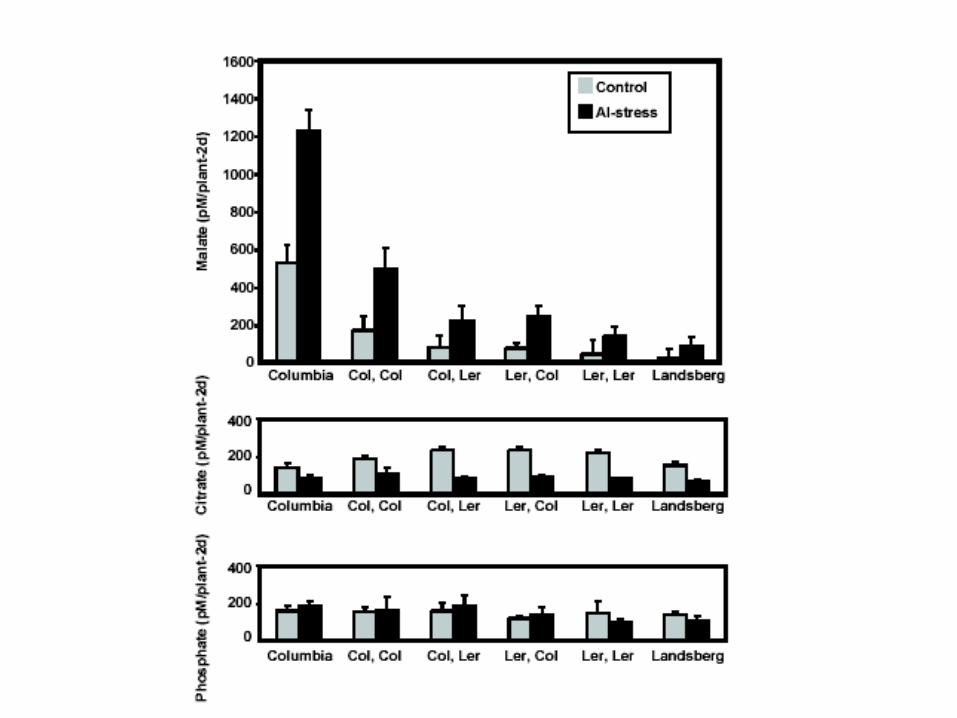
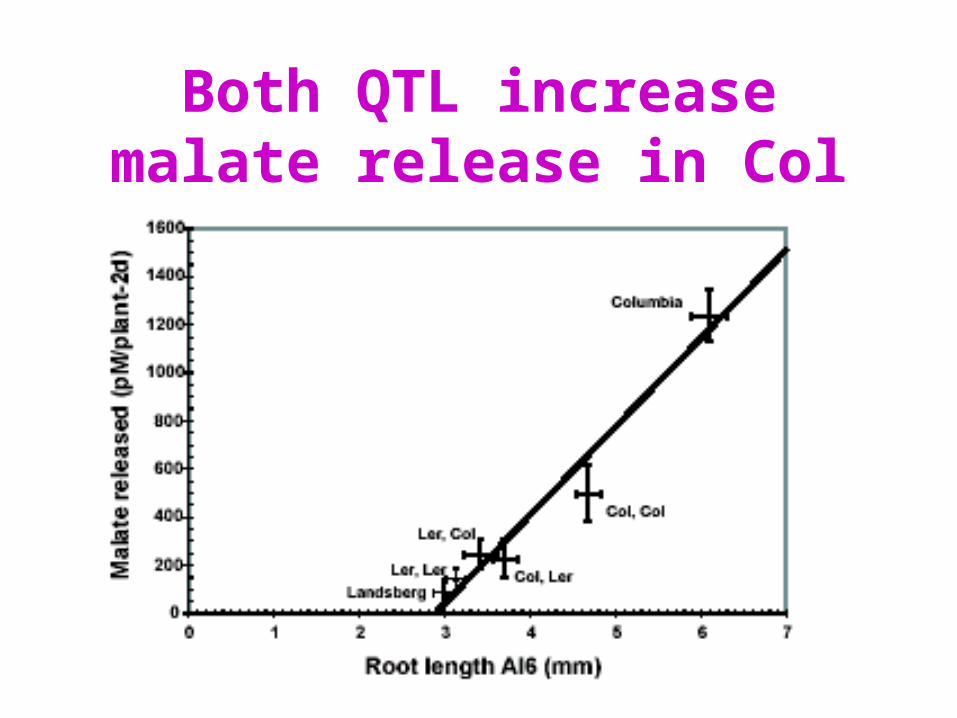
Both QTL increase malate release in Col
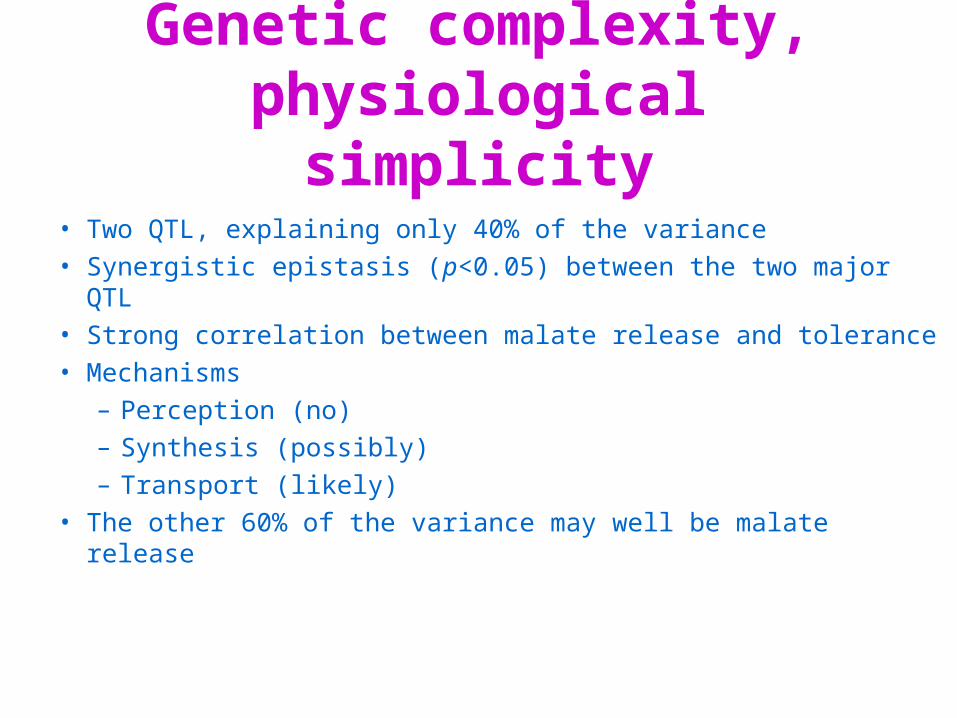
Genetic complexity, physiological simplicity
• Two QTL, explaining only 40% of the variance • Synergistic epistasis (p<0.05) between the two major QTL• Strong correlation between malate release and tolerance• Mechanisms
– Perception (no)– Synthesis (possibly)– Transport (likely)
• The other 60% of the variance may well be malate release
Where things stand now…
• Fine mapping– Isolating new recombinants near QTL
• Nearly isogenic lines– Backcrossing with marker assisted selection– To test QTL in isolation
• The goal… positional cloning
Outline
• Design of transcript mapping projects
• QTL mapping of physiological variation in plants– Aluminum tolerance– Carbon-water balance
Genomic analysis of water use efficiency
Boyce Thompson Institute for Plant Science
Cornell University
Oklahoma State University
University of North Carolina at Chapel Hill
http://isotope.bti.cornell.edu/
Water use efficiency• A fundamental trade-off
– open stomates allow photosynthesis– but also result in water loss through transpiration
• WUE is the ratio of carbon fixed to water lost– Somewhat related to drought tolerance– More closely to yield potential under irrigation
• Water is the most limiting resource to global agricultural production
• In some crops, and under some conditions, greater WUE would be desirable and in others less
WUE considered at 3 levels
• Whole-field (under agronomic control)
• Whole-plant (driven by respiration)
• Single-leaf (of interest here)
Wind
g s
ca
ci
C 2O
wi
wa
H2O
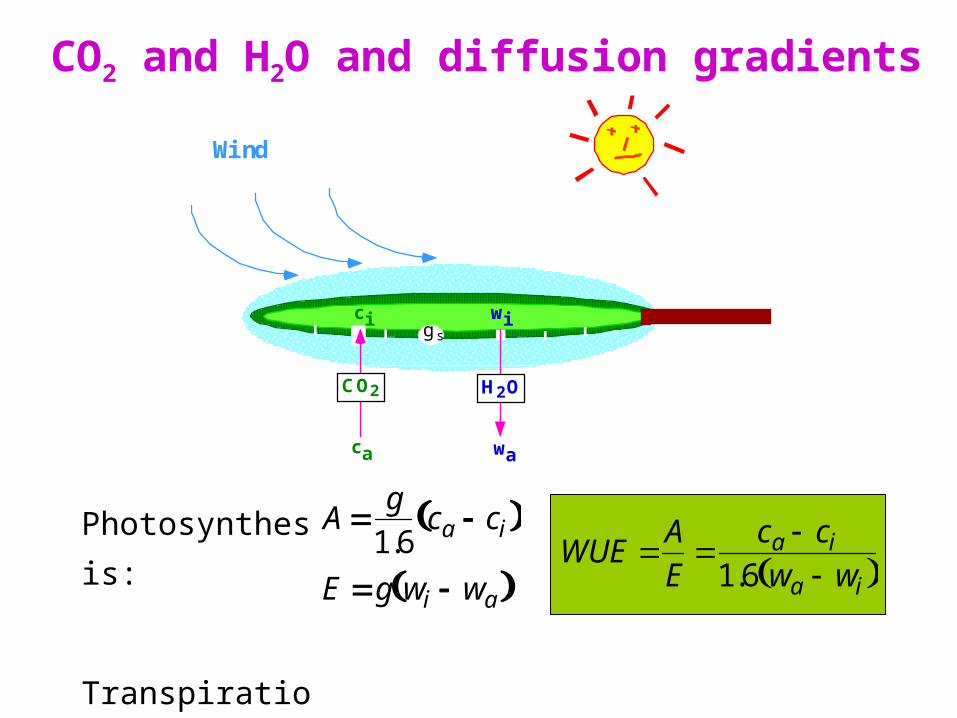
WUE AE
ca ci
1.6 wa wi A
g1.6
ca ci
E g wi wa
Photosynthesis:
Transpiration:
CO2 and H2O and diffusion gradients
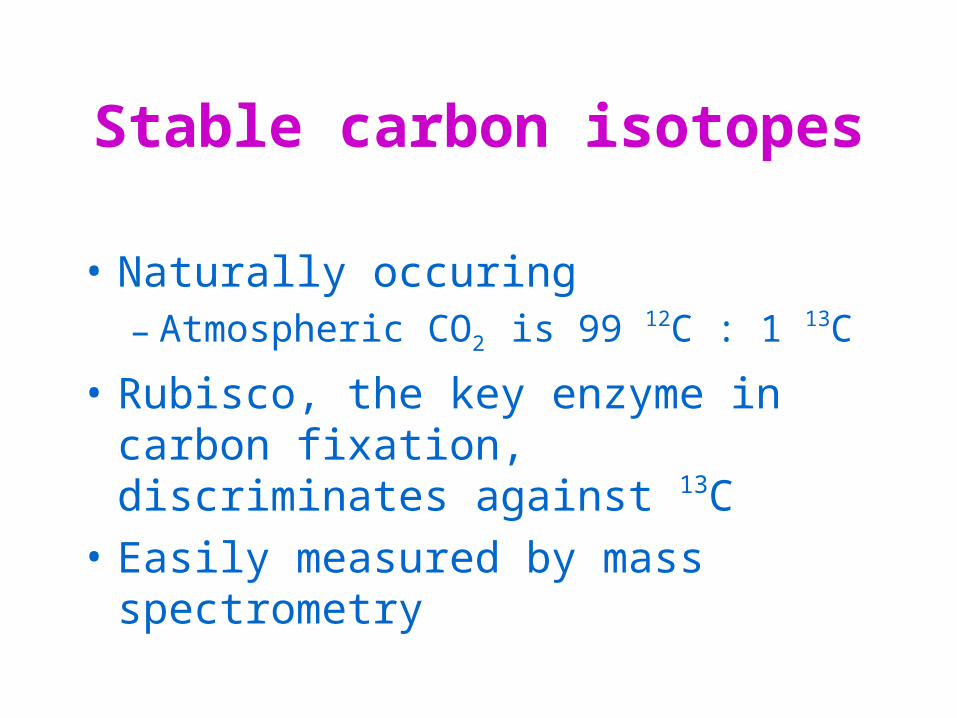
Stable carbon isotopes
• Naturally occuring– Atmospheric CO2 is 99 12C : 1 13C
• Rubisco, the key enzyme in carbon fixation, discriminates against 13C
• Easily measured by mass spectrometry
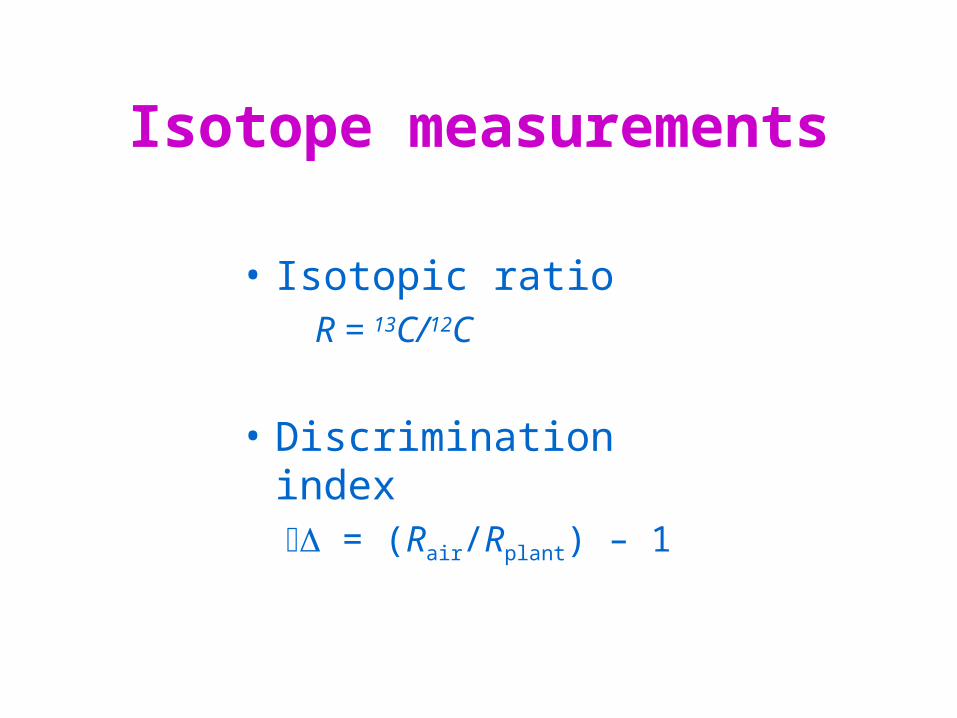
Isotope measurements
• Isotopic ratioR = 13C/12C
• Discrimination index = (Rair/Rplant) – 1
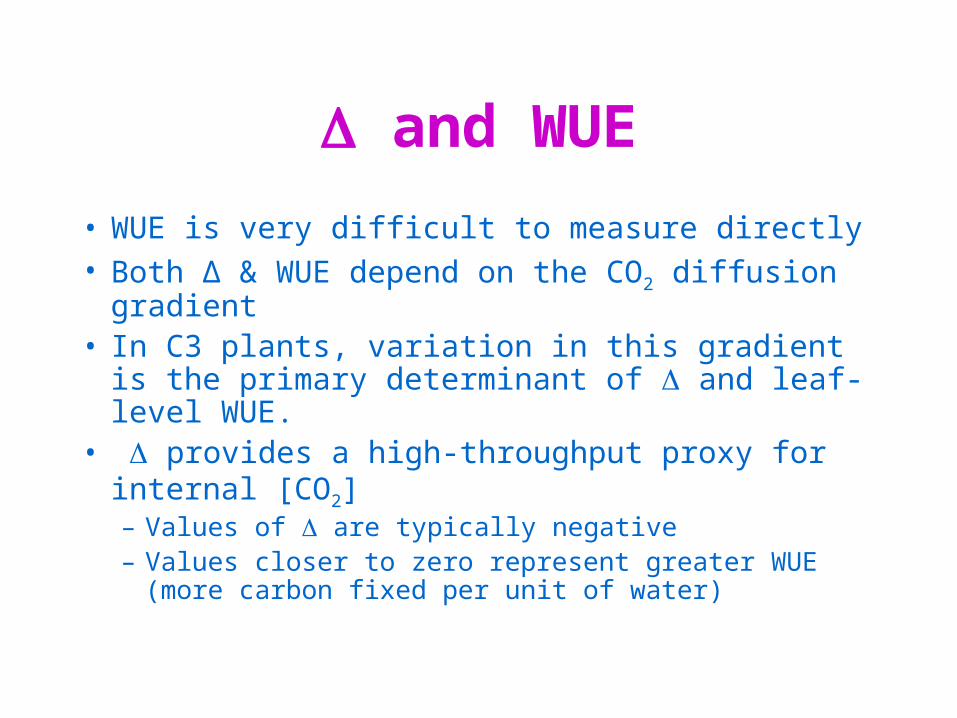
and WUE
• WUE is very difficult to measure directly• Both ∆ & WUE depend on the CO2 diffusion
gradient• In C3 plants, variation in this gradient is the
primary determinant of and leaf-level WUE.• provides a high-throughput proxy for internal
[CO2] – Values of are typically negative– Values closer to zero represent greater WUE (more
carbon fixed per unit of water)
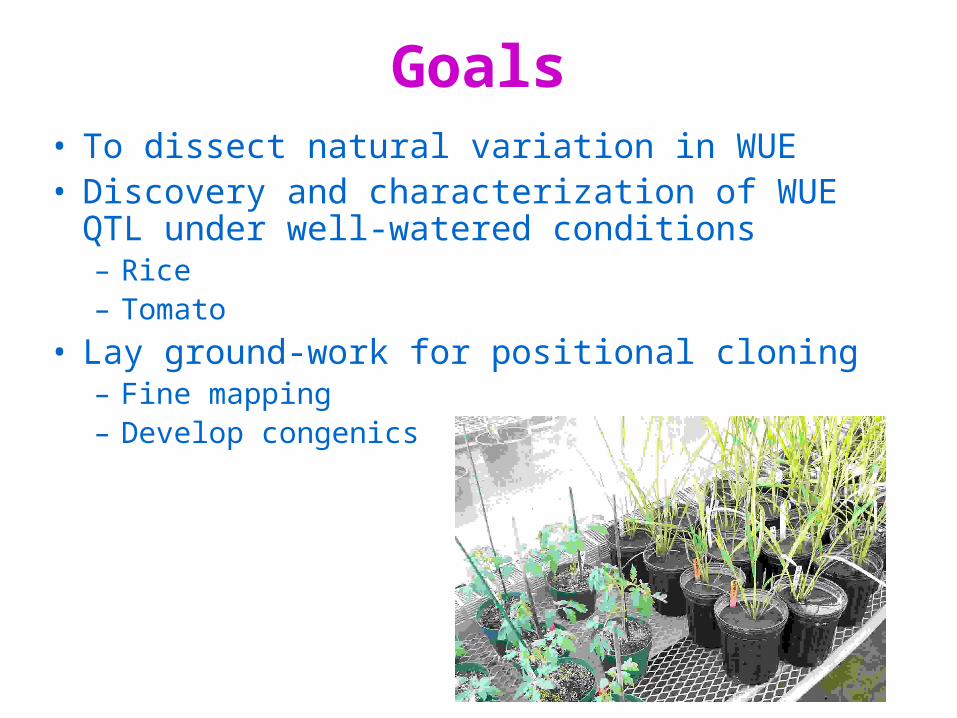
Goals• To dissect natural variation in WUE• Discovery and characterization of WUE QTL
under well-watered conditions – Rice– Tomato
• Lay ground-work for positional cloning– Fine mapping– Develop congenics
The ideal mapping population
• Genetically compatible parents• Phenotypic difference between parents• Transgressive segregation in progeny• Permanent (can be replicated)• Large• Readily available markers• One or both parents have useful genetic
background
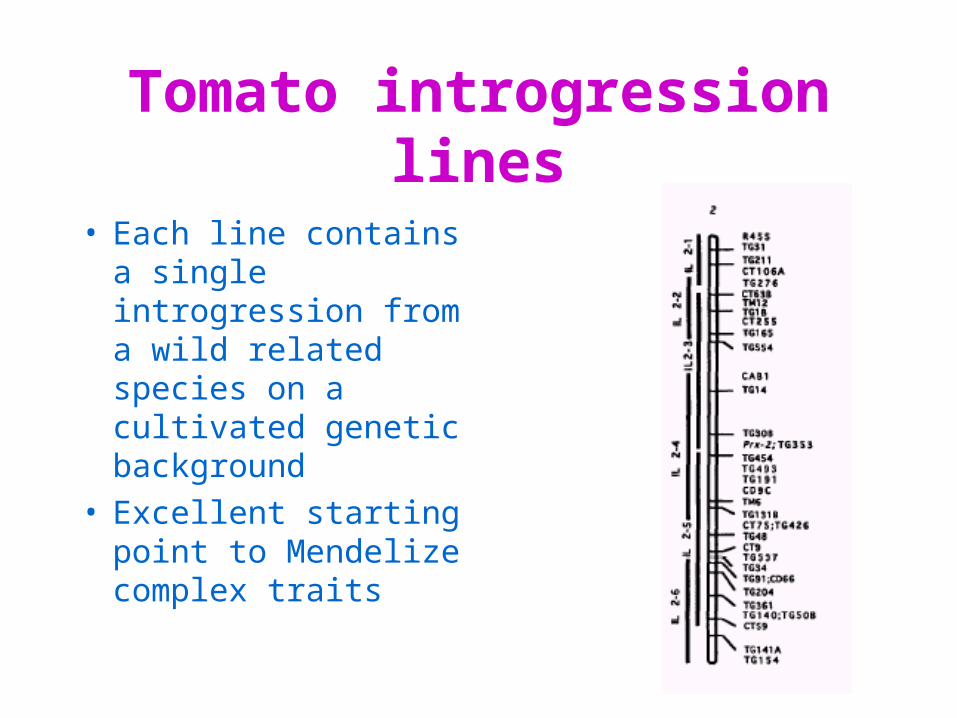
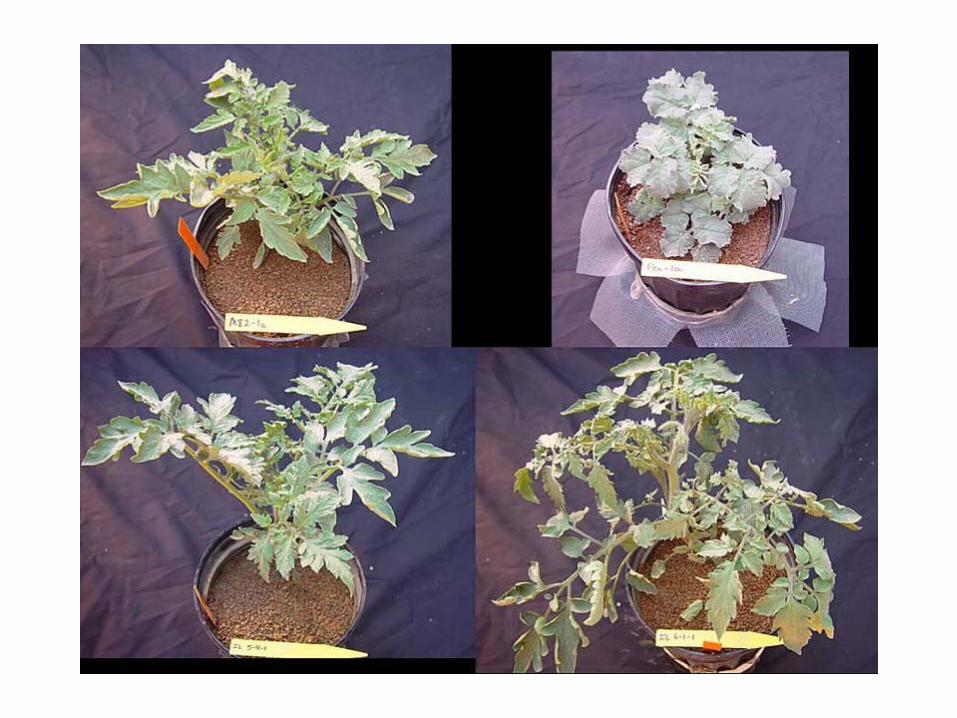
Tomato introgression lines
• Each line contains a single introgression from a wild related species on a cultivated genetic background
• Excellent starting point to Mendelize complex traits
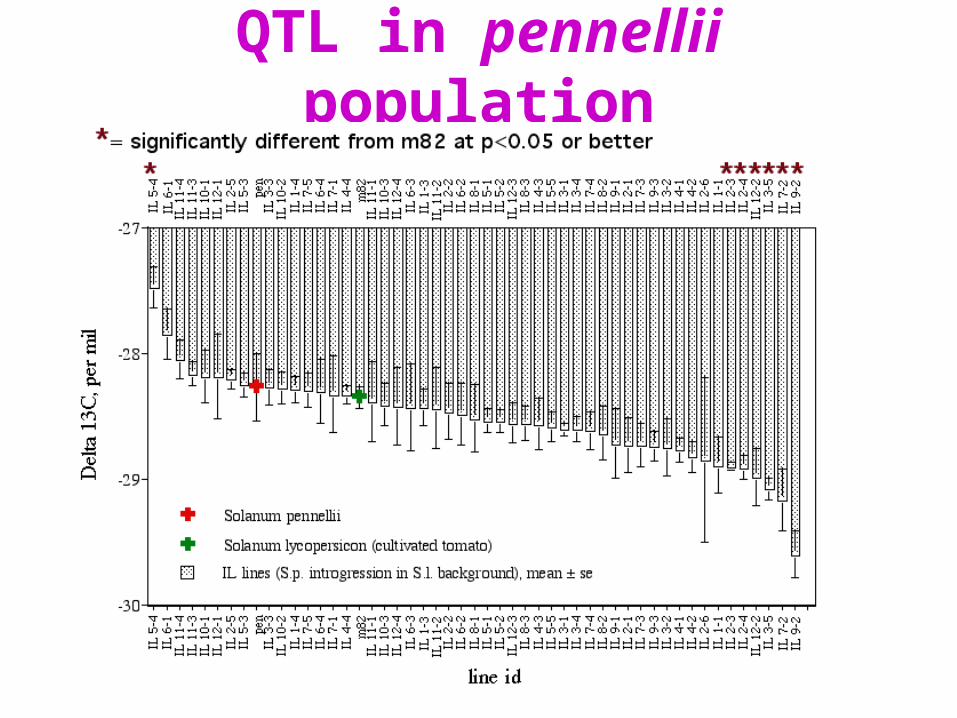
QTL in pennellii population
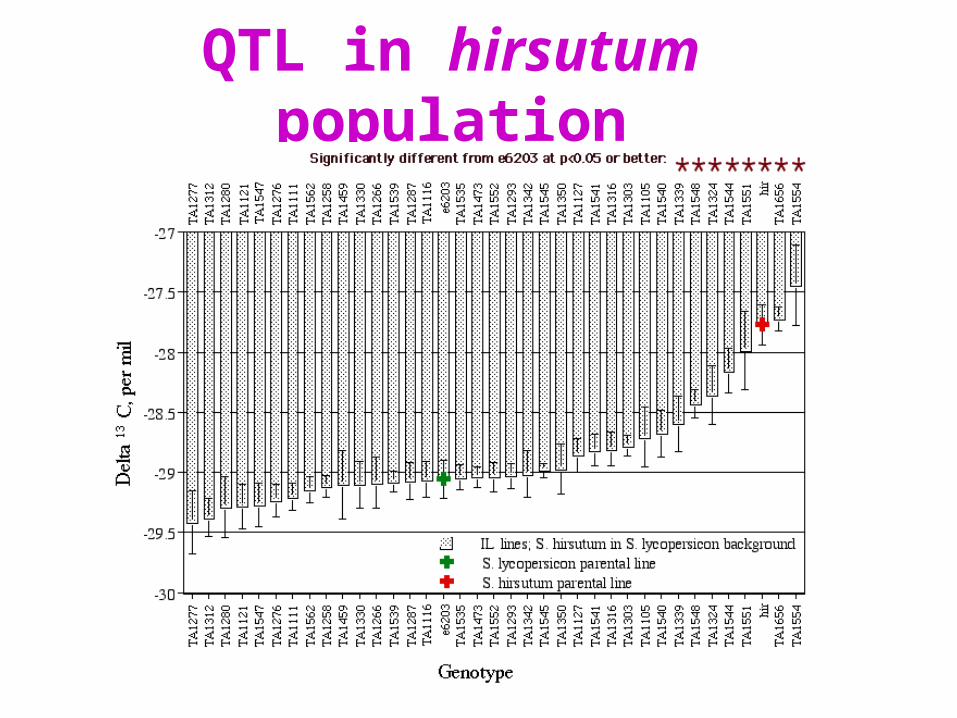
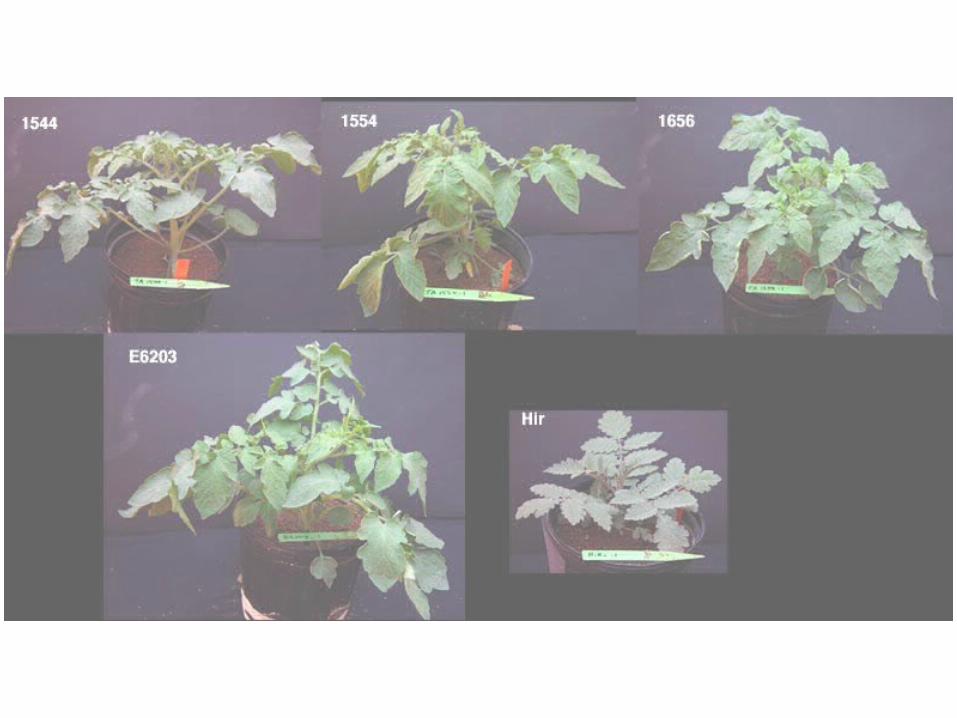
QTL in hirsutum population
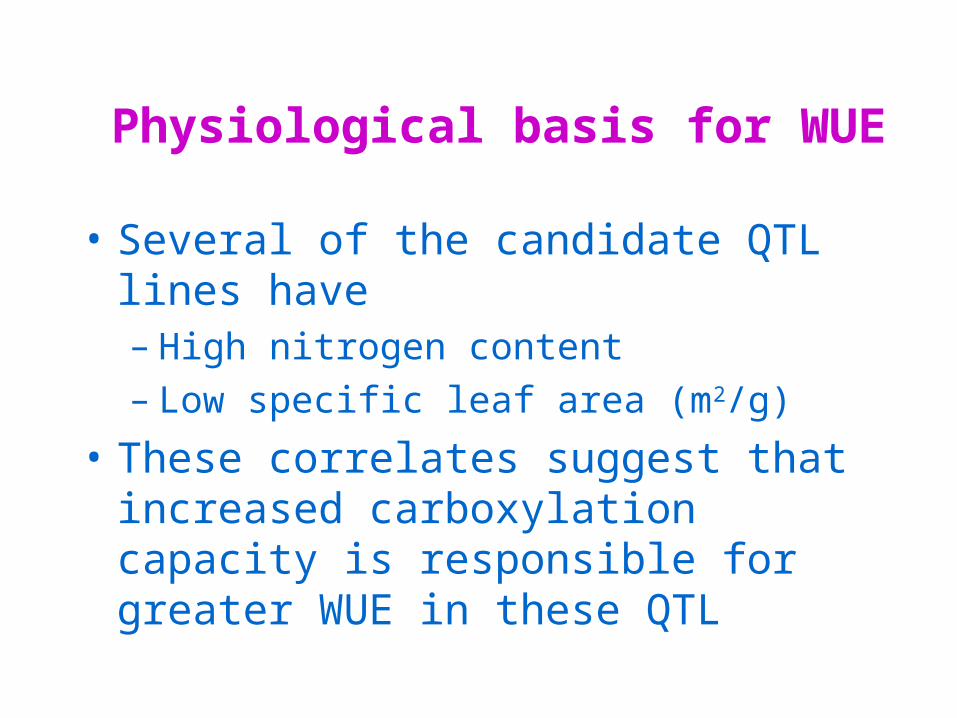
Physiological basis for WUE
• Several of the candidate QTL lines have– High nitrogen content– Low specific leaf area (m2/g)
• These correlates suggest that increased carboxylation capacity is responsible for greater WUE in these QTL
-31.
20
-30.
90
-30.
60
-30.
30
-30.
00
-29.
70
-29.
40
-29.
10
-28.
80
-28.
50
-28.
20
-27.
90
Mor
e
0
2
4
6
8
10
12
14
16
freq
uenc
y
13C Content
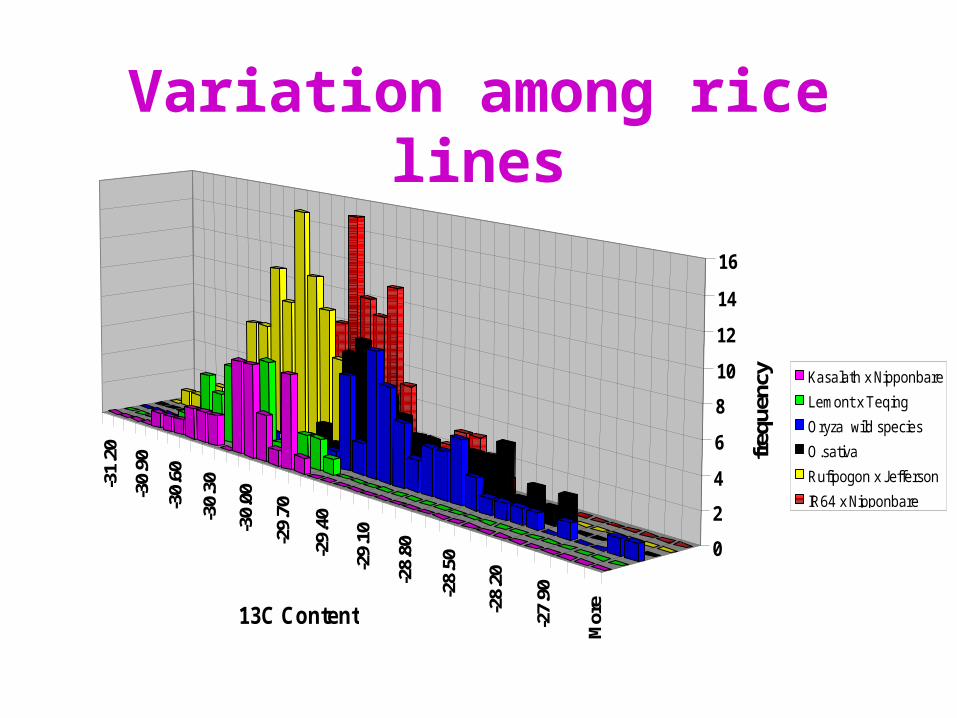
Kasalath x Nipponbare
Lemont x Teqing
Oryza wild species
O.sativa
Rufipogon x Jefferson
IR64 x Nipponbare
Variation among rice lines
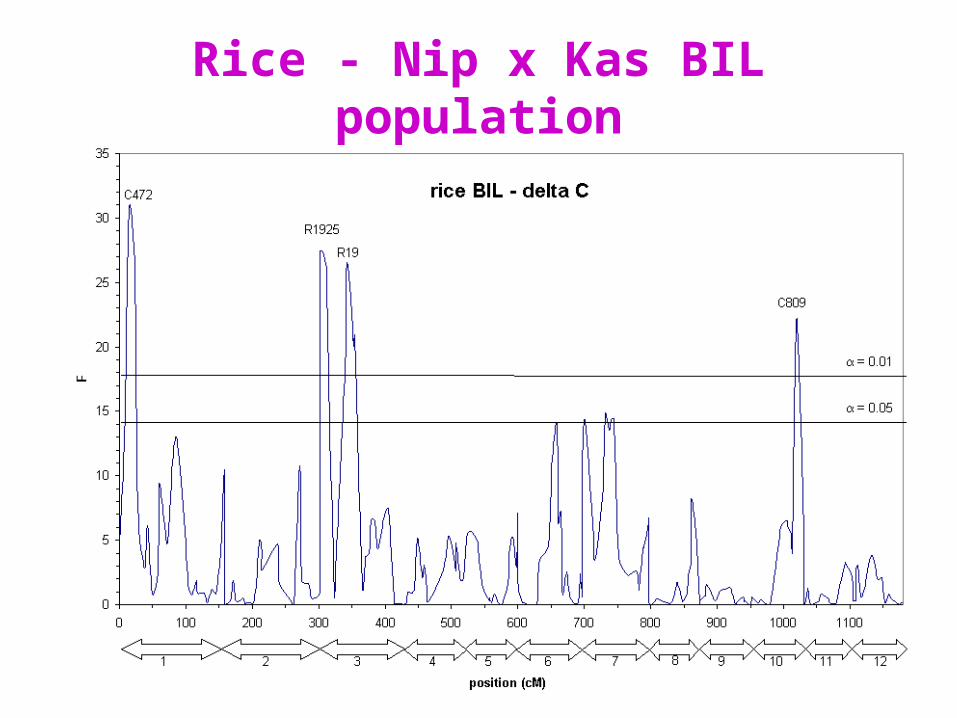
Rice - Nip x Kas BIL population
Mapping physiological traits ain’t so tough as long
as you…• Select the mapping population with care
– Variation can be hidden– Different population types have different strengths
• Pay heed to environmental conditions– Do systematic experimentation– Control variation as much as possible– Find good physiologist to collaborate with!
• Have a good, cheap, fast assay
Acknowledgements
• Transcript mapping– Dan Brown– Steve Tanksley– David Shmoys– Rick Durrett
• QTL mapping– Owen Hoekenga– Leon Kochian– Jonathan Comstock– Susan McCouch– Bjorn Martin– Chuck Tauer
Funding from NSF and USDA