Embed Size (px)
Citation preview

Testimony before Michigan Civil Rights Commission Hearing on Flint Water CrisisPeter J. Hammer
Professor of Law and DirectorDamon J. Keith Center for Civil Rights
Wayne State University Law SchoolJuly 14, 2016

Central question of our time How do systems of racial oppression produce and
reproduce themselves over time?
Claim: This process involves dynamic interaction between “beliefs” and “institutions”
This transformation has moved from
slavery to
Jim Crow segregation to
the “spatial racism” that defines Flint and Genesee County today

Overview: Spatial Racism in Flint and Genesee County 1920’s-1950’s
Racial containment in Floral Park and St. John Street
Near-complete segregation of race, wealth and opportunity
1960’s-1970’s
Containment breached at the edges
Racialized panic and “blockbusting”
Escalating white flight
1980’s-present
Reproduction of spatial racism at the county level
All of Flint is now Floral Park and St. John Street

Implications for Flint Water Crisis Spatial-Structural Racism is the root cause of Flint’s
municipal distress mediated by
Collapse of property market and property tax revenue
Regional division, deindustrialization and the collapse of income tax revenue
Emergency Management was a fatally misguided response to spatial-structural racism
Emergency Management and fiscal austerity created the preconditions for the Flint Water Crisis

Structuralized Racialization (Verb)
Intent
(Express)
Structural
Racism
White
Supremacy
(Privilege)
Unconscious
Bias

Co-Evolution: Beliefs & Institutions
Beliefs
• Religion
• Myths
• Ideology
• Worldviews
Institutions
• Rules
• Norms
• Laws
• Policies

Historic lineage of “spatial racism”
Slavery
Jim Crow
Spatial Racism

What is a “Belief System”? Belief Systems: Provide (1) order and (2) meaning
Functions of Belief Systems
Existential (explain the mystery of life to itself)
Cosmological (explain how the world works)
Sociological (provide rules of social conduct)
Psychological (guide individuals through life cycle)
(Joseph Campbell)
Belief systems are “internal” manifestations of Institutional Matrix

Two common frames (myths?) Time is linear
Race is marginal
What are implications for thought and action? Past injustices can be ignored
Problems of racial justice are not important and will take care of themselves
How does though and action change when Time is cyclical?
Race is central?
Social reproduction of systems of oppression
Belief Systems shape action

Existential (defines meaning through racial exclusion)
Cosmology (necessitates a false science)
Sociological (repressive social orders of domination and hierarchy – slavery and Jim Crow segregation)
Psychological (what does it do to a person to be raised in this environment? Implications for oppressed and oppressor?)
The myth of white supremacy

Claim: The myth of “white supremacy” has been divided into two parts
External: The myth of colorblindness
Internal: The denial of “white privilege”
These beliefs underlie Emergency Management
Time is linear & race is marginal
Where is white supremacy today?

What is an “Institutional Matrix”? Formal and informal rules, norms, laws and
regulations that control social behavior
Rules of the game
Players of the game
Interaction between the Players and the Rules
Institutional Matrix is the “external” manifestation of Belief Systems

Institutional Matrix facilitating spatial racism in Flint Racially restrictive covenants (1920’s-1040’s)
Federal Home Owners Loan Corporation (HOLC) and Federal Housing Authority (FHA) racialized lending practices (redlining, denial of loans to African Americans and African American neighborhoods) (1930’s-1960’s)
Racism in Flint Realty Board (racial steering and other practices)
Physical violence from white homeowners
Police harassment outside St. John and Floral Park

1930’s FHA Redlining map

Andrew R. HighsmithDemolition Means Progress:
Race, Class, and the Deconstruction of the
American Dream in Flint, Michigan
by
Andrew R. Highsmith
A dissertation submitted in partial fulfillment of the
requirements for the degree of
Doctor of Philosophy (History)
in the University of Michigan
2009

Spatial Racism: Floral Park and St. John Street neighborhoods Floral Park
Original home of free persons of color and former slaves
Located south of downtown
St. John Street Near-north side
Surrounded on three sides by the Buick factories, the Flint River and a maze of rail lines
Largest concentration of poverty and highest proportion of African Americans
“St. John is virtually an island in a city . . . there are few ways to get in and out” (Highsmith 54-55)

St. Johns Street

Segregation by the numbers 1940 Census study: Flint is third most segregated city in
the country (Highsmith 37)
1940 and 1947: black population doubles, but builders build only 25 privately financed new homes, all in St. John and Floral Park (Highsmith 140)
1940 and 1955: African-American population triple to 18,000
End of 1960’s: Black population grows to 35,000, but boundaries of segregated neighborhoods remain essentially fixed – “St. John, Floral Park, and other increasingly overcrowded, segregated, and polluted neighborhoods along Saginaw Street.” (Highsmith 326)

Effects of spatial racism Rosa Kimp (Flint Urban League Director) (1955): “We
are living . . . in compressed segregated neighborhoods whose boundaries are well defined . . . this segregated living pattern is forced!” (Highsmith 322)
MCRC Commissioner Burton Levy (1966): “I do not know of even one white community or white section of a city, where an [African American] citizen visiting a realtor chosen at random or a home advertised for sale would get the fair and equitable treatment that is theoretically required by law and this Commission.” (Highsmith 337)

1966 Flint MCRC hearings “Flint Urban League‘s executive director John W. Mack
testified that the city of Flint, with a segregation index of over 94 percent, was the most segregated non-southern city in the United States . . . Mack informed the commission that Flint‘s African-American population, despite comprising over 20 percent of the city‘s total, remained confined to just twelve adjacent census tracts along the north-south and east-west axes of Saginaw Street and Lapeer Road.” (Highsmith 339)
The commission called for a municipal open occupancy law, a comprehensive ordinance prohibiting discrimination in housing (Highsmith 349)

1967-68 Open Housing struggle July 1967 Rebellions in Detroit and Flint forced Flint‘s civic
leaders to reevaluate the merits of a fair housing ordinance August 1967: Flint City Commission reject the fair housing
ordinance (5-4) and triggering the resignation of the City’s first African American Mayor
October 1967: Flint City Commission approved open occupancy legislation (5-4) (after many compromises)
February 1968: Ballot referendum to repeal Fair Hosing Ordinance defeated by razor thin margin of thirty votes
“Rather than uniting the city around a shared commitment to fair housing and civil rights, the open housing referendum highlighted the depth of the city‘s racial fissures.” (Highsmith 361)

Flint’s solution to Spatial Racism? Demolition! 1960 Master Plan: recommended clearance of St. John and
Floral Park neighborhoods (Highsmith 329)
Floral Park => present day 475 freeway interchange
St. John Street => now largely vacant industrial park
Flint’s first segregated public housing program adopted in 1964 to facilitate freeway construction projects to provide subsidized housing for displaced persons
“By funneling St. John and Floral Park residents to recently integrated areas, the city‘s relocation program triggered waves of panic selling in formerly all-white neighborhoods.” (Highsmith 475)

From racialized containment to white flight “Emanating from St. John in the North End and Floral Park
on the south side, the geographic expansion of the city‘s two primary black enclaves tended to occur in a rather linear, block-by-block, neighborhood-by-neighborhood progression. On the south side of the city, migrants from Floral Park
tended to move along an easterly axis towards Lapeer Park, Evergreen Valley, and points eastward.
In the North End, where racial transitions were more rapid and widespread, black population expansion during the 1960s and 1970s followed a northwesterly route towards Flint Park, Civic Park, Manley Village, Forest Park.” (Highsmith 488)

From racialized containment to white flight (cont.) “Between 1970 and 1980, Flint‘s white population declined
sharply, (from 138,065 to 89,470), while the city‘s black population increased from (54,237 to 66,164). By the close of the decade, white flight and black population increases had combined to produce a city that was over 40 percent African American” (Highsmith 497)
“Desperate to escape their changing neighborhoods, many white homeowners moved away before they could sell their houses, leaving behind thousands of empty structures. By 1979, nearly 10 percent of Flint homes were unoccupied.” (Highsmith 498)
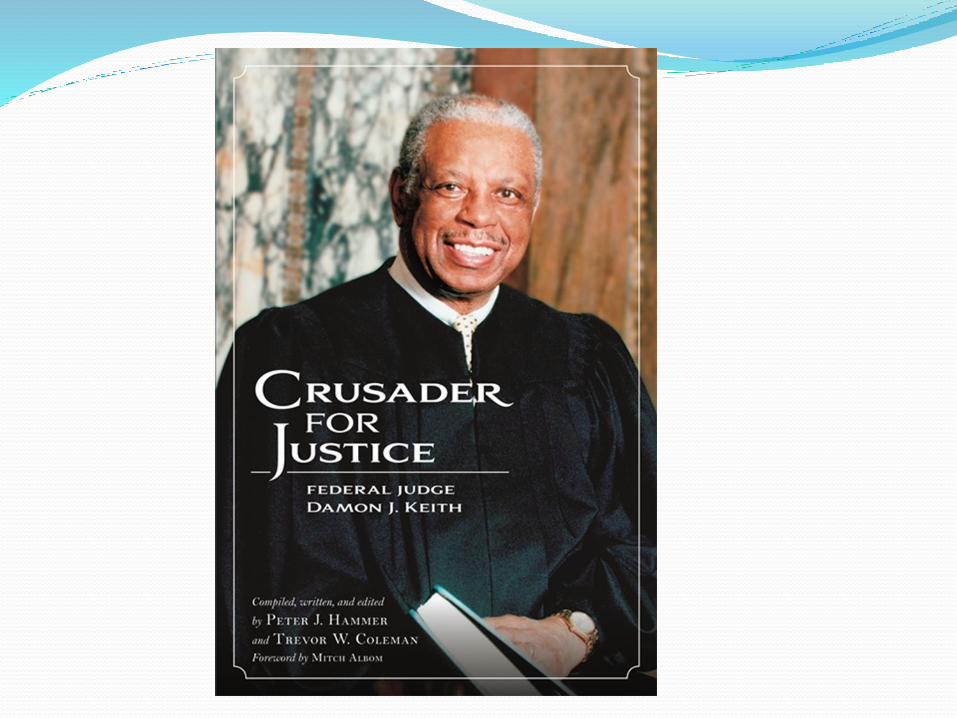
Population density by race, 1950‐1970 (Rick Sadler)

Blockbusting 1950 (blue), 1960 (green) and 1970 (orange) (Sadler)

Percent of vacant properties, 1950‐1990 (Rick Sadler)

Race (2010) and Voting (2015)(Gridwood 2015)

Institutional Matrix facilitating spatial racism in Genesee County Strong Michigan Home Rule Laws – “Inelastic
boundaries” (David Rusk) Difficulties in city annexation
Defensive “incorporation” and Charter Township status
Milliken v Bradley: Prohibition against inter-district school desegregation remedies
Exclusive zoning codes and building regulations preventing African Americans and poor whites from moving to the suburbs
(Institutional mechanisms for the social reproduction of spatial racism)

Divided regionalism Every new GM complex opened in Genesee County between
1940 and 1960 was located outside Flint (Highsmith 222)
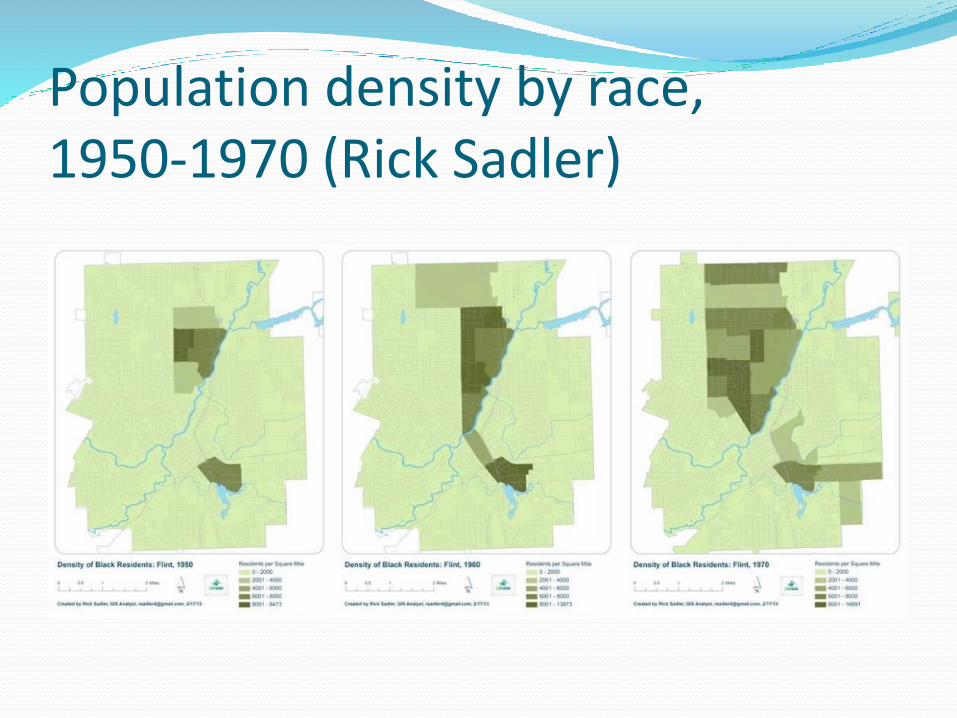
1958: “New Flint” plan sought to unite 26 governmental units within the urbanized area of Genesee County into a single city with a unified school district and a regional planning agency –plan had no suburban support (Highsmith 304-05)
1960’s-70’s: “Following the defeat of the New Flint plan, [Flint] . . . moved to annex suburban factories and shopping centers. In response, voters in the out-county launched several successful incorporation drives . . . The incorporation of Flint‘s inner-ring suburbs left the city landlocked, surrounded by hostile suburban governments, and far removed from the county‘s remaining industrial and commercial establishments.” (Highsmith 530-31)
1958 “New Flint Plan”

Segregation by the numbers 1930: a quarter of Genesee County‘s residents live outside Flint
1960: 60 percent of the county‘s residents live outside Flint
1980-1992: “proportion of white pupils in the Flint Public Schools dropped sharply from 52.5 to 29.6 percent . . . Flint‘s public schools experienced a rapid transition from segregation to resegregation.” (Highsmith 395)
1997: MSU study demonstrated how African Americans were “severely underrepresented in every area of the county except Beecher, Mt. Morris Township, and the city of Flint. At century‘s end, this study argued, white racism, restrictive zoning and building codes, and real estate discrimination continued to play a major role in limiting the housing options of all African Americans, regardless of their class status.” (Highsmith 552)

Job loss 1998-2013 (Henderson and Tanner 2016)

Spatial racism causes municipal distress Between FY 2006 and FY 2012, there were dramatic
reductions in each of Flint’s primary revenue sources
Property tax revenue fell 33% (from $12.5 million to $8.3 million), a sign of a collapsing real estate market
Income tax revenue fell 39% (from $19.7 million to $12 million), a sign of a collapsing jobs market.
State revenue sharing fell a dramatic 61% (from $20 million to $7.9 million), a sign of the state’s abandonment of it older urban areas.
Scorsone & Bateson (2011)

Emergency Management is a racially blind and fiscally flawed response Rather than addressing root causes of spatial-
structural racism and root causes of municipal distress, the State imposed Emergency Management Emergency Management disproportionately targets
African American communities
Emergency Management imposes strict policies of fiscal austerity
Emergency Management established the preconditions of the Flint Water Crisis
Peter J. Hammer, The Flint Water Crisis, KWA and Strategic-Structural Racism (work in progress)

Social reproduction of systems of oppression (beliefs & institutions)
Slavery
Jim Crow
Spatial Racism

Questions?