Embed Size (px)
Citation preview
THEORETICAL AND EXPERIMENTAL VIBRATIONAL AND NMR STUDIES OF α AND β-RDX
By
Ricardo Infante Castillo
A thesis submitted in partial fulfillment of the requirements for the degree of
DOCTOR OF PHILOSOPHY In
Applied Chemistry (Materials)
UNIVERSITY OF PUERTO RICO MAYAGÜEZ CAMPUS
2008 Approved by:
___________________________________ __________ Miguel E. Castro Rosario, Ph.D. Date Member, Graduate Committee
___________________________________ __________ Nairmen Mina Camilde, Ph.D. Date Member, Graduate Committee
___________________________________ __________ Luis A. Rivera Montalvo, Ph.D. Date Member, Graduate Committee
___________________________________ __________ Julio G. Briano Peralta, Ph.D. Date Member, Graduate Committee
___________________________________ __________ Samuel P. Hernández Rivera, Ph.D. Date President, Graduate Committee
___________________________________ __________ Narinder K. Mehta Chopra, Ph.D. Date Representative of Graduate Studies
___________________________________ __________ Francis Patrón Geoghegan, Ph.D. Date Chairperson of the Department of Chemistry

ABSTRACT
Cyclic nitramine hexahydro-1,3,5-trinitro-s-triazine (RDX), is an important
energetic ingredient for propellants and explosives. To understand RDX
explosive nature, the molecular structure needs to be examined in detail. Solid
state RDX exist as three polymorphs: α, β and γ. The α-form is the stable
polymorph at room temperature with Cs symmetry, β-polymorph has a molecular
symmetry of C3v and γ- polymorph may assume one of three orthorhombic
structures: D2h, C2v or D2. Solid state Infrared and Raman spectra of α-RDX and
13C and 15N (ring) enriched isotopomers were recorded and fundamental
frequencies were assigned using isotopic frequency shifts. Changes in vibrational
signals associated with isotopic substitutions provide nearly unambiguous
assignments of vibrational spectra of α-RDX, particularly where exact nature of
vibrational modes had been either vague or contradictory. Assignments of the
vibrational modes for α and β-RDX were made through comparisons between
experimental and density functional calculations results. Calculated frequencies
represent vibrational signatures for gas phase molecules. Hence, experimentally
observed spectra for solid α and β-RDX may differ somewhat from calculated
spectra for RDX AAE and AAA conformers. In the DFT calculation, B3LYP
function tends to overestimate the spectral location of vibrational bands
compared to experimentally observed values. The slight disagreement between
theory and experiment could be a consequence of anharmonicity and of the
ii
general tendency of quantum chemical methods to overestimate force constants
at the equilibrium geometry.
The elusive α→β solid-solid RDX phase transition has been documented
in real time mode using Raman spectroscopy. The thermal conversion of α→β at
atmospheric pressure occurred at 204°C. The vibrational pattern of solid β-RDX
shows that several vibration signals present in α-RDX phase coalesce into
single, doubly degenerate vibrations, possibly because of higher molecular
symmetry.
Calculated nuclear magnetic resonance (NMR) chemical shifts (13C and
15N) are reported for RDX conformers and others cyclic and acyclic nitramines.
Data were compared with experimental solid and solution data, focusing on
agreement of spectral patterns and trends. In order to establish a convenient and
consistent protocol to be employed for confirming experimental 13C and 15N NMR
spectra of nitramine compounds, different combinations of models and basis set
were considered.
iii
RESUMEN
La nitramina cíclica hexahidro-1,3,5-trinitro-s-triazina (RDX) es un
ingrediente energético importante en explosivos e impulsores. Para entender su
naturaleza explosiva la estructura molecular debe examinarse detalladamente.
RDX presenta tres polimorfos sólidos: α, β y γ. La forma α es el polimorfo estable
a temperatura ambiente con simetría Cs; el polimorfo β tiene simetría C3v; el
polimorfo γ puede asumir estructura ortorrómbicas: D2h, C2v o D2. Cambios en
modos vibracionales asociados con sustituciones isotópicas permiten asignar
espectros infrarrojo y Raman de α-RDX casi sin ambigüedad, especialmente
donde la naturaleza exacta de los modos vibracionales ha sido confusa o
contradictoria. Se midieron espectros Infrarrojo y Raman en estado sólido de α-
RDX e isotopómeros enriquecidos 13C y 15N (anillo) y se asignaron frecuencias
fundamentales utilizando desplazamientos isotópicos. Las asignaciones de los
modos vibracionales para α and β-RDX se realizaron por comparaciones de
resultados experimentales y cálculos de densidad funcional. Las frecuencias
calculadas representan señales vibracionales de moléculas en fase gaseosa.
Espectros observados experimentalmente de sólidos α-RDX y β-RDX pueden
diferir parcialmente de espectros calculados para confórmeros AAE y AAA. En
cálculos de teoría de densidad funcional (DFT), la función B3LYP tiende a
sobreestimar la localización de vibraciones fundamentales comparadas con
mediciones experimentales. Desacuerdos entre teoría y experimentos pueden
ser consecuencia de anharmonicidad y la tendencia general de métodos de
iv
química cuántica de sobreestimar constantes de fuerza en geometrías de
equilibrio.
La transición de fase sólido-sólido α-RDX→β-RDX se observó y
documentó en tiempo real utilizando espectroscopia Raman. La conversión
térmica ocurre a 204°C a presión atmosférica. El patrón vibracional de β-RDX
sólido muestra que algunos modos presentes en la fase α-RDX, son vibraciones
doblemente degeneradas, que aparecen como sencillas debido a aumento en
simetría molecular.
Se informaron cálculos desplazamientos químicos de resonancia
magnética nuclear (RMN) para 13C y 15N en confórmeros de RDX y otras
nitraminas cíclicas. Los datos comparados con valores experimentales en sólido
y solución se analizaron con base a patrones y tendencias espectrales. Con el
fin de establecer un protocolo consistente y conveniente para emplearse al
confirmar espectros experimentales RMN de 13C y 15N de nitraminas, se
utilizaron diferentes combinaciones de modelos y bases.
v

© 2008 Ricardo Infante-Castillo
vi

In memory to my grandfather Nabor Infante Puerto. To my kids Manuel Alejandro and Ricardo Andres, for being my inspiration.
To my wife Brenda, for her patience and support. To my parents and sisters for their unconditional support.
vii
ACKNOWLEDGEMENTS
During the development of my doctoral studies at the University of Puerto
Rico at Mayagüez campus, several persons and institutions collaborated directly
and indirectly with my research. I want to start expressing a sincere
acknowledgement to my advisor, Dr. Samuel P. Hernández-Rivera who has
trusted and put his faith in me for the last fourteen years and for his invaluable
scientific support, guidance and friendship.
I would also like to thank my doctoral committee: Dr. Miguel Castro, Dr.
Nairmen Mina, Dr. Luis Rivera, Dr. Julio Briano and Dr. Narinder Mehta for their
time and availability to help me during the progress of this research. I would like
to thank Mr. Julio Cartagena senior member of technical staff at Hewlett-Packard
Caribe, Ltd. for giving me the opportunity of completing the practicum or
internship requirement in Aguadilla facilities. Last but not least, I would like to
thank Alfred P. Sloan Foundation and Center for Chemical Sensors Development
for the financial support.
viii
Table of Contents
List of Symbols and Abbreviations ……………………………………………....xi
List of Figures ……………………………………………………………………….xiii
List of Tables …………………………………………………………………………xv
1 INTRODUCTION
1.1 Motivation …………………………………………………………..…..1
1.2 The polymorphism of RDX .………………………………………….3
1.3 Computational methods …………………………………...………...5
1.3.1 General considerations ………………………………..…….5
1.3.2 Density functional theory ……………………………...…….8
1.3.3 NMR spectral properties ……………………………………12
1.3.4 The calculation of the chemical shielding ………..…….13
1.3.5 Quantum treatment of magnetic shielding ………...…...16
1.3.6 Density functional theory of chemical shifts …..……….20
1.4 Objectives …………………………………………………………….21
2 MATERIALS AND METHODS
2.1 Isotopic studies ……………………………………...……………....23
2.1.1 Labeled RDX’s …………………………………..……………23
2.1.2 Vibrational spectroscopy ……………………………..……23
2.1.3 Computational methods ………………………...………….24
2.2 α→β phase transition ………………………………………………24
2.2.1 Preparation of RDX ……………………………….…………24
2.2.2 Equipment ……………………………………………...……..25
ix
2.2.3 Raman spectroscopy ……………………………..………...25
2.2.4 Computational methods …………………………...……….25
2.3 NMR studies of nitramines …………………………………...…....26
2.3.1 NMR measurements ………………………………………...26
2.3.2 Computational methods ………………………...………….27
3 VIBRATIONAL SPECTRA AND STRUCTURE OF α-RDX AND ITS 13C AND 15N-LABELLED DERIVATIVES: A THEORETICAL AND EXPERIMENTAL STUDY 3.1 Introduction ………………………………………….……………….29
3.2 Results ……………………………………….………………………..31
3.3 Discussion …………………………………………………………....32
4 MONITORING α→β PHASE TRANSITION OF RDX WITH FT-RAMAN SPECTROSCOPY 4.1 Introduction …………………………………………….…………….40
4.2 Results ………………………………………………….……………..42
3.3 Discussion …………………………………………………………....46
5 13C AND 15N NMR CHEMICAL SHIFTS CALCULATIONS ON NITRAMINE SYSTEMS: A COMPARISON OF METHODS AND BASIS SETS 5.1 Introduction ……………………………………………………….….51
5.2 Results …………………………………………………….…………..55
5.3 Discussion …………………………………………………………....56
6 CONCLUSIONS ………………………………………………………..……..66
7 REFERENCES ………………………………………………………………..69
x
List of Symbols and Abbreviations σ Chemical shielding tensor
AAA Axial, axial, axial
AAE Axial, axial, equatorial
ATR Attenuated total reflectance
B° External magnetic field
B3LYP Beck three-parameter Lee-Yang-Parr
cc-PVTZ Correlation consistent polarized valance triple zeta
CSGT Continuous set of gauge transformations
δ Chemical shift tensor
DFT Density functional theory
DMSO Dimethylsulfoxide
EEE Equatorial, equatorial, equatorial
EJ Electron-electron repulsion term
ET Kinetic energy
EV Potential energy
Exc Exchange-correlation term
FT Fourier transform
FTIR Fourier transform infrared
GIAO Gauge including atomic orbital
GPa Giga Pascal
H Halmitonian
HK Hohenberg and Kohn
xi
IGAIM Individual gauges for atoms in molecules
IGLO Individual gauge for localized orbitals
kcal kilocalorie
LCAO Linear combination of atomic orbitals
µ Nuclear moment
MBT Many-body perturbation theory
MP2 Møller-Plesset
nm Nanometers
NMR Nuclear magnetic resonance
RDX Royal demolition explosive
VWN Vosko, Wilk and Nusair local functional
WLS Wavenumber linear scaling method
)(rrρ Electronic density distribution
ψ Wave function
xii
List of Figures
Figures Page 1.1 Equilibrium geometry of RDX molecule in the α-polimorph. Legend:
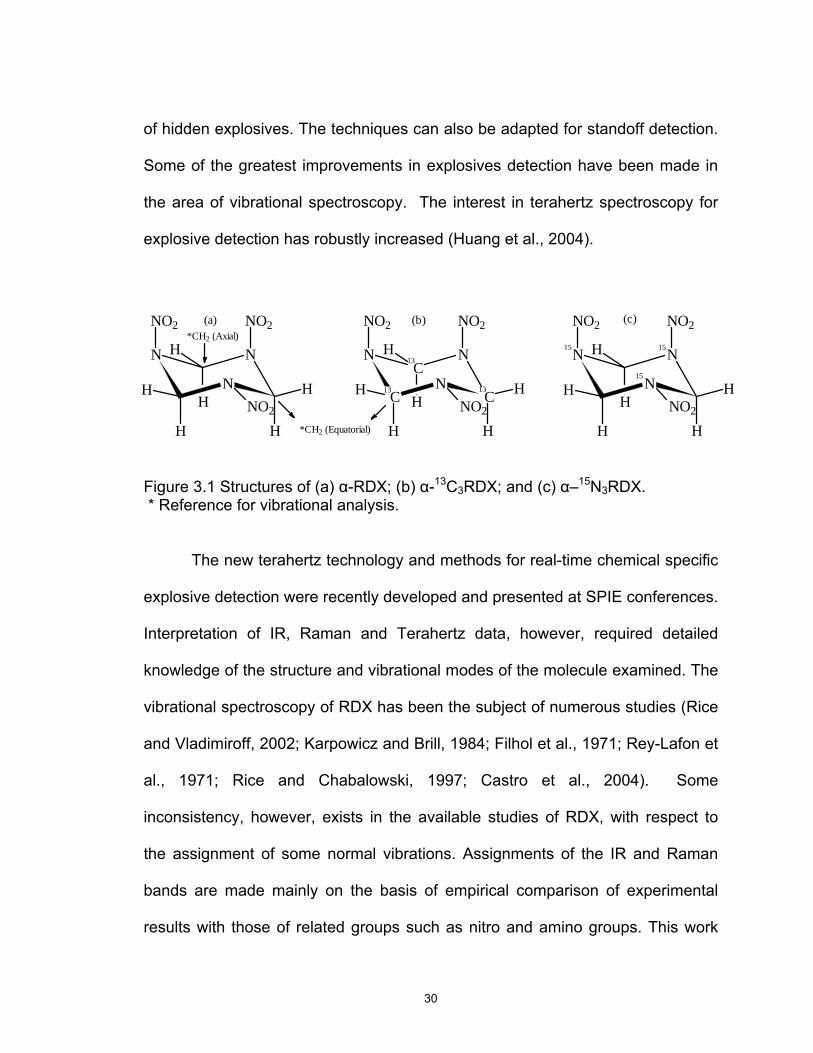
carbon, gray; nitrogen, blue; oxygen, red; hydrogen, white ……………. 3 1.2 Coordinate system used to illustrate the gauge origin dependence of the chemical shift ………………………………………………….............. 19 3.2 Structures of α-RDX (a); α-13C3RDX (b) and α–15N3RDX (c).
* Reference for vibrational analysis ………………………………………. 30 3.2 Experimental FTIR spectra for RDX and isotopically labeled RDX
from 500 to 1600 cm-1; (a) RDX solid (black); (b) 13C3-RDX (red) and (c) 15N3-RDX (blue) …………………………………………………… 33
3.3 Experimental FT-Raman spectra for RDX and isotopically labeled RDX from 2800 to 3200 cm-1. (a) RDX solid (black); (b) 13C3-RDX (red) and (c) 15N3-RDX (blue) .…………………………………………….. 34 3.4 Experimental FT-Raman spectra for RDX and isotopically labeled RDX from 100 to 1700 cm-1. (a) RDX solid (black); (b) 13C3-RDX (red) and (c) 15N3-RDX (blue) …….………………………….... 35 3.5 Theoretical Raman spectra (B3LYP/6-311+G**) for RDX and isotopically labeled RDX from 100 to 1700 cm-1; (a) RDX normal (black); (b) 13C3-RDX (red) and (c) 15N3-RDX (blue) …….……………... 38 4.1 Structures of α-RDX (a), β-RDX (b) and γ-RDX (c) ………………........ 41 4.2 Raman spectral changes upon slow heating α-RDX to 204°C and then cooling to room temperature. An α→β-RDX transition occurs.
Heating: (a) 25°C; (b) 150°C; (c) 202°C; (d) 204°C. Cooling: (e) 202°C; (f) 150°C; (g) 25°C ……………………………………………….………… 44
4.3 Effect of temperature on Raman modes in the frequency range 2900-3200 cm-1. Heating: (a) 25°C; (b) 150°C; (c) 202 °C; (d) 204°C. Cooling: (e) 202°C; (f) 150°C; (g) 25°C ……………………. 45
xiii
4.4 Theoretical and experimental FT-Raman spectra for RDX and conformers from 100 to 1700 cm-1 using B3LYP/6-311++G**: (a) calculated AAE RDX conformer, (b) experimental α-RDX, (c) calculated EEE-RDX conformer, (d) calculated AAA-RDX conformer and (e) experimental β-RDX ………………………................ 49 5.1 The structures of the investigated nitramines. (1) 1-nitro-1-azaethane
(MNA); (2) N,N-dimethylnitramine (DMNA); (3) 1,1-dinitro-1-1-aza- ethane (MDN); (4) N,N-diethylnitroamine (DENA); (5) 1,3-dinitro-1,3- diazacyclobutane (TETRAGEN); (6) 1,1,3-trinitroazetidine (TNAZ): (7) 1,3-dinitro-1,3-diazacyclopentane (CPX); (8) N-nitropiperidine (NP); (9) 1,4-dinitro-1,4-diazacyclohexane (CDNC); (10) Hexahydro-1,3,5- trinitro-s-triazine (RDX)…………………………………………………….. 54
5.2 The linear regression between experimental and theoretical DFT predicted 13C NMR chemical shifts for cyclic and acyclic nitramines using different models and basis set; GIAO/6-311+G(2D,P), GIAO/cc-pVTZ, ▲ CSGT/6-311+G(2D,P), ∆ CSGT/ cc-pVTZ ……… 62 5.3 Mean absolute error for the 13C ( ), 15N-Nitro ( ) and 15N-Amine (▲) NMR calculations at different models using different basis set. The geometry optimizations of the structures utilized as inputs were performed at B3LYP/6-311+G(D,P) theory level ………… 63 5.4 Solid-state CP/MAS 15N NMR spectrum of RDX ……………………….. 64
xiv
List of Tables
Tables Page 3.1 Observed, calculated and assigned frequencies of fundamental modes for α-RDX, 13C3RDX and 15N3RDX isotopomersa ……………………….. 39 4.1 Absolute and relative energies of RDX conformers ……………………… 43 4.2 Observed, calculated and assigned frequencies of fundamental modes for α and β-RDX………………..……………………………………………. 50 5.1 13C and 15N experimental and theoretical chemical shifts for acyclic nitramines at different models and basis set ……………………………… 58 5.2 13C and 15N experimental and theoretical chemical shifts for cyclic nitramines at different models and basis set ……………………………… 59 5.3 Slope (a), intercept (b) and linear correlation coefficient (R2) found
for the different combination of model and basis set for 13C and 15N NMR calculations ………...………………………………………………….. 61
5.4 Mean absolute error (MAE) for the different combination of model and basis set for 13C and 15N NMR calculations …………………………. 61
xv
1 INTRODUCTION
1.1 Motivation
Hexahydro-1,3,5-trinitro-s-triazine or RDX (for Royal Demolition
eXplosive) is one of the most widely employed high explosives (HE) in military
applications today. The extensive use of RDX is associated to its reasonable
insensitivity to external conditions and high performance level. Various
experimental and theoretical techniques have been used in order to determine
the structure of RDX in the gas, solid and liquid states (Rice and Vladimiroff,
2002; Karpowicz and Brill, 1984; Filhol et al., 1971; Rey-Lafon et al., 1971).
Some of the greatest improvements in explosives detection during the last years
have been made in the area of vibrational spectroscopy. Several of these
methods have been shown capable of detecting explosives on surfaces at stand-
off distances, although much work remains to be done to improve selectivity and
differentiation from matrix effects and background clutter.
To understand the explosive nature of RDX, the molecular structure needs
to be examined in detail. RDX is known to exist in four polymorphic phases,
termed α, β, γ and δ (Choi and Prince, 1972; Karpowicz and Brill, 1984; Ciezack
et al., 2007; Dreger and Gupta, 2007). The vibrational spectroscopy of α-RDX
has been the subject of numerous studies (Rice and Chabalowski, 1997; Castro
et al., 2004). However, some inconsistency exists in the available studies of α-
RDX, with respect to the assignment of some normal vibrations. Assignments of
the IR and Raman bands are made mainly on the basis of empirical comparison
1
of experimental results with those of related groups such as nitro and amino
groups. There are only a few vibrations which are not combination modes
involving more than one type of motion. The degree of mixing is evident in the
varying amounts of frequency shifts that are observed. In this sense the effects of
the 13C and 15N substitution on various vibrations are large enough to be useful in
matching calculated and measured frequencies. The infrared and Raman
spectra, in solid state, of α-phase and 13C and 15N (on ring) enriched RDX
analogues were obtained for the study. Quantum chemical calculations have also
been performed, and many vibrational bands have been clearly assigned.
In contrast to the experimental data available for α-phase, there is limited
experimental data on the characterization of the solid β-phase. The RDX
transition between α and β solid phases occurs at 204 °C and is detectable by
changes in the Raman spectra. This temperature-induced phase transition has
not been reported previously and may play an important role in the stages of
explosive initiation.
In addition, it is a generally accepted idea that nitro groups represent the
primary cause of initiation reactivity of polynitro compounds. Recently,
relationships between explosive properties (electric spark sensitivities, detonation
and thermal decomposition) and 15N NMR chemical shifts of nitrogen atoms of
nitramino groups were reported. In the present study, two theoretical models with
different basis set were applied to predict NMR shielding tensor for RDX and
others cyclic and acyclic nitramine systems and were compared with
experimental results.
2
All experimental results were supported by performing density functional
theory (DFT) (Kohn et al., 1996) calculations for energies, geometries, vibrational
frequencies and shieldings constants. The theoretical data have satisfactorily
reproduced experimental results and DFT offers an acceptable trade off between
accuracy and speed.
1.2 The polymorphism of RDX
The RDX molecule consists of the three NO2 groups bonded to the
nitrogen atoms of a triazine ring (see Figure 1.1). The conformers of RDX are
distinguished mainly by the arrangement of nitro groups relative to the rings
atoms of the RDX molecule. In the solid state, RDX is known to exist in four
polymorphs: α, β, γ andδ.
Figure 1.1 Equilibrium geometry of RDX molecule in the α-polymorph. Legend: carbon, gray; nitrogen, blue; oxygen, red; hydrogen, white.
3
The α-polymorph exists at ambient conditions and has an orthorhombic
structure belonging to the Pbca space group with eight molecules per unit cell
(Choi and Prince, 1972). All molecules occupy sites of C1 symmetry, but they
possess Cs pseudo-symmetry with two of the nitro groups in the axial (A) position
with respect to the s-triazine ring and the third in an equatorial (E) position. This
molecular conformation is usually referred to as the chair AAE conformer.
A second polymorph of RDX, labeled β-RDX, is obtained either by
evaporation of boiling solvent containing RDX (Brill et al., 1983), deposition of
RDX from solution on a glass substrate (Castro et al., 2004), or under high
temperature and high pressure (Miller et al., 1991). On the basis of comparison
between the vibrational spectra of the β-polymorph and that of RDX in the gas
phase and in solution, the molecular symmetry for this polymorph was suggested
to be C3v. Further experimental and theoretical studies (Harris and Lammertsma,
1997; Rice and Chabalowski, 1997) for the gas phase showed that the C3v
conformer may assume a structure in which all of the NO2 groups are in axial
positions with respect to the s-triazine ring, forming the so-called AAA
conformation.
The γ-polymorph was observed under high pressure above 3.8 GPa, using
X-ray diffraction (Yoo et al., 1998), by Raman spectroscopy (Baer et al., 1990)
and IR spectroscopy (Goto et al., 2006). Symmetry correlation analyses indicate
that the γ-polymorph may assume one of the three orthorhombic structures: D2h,
C2v or D2. On the basis of the available X-ray data, the D2h factor group is favored
over the other structures, and it is proposed that γ-phase RDX has a space group
4
isomorphous with a point group D2h with eight molecules occupying the C1
symmetry sites, similar to the α-phase.
The γ-RDX phase remains kinetically stable in the pressure range
between 17.8 and 18.9 GPa where prominent discontinuities in the frequency
shifts suggest the existence of another new phase (δ) (Dreger and Gupta, 2007).
The δ-phase has vibrational characteristics that are similar to those of β-RDX,
suggesting the two polymorphs share a related crystal structure.
1.3 Computational Methods
1.3.1 General considerations
It is now possible to describe molecular properties of relative small
molecules with nearly chemical accuracy using theoretical methods due to recent
advances in computational methods and common access to large-scale powerful
computers and software. The application of quantum mechanical calculations to
energetic materials has expanded dramatically. Two major classes of electronic
structure methods have been devised and are frequently used in the literature;
semi-empirical methods and ab initio methods. The development of semi-
empirical methods gained popularity in the 1970s-1980s. These methods use
derived parameters from experimental data to fit into the computations. Semi-
empirical calculations continue to appear in large numbers in the chemical
literature. Since there will always be researchers interested in molecules that
exceed the size of those practically accessible by ab initio methods, semi-
5
empirical levels of molecular orbital theory are certain to continue to be
developed and applied (Cramer, 2004). The fundamental assumption of Hartree-
Fock (HF) theory (Henre et al., 1986), that each electron sees all of the others as
an average field, allows for tremendous progress to be made in carrying out
practical molecular orbital calculations. However, neglecting electron correlation
can have profound chemical consequences when it comes to determining
accurate wave functions and properties derived there from. The development of
semi-empirical theories was motivated in part by the hope that judicious
parameterization efforts could compensate this feature of HF theory. While such
compensation has no rigorous foundation, to the extent that it allows making
accurate chemical predictions, it may have great practical utility. Early developers
of so-called ‘ab initio’ (Latin for ‘from the beginning’) HF theory, however, tended
to be less focused in making short-term predictions, and more focused on long-
term development of a rigorous methodology that would be worth the wait. The
ultimate goal is to solve Schrödinger’s equation, which cannot be solved in a
practical sense for all but the most simple of systems. To that extent, an
enormous amount of effort has been spent on developing mathematical and
computational techniques to reach the HF limit, which means to solve the HF
equations with the equivalent of an infinite basis set, with no additional
approximations. Initially ab initio methods were limited to small systems e.g.
hydrogen. Often, the implementation of these methods takes a significant amount
of computer capabilities and are memory consuming. Thus, only systems with
relatively few atoms can be computed within reasonable time. Properties such as
6
total energies, charge distributions, reaction pathways and vibrational
frequencies are often comparable to experimental observables. With the
development of faster computers, calculations can be made for large systems
and physico-chemical information can be derived.
Since the 1980s, density functional theory (DFT; Kohn et al., 1996) has
emerged as a useful method for quantum chemical studies since it is
computationally less intensive and includes electron correlation effects. For the
‘average’ problem, DFT is the method of choice to achieve a particular level of
accuracy at lowest computational expenditure. With the appearance of each new
functional, there has tended to be at least one paper benchmarking the
performance of that functional on a variety of standard test sets (for energies,
structures, etc.) and there is now a rather large body of data that is somewhat
scattered and disconnected with respect to individual functional performance.
Among modern functionals, B3LYP has proven to be the most popular to date.
Excellent in-depth texts such as “Essentials of Computational Chemistry” by
Cramer (Cramer, 2004) provide commendable coverage on the strengths and
weaknesses of DFT. Some of the experimental results presented in this thesis
have an important theoretical support by means of DFT calculations. The next
section is devoted to briefly introduce the basic concepts, we have used
throughout the present work.
7
1.3.2 Density functional theory (DFT)
The Density Functional Theory (DFT) approach is based upon a strategy
of modeling electron correlation via general functionals of the electron density. A
functional is a function whose argument definition is itself a function: in other
words, a function of a function. DFT is primarily a theory of electronic ground
state structure, couched in terms of the electronic density distribution . DFT
is an alternative and complementary, approach to the traditional methods of
quantum chemistry which are couched in terms of the many-electron wave
function . The starting point of DFT is the rigorous, simple lemma of
Hohenberg and Kohn (H-K; Hohenberg and Kohn, 1964). In the language of
DFT, the ground state properties of an interacting electron gas could be
calculated from the electron density , independent of the external potential.
The electron density distribution is composed of three spatial variables. The
electronic state, the energy and all the electronic properties of a system could be
uniquely described in terms of this as shown in equation 1.1
)(rrρ
)....( 1 NrrΨ
)(rrρ
)(rrρ
)(rrρ
nn xdxddsxxxNr rrrrrr .....,.....,(....)( 21
2
21∫ ∫= ψρ (1.1)
)(rrρ determines the probability of finding any of the N electrons within the
volume element (with an arbitrary spin). The dependence on total number of
electrons immediately suggests that a useful physical observable would be the
1rdr
8
electron density ρ, since, integrated over all space, it gives the total number of
electrons N.
The basic properties of the electron density are:
0)( =∞→rrρ (1.2)
∫ = Nrdr rr)(ρ (1.3)
Moreover, because the nuclei are effectively point charges, it should be obvious
that their positions correspond to local maxima in the electron density, so the
only issue left to completely specify the Hamiltonian is the assignment of nuclear
atomic numbers. It can be shown that this information is also available from the
density, since for each nucleus A located at an electron density maximum rA,
)(2)(
0AA
rAA
A rZrr
ρρ
−=∂
∂
=
(1.4)
where Z is the atomic number of A, rA is the radial distance from A, and ρ is the
spherically averaged density. The arguments above do not provide any simpler
formalism for finding the energy. They simply indicate that given a known density,
one could solve the Schrödinger equation form the Hamiltonian operator and
determine the wave functions and energy eigenvalues. As previously noted, to
establish a dependence of the energy on the density, and in the Hohenberg–
Kohn (H-K) theorem it is the ground-state density that is employed. It is sufficient
to show that this density determines the Hamiltonian operator and thence,
implicitly, all properties determined by H. The Hohenberg-Kohn theorem basically
establishes that there is one–to-one mapping between the ground state
electronic density and the ground state wave function. Therefore, the calculation
9
of the density can be replaced by a calculation of the wave function which
defines the system. The Hohenberg-Kohn theorem demonstrated the existence
of a unique functional which determines the ground state energy and density
exactly but does not provide the form of this functional. The H-K theorem does
not tell us what the true total energy functional is; only that it exists.
The most common implementation of density functional theory is through
the Kohn-Sham method (Kohn W. and Sham L. J. 1965), which maps the
properties of the system onto the properties of a system containing non-
interacting electrons under a different potential. In the Kohn-Sham equations, the
interaction among electrons is simulated via an effective potential due to the
surrounding electrons. Within the framework of Kohn-Sham method, the
approximate functionals employed by the current DFT methods partitions the
electronic energy into several terms:
(1.5) XCJVT EEEEE +++=
where is the kinetic energy term, includes terms describing the potential
energy of the nuclear-electron attraction and of the repulsion between pairs of
nuclei, is the electron-electron repulsion term and is the exchange-
correlation term and includes the remaining part of the electron-electron
interactions. All terms, except the nuclear-nuclear repulsion, are functions of
TE VE
JE XCE
ρ ,
the electron density. The energy sum: ET + EV + EJ, corresponds to the classical
energy of the charge distribution ρ . The EXC term is determined entirely by the
electron density and is usually divided into separate parts, referred to as the
10
exchange and correlation parts, but actually corresponding to same-spin and
mixed-spin interactions respectively.
(1.6) )()()( ρρρ CXXC EEE +=
All the three terms are again functionals of the electron density, and
functionals defining the two components on the right side of equation 1.6 are
termed exchange functionals and correlation functionals, respectively. Since no
exact functionals for exchange and correlation are known (except for the free
electron gas) some approximations have to be included in order to calculate
physical quantities. Basically, two approximations are used in DFT: the local-
density approximation (LDA) (Becke, 1993) and generalized gradient
approximation (GGA). In physics, the most widely used approximation is the
LDA, where the functional depends only on the density at the coordinate where
the functional is evaluated. The GGA functionals are still local, but also take into
account the gradient of the density at the same coordinate. Difficulties in
expressing the exchange part of the energy can be relieved by including a
component of the exact exchange energy calculated from Hartree-Fock theory.
Functionals of this type are known as hybrid functionals. Of all modern hybrid
functionals, B3LYP has proven the most popular today. Its overall performance is
remarkably good for geometries and frequency calculations and is not an
expensive method.
The exchange-correlation for a hybrid functional is usually a linear
combination of the Hartree-Fock exchange ( ) and some combination of HFXE
11
exchange and correlation functionals. The parameters relating the amount of
each functional can be arbitrarily assigned and is usually fitted to reproduce well
some set of observables (bond lengths, band gaps, etc). The popular, three
parameters Becke B3LYP exchange-correlation functional (Becke, 1988; Lee-
Yang-Parr, 1988; Kim et al., 1994; Stephens et al., 1994) is defined by:
)()()(03 LDA
XGCAXC
LDAX
GCAXX
LDAX
HFX
LDAXC
LYPBXC EEaEEaEEaEE −+−+−+= ( 1.7)
where , and 20.00 =a 72.0=Xa 81.0=Ca are the three empirical parameters;
and are the generalized gradient approximation formulated with the
Becke 88 exchange functional (Becke, 1988) and the correlation functional of
Lee, Yang and Parr ( Lee C. et al., 1988), and is the Vosko, Wilk and
Nusair (VWN) local functional (Vosko, et al., 1980).
GGAXE GGA
CE
LDACE
The formal scaling behavior of DFT has already been noted to be in
principle no worse than N 3, where N is the number of basis functions used to
represent the Kohn-Sham orbitals. This is better than HF by a factor of N, and
substantially better than other methods that, like DFT, also include electron
correlation.
1.3.3 NMR spectral properties
Nuclear magnetic resonance (NMR) is probably the most widely applied
spectroscopic technique in modern chemical research. Its high sensitivity and the
mild conditions required for its application render it peerless for structure
determination and kinetics measurements in many instances. As an experimental
12
technique, its use is extraordinarily widespread. Until quite recently, however,
theoretical prediction of NMR spectral properties significantly lagged
experimental work. The ultimate factor slowing theoretical work has been simply
that it is more difficult to model the interactions of a wave function with a
magnetic field than it is to model interactions with an electric field (Facceli, 2004).
The inclusion of a magnetic field B in the Hamiltonian is achieved by the minimal
substitution which includes the vector potential A. The vector potential A uniquely
determines the magnetic field B through B = rot A. However, there is no unique
choice of the vector potential A for a given magnetic field B. The freedom in the
choice of the gauge origin should have no consequences since all physical
quantities are requested to be gauge-invariant. However, gauge-invariance holds
only for exact solutions to the Schrödinger equation and cannot be enforced for
approximations wavefunctions. It turns out that the source of the gauge origin
problem in quantum chemistry is the finite basis set representation of the
wavefunctions. Nevertheless, significant progress has been made over the last
decade, particularly with respect to DFT, and calculation of chemical shifts is
becoming much more of a routine than had previously been. This section begins
with a very brief summary of some of the technical issues associated with NMR
spectral calculations. Subsequent subsections address the various utilities of
modern methods for predicting chemical shifts.
1.3.4 The calculation of the chemical shielding.
13
A nucleus with a non-zero nuclear magnetic moment µ provides an
excellent probe of the magnetic fields inside a sample. Exposed to a static
homogeneous magnetic field, the nuclear magnetic moment will precess around
the direction of the magnetic field with a frequency directly proportional to the
magnitude of the magnetic field. The frequency and thus the magnetic field at the
nuclear site can be detected by nuclear magnetic resonance (NMR) experiments.
This introduced magnetic field, B at the nucleus A, is opposite in the direction
to the applied external magnetic field and is proportional to the magnitude of B
1A
0,
according to Lenz Law. So the magnitude of the magnitude of the magnetic field
at nucleus A can be expressed as
(1.8) )1(010AAA BBBB σ−=−=
where the proportionality constant Aσ is called the shielding constant for nucleus
A. The ability of the applied field to induce a current in the molecule, and hence
the strength of the resulting local magnetic field experienced by nucleus,
depends on the details of the electronic structure near magnetic nucleus of
interest, so nuclei in different chemical groups have different shielding constants.
For that reason NMR spectroscopy has become a standard tool to characterize
chemically different sites of an ion in a molecule or in a crystal.
There is considerable confusion in the literature about the use of the
terms: “chemical shift” and “chemical shielding” (Facceli, 2004). The chemical
shielding is the tensor that describes the relative change in the local magnetic
field at the nucleus position relative to external magnetic field. In general,
14
shielding effects are associated with diamagnetic effects from spherical charge
distribution, whereas de-shielding effects are associated with a nonspherical
charge distribution originating from p or higher angular momentum electrons. In
practice, NMR experiments do not measure the chemical shielding directly;
instead, the common practice is to measure the chemical shifts as the change of
resonance frequency of a nucleus relative to a given standard. The formal
relation between the chemical shift and chemical shielding tensors is given by
σσδ −= iso1 (1.9)
where δ is the chemical shift tensor, σ is the chemical shielding tensor, 1 is the
unit matrix, and isoσ is the isotropic value or trace of the chemical shielding of the
standard reference used in NMR experiments.
There are several scientific reasons to pursue research efforts in
calculating chemical shielding, but one of the most common applications is
associated to the chemical shielding dependence on the molecular geometry and
specific chemical environment. A common difficulty in the calculation of magnetic
properties is that the usual wave functions do not guarantee gauge invariance,
i.e., in the simplest case, the results may depend on the position of the molecule
in the Cartesian coordinate frame. The physical reason for this is that a magnetic
field, say in the z direction, leads to a perturbation in the momenta, which twists
the molecular orbitals around the z axis in the imaginary xy plane. If an atom is
situated on the z axis, its basis set is close under this rotation, and it can be
described equally well both unperturbed state and in the presence of the
15
perturbation. However, for an atom far from the z axis, the rotation of the orbitals
can only be described by using high angular momentum basis functions, which
are not normally included in the basis set.
More satisfying solutions to the gauge-origin problem have been offered
by approaches which introduce local gauge origins to define the vector potential;
an idea which originates in London’s study of the molecular diamagnetism more
than 60 years ago. Within quantum chemical NMR shift calculation, this idea was
first adopted by Ditchfield in his gauge including atomic orbital (GIAO) method
(Ditchfield, 1974), in which each atomic orbital has its own local gauge origin
placed on its center. The most common methods, in addition to the GIAO’s
approach, are IGLO, individual gauge for localized orbitals (Schindler M. and
Kutzelning, 1982); LORG, localized orbitals local origin (Bouman and Hansen,
1989), IGAIM, individual gauges for atoms in molecules (Keith and Bader, 1992)
and CSGT, continuous set of gauge transformation (Keith and Bader, 1993). The
GIAO method is generally preferred in the modern literature because it is free of
localization artifacts and appears to be less sensitive to basis set quality (Gabor
and Pulay, 2003).
1.3.5 Quantum treatment of magnetic shielding
The interaction of an external magnetic field 0B with a nuclear magnetic
moment Aµ inside a molecule, as observed in nuclear magnetic resonance, can
be described by the Zeeman energy change,
16
BE A ⋅−=∆ µ (1.10)
where is effective magnetic field felt by the nuclear moment. This effective
magnetic field arises because the electrons are influenced by the external
magnetic field and give rise to an induced magnetic field at the site of nucleus
B
A ,
(1.11) 01j
Aiji BB σ−=
where is called the shielding tensor of nucleusAijσ A .
(1.12) 00 BBEA
AA ⋅⋅+⋅−=∆∧
σµµ
where the first term describes the direct interaction between the external
magnetic field and the nuclear moment and the second term describes the
electron coupled interaction which may be written as a second-order energy
change,
0
0
02
0
),(
==⎥⎥⎦
⎤
⎢⎢⎣
⎡
∂∂∂
=BAji
AAij
AB
BE
µµ
µσ (1.13)
arising from a consideration of the energy of a molecule in the presence of an
external magnetic field and a perturbing nuclear moment Aµ .
In the Hartree-Fock method, the electronic energy of a molecule in the presence
of the external magnetic field 0B and the nuclear moment Aµ is given as the
expectation value of the appropriate Hamiltonian operator using a single
determinant wave function. In terms of the doubly occupied molecular iΨ , this
expression is
17
ii
N
iiiA ghBE ψψψψµ
∧
=
∧
∑ +=2/
1
0 2),( (1.14)
where the one-electron Hamiltonian operator, is ∧
h
∑−⎥⎦⎤
⎢⎣⎡ +∇−=
∧ atoms
k k
k
rZe
Acei
mh
22
21
h (1.15)
and is the two-electron Hamiltonian operator. In equation 1.15, the vector
potential A is
∧
g
30
21
A
AA
rr
rBA×
+×=µ
(1.16)
and is due to the uniform external magnetic field 0B and the magnetic moment of
nucleus A, i.e. Aµ . The number of electrons is and is the charge of the kN kZ th
nucleus. The vectors r and are the distance vectors of the coordinate system
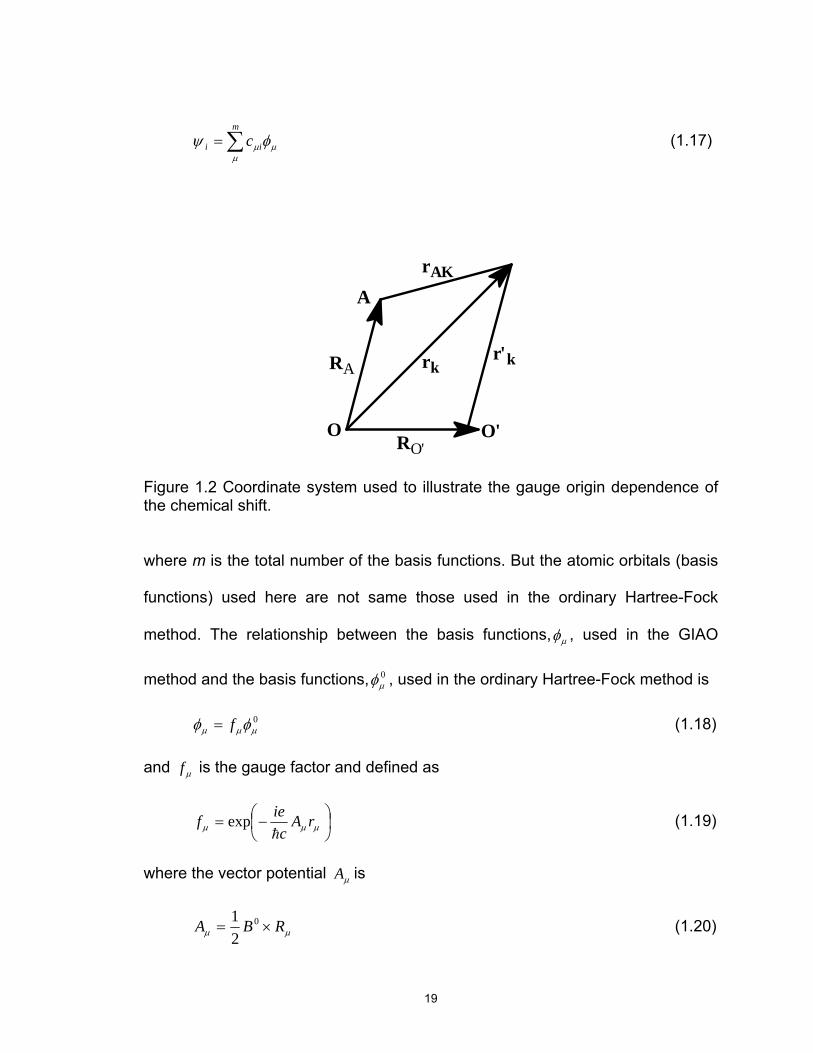
and nucleus , respectively. Figure 1.2 shows a coordinate system used to
illustrate the gauge origin dependence of the chemical shielding. O is the origin
of coordinates, O’ is the new origin, R
kr
k
O’ is the position of the new origin of
coordinates with respect to original one, RA is the position of the nucleus A, rk is
the position of the electron with respect to O, rAk is the position of the electron
with respect to the nucleus A, and r’k is the position of the electron relative to the
new origin of coordinates O’.
With GIAO, the molecular orbitals, iψ , are still expressed as a linear
combination of atomic orbitals (LCAO), , as in the Hartree-Fock method, that is,
0µφ
18
µµ
µ φψ ∑=m
ii c (1.17)
O O'RO'
A
RA
rAK
rkr'k
Figure 1.2 Coordinate system used to illustrate the gauge origin dependence of the chemical shift.
where m is the total number of the basis functions. But the atomic orbitals (basis
functions) used here are not same those used in the ordinary Hartree-Fock
method. The relationship between the basis functions, µφ , used in the GIAO
method and the basis functions, , used in the ordinary Hartree-Fock method is 0µφ
(1.18) 0µµµ φφ f=
and is the gauge factor and defined as µf
⎟⎠⎞
⎜⎝⎛−= µµµ rA
ciefh
exp (1.19)
where the vector potential is µA
µµ RBA ×= 0
21 (1.20)
19
and a new vector that represents the distance vector from the arbitrary origin
of the molecular coordinate system to the atom on which the basis function
νR
µφ is
located. Now the total chemical shielding is invariant under changes of the origin
of coordinates. In the language of electromagnetic interactions this is equivalent
to say that chemical shielding tensor is invariant under gauge transformation
which preserve . 0=⋅∇ A
1.3.6 Density functional theory of chemical shifts
The methods for calculating chemical shieldings that include contributions
of the electronic correlation into many-body perturbation theory (MBPT) and
coupled-cluster methods do not provide a practical alternative to calculate
chemical shieldings because they scale as N5 to N7, depending on the
approximation, with the number of electrons N in the molecule. Using DFT
theory, which scales as N2, makes possible to calculate chemical shieldings in
molecular system of practical interest including electronic correlation effects.
Two important observations derived from results of calculated chemical
shifts for different exchange correlation functionals (Cheeseman, et al. 1996): the
calculations are not sensitive to the exchange-correlation functional used, except
for the LDA approximation and DFT methods recover a significant portion of the
electronic correlation effect and provide a viable alternative to calculate chemical
shifts with accuracies close to those obtained with the much more
20
computationally expensive Møller-Plesset 2 method (MP2; Gauss and Stanton,
2002).
1.4 Objectives
Characteristics of high explosives, such as performance, sensitivity and
stability, are determined by molecular level properties. These properties have
implications for safety and handling as well as the practical use of these
explosives materials. Vibrational spectroscopy (IR and Raman) and NMR
techniques are widely used to structural and dynamic aspects of molecular
systems. Some of the greatest improvements in explosive detection during the
past five years have been made in the area of vibrational spectroscopy. This
study is part of a comprehensive effort to investigate the molecular conformations
of RDX using vibrational spectroscopy and NMR methods. The combination of
quantum calculations of chemical shifts and harmonic vibrations with NMR and
IR/Raman parameters, respectively, has become an accepted technique to
gather insight into molecular structure. Therefore, an understanding of RDX
polymorphisms is required for the proper characterization of the reactive behavior
of explosive molecular solids. The purpose of our work was fourfold:
1) To assign the fundamental vibration frequencies and to elucidate both
force field and structure of α-RDX molecule on the basis of IR and Raman
spectra , isotope labeling, and ab initio force field calculations.
21
2) To record 1H, 13C and 15N nuclear magnetic resonance (NMR) spectra in
solution and solid state for the RDX and predict the nuclear magnetic
resonance (NMR) shielding constants using the gauge independent
atomic orbital (GIAO) approach at DFT approach for RDX conformers. We
have also extended these studies to other cyclic and acyclic nitramines.
3) To follow temperature-induced structural transformation of α-RDX using
Raman spectroscopy and to examine changes in vibrational modes
associated with phases transitions.
4) To correlate the experimental and theoretical results and to determine the
importance of the qualitative agreement between the experimental and
calculated values of the chemical shifts and vibrational analysis in order to
enhance the understanding of the molecular structure of RDX conformers.
22
2 MATERIALS AND METHODS
2.1 Isotopic studies
2.1.1 Labeled RDXs
RDX standards were obtained as 1 mg/mL solution in acetonitrile from
Supelco® (Sigma-Aldrich Chemical Co., Milwaukee, WI), 13C (99%) enriched
RDX was obtained from Cambridge Isotope Laboratories, Inc. (Andover, MA) as
1 mg/mL acetonitrile solution and 15N (99%) enriched RDX was obtained from
SRI International as solid material. Acetonitrile (Sigma-Aldrich) was allowed to
evaporate at room temperature after the deposition on metallic slide.
2.1.2 Vibrational spectroscopy
Fourier transform infrared (FTIR) spectra were obtained by attenuated
total reflection (ATR) method in a Nexus 8700, Thermo Nicolet FTIR
spectrometer in the range of 400-4000 cm-1. Samples were lightly ground in
preparation for placement on the ATR stage. Raman spectra were measured
using a commercial Renishaw RM2000 Raman microspectrometer with
vibrational and white light imaging capabilities. The 514.5 nm line of a Coherent
INNOVA 308 Ar+ ion laser system was used as the excitation source. Dispersive
Raman equipment was operated in confocal mode microscopy. Spectrometers
were equipped with polarization analyzers and de-scramblers. All of
measurements were taken at room temperature (ca. 20 °C).
23
2.1.3 Computational methods
Ab initio density functional theory (DFT) with the B3LYP hybrid functional
calculations using the Gaussian 03-W program package (Frisch et al., 2003)
were carried out for the α-RDX and its 13C and 15N isotopomers. The basis sets
implemented in the program were employed without modification. The hybrid
density functional B3LYP method (Lee et al., 1988) was used for geometry
optimization and frequency intensity calculations. In all cases, the 6-311++G**
basis set was used. Frequencies for isotopically labeled RDX were recalculated
following mass substitution using the force constants obtained for the most
common isotope. Detailed assignment was given based on the comparison
between the theoretical data and the experimental results. The normal mode
descriptions were obtained with the assistance of animated pictures based on the
normal coordinates.
2.2 α→β phase transition
2.2.1 Preparation of RDX
RDX was synthesized by the Bachmann method (Bachman and Sheena,
1954) with some modifications. Product was purified by recrystallization from
acetone. The purity was confirmed with high performance liquid chromatography.
24
2.2.2 Equipment
The equipment and techniques employed during the slow heating
experiment were developed in our laboratory and involved a modified melt-temp
apparatus coupled to digital thermometer. The sample was placed in a small hole
in the melt-temp and covered with a glass slide. The temperature of the sample
was controlled by adjusting the voltage control. The overall heating rate during
the controlled experiment (slow heating) was limited to less than 4°C/ min. The
temperature of the sample was allowed to equilibrate at a particular temperature
for a 3 min before the Raman spectra was recorded. Low setting is adjusted to
achieve the temperature rise of 1°C/ minute near the transition temperature. The
laser beam has no noticeable effect on these temperatures.
2.2.3 Raman spectroscopy
For the measurement of the Raman spectra a Renishaw RM2000
microspectrometer was used in the 500-3500 cm-1 region with 0.5 cm-1
resolution. The spectra were excited with a Coherent INNOVA 308 Ar+ ion laser
at wavelength 514.5 nm. Samples were held on the variable temperature
equipment in their normal crystalline condition.
2.2.4 Computational methods
Density functional theory (DFT) with the B3LYP hybrid functional
calculations using the Gaussian 03-W program package (Frisch et al., 2003)
25
were carried out for the AAE, AAA and EEE-RDX polymorphs. The basis sets
implemented in the program were employed without modification. Absolute,
relative and zero-points energy of each conformer were established. The hybrid
density functional B3LYP method (Lee et al., 1988) was used for geometry
optimization and frequencies calculations. In all cases, the 6-311++G(d,p) basis
set was used. The problem of overestimation associated to DFT calculations
were solved using wavenumber-linear scale method (WLS) (Hiroshi and Akito,
2000). Detailed assignment was given based on the comparison between the
theoretical data and the experimental results. The normal mode descriptions
were obtained with the assistance of animated pictures based on the normal
coordinates using the software GaussView 03 (Frisch et al., 2003).
2.3 NMR studies of nitramines
2.3.1 NMR measurements
All NMR measurements were performed using on Bruker 500
spectrometers system MHz and Varian 300 MHz spectrometers. Samples were
examined in DMSO-d6 solutions and compared with previous acetone-d6 solution
results [Infante and Hernández, 2006). The solvent signal, calibrated against
Me4Si, was used as a reference for proton and carbon-13 spectra. The 15N
chemical shifts were referenced to the signal of an external CH3NO2. 13C(99%)
enriched RDX was obtained from Cambridge Isotope Laboratories, Inc.
(Andover, MA) as 1mg/mL acetonitrile solution and 15N (99%) enriched RDX was
26
obtained from Dr. Ronald Spanggord, SRI, Menlo Park, CA., as solid material.
Solid-state CP/MAS (cross-polarization/magic angle spinning) 15N NMR spectra
were obtained from Dr. Kevin Thorn, U.S. Geological Survey and were recorded
on a Chemagnetics CMX-200 spectrometer at nitrogen resonant frequency of
20.27 MHz. Acquisition parameters included a 2.0 ms contact time, pulse delay
of 0.5 s and spinning rate of 5 kHz. The 13C and 15N NMR chemical shifts for
some nitramines were taken from literature (Bulusu, 1982; Zeman, 1999). The
15N NMR chemical shift for substances not yet synthesized has been predicted
and reported (Zeman, 2006).
2.3.2 Computational methods
GAUSSIAN 03 software package was used for all theoretical calculations.
All the molecular geometries were optimized at B3LYP/6-311+(d,p) level, which
can give a good geometry at relative low cost. The calculations of NMR shielding
tensors were done at B3LYP level of theory using GIAO and CSGT models,
using as input the structure optimized at B3LYP/6-311+G(d,p) level. Two basis
set were applied to perform these calculations, one of them is the standard Pople
style basis sets 6-311+G(2d,p) (Pople et al., 1984), which is a triple split valance
with one additional diffuse sp-function, and two d-functions on heavy atoms and
one p-function on hydrogen atoms. The other basis set which tested was cc-
pVTZ (correlation consistent polarized valance triple zeta) (Dunning and Woon,
1995) which gave good results in describing the effect of a strong electron-
withdrawing group (NO2) in the NMR shielding tensor (Tormena and da Silva,
27

2004). The chemical shifts were calculated against the shielding of appropriate
nuclei in the reference molecule calculated in the same solvent, basis set and
method: irefi σσδ −=
28
3 VIBRATIONAL SPECTRA AND STRUCTURE OF α-RDX AND ITS 13C AND 15N-LABELLED DERIVATIVES: A THEORETICAL
AND EXPERIMENTAL STUDY
3.1 Introduction
The cyclic nitramine hexahydro-1,3,5-trinitro-s-triazine (RDX) is a well-
known powerful secondary explosive that has attracted considerable attention
due to its physical properties. The trinitrate ester is very persistent in the
environment with an estimated lifetime of 90 years, under varied soil conditions.
Another property that has been the subject of several investigations is the
possible conformational arrangements that lead to polymorphism in RDX. The
conformers of RDX are distinguished mainly by the arrangement of nitro groups
relative to the rings atoms of the RDX molecule. The α-form, shown in Figure 3.1,
is the stable polymorph at room temperature and is used in the general bulk level
applications. The individual α-RDX molecules possess essentially Cs symmetry
with two of the NO2 groups axial and the third equatorial with respect to the
triazine ring. In the present study we have reinvestigated the structure and
vibrational spectra of solid α-RDX and its 13C and 15N isotopomers. The
structures of the three molecular spatial arrangements (isotopomers) are shown
in Figure 3.1. Trace explosive detection is a major technological challenge. The
most promising and sensitive devices and techniques for explosive detection that
provide qualitative and quantitative information are not amenable to routine field
use. IR and Raman spectrometry promise to perform well as portable fieldable
parts of an explosive detection system for identifying or confirming the presence
29
of hidden explosives. The techniques can also be adapted for standoff detection.
Some of the greatest improvements in explosives detection have been made in
the area of vibrational spectroscopy. The interest in terahertz spectroscopy for
explosive detection has robustly increased (Huang et al., 2004).
*CH2 (Axial)
N
NNO2
N
NO2
H
NO2
H
H
H
HH
(a) (b)
N
CN
NO2
N
NO2
H
NO2
H
H C
H
H C
H13
13
13
15
15
15 N
NNO2
N
NO2
H
NO2
H
H
H
HH
(c)
*CH2 (Equatorial)
Figure 3.1 Structures of (a) α-RDX; (b) α-13C3RDX; and (c) α–15N3RDX. * Reference for vibrational analysis.
The new terahertz technology and methods for real-time chemical specific
explosive detection were recently developed and presented at SPIE conferences.
Interpretation of IR, Raman and Terahertz data, however, required detailed
knowledge of the structure and vibrational modes of the molecule examined. The
vibrational spectroscopy of RDX has been the subject of numerous studies (Rice
and Vladimiroff, 2002; Karpowicz and Brill, 1984; Filhol et al., 1971; Rey-Lafon et
al., 1971; Rice and Chabalowski, 1997; Castro et al., 2004). Some
inconsistency, however, exists in the available studies of RDX, with respect to
the assignment of some normal vibrations. Assignments of the IR and Raman
bands are made mainly on the basis of empirical comparison of experimental
results with those of related groups such as nitro and amino groups. This work
30
focuses on the use of modern density functional theory (DFT) (Kohn et al., 1996),
to account for the experimental vibrational Raman and IR data from RDX and its
13C and 15N-RDX isotopomers. Raman and IR frequencies were calculated at the
DFT/B3LYP level using the 6-311++G** basis set. The calculated frequencies
were compared with the experimental data and the isotopic effects are
discussed. Assignments of the vibrational modes for RDX are made through
comparison between experimental and density functional calculations results.
The purpose of the present study is to assign the fundamental vibrational
frequencies, to elucidate the structure of RDX, and to analyze the force field on
the basis of IR and Raman spectra including isotopic labeling and ab initio force
field calculations.
3.2 Results
Experimental Raman and FTIR solid phase spectra of α-RDX and its
isotopically labeled 13C3-RDX and 15N3-RDX are shown in Figures 3.2 and 3.3.
The spectra of RDX and its isotopic analogues are characterized by intense and
sharp vibrational bands. Solid α-RDX has close to Cs symmetry and occupies a
C1 site. The 57 fundamental vibrational modes are active in both IR and Raman.
These modes included 26 planar modes with A’ symmetry and 31 non-planar
modes with A” symmetry. Several of these are not expected to be detected
because they are either too weak or appear below the limit of detection in this
study. The assignments for the IR and Raman frequencies of α-RDX and its
31
isotopomers, together with the results of the B3LYP calculations are listed in
Table 1. The problem of the overestimation commonly encountered in DFT
vibrational frequencies calculations due to the neglecting of anharmonicity
effects, was solved using a wavenumber-linear scaling (WLS) method (Hiroshi
and Akito, 2000) with the following relationship:
(3.1) )/)(6(0000163.0)9(0087.1/ 1−−= cmvvv calccalcobs
All assignments were determined by comparison of experimental shifted
data of the labeled RDX with the calculated wavenumbers and vibrational modes
at each selected mode. There are some differences of wavenumbers between
calculated and experimental data. This is because the calculated spectra
correspond to the gas phase whereas experimental data are taken with solid
RDX. However, the spectral patterns are similar. The simulated Raman spectra
of RDX for all isotopic are shown in Figure 3.4.
3.3 Discussion
The assignments of selected normal vibrations of the RDX, 13C3-RDX and
15N3-RDX isotopomers are presented in Table 1, listing the experimental and the
calculated frequencies. The calculation gives a reasonable prediction of the
normal mode frequencies and the observed isotopic shifts. The normal harmonic
frequencies tend to become smaller with increasing isotopic mass, and intensity
sometimes changes. From Figures 3.3 and 3.4, it may be said that the principal
32
features of the observed Raman spectrum are satisfactorily reproduced by the
quantum chemical calculations.
500 700 900 1100 1300 1500 1700
Wavenumber (cm-1)
Inte
nsity
(arb
. uni
ts)
(b)
(a)
(c)
Figure 3.2 Experimental FTIR spectra for RDX and isotopically labeled RDX from 500 to 1600 cm-1; (a) RDX solid (black); (b) 13C3-RDX (red); and (c) 15N3-RDX (blue).
33
2800 2900 3000 3100 3200
Raman Shift (cm-1)
Inte
nsity
/Arb
. Uni
ts
(a)
(c)
(b)
Figure 3.3 Experimental Raman spectra for RDX and isotopically labeled RDX from 2800 to 3200 cm-1. (a) RDX solid (black); (b) 13C3-RDX (red); and (c) 15N3-RDX (blue).
34
100 300 500 700 900 1100 1300 1500 1700
Raman Shift (cm-1)
Inte
nsity
/Arb
. Uni
ts
(c)
(b)
(a)
igure 3.4 Experimental FT-Raman spectra for RDX and isotopically labeled RDX from 100 to 1700 cm-1. (a) RDX solid (black); (b) 13C3-RDX (red); and (c) 15N3-RDX (blue).
F
35

Regarding band intensities, the calculation predicts the observed spectra
with sufficient accuracy as a qualitative guide for the vibrational assignment,
although there are some problems in a quantitative point of view. Four bands are
observed in the region from 2800 to 3200 cm . The three bands at 3076, 3067,
and 2945 are assigned to CH2 equatorial asymmetric stretching modes. The
band at 2995 cm is attributed to asymmetric stretching mode of the CH2 axial
group. The isotopic effect is well observable for the CH2 stretching modes. The
change from C to C decreased more or less the frequencies in these cases.
The asymmetric stretching modes for NO2 groups are found in the 1520-1600
cm region. Of these three signals, two are attributed to axial nitro groups in the
triazine ring. In the NO2 stretching region, the N3RDX frequency calculation is
partially unsuccessful to reproduce the Raman experimental spectrum for this
isotopomer. Isotopic mass change has no evident effect on the frequencies for
these bands.
The experimental IR and Raman spectra between 1300 and 1460 for
α-RDX and its isotopomers show a seven-band pattern. Assignment of the
observed vibrational bands is proposed in Table 1. In this sense, it would be
important to mention that the vibrational modes in this range seem to reflect the
in-plane, β(CH ), and out-of-plane, γ(CH ), methylene bending vibrations. The
bending CH vibration, does not shift much in energy for 13C and 15N , revealing
the lack of involvement of the triazine ring in these modes. There are many
combinations in the Raman and IR spectra of RDX and its isotopomers below
1300 cm .
-1
-1
12 13
-1
15
2 2
2 3 3
-1
36
Several of the bending modes in the spectra of α-RDX were calculated to
have small degree of mixing with other vibrations. The symmetric nitro stretch
mode mixes with the out-of-plane methylene γ(CH2).Vibrational signals below
1200 cm-1 are expected to belong to ring modes and NO2 bending modes.
Vibrations in the region of 800-1200 cm-1 are related to ring, N-C-N, C-N-C and
nitro deformation, 13C3RDX and 15N3RDX spectra had small red shifts. The strong
Raman peak centered at 885 cm-1 is attributed to the symmetric ring-breathing
mode. The 1215 cm-1 band corresponds to the ν(N-NO2) vibration. The
comparative analysis of vibrational modes of RDX and its isotopic analogue
shows that patterns and regions of absorption/scattering are very similar. In the
case of the C-N stretching the shift depends practically on the participation in the
normal mode.
37
100 300 500 700 900 1100 1300 1500 1700
Raman shift (cm-1)
Inte
nsity
(arb
. uni
ts)
(a)
(c)
(b)
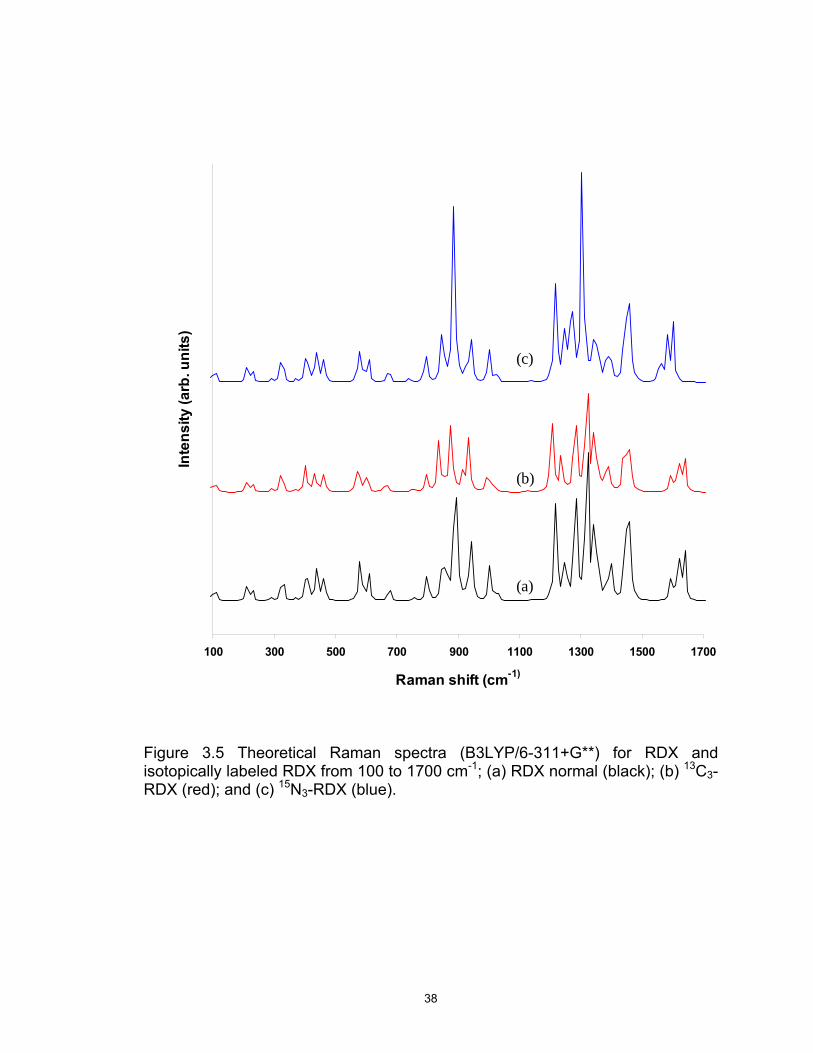
Figure 3.5 Theoretical Raman spectra (B3LYP/6-311+G**) for RDX and isotopically labeled RDX from 100 to 1700 cm-1; (a) RDX normal (black); (b) 13C3-RDX (red); and (c) 15N3-RDX (blue).
38
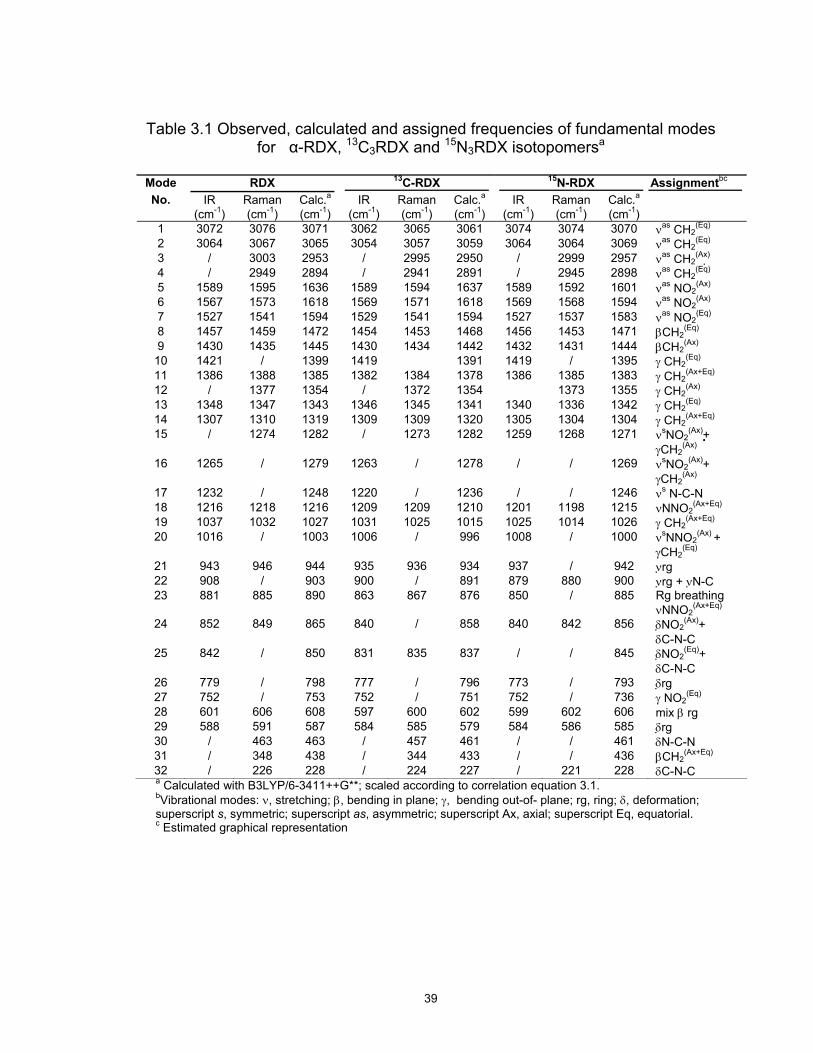
Table 3.1 Observed, calculated and assigned frequencies of fundamental modes for α-RDX, 13C3RDX and 15N3RDX isotopomersa
Mode RDX 13C-RDX 15N-RDX Assignmentbc
IR Raman Calc.a IR Raman Calc.a IR Raman Calc.aNo. (cm-1) (cm-1) (cm-1) (cm-1) (cm-1) (cm-1) (cm-1) (cm-1) (cm-1)
1 3072 3076 3071 3062 3065 3061 3074 3074 3070 νas CH2(Eq)
2 3064 3067 3065 3054 3057 3059 3064 3064 3069 νas CH2(Eq)
3 / 3003 2953 / 2995 2950 / 2999 2957 νas CH2(Ax)
4 / 2949 2894 / 2941 2891 / 2945 2898 νas CH2(Eq)
5 1589 1595 1636 1589 1594 1637 1589 1592 1601 νas NO2(Ax)
6 1567 1573 1618 1569 1571 1618 1569 1568 1594 νas NO2(Ax)
7 1527 1541 1594 1529 1541 1594 1527 1537 1583 νas NO2(Eq)
8 1457 1459 1472 1454 1453 1468 1456 1453 1471 βCH2(Eq)
9 1430 1435 1445 1430 1434 1442 1432 1431 1444 βCH2(Ax)
10 1421 / 1399 1419 1391 1419 / 1395 γ CH2(Eq)
11 1386 1388 1385 1382 1384 1378 1386 1385 1383 γ CH2(Ax+Eq)
12 / 1377 1354 / 1372 1354 1373 1355 γ CH2(Ax)
13 1348 1347 1343 1346 1345 1341 1340 1336 1342 γ CH2(Eq)
14 1307 1310 1319 1309 1309 1320 1305 1304 1304 γ CH2(Ax+Eq)
15 / 1274 1282 / 1273 1282 1259 1268 1271 νsNO2(Ax)+
γCH2(Ax)
16 1265 / 1279 1263 / 1278 / / 1269 νsNO2(Ax)+
γCH2(Ax)
17 1232 / 1248 1220 / 1236 / / 1246 νs N-C-N 18 1216 1218 1216 1209 1209 1210 1201 1198 1215 νNNO2
(Ax+Eq)
19 1037 1032 1027 1031 1025 1015 1025 1014 1026 γ CH2(Ax+Eq)
20 1016 / 1003 1006 / 996 1008 / 1000 νsNNO2(Ax) +
γCH2(Eq)
21 943 946 944 935 936 934 937 / 942 ν rg 22 908 / 903 900 / 891 879 880 900 ν rg + ν N-C 23 881 885 890 863 867 876 850 / 885 Rg breathing
νNNO2(Ax+Eq)
24 852 849 865 840 / 858 840 842 856 δNO2(Ax)+
δC-N-C 25 842 / 850 831 835 837 / / 845 δNO2
(Eq)+ δC-N-C
26 779 / 798 777 / 796 773 / 793 δrg 27 752 / 753 752 / 751 752 / 736 γ NO2
(Eq)
28 601 606 608 597 600 602 599 602 606 mix β rg 29 588 591 587 584 585 579 584 586 585 δrg 30 / 463 463 / 457 461 / / 461 δN-C-N 31 / 348 438 / 344 433 / / 436 βCH2
(Ax+Eq)
32 / 226 228 / 224 227 / 221 228 δC-N-C a Calculated with B3LYP/6-3411++G**; scaled according to correlation equation 3.1. bVibrational modes: ν, stretching; β, bending in plane; γ, bending out-of- plane; rg, ring; δ, deformation; superscript s, symmetric; superscript as, asymmetric; superscript Ax, axial; superscript Eq, equatorial. c Estimated graphical representation
39
4 MONITORING α→β PHASE TRANSITION OF RDX WITH FT-RAMAN SPECTROSCOPY
4.1 Introduction
The cyclic nitramine hexahydro-1,3,5-trinitro-s-triazine, commonly known
as RDX, is an important energetic material for various propellants and explosives
formulations. In solid state, RDX exist in four polymorphs: α, β, γ and δ (Dreger
and Gupta, 2007). Previous works have established α-phase as the stable form
at room temperature, where the six-member ring RDX molecules posses
essentially Cs symmetry with two of the NO2 groups axial and the third equatorial
with respect to the triazine ring. This molecular conformation is usually referred
as the chair AAE conformer. The thermal solid-solid transition from α-RDX to β-
RDX at atmospheric pressure occurs at 204°C. Also, the β-polymorph is obtained
either by evaporation of boiling solvent containing RDX (Brill et al., 1983) or by
deposition of RDX from solution on a glass substrate (Castro et al., 2004). The
molecular conformation of RDX in the β-solid, in solution and in the vapor phase
has a molecular symmetry of C3v and two possible structures with this symmetry
are possible. One structure has the nitro groups occupying all axial positions
(AAA), and the other has the nitro groups occupying all pseudo equatorial
positions (EEE). The γ- polymorph was observed under high pressure above 3.8
GPa. The α -γ phase transition is manifested by changes in vibrational spectra
patterns and adopts AEE conformation. The γ-RDX phase remains kinetically
stable until 18 GPa, approximately. In contrast to the extensive experimental and
40
theoretical data for α-RDX, there has been limited literature associated with solid
β and γ-RDX. Recently we reported the vibrational spectra of solid α-RDX and
their fundamental frequencies were assigned using isotopic substitution (Infante-
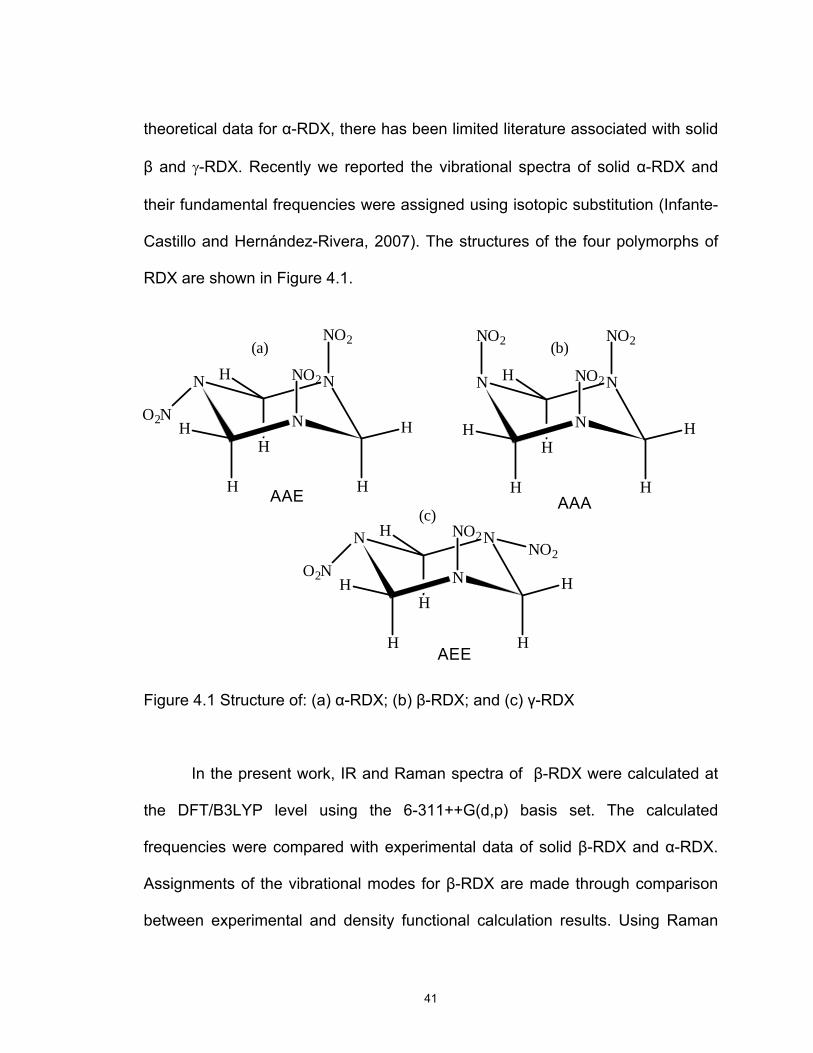
Castillo and Hernández-Rivera, 2007). The structures of the four polymorphs of
RDX are shown in Figure 4.1.
AAA
N
N
NO2N H
NO2
H
H
H
HH
NO2
N
N
NO2N H
H
H
H
HH
O2NNO2
AEE
N
N
NO2N H
NO2
H
H
H
HH
O2N
AAE
(a) (b)
(c)
Figure 4.1 Structure of: (a) α-RDX; (b) β-RDX; and (c) γ-RDX
In the present work, IR and Raman spectra of β-RDX were calculated at
the DFT/B3LYP level using the 6-311++G(d,p) basis set. The calculated
frequencies were compared with experimental data of solid β-RDX and α-RDX.
Assignments of the vibrational modes for β-RDX are made through comparison
between experimental and density functional calculation results. Using Raman
41
spectroscopy, we have observed the solid-solid phase transition of RDX in real
time. By heating at slow rates and following the spectral details, crystal
transformation occurring near the melting point can be seen. The results from
these experiments show that once the β-RDX is formed, no reversible change in
the symmetry is observed and the Raman spectra differences in both conformers
are evident.
4.2 Results
Absolute, relative and zero-point energies for AAA and AAE conformers of
RDX, obtained by B3LYP/6-311G++**, are shown in Table 4.1. The results of the
calculations indicate that the AAA conformer is only slightly lower in energy than
the AAE conformer (by 0.02 kcal/mol). Within the level accuracy for the
calculations, the AAE and AAA conformers are identical in their stability. Previous
theoretical calculations had the energy ordering reversed for the AAE and AAA
conformers. In these studies, the AAE was more stable by 0.64, 0.52 and 0.19
kcal/mol using 6-311+G**, 6-311G** and 6-31G * respectively.
Having obtained the room temperature spectra of the α-RDX, a great deal
of effort was directed at the use of Raman spectroscopy to map the solid-solid
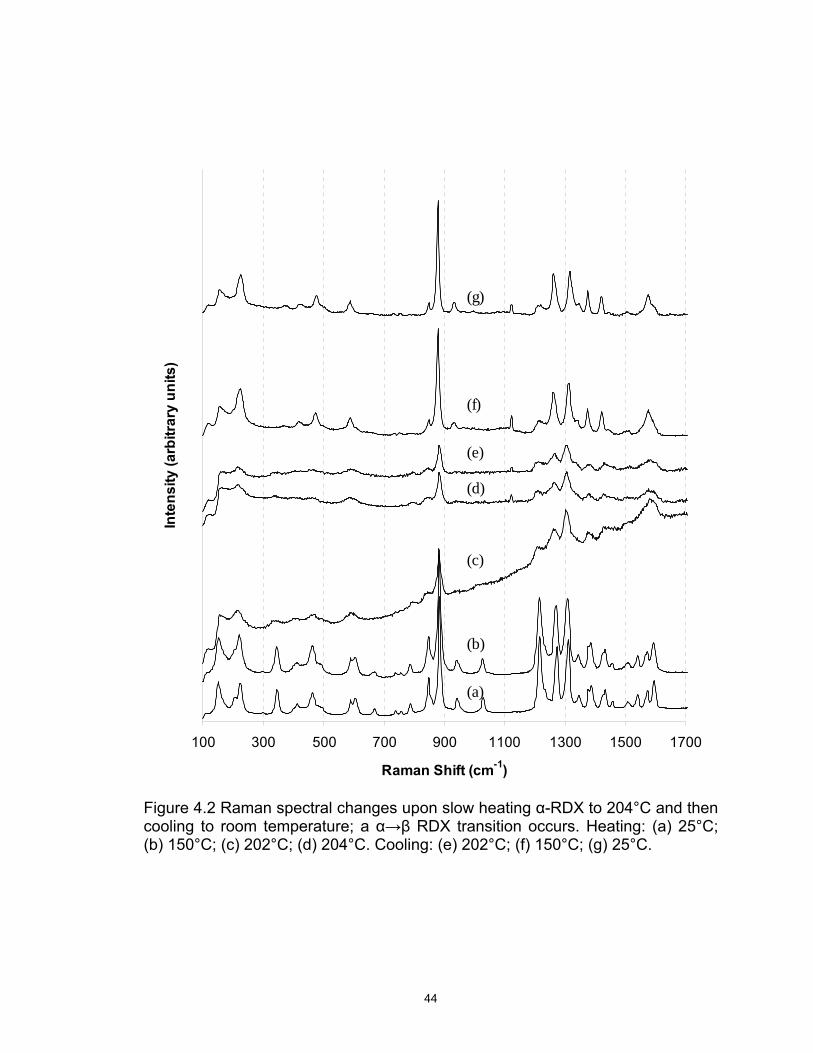
temperature-induced transition of RDX. Figure 4.2 shows the typical spectral
changes which occur upon slow heating of RDX and then cooling to room
temperature. The α-polymorph was stable until 203°C.
42
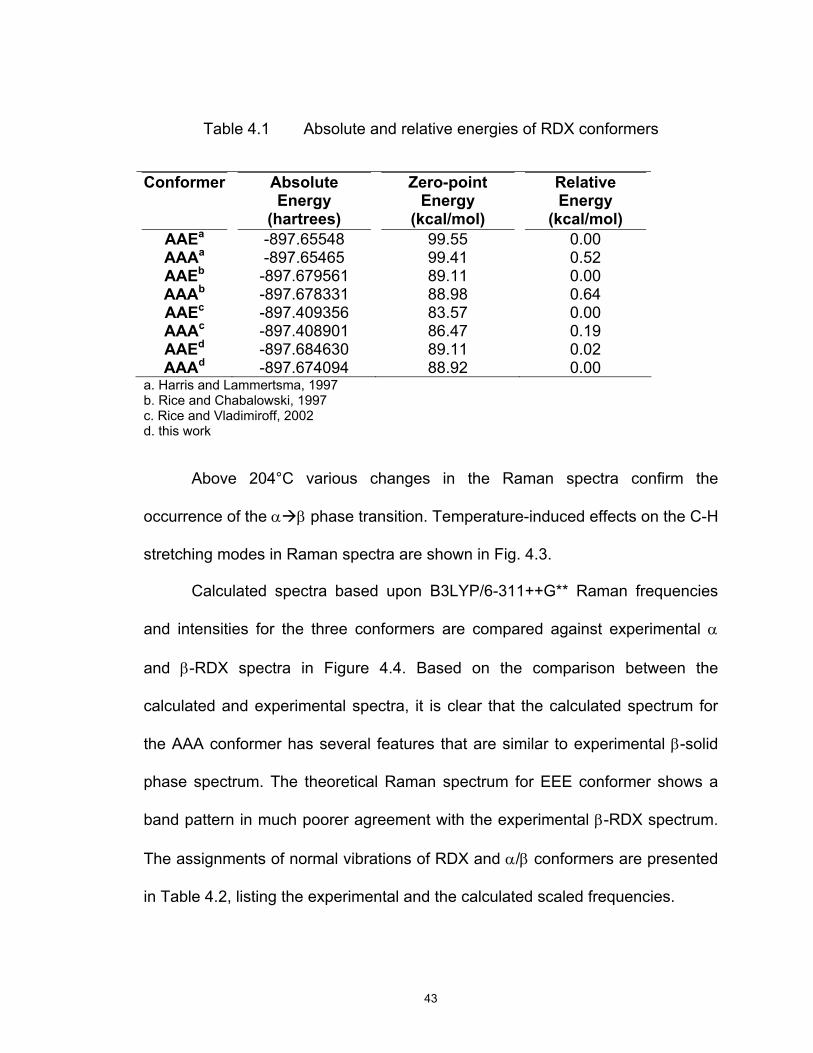
Table 4.1 Absolute and relative energies of RDX conformers
Conformer
Absolute Energy
(hartrees)
Zero-point Energy
(kcal/mol)
Relative Energy
(kcal/mol) AAEa -897.65548 99.55 0.00 AAAa -897.65465 99.41 0.52 AAEb -897.679561 89.11 0.00 AAAb -897.678331 88.98 0.64 AAEc -897.409356 83.57 0.00 AAAc -897.408901 86.47 0.19 AAEd -897.684630 89.11 0.02 AAAd -897.674094 88.92 0.00
a. Harris and Lammertsma, 1997 b. Rice and Chabalowski, 1997 c. Rice and Vladimiroff, 2002 d. this work
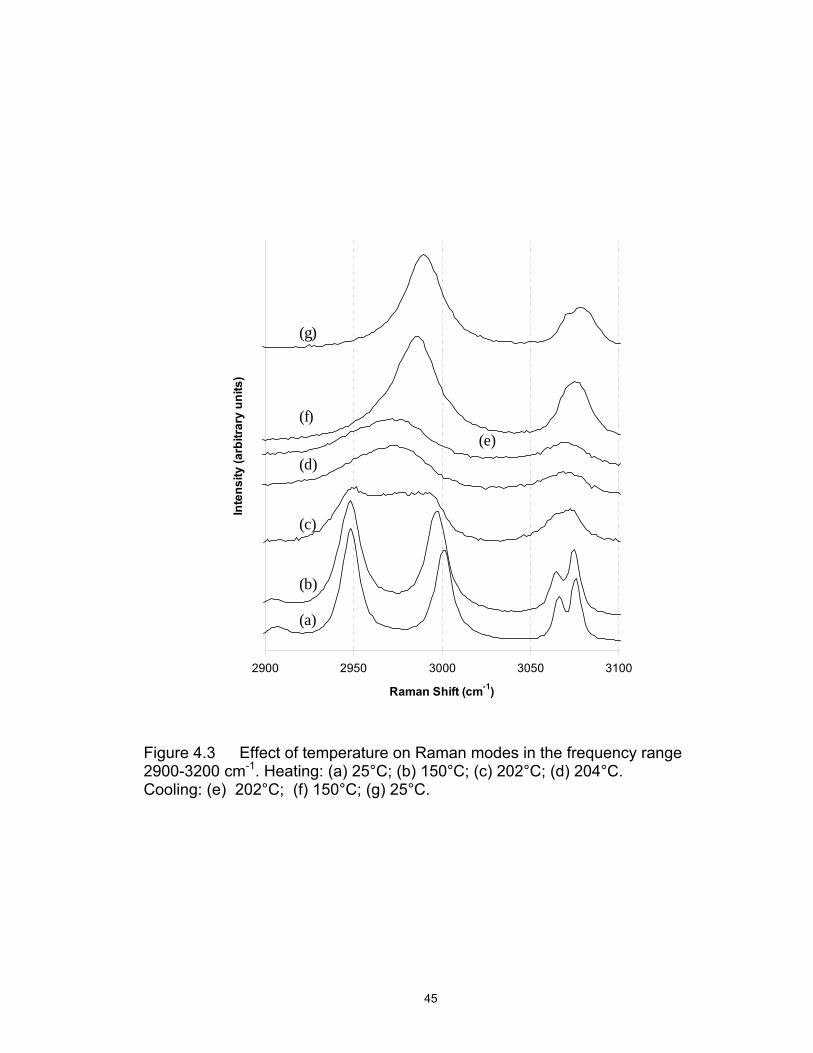
Above 204°C various changes in the Raman spectra confirm the
occurrence of the α β phase transition. Temperature-induced effects on the C-H
stretching modes in Raman spectra are shown in Fig. 4.3.
Calculated spectra based upon B3LYP/6-311++G** Raman frequencies
and intensities for the three conformers are compared against experimental α
and β-RDX spectra in Figure 4.4. Based on the comparison between the
calculated and experimental spectra, it is clear that the calculated spectrum for
the AAA conformer has several features that are similar to experimental β-solid
phase spectrum. The theoretical Raman spectrum for EEE conformer shows a
band pattern in much poorer agreement with the experimental β-RDX spectrum.
The assignments of normal vibrations of RDX and α/β conformers are presented
in Table 4.2, listing the experimental and the calculated scaled frequencies.
43
100 300 500 700 900 1100 1300 1500 1700
Raman Shift (cm-1)
Inte
nsity
(arb
itrar
y un
its)
(a)
(b)
(c)
(d)
(e)
(f)
(g)
Figure 4.2 Raman spectral changes upon slow heating α-RDX to 204°C and then cooling to room temperature; a α→β RDX transition occurs. Heating: (a) 25°C; (b) 150°C; (c) 202°C; (d) 204°C. Cooling: (e) 202°C; (f) 150°C; (g) 25°C.
44
2900 2950 3000 3050 3100
Raman Shift (cm-1)
Inte
nsity
(arb
itrar
y un
its)
(a)
(b)
(c)
(d)(e)
(f)
(g)
Figure 4.3 Effect of temperature on Raman modes in the frequency range 2900-3200 cm-1. Heating: (a) 25°C; (b) 150°C; (c) 202°C; (d) 204°C. Cooling: (e) 202°C; (f) 150°C; (g) 25°C.
45
For a better comparison of the predicted harmonic wavenumbers with the
recorded wavenumbers of the fundamental modes, we scaled the DFT calculated
vibrational frequencies using wavenumber-linear scaling method (Hiroshi and
Akito, 2000). The scaled calculated frequencies of the molecules investigated are
very close to the corresponding experimental values.
4.3 Discussion
Various changes in the spectra at 204°C confirm the occurrence of the
α β phase transition. The decrease in the number of peaks in the Raman
spectra is in general an indicative of the increase in molecular symmetry. The α-
RDX and β-RDX phases have 37 and 24 active Raman signals, respectively. The
most obvious changes in the Raman spectrum are observed in the C-H
stretching region. The Raman spectrum at 25 and 150°C shows bands
characteristic of solid α-RDX. Solid α-RDX has close to Cs symmetry and
occupies a C1 site. The 57 fundamental vibration modes are active in both IR and
Raman. Four bands are observed in the region from 2800 to 3200 cm-1. The
three bands at 3076, 3067, and 2945 are assigned to CH2 equatorial asymmetric
stretching modes. The band at 2995 cm-1 is attributed to asymmetric stretching
mode of the CH2 axial group. The assignments for the experimental Raman and
IR absorption frequencies for α and β-RDX are listed in Table 4.2. The increase
in symmetry from Cs to C3v is consistent with the decrease in the numbers of
modes in the spectrum of β-RDX. The reported experimental Raman frequencies
46

for the β-RDX are comparable with the ones obtained theoretically for AAA
conformer. The doublet at 3076 and 3067 cm-1 coalesces into a single band at
3077 cm-1 in β-RDX. The single band at 2987 cm-1 in the spectrum of β-RDX
corresponds to convergence of the bands at 2995 and 2945 cm-1 in the spectrum
of α-polymorph. Figure 4.2 shows the effect of temperature on Raman modes in
the region from 2800 cm-1 to 3200 cm-1 for both phases β and α-RDX. Three
Raman bands found in the 1520-1600 cm-1 region in the spectrum of α-RDX are
readily assigned to asymmetric stretching modes for NO2 groups. Of these three
signals, two are attributed to axial nitro groups in the triazine ring. In contrast,
only one band at 1527 cm-1 can be observed for β-RDX. The existence of a
broad band with a shoulder in the β phase reaffirms that the NO2 groups in the β
phase have approximately the same chemical environmental with all the NO2
groups in axial position. It is clear that the CH and NO2 stretching regions in the
Raman spectra are really sensitive to polymorphic changes in the RDX molecule.
The convergence of the Raman modes under high temperature condition serves
as a clear marker of the phase transitions.
The experimental Raman spectrum between 1100 and 1460 for α-RDX
show a seven-band pattern, while in β-RDX only four modes were observed.
Assignment of the observed vibrational bands is proposed in Table 4.2. In this
sense, it would be important to mention that the vibrational modes in this range
seem to reflect the in-plane, β(CH2), and out-of-plane, γ(CH2), methylene bending
vibrations and the stretching N-NO2. The calculated modes for AAA assigned in
47
the previous region coincide with the experimental β-phase. The single bands at
1418 and 1374 cm-1 in the spectrum of β-RDX corresponds to convergence of
the bands at 1436/1460 and 1380/1390 cm-1 respectively in the spectrum of α-
polymorph. These modes shift to lower frequencies. The band at 1314 cm-1 in the
β phase decreases frequency to 1310 cm-1 in the α phase. The band ca. 1273
cm-1 in the α phase moves to 1260 cm-1 in the β phase. At 1214 cm-1 a strong
band was observed for α phase. This mode corresponds to γ CH2 equatorial
and does not appear in β phase spectrum. An intense band appears at 884 cm-1
in the α phase. When the change of phase occurs from the α to β phase, the
band moves to 878 cm-1. In both phases this band has the most intense
absorption. The band found at 587 cm-1 in the β phase corresponding to a ring
rotation plus a C-N stretching mode is split into a doublet at 592 cm-1 and 907
cm-1 in the α phase. These vibrational modes were assigned to a ring bending
and a ring rocking respectively
A group of weak bands at 1031, 789, 670 and 346 cm-1 in the α phase are
not detected in the Raman spectrum for the β phase. On the other hand, the
bands at 413 cm-1 and 465 cm-1 in the α phase are assigned to ring breathing
modes (only carbons atoms) and ring breathing respectively, move to 420 cm-1
and 476 cm-1 in the β phase. These bands at 413 cm-1 and 465 cm-1 in the α
phase were assigned to a ring bending and a ring bending plus an N-N stretching
(axial) vibration respectively. The band at 225 cm-1 in α and β phases was
assigned to a ring rotation plus an NO2 rocking motion.
48
100 300 500 700 900 1100 1300 1500 1700
Raman shift (cm-1)
Inte
nsity
(arb
itrar
y un
its)
(a)
(b)
(c)
(d)
(e)
Figure 4.4 Theoretical and experimental FT-Raman spectra for RDX and conformers from 100 to 1700 cm-1 using B3LYP/6-311++G**: (a) calculated AAE RDX conformer, (b) experimental α-RDX, (c) calculated EEE-RDX conformer, (d) calculated AAA-RDX conformer and (e) experimental β-RDX.
49
Table 4.2 Observed, calculated and assigned frequencies of fundamental modes for α and β-RDX
a (Infante and Hernandez, 2004) b Calculated with B3LYP/6-3411++G**; scaled according to equation 3.1 (Yoshida, 2000). cVibrational modes: ν, stretching; β, in plane bending; γ, out-of- plane bending; rg, ring; δ, deformation; τ , torsion; s, symmetric; as, asymmetric; Ax, axial; Eq, equatorial.d Estimated graphical representation. e (Karpowicz and Brill, 1984)
Mode α-RDX (AAE)a β-RDX (AAA) (EEE)
No. IR Raman Calc.b IRe Raman Calc.b Calc.b (cm-1) (cm-1) (cm-1) (cm-1) (cm-1) (cm-1) (cm-1) Assignmentcd
1 3072 3076 3071 3075 3073 3051 3060 νas CH2(Eq)
2 3064 3067 3065 3067 / / / νas CH2(Eq)
3 / 3003 2953 3005 2987 2943 / νas CH2(Ax)
4 / 2949 2894 / / / 2842 νas CH2(Eq)
5 1589 1595 1636 1588 / / / νas NO2(Ax)
6 1567 1573 1618 / 1572 1627 / νas NO2(Ax)
7 1527 1541 1594 / / / 1608 νas NO2(Eq)
8 1457 1459 1472 1458 / / 1484 βCH29 1430 1435 1445 / / / / βCH2
10 1421 / 1399 1419 1418 1435 1407 βCH211 1386 1388 1385 1383 / 1378 / γ CH212 / 1377 1354 / 1374 / / γ CH213 1348 1347 1343 / 1342 1359 γ CH214 1307 1310 1319 1313 1314 1320 1330 νN-NO2+γCH215 / 1274 1282 / / / / νN-NO2 16 1265 / 1279 1261 1261 1272 1234 νN-NO217 1232 / 1248 / / 1234 / νs N-C-N 18 1216 1218 1216 1218 / 1224 / ν N-C 19 1037 1032 1027 / / / 1049 γ CH220 1016 / 1003 1018 / 991 981 νsNNO2+γCH2
21 943 946 944 931 931 932 / ν rg 22 908 / 903 904 / / / ν rg 23 881 885 890 877 878 883 903 rg breathing 24 852 849 865 / / / / δNO2+δC-N-C 25 842 / 850 845 846 / / δNO2+δC-N-C 26 779 789 798 774 / / 815 δrg (N-C-N) 27 752 / 753 / / / / γ NO228 / 670 677 / / / δ rg 28 601 606 608 / / / / mix β rg 29 588 591 579 / 587 588 588 βCH2+βNO230 / 463 463 / 476 460 / δrg (N-C-N) 31 / 413 410 / 420 440 360 βCH232 / 348 330 / / / 330 βCH233 / 226 230 / 225 220 / τ NO2+δ rg
50

5 13C AND 15N NMR CHEMICAL SHIFTS CALCULATIONS ON NITRAMINE SYSTEMS: A COMPARISON OF METHODS AND
BASIS SETS
5.1 Introduction
It is well known that nuclear magnetic resonance (NMR) is one of the most
powerful and extensively used experimental methods to probe the electronic and
molecular structures of a wide range of compounds. A significant part of the NMR
spectral information is the chemical shifts, which are used in structural
assignments. Liquid solution NMR is one of the techniques that have been used
to study energetic materials. Relationships between liquid-state isotropic
chemical shift and explosive characteristics have been illustrated by Zeman and
colleagues. In this sense, theoretical NMR chemical shifts calculations have been
proved to be a useful tool to interpret experimental data. The calculation of
nuclear magnetic resonance (NMR) parameters is an important aspect of
theoretical chemistry. The measured NMR spectra in combination with theoretical
calculation lead to nearly unequivocal structural assignments of the system under
study (Infante et al., 2008). It is known that large basis set are required to
calculate accurate magnetic shielding values and also that a correction for
electron correlation is desirable. Density functional theory (DFT) has emerged as
an approximate but computationally inexpensive method of treating electron
correlation that gives performance comparable to a second order Møller-Plesset
theory (MP2) and has already yielded promising results for the calculation of
NMR shieldings (Gauss, J. and Stanton, 2002). The root mean square (RMS)
51
error achieved at B3LYP/6-311+G(2d,p) level for 13C chemical shifts was 4.2
ppm (Cheeseman J. et al., 1996)
The relationship between detonation characteristics and 15N NMR
chemical shifts of nitramines was reported by Zeman (Zeman, 1999). The
electron configuration and steric conditions with the reaction centre of the
molecule can be represented by NMR chemical shifts of the key atoms of the
centre. The shifts of these atoms should correlate with characteristics of
individual energetic materials. That means that the centers of initiation (hot spots)
reactivity in molecules of nitramines can be advantageously determined by
means of 15NMR spectroscopy (Zeman S, 2006).
A number of computational methods have been developed for the
calculation of nuclear magnetic shielding tensors. It is generally accepted that
accurate prediction of these properties within the finite basis approximation
requires gauge-invariant procedures (Facceli, 2004). This contribution will focus
on predicting NMR shielding tensors at DFT/B3LYP level of theory with two
different models, gauge-including atomic orbital (GIAO) (Ditchfield, 1974) and
continuous set of gauge transformations (CSGT) (Keith and Bader, 1993) and
two different basis set, 6-311+G(2d,p) and cc-pvtz (Dunning and Woon, 1995).
The solvent effect on the theoretical NMR parameters was included using
Integral Equation Formulation-Polarizable Continuum Model (IEF-PC). The
consistency and efficiency of the considered combinations of models and basis
set on NMR calculations were thoroughly checked by the analysis of statistical
52
parameters concerning computed and experimental 13C NMR/15N NMR chemical
shifts values.
The tested nitramines were four acyclic compounds: (1) 1-nitro-1-
azaethane (MNA); (2) N,N-dimethylnitramine (DMNA); (3) 1,1-dinitro-1-1aza-
ethane (MDN); (4) N,N-diethylnitroamine (DENA) and six cyclic compounds: (5)
1,3-dinitro-1,3-diazacyclobutane (TETRAGEN); (6) 1,1,3-trinitroazetidine (TNAZ);
(7) 1,3-dinitro-1,3-diazacyclopentane (CPX); (8) N-nitropiperidine (NP);(9) 1,4-
dinitro-1,4-diazacyclo-hexane (DNDC) and (10) Hexahydro-1,3,5-trinitro-s-
triazine (RDX) (see Figure 5.1). Molecules of nitromethane and tetramethylsilane
(TMS) were also included as a reference compounds.
In addition, we also report the 15N chemical shift tensors of α-RDX and
discuss the theoretical model necessary to accurately calculate these values.
The β-polymorph is obtained in solution NMR studies. The multiple nitrogen sites
and structural sensitivity of 15N chemical shifts provide an opportunity to use 15N
solid-state NMR spectroscopy to study the subtle differences present in the RDX
polymorphs.
Based on the present study, we suggest that, among the methods and
basis sets taken into consideration, the best prediction of the 13C and 15N values
is obtained at the CSGT model using 6-311+G(2d,p) basis set . Theoretical NMR
chemical shifts calculations have proved to be a useful tool to interpret
experimental data. The measured NMR spectra in combination with theoretical
calculation lead to nearly unequivocal structural assignments of the system under
this study.
53
N NO2
CH3
CH3
(2)
N NO2
NO2
CH3
(3)
CH3 N
HNO2
(1)
(7)
NN NO2
O2N
(8)
N
NO2
(9)
NN NO2O2N
(10)
N N
N
NO2
NO2O2N
N NO2
CH2CH3
CH3CH2
(5)
N
NNO2
O2N
N
O2N
NO2
NO2
(6) (4)
Figure 5.1 The structures of the investigated compounds. (1) 1-nitro-1-azaethane (MNA); (2) N,N-dimethylnitramine (DMNA); (3) 1,1-dinitro-1-1aza-ethane (MDN); (4) N,N-diethylnitroamine (DENA); (5) 1,3-dinitro-1,3-diazacyclobutane (TETRAGEN); (6) 1,1,3-trinitroazetidine (TNAZ):(7) 1,3-dinitro-1,3-diazacyclopentane (CPX); (8) N-nitropiperidine (NP);(9) 1,4-dinitro-1,4-diazacyclohexane (DNDC) and (10) Hexahydro-1,3,5-trinitro-s-triazine (RDX)
54

In this sense, theoretical calculations of the chemical shifts may be used
as an aid for the assignment of the experimentally determined shifts and for the
study of the conformational behavior of the molecules. The values of the
chemical shielding constants strongly depend on the geometry of the molecule.
Chemical shielding constants are frequently calculated by the density functional
theory (DFT) approach because it provides better results than conventional SCF-
based methods with comparable computational effort.
5.2 Results
In Tables 5.1 and 5.2 the calculated NMR chemical shifts in solution is
compared with the experimental data for ten nitramines. The DFT method with
the B3LYP and 6-311G(d,p) hybrid functional was used to generate the
optimized structure of the studied compounds. The 13C and 15N chemical
shielding calculations were converted into the predicted chemical shifts using
tetramethylsilane and nitromethane values calculated at the same level of the
theory. The NMR experiment was measured in acetone and dimethylsulfoxide
solutions. The predicted chemical shift values of DFT method are very suitable to
the NMR experimental values. The theoretical calculations of 15N and 13C NMR
chemical shifts for acyclic nitramines (Table 5.1) and cyclic nitramines (Table 5.2)
were performed with GIAO and CSGT model, through B3LYP level of theory
applying two different basis sets. Based on the 13C and 15N chemical shifts, data
presented in Table 5.1 and 5.2 an the fits (Figure 5.2) one can deduce that the
select DFT method, combined with appropriate model and basis set, represents
55
a good compromise between accuracy and computational time, and yielded
carbon and nitrogen chemical shifts in a agreement with experimental values.
Results of linear regression fits between experimental and calculated chemical
shifts (13C) performed for the ten nitramines tested are summarized in Table 5.3.
The regression coefficients (R2) between calculated and experimental chemical
shifts range from a high of 0.991for 13C in CSGT/cc-pvtz model to a low 0.979 in
GIAO/cc-pvtz model. The 15N amine chemical shifts in acyclic nitramines show a
very good correlation coefficient, R2= 0.997 ± 0.001 using CSGT model in both
basis set (6-311+G(2d,p) and cc-pVTZ. Most of the experimental chemical shifts
were smaller than the calculated values. The largest deviations from
experimental values were observed in the 15N (amine) calculated chemical shifts.
Figure 5.3 shows the effects of the basis sets in the GIAO and CSGT
calculations when the geometry optimizations of the structures utilized as inputs
in the GIAO and CSGT calculations were performed at DFT theory. The solid-
state CP/MAS 15N NMR spectrum of RDX is shown in Figure 5.4.
5.2 Discussion
The CSGT/6-311+G(2d,p) approach has proved to be the most efficient in
predicting the 13C chemical shifts of the compounds taken in consideration,
displaying both the lowest mean absolute error (MAE) parameters and the
highest linear correlation coefficients (R2). This is illustrated in Figure 5.3 and is
supported by the results in Tables 5.3 and 5.4.
56
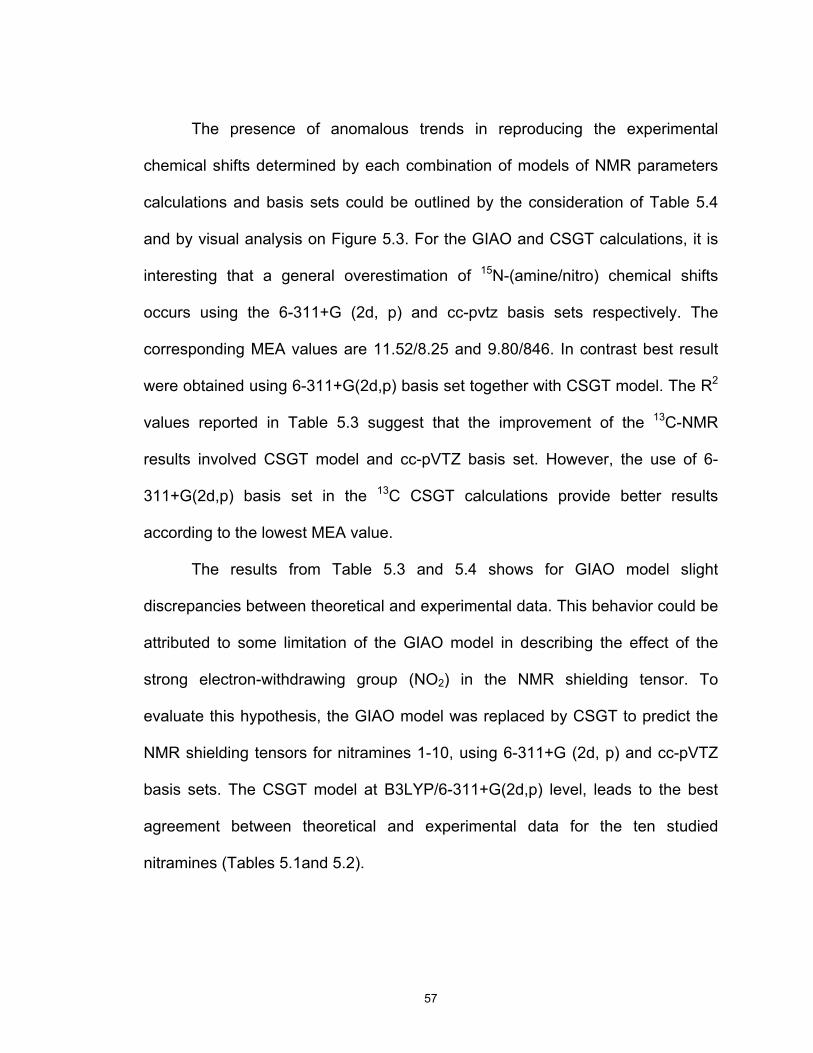
The presence of anomalous trends in reproducing the experimental
chemical shifts determined by each combination of models of NMR parameters
calculations and basis sets could be outlined by the consideration of Table 5.4
and by visual analysis on Figure 5.3. For the GIAO and CSGT calculations, it is
interesting that a general overestimation of 15N-(amine/nitro) chemical shifts
occurs using the 6-311+G (2d, p) and cc-pvtz basis sets respectively. The
corresponding MEA values are 11.52/8.25 and 9.80/846. In contrast best result
were obtained using 6-311+G(2d,p) basis set together with CSGT model. The R2
values reported in Table 5.3 suggest that the improvement of the 13C-NMR
results involved CSGT model and cc-pVTZ basis set. However, the use of 6-
311+G(2d,p) basis set in the 13C CSGT calculations provide better results
according to the lowest MEA value.
The results from Table 5.3 and 5.4 shows for GIAO model slight
discrepancies between theoretical and experimental data. This behavior could be
attributed to some limitation of the GIAO model in describing the effect of the
strong electron-withdrawing group (NO2) in the NMR shielding tensor. To
evaluate this hypothesis, the GIAO model was replaced by CSGT to predict the
NMR shielding tensors for nitramines 1-10, using 6-311+G (2d, p) and cc-pVTZ
basis sets. The CSGT model at B3LYP/6-311+G(2d,p) level, leads to the best
agreement between theoretical and experimental data for the ten studied
nitramines (Tables 5.1and 5.2).
57
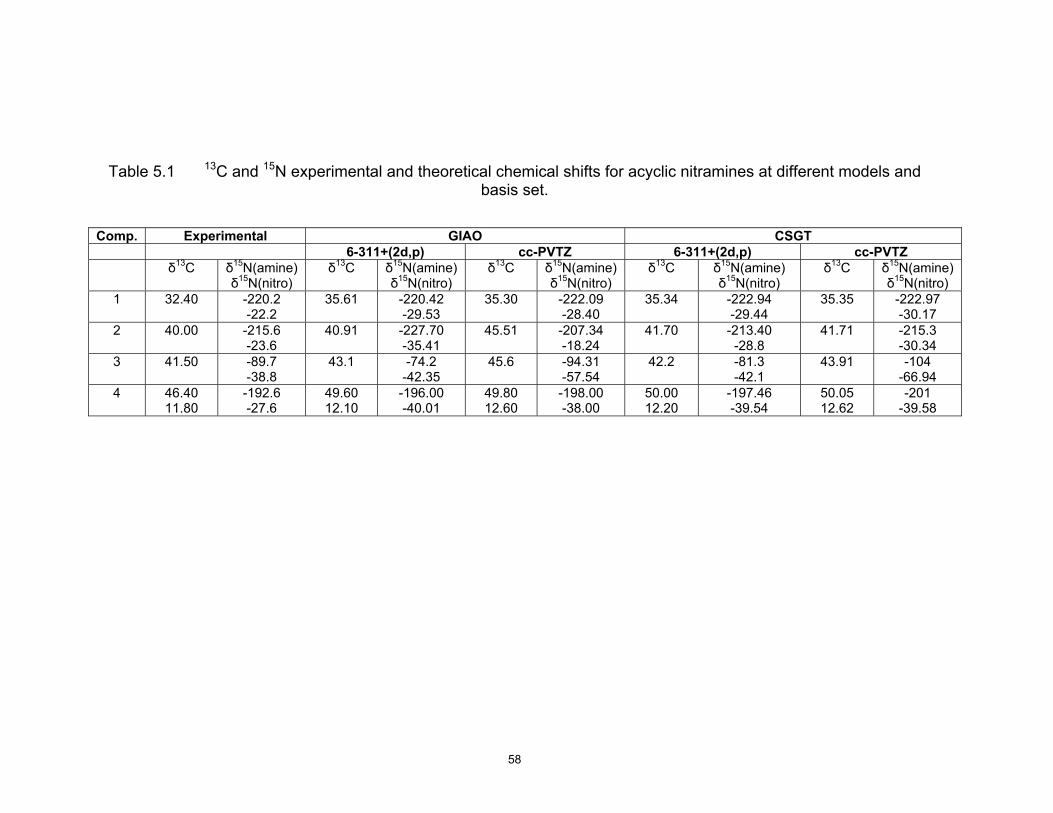
Table 5.1 13C and 15N experimental and theoretical chemical shifts for acyclic nitramines at different models and
basis set.
Comp. Experimental GIAO CSGT 6-311+(2d,p) cc-PVTZ 6-311+(2d,p) cc-PVTZ
δ13C δ15N(amine) δ15N(nitro)
δ13C δ15N(amine) δ15N(nitro)
δ13C δ15N(amine) δ15N(nitro)
δ13C δ15N(amine) δ15N(nitro)
δ13C δ15N(amine) δ15N(nitro)
1 32.40 -220.2-22.2
35.61 -220.42-29.53
35.30 -222.09-28.40
35.34 -222.94-29.44
35.35 -222.97-30.17
2 40.00 -215.6-23.6
40.91 -227.70-35.41
45.51 -207.34-18.24
41.70 -213.40-28.8
41.71 -215.3-30.34
3 41.50 -89.7-38.8
43.1 -74.2-42.35
45.6 -94.31-57.54
42.2 -81.3-42.1
43.91 -104-66.94
4 46.4011.80
-192.6 -27.6
49.60 12.10
-196.00 -40.01
49.80 12.60
-198.00 -38.00
50.00 12.20
-197.46 -39.54
50.05 12.62
-201 -39.58
58
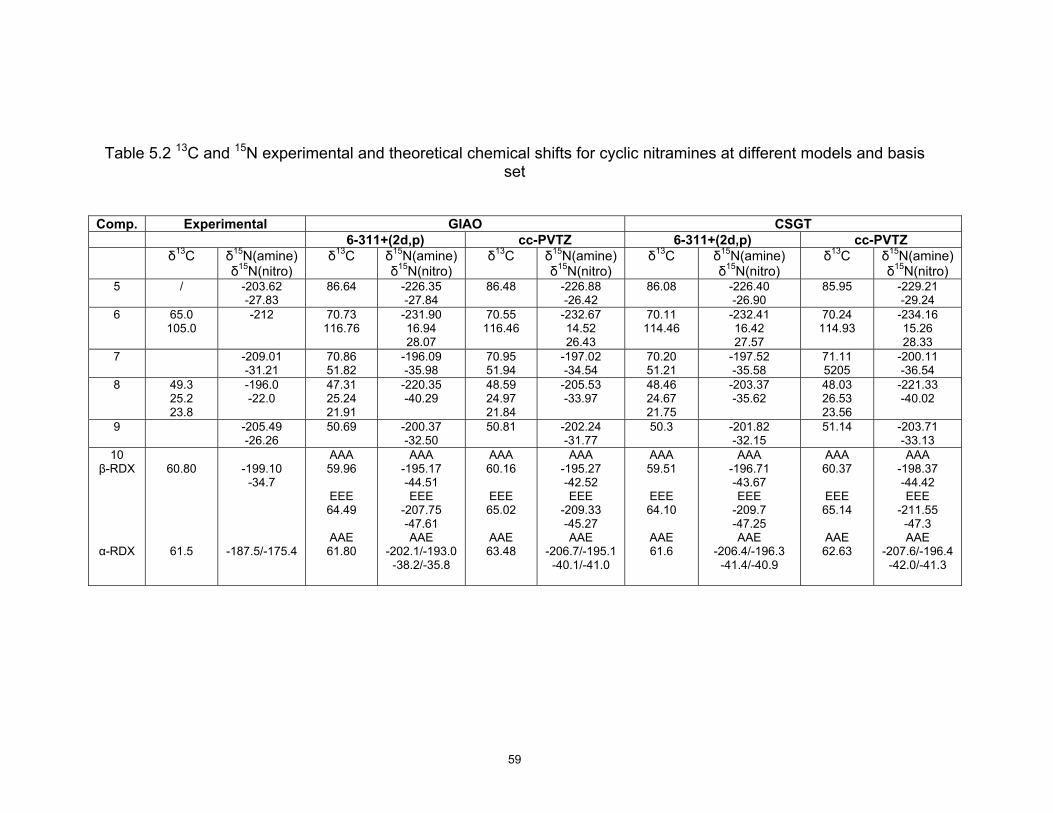
Table 5.2 13C and 15N experimental and theoretical chemical shifts for cyclic nitramines at different models and basis set
Comp. Experimental GIAO CSGT 6-311+(2d,p) cc-PVTZ 6-311+(2d,p) cc-PVTZ
δ13C δ15N(amine) δ15N(nitro)
δ13C δ15N(amine) δ15N(nitro)
δ13C δ15N(amine) δ15N(nitro)
δ13C δ15N(amine) δ15N(nitro)
δ13C δ15N(amine) δ15N(nitro)
5 / -203.62-27.83
86.64 -226.35-27.84
86.48 -226.88-26.42
86.08 -226.40-26.90
85.95 -229.21-29.24
6 65.0105.0
-212 70.73116.76
-231.90 16.94 28.07
70.55 116.46
-232.67 14.52 26.43
70.11 114.46
-232.41 16.42 27.57
70.24 114.93
-234.16 15.26 28.33
7 -209.01-31.21
70.86 51.82
-196.09 -35.98
70.95 51.94
-197.02 -34.54
70.20 51.21
-197.52 -35.58
71.11 5205
-200.11 -36.54
8 49.325.2 23.8
-196.0 -22.0
47.31 25.24 21.91
-220.35 -40.29
48.59 24.97 21.84
-205.53 -33.97
48.46 24.67 21.75
-203.37 -35.62
48.03 26.53 23.56
-221.33 -40.02
9 -205.49-26.26
50.69 -200.37-32.50
50.81 -202.24-31.77
50.3 -201.82-32.15
51.14 -203.71-33.13
10 β-RDX
α-RDX
60.80
61.5
-199.10 -34.7
-187.5/-175.4
AAA 59.96
EEE 64.49
AAE 61.80
AAA -195.17 -44.51 EEE
-207.75 -47.61 AAE
-202.1/-193.0 -38.2/-35.8
AAA 60.16
EEE 65.02
AAE 63.48
AAA -195.27 -42.52 EEE
-209.33 -45.27 AAE
-206.7/-195.1 -40.1/-41.0
AAA 59.51
EEE 64.10
AAE 61.6
AAA -196.71 -43.67 EEE
-209.7 -47.25 AAE
-206.4/-196.3 -41.4/-40.9
AAA 60.37
EEE 65.14
AAE 62.63
AAA -198.37 -44.42 EEE
-211.55 -47.3 AAE
-207.6/-196.4 -42.0/-41.3
59
An important point that should be mentioned is that while the cc-pVTZ
basis set gives 534 basis functions for RDX, the 6-311+G(2d,p) gives 441 basis
functions which leads to a shorter computational time with the same accuracy
level for 13C and 15N NMR chemical shifts.
Different resonances present in the solid-state CP/MAS 15N NMR
spectrum suggest the structural sensitivity of 15N chemical shifts. The solid-state
CP/MAS 15N NMR spectrum of the solid RDX is compared to the solution
spectrum. The solid-phase 15N NMR spectrum of the RDX provides additional
resolution over the liquid solution-state spectrum. The two resonances observed
in the 15N NMR CP/MAS spectrum (Figure 5.4) from 170 to 190 of RDX suggest
that non-equivalent magnetic environment. The relative sizes of the peaks are
related, in part, to the number of each type of nitrogen atom present in the
molecule. Notice in Figure 5.4 that the peak at 187.5 ppm is much larger than the
175.4 ppm peak. This peak is generated by the two nitrogen atoms with the NO2
groups in axial position. The 15N NMR spectrum of the solid RDX is significantly
different from that in solution. Figure 5.4 shows the amine nitrogen region of the
CP/MAS spectrum of RDX.
In a solution 15N NMR spectrum only one amine signal was found while in
the solid state there are two. The difference arises because in solution, the
molecular symmetry of RDX is C3V, whereas, in the solid, the molecules occupy
sites of Cs symmetry and the amine-nitrogen atoms are different. The increase in
symmetry from Cs to C3V is consistent with the decrease in the resonance signals
in the solution spectrum of RDX.
60
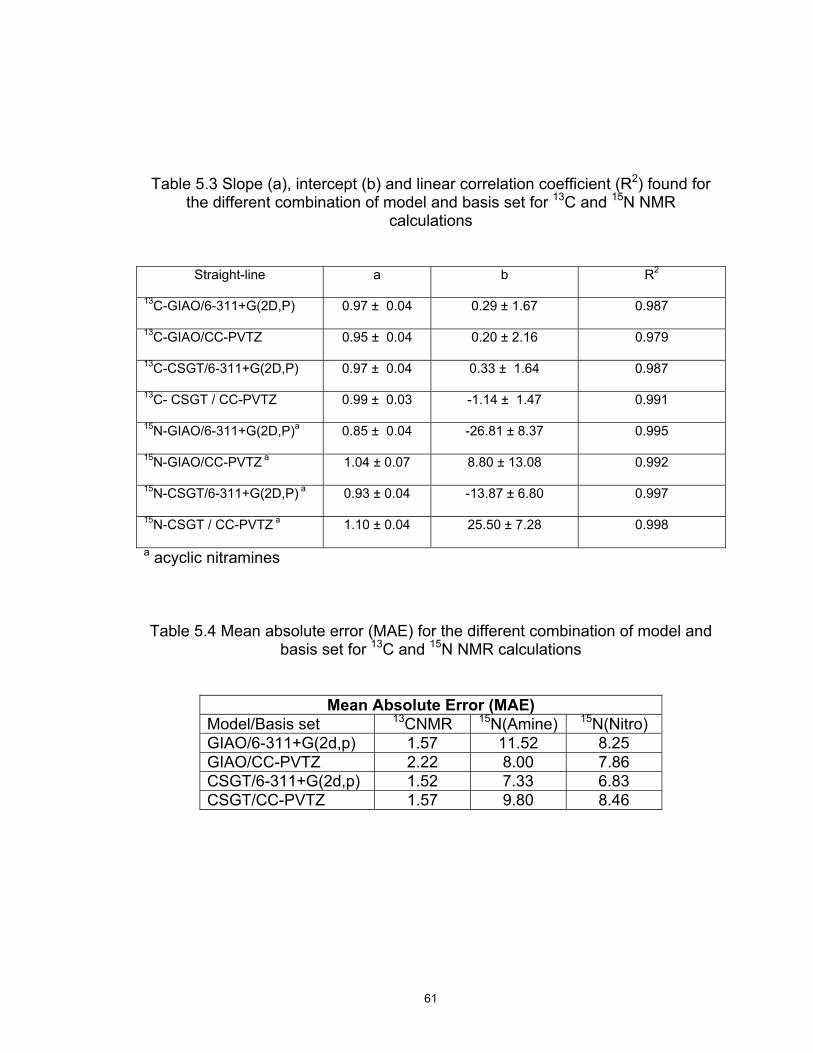
Table 5.3 Slope (a), intercept (b) and linear correlation coefficient (R2) found for
the different combination of model and basis set for 13C and 15N NMR calculations
Straight-line a b R2
13C-GIAO/6-311+G(2D,P) 0.97 ± 0.04 0.29 ± 1.67 0.987
13C-GIAO/CC-PVTZ 0.95 ± 0.04 0.20 ± 2.16 0.979
13C-CSGT/6-311+G(2D,P) 0.97 ± 0.04 0.33 ± 1.64 0.987
13C- CSGT / CC-PVTZ 0.99 ± 0.03 -1.14 ± 1.47 0.991
15N-GIAO/6-311+G(2D,P)a 0.85 ± 0.04 -26.81 ± 8.37 0.995
15N-GIAO/CC-PVTZ a 1.04 ± 0.07 8.80 ± 13.08 0.992
15N-CSGT/6-311+G(2D,P) a 0.93 ± 0.04 -13.87 ± 6.80 0.997
15N-CSGT / CC-PVTZ a 1.10 ± 0.04 25.50 ± 7.28 0.998
a acyclic nitramines
Table 5.4 Mean absolute error (MAE) for the different combination of model and
basis set for 13C and 15N NMR calculations
Mean Absolute Error (MAE) Model/Basis set 13CNMR 15N(Amine) 15N(Nitro) GIAO/6-311+G(2d,p) 1.57 11.52 8.25 GIAO/CC-PVTZ 2.22 8.00 7.86 CSGT/6-311+G(2d,p) 1.52 7.33 6.83 CSGT/CC-PVTZ 1.57 9.80 8.46
61
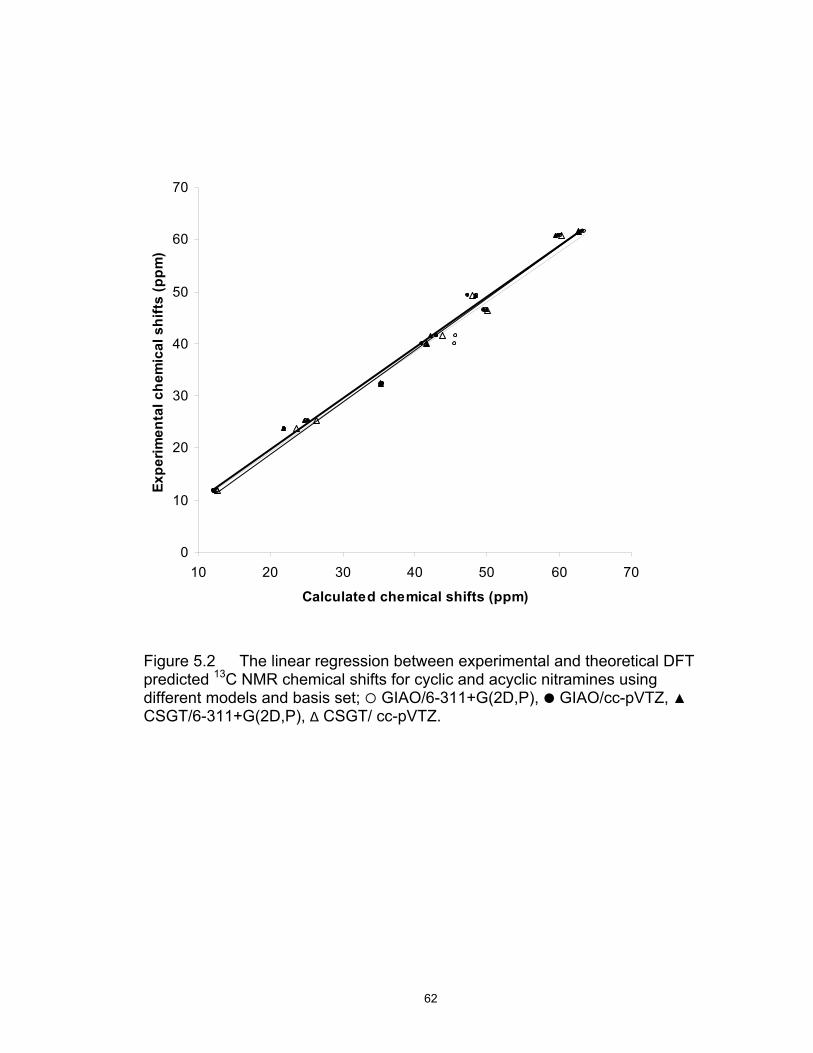
0
10
20
30
40
50
60
70
10 20 30 40 50 60 70
Calculated chemical shifts (ppm)
Expe
rimen
tal c
hem
ical
shi
fts
(ppm
)
Figure 5.2 The linear regression between experimental and theoretical DFT predicted 13C NMR chemical shifts for cyclic and acyclic nitramines using different models and basis set; GIAO/6-311+G(2D,P), GIAO/cc-pVTZ, ▲ CSGT/6-311+G(2D,P), ∆ CSGT/ cc-pVTZ.
62
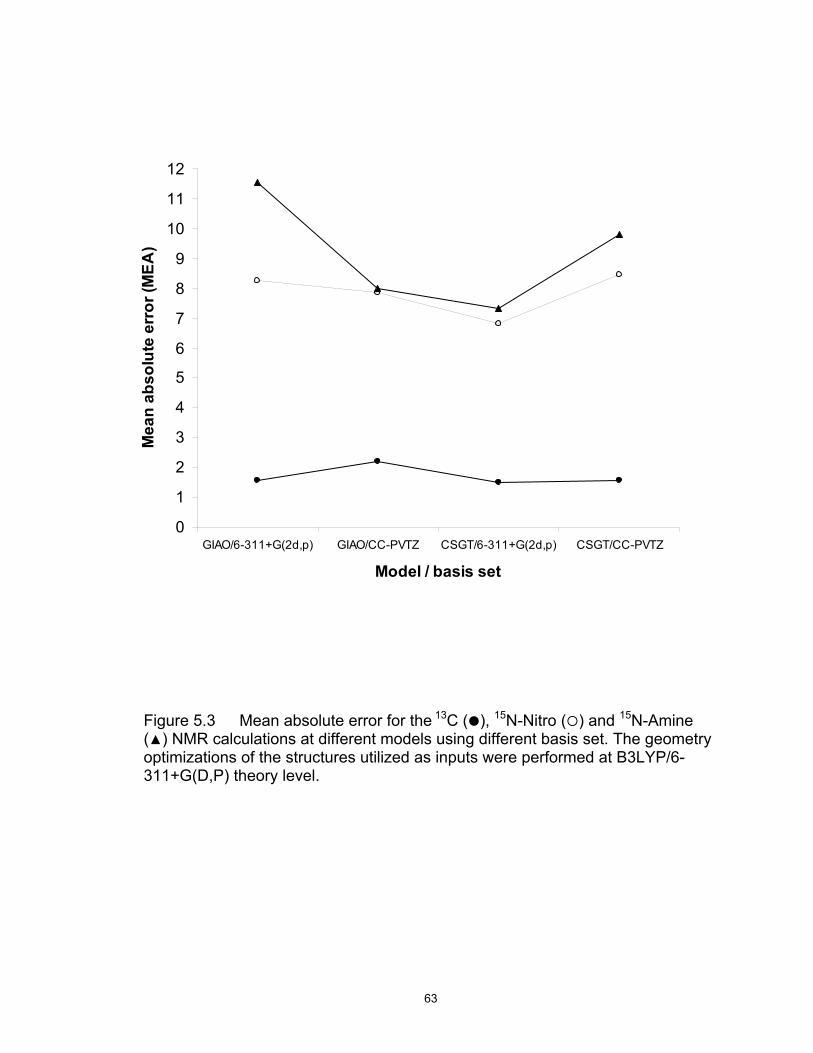
0
1
2
3
4
5
6
7
8
9
10
11
12
GIAO/6-311+G(2d,p) GIAO/CC-PVTZ CSGT/6-311+G(2d,p) CSGT/CC-PVTZ
Model / basis set
Mea
n ab
solu
te e
rror
(MEA
)
Figure 5.3 Mean absolute error for the 13C ( ), 15N-Nitro ( ) and 15N-Amine (▲) NMR calculations at different models using different basis set. The geometry optimizations of the structures utilized as inputs were performed at B3LYP/6-311+G(D,P) theory level.
63
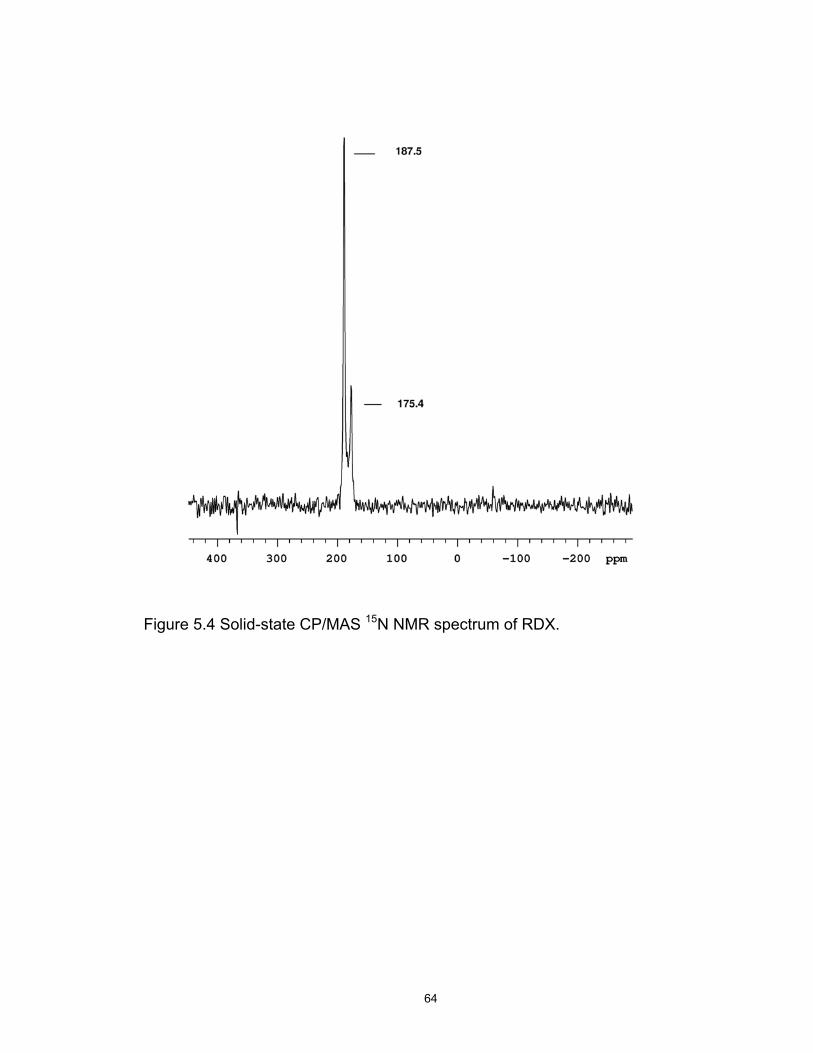
Figure 5.4 Solid-state CP/MAS 15N NMR spectrum of RDX.
64
Two possible structures with C3V symmetry are possible in solution; all
nitro groups occupying axial positions (AAA conformer) and all nitro groups
occupying pseudo-equatorial positions. Theoretical predictions of chemical shifts
indicate that the molecular geometry of RDX, in solution, is consistent with the
AAA conformer. On the other hand, the solid-state CP/MAS 13C NMR spectrum
of RDX exhibited a single peak at 61.5 ppm, close to liquid state chemical shift of
60.8 ppm in deuterated dimethylsulfoxide. The 13C NMR chemical shift is less
susceptible to the chemical environment for the polymorphs of RDX.
One of the most valuable properties of the chemical shieldings is their
sensitivity to the molecular geometry and environment. The experiments
provided only the values of chemical shifts, which were later assigned in to the
molecular frame by comparison with the calculated values. The high accuracy
achievable by modern chemical shieldings calculations allows its use in revising
questionable assignments.
65
6 CONCLUSIONS
Isotopic Studies of α-RDX
Infrared and Raman spectra of the cyclic nitramine α-RDX, and 13C, and
15N (on ring) enriched RDX analogues in the solid state were recorded and their
fundamental frequencies have been assigned using isotopic frequency shifts.
The IR and Raman spectra for α-RDX and its isotopic derivatives were also
computed using density functional calculations and compared with the normal
isotopic experimental spectra. The results of the calculations were in reasonable
agreement with the observed wavenumber locations, in most of the cases. DFT
have also allowed more definitive set of assignments to be made for α-RDX and
its isotopomers. The experimental results obtained in this study for RDX,
13C3RDX and 15N3RDX compared with theoretical data allowed to derive
correlations of observed frequency deviations of certain vibration modes and the
effect of isotopic substitution on the RDX molecule. Most of the observed
vibrational bands have been successfully assigned by the present work.
α→β Phase Transition of RDX
The presented results show that FT-Raman spectroscopy can be used to
clearly detected phase transitions in α-RDX. The solid-solid phase transition
behavior between the polymorph forms was studied at temperature induced and
the FT-Raman spectra recorded at isothermal conditions.
66
A systematic study of the changes in the Raman spectra of RDX to 204°C
has been presented. The Raman vibrational patterns observed below 204°C are
consistent with those previously defined for α-RDX. The α→β transition is
supported by the vibrational modifications, such as the decreasing of number of
the vibrational modes and intensity changes. The decrease in the number of
peaks in the Raman spectra is in general indicative of the increasing of molecular
symmetry.
Using Raman spectroscopy we have observed the solid-solid phase
transition of RDX in real time. By heating at slow rates and following the spectral
details, crystal transformation occurring near the melting point can be seen. The
results from these experiments show that once formed the β-RDX no reversible
change in the symmetry is observed and the Raman spectra differences in both
conformers are evident.
13C and 15N Chemical Shifts Calculations on Nitramines
In order to suggest a convenient and consistent protocol to be employed
for mimicking the experimental 13C and 15N spectra of nitramine compounds,
different combinations of models and basis sets were considered. The CSGT is a
better model than GIAO to evaluate the gauge origin of the vector potential
describing the external magnetic field for the compounds studied here. The
B3LYP/6-311+G(2d,p) level and CSGT model can be used to calculate 13C and
67
15N NMR chemical shifts with a very high accuracy and a dramatic reduction of
the computational time for nitramine compounds.
The most reliable results were obtained at B3LYP/6-311+G(2d,p) level
and CSGT model and can be used to calculate 13C and 15N NMR chemical shifts
with a very high accuracy and a dramatic reduction of the computational time for
nitramine compounds. The theoretical results of chemical shielding obtained in
this study for RDX compared with experimental results indicates 15N-amine NMR
chemical shift sensitivity to the molecular geometry. These results shows that the
agreement between theoretical and experimental 15N-amine NMR chemical
shieldings of nitramines could be used for evaluate the intrinsic relationship
between structure and explosives properties.
68
REFERENCES Bachman, W. E. and Sheena, J. C., 1949. A new method of preparing the high
explosive RDX. J. Am. Chem. Soc., 71:1842-1845.
Baer, B. J. Oxley, J. and Nicol, M., 1990. The phase diagram of RDX (Hexahydro- 1,3,5-trinitro-s-triazine) under hydrostatic pressure", High Pressure Research 2: 99-108. Becke, A. D., 1988. Density-functional exchange-energy approximation with
correct asymptotic behavior. Phys. Rev A., 38: 3098-3100. Becke, A. D., 1993. A new mixing of Hartree-Fock and local density-functional
theories. J. Chem. Phys., 98: 1372-1377. Bouman, T. D. and Hansen A. E., 1989. Linear response calculations of
molecular optical and magnetic properties using RPAC program. Int. J. Quantum Chem. Symp. 23: 381-386.
Brill, T., Sergio, T. and Karpowicz R.,1983. β-Polymorph of hexahydro-1,3,5-
trinitro-s-triazine. A Fourier Transform infrared spectroscopy study of an energetic material. Ind. Eng. Chem. Prod. Res. Dev., 22: 363-365.
Bulusu, S., Axenrod, T. and Autera J. R., 1981. Application of 13C and 15N NMR spectroscopy to structural studies on nitramines. Organic Magnetic
Resonance.16: 52-56. Castro, M., P., Cotte, I., Hernández S. P., Mina, N., Santana A., Chamberlain, R.
T. and Lareau R., 2004. Vibrational spectroscopy study of β and a RDX deposits. J. Phys. Chem. B., 108: 8799-8805.
Castro-Rosario, M., Mercado, L., Torres, P., Gómez, L. M., Mina, N., Hernández, S. P., Lareau, R. and Chamberlain, R. T., 2004 “Synthesis and Characterization of High-Energy Nanoparticles”, J. Phys. Chem. B, 108: 12314-12317. Cheeseman, J. R., Trucks G. W., Keith T. A. and Frisch J. M., 1996. A
comparison of models for nuclear magnetic resonance shielding tensors. J. Chem. Phys., 104: 5497-5508.
Choi, C. and Prince, E., 1972. The crystal structure of
cyclotrimethylenetrinitramine. Acta Crystallogr. Sect B, 28: 2857-2860.
69
Ciezak, J. A., Jenkins, T. A., Liu, Z., and Hemley, R. J., 2007. High-pressure vibrational spectroscopy of energetic materials: Hexahydro-1,3,5-trinitro- triazine. J. Phys. Chem. A, 111: 59-63.
Cramer, C. J. 2004. Essentials of Computational Chemistry: theories and
models, Wiley and Sons, Inc., New York, NY, pp. 607. Ditchfield, R., 1974. Self consistent perturbation theory of diamagnetism. A
gauge-invariant LCAO method for NMR chemical shifts. Mol. Phys., 27: 789-794.
Dreger, A. Z. Patterson, J. E. and Gupta, Y. M., 2007. Shock wave-induced
phase transition in RDX single crystals. J. Phys. Chem. B, 111: 10897- 10904.
Dunning T. H. and Woon D., 1995. Gaussian basis sets for use in correlated molecular calculations. I. The atoms boron through neon and hydrogen J. Chem. Phys. 90: 1007-1017. Facceli, J. A., 2004. Calculations of chemical shieldings: theory and applications. Concepts in Magnetic Resonance Part A. 20: 42-69. Filhol, A., Clement, C., Forel, M. T., Pavot, J., Rey-Lafon, M., Richoux, G., Trinquecoste, C. and Cherville, J., 1971. “Molecular Conformation of
1,3,5-Trinitrohexahydro-s-triazine (RDX) in solution”. J. Phys. Chem. 75(13): 2056-2060.
Foreman, J. B. and Frisch, A., 1996. Exploring chemistry with electronic structure
methods. Gaussian, Inc., Pittsburgh, 302 pp. Freitag, M. A., Hillman B. and Agrawal, A., 2004. Predicting shielding constants
in solution using gauge invariant atomic orbital theory and effective fragment potential method. J. Chem Phys. 120(3): 1197-1202.
Frish, A., Dennington, R. D., Keith, T.A, Nielsen, A. B. and Holder, A. J., 2003.
Gaussview 03. Frisch, M. J., Trucks, G. W., Schlegel, H. B., Scuseria, G. E., Robb, M. A.,
Cheeseman, J. R., Zakrzewski, V. G., Montgomery, Jr. J. A., Stratmann, R. E., Burant, J. C., Dapprich, S., Millam, J. M., Daniels, A. D., Kudin, K. N., Strain, M. C., Farkas, O., Tomasi, J., Barone, V., Cossi, M., Cammi, R., Mennucci, B., Pomelli, C., Adamo, C., Clifford, S., Ochterski, J., Petersson, G. A., Ayala, P.Y., Cui, Q., Morokuma, K., Malick, D. K., Rabuck, A. D., Raghavachari, K., Foresman, J. B., Cioslowski, J., Ortiz, J. V., Baboul, A.
70
G., Stefanov, B. B., Liu, G., Liashenko, A., Piskorz, P., Komaromi, I., Gomperts, R., Martin, R. L., Fox, D. J., Keith, T., Al-Laham, M. A., Peng, C. Y., Nanayakkara, A., Gonzalez, C., Challacombe, M., Gill, P. M. W., Johnson, B. G., Chen, W., Wong, M. W., Andres, J. L., Head-Gordon, M., Replogle, E. S. and Pople, J. A., 2003. GAUSSIAN 03 (Revision A.9), Gaussian, Inc., Pittsburgh.
Gabor, M. and Pulay, P., 2003. Assessment of density functional methods for
nuclear magnetic resonance shielding calculations. J. Chem. Phys., 119: 1350-1357.
Gauss, J. and Stanton, J. F., 2002. Electron-correlated approach for calculation
of NMR chemical shifts. Adv. Chem. Phys., 123: 355-422. Goto, N., Fujihsia, H., Yamawaki, H., Wakabayashi K., Nakayama Y., Yoshida M
and Koshi, M., 2006. Crystal structure of the high-pressure of hexahydro-1,3,5-trinitro-1,3,5-tiazine (γ-RDX). J. Phys. Chem. B., 110: 23655-23659.
Harris, N. J. and Lammertsma K., 1997. Ab Initio density functional computations
of Conformations and Bond Dissociation Energies for Hexahydro-1,3,5- trinitro-1,3,5-triazine. J. Am. Chem. Soc., 119(28): 6583-6589. Henre, W. H., Radom, L., Schleger, P. R. and Pople, J. A., 1986. Ab initio
molecular orbital theory, Wiley and Sons, Inc. New York, NY, 548 pp. Hiroshi, Y. and Akito, E., 2000. Density functional vibrational analysis using
wavenumber-linear scale factors. Chem. Phys. Lett., 325: 477-483. Hohenberg, P. and Kohn, W. 1964. Inhomogeneus electron gas. Physical review,
136: 864-872. Huang F., Schulkin, B., Altan, H., Federici, J., Gary, D., Barat R. Zimdars, D.,
Chen, H. and Tanner D. Terahertz study of 1,3,5-trinitro-s-triazine by time-domain and Fourier transform infrared spectroscopy. Appl. Phys. Lett., 85: 5535-5537.
Infante-Castillo R. and Hernandez-Rivera, S. P., 2006. Theoretical and
experimental vibrational and NMR studies of RDX. Sensors, and Command, Control, Communications, and Intelligence (C3I) Technologies for Homeland Security and Homeland Defense V; Edward M. Carapezza, Ed. Proc. of SPIE. Vol. 61 62012F, 1-6.
Infante-Castillo R. and Hernandez-Rivera, S. P. 2007. Effects of isotopic
substitution on the vibrational spectra of RDX. Sensors, and Command, Control, Communications, and Intelligence (C3I) Technologies for
71
Homeland Security and Homeland Defense V; Edward M. Carapezza, Ed. Proc. of SPIE. Vol. 6538 653825, 1-7.
Infante-Castillo, R., Rivera-Montalvo, L. A. and Hernandez-Rivera S. P., 2008. Theoretical DFT, Vibrational and NMR studies of benzimidazole and alkyl derivatives. J. Mol. Struct., 10: 887-898. Karpowicz, R. J. and Brill, T. B., 1984. Comparison of the molecular structure of hexahydro-1,3,5-trinitro-s-triazine in the vapor, Solution, and solid phases. J. Phys. Chem., 88(3): 348-352. Karpowicz, R. J. and Brill, T. B., 1983. “Vibrational Motion of Hexahydro-1,3,5-
trinitro-s-triazine Based on the Temperature Dependence of the Nitrogen-14 Nuclear Quadrupole Resonance Spectra: The Relationship to Condensed-Phase Thermal Decomposition”. J. Phys. Chem., 87(12): 2109-2112.
Keith, T. A. and Bader R., 1992. Calculation of magnetic response properties
using atoms in molecules. Chem. Phys. Lett., 210: 223-231. Keith, T. A. And Bader R., 1993. Calculation of magnetic response properties
using a continuous set of gauge transformations. Chem. Phys. Lett., 179: 479-482.
Kim, K. and Jordan, K. D., 1994. Comparison of density functional and MP2
calculations on the water monomer and dimer. J. Phys. Chem. 105: 10089-10094.
Kohn W. and Sham L. J., 1965. Self-consistent equations including exchange
and correlation effects. Physical Review. 140A: 1133-1138. Kohn, W. Becke, A. D. and Parr, R. G., 1996. Density functional theory of
electronic structure. J. Phys. Chem., 100: 12974-12980. Lee, C., Yang, W. and Parr, R. G., 1988. Development of the Colle-Salvetti
correlation-energy formula into a functional of the electron density. Phys. Rev. B. 37: 785-790.
Miller, P. J., Block, S. and Piermarini, G., 1991. Effects of pressure on the
thermal decomposition kinetics, chemical reactivity and phase behavior of RDX Combustion and Flame, 83: 174-184.
Oxley, J., Smith J., Zheng, W., Rogers, E. and Coburn, M., 1997. Thermal decomposition of 1,3,3-trinitroazetidine (TNAZ). J. Phys. Chem. A. 101: 4375-4283.
72
Pople, J. S., Frisch, M.J., and Binkley, I., 1984. Self-consistent molecular orbital methods. J. Chem. Phys. 80: 3265-3269. Rice, B. M. and Vladimiroff, T., 2002. Reinvestigation of the gas-phase structures
using density functional theory predictions of electron-scattering intensities. J. Phys. Chem., 106A (43): 10437-10443.
Rice, B. M. and Chabalowski, P. D., 1997. Ab initio and nonlocal density
functional study of 1,3,5-trinitro-s-triazine (RDX) conformers. J. Phys. Chem. 1997, 101A(46): 8720-8726.
Roothan, C. C. J., 1951. New developments in molecular orbital theory. Rev.
Mod. Phys, 23: 69-81. Schindler, M. and Kutzelning, W., 1982. Theory of magnetic susceptibilities and
NMR chemical shifts in terms of localized quantities. J. Chem Phys., 76: 1919-1925. Stephens, P. J., Devlin, F. J., Chabalowski, C. F. and Frisch, M. J., 1994. Ab
initio calculation of vibrational absorption and circular dichroism spectra using density functional force fields. J. Phys. Chem., 98: 11623-11627.
Tormena, C. F. and da Silva G. V. J., 2004. Chemical shifts calculations on
aromatic systems: a comparison of model and basis sets. Chem. Phys Lett. 398: 466-470.
Trinquecoste, C., Rey-Lafon, M. and Forel, M. T., 1975. “Détermination du
Champ de Force de Valence des Modes Normaux et des Amplitudes Quadratiques Moyennes de Vibration de la Trinitro-1,3,5 Hexahydro-s-Triazine”. Journal de Chime Physique. 72(6): 689-696.
Vosko, S., Wilk, L. and Nusair, M., 1980. Accurate spin-dependent electron liquid correlation energies for local spin density calculations: a critical analysis. Canadian J. Phys, 1200-1208. Yoo, C. S., Cynn, H., Howard, W. and Holmes, M., 1999. Equation of state, phase transition, decomposition of β-HMX (octahydro-1,3,5,7-tetranitro-1,3,5,7- tetrazocine) at high pressures. J. Chem. Phys. 111: 10229-10235. Zeman, S. 1999. Analysis and predictions of the Arrhenius parameters of low temperature thermolysis of nitramines by means of the 15N NMR
spectroscopy. Thermochimica Acta., 333: 121-129. Zeman, S., 2006. New aspects of initiation reactivities of energetic materials
73

demonstrated on nitramine. J. of Hazardous Materials, A132: 155-164.
74