Embed Size (px)
Citation preview

Garrett Connolly
Thesis Paper
Dr. Hendricks
December 16th, 2013
1

Table Of Contents: Page Number:
Chapter 1: ………………………… 4
Introduction to the Chapter…………………………………………………… 4
Statement of Problem …………………………………………………….. . 4
Research Population………………………………………………………….. 4
Purpose …………………………………………………………………….. ... 4-5
Research Questions…………………………………………………………. 5
Definitions …………………………………………………………………… 5-8
Significance of study………………………………………............................ 8
Chapter 2: ……………………….. 8
Introduction to the Chapter………………………………………………… 8
Lit categories………………………………………………………………… 8-13
Summary/Restate Problem……………………………………………………. 13
Chapter 3: …………………………. 13
Introduction to the Chapter ………………………………………………….. 13
Sample Population ………………………………………………………. 13
2

Methods/ Procedure……………………………………………………… 14-17
Page Number:
Chapter 4: …………………………. 17
Introduction to the chapter …………………………………………………… 17
Results of Research …………………………………………………………. 17-19
Tables and Descriptions …………………………………………………….. 19-26
Chapter 5: ………………………….. 29
Introduction to the Chapter ………………………………………………….. 29-30
Explanation of findings ……………………………………………………….. 30-31
- Similarities……………………………………………………………… 31-32
- Differences ……………………………………………………………… 32
Possible Reasons for Results ……………………………………………………. 33
Implications ……………………………………………………………………… 33-34
Future Research ………………………………………………………………….. 34
References ………………………………………………………………………. 35-36
3

Chapter One:
Introduction to the Study
Major League Baseball Executives (MLB) uses statistics to evaluate players depending
upon their circumstance, whether it’s signing a new contract, trading for certain players or
bringing up Triple-A Prospects to play in the MLB parent team. For my research I will be asking
the general public on: Does OPS give us a better image of MLB Prospects than a person within
solid baseball knowledge?
Statement of Problem:
Does Minor League OPS provide better projection of major league prospects success in
the MLB, than a person with baseball experience?
Research Population:
The population that we chose to study was to cover minor league prospects, and the
prospects that we collected from was the Minor League Baseball website. We collected the top
40 players and we are going to survey 30 students from Nichols College. These students are
4

going to be part of the Nichols Baseball Team, and also any other student who has basic
knowledge and background who understand how baseball is played.
Purpose:
The purpose of the study and what I am looking forward to is to see what the general
public put for prospects and how they would rate them. When we first looked up the original
rankings and OPS’s, we found out what the overall numbers were. But now we are going to find
out what the people who have either played baseball or who have past experience feel about the
players and what they would put for an OPS and there Ranking.
Research Question:
The research questions that guide this study are:
1. The purpose of the study is to see if OPS give us a better image of MLB Prospects than a
person with solid baseball knowledge.
Please Group these Triple-A Players in Four Sections. Using the given statistics, (using an
eyeball approach) please circle your prospect rating for each player based on following scale:
1= Top 25% Minor League Player 3= 51%-75% Minor League Player
2=26%-50% Minor League Player 4= Bottom 25% Minor
League Player
Operational Definitions:
5

1. BA: Batting average (also abbreviated AVG) - hits divided by at bats (Gary Gillette, Pete
Palmer , March, 17 2012, PG1)
2. Bill James: Bill James, the field's most celebrated author, and is derived from the
acronym "SABR", for the Society for American Baseball Research. (S, Smith, P. Palmer,
G. Gillette, October , 11 2012).
3. Billy Beane: He is the general manager (GM) and minority owner of the Oakland
Athletics of Major League Baseball (MLB). (Smith,Palmer,Gillette, S. October , 11
2012)
4. Double: Double - hits on which the batter reached second base safely without the
contribution of a fielding error. (Gary Gillette, Pete Palmer , March, 17 2012, PG1)
5. GM: In most professional sports, the general manager is the team executive responsible
for acquiring the rights to player personnel, negotiating their contracts, and reassigning or
dismissing players no longer desired on the team.
6. G: Games played - number of games where the player played, in whole or in part (Gary
Gillette, Pete Palmer , March, 17 2012, PG1)
7. H: Hits - times reached base because of a batted, fair ball without error by the defense
(Gary Gillette, Pete Palmer , March, 17 2012, PG1)
8. Henry Chadwick: Henry Chadwick was a journalist who created boxes scores for
baseball. He was called “Father of Baseball.” (Gary Gillette, Pete Palmer , March, 17
2012, PG1)
6

9. Homerun: Home runs - hits on which the batter successfully touched all four bases,
without the contribution of a fielding error. (Gary Gillette, Pete Palmer , March, 17 2012,
PG1)
10.MLB: Major League Baseball
11. Moneyball: For the statistical approach sometimes referred to as "Moneyball"
Moneyball: The Art of Winning an Unfair Game is a book by Michael Lewis, published in
2003, about the Oakland Athletics baseball team and its general manager Billy Beane. Its
focus is the team's analytical, evidence-based, sabermetric approach to assembling a
competitive baseball team, despite Oakland's disadvantaged revenue situation.
(Smith,Palmer,Gillette, S. October , 11 2012).
12.Oakland Athletics: The Oakland Athletics are a Major League Baseball team based
in Oakland, California.
13.OBP: On base percentage - times reached base (H + BB + HBP) divided by at bats plus
walks plus hit by pitch plus sacrifice flies (AB + BB + HBP + SF). (Gary Gillette, Pete
Palmer , March, 17 2012, PG1)
14.OPS: On-base plus slugging - on-base percentage plus slugging average (Gary Gillette,
Pete Palmer , March, 17 2012, PG1)
15.RBI: Run batted in - number of runners who scored due to a batters's action, except
when batter grounded into double play or reached on an error (Gary Gillette, Pete Palmer
, March, 17 2012, PG1)
7

16.Sabermetrics: Sabermetrics is the study of baseball using statistics.
17.Scouts: In professional sports, scouts are trained talent evaluators who travel extensively
for the purposes of watching athletes play their chosen sports and determining whether
their set of skills and talents represent what is needed by the scout's organization.
18.Single: Single - hits on which the batter reached first base safely without the contribution
of a fielding error. (Gary Gillette, Pete Palmer , March, 17 2012, PG1)
19.SLG: Slugging average - total bases divided by at-bats (Gary Gillette, Pete Palmer ,
March, 17 2012, PG1)
20.Triple: Triple - hits on which the batter reached third base safely without the contribution
of a fielding error. (Gary Gillette, Pete Palmer , March, 17 2012, PG1)
21.WARP: Wins Above Replacement Player, or WARP, is a statistic published in Baseball
Prospectus that attempts to measure the "total value" of a player over a given season.
Significance of Study:
This study is significant because baseball executives and scouts primarily go by scouting
and past experiences as a player. As I mentioned, during my research we talked about how
baseball statistics were first born. Even though it was a huge deal back in the 70’s and 80’s, it’s
still has become a huge tool to evaluate prospects and any other future prospect that are scouted
and that come through the system.
Chapter 2:
8

Introduction to the Study
The purpose of Chapter two is to talk about the research why this research is important to our
topic. The purpose of this research is to see if OPS gives us a better image of MLB Prospects
than a person with solid baseball knowledge. In this Chapter 2 it talks about how it list the
categories of what research we are going to cover, it shows the summary and shows the restated
research problem that we are asking to the surveyed people.
List Categories:
Introduction to the Study
Major League Baseball Executives (MLB) uses statistics to evaluate players depending
upon their circumstance, whether it’s signing a new contract, trading for certain players or
bringing up Triple-A Prospects to play in the MLB parent team. For my research I will be asking
the general public on: Does OPS give us a better image of MLB Prospects than a person within
solid baseball knowledge?
Henry Chadwick:
Statistics first started being used back in the 19th Century and introduced by Henry
Chadwick.(Andrew 2008) Chadwick is called “the father of baseball,” introduced box scores
and the use of statistics. Chadwick was a journalist and was elected to the Baseball Hall of Fame
back in 1938. (Andrew 2008) As the game of baseball grew so did the use of statistics and
became more popular in the 1970’s. The study of Baseball Statistics is called Sabermetrics
9

(SABR)(2008). Bill James is an author who focuses his studies on baseball statistics who
created the term Sabermetrics.
Research Question:
The purpose of the study is to see if OPS give us a better image of MLB Prospects than a person
with solid baseball knowledge.
HO: OPS gives us a better image of MLB Prospects than a person within solid baseball
knowledge.
HA: OPS does not give us a better image of MLB Prospects than a person with solid baseball
knowledge.
Moneyball:
These Statistics are used in many organizations today, and recently there was a book
written about this topic called Moneyball. The book, Moneyball (Lewis, 2003) was written about
baseball and how the Oakland Athletics Baseball Organization would be financially stable in
order to play against the big market teams.
“Moneyball, describes how Billy Beane, general manager of the Oakland Athletics,
revolutionized Major League Baseball (MLB) by exploiting an inefficiency in the baseball labor
market- the ability to get on base had been seriously undervalued.” “Beane exploited the
inefficiency by implementing an employee (player) performance measurement and feedback
system that allowed him to field a highly competitive team while having one of the lowest
payrolls in MLB.” (2007)Besides baseball, other sports are adopting the statistic of moneyball.
10

According to Gerrard (2007), it was found that there were three burrows, which are
technological, conceptual, and cultural when transferring moneyball approach to other team
sports.
According to (Farrar, Bruggink 2011), they talk about how MLB GM’s rely solely just on
one statistic rather than including both statistics to a players value. One of the Statistics that
Gm’s relied on too much was Slugging. GM’s just looked at Slugging when they produced runs
rather than if they are going to get on base during a percentage of the time. “In particular,
slugging is overcompensated relative to its contribution to scoring runs.” “This causes an
inefficiency in run production as runs (and wins) could be produced at a lower cost (Farrar,
Bruggink 2011).”
According to (Farrar, Bruggink, A. (2011), Moneyball and the innovation of statistical
analysis will take a while to adapt into the MLB. The author pointed out that the batting average
(BA) is still more prevalent than On base percentage (OBP) and also receives more attention in
the evaluation process. “Finally, the adoption of Moneyball is not limited to baseball.” “General
Managers in hockey (6), basketball (8), football (5), and soccer (2) are beginning to see the same
advantages in using statistical analysis to supplement or replace conventional wisdom in making
decisions on personnel and strategy (Farrar, Bruggink, A. (2011).” The author also points out
those sports teams (colleges and professional teams) make a judgment on data driven results
rather than the old style of scouting and evaluation.
According to (Gerrard, B. (2007), he concluded that the movement of statistical analysis
has helped MLB executives to find better ways to recruit /acquire or trade for players besides the
11

traditional way of scouting for them or signing for big contracts. He talks about how the Oakland
Athletics are the second lowest payroll in baseball and try to find the most affordable and players
that can perform well and under- the radar. This tends to be overlooked and helps small market
teams become more successful when they compete against New York when they have a high
payroll.
WARP/Sabermetrics (Winning Above Replacement Player):
Another Statistic that Baseball executives use is called WARP (Wins Above Replacement
Player). WARP tries to measure the “total value,” of a player over certain seasons. “WARP,
intuitively, attempts to express the total number of wins that a given player adds this team over
the course of a season by comparing the players performance with that of a fictitious
“replacement player” is assumed to be an average Triple-A call up who might appear in the
majors only as a replacement for an injured player, and whose hitting, fielding, and (if
applicable) pitching skills are far below league average.” (2007)
According to (Gerrard, B. 2007), that in professional team sports, the economic power of
teams depends upon your geography location and past history. Gerrard pointed out that certain
teams that are located in a large metropolitan area and has a history of sporting success are able
to acquire the best talent for their large fan base. Gerrard also talked about his overall concern
that does not just focus on baseball, but focuses on a world wide spectrum for all sports leagues.
The reason for Gerrard’s concern is that he feels that the sports leagues should maintain
competitive balance for fans overall experience and for leagues to limit the amount of money per
organization. If this happens, the top teams could not hold on to their top players and have a
12

chance for every single team to attempt to acquire about the player’s services. This approach
tries to even out the playing field and attempt to have competitive seasons and games.
“Alternatively, leagues have regulated the players’ labor market via salary caps, luxury taxes on
excessive payrolls, reserve clauses, transfer fees, and centralized drafting of new players.” “The
MLB has been one of the least regulated professional sports leagues (Gerrard, B. 2007).”
OPS (On Base Plus Slugging):
Another way evaluate a baseball players production is called OPS(On-Base Plus
Slugging). This is what I am basing my research on MLB prospects. OPS is another statistic
which is in the family of Sabermetrics, which shows an overall offensive players performance.
OPS is taking the slugging percentage of the certain prospect and adding the OBP (On Base
Percentage) together to make the OPS. “Since MLB teams have focused on the conventional
measures of hitter performance rather than OBP, this would imply that the market valuation of
players would tend to undervalue players who rank much better on their OBP statistics than
batting and slugging averages (Gerrard, B. (2007)”.
The biggest reason why GM’s tend to stay away from these types of statistics is because
they rely on the old traditional way of scouting top prospects. According to (Wolfe,et al, 2007),
the article talks about how scouts are considered the best judgment towards evaluating baseball
talent and using the naked eye. “The desired attributes on which scouts assessed positing players
were the “five tools”: hitting for average, hitting power, fielding, foot speed, and arm strength.”
“Sabermetrics, on the other hand, applies rigorous statistical analysis to determine the traits most
13

associated with scoring runs and winning ballgames rather than the traditional attributes (Wolfe,
et al, 2007).”
Re-statement of Problem:
Does Minor League OPS provide better projection of major league prospects success in
the MLB, than a person with baseball experience?
Chapter 3: Research Design and Methodology
Introduction to the Chapter:
The purpose of Chapter three is to talk about the research design and methodology used
in this study. The purpose of this research is to see if OPS gives us a better image of MLB
Prospects than a person with solid baseball knowledge. In this Chapter 3 it talks about how, it
restates the problem, research questions, and definitions of terms, population and sample,
instrumentation and data collections, data collection procedures and limitations of study.
Sample Population:
In my study there were two populations that surveyed for my information. The two
populations were the Nichols College Baseball Team and Coaches, and any Nichols College
Students that had knowledge and followed baseball before. During our population sample, I
gathered prospects from four different Triple-A Leagues
Design of Study:
14

The design of this study was to look at Triple-A Prospects that have never been called up
by their organization. The way we did it was to research and look at the high OPS’s that the
prospects had without being called up. Then we surveyed people who had some knowledge and
background in the sport of baseball. When we first made the survey, we gave them the players,
statistics and to rank them according to their OPS. We also gave them: Batting Average, Doubles,
Triples, Runs Batted In, and Homeruns.
Even though we know the OPS, but also wanted to find out what the people thought
about the overall players and have them rank themselves. We surveyed people using survey
monkey, and also email to figure out how they would rank them. We gave them four groups and
they had to choose and place each player in a different section. After they would do that, we
would rank them and add up the total number of points for that section. After we collect the data,
we would compare these survey scores that the Nichols College Baseball team would score and
we also would take the actual OPS scores from each minor league player that I ended up taking
from the website.
Sample Population:
In my study there were two populations that surveyed for my information. The two
populations were the Nichols College Baseball Team and Coaches, and any Nichols College
Students that had knowledge and followed baseball before. During our population sample, I
gathered prospects from four different Triple-A Leagues
15

Instrumentation and Data collection:
The instruments and tools that were used in this study to survey the population were by
using Microsoft Excel, Microsoft Word, and using email to distribute the survey. When we first
started creating the survey, we took minor baseball players who played for Triple-A leagues. I
went to the minor league website for minor league website to find the stats and took players from
each league in Triple-A. We found out that there were only 3 leagues, so we divided up the
players by researching each player and trying to find out if they were called up to the majors
(MLB). If a minor leaguer was called up, then we would not use them. We only used minor
leaguers who was still played in the minors and was the next to be called up.
Next, we took ten (10) players from each league, starting with the International League,
Pacific Coast League, and lastly the Mexican League. After we chose ten players, we took stats
and put them into Microsoft Excel in alphabetical order. After we found the players, we created
the survey and put the survey into Microsoft Word. Besides putting in the stats and setting up the
survey, we built the question and figured how the results would work.
We took another Microsoft Excel assignment and put the ratings and scores in another
document. The people that we are going to survey, is the Nichols College Men’s Baseball Team
and Staff. If we feel that our survey is insufficient because of the small data sample, then we
would survey Nichols College Students and Staff who are knowledgeable about baseball and has
played the sport since they had prior experience playing the sport. After we create the survey,
then we would put the Microsoft Word document into an email document and send it off asking
the Coach of the Men’s Baseball Team to send it to the team to take the survey.
16

Data collection procedures:
In the previous section, I talked about how we created the survey and set up the document
to record the results. Each person from the Nichols College Men’s Baseball Team will fill out a
survey and then send it back to my Nichols College email. From there, I will take each survey
and record the results in a Microsoft Excel document. The way we record results is by categories,
the categories go from:
1= Top 25% Minor League Player 3= 51%-75% Minor League Player
2=26%-50% Minor League Player 4= Bottom 25% Minor League
Player
Each person will record the results ranging from 1-4, and after we record each person’s
results, we use Microsoft Excel to create the average OPS that we created from the team being
surveyed. We add up the scores using the excel spreadsheet formulas to figure out the averages.
We then take the averages and compare them to our own personal OPS’s that we have recorded
from the actual results of the Minor League players. After we record the scores in excel, we
compare our survey scores to the real OPS scores that have been already been recorded and are
used by the Minor Leagues and the MLB.
Limitations of study
17
This Study was conducted to this certain question that we asked ourselves: Please Group these
Triple-A Players in Four Sections. Using the given statistics, (using an eyeball approach) please
circle your prospect rating for each player based on following scale:
1= Top 25% Minor League Player 3= 51%-75% Minor League Player
2=26%-50% Minor League Player 4= Bottom 25% Minor League Player
We stayed in the confines of this question because we would be covering a broad topic to
discuss. We also confined our search to just offensive players/hitters out-put. When we looked at
the Statistical Analysis we found that just looking at offensive out-put would help our search
rather than combining both pitching (defense) stats (ERA’s) to batting (offense).
Chapter 4: Results:
Introduction:
The purpose of Chapter Four is to talk about the results that we collected from our
surveys and conclude our results from our research. The purpose of this research is to see if OPS
give us a better image of MLB Prospects than a person with solid baseball knowledge. In this
Chapter 4 we introduce the chapter and this chapter talks mostly about our results from our
research and also any other tables that we may include with our results. The results will also
include tables of surveys and any others tables that we may done work on. In the tables we will
be describe what is actually going on in the table.
Results Of Research:
18

Over the course of the Spring Semester, I asked students from Nichols College who are
on the Nichols College Baseball Team and any other students to take my survey regarding Minor
League Baseball and minor league prospects. During my survey I surveyed other students who
attend the college besides the baseball team who have a basic background of baseball
knowledge. The research question that I asked Nichols College students does OPS give us a
better image of MLB Prospects than a person within solid baseball knowledge?
When I began researching these top 40 prospects from the minor league baseball website,
I looked at the end of the season statistics for these baseball players. The results showed that
there OPS’s were high on the website. When I surveyed the Nichols College, I surveyed 30
students who had some basic background in baseball. The results came back and it showed that
some of the baseball players got rated at a level where they should be at, and other prospects got
rated differently. As the students rated these players, I found that they did not think that this
prospect was as good as I thought he was. I ended taking the recorded players and putting them
into tables to where they rank on the list. As it looked clearer to me, it showed that a prospect
that made it to one table did not make it to another table.
The last table that I made up showed a list of five prospects and each of them poses two
factors that show why they make that list. Once is that they are ranked high as a prospect from a
rating of 1-4. If they are ranked close to a 1 then they are considered top candidate for a prospect.
The second factor is that they have a high OPS. The higher OPS, the higher prospect and it show
that the prospect can hit for average and can get on base. But as I looked closer, it shows a
catcher by the name of Cesar Tapia who has a career minor league average of 0.345. Most
19

catchers are not power bats and tend to hit more singles, but uncharacteristically shows that he
had 25 doubles and 3 triples to his name. He was selected for a high OPS number but not a high
eyeball approach or ranking as we call it.
Once I gathered all the scores, I decided to put them in categories and groups to show
how they are supporting our thesis question. In the last couple tables we showed an OPS table,
estimate table, and lastly a table where it’s a combined list of prospects and they came from the
two previous lists. We combined the players that had a high ranking and also high OPS and
showed the top prospects out of our list.
Tables:
Survey Sample Table 1:
20

Rating:
AVE. 2B 3B RBI HR 1-25% 26-50% 51-75% 76-100
%
Agustin Murillo 3B 0.337 24 1 56 10 1 2 3 4
Alan Sanchez CF 0.34 13 2 44 5 1 2 3 4
Barbaro Canizares 1B 0.374 32 0 112 29 1 2 3 4
Ben Paulsen 1B 0.292 32 10 79 18 1 2 3 4
Brad Snyder OF 0.311 29 5 60 12 1 2 3 4
Brandon Guyer LF 0.301 23 6 41 7 1 2 3 4
Brian Barden 3B 0.277 22 3 56 5 1 2 3 4
Cesar Suarez LF 0.327 35 0 80 16 1 2 3 4
Cesar Tapia C 0.345 25 3 80 11 1 2 3 4
Chris Dominguez 3B 0.294 24 5 65 15 1 2 3 4
Chris Rahl OF 0.293 21 5 42 8 1 2 3 4
Dan Robertson CF 0.285 24 9 53 2 1 2 3 4
Dean Anna 2B 0.331 38 5 73 9 1 2 3 4
Donell Linares DH 0.343 27 0 75 17 1 2 3 4
Eder Salcedo RF 0.332 29 3 43 12 1 2 3 4
Eric Campbell OF 0.314 25 3 66 8 1 2 3 4
Fernando Valenzuela
1B
0.346 26 2 56 5 1 2 3 4
Frank Diaz RF 0.36 29 2 83 21 1 2 3 4
Gregorio Petit SS 0.292 26 3 61 4 1 2 3 4
Hector Garanzuay 2B 0.331 22 2 48 10 1 2 3 4
Jaime Brena 2B 0.351 26 2 49 5 1 2 3 4
Jim Negrych 2B 0.285 27 1 44 3 1 2 3 4
Jonathan Galvez LF 0.276 24 1 51 6 1 2 3 4
Jordan Lennerton 1B 0.278 25 1 57 17 1 2 3 4
21

Survey Sample Table1 Explanation:
This table shows us what I have been surveying people on. During any point during my research,
I would send it to people, teams, or students of Nichols College to take my survey that looked
like this. When people would take this survey, they would rank the prospect depending upon
what they gave as a number.
Jose Castillo 2B 0.369 29 4 108 25 1 2 3 4
Josh Fields DH 0.289 26 3 45 4 1 2 3 4
Rating
AVE. 2B 3B RBI HR 1-25% 26-50% 51-75% 76-100
%
Leslie Anderson 0.292 28 1 74 14 1 2 3 4
Luis Fonseca RF 0.376 21 9 73 20 1 2 3 4
Luis Jimenez 1B 0.285 16 2 73 18 1 2 3 4
Luis Suarez LF 0.413 27 2 57 6 1 2 3 4
Matt Angle CF 0.283 20 8 62 8 1 2 3 4
Matt Long OF 0.293 21 6 71 14 1 2 3 4
Oswaldo Morejon 2B 0.383 36 1 66 9 1 2 3 4
Sandy Madera DH 0.39 28 3 92 19 1 2 3 4
Stefen Romero LF 0.277 23 4 76 11 1 2 3 4
Steve Tolleson 2B 0.288 28 1 53 8 1 2 3 4
Vince Belnome 1B 0.3 35 3 67 8 1 2 3 4
Willis Otanez 1B 0.356 22 0 93 26 1 2 3 4
Yangervis Solarte 2B 0.276 31 0 75 12 1 2 3 4
22

Eyeball Approach Table 2 :
23

PLAYER ESTIMATE OPS
Oswaldo Morejon 2B 1.87 0.93
Gregorio Petit SS 1.90 0.72
Jaime Brena 2B 2.03 0.90
Dan Robertson CF 2.07 0.76
Jim Negrych 2B 2.13 0.75
Vince Belnome 1B 2.17 0.85
Agustin Murillo 3B 2.20 0.91
Brandon Guyer LF 2.20 0.73
Luis Fonseca RF 2.23 1.07
Matt Long OF 2.23 0.84
Willis Otanez 1B 2.23 1.08
Jonathan Galvez LF 2.27 0.72
Brian Barden 3B 2.30 0.83
Fernando Valenzuela 1B 2.30 0.86
Steve Tolleson 2B 2.30 0.81
Alan Sanchez CF 2.33 0.82
Eder Salcedo RF 2.33 0.90
Luis Suarez LF 2.33 1.04
Sandy Madera DH 2.33 1.05
Stefen Romero LF 2.33 0.78
Brad Snyder OF 2.37 0.86
Hector Garanzuay 2B 2.37 0.87
Matt Angle CF 2.37 0.81
Donell Linares DH 2.43 0.92
Jose Castillo 2B 2.47 1.04
Dean Anna 2B 2.50 0.89
Eric Campbell OF 2.50 0.91
24

Eyeball Approach Table 2 Explanation:
This table explains how people rated the players themselves using an eyeball approach. This
table works by: If the number is high, the player is not as good. You are looking for a player who
has a ranking close to 1 on the left as you can.
OPS Table 3:
Josh Fields DH 2.53 0.74
Luis Jimenez 1B 2.53 0.85
Yangervis Solarte 2B 2.53 0.73
Frank Diaz RF 2.57 0.98
Leslie Anderson 2.57 0.83
Matt Hague 1B 2.57 0.79
Cesar Suarez LF 2.60 0.91
Cesar Tapia C 2.60 0.91
Ben Paulsen 1B 2.63 0.87
Chris Rahl OF 2.63 0.74
Jordan Lennerton 1B 2.73 0.81
Barbaro Canizares 1B 2.83 1.10
Chris Dominguez 3B 2.93 0.80
25

PLAYER ESTIMATE OPS
Barbaro Canizares 1B 2.83 1.10
Willis Otanez 1B 2.23 1.08
Luis Fonseca RF 2.23 1.07
Sandy Madera DH 2.33 1.05
Jose Castillo 2B 2.47 1.04
Luis Suarez LF 2.33 1.04
Frank Diaz RF 2.57 0.98
Oswaldo Morejon 2B 1.87 0.93
Donell Linares DH 2.43 0.92
Cesar Tapia C 2.60 0.91
Eric Campbell OF 2.50 0.91
Agustin Murillo 3B 2.20 0.91
Cesar Suarez LF 2.60 0.91
Jaime Brena 2B 2.03 0.90
Eder Salcedo RF 2.33 0.90
Dean Anna 2B 2.50 0.89
Hector Garanzuay 2B 2.37 0.87
Ben Paulsen 1B 2.63 0.87
Brad Snyder OF 2.37 0.86
Fernando Valenzuela 1B 2.30 0.86
Vince Belnome 1B 2.17 0.85
Luis Jimenez 1B 2.53 0.85
Matt Long OF 2.23 0.84
Brian Barden 3B 2.30 0.83
Leslie Anderson 2.57 0.83
Alan Sanchez CF 2.33 0.82
Jordan Lennerton 1B 2.73 0.81
26

OPS Table 3 Explanation:
This table explains their OPS. OPS (Offense Plus Slugging) shows number on the right ranging
from 1.10 to 0.72. In this case, you want a high OPS. If a player has a low OPS, which means
that you are not as good as the player in front of you. A high OPS means that there is a
probability that you will get on base a lot, but its unpredictable on how you get on base (single,
double, triple, homerun, i.e.)
Estimate Quartile Table 4:
Steve Tolleson 2B 2.30 0.81
Matt Angle CF 2.37 0.81
Chris Dominguez 3B 2.93 0.80
Matt Hague 1B 2.57 0.79
Stefen Romero LF 2.33 0.78
Dan Robertson CF 2.07 0.76
Jim Negrych 2B 2.13 0.75
Josh Fields DH 2.53 0.74
Chris Rahl OF 2.63 0.74
Brandon Guyer LF 2.20 0.73
Yangervis Solarte 2B 2.53 0.73
Gregorio Petit SS 1.90 0.72
Jonathan Galvez LF 2.27 0.72
27
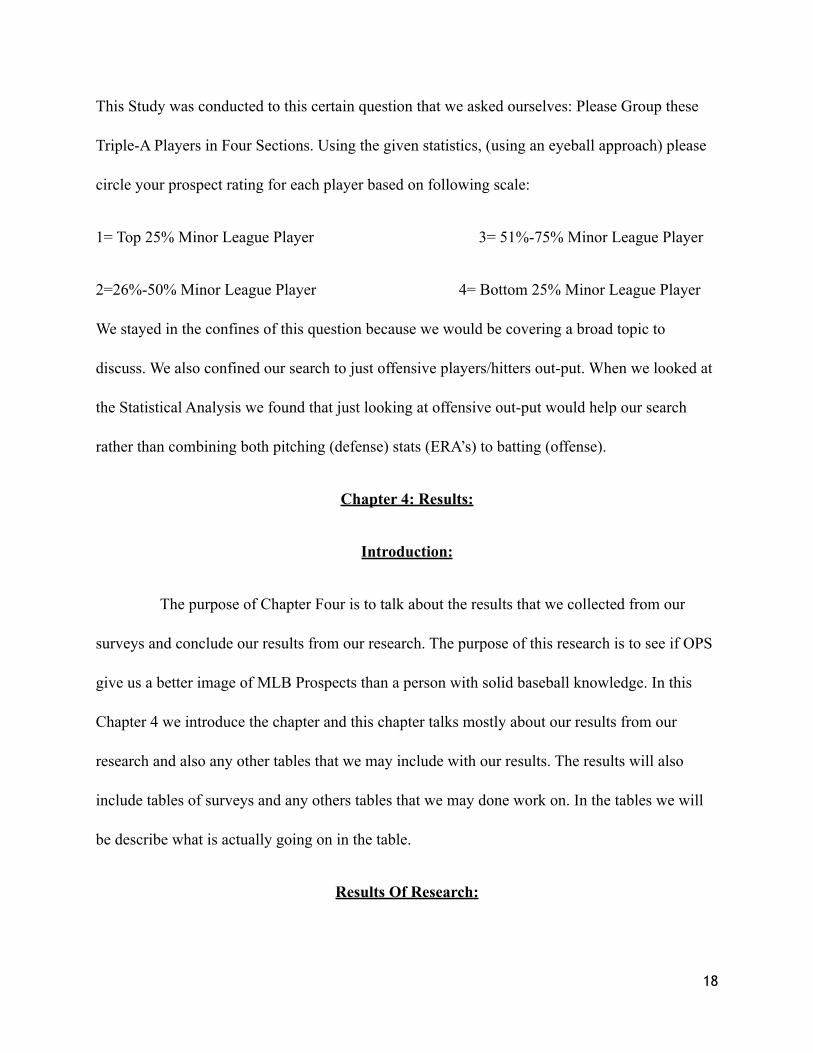
Estimate Quartile Table 4 Explanation:
This table is a quartile table and it sections the baseball prospects into 4 categories. Since these
categories are all estimates. We took the estimates and the ones that were close to 1 which was
quartile 1 were the best and top 25% of the prospects. If they were picked to be placed in
quartile 4, then they would be bottom 25% of the prospects.
OPS Table 5:
Table 5 Explanation:
Survey
Mean SDV
Quartile
1
Quartile
2
Quartile
3
Quartile
4
2.38 1.07 1.00 2.00 3.00 5
OPS
Mean SDV
Quartile
1
Quartile
2
Quartile
3
Quartile
4
0.87 0.11 0.79 0.86 0.91 1.099
28

This quartile table was an OPS Table. This table shows how the prospects were ranked by their
OPS numbers. If they were placed in Quartile 1 then they would be ranked poorly. If they were
selected and placed in Quartile 4, they were considered highly ranked and the best among the
prospects in the list.
Finished Survey Table 6:
29

Rating:
AVE. 2B 3B RBI HR 1-25% 26-50% 51-75% 76-100
%
Agustin Murillo 3B 0.337 24 1 56 10 1 2 3 4
Alan Sanchez CF 0.34 13 2 44 5 1 2 3 4
Barbaro Canizares 1B 0.374 32 0 112 29 1 2 3 4
Ben Paulsen 1B 0.292 32 10 79 18 1 2 3 4
Brad Snyder OF 0.311 29 5 60 12 1 2 3 4
Brandon Guyer LF 0.301 23 6 41 7 1 2 3 4
Brian Barden 3B 0.277 22 3 56 5 1 2 3 4
Cesar Suarez LF 0.327 35 0 80 16 1 2 3 4
Cesar Tapia C 0.345 25 3 80 11 1 2 3 4
Chris Dominguez 3B 0.294 24 5 65 15 1 2 3 4
Chris Rahl OF 0.293 21 5 42 8 1 2 3 4
Dan Robertson CF 0.285 24 9 53 2 1 2 3 4
Dean Anna 2B 0.331 38 5 73 9 1 2 3 4
Donell Linares DH 0.343 27 0 75 17 1 2 3 4
Eder Salcedo RF 0.332 29 3 43 12 1 2 3 4
Eric Campbell OF 0.314 25 3 66 8 1 2 3 4
Fernando Valenzuela
1B
0.346 26 2 56 5 1 2 3 4
Frank Diaz RF 0.36 29 2 83 21 1 2 3 4
Gregorio Petit SS 0.292 26 3 61 4 1 2 3 4
Hector Garanzuay 2B 0.331 22 2 48 10 1 2 3 4
Jaime Brena 2B 0.351 26 2 49 5 1 2 3 4
Jim Negrych 2B 0.285 27 1 44 3 1 2 3 4
Jonathan Galvez LF 0.276 24 1 51 6 1 2 3 4
Jordan Lennerton 1B 0.278 25 1 57 17 1 2 3 4
30

Finished Survey Table Explanation 6:
This table is an example of a person who took my survey. His answers are highlighted in yellow,
and show how he ranks that certain prospect. In this we see that he ranked some players at 1’s for
being poor and other players at 4 being really good.
Making Both Lists Table 7:
Jose Castillo 2B 0.369 29 4 108 25 1 2 3 4
Josh Fields DH 0.289 26 3 45 4 1 2 3 4
Leslie Anderson 0.292 28 1 74 14 1 2 3 4
Luis Fonseca RF 0.376 21 9 73 20 1 2 3 4
Luis Jimenez 1B 0.285 16 2 73 18 1 2 3 4
Luis Suarez LF 0.413 27 2 57 6 1 2 3 4
Matt Angle CF 0.283 20 8 62 8 1 2 3 4
Rating:
AVE. 2B 3B RBI HR 1-25% 26-50% 51-75% 76-100
%
Matt Hague 1B 0.285 37 2 69 8 1 2 3 4
Matt Long OF 0.293 21 6 71 14 1 2 3 4
Oswaldo Morejon 2B 0.383 36 1 66 9 1 2 3 4
Sandy Madera DH 0.39 28 3 92 19 1 2 3 4
Stefen Romero LF 0.277 23 4 76 11 1 2 3 4
Steve Tolleson 2B 0.288 28 1 53 8 1 2 3 4
Vince Belnome 1B 0.3 35 3 67 8 1 2 3 4
Willis Otanez 1B 0.356 22 0 93 26 1 2 3 4
Yangervis Solarte 2B 0.276 31 0 75 12 1 2 3 4
31

Making Both Lists Table 7 Explanation:
In the previous two tables which were Table 4+5, which were called Estimate Table and OPS
Table. This table shows players have made both Table 4 and 5. It shows there Estimate ranking
and their OPS. Some of the players that had very good OPS numbers never made it to the
estimate list or this Table at all. I combined both list into one list to show the top OPS and top
estimates to show who was ranked the best out of the possible 40 prospects.
Chapter 5:
Introduction:
The purpose of Chapter Five is to talk about how I concluded my paper and any other
conclusions that I thought about during m research. The purpose of this research is to see if OPS
gives us a better image of MLB Prospects than a person with solid baseball knowledge. In this
Chapter 5, I introduce everybody to how we concluded my paper and then we explain our
Players Making Both
Lists ESTIMATE OPS
Willis Otanez 1B 2.23 1.08
Luis Fonseca RF 2.23 1.07
Agustin Murillo 3B 2.20 0.91
Jaime Brena 2B 2.03 0.90
Oswaldo Morejon 2B 1.87 0.93
32

findings with similarities, and differences. I also talk about the possible reasons for the results
and the recent and future implications and any other Future Research.
Explanation of findings:
In my conclusion, I have researched many ways on how baseball executives and scouts
have tried to evaluated baseball prospects. Most baseball scouts have used the traditional way of
scouting, usually you have to play the game and have knowledge about the game. In the past
recent years, scouts and baseball executives have relied on statistics rather than just pure
evaluation. Now they are tracking their statistics on a computer or paper to figure out what there
statistics are. In my paper the big question that I am asking is: Does Minor League OPS provide
better projection of major league prospects success in the MLB, than a person with baseball
experience?
During my conduction of my research I have used a program called excel where I put
the numbers that people have chosen from that certain prospect. I surveyed 30 people but before
I actually put the numbers in. I put in formulas in excel to calculate and help project these 40
players myself. During these formulas we put in formulas for Total number that the person put
that prospect. I also put in averages, and the real OPS number that I took online.
I then made two tables where I found the mean, standard deviation, and took all four
quartiles for the 40 players. I then made another table called an OPS table which put the OPS’s
for all 40 players and put them into four quartiles as well. Once I calculated them, I took the
prospects that had high estimated rankings and also had high OPS and made three columns. The
33

three columns were Estimated Ranking, OPS’s, and a combined table. When I made the 3 tables,
I took the high rankings and the high OPS for all 40 projected players.
I made a cutoff point for putting projections for these players in the combined list. In
this combined list I took the highest estimated ranking and also the highest OPS as well. The list
of the combined prospects was selected by a number: Any player who had a high estimated
number close to 1. For the OPS, we had a number and it had to be over a 1 to make the list. The
cutoff point for estimated rankings was 2.30 and the cutoff point for OPS was 0.87. When I put
this survey table and survey together, I had a general sense on which players were actually good.
The players that had an overall good OPS had to be over a 1. The highest OPS that a
prospect received was a 1.10, and the lowest OPS was 0.72. The highest ranking/estimated
ranking I had was close to 1. If you had a prospect that was rated close to a 1 than he was
considered a top 25% minor league prospect. In that instance, the top number that a estimated
prospect received was a 1.87. The lowest number that a prospect number was a 2.93. There were
many prospects that had either the same number as some other prospects or the same. If the
prospect was ranked in the bottom quartile of the survey/table then they would be considered the
Bottom 25% of the Minor League prospects.
The last table that I put together was a table that was called Making Both Lists Table,
and it shows which prospects actually made both lists. If they made both list, I took them and put
them on a list where they made both. That list shows their top OPS number and their top
expected number as well.
Similarities:
34

In my research, I found some similarities when I calculated my results by putting
together tables that the prospects fell into for each category. As I mentioned above, I put together
seven tables, but the last three tables in particular were very important to my research. It showed
which prospects had the highest ratings, OPS numbers and a combined table. I thought when I
made the combined table; it became a very important table because to my research for two
reasons.
The first reason was because it showed which players made both lists for OPS numbers
and estimated numbers. The second reason is because it showed the people I am presenting to
and me which players were successful and considered good baseball players. In the world of
professional sports a lot of people in general ask how a player is evaluated and how a player can
be considered good. I think this is a good reason to show how player are evaluated but mostly
how a player is categorized and since we put them in certain categories where it means a certain
statistic.
Differences:
In my defense of my research, I did not cover anything else but offensive players so
when you look at differences and any issues. The differences is when you look at certain players
that you though that would make the list. When I looked at their real OPS numbers compared to
their evaluated numbers, it became clear to me how people feel about a certain prospect. That’s
because there was one prospect in particular that I was surprised that did not make both lists.
This prospect was a catcher named Cesar Tapia with a 2.60 for an estimated ranking
and OPS of 0.91. The uncommon characteristic for this catcher is that he did not have a high
35

enough estimated ranking but ended up with a high OPS. The only reason why I say that is
because Cesar had a high batting average with a lot more doubles than a normal catcher would
have. He had a lot of homeruns and could hit for power.
Possible Reasons for Results:
The possible reasons for results was that I tried to keep the prospects with similar
statistics. Their statistics could be higher or altered if they were called up by a Major League
team and put up big numbers. The other reason why was because I pulled players from three
different leagues and the people that are being surveyed are just college students. The people that
were surveyed are just normal people and not professional executives and scouts.
These college students from Nichols are students that watch the game because they
love it and are addicted to it, but I feel that they look at batting averages, homeruns and RBI’s
(Runs Batted In) rather than look at the combined statistics that scouts look at during a daily
basis. Executives look at a wide range of possibilities when they look at certain players they
acquire or draft prospects and people usually only look at power numbers. I put in all of the
calculations and I feel that the surveyed prospects for power rather than producing runs or just
getting on base. When I look at OPS, the statistic is mostly used for offensive statistics. They
look at it, and try to analyze the results and try to figure out how much do the player reaches base
and how often do they reach base.
Implications:
36

The Implications about my research is that when you survey only 30 people, the
numbers tend to only tell you a small portion of how that certain player performed. Since I only
looked at once combined statistic, we tend to not believe the numbers that are calculated. Even
though I calculated them all, I tend to only see parts of the research. As people, we all tend to
look information and always think of the number of possibilities of why the player did not
perform, or did not do well. Since its only research, I feel that you have survey more people than
30 but that was the target number that I was looking survey. I have a sample size that shows us
how the player performed offensively but does not show the whole picture.
As a baseball fan, I look at many statistics but for every phase of the game, there is a
different statistics that can tell why that player as not performed well. I also targeted 40 different
players for each league, so I could have looked at more players than only 40. The difference of
the sample size can tell how the players are categorized and rated and surveyed.
Future Research:
Back then in baseball, statistics were not as prevalent back in the 70’s, 80’s, as it is
today. Now that statistics is so huge: books, movies, magazines, and other research has become
popular to sports fans that watch the sport. Since I did this, I have learned a lot even though we
only looked one portion of statistics. There are many other statistic research projects, and thesis
projects that can be conducted. There are several topics that I have not covered in my research
that are so huge in baseball. I love baseball and have a huge passion for it. But, in the end when
you focus on baseball statistics you tend to focus on one rather than hundreds of other formulas
and other statistics that can help people with arguments when they try to figure out which player
37

is better and how they are better. Since I can only predict and show so many results, I feel that
there could be many other ideas that people can do to find out how that player is successful and
his offensive output.
In the future, I think baseball will become statistically driven besides the traditional
scouting. There are so many ways to predict a players outcome and try to figure out how they are
doing it.
References:
Baseball Reference. (n.d.). Retrieved from http://www.baseball-reference.com/bullpen/
Sabermetrics
Baseball statistics - BR Bullpen. (n.d.). Retrieved from http://www.baseball-reference.com/bpv/
index.php?title=Baseball_statistics&oldid=1700127063
contributors, W. (November , 16 2013). Moneyball. Retrieved from http://en.wikipedia.org/w/
index.php?title=Moneyball&oldid=581871261
contributors, W. (November , 22 2013). General manager. Retrieved from http://
en.wikipedia.org/w/index.php?title=General_manager&oldid=580429913
contributors, W. (November, 16 2013). billy beane. Retrieved from http://en.wikipedia.org/wiki/
Billy_Beane
38

contributors, W. (November, 21 2013). oakland athletics. Retrieved from http://en.wikipedia.org/
w/index.php?title=Oakland_Athletics&oldid=582618465
Farrar,Bruggink, A. (2011). A new test of the moneyball hypothesis. United States Sports
Academy, The Sport Journal , 14,
Gerrard, B. (2007). Is the moneyball approach transferable to complex invasion team sports.
Gillette, Palmer , G. (March, 17 2012). Henry chadwick. Retrieved from http://www.baseball-
reference.com/bullpen/Henry_Chadwick
http://www.baseball-reference.com/bullpen/Wins_Above_Replacement
http://www.milb.com/milb/stats/
International Journal of Sport Finance, 2, 214-230.
Is The Moneyball Approach. Gerrard, B. (2007) International of Sport Finance
Lewis, M. (2003). The art of winning an unfair game. . New York: W.W. Norton
Lindsey,Cook,Cramer Palmer, Albert, G. (November, 29 2012). Sabermetrics. Retrieved from
Smith,Palmer, Gillette, S. (July, 27 2012). Bill james. Retrieved from http://www.baseball-
reference.com/bullpen/Bill_James_(author)
Smith,Palmer,Gillette, S. (October , 11 2012). Baseball statistics. Retrieved from http://
www.baseball-reference.com/bullpen/Baseball_statistics
39

Tongo,Smith,Palmer,Gillette, T. (July, 4 2013). Wins above replacement. Retrieved from http://
www.baseball-reference.com/bullpen/Wins_Above_Replacement
Wikipedia , C. (November, 19 2013). Scout (sport). Retrieved from http://en.wikipedia.org/w/
index.php?title=Scout_(sport)&oldid=582403885
Wolfe,et al. (2007). Moneyball: A business perspective.International Journal of Sport
Finance , 2(4), 250-263.
40