Embed Size (px)
Citation preview
\九
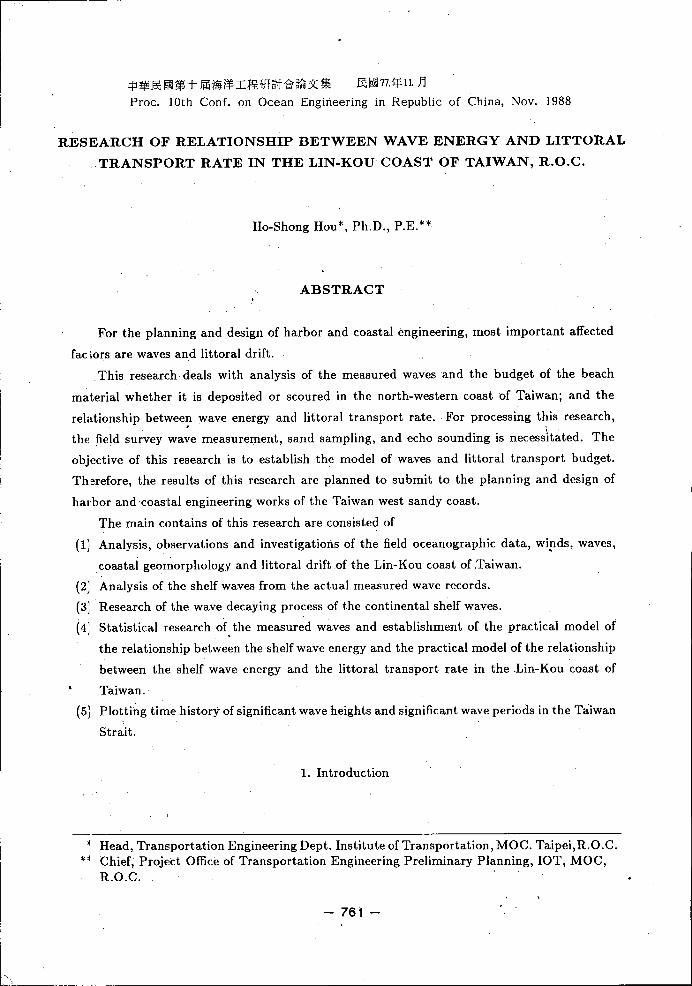
中華民國第十屆海洋工程研討會論文集民國 77.年11. 月
Proc. 10th Conf. on Ocean Engineering in Republic of China,Nov. 1988
RESEARCH Ol~ RELATIONSHIP BETWEEN WAVE ENERGY AND LITTORAL
TRANSPORT RATE IN THE LIN-KOU COAST OF TAIWAN ,R.O.C.
Ho-Shong Hou*,Ph.D. ,P.E. **
ABSTRACT
For the planning and design of harbor and coastal engineering ,most important affected
fadors are waves and littoral drift.
This research deals with analysis of the measured wavesand the budget of the beach
material whether it is deposited or scoured in the north-western coast of Taiwan; and the
relationship between wave energy and littoral transport rate. For processing this research ,the field survey wave measurement ,sand sampling ,and echo sounding is necessitated. The
objective of this research is to establish the model of waves and littoral transport budget.
Therefore ,the r,esults of this research are planned to submit to the planning and design of
hal'bor andcoastal engineering works of the Taiwan west sandy coast.
The main contains of this research are consisted of
(lJ Analysis ,observations and investigations of the field oceanographic data ,winds ,waves,coastal geomorphology and littoral driftof the Lin-Kou coast of‘Taiwan.
(2; Analysis of the shelf waves from the actual measured wave records.
(3; Research of the wave decaying process of the continental shelf waves.
(4; Statistical research of the measured waves and establishment of the practical model of
the relationship between the shelf wave energy and the practical model of the relationship
between the shelf wave energy and the littoral transport rate in the Lin-Kou coast of
Taiwan.
(5; Plotting time history of significant wave heights and sigIiificant wave periods in the Taiwan
Strait.
1. Introduction
場 Head ,Transportation Engineering Dept. Institute of Transportation ,齡10G. Taipei ,R.O.C.料 Chief,Proje:ct Office of Transportation Engineering Preliminary Planning ,IOT ,MOC ,
R.O.C.
- 761 一
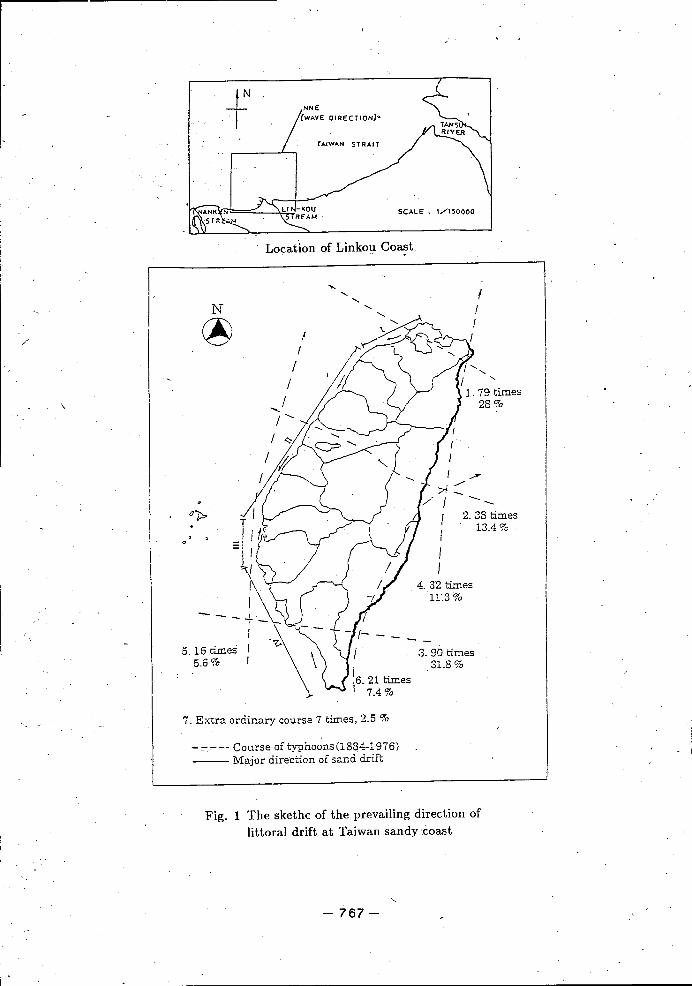
Basedon the wave pattern ,the geographical location and the disposition óf rivers,thelittoral drift moves predominantly fr.om Lin-Kou to SW'direction in section 1 臼 shown in
Fig. 1. Tansui rivers of ample stream bring tremendous amount of sediments from the high
mountain to the 間的 ore of恥 section in typhoon 閻部on (i.e. from June to September)
But for the winter monsoon season,i.e. from October to the next April,the waves induced by
NE monsoons migrate littoral drift from north toward south.
Applying the energy approach for unidirectional steady flow derived by Bagnold (1963),the theoretical relationship between the littoral immersed weig~t transport rate and the along-
shore breaking wave energy is found out. It reveals that the relationship is not strictly linear ,
i.e. the larger part of the alongshore breaking wave energy is supplied for transporting the sed-
iment as the former increases. But for a coast having a steady oceanographical condition ,the
relationship could be considered as linear relation since the alongshore bteaking wave energyis not varying véry much.
By using the shelf wavé records and the littoral drift quantity obtained fróm long-terin
echo-sounding map,the relationship between alongshore breaking wave energy and Iittoralimmersed weight transport rate isfound out.
2. Information of Oceanographical Data
For the movable- bad investigation of Lir
of Ta剖iwan吋),the following field irivestigation is undertaken.
(1) Wind & Waves: The monsoon of this area starts from September to April of the next
year,the prevailing wind direction is NE-ENE ,andthe wave direction if the nearshore
in NNE,the maximum wave height of strong monsoon is 4M,while the wave period is
9.0 sec. The mximum significant wave h~ight of hurricane attacking H1月=4.75 M,the
corresponqing period T1/3 = 12 sec.
(2) River sedi~ent discharge: The sediment which affects obviously on the Lin-Kou Power
Plant is from the Tansui River,the river sediment transport rate is 6.095 X 10⁶ MT/year.
(3) Littoral transport: Based on the sounding data of Li叫(ou coastal area,including survey
maps of 1971,1975,cognized that sediment transport toward south.
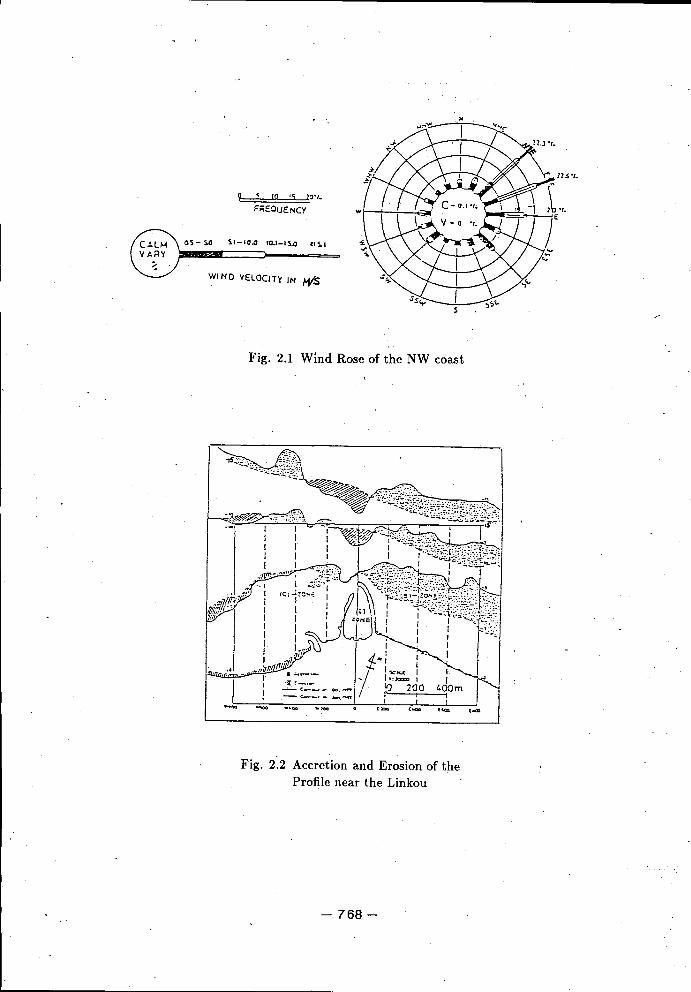
(a) Coastal morphology: The mean beach slope of nearshore zone is 1/66,the sea-bed
slope of depths from -15 M to -20 M is 1/300 ,is flat,the profile near the intake、
structure is steeper than those ofother profile. Therefore ,it is very c1ear that the
'effect of wave action is severe,the Iittoral transport is obvious as Fig. 2.2 shown.
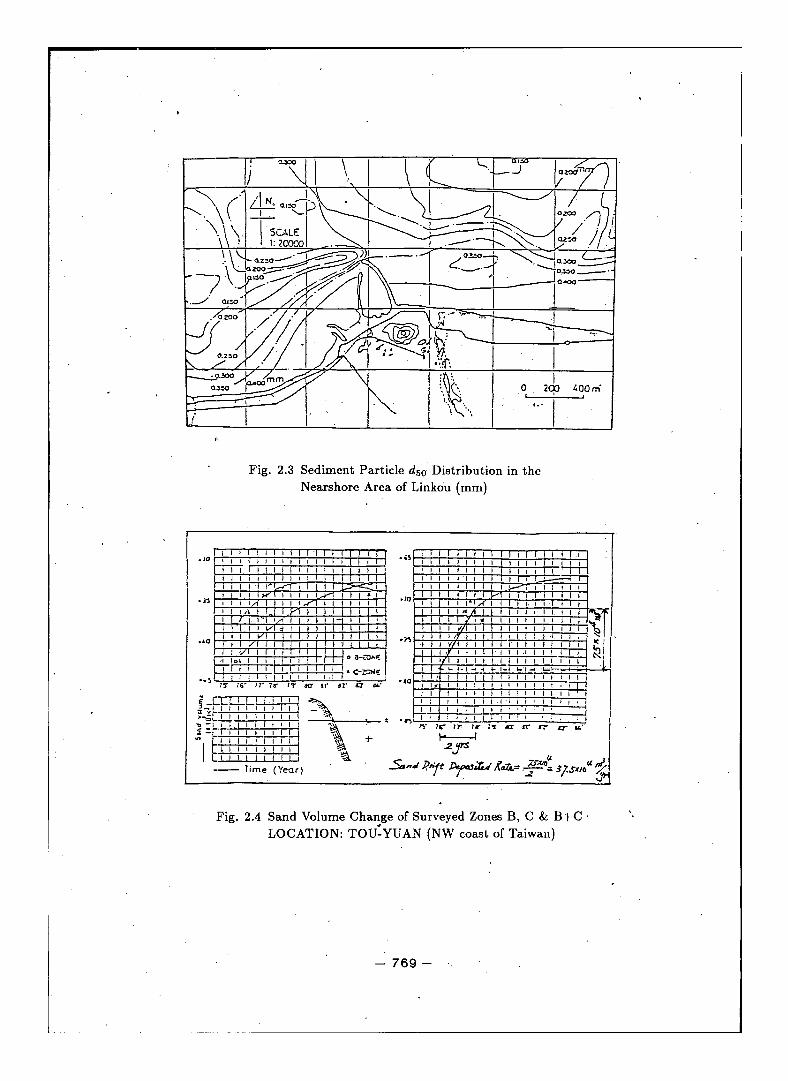
(b) Sediment particle: Based on the field measurement ,the coastal area of this region
- 762 一
/
spreads.over the co~ble stone,the distribution ,of sand particle after seive analysis is
shown as Fig. 2.3. From the figure,the sediments ofthe breaking zone and inner
shore zone of the power plant area dso = 0.3一0.4 m/m ,while contour of -5 M to
-10 M'I 也o is 0.2 m/m ,therefore the sand particle of thè upstream of the plantsite
is bigger than that of the downstream site,it is recognized that the littoral transport
direction is from north to south ,as shown in Fig. 2.3.
(c) Littoral tra.nsport rate: Based on the echo sounding data ,using mesh method to
calculate the littoral transport' rate. of the deposit sand around the coastal area 'of
the plant site. It is 37.5 X 10⁴ M3 jyear ,and could be dound out from Fig. 2.4.
(d) Tide and tidal current: The tide is belong to semidiurnal tide. The mean high water
level of thespring tide is 3.1 M,while the mean low water level of the spring tide is
-0.3 M. Tidal current is measured about 0.75 m/seè 01'so.
3. Statistical Analysis of Self Waves
Waves in Taiwan Strai~,i.e. self waves,are to be divided into three patterns -i.e.,waves in
winter monsoon,waves in hurricane and waves generated by conveetiv.e wind in the summer.
StatisticáJ characteristics of significant waves extracted' from the meteorological and wave
m'lasuri 時 records along the condinental self for 4 years (Tang,1986).
Wave records obtained from cassette type wave meter are continuously measuring the
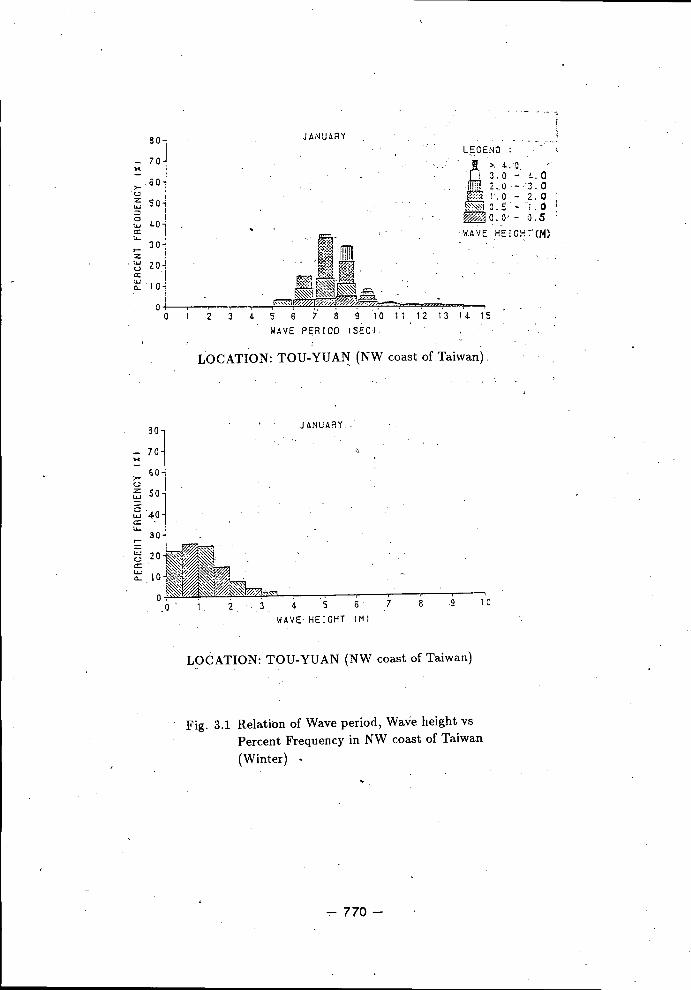
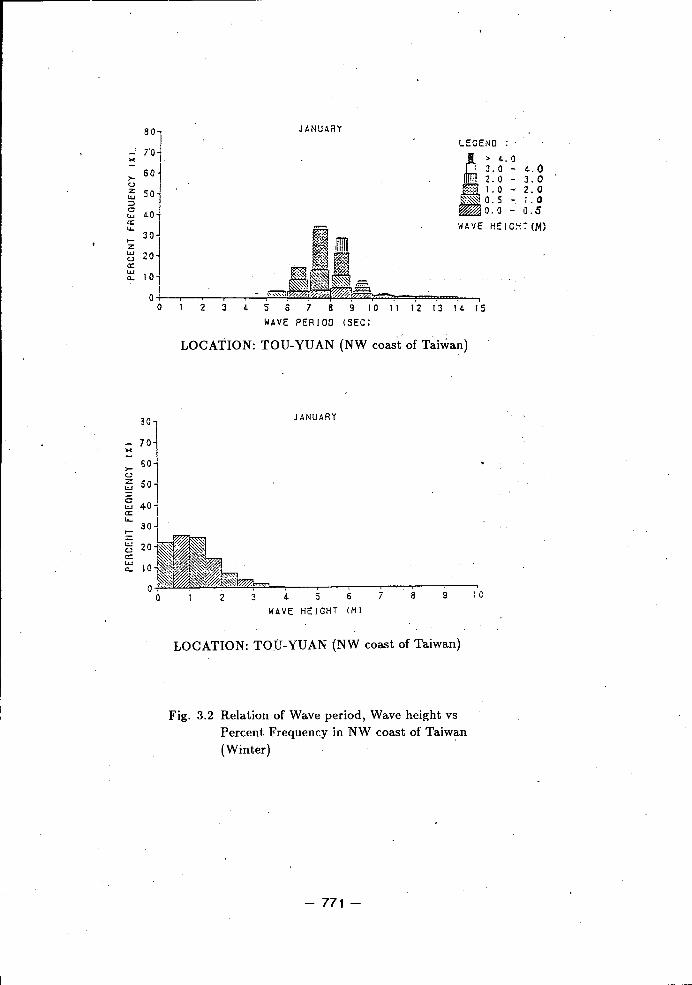
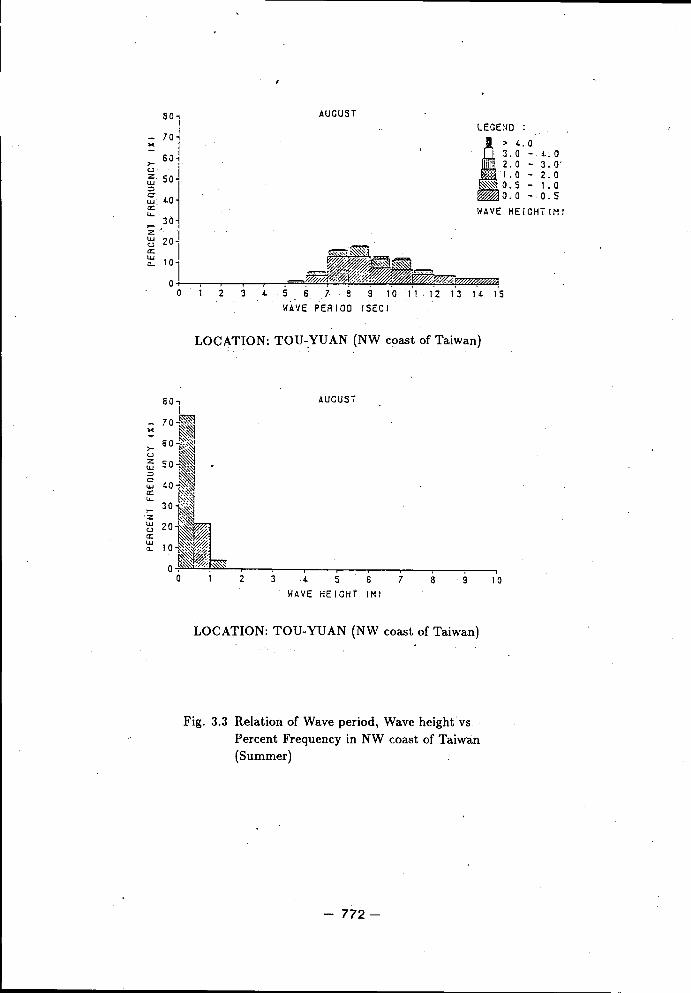
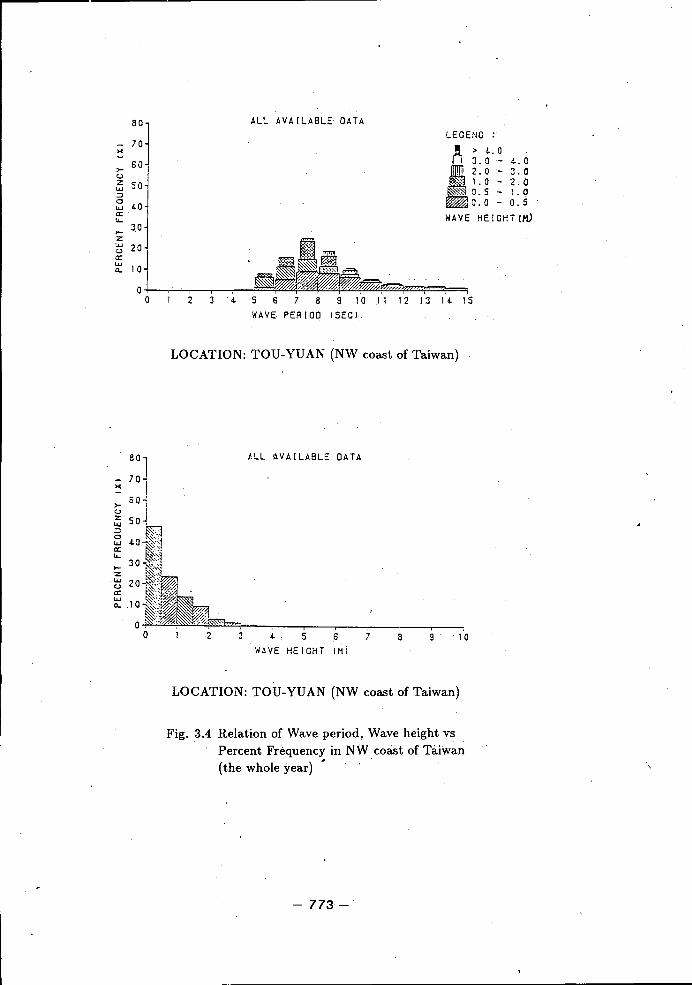
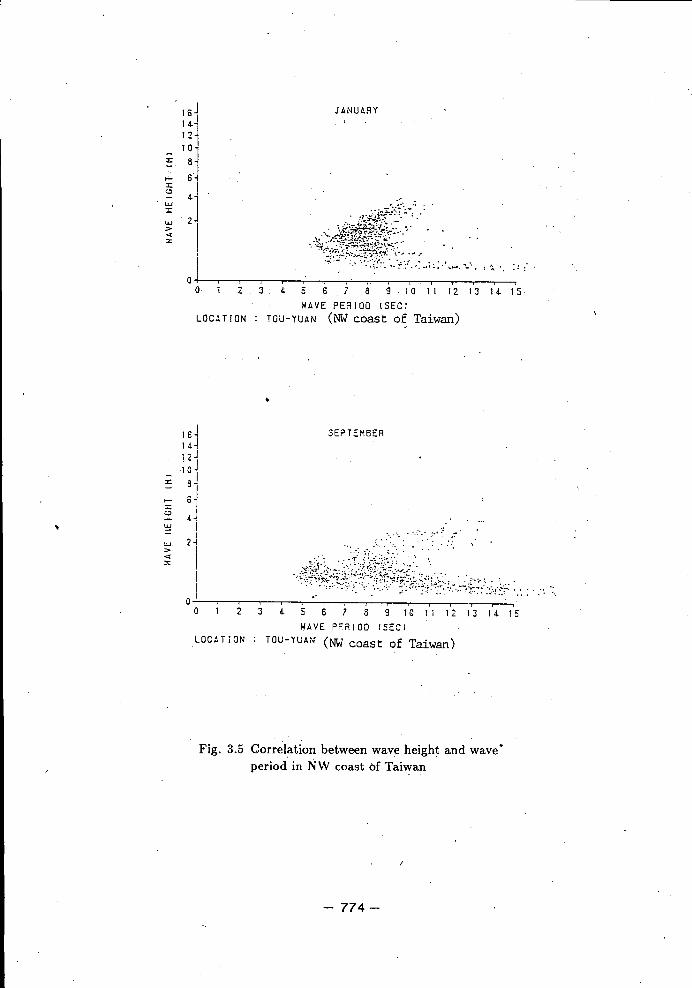
whole year in the NW co臼 t 10cated in the nearshore area of Linkou,Fig. 3.1,Fig. 3.2,Fig. 3.3,and Fig. 3.4 show that relationship between wave period ,wave height VS percent
fn'quency in January (winter) ,is August (summer) and the whole year's record (all available
data) while Fig. 3.5 shows that correlation between wave height and wave period in January'
and in September. Their range for wave height is from 20 cm to 4 m,wave period is from
5 日ec to 15 sec 01'more. The waves in the NW coast are slightly stronger that those of the
mid- West coast of Taiwan.
4. The calculation of the alongshore breaking wave energy
The wave is affected by the effects of shoaling,refraction ,bottom friction and percolation.
By neglecting the e叮'ects of bottom friction and percolation as wave is propagating toward the
su:f zone,there the breaking wave height is equal to
H=HoK ,.Ks
- 763一
..( 4-'-1)
•'" ( 4一3 )
'"(4- 4 )
.........( 4-2) 、
........ ( 4-5 )
tank khcz=(f)
K,= ( B./B) 2
K. = ( Cg./Cg )了
where Kr and Ks arè-refraction coefficient and shoaling coefficient respectively. The mathe-matical representation is as follows
where B is the separation of the wave rays and prefix “0" represents 、the characters of deep
water. As the bottom slope is smaller than 1/10,then Kr and Ks could be caIculated from
the four equations derived by Chao,Y.Y. (1970) 前 follows
1 dr rI
H. (Cg). B. =H2 •Cg ﹒B = cons tant .....•... ( 4 - 6 )
d2B2 _'"_ dB一了了τ_ P(l) 一~:--+P(2)B=OU:S Q S '" ( 4一7 )
PCl) =~(川之三+sinoi 三)Cυx Oy '''(4-8)
P (2) =土(s in2()些-2 s in θcos θ一-a2Cc ,---- ax2 ~ v...v ,",v",v axay + cos2θ375) ( 4-9 )
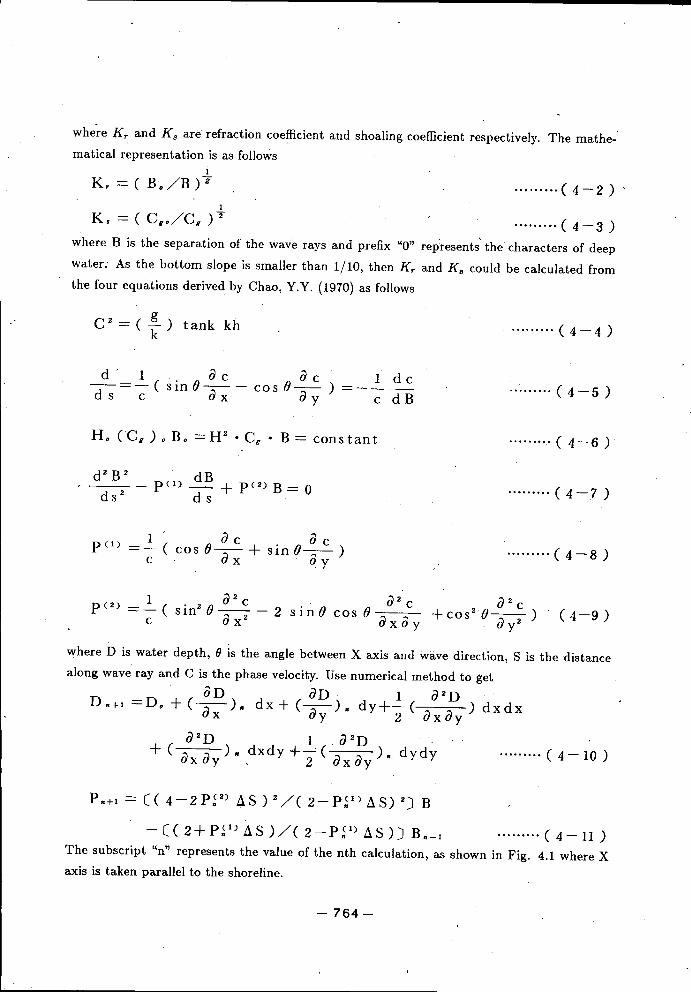
where D is water depth,8 is the angle between X axis and wave direction ,S is the distancealong wave ray and C is the phase velocity. Use numerical method to getaD , 1 " aD , 1 _ a2D
Dn+1=D.+( ;:一九dx + (一一)n dy+ 一(-一一一一)dxdxa x ' n - •• ,,a y "n ~,I 2 ' a x a ya2D . 1 、 a2D+(737)" 、dxdyy( 石ay L dydy .... ( 4 - 10 )
Pn+l = C( 4-2P~2) LlS) 2/( 2-P~1) LlS) 2) B
一C( 2+P~I) LlS )/( 2-P~I) LlS)) B← 1 ( 4 - 11 )
The subscript “n" represents the value of the nth caIculation ,as shown in Fig. 4.1 where Xaxis is taken parallel to the shoreline.
- 764 一
Develloping these 'numericaI caIculations toget “THE WAVE CHARACTER COMPUT-
ING PROGRAM" ‘(HOU,1980),the wave characters such as Kr ,Ks ,H,Cg and 8 could. be
found out at any water depth h=D. Since 8= ~一α 品 shown in Fig. 4.1,then
:prh=jmf(cg)bωθð S叫( 4-12 )
is tl.e alongshore breaking wave energy. For the self wave energy it is obtained 品 (Peh =2.25x 10¹⁰ kgm2/sec2/m - yr.
~. Relation:ship between shelf waves and IittoraI drift in the NW coast of Taiwan
From the echo sounding data ,the IittoraI transport rate (Ie) of the NW coast is caIculated
由 37.5 x 10⁴m3 IyrIe and (Peh are in units of cgs system.
But for the Taiwan Strait where the cIimate is so steady that the alongshore breaking
wav,~energy fluctuate sIightly,the relationship between Ie and (Pih could be expressed 卸
"
[,=KCP ,)ð .....(5-1 )
WhereK is constant and is equaI to 0.14 for the north western coast of Taiwan.
TheNW coa.st has the rela.tion of Ie = 0.14 (Peh ,This equation could be a.ppIied for
the <:oast of simiIar oceanographic conditions and beach characteristics to estimate the IittoraI
transport rate. Therefore ,the harbor planning and shore protection could be based on.
The re叫Ia叫tionshi句p between Ie and (Peh is not exact IinearIy proportionaI to each other ,
this is proved by Eq. (5手)which is originaIIy prepared by Komar and Inman (1970) there is
a upper Iimit K=Q.77. Adding the data of the au中肘,reanalyzing the totaI data by the Ieast
squa.re tnethod to get a regression line which is expressed as Ie = 0.154 (Pe) 1.0695 部 shown in
Fig. 5.1.
["= 0.154 ( P,)1.0695 ''',(5-2)
The regression eqution is more practicaI use than that of öbtaining from Komar (1970).
The 可fore it is recommended Eq. (5-2) be the optimaI soIution for the relation of the alongshore
breaking wave energy and the immersed weight transport rate.
- 765一‧
'\:Reference
1. Bagnold ,R.A. (1963) “Mechanics of Marine Sedimentation ,"工旦旦旦旦i車;Interscience Pub-
lishers,New York,3:507-528.
2. Komar ,P.D. and D.L. Inman (1970) “Longshore Sand Transport on Beaches" ,J. of
Geophysical Research ,Vol.' 76,No.' 3.
3. Taiwan Power Co. (1980) 吋he Research Report of Littoral Transport of Lin-Kou Power
Plant".
4. H.S. Hou; C.P. Lee,G.H. Weng ,and T.J. Liaw (1980),“The Movable-Bed ModelInves----tigation of North-East Sandy Coast of Taiwan".
5; H..S. Hou,C.P. Lee and L.H. Lin (1980) “Relationship Between Alongshore Wave En-
ergy and Littoral Drift in the Mid- West Coast at Taiwan ,R.O.C." 17th ICCE. Sydney,
Australia ,Sept.,1980.
6.1H.S. Houj T.J. Liaw (1982),“The Movable-Bed Model Investigation of the 2nd Tan-
sui FisheryHarbor Out-:areakwater Construction Stage". Reseàrch Rpt. of NTC 孔1ST.,Keelung.
7. H.S. Hou (1982),“Researches of Harbor Site Investigation ,Planning ,and Design of
Coastal Shipping System in Taiwan ,R.O.C." ,Special Report No. 7 by Institute ofHarbor
and 1\在arine Technology.
8. Rs. Hou,T;J. Liaw (1983),“Hydraulic Model Experiments Detealwith Shoali時 Problem
of Littoral Transport for Improvement on the Intake and Outlet of Lin-K<.'uPower Plant" ,'Special Report N6. 12 by Institute of Harbor and Mfarine Technology.
9. H.S. Hou. (1985) “Littoral Drift Model Investigationalong the Taiw.an coast and Research
of the Related Problem of Inlet Planning 、(11),"NTU-INA-Tech Rept. 216.
10. H.S. Hou (1986),“G品 e St吋y-Model Study of Lin-Kou Power Plant" Short Co~rse ,20th
ICCE ,Dynamics of Sand Beaches. Nov. 8-9,1986,The Olympic Hotel ,Taipei ,R.O.C.
11. F.L.W. Tang (1986) ,“Wave Forecasting and Wave Statistics in Taiwan Strait" Short
Course ,20th ICCE ,Dynamics of Sand Beaches. Nov. 8-9,1986,The Olympic Hotel ,Taiysei ,R.O.C.
12. H.S. Hou (1987) “Offshore Mechanics and Research of the Related Problems of Port
Planning (III)" NTU-INA Tech Rept. 248.
- 766一‧
f NNE'(WAVE DIRECTlON) ﹒
T.A.IWAN STRA'T
SCAL E ; t/tSODOD
/
\
@
Oþ.
Location of Linkou Coast
7. Extra ordinary course 7 tim白, 2.5%
-' 0- - -- Course oftyphoons (1884~1976ì一一-Major direetion ofs<lnùdrift
Fig. 1 The skethc of the prevailing direction oflittoral drift at Taiwan sandy \coast
- 767 一
.L....l且~O"I.FREOUENCY w
Q.s- s.o ~I-la.o '0.1-11.0 lts'1
WI NO VELOCITY IN MIS
Fig. 2.1 WÎnd Rose of the NW coast
,‧‧.
Fig. 2.2 Accretion and Erosion of theProfile near the Linkou
- 768 一
JANUARYLEGEND
f!I >: 4.. 口I I 3.0 - 4.. a1I1!!~2. 0 - '3. 0豆豆 1'.0 - 2.0~~?心1 0.5 - i. 0 '_. __.毯鈞。 .0' - 1).5
W.A'IEHEIG 只7(M}
2 4
麗還闖
關心鼠忌~~穿亨 r~乏了斗 ;p彷圳芬芳月~~ 自
13 14. 15
LOCATION: TOU-YUAN (NW coast ofTaiwan)
JANUARY
冒.......叮.,,/.'/Ao:、;..........;r;一一⋯4. 5 Ô 7 89 1 C
WAVE. HEIGHT (MJ
LOCATION: TOU-YUAN (NW coast of Taiwan)
Fig. 3.1 Relatiön of Wave period ,Wave height vsPercent Frequency in NW coast of Taiwan(Winter)
‧.,.-770一
LEGEN 口
囝> 4..0I I :3.0 - ~. 0!!~ 2.1) - :3. 0
r~::::;j 1.0 - 2.0~~~~ O. 5 - i. 0傷侈~?O.O - 0.5
WA'IE HEIGH7(M}
。+-.2 3
JANUARY
問鸝忌"11 12 13 14. 15
LOCATION: TOU-YUAN (NW coast of Taiwan)
JANUAAY
4. 5 6 7 8 9 10
WAVE HEIGHT IMl
LOCATION: TOÚ-YUAN (NW coast of Taiwan)
Fig. 3.2 Relation of Wave period ,Wave height vsPercent Frequency in NW coast of Taiwan(Winter)
- 771 一
AUCUSTLECENO
1iI > 4..0113.0-4.~O附 R2.0-3.0'齡必 1.0 - 2.0良心刻。 .5 - 1.0路必須 0.0 - 0.5
WAVE HEiCHïl 鬥!
2 3 4 14. 15
LOCATION: TOU-.YUAN (NW coast of Taiwan)
2 3
AUCUST
4. 5 6WAVE HEICHi IMI
7 8 g 10
LOCATION: TOU-YUAN (NW coast of Taiwan)
Fig. 3.3 Relation of Wave period ,Wave heightvsPercent Frequency in NW coast of Taiw'àn(Summer)
- 772一
~~l ALL AVAlLABLE. DATALEGENG
!'l > 4..0I I 3.0- 4..0川1'1 2.0- 3. 0監量 1.0 - 2.0心心呵。.s - !. 0Z忽忽 0.0 - 0.5WAVE HE!GHï 【川
2 3 4J么且已=
11 1213 14. 15
LOCATION: TOU-YUAN (NW coast of Taiwan)
ALL 也 VAlLABLE DATA
s1M
7 8 g 10
LOCATION: TOU-YUAN (NW coast of Taiwan)
Fig. 3.4 Relation of Wave period ,Wave height vsPercent Frequency in NW coast of Táiwan(the whole year)
- 773 一
、\
JANUAAY
43T
'‘4已
..'.,~-...:、.-一.
,',立:~弋戶J‘、主添加言學:~.~:.γ'.這一三?芯苓可!~;-\~'"..:.:..
.三」ιJ九已:.-:戶〉」之、卅旭弓';Aι~~'~.'-'.'‘.::.~♂:~(:-......'!'.:1. ,:..::斗;,a 三'.\-,
S 6 7 8 9 10 11 12 13 14. 15WAVE PERIOO ISECI
LOC.1T 1ON : TOU-YUAN (NWcoast of Taiw.血)
-z-.-zζ2-wzw>4 司EZ
..
3EPTEM 日EA
2 3 4.
、
-zF--<:>-wzw>〈霍
::.::
.、、μ.'
'0'''' ;';..-:皂、
咕;三;J 忌。‘、".的君主三..."﹒、.一惜之九心.'"-~、.,叫:甘心,凡
3γ〕 λ.' -.: .....::.. •.' :..r.~..;-...._.‘叮"戶..",九..:-、---- :........;..,.....:..:.‧‧ -'..'
5 6 7 8 9 10 11 12 13 14. 15WAVE PFRIOO (SECl
LDC.1TION : TOU-YUAN (NWcoast of Taiwan)
Fig. 3.5 Correlation between wave height and wave.period in NW coast óf Taiwan
-774 一

Y
wave ray
Pl (XJ.,Yl)
但-
XFig. 4.1 The diagram of the wave refraction
1dζ3
‘J'"
2、‘'
10'" 105 106 1d 1d 1d(Púb{EC(\~ SincL,C"s肉,問 /s~c:.-c:n
F尪 .5.1 The relationship of the alongshore breàking waveenergy and the immersed weight transport rate
- 775一

台灣地區北部林口海岸漂沙量與波浪能量關係之研究
儀和雄,
摘要
*研究旨在針對西北部林口海岸進行漂沙輿波浪關係之探討,蒐集歷年實
測水深圖,以網格法分析漂沙量,並由渡?良實測資料,考慮波浪由外海至近岸
之渡浪折射殼果,計算整年之碎控能量比較分析,並求得兩者問之實際關係式作
為海岸規劃設計之依釀。
本文並探討林口海岸之海氣象條件,且與海峽渡浪(台中港外海〉分析比/
較因此略可瞭解海峽按浪對台灣西部區海岸漂沙之影響,提供今後海岸開發之
參考。
交通部運輸研究所運輸工程組組長
交通部運輸研究所專案計畫室主任
- 776 一