Embed Size (px)
Citation preview

MNRAS 000, 1–18 (2016) Preprint 5 October 2018 Compiled using MNRAS LATEX style file v3.0
Uncertainties in s-process nucleosynthesis in massive starsdetermined by Monte Carlo variations
N. Nishimura (西村信哉)1,2?†, R. Hirschi1,3†, T. Rauscher4,5†, A. St. J. Murphy6†and G. Cescutti5,7†1 Astrophysics Group, Faculty of Natural Sciences, Keele University, Keele ST5 5BG, UK2 Yukawa Institute for Theoretical Physics, Kyoto University, Kyoto 606-8502, Japan3 Kavli IPMU (WPI), University of Tokyo, Kashiwa 277-8583, Japan4 Department of Physics, University of Basel, 4056 Basel, Switzerland5 Centre for Astrophysics Research, University of Hertfordshire, Hatfield AL10 9AB, UK6 School of Physics, University of Edinburgh, Edinburgh EH9 3JZ, UK7 INAF, Osservatorio Astronomico di Trieste, I-34131 Trieste, Italy
Accepted 2017 March 17. Received 2017 March 17; in original form 2016 December
ABSTRACTThe s-process in massive stars produces the weak component of the s-process (nu-clei up to A ∼ 90), in amounts that match solar abundances. For heavier isotopes,such as barium, production through neutron capture is significantly enhanced in verymetal-poor stars with fast rotation. However, detailed theoretical predictions for theresulting final s-process abundances have important uncertainties caused both by theunderlying uncertainties in the nuclear physics (principally neutron capture reactionand β-decay rates) as well as by the stellar evolution modeling. In this work, we inves-tigated the impact of nuclear-physics uncertainties relevant to the s-process in massivestars. Using a Monte-Carlo based approach, we performed extensive nuclear reactionnetwork calculations that include newly evaluated upper and lower limits for the indi-vidual temperature dependent reaction rates. We found that most of the uncertaintyin the final abundances is caused by uncertainties in the neutron capture rates, whileβ-decay rate uncertainties affect only a few nuclei near s-process branchings. The s-process in rotating metal-poor stars shows quantitatively different uncertainties andkey reactions, although the qualitative characteristics are similar. We confirmed thatour results do not significantly change at different metallicities for fast rotating mas-sive stars in the very low metallicity regime. We highlight which of the identified keyreactions are realistic candidates for improved measurement by future experiments.
Key words: nuclear reactions, nucleosynthesis, abundances — stars: evolution —stars: massive — stars: abundances — stars: rotation — galaxies: abundances
? e-mail: [email protected]† BRIDGCE UK Network; www.bridgce.ac.uk
© 2016 The Authors
arX
iv:1
701.
0048
9v3
[as
tro-
ph.S
R]
25
May
201
7

2 Nishimura el al.
1 INTRODUCTION
The slow neutron capture process, the s-process (see, e.g.Burbidge et al. 1957; Seeger et al. 1965), is one of the majornucleosynthesis processes. It produces heavy elements be-yond iron by sequences of neutron captures and β-decays.The principal characteristic of this process is that the timescale for neutron capture is generally much slower (� 1 yr)than for β-decay, even for ground states of nuclei near sta-bility, resulting in the main s-process nucleosynthesis pathto lie along the “β-stable valley” of the chart of nuclei. Thes-process begins from seed nuclei, which are mainly the 56Fenuclei initially present in the star, and proceeds by captur-ing neutrons released from (α,n) reactions on lighter nuclei(lighter that than the iron group) occurring in stellar nu-clear burning. Massive stars (& 10 M�) are considered tobe the main astronomical site for the weak s-process (here-after the ws-process), producing the weak component of thes-process, responsible for nuclides with mass numbers up toA ∼ 90 (e.g., Prantzos et al. 1990; Pignatari et al. 2010).On the other hand, thermal pulses in low mass asymptoticgiant branch stars are the site of the main s-process, pro-ducing the main component (see e.g., Kappeler et al. 2011;Bisterzo et al. 2015, and references therein).
Considering the ws-process, this occurs in helium-coreand carbon-shell burning phases of massive stars. The evo-lution of the star is governed by several fusion reactions,e.g., the triple-α reaction (Suda et al. 2011; Kikuchi et al.2012), 12C + α → 16O in helium burning, and 12C + 12Cin carbon burning (Bennett et al. 2012; Pignatari et al.2013). The impact of uncertainty for these reactions on thews-process has been investigated for stellar temperatures∼ 200 MK ≡ 17.2 keV (for recent studies, see, Tur et al. 2009;Jones et al. 2015, and references therein). The main neutronsource reaction for massive star evolution is 22Ne(α, n)25Mg,while the competing 22Ne(α, γ)26Mg reaction reduces theproduction of source neutrons, and, notably, has a reactionrate that is still uncertain. Recent studies (Rauscher et al.2002; Hoffman et al. 2002; Longland et al. 2012; Nishimuraet al. 2014) have revealed that, for a reasonable range ofupdated nuclear physics properties, the ratio of the rates ofthe 22Ne(α, n)25Mg reaction to the 22Ne(α, γ)26Mg reactionhas a significant impact on the final ws-process products.
At solar metallicity, rotation-induced mixing enhancesws-process production by a factor of up to a few, but the gen-eral production and the nucleosynthesis path are the samein rotating as in non-rotating models. It is thus not neces-sary to consider additional models for rotating stars to studythe impact of nuclear uncertainties on the ws-process at so-lar metallicity. As the metallicity of stars decreases, how-ever, rotation-induced mixing has stronger effects on nucle-osynthesis, including the ws-process (Pignatari et al. 2008).Stellar evolution calculations that include rapid rotation(Frischknecht et al. 2012, 2016) show strong mixing betweenthe helium-burning core and the hydrogen-burning shell.Firstly, this mixes primary 12C and 16O into the hydrogen-burning shell, leading to the production of additional 14N inthis shell via the CNO cycle. Secondly, this 14N is then mixedback into the helium-burning core, at which point it im-mediately converts via the 14N(α, γ)18F(e+νe)18O(α, γ)22Neseries of reactions into 22Ne, i.e., the fuel for the main neu-tron source reaction. Finally, at the end of He-core burning,
22Ne(α, n)25Mg reactions release large numbers of neutrons.(Frischknecht et al. 2012, 2016). Due to a larger neutronexposure, combined with a lower seed abundance, the pro-duction of heavier nuclei with mass numbers A > 100 is en-hanced as compared to the “standard” ws-process that onlyproduces nuclei up to A ∼ 90.
This enhanced weak s-process (denoted here as the es-process), which is described as a “non-standard” s-process inFrischknecht et al. (2012), has a significant contribution tothe chemical evolution of galaxies. Although the es-processis considered to be active only in very metal-poor stars, it ispossibly a source of heavy elements (e.g. barium) in the earlyUniverse. While early studies have ignored the contributionsfrom massive stars (see, Raiteri et al. 1992), as pointed out inChiappini et al. (2011a,b) it has since been shown that thees-process can have important impact on chemical enrich-ment in early galaxies. Furthermore, es-process productioncoupled with an r-process production can explain the dis-persion observed in the light neutron capture elements overthe heavy neutron capture elements in Galactic halo stars(Cescutti et al. 2013).
For the es-process, in addition to the neutron sourcereactions, it is important to consider the effect ofthe 16O(n, γ)17O neutron poison reaction. The net effi-ciency of this poison reaction is determined by the ra-tio between the reaction paths 16O(n, γ)17O(α, n)20Ne and16O(n, γ)17O(α, γ)21Ne (see, Frischknecht et al. 2012, 2016;Nishimura et al. 2014). This is poorly known because, inparticular, the rate of the 17O(α, γ)21Ne reaction is experi-mentally undetermined, and evaluated reaction rates are dif-ferent by several orders of magnitude (Taggart et al. 2010;Best et al. 2011, 2013). Consequently, the final abundancesof the es-process are significantly influenced by this uncer-tainty as shown in previous studies (Frischknecht et al. 2012;Nishimura et al. 2014).
In the present study, we investigate the impact ofnuclear-physics uncertainty relevant to the s-process (ws-and es-processes) in massive stars. We focus on (n, γ) reac-tions and β-decay on the path of s-process nucleosynthesis.We perform comprehensive rate variations using the PizBuinMonte-Carlo (MC) framework coupled with a reaction net-work code, described previously in Rauscher et al. (2016).Analysing the results of the MC calculations, we determinethe important reactions and decays that are the dominantsources of uncertainty for the production of “key” elements.We highlight such reactions that should be investigated infuture nuclear physics studies.
Importantly, the uncertainties used for the nuclear re-action rates include a temperature-dependence due to therelative contributions of ground states and excited states.Following the prescription of Rauscher et al. (2011) andRauscher (2012), we apply temperature dependent uncer-tainties even for experimentally evaluated (n, γ) reactionrates. This leads to a higher uncertainty compared toground-state contributions alone. We use a similar approachfor the β-decay rates, also including dependency on temper-ature, based on nuclear partition functions.
The present paper has the following structure. In Sec-tion 2, we describe the stellar evolution models and the nu-clear reaction networks used in this study, as well as themethod of MC simulation with the evaluation of uncertaintyfor the reaction rates. The results of standard nucleosynthe-
MNRAS 000, 1–18 (2016)

MC uncertainties for massive star s-process 3
sis and rate variation with the MC approach for ws- andes-processes are shown in Section 3 and in Section 4, re-spectively. We discuss the possibilities for improvement ofnuclear data in Section 5. Section 6 is devoted to discussionand conclusions.
2 NUCLEOSYNTHESIS AND MONTE-CARLOMETHODS
2.1 Stellar evolution models
Contemporary nucleosynthesis calculations for the ws-process in massive stars use full stellar evolution models. Thecomplete nucleosynthesis is calculated either fully coupled(see e.g. Frischknecht et al. 2016) or using a post-processingapproach (Pignatari et al. 2016). In a Monte Carlo frame-work, however, the calculations need to be repeated many(e.g. 10, 000) times and using fully coupled networks in stel-lar models would be computationally extremely expensive.
To establish a more tractable approach, we have thuscreated a single-zone trajectory that mimics the averagethermodynamic (density and temperature) history and nu-cleosynthesis occurring during core helium and carbon shellburning. The trajectory was chosen in such a way that anequal amount of 22Ne burnt in the trajectory and the fullstellar model. This simplification is reasonable because thews-process is produced in large convective zones in massivestars, in which quantities vary smoothly and not too signif-icantly. This procedure was used in several studies in thepast (Pignatari et al. 2008; Hirschi et al. 2008). The trajec-tory used in this work was extracted from a solar metallicity25 M� model (Hirschi et al. 2004), and was chosen becauseit corresponds roughly to the average ws-process productionin massive stars weighted over the initial mass function.
In Figure 1, we show the temporal evolution of the den-sity and temperature for the adopted trajectory. The trajec-tory follows the core-hydrogen, core-helium and shell-carbonburning phases. It thus covers the entire evolution of the starfrom the zero-age main-sequence to core collapse (the car-bon burning shell is still active at core-collapse). Since theprecise choices of initial metallicity and rotation affect thenucleosynthesis yields much more strongly than the stellarstructure, we may, without loss of generality of the discus-sion on the nuclear uncertainty in the ws-process, assumeone representative thermodynamic trajectory, and changerotation and metallicity parameters as required.
Adopting this thermodynamic (i.e., the temperatureand density) trajectory, we consider a range of initial com-positions from very metal-poor stars to solar metallicity.Metallicities are indicated by Zm = 1 − XH − XHe, with XHand XHe being the mass fractions of hydrogen and helium,respectively. We adopt Zm = 1.4 × 10⁻² ≡ Z� as the solarmetallicity and considered four additional metallicity mod-els. The adopted values are presented in Table 1 and are de-noted by z0 (Z�), z1, z2, z3, and z4. In addition, the effectof rotation-induced mixing is considered by means of addingextra 14N to the initial composition. This primary 14N imme-diately converts to 22Ne at the start of core helium-burningand enhances the ws-process production. This causes thees-process in the rotating massive stars at low metallicities.Such a simplified approach has been shown to provide consis-tent results in nucleosynthesis similar to more sophisticated
0
200
400
600
800
102103104105106100
101
102
103
104
105
106
8 keV
30 keV
Temperature, MK
Density, gcm-3
Time until collapse, yr
Temperature
Density
Figure 1. The density and temperature evolution of the single
trajectory of a 25M� star model (Hirschi et al. 2004). The tem-
perature in MK and the density in g cm−3 are shown. The tem-perature region between 8 and 30 keV, relevant for the ws-process,
is delimited by horizontal dashed lines.
Table 1. Parameters of metallicity and rotation, defining the
stellar models used. The values of z0 to z4 denote the initial
metallicity Zm. The strength of rotation, r0 to r4, is characterizedby the mass fraction of primary 14N.
z0 z1 z2 z3 z4
1.4 × 10⁻² 6.0 × 10⁻³ 1.0 × 10⁻³ 1.0 × 10⁻⁴ 1.0 × 10⁻⁵
r0 r1 r2 r3 r4
0 5 × 10⁻⁴ 1 × 10⁻³ 5 × 10⁻³ 1 × 10⁻²
evolution calculations (see, Frischknecht et al. 2012, 2016).Following Frischknecht et al. (2012), we choose a mass frac-tion of X(14N) = 0.01 for the fastest rotating case, and con-sider five values for the initial 14N to represent a range ofrotation, from non-rotating, r0, to a maximum rotation, r4,see Table 1.
In this study, the stellar models are set by choosingvarious combinations of metallicity and effective rotation,while always using the same thermodynamic trajectory. Interms of our notation, the stellar model at solar metallicitywithout rotation is denoted z0r0, while the fast rotatingmetal-poor star is z2r4. The z0r0 model shows typical ws-process final abundances, whereas rotating metal-poor starsshow abundance patterns that differ due to the es-process.Nucleosynthesis results are presented in Sections 3 and 4.
2.2 Nuclear reaction networks
The reaction network consists of 943 isotopes including allreactions relevant to the s-process, e.g., fusion reactions oflighter isotopes as well as (n,γ) reactions and β-decays orelectron captures of heavy nuclei. The numerical values oftheoretical and experimental reaction rates are taken fromRauscher & Thielemann (2000) and Cyburt et al. (2010).The majority of (n,γ) experimental rates are taken from the
MNRAS 000, 1–18 (2016)

4 Nishimura el al.
Table 2. Important reactions related to neutron production andconsumption in the ws- and es-processes with their references.
Reaction Rate taken from
22Ne(α, n)25Mg Jaeger et al. (2001)22Ne(α, γ)26Mg Angulo et al. (1999)17O(α, n)20Ne Angulo et al. (1999)17O(α, γ)21Ne Caughlan & Fowler (1988)×0.1 ∗a
∗a A modified rate, set at 0.1 of the rate of Caughlan & Fowler(1988), has been used for the MC calculations (see text for de-
tails).
KADoNiS compilation (Dillmann et al. 2006b), which pro-vides the standard nuclear reaction rate input. We adopttemperature dependent β-decay rates from Takahashi &Yokoi (1987) and Goriely (1999) as provided in Aikawa et al.(2005) and Xu et al. (2013). Original data of the decayrates are given by numerical tables. These β-decays ratesare dependent on the temperature, and we express them bya seven-parameter fitting formula (Rauscher & Thielemann2000):
λ(T9) = exp(a0 + a1T9−1 + a2T9
−1/3
+ a3T91/3 + a4T9 + a5T9
5/3 + a6 ln T9) ,(1)
where a0–a6 are constant coefficients and T9 is the temper-ature in 109 K (GK).
Neutron sources and neutron poisons are key reac-tions in s-process nucleosynthesis. We adopt Jaeger et al.(2001) for 22Ne(α, n)25Mg and Angulo et al. (1999) for22Ne(α, γ)26Mg, respectively. In addition to the neutronsource reactions, abundant 16O in the helium core and thecarbon shell is a strong neutron absorber. Thus, it maybe a strong neutron poison. Although the poison reaction,16O(n, γ)17O, is relatively well determined, rates of (α, n)and (α, γ) on the produced 17O have large uncertainties.The net efficiency of the poison reactions is determinedby the competition between the reaction combination of16O(n, γ)17O(α, γ)21Ne and 16O(n, γ)17O(α, n)20Ne. Only thelatter sequence makes 16O a neutron poison. Following theprevious study (Frischknecht et al. 2012), we adopt the17O(α, n)20Ne rate from Angulo et al. (1999), while we usethe rate of Caughlan & Fowler (1988) for 17O(α, γ)21Ne di-vided by a factor of 10. The choices for which rates to usefor the main neutron source and poison reactions are sum-marized in Table 2.
2.3 Reaction rate variation
The Monte-Carlo (MC) method, which treats physical un-certainty through the use of repeated random variation, is arobust methodology to examine nucleosynthesis uncertain-ties (see, e.g. Iliadis et al. 2014; Rauscher et al. 2016). Weuse the PizBuin MC driver coupled with a nuclear reactionnetwork. This framework was developed for application togeneral nucleosynthesis processes and is described in moredetail in Rauscher et al. (2016), where its first applicationwas to the γ-process in massive stars. In the following weonly provide an outline of the most important concepts andespecially of details particular to s-process nucleosynthesis.
In this work we focus on reactions relevant to heavy
element synthesis by the s-process. This involves nuclei withmass numbers A > 56 and thus we do not vary reaction ratesfor lighter nuclei.
2.3.1 Uncertainty of neutron capture rates
Reaction rates in nucleosynthesis, even those experimentallydetermined under laboratory conditions, can bear significanttheoretical uncertainty due to population of excited statesat stellar temperatures. For the s-process, many neutron-capture rates based on experimental data are available, butRauscher et al. (2011) and Rauscher (2012) demonstratedthat excited state contributions can be important evenat s-process temperatures. Thus, we adopt temperature-dependent uncertainty factors, based on the contribution ofreactions on the target ground state (as measured in the lab-oratory) to the reaction (Rauscher 2012). Using the ground-state contribution X0, we calculate the uncertainty of (n, γ)-reactions by
u(n,γ)(T) = uexpX0(T) + uth (1 − X0(T)) , (2)
where uexp and uth are the uncertainty factors for experimentand theory, respectively.
The value of X0 behaves monotonically with tempera-ture, approaching zero with increasing temperature. Thus,we obtain u(n,γ) ' uexp at low temperatures and u(n,γ) ' uthat high temperatures, respectively. Experimental uncertain-ties (2σ) are used for the measured ground state rates,whereas u = 2 is adopted for unmeasured rates and for re-actions on thermally exited states. We apply u(n,γ) for the
upper limit and u(n,γ)−1 for the lower limit in the uniformMC variation. Here, in the context of the s-process, the ma-jority of reactions are based on experimental data. For moredetails and the derivation of Equation 2, see Rauscher et al.(2016) and references therein.
2.3.2 Uncertainty of β-decay rates
Although most β-decay half-lives for nuclei relevant to thes-process are based on experimental data, the temperaturedependence for these half-lives is not well known. We there-fore apply an approach similar to that described above forβ-decay rates, but based on partition functions to deter-mine the importance of excited states. The uncertainty atlow temperature (T < 107 K) corresponds to the one of mea-sured decays. A uniform random distribution between theupper and lower limit of the reaction rate at a given tem-perature is used for the MC variation factors.
The temperature-dependent uncertainty for β-decayrates is given by
uβ(T) =2J0 + 1G(T) ug.s. +
(1 − 2J0 + 1
G(T)
)ue.s. (3)
where G(T) is the temperature dependent partition function(see, e.g., Rauscher & Thielemann 2000). The value of Ggenerally reaches 2J0 + 1 at low temperature (T9 < 0.1), i.e.,u(T) ' ug.s., while G becomes larger as the temperature in-creases. Thus, β-decay rates become more dependent on the-ory uncertainties with increasing temperature, which is dueto the increasing contribution from excited state decays. In
MNRAS 000, 1–18 (2016)

MC uncertainties for massive star s-process 5
this study, we adopt ug.s. = 1.3 and ue.s. = 10 unless experi-mentally known. Nevertheless, the total uncertainty remainswithin a factor of few in the s-process temperature range.
In addition to β-decay, electron captures (e−-captures)on nuclei are taken into account as provided by Freiburghaus& Rauscher (1999). While e−-capture has less impact onthe s-process as compared to β-decay, the uncertainty in itsdecay rates is large. In this study, we simply adopt a constantfactor 2 for variation of all e−-capture rates and do not studythis feature in more detail.
2.4 MC simulations
We determine the upper and lower limits of each reactionrate as described above, and vary the reaction rate in eachMC calculation step. We adopt a uniform distribution ofvalues between the limits for this random variation. Sincethe uncertainty factors are not evaluated analytically, we fitthe upper and lower rate limits for computational efficiency,using Equation 1. We find that 10, 000 MC iterations giveswell converged results (see Rauscher et al. 2016, for the γ-process that requires a much larger reaction network).
In the simulations, all relevant rates are varied simul-taneously within the assigned uncertainties. As we focus ons-process nucleosynthesis, we included all neutron capturesand weak rates (mostly β-decays) for heavier nuclei beyondiron (Z > 26) in the MC variation. This amounts to 900reactions being varied in total. For comparison, we also cal-culated cases with variation of only (n,γ) or only weak re-actions. This included variations of 510 and 390 reactions,respectively. For every case, we performed 10, 000 MC iter-ations, required because convergence depends on the totalnumber of rates in the reaction network and does not de-pend on the number of reactions varied (see also Rauscheret al. 2016).
In each MC iteration, the rate ri of each reaction i re-ceived its specific random variation factor fi . The same fac-tor was applied to the respective reverse rate. Although eachinitially assigned fi is a single, randomly determined valuebetween 0 and 1, the actual rate variation factor is tem-perature dependent because of the temperature-dependentupper and lower limits of the uncertainty ranges. The initialfactor fi is mapped consistently to an actual rate variationfactor at each temperature (see Rauscher et al. 2016, formore details). It should be noted that although the relationbetween the variation factor and the rate is linear and mono-tonic, variation factors and final abundances have a stronglynon-linear, and sometimes non-monotonic relation.
The result of each MC run consists of a set of final abun-dances for each isotope. Thus 10, 000 different sets of isotopicabundances were obtained for each variation case. As an ex-ample, Figure 2 shows the frequency (F) of final abundance(Y) distributions of 69Ga and 72Ge in the ws-process (see,Section 3 for details). The peak value of the final abundanceY is denoted by Ypeak and the frequency of abundance valuesfound in the iterations is normalized to this value. Red linesindicate 5% and 95% of the cumulative frequency and thusthe interval between the lines contains 90% of the results(see e.g., Figure 7 and following). We adopt this interval asuncertainty in the final abundance. Note that each distri-bution is not exactly a Gaussian or lognormal distribution,although the histogram has a continuous shape.
0.4 0.2 0.0 0.2 0.4Abundance, log10(Y/Ypeak)
0.0
0.2
0.4
0.6
0.8
1.0
Fre
qu
en
cy, F/F
pea
k(Y
)
log102log101/2 log103log101/369Ga
0.4 0.2 0.0 0.2 0.4Abundance, log10(Y/Ypeak)
0.0
0.2
0.4
0.6
0.8
1.0
Fre
qu
en
cy, F/F
pea
k(Y
)
log102log101/2 log103log101/372Ge
Figure 2. The final abundance distributions of 69Ga and 72Ge inthe ws-process, based on the result of 10, 000 MC iterations. The
plot shows the histogram of the frequency F for the final abun-
dance Y normalized to the peak value, Fpeak. Red lines correspondto the values of 5%, 50% and 95% in the cumulative frequency.
Note that the histogram is plotted for logarithmic value of abun-dances, i.e., log10 Y/Ypeak, not for Y/Ypeak.
The uncertainty of 69Ga appears to be symmetricallydistributed, i.e., it is centered around Ypeak ' Y (50%), andthe uncertainty is significantly below a factor of two. Onthe other hand, 72Ge has an asymmetric distribution with alonger tail at larger values. Resulting from this asymmetry,the peak of the distribution does not correspond to the av-erage value of Y , i.e., Ypeak , Y (50%). The uncertainty range,determined by Y (5%) and Y (95%), exceeds by a factor of two,while the minimum limit is closer to one than to a factor of1/2.
2.5 Key reaction rates based on MC calculations
As we obtain sets of rate variation factors and correspondingdistributions of final abundances, the statistical correlationbetween them can be investigated. Key reactions are thenidentified by a strong correlation, as introduced in Rauscheret al. (2016). In the current study, we calculate 900 × Nnuc
MNRAS 000, 1–18 (2016)
6 Nishimura el al.
0 100 200 300 400 500 600 700 800 900ReactionIndex
0.0
0.2
0.4
0.6
0.8
1.0
Cor
rela
tion,|r c
or|
weak reaction (n, γ)/(γ, n)86Kr
Lv1
85Kr(β−)86Rb
85Kr(n,γ)86Kr
86Kr(n,γ)87Kr
0 100 200 300 400 500 600 700 800 900ReactionIndex
0.0
0.2
0.4
0.6
0.8
1.0
Cor
rela
tion,|r c
or|
weak reaction (n, γ)/(γ, n)86Kr
Lv2
85Kr(β−)86Rb
86Kr(n,γ)87Kr
0 100 200 300 400 500 600 700 800 900ReactionIndex
0.0
0.2
0.4
0.6
0.8
1.0
Cor
rela
tion,|r c
or|
weak reaction (n, γ)/(γ, n)86Kr
Lv385Kr(β−)86Rb
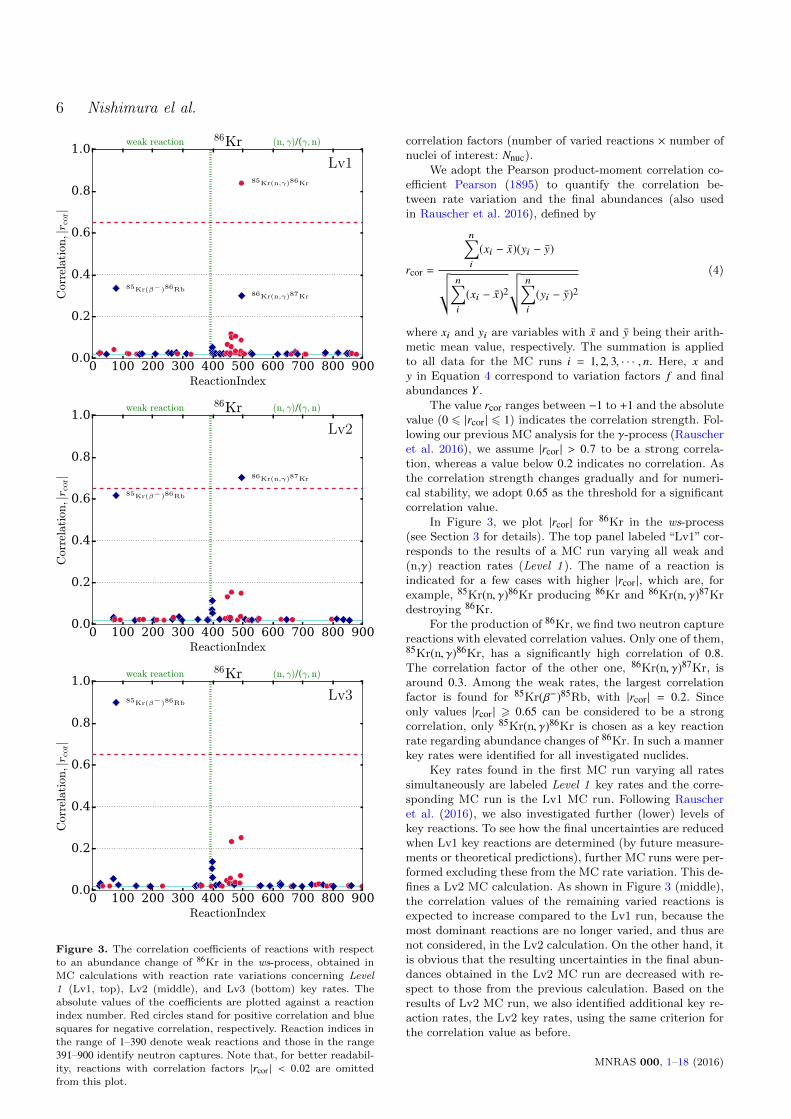
Figure 3. The correlation coefficients of reactions with respect
to an abundance change of 86Kr in the ws-process, obtained inMC calculations with reaction rate variations concerning Level
1 (Lv1, top), Lv2 (middle), and Lv3 (bottom) key rates. The
absolute values of the coefficients are plotted against a reactionindex number. Red circles stand for positive correlation and blue
squares for negative correlation, respectively. Reaction indices in
the range of 1–390 denote weak reactions and those in the range391–900 identify neutron captures. Note that, for better readabil-
ity, reactions with correlation factors |rcor | < 0.02 are omitted
from this plot.
correlation factors (number of varied reactions × number ofnuclei of interest: Nnuc).
We adopt the Pearson product-moment correlation co-efficient Pearson (1895) to quantify the correlation be-tween rate variation and the final abundances (also usedin Rauscher et al. 2016), defined by
rcor =
n∑i
(xi − x)(yi − y)√√√ n∑i
(xi − x)2√√√ n∑
i
(yi − y)2(4)
where xi and yi are variables with x and y being their arith-metic mean value, respectively. The summation is appliedto all data for the MC runs i = 1, 2, 3, · · · , n. Here, x andy in Equation 4 correspond to variation factors f and finalabundances Y .
The value rcor ranges between −1 to +1 and the absolutevalue (0 6 |rcor | 6 1) indicates the correlation strength. Fol-lowing our previous MC analysis for the γ-process (Rauscheret al. 2016), we assume |rcor | > 0.7 to be a strong correla-tion, whereas a value below 0.2 indicates no correlation. Asthe correlation strength changes gradually and for numeri-cal stability, we adopt 0.65 as the threshold for a significantcorrelation value.
In Figure 3, we plot |rcor | for 86Kr in the ws-process(see Section 3 for details). The top panel labeled “Lv1” cor-responds to the results of a MC run varying all weak and(n,γ) reaction rates (Level 1 ). The name of a reaction isindicated for a few cases with higher |rcor |, which are, forexample, 85Kr(n, γ)86Kr producing 86Kr and 86Kr(n, γ)87Krdestroying 86Kr.
For the production of 86Kr, we find two neutron capturereactions with elevated correlation values. Only one of them,85Kr(n, γ)86Kr, has a significantly high correlation of 0.8.The correlation factor of the other one, 86Kr(n, γ)87Kr, isaround 0.3. Among the weak rates, the largest correlationfactor is found for 85Kr(β−)85Rb, with |rcor | = 0.2. Sinceonly values |rcor | > 0.65 can be considered to be a strongcorrelation, only 85Kr(n, γ)86Kr is chosen as a key reactionrate regarding abundance changes of 86Kr. In such a mannerkey rates were identified for all investigated nuclides.
Key rates found in the first MC run varying all ratessimultaneously are labeled Level 1 key rates and the corre-sponding MC run is the Lv1 MC run. Following Rauscheret al. (2016), we also investigated further (lower) levels ofkey reactions. To see how the final uncertainties are reducedwhen Lv1 key reactions are determined (by future measure-ments or theoretical predictions), further MC runs were per-formed excluding these from the MC rate variation. This de-fines a Lv2 MC calculation. As shown in Figure 3 (middle),the correlation values of the remaining varied reactions isexpected to increase compared to the Lv1 run, because themost dominant reactions are no longer varied, and thus arenot considered, in the Lv2 calculation. On the other hand, itis obvious that the resulting uncertainties in the final abun-dances obtained in the Lv2 MC run are decreased with re-spect to those from the previous calculation. Based on theresults of Lv2 MC run, we also identified additional key re-action rates, the Lv2 key rates, using the same criterion forthe correlation value as before.
MNRAS 000, 1–18 (2016)

MC uncertainties for massive star s-process 7
40 60 80 100 120 140 160Mass number, A
10−2
10−1
100
101
102
103
Ove
rpro
duct
ion
fact
or,X
/X�
KCaSc
Ti
V
CrMn
Fe
Co
Ni
Cu
Zn
GaGe
AsSe
Br
Kr
Rb
Sr
YZr
Nb
MoRu
Rh
Pd
Ag
Cd
In
Sn
SbTe
I
Xe
Cs
BaLaCePrNd
Sm
Eu
Gd
Tb
17O(α, γ)21Ne (CF88)17O(α, γ)21Ne/10
Figure 4. Final overproduction factors of the ws-process, basedon the z0r0 model. Nucleosynthesis results using two rates for17O(α, γ)21Ne are shown: for the standard rate by CF88 (red dia-monds) and the CF88 rate divided by 10 (blue circles).
Another iteration of the same screening method wasused to find Lv3 key reaction rates after having performedthe Lv3 MC calculation, which implies that Lv1 and Lv2key reactions are set to the standard reaction rate and notvaried. As shown in Figure 3 (lower), finally the correlationfor 85Kr(β−)85Rb exceeds rcor = 0.65 and thus it becomes aLv3 key rate. In the following, we show key reactions at var-ious levels for the ws-process and the es-process, describedin Sections 3 and 4, respectively.
An important point becomes obvious from the above:Lv2 and Lv3 key rates become important only after the un-certainties for all key reactions in the higher levels have beenreduced. An improved constraint of a Lv2 or Lv3 rate willhave no significant impact if key rates of higher levels arestill only weakly constrained. Nevertheless, providing alsoLv2 and Lv3 key rates may be useful to determine long-termresearch strategies.
The Lv2 (and Lv3) key rates identified here incur an ad-ditional uncertainty. The methodology used identifies theserates under the assumption that Lv1 (Lv2 rates) are con-strained at their standard values with their existing uncer-tainty. If new measurements were to constrain a Lv1 (Lv2)key rate at a new, different value, with different uncertain-ties, then the redetermination of Lv2 and Lv3 key reactionswould be in order.
3 THE WEAK s-PROCESS
3.1 Nucleosynthetic features of the ws-process
The final abundance distribution of the ws-process, i.e. justbefore the onset of the core collapse, is shown in Figure 4.We chose a solar-metallicity star without rotation, the z0r0
model, as the standard case for the ws-process. Two dif-ferent abundance distributions are plotted, based on dif-ferent reaction rates for the neutron-poison relevant reac-tion 17O(α, γ)21Ne, which has a significant physical uncer-tainty. We used the rate adopted by Caughlan & Fowler(1988), denoted CF88, and a rate value divided by a fac-tor of 10 to consider a recent experimental suggestion forthe associated uncertainty (as discussed in Section 2.2). De-spite the difference in these rate values, the abundance pat-
104
105
106
107
108
109
102103104105106
Neu
tron
num
ber d
ensit
y, c
m-3
Time until collapse, yr
ws-processes-process
Figure 5. The evolution of the neutron number density for the
ws-process (solid line) and es-process (dashed line). See Figure 1
for the corresponding density and temperature evolution.
48 50 52 54 56Neutron number, N
35
36
37
38
39
40
41
42
43
Pro
ton
num
ber,Z
Kr
Rb
Sr
Y
Zr
Nb
Mo
−11.5
−10.5
−9.5
−8.5
−7.5
Flux
,log
10(f
)
48 50 52 54 56Neutron number, N
35
36
37
38
39
40
41
42
43
Pro
ton
num
ber,Z
Kr
Rb
Sr
Y
Zr
Nb
Mo
−11.5
−10.5
−9.5
−8.5
−7.5
Flux
,log
10(f
)
(a) ws-process
(b) es-process
Figure 6. Nucleosynthesis flows in the (a) ws-process and (b)
es-process. The time-integrated abundance change (flux) of eachreaction is shown by an arrow. The flux value is indicated by thecolour and width of the arrow.
MNRAS 000, 1–18 (2016)

8 Nishimura el al.
terns are almost identical at Zm = Z� because the impactof the neutron poison 16O is significant only for metal-poorstars (Frischknecht et al. 2016). The abundance distributionagrees with a typical ws-process pattern (see, e.g. Prantzoset al. 1990; Frischknecht et al. 2016), of which the overpro-duction peak is at A ' 60 and the production steeply declinesfor nuclei with mass numbers A > 90.
The time evolution of the neutron density is shown inFigure 5, where the solid line corresponds to the ws-processresult. As expected from the temperature and density evolu-tion (shown in Figure 1), the neutron density has a peak atthe beginning of the core-helium burning phase (2 × 10⁵ yrbefore collapse), exceeding 107cm−3 for a very short period.This increase is due to the 13C(α, n)16O reaction, which alsois a dominant neutron source reaction for the main s-processin low mass asymptotic-giant-branch stars. However, in theevolution of a massive star, the duration of this peak is soshort (∼ 10 yr) that this increase of the neutron density hasno significant impact on the total neutron exposure. Dur-ing the core-helium burning phase (∼ 105–103 yr before col-lapse), the neutron density assumes values > 105cm−3. Afterthe ignition of carbon-shell burning at ∼ 3 × 10² yr beforecollapse, the neutron density increases further, although theduration of this phase is shorter than the core-He burningphase. The 17O(α, γ)21Ne rate does not change the resultssignificantly, so the reduced rate (CF88 divided by a factorof 10) has been adopted for consistency with the es-processcalculations (see later).
The nucleosynthesis flux of each reaction, i.e., (n,γ) re-actions and β-decays, over the nucleosynthesis time has beencalculated. This equates to the time-integrated abundancechange of each reaction from its initial abundance to its finalabundance. Nucleosynthesis fluxes in the ws- and es-processobtained in this manner are shown in Figure 6. The colourand width of an arrow indicate the value of bulk flow (abun-dance change) for individual reactions. Note that the valueof the nuclear flow is integrated over the entire nucleosyn-thesis calculation, which is different from the reaction rateat a given time step.
As expected for the s-process, the predominant reac-tions in nucleosynthesis are (n,γ) reactions (→) and β− de-cays (↖) along the line of stability. Although the reactionflow is basically a single path, several branches are evidentwhere a decay rate is comparable to an (n,γ) rate. This is thecase for example at neutron numbers N = 49 and 53 in theregion plotted. For these branching points, we expect thatthe effect of nuclear physics uncertainty on the final abun-dances is more complicated due to the competition betweenneutron capture and β-decay. Note that for weak reactionsin the s-process, e−-capture also contributes to the reactionflow, i.e., diagonal arrows in the plot. However, β−-decayhas a more significant impact on nucleosynthesis comparedto the corresponding e−-capture.
3.2 Nuclear uncertainties in the ws-process
MC calculations for the ws-process have been performed,based on the rate variation method for neutron capturesand weak rates as described in Section 2.3. The abundanceuncertainty distributions for all ws-process nuclei are shownin Figure 7 using the standard ws-process model z0r0 (seeSection 3.1). The colour shade in the plot shows the fre-
63 64 67 69 70 73 75 77 80 81 82 84 85 86 88
Mass number, A
0.4
0.2
0.0
0.2
0.4
Ab
un
dan
ce, lo
g10
(Y/Y
pea
k)
Cu
Cu
Zn
Zn
Zn
Zn
Ga
Ga
Ge
Ge
Ge
Ge
As
Se
Se
Se
Se
Br
Br
Kr
Kr
Kr
Kr
Kr
Rb
Rb
Sr
Sr
Sr
Y
log102
log101/2
log103
log101/3
Element
65 66 68 71 72 74 76 78 79 80 83 86 87 87 890.10
0.25
0.40
0.55
0.70
0.85
1.00
Fre
qu
en
cy, F/F
pea
k(Y
)
Figure 7. Uncertainty distributions for the ws-process whenvarying all neutron captures and weak rates. The colour shade
is the probabilistic frequency and the 90% probability intervalsup and down marked for each nuclide (see, Figure 2 for examples
of the distribution). Horizontal dashed lines indicate uncertainty
factors of 2, 3, 1/2, and 1/3, respectively.
quency F of each abundance Y normalized to F(Ypeak) asexplained for Figure 2. Again, the interval between the redlines corresponds to 90% of all abundance values. The nu-merical uncertainty value for each investigated nucleus isgiven in Table 3, in which the columns ‘Up’ and ‘Down’correspond to the Y (95%)/Ypeak and Y (5%)/Ypeak values, re-spectively. The column ‘Level’ in the table indicates the levelof a key reaction relevant to the production or destructionof the nucleus, defined in Section 2.5 and discussed in moredetail in the following section.
As can be seen in Figure 7 and Table 3, for most nuclidesthe uncertainty distributes symmetrically and the bound-aries of the uncertainty range (90% of cumulative frequencyaround the Ypeak) are located at F/Fpeak > 0.1. We find thatthe uncertainty of most isotopes is smaller than a factor oftwo. Only a few species, specifically 64Zn, 72,73Ge, 77,80Se,81Br and 83Kr, show a larger uncertainty. As already seenin Figure 2, the distribution is not symmetric for such nu-clei, having a very much larger upper value or a very muchsmaller lower value, compared to the other boundary. Ex-cepting these specific isotopes, the general trend in finalabundance uncertainty is to increase from about 10% atA ∼ 63 to about 50% at A ∼ 80. This reflects the prop-agation of uncertainties as the nucleosynthesis flow buildsheavier nuclei from lighter nuclei. Above the mass numberA = 80, the absence any reaction rates with significant uncer-tainties results in overall abundance uncertainties that thenreduce with increasing mass.
To investigate the impact of uncertainties in neutroncaptures and weak reactions separately, we also performedMC calculations varying those rates separately. The resultsare shown in Figure 8. As the global feature of the uncer-tainty distribution for the (n,γ) variation case is similar tothe results of varying all (n,γ) and weak reactions, it isdemonstrated that the total uncertainty is mostly causedby the neutron captures, while weak reactions only have aminor contribution. Only for 64Zn and 80Se are the uncer-tainties dominated by weak reactions rather than by (n,γ)
MNRAS 000, 1–18 (2016)

MC uncertainties for massive star s-process 9
63 64 67 69 70 73 75 77 80 81 82 84 85 86 88
Mass number, A
0.4
0.2
0.0
0.2
0.4
Ab
un
dan
ce, lo
g10(Y/Y
pea
k)
Cu
Cu
Zn
Zn
Zn
Zn
Ga
Ga
Ge
Ge
Ge
Ge
As
Se
Se
Se
Se
Br
Br
Kr
Kr
Kr
Kr
Kr
Rb
Rb
Sr
Sr
Sr
Y
log102
log101/2
log103
log101/3
Element
65 66 68 71 72 74 76 78 79 80 83 86 87 87 890.10
0.25
0.40
0.55
0.70
0.85
1.00
Fre
qu
en
cy, F/F
pea
k(Y
)
(n,γ)
63 64 67 69 70 73 75 77 80 81 82 84 85 86 88
Mass number, A
0.4
0.2
0.0
0.2
0.4
Ab
un
dan
ce, lo
g10
(Y/Y
pea
k)
Cu
Cu
Zn
Zn
Zn
Zn
Ga
Ga
Ge
Ge
Ge
Ge
As
Se
Se
Se
Se
Br
Br
Kr
Kr
Kr
Kr
Kr
Rb
Rb
Sr
Sr
Sr
Y
log102
log101/2
log103
log101/3
Element
65 66 68 71 72 74 76 78 79 80 83 86 87 87 890.10
0.25
0.40
0.55
0.70
0.85
1.00F
req
uen
cy, F/F
pea
k(Y
)
β & e-capture
Figure 8. Same as Figure 7, varying only (n,γ) reactions (top)
or weak rates (bottom).
reactions. These isotopes are at a known s-process branchingpoint.
3.3 Key reactions for the weak s-process
The correlation coefficients rcor for all s-process isotopes andall neutron capture and weak rates were computed accord-ing to Equation 4 and used to identify key reactions mainlycontributing to the abundance uncertainty of each isotope,as explained in Section 2.5. Only ten reactions bear a strongcorrelation |rcor | > 0.65 with final abundances. These keyreactions are listed in Table 4. The table has additionalcolumns for key reactions at lower levels but the primarykey reactions are listed in in the column “Key Rate Level 1”and its corresponding correlation coefficient is given in thecolumn “rcor,0”.
As expected, most of the key reactions are neutron cap-tures in the s-process path. A few weak reactions have signif-icant impact for nuclei around branching points. The resultsof the MC runs at different levels are shown in Figure 9.When the number of the reactions varied in the MC runsis decreased, the final uncertainties become smaller. The re-sult of the Lv4 MC run shows a tiny uncertainty for allws-process nuclei.
For reference, in Table 5 we also provide uncertaintyranges and key correlations for elemental abundances. Theuncertainty range of each element is the weighted average
Table 3. Uncertainties in the final abundance of ws-process nu-clei from the MC calculation. The column labeled “Level” indi-
cates the level of the first key reaction found, as described in
Section 3.3. The remaining columns show uncertainty factors forvariations Up and Down, of which values are Y(95%)/Ypeak and
Y(5%)/Ypeak, respectively. They enclose a 90% probability inter-val, as shown in Figure 7.
Level Up Down
63Cu – 1.16 0.88865Cu – 1.20 0.79064Zn 1 1.55 0.52266Zn – 1.27 0.81667Zn 1 1.35 0.77368Zn – 1.30 0.80269Ga – 1.33 0.77471Ga – 1.40 0.79970Ge – 1.33 0.77572Ge 1 2.20 0.76273Ge 1 2.29 0.68574Ge 3 1.39 0.74375As 3 1.47 0.75976Se – 1.31 0.73177Se 1 3.15 0.86178Se 1 1.62 0.76280Se 1 4.61 0.59279Br 2 1.52 0.74481Br 1 2.09 0.71580Kr – 1.37 0.52282Kr – 1.31 0.71383Kr 1 1.89 0.78584Kr 3 1.30 0.72586Kr 1 1.29 0.88185Rb – 1.33 0.77887Rb 3 1.20 0.86386Sr – 1.34 0.83087Sr – 1.32 0.85188Sr – 1.16 0.90189Y – 1.14 0.911
value of the ones of its isotopes. All elements show uncer-tainty factors less than ∼ 1.5 with the exception of Br, theupper limit of which is 1.57. This is the case although someof the contributing isotopes of Ge, Se, and Br (more specif-ically 72,73Ge, 77,80Se and 81Br) have a larger uncertaintybeyond a factor of 2 (see Table 3). Regarding key reactionsfor elemental abundances, only one case was found, the β−
decay of 64Cu which affects the production of Zn. This be-haviour reflects that the production of each element involvescontributions from multiple individual isotopes, that do notact coherently.
4 THE ENHANCED s-PROCESS
4.1 Nucleosynthetic features of the es-process
The results of nucleosynthesis calculations for rotatingmetal-poor stars are shown in Figure 10, for (a) the z2r4
model and (b) the z4r4 model. In both cases, the effect ofrotation is included by adding 1% by mass fraction of 14Nto the initial composition. The z2r4 model is a low metal-licity star with Zm = 1 × 10⁻³ and the z4r4 model is an
MNRAS 000, 1–18 (2016)

10 Nishimura el al.
Table 4. The key reaction rates for the ws-process. Key rates in levels 1–3 are shown, along with their correlation factors rcor,0, rcor,1and rcor,2, respectively. Significant correlation values are underlined. Not all s-process nuclei are listed but only those for which key rates
were found. Also shown for each rate are the g.s. contributions of the (n,γ) reaction to the stellar rate and uncertainty factors of the
β-decay rate at two plasma temperatures, respectively.
Nuclide rcor,0 rcor,1 rcor,2 Key Rate Key Rate Key Rate X0 Weak RateLevel 1 Level 2 Level 3 (8, 30 keV) (8, 30 keV)
64Zn 0.76 64Cu(β−)64Zn 1.30, 1.36
-0.46 -0.73 64Cu(e−, νe)64Ni e− capture67Zn -0.67 67Zn(n, γ)68Zn 1.00, 1.0072Ge -0.85 72Ge(n, γ)73Ge 1.00, 1.0073Ge -0.84 73Ge(n, γ)74Ge 0.88, 0.8174Ge -0.44 -0.54 -0.67 74Ge(n, γ)75Ge 1.00, 1.0075As -0.50 -0.59 -0.70 75As(n, γ)76As 1.00, 1.0077Se -0.86 77Se(n, γ)78Se 1.00, 1.0078Se -0.71 78Se(n, γ)79Se 1.00, 1.00
0.38 0.68 68Zn(n, γ)69Zn 1.00, 1.0080Se -0.76 80Br(β−)80Kr 1.31, 4.70
0.27 0.73 80Br(β+)80Se 1.31, 4.70
0.16 0.44 0.88 80Br(e−, νe)80Se e− capture79Br -0.64 -0.73 79Br(n, γ)80Br 1.00, 1.0081Br -0.80 81Kr(n, γ)82Kr 1.00, 0.9883Kr -0.76 83Kr(n, γ)84Kr 0.81, 0.7484Kr -0.49 -0.65 -0.76 84Kr(n, γ)85Kr 1.00, 1.0086Kr 0.84 85Kr(n, γ)86Kr 1.00, 1.00
-0.30 -0.70 86Kr(n, γ)87Kr 1.00, 1.00
-0.34 -0.62 -0.90 85Kr(β−)85Rb 1.30, 1.3087Rb -0.56 -0.65 -0.95 87Rb(n, γ)88Rb 1.00, 1.00
Table 5. Uncertainties in the ws-process for elemental abun-
dances. The columns ‘Up’ and ‘Down’ correspond to the upper
and lower boundary of the uncertainty range similar to Table 3but for each element. The correlation coefficient rcor and the corre-
sponding reaction is shown for Lv1 key reactions (See Section 3.3).
Element Up Down rcor Lv1 Key Reaction
Cu 1.16 0.891
Zn 1.27 0.720 0.68 64Cu(β−)64ZnGa 1.33 0.778
Ge 1.27 0.754As 1.47 0.759
Se 1.40 0.737
Br 1.57 0.732Kr 1.27 0.733
Rb 1.29 0.804
Sr 1.19 0.876Y 1.14 0.911
even lower metallicity star with Zm = 1 × 10⁻⁵. Comparingthe abundances in Figure 10a and the ones from the ws-process (Figure 4), the production of heavier nuclei beyondthe Sr peak is significantly enhanced due to the effect of rota-tional mixing, and the overabundant region reaches up to thebarium peak around A ∼ 138 (Frischknecht et al. 2012). Incontrast to the ws-process, the production in the es-processstrongly depends on the assumed rate for 17O(α, γ)21Ne. Thecase with reduced neutron poison efficiently produces muchmore intermediate mass s-process isotopes (A > 90).
Another comparison is shown in Figure 10c, which isthe ratio of the final abundances between the rotating metal-poor star (z2r4) and the even more metal-poor case (z4r4).
In both models, we adopted a reduced CF88 rate for the17O(α, γ)21Ne reaction (divided by 10) in this study. Theabundance ratio (z2r4/z4r4) is around 100, which is theinitial abundance ratio. However, in the heavier nuclei withA > 90, the ratio is below 100, i.e., in the more metal-poorcase (z4r4) heavier s-process nuclei (beyond Sr) are more ef-ficiently produced. In fact, focusing on the ratio of the Sr andBa peaks, z2r4 and z4r4 show [Sr/Ba] of 1.98 and 1.76, re-spectively. This difference is caused by the ratio of availableneutrons (given by the neutron density) to the seed nucleiduring the s-process. The lower metallicity model has effec-tively a higher number of neutrons compared to the initialseed abundances (mostly Fe).
The time evolution of neutron number density for thees-process (z2r4) is shown in Figure 5 (dashed line). Notethat neutron densities are similar for the two choices of17O(α, γ)21Ne rates. We see that the es-process has a higherneutron density compared to the ws-process in each burn-ing phase. Nevertheless, the nucleosynthesis flow in the es-process, shown in Figure 6, is very similar to the one in thews-process. The dominant reaction flow consists of neutroncaptures and β-decays along a path following the stable iso-topes. The main difference between the ws- and es-processesis that the es-process has a higher flux due to increased neu-tron captures and this enhances the production of heaviernuclei.
In the present study, we adopted the r2z4 model asthe representative case for the following MC analysis of thees-process because its nucleosynthesis result shows the pri-mary feature of the es-process, namely the production of theSr and Ba peaks. The r4z4 model is also considered whendiscussing the uncertainty of the results due to the stellar
MNRAS 000, 1–18 (2016)

MC uncertainties for massive star s-process 11
63 64 67 69 70 73 75 77 80 81 82 84 85 86 88
Mass number, A
0.4
0.2
0.0
0.2
0.4
Ab
un
dan
ce, lo
g10(Y/Y
pea
k)
Cu
Cu
Zn
Zn
Zn
Zn
Ga
Ga
Ge
Ge
Ge
Ge
As
Se
Se
Se
Se
Br
Br
Kr
Kr
Kr
Kr
Kr
Rb
Rb
Sr
Sr
Sr
Y
log102
log101/2
log103
log101/3
Element
65 66 68 71 72 74 76 78 79 80 83 86 87 87 890.10
0.25
0.40
0.55
0.70
0.85
1.00
Fre
qu
en
cy, F/F
pea
k(Y
)
Lv2
63 64 67 69 70 73 75 77 80 81 82 84 85 86 88
Mass number, A
0.4
0.2
0.0
0.2
0.4
Ab
un
dan
ce, lo
g10
(Y/Y
pea
k)
Cu
Cu
Zn
Zn
Zn
Zn
Ga
Ga
Ge
Ge
Ge
Ge
As
Se
Se
Se
Se
Br
Br
Kr
Kr
Kr
Kr
Kr
Rb
Rb
Sr
Sr
Sr
Y
log102
log101/2
log103
log101/3
Element
65 66 68 71 72 74 76 78 79 80 83 86 87 87 890.10
0.25
0.40
0.55
0.70
0.85
1.00F
req
uen
cy, F/F
pea
k(Y
)
Lv3
63 64 67 69 70 73 75 77 80 81 82 84 85 86 88
Mass number, A
0.4
0.2
0.0
0.2
0.4
Ab
un
dan
ce, lo
g10
(Y/Y
pea
k)
Cu
Cu
Zn
Zn
Zn
Zn
Ga
Ga
Ge
Ge
Ge
Ge
As
Se
Se
Se
Se
Br
Br
Kr
Kr
Kr
Kr
Kr
Rb
Rb
Sr
Sr
Sr
Y
log102
log101/2
log103
log101/3
Element
65 66 68 71 72 74 76 78 79 80 83 86 87 87 890.10
0.25
0.40
0.55
0.70
0.85
1.00
Fre
qu
en
cy, F/F
pea
k(Y
)
Lv4
Figure 9. Results of MC calculations of the ws-process at differ-
ent levels, Lv2 (upper panel), Lv3 (middle panel) and Lv4 (lowerpanel). Uncertainty distributions are plotted in the same manner
as in Figure 7.
evolution models. For both stellar models, we use a CF88rate divided by 10 for 17O(α, γ)21Ne in all MC calculations.
We note that the latest evaluation in Best et al.(2013) shows a reduction in both the 17O(α, γ)21Ne and17O(α, γ)21Ne rates, but a similar (α, n)/(α, γ) reaction rateratio, compared to NACRE/CF88. However, these reactionrates have large uncertainties, and changes up to a factor of10 is still reasonable. Our results show robustness to suchchanges so long as the es-process produces heavier s-processisotopes compared to the ws-process.
40 60 80 100 120 140 160Mass number, A
10−4
10−3
10−2
10−1
100
101
102
103
Ove
rpro
duct
ion
fact
or,X
/X�
KCaSc
Ti
VCrMnFe
Co
Ni
CuZn
GaGeAsSe
Br
Kr
Rb
SrYZr
Nb
MoRuRh
PdAg
Cd
In
Sn
SbTe
I
Xe
Cs
BaLaCePrNd
Sm
Eu
Gd
Tb
17O(α, γ)21Ne (CF88)17O(α, γ)21Ne/10
(a)
40 60 80 100 120 140 160Mass number, A
10−4
10−3
10−2
10−1
100
101
102
103
Ove
rpro
duct
ion
fact
or,X
/X�
KCaSc
TiV
CrFeCo
Ni
CuZn
GaGeAsSe
Br
Kr
Rb
SrYZr
Nb
MoRuRh
PdAg
Cd
In
Sn
SbTe
I
Xe
Cs
BaLaCePrNd
Sm
Gd
Tb
17O(α, γ)21Ne (CF88)17O(α, γ)21Ne/10
(b)
101
102
103
40 60 80 100 120 140 160
Fina
l abu
ndan
ce ra
tio, z
2r4
/ z4r
4
Mass number, A
(c)
Figure 10. Overproduction factors in the es-process for (a) the
z2r4 model and (b) the z4r4 model. Similarly to Figure 4, results
for different values of the 17O(α, γ)21Ne rate are compared. (c) Thefinal abundance ratio for the above models, based on a reduced17O(α, γ)21Ne reaction.
4.2 The uncertainty of the es-process
Uncertainties in es-process abundances have been deter-mined using the same methodology as was used for the ws-process. Figure 11 shows the resulting production uncertain-ties for cases with variations of all (n,γ) reactions and weakreactions. For this plot, we choose to show stable s-processnuclei with 29 6 Z 6 40 (left panel) and 38 6 A 6 60 (rightpanel), covering elements up to Sr and up to Ba, respectively.As in Figure 7, the range defined by the red lines for eachisotope corresponds to 90% of the abundance uncertaintydistribution. The uncertainty ranges for the es-process prod-ucts are also listed in Table 6. Comparing Figures 11 and7, we see that the uncertainty distribution pattern is signif-icantly different between the es-process and the ws-process,
MNRAS 000, 1–18 (2016)

12 Nishimura el al.
although the same nuclei exhibit a larger uncertainty in bothcases. For heavier nuclei beyond Sr, the abundance uncer-tainty increases and is propagated from lighter to heaviernuclei.
To distinguish the individual impact on final abundanceuncertainties, we also performed MC calculations with a lim-ited number of rates being varied, i.e., we considered (n,γ)and weak rates separately. Figure 12 shows the results ob-tained by only varying neutron-captures (upper panel) orweak reactions (lower panel). As already seen in the re-sults for the ws-process, the dominant uncertainty is dueto uncertainties in (n,γ), while weak rates only affect nucleiaround branching points. In addition to those found in thews-process, we identified additional such nuclei, 94Nb, 108Pd,and 122Sn, influenced by weak reactions. These species,which are intermediate mass s-process nuclei, are not sig-nificantly produced in the ws-process and did not appearin the results and discussion of the ws-process in Section 3.The nucleosynthesis and uncertainties in the es-process aredifferent from the ones in the ws-process and therefore wealso expect different key reactions.
4.3 Key reactions in the es-process
As for the ws-process, we identified key reactions with astrong influence on the final abundance uncertainties. Thekey reactions for the es-process with a high correlation(|rcor | > 0.65) are listed in Table 7. The list includes 30Lv1 key reactions in the es-process. A majority of key reac-tions are neutron captures along the s-process path, whileonly a few weak reactions around branchings have an im-pact: only β−-decay of 64Cu, 80Br, and 122Sb are listed atLv1. Additional reactions are found at Lv2 and Lv3, basedon Lv2 and Lv3 MC runs, respectively. The resulting un-certainty distributions of es-process abundances at differentlevels are shown in Figure 13. With decreasing number ofvaried reactions in the MC variations in the various levels,the uncertainties in the final abundances shrink and finallythe Lv4 results show only small uncertainties.
The list of key es-process reactions found here is moreextensive than the list of key ws-process reactions presentedin Table 4. While the es-process obviously has additional keyreactions for intermediate mass s-process nuclei from the Srpeak to lighter lanthanides beyond Ba, which the ws-processdoes not produce, we find that the es-process has more keyreactions even for the lighter s-process nuclei. It is common(although not in all the cases) that a reaction in the es-process has a larger correlation |rcor | as the same reactionin the ws-process. This increase in the correlation factor iscaused by the stronger reaction flow in the es-process, whichenhances the uncertainty propagation.
Observationally, the isotopic composition of neutroncapture elements in galactic stars has been measured onlyfor few elements (e.g., Ba, Sm, Nd and Eu) so far (Roedereret al. 2008; Gallagher et al. 2015), whereas the elementalabundances are available for much more elements (with thenotable exception of In). The uncertainty ranges and pri-mary key reactions for each es-process element are summa-rized in Table 8. While most elements have an uncertaintyrange up to a factor of 1.5, Rh and In show significantlyhigher uncertainties, exceeding a factor of two. Interestingly,both Rh and In have a key neutron-capture reaction. The
Table 6. Uncertainties of es-process nuclei from the Lv1 MCcalculation. The columns labeled “Level” indicates the level of
the first key reaction found, as described in Section 3.3. The re-maining columns show uncertainty factors for variations Up and
Down, whose values Ypeak(95%)/Ypeak and Ypeak(5%)/Ypeak, respec-
tively, enclose a 90% probability interval, as shown in Figure 11.
Level Up Down Level Up Down
63Cu – 1.19 0.864 90Zr – 1.26 0.81165Cu 1 1.15 0.907 91Zr – 1.28 0.80064Zn 1 1.65 0.543 92Zr – 1.28 0.78866Zn 1 1.34 0.928 94Zr – 1.25 0.74967Zn 1 1.46 0.941 93Nb 2 1.36 0.76068Zn 1 1.62 0.953 94Mo 2 1.75 0.63369Ga 1 1.11 0.937 95Mo – 1.31 0.77271Ga 1 1.21 0.940 96Mo 3 1.29 0.73670Ge 1 1.18 0.956 97Mo – 1.31 0.77372Ge 1 3.41 0.991 98Mo – 1.29 0.73173Ge 1 3.23 1.004 99Ru 1 2.96 0.82574Ge 1 1.45 0.947 100Ru 3 1.41 0.78475As 1 1.33 0.938 101Ru 3 1.41 0.77276Se 1 1.19 0.949 102Ru – 1.35 0.75777Se 1 3.16 0.942 103Rh 1 2.39 0.76678Se 1 1.86 0.938 104Pd 2 1.54 0.77680Se 1 4.06 0.631 106Pd 2 1.55 0.78379Br 1 1.49 0.935 108Pd 2 2.62 0.64581Br 1 2.20 0.881 107Ag 1 1.85 0.70180Kr 2 1.18 0.522 109Ag 2 1.52 0.73282Kr 1 1.19 0.865 108Cd – 1.31 0.71583Kr 1 1.91 0.916 110Cd – 1.29 0.73284Kr 1 1.36 0.911 112Cd – 1.34 0.75986Kr 1 1.49 0.406 114Cd – 1.44 0.76985Rb 2 1.11 0.859 113In 1 2.96 0.76987Rb 2 1.86 0.540 115In – 1.48 0.75286Sr 2 1.16 0.886 114Sn – 1.29 0.72787Sr 2 1.17 0.876 115Sn – 1.30 0.71888Sr – 1.19 0.848 116Sn – 1.29 0.72489Y – 1.22 0.828 117Sn 2 1.58 0.771
118Sn – 1.35 0.752119Sn 1 2.51 0.802120Sn – 1.41 0.776122Sn 2 2.91 0.715121Sb 1 1.75 0.723122Te – 1.41 0.771123Te 2 1.52 0.695124Te – 1.36 0.745126Te – 1.36 0.745127I 1 1.78 0.761128Xe – 1.46 0.697130Xe – 1.42 0.771132Xe 3 1.40 0.730133Cs 2 1.43 0.714134Ba – 1.31 0.718136Ba – 1.36 0.754137Ba – 1.30 0.732138Ba – 1.28 0.810139La 2 1.32 0.798140Ce – 1.21 0.867141Pr 2 1.22 0.851142Nd – 1.16 0.899144Nd 3 1.15 0.911146Nd – 1.14 0.912
MNRAS 000, 1–18 (2016)

MC uncertainties for massive star s-process 13
Table 7. The key reaction rates for the es-process. Similar to Table 4, key rates in levels 1–3 are shown, along with their correlationfactors rcor,0, rcor,1, and rcor,2, respectively. Significant correlation values are underlined. Also shown for each rate are the g.s. contributions
to the stellar rate for neutron captures and uncertainty factors of the β-decay rates at two plasma temperatures, respectively.
Nuclide rcor,0 rcor,1 rcor,2 Key Rate Key Rate Key Rate X0 Weak Rate
Level 1 Level 2 Level 3 (8, 30 keV) (8, 30 keV)65Cu -0.83 65Cu(n, γ)66Cu 1.00, 1.0064Zn 0.72 64Cu(β−)64Zn 1.30, 1.36
-0.45 -0.67 64Cu(e−, νe)64Ni e− capture
-0.36 -0.52 -0.72 64Zn(n, γ)65Zn 1.00, 1.0066Zn -0.96 66Zn(n, γ)67Zn 1.00, 1.00
-0.13 -0.58 -0.67 57Fe(n, γ)58Fe 0.73, 0.5967Zn -0.97 67Zn(n, γ)68Zn 1.00, 1.0068Zn -0.98 68Zn(n, γ)69Zn 1.00, 1.0069Ga -0.92 69Ga(n, γ)70Ga 1.00, 1.0071Ga -0.97 71Ga(n, γ)72Ga 1.00, 1.0070Ge -0.95 70Ge(n, γ)71Ge 1.00, 1.0072Ge -0.94 72Ge(n, γ)73Ge 1.00, 1.0073Ge -0.94 73Ge(n, γ)74Ge 0.88, 0.81
0.03 0.82 64Ni(n, γ)65Ni 1.00, 1.0074Ge -0.97 74Ge(n, γ)75Ge 1.00, 1.0075As -0.96 75As(n, γ)76As 1.00, 1.0076Se -0.90 76Se(n, γ)77Se 1.00, 1.0077Se -0.93 77Se(n, γ)78Se 1.00, 1.0078Se -0.97 78Se(n, γ)79Se 1.00, 1.00
0.07 0.46 0.70 56Fe(n, γ)57Fe 1.00, 1.0080Se -0.78 80Br(β−)80Kr 1.31, 4.70
0.18 0.47 0.89 80Br(e−, νe)80Se e− capture79Br -0.96 79Br(n, γ)80Br 1.00, 1.0081Br -0.86 81Kr(n, γ)82Kr 1.00, 0.9880Kr -0.28 -0.78 80Br(β+)80Se
-0.30 -0.43 -0.67 80Kr(n, γ)81Kr 1.00, 1.0082Kr -0.78 82Kr(n, γ)83Kr 1.00, 1.0083Kr -0.95 83Kr(n, γ)84Kr 0.81, 0.7484Kr -0.88 84Kr(n, γ)85Kr 1.00, 1.0086Kr 0.87 85Kr(n, γ)86Kr 1.00, 1.0085Rb -0.62 -0.73 85Rb(n, γ)86Rb 1.00, 1.0087Rb -0.35 -0.74 85Kr(β−)85Rb 1.30, 1.30
0.22 0.44 0.75 86Kr(n, γ)87Kr 1.00, 1.0086Sr -0.57 -0.67 86Sr(n, γ)87Sr 1.00, 1.0087Sr -0.55 -0.66 87Sr(n, γ)88Sr 1.00, 1.0093Nb -0.59 -0.76 93Zr(n, γ)94Zr 1.00, 1.0094Mo 0.64 0.68 93Zr(β−)93Nb 1.30, 1.30
-0.47 -0.51 -0.88 94Mo(n, γ)95Mo 1.00, 1.0096Mo -0.42 -0.58 -0.66 96Mo(n, γ)97Mo 1.00, 1.0099Ru -0.86 99Ru(n, γ)100Ru 1.00, 1.00100Ru -0.44 -0.61 -0.69 100Ru(n, γ)101Ru 1.00, 1.00101Ru -0.47 -0.65 -0.73 101Ru(n, γ)102Ru 1.00, 1.00103Rh -0.85 103Rh(n, γ)104Rh 0.95, 0.80104Pd -0.60 -0.77 104Pd(n, γ)105Pd 1.00, 1.00106Pd -0.60 -0.78 106Pd(n, γ)107Pd 1.00, 1.00108Pd -0.61 -0.66 107Pd(β−)107Ag 1.30, 1.36
-0.47 -0.50 -0.75 108Pd(n, γ)109Pd 1.00, 1.00107Ag -0.80 107Ag(n, γ)108Ag 1.00, 1.00109Ag -0.56 -0.71 109Ag(n, γ)110Ag 1.00, 1.00113In -0.85 113In(n, γ)114In 1.00, 1.00117Sn -0.58 -0.77 117Sn(n, γ)118Sn 1.00, 1.00119Sn -0.83 119Sn(n, γ)120Sn 0.89, 0.75122Sn -0.68 122Sb(β−)122Te 1.30, 2.81
-0.32 -0.64 -0.67 122Sb(β−)122Te 1.30, 2.81121Sb -0.73 121Sb(n, γ)122Sb 0.98, 0.93123Te -0.64 -0.83 123Te(n, γ)124Te 1.00, 1.00127I -0.70 127I(n, γ)128I 1.00, 0.99132Xe -0.37 -0.58 -0.66 132Xe(n, γ)133Xe 1.00, 1.00133Cs -0.49 -0.70 133Cs(n, γ)134Cs 1.00, 1.00139La -0.56 -0.73 139La(n, γ)140La 1.00, 1.00141Pr -0.56 -0.66 141Pr(n, γ)142Pr 1.00, 1.00144Nd 0.51 0.61 0.65 138Ba(n, γ)139Ba 1.00, 1.00
MNRAS 000, 1–18 (2016)

14 Nishimura el al.
63 64 67 69 70 73 75 77 80 81 82 84 85 86 88 90 92
Mass number, A
0.4
0.2
0.0
0.2
0.4
Ab
un
dan
ce, lo
g10
(Y/Y
pea
k)
Cu
Cu
Zn
Zn
Zn
Zn
Ga
Ga
Ge
Ge
Ge
Ge
As
Se
Se
Se
Se
Br
Br
Kr
Kr
Kr
Kr
Kr
Rb
Rb
Sr
Sr
Sr
Y
Zr
Zr
Zr
Zr
log102
log101/2
log103
log101/3
Element
65 66 68 71 72 74 76 78 79 80 83 86 87 87 89 91 940.10
0.25
0.40
0.55
0.70
0.85
1.00
Fre
qu
en
cy, F/F
pea
k(Y
)
86 88 90 92 93 95 97 99 101 103 106 107 108 112 113 114 116 118 120 121 123 126 128 132 134 137 139 141 144
Mass number, A
0.4
0.2
0.0
0.2
0.4
Ab
un
dan
ce, lo
g10
(Y/Y
pea
k)
Sr
Sr
Sr
Y
Zr
Zr
Zr
Zr
Nb
Mo
Mo
Mo
Mo
Mo
Ru
Ru
Ru
Ru
Rh
Pd
Pd
Pd
Ag
Ag
Cd
Cd
Cd
Cd
In
In
Sn
Sn
Sn
Sn
Sn
Sn
Sn
Sn
Sb
Te
Te
Te
Te
I
Xe
Xe
Xe
Cs
Ba
Ba
Ba
Ba
La
Ce
Pr
Nd
Nd
Nd
log102
log101/2
log103
log101/3
Element
87 89 91 94 94 96 98 100 102 104 108 109 110 114 115 115 117 119 122 122 124 127 130 133 136 138 140 142 1460.10
0.25
0.40
0.55
0.70
0.85
1.00
Fre
qu
en
cy, F/F
pea
k(Y
)
Figure 11. Uncertainty distribution in the es-process when varying all relevant neutron capture and weak rates for low mass (left) and
medium mass (right) s-process nuclei. The colour shade is the probabilistic frequency and the 90% probability intervals up and down
marked for each nuclide (see Figure 2 for examples of the distribution). Horizontal dashed lines indicate uncertainty factors of 2, 3, 1/2,and 1/3, respectively.
63 64 67 69 70 73 75 77 80 81 82 84 85 86 88 90 92
Mass number, A
0.4
0.2
0.0
0.2
0.4
Ab
un
dan
ce, lo
g10
(Y/Y
pea
k)
Cu
Cu
Zn
Zn
Zn
Zn
Ga
Ga
Ge
Ge
Ge
Ge
As
Se
Se
Se
Se
Br
Br
Kr
Kr
Kr
Kr
Kr
Rb
Rb
Sr
Sr
Sr
Y
Zr
Zr
Zr
Zr
log102
log101/2
log103
log101/3
Element
65 66 68 71 72 74 76 78 79 80 83 86 87 87 89 91 940.10
0.25
0.40
0.55
0.70
0.85
1.00
Fre
qu
en
cy, F/F
pea
k(Y
)
(n,γ)
86 88 90 92 93 95 97 99 101 103 106 107 108 112 113 114 116 118 120 121 123 126 128 132 134 137 139 141 144
Mass number, A
0.4
0.2
0.0
0.2
0.4
Ab
un
dan
ce, lo
g10
(Y/Y
pea
k)
Sr
Sr
Sr
Y
Zr
Zr
Zr
Zr
Nb
Mo
Mo
Mo
Mo
Mo
Ru
Ru
Ru
Ru
Rh
Pd
Pd
Pd
Ag
Ag
Cd
Cd
Cd
Cd
In
In
Sn
Sn
Sn
Sn
Sn
Sn
Sn
Sn
Sb
Te
Te
Te
Te
I
Xe
Xe
Xe
Cs
Ba
Ba
Ba
Ba
La
Ce
Pr
Nd
Nd
Nd
log102
log101/2
log103
log101/3
Element
87 89 91 94 94 96 98 100 102 104 108 109 110 114 115 115 117 119 122 122 124 127 130 133 136 138 140 142 1460.10
0.25
0.40
0.55
0.70
0.85
1.00
Fre
qu
en
cy, F/F
pea
k(Y
)
(n,γ)
63 64 67 69 70 73 75 77 80 81 82 84 85 86 88 90 92
Mass number, A
0.4
0.2
0.0
0.2
0.4
Ab
un
dan
ce, lo
g10(Y/Y
pea
k)
Cu
Cu
Zn
Zn
Zn
Zn
Ga
Ga
Ge
Ge
Ge
Ge
As
Se
Se
Se
Se
Br
Br
Kr
Kr
Kr
Kr
Kr
Rb
Rb
Sr
Sr
Sr
Y
Zr
Zr
Zr
Zr
log102
log101/2
log103
log101/3
Element
65 66 68 71 72 74 76 78 79 80 83 86 87 87 89 91 940.10
0.25
0.40
0.55
0.70
0.85
1.00
Fre
qu
en
cy, F/F
pea
k(Y
)
β & e-capture
86 88 90 92 93 95 97 99 101 103 106 107 108 112 113 114 116 118 120 121 123 126 128 132 134 137 139 141 144
Mass number, A
0.4
0.2
0.0
0.2
0.4
Ab
un
dan
ce, lo
g10(Y/Y
pea
k)
Sr
Sr
Sr
Y
Zr
Zr
Zr
Zr
Nb
Mo
Mo
Mo
Mo
Mo
Ru
Ru
Ru
Ru
Rh
Pd
Pd
Pd
Ag
Ag
Cd
Cd
Cd
Cd
In
In
Sn
Sn
Sn
Sn
Sn
Sn
Sn
Sn
Sb
Te
Te
Te
Te
I
Xe
Xe
Xe
Cs
Ba
Ba
Ba
Ba
La
Ce
Pr
Nd
Nd
Nd
log102
log101/2
log103
log101/3
Element
87 89 91 94 94 96 98 100 102 104 108 109 110 114 115 115 117 119 122 122 124 127 130 133 136 138 140 142 1460.10
0.25
0.40
0.55
0.70
0.85
1.00
Fre
qu
en
cy, F/F
pea
k(Y
)
β & e-capture
Figure 12. Same as Figure 11 but when varying only neutron captures (top) or weak rates (bottom).
element Rh has only one stable isotope, 103Rh, so that thekey reaction for the elemental production obviously corre-sponds to the one for this isotope as given in Table 7. In veryhigh quality spectra of galactic halo stars, the abundance ofrhodium can be measured (Hill et al. 2002) and can be usedto constrain the key reaction rate, 103Rh(n, γ)104Rh. For in-
dium, the 113In isotope is mostly produced by the s-process1,
1 In the solar abundances, the isotopic contribution of 113In to theelemental abundance is less than 5% and 115In is the dominant
isotope. This isotopic comparison is driven by another nucleosyn-thesis process, namely the r-process, that produces most of the
solar In.
MNRAS 000, 1–18 (2016)

MC uncertainties for massive star s-process 15
63 64 67 69 70 73 75 77 80 81 82 84 85 86 88 90 92
Mass number, A
0.4
0.2
0.0
0.2
0.4
Ab
un
dan
ce, lo
g10
(Y/Y
pea
k)
Cu
Cu
Zn
Zn
Zn
Zn
Ga
Ga
Ge
Ge
Ge
Ge
As
Se
Se
Se
Se
Br
Br
Kr
Kr
Kr
Kr
Kr
Rb
Rb
Sr
Sr
Sr
Y
Zr
Zr
Zr
Zr
log102
log101/2
log103
log101/3
Element
65 66 68 71 72 74 76 78 79 80 83 86 87 87 89 91 940.10
0.25
0.40
0.55
0.70
0.85
1.00
Fre
qu
en
cy, F/F
pea
k(Y
)
Lv2
86 88 90 92 93 95 97 99 101 103 106 107 108 112 113 114 116 118 120 121 123 126 128 132 134 137 139 141 144
Mass number, A
0.4
0.2
0.0
0.2
0.4
Ab
un
dan
ce, lo
g10
(Y/Y
pea
k)
Sr
Sr
Sr
Y
Zr
Zr
Zr
Zr
Nb
Mo
Mo
Mo
Mo
Mo
Ru
Ru
Ru
Ru
Rh
Pd
Pd
Pd
Ag
Ag
Cd
Cd
Cd
Cd
In
In
Sn
Sn
Sn
Sn
Sn
Sn
Sn
Sn
Sb
Te
Te
Te
Te
I
Xe
Xe
Xe
Cs
Ba
Ba
Ba
Ba
La
Ce
Pr
Nd
Nd
Nd
log102
log101/2
log103
log101/3
Element
87 89 91 94 94 96 98 100 102 104 108 109 110 114 115 115 117 119 122 122 124 127 130 133 136 138 140 142 1460.10
0.25
0.40
0.55
0.70
0.85
1.00
Fre
qu
en
cy, F/F
pea
k(Y
)
Lv2
63 64 67 69 70 73 75 77 80 81 82 84 85 86 88 90 92
Mass number, A
0.4
0.2
0.0
0.2
0.4
Ab
un
dan
ce, lo
g10
(Y/Y
pea
k)
Cu
Cu
Zn
Zn
Zn
Zn
Ga
Ga
Ge
Ge
Ge
Ge
As
Se
Se
Se
Se
Br
Br
Kr
Kr
Kr
Kr
Kr
Rb
Rb
Sr
Sr
Sr
Y
Zr
Zr
Zr
Zr
log102
log101/2
log103
log101/3
Element
65 66 68 71 72 74 76 78 79 80 83 86 87 87 89 91 940.10
0.25
0.40
0.55
0.70
0.85
1.00F
req
uen
cy, F/F
pea
k(Y
)
Lv3
86 88 90 92 93 95 97 99 101 103 106 107 108 112 113 114 116 118 120 121 123 126 128 132 134 137 139 141 144
Mass number, A
0.4
0.2
0.0
0.2
0.4
Ab
un
dan
ce, lo
g10
(Y/Y
pea
k)
Sr
Sr
Sr
Y
Zr
Zr
Zr
Zr
Nb
Mo
Mo
Mo
Mo
Mo
Ru
Ru
Ru
Ru
Rh
Pd
Pd
Pd
Ag
Ag
Cd
Cd
Cd
Cd
In
In
Sn
Sn
Sn
Sn
Sn
Sn
Sn
Sn
Sb
Te
Te
Te
Te
I
Xe
Xe
Xe
Cs
Ba
Ba
Ba
Ba
La
Ce
Pr
Nd
Nd
Nd
log102
log101/2
log103
log101/3
Element
87 89 91 94 94 96 98 100 102 104 108 109 110 114 115 115 117 119 122 122 124 127 130 133 136 138 140 142 1460.10
0.25
0.40
0.55
0.70
0.85
1.00
Fre
qu
en
cy, F/F
pea
k(Y
)
Lv3
63 64 67 69 70 73 75 77 80 81 82 84 85 86 88 90 92
Mass number, A
0.4
0.2
0.0
0.2
0.4
Ab
un
dan
ce, lo
g10
(Y/Y
pea
k)
Cu
Cu
Zn
Zn
Zn
Zn
Ga
Ga
Ge
Ge
Ge
Ge
As
Se
Se
Se
Se
Br
Br
Kr
Kr
Kr
Kr
Kr
Rb
Rb
Sr
Sr
Sr
Y
Zr
Zr
Zr
Zr
log102
log101/2
log103
log101/3
Element
65 66 68 71 72 74 76 78 79 80 83 86 87 87 89 91 940.10
0.25
0.40
0.55
0.70
0.85
1.00
Fre
qu
en
cy, F/F
pea
k(Y
)
Lv4
86 88 90 92 93 95 97 99 101 103 106 107 108 112 113 114 116 118 120 121 123 126 128 132 134 137 139 141 144
Mass number, A
0.4
0.2
0.0
0.2
0.4
Ab
un
dan
ce, lo
g10
(Y/Y
pea
k)
Sr
Sr
Sr
Y
Zr
Zr
Zr
Zr
Nb
Mo
Mo
Mo
Mo
Mo
Ru
Ru
Ru
Ru
Rh
Pd
Pd
Pd
Ag
Ag
Cd
Cd
Cd
Cd
In
In
Sn
Sn
Sn
Sn
Sn
Sn
Sn
Sn
Sb
Te
Te
Te
Te
I
Xe
Xe
Xe
Cs
Ba
Ba
Ba
Ba
La
Ce
Pr
Nd
Nd
Nd
log102
log101/2
log103
log101/3
Element
87 89 91 94 94 96 98 100 102 104 108 109 110 114 115 115 117 119 122 122 124 127 130 133 136 138 140 142 1460.10
0.25
0.40
0.55
0.70
0.85
1.00
Fre
qu
en
cy, F/F
pea
k(Y
)
Lv4
Figure 13. Results of MC calculations in the es-process for different MC levels, Lv2 (upper panel), Lv3 (middle panel), and Lv4 (lower
panel). Uncertainty distributions are plotted in the same manner as in Figure 11.
where the mass fraction of 113In is 0.964 of the totally pro-duced In. Thus, the key reaction of 113In naturally has asignificant impact on uncertainty of In.
In addition to the es-process in our standard model(z2r4), the uncertainty range and the key reactions for thevery low metal-poor star, z4r4, are shown in Table 9. Thismodel showed a different final abundance distribution (Fig-ure 10). Nevertheless, comparing Table 8 and Table 9, we donot find any significant differences either in the uncertaintyranges or in correlation coefficients and listed key reactions.This indicates that our conclusions regarding the nuclearphysics uncertainties in the es-process are robust with only
a weak dependence on the stellar models as long as the finalabundance distribution shows a typical es-process pattern,as discussed in Section 4.1.
5 OPPORTUNITIES FOR IMPROVEDNUCLEAR DATA
Tables 4 and 7 list the key nuclear reaction rates identifiedin this study for the ws- and es-processes, respectively. Un-certainties in these rates have the greatest overall impacton final abundances, and are therefore prioritised for future
MNRAS 000, 1–18 (2016)

16 Nishimura el al.
Table 8. Uncertainties in the es-process for elemental abun-dances in the z2r4 model. The columns ‘Up’ and ‘Down’ corre-
spond to the upper and lower boundary of the uncertainty range
similar to Table 6 but for each element. The correlation coefficientrcor and the corresponding reaction is shown for Lv1 key reactions
(See Section 4.3).
Element Up Down rcor Key reaction
Cu 1.14 0.913 -0.73 65Cu(n, γ)66CuZn 1.28 0.900 -0.91 68Zn(n, γ)69ZnGa 1.11 0.935 -0.83 71Ga(n, γ)72GaGe 1.28 0.852 -0.74 72Ge(n, γ)73GeAs 1.33 0.938 -0.96 75As(n, γ)76AsSe 1.41 0.828 -0.73 78Se(n, γ)79SeBr 1.51 0.851 -0.80 81Kr(n, γ)82KrKr 1.19 0.869Rb 1.19 0.867
Sr 1.18 0.861
Y 1.22 0.828Zr 1.25 0.808
Nb 1.36 0.760
Mo 1.26 0.747Ru 1.39 0.793
Rh 2.39 0.766 -0.85 103Rh(n, γ)104RhPd 1.36 0.744
Ag 1.36 0.686
Cd 1.34 0.761
In 2.75 0.743 -0.85 113In(n, γ)114InSn 1.35 0.753
Sb 1.75 0.723 -0.73 121Sb(n, γ)122SbTe 1.42 0.769
I 1.78 0.761 -0.70 127I(n, γ)128IXe 1.43 0.767Cs 1.43 0.714
Ba 1.31 0.785
La 1.32 0.798Ce 1.21 0.867
Pr 1.22 0.851
Nd 1.15 0.907
precision measurement. Although neutron captures on sta-ble or long-lived nuclei can, in principle, be measured, itis not always possible to also experimentally constrain thestellar neutron capture rates which contain contributionsfrom reactions on thermally excited states of the target nu-cleus. As highlighted earlier, excited state contributions areimportant for some nuclei even at s-process temperatures.This should be kept in mind when selecting reactions fromTables 4 and 7 for future experiments. To simplify the task,the g.s. contributions to the stellar rates are also given inthe tables of the key reactions. The larger the ground-state(g.s.) contribution, the better an experiment can constraina stellar rate, as can also be seen from Equation (2). Sincemany key reactions have a ground-state contribution close toone, there is a good prospect of future experiments reducingthe uncertainties in these rates.
The experimental measurement of (n, γ) type reactionsis well established, for example through the use of activa-tion or neutron time of flight techniques. For direct mea-surements, one requires a radioactively stable or long-livedtarget of sufficient mass and isotopic purity, and in addi-tion a solid and chemically inert target is preferred. Com-pounds may be used to satisfy the latter requirement. Many
Table 9. Uncertainty and key reactions of es-process elements(z4r4). The columns are the same as Table 8.
Element Up Down rcor Key reaction
Cu 1.15 0.893 -0.66 65Cu(n, γ)66Cu
Zn 1.30 0.892 -0.90 68Zn(n, γ)69Zn
Ga 1.12 0.930 -0.79 71Ga(n, γ)72Ga
Ge 1.29 0.849 -0.74 72Ge(n, γ)73Ge
As 1.33 0.940 -0.97 75As(n, γ)76As
Se 1.53 0.901 -0.74 78Se(n, γ)79Se
Br 1.45 0.823 -0.80 81Kr(n, γ)82KrKr 1.18 0.871
Rb 1.19 0.874
Sr 1.16 0.879Y 1.21 0.841
Zr 1.20 0.785Nb 1.36 0.760
Mo 1.31 0.778
Ru 1.39 0.791
Rh 2.39 0.756 -0.85 103Rh (n, γ) 104Rh
Pd 1.37 0.748Ag 1.49 0.744
Cd 1.35 0.757
In 2.83 0.776 -0.85 113In (n, γ) 114In
Sn 1.36 0.751
Sb 1.82 0.738 -0.71 121Sb (n, γ) 122Sb
Te 1.40 0.731
I 1.74 0.721 -0.69 127I (n, γ) 128IXe 1.46 0.754
Cs 1.52 0.730Ba 1.43 0.781
La 1.49 0.820
Ce 1.34 0.853Pr 1.30 0.815
Nd 1.22 0.864
of the reactions listed in tables 4 and 7 satisfy these require-ments, and indeed many have been measured, although withgreatly varying levels of completeness, precision, and con-sistency. We used the KADoNiS database (Dillmann et al.2006b) to define the standard neutron capture rates for ourMC variations. Opportunities for improvements to the li-brary of nuclear data are extensive. For example, the 77Seand 78Se(n, γ) reactions are identified as Lv1 key reactionsin both the ws- and es-processes. In the case of 77Se, existingprecision data cover only the 15 < E < 100 keV and aroundthe 510 keV regions. Recent work (Kamada et al. 2010) re-vealed inconsistencies at the level of 10–20% as compared toearlier evaluations. Similarly, for 78Se(n, γ)79Se, a previousactivation study (Dillmann et al. 2006a) and time of flightmeasurements (Igashira et al. 2011, and private communi-cation) show a large discrepancy in values of Maxwellianaveraged cross section.
For some of the reactions identified here there arepresently no experimental data available, e.g., neutron cap-tures on 80Br, 81Kr, 99Ru, and 103Ru, although 80Br and103Ru are radioactive isotopes with half lives of 17.68 m and39.25 d, respectively.
MNRAS 000, 1–18 (2016)

MC uncertainties for massive star s-process 17
6 SUMMARY AND CONCLUSIONS
We investigated the impact of nuclear-physics uncertaintieson the s-process in massive stars, focusing on neutron cap-tures and weak reaction (mostly β-decays) rates. Adopt-ing the evolution models of a solar metallicity star and afast rotating metal-poor star, we studied the ws-process androtation-induced es-process, respectively. Using newly eval-uated temperature-dependent uncertainties for neutron cap-ture and β-decay rates, we performed a series of MC calcula-tions with a nuclear reaction network. We obtained completeinformation about the uncertainty of final abundances andthe identity of the underlying key reaction rates. The resultsare summarised as follows.
(i) For both of the ws- and es-processes, the uncertaintyrange in the final abundances (the upper and lower bound-aries of 90% probability around the mean value) is relativelysmall for the majority of s-process nuclei, typically within afew tens of percent. Several nuclei have a larger uncertaintyin the final abundance, which is beyond a factor of 2 but isless than a factor of 5. In general, the resulting frequencydistribution of the final abundances is continuous but asym-metric in shape.
(ii) Our MC calculations have determined the correlation(rcor defined by Equation 4) between the reaction rate varia-tion and the final abundances, identifying key neutron cap-ture reactions and β-decays (|rcor | > 0.65). We find 10 impor-tant reactions to improve the ws-process abundance predic-tion as well as 30 rates for the es-process. In addition, thereare 11 and 32 extra rates of secondary importance for thews- and es-processes, respectively, summarised in Table 4and 7.
(iii) The es-process exhibits different features of uncer-tainty distribution and key reactions from the ws-process.Even within the lighter s-process nuclei region, overlappedwith ws-process products, the es-process has a larger uncer-tainty with more key reactions. This is caused by a strongerflow of nucleosynthesis due to a higher neutron exposure.
(iv) Although there are still uncertainties in stellar mod-els for the es-process, the results of MC variation basedon models at two different metallicities lead to the samekey reaction rate list. Thus the key reaction rate list ob-tained in this study is robust, as long as the final abundancesshow a “typical” es-process pattern, producing intermediates-process nuclei from strontium to barium.
In the priority list (key reactions) for both ws- and es-processes, there are some reactions for which future experi-ments can reduce the current uncertainty. The weak reactionrates are mostly from theory and their uncertainty is signif-icant, especially at the stellar temperature. Improved rele-vant nuclear physics properties and theoretical predictionsare desirable. Conversely, our MC results in combinationwith future observations may be able to provide constraintson the nuclear physics.
For the es-process in particular there are only limitedobservational constraints. However, we find that the uncer-tainty range and the key reactions are similar in a certainrange of metallicities for fast rotating evolution models. Theevaluated uncertainty in each element can be immediatelyuseful for some astronomical application, e.g. comparisonto abundance observations in metal-poor stars and theoret-
ical calculations of galactic chemical evolution. We expectthat such astronomical comparisons will provide further re-striction to the es-process abundances and relevant nuclearreactions.
As demonstrated in this study of the impact of (n,γ)rate uncertainties on the s-process production in massivestars, a Monte Carlo framework provides a robust tool forthe analysis of uncertainties. This is the second paper in aseries of applications of our recently developed MC frame-work, including sets of realistic variation limits, which wasdescribed in more detail in the first paper (Rauscher et al.2016). The framework is applicable to further nucleosynthe-sis processes, in particular to the synthesis of heavy elementsin which a large number of reactions are involved. A study ofthe main s-process is underway (G. Cescutti et al, in prepa-ration). Applications of the MC framework to further nucle-osynthesis processes, such as the γ-process in thermonuclearsupernovae, the r- and the νp-processes are planned.
ACKNOWLEDGMENTS
The authors thank U. Frischknecht and C. Winteler for con-tributing to the development of the MC code. This projecthas been financially supported by European ResearchCouncil (EU-FP7-ERC-2012-St Grant 306901-SHYNE andGA 321263-FISH) and Swiss National Science Founda-tion. Numerical computations were in part carried outon the Cambridge COSMOS SMP system (part of theSTFC DiRAC HPC Facility supported by BIS NeI capi-tal grant ST/J005673/1 and STFC grants ST/H008586/1,ST/K00333X/1) and Edinburgh Compute and Data Facil-ity, Eddie mark 3, which has support from the eDIKT ini-tiative. N.N. used computer facilities at CfCA, National As-tronomical Observatory of Japan. R.H. acknowledges sup-port from the World Premier International Research CenterInitiative, MEXT, Japan. G.C. acknowledges financial sup-port from the European Union Horizon 2020 research andinnovation programme under the Marie Sk lodowska-Curiegrant agreement No 664931. The University of Edinburgh isa charitable body, registered in Scotland, with registrationNo. SC005336.
REFERENCES
Aikawa M., Arnould M., Goriely S., Jorissen A., Takahashi K.,
2005, A&A, 441, 1195
Angulo C., et al., 1999, Nuclear Physics A, 656, 3
Bennett M. E., et al., 2012, MNRAS, 420, 3047
Best A., et al., 2011, Phys. Rev. C, 83, 052802
Best A., et al., 2013, Phys. Rev. C, 87, 045805
Bisterzo S., et al., 2015, MNRAS, 449, 506
Burbidge E. M., Burbidge G. R., Fowler W. A., Hoyle F., 1957,
Reviews of Modern Physics, 29, 547
Caughlan G. R., Fowler W. A., 1988, Atomic Data and NuclearData Tables, 40, 283
Cescutti G., Chiappini C., Hirschi R., Meynet G., FrischknechtU., 2013, A&A, 553, A51
Chiappini C., Frischknecht U., Meynet G., Hirschi R., Barbuy B.,
Pignatari M., Decressin T., Maeder A., 2011a, Nature, 472,
454
MNRAS 000, 1–18 (2016)

18 Nishimura el al.
Chiappini C., Frischknecht U., Meynet G., Hirschi R., Barbuy B.,
Pignatari M., Decressin T., Maeder A., 2011b, Nature, 474,
666
Cyburt R. H., et al., 2010, ApJS, 189, 240
Dillmann I., et al., 2006a, in International Symposium on NuclearAstrophysics - Nuclei in the Cosmos. p. 89.1
Dillmann I., Heil M., Kappeler F., Plag R., Rauscher T., Thiele-
mann F.-K., 2006b, in Woehr A., Aprahamian A., eds, Amer-ican Institute of Physics Conference Series Vol. 819, Capture
Gamma-Ray Spectroscopy and Related Topics. pp 123–127,doi:10.1063/1.2187846
Freiburghaus C., Rauscher T., 1999, Reaction rate library in
REACLIB format; http://nucastro.org/reaclib
Frischknecht U., Hirschi R., Thielemann F.-K., 2012, A&A, 538,
L2
Frischknecht U., et al., 2016, MNRAS, 456, 1803
Gallagher A. J., Ludwig H.-G., Ryan S. G., Aoki W., 2015, A&A,
579, A94
Goriely S., 1999, A&A, 342, 881
Hill V., et al., 2002, A&A, 387, 560
Hirschi R., Meynet G., Maeder A., 2004, A&A, 425, 649
Hirschi R., et al., 2008, in Nuclei in the Cosmos (NIC X).(arXiv:0811.4654)
Hoffman R. D., Rauscher T., Heger A., Woosley S. E., 2002, J.
Nucl. Sci. Techn., Suppl., 2, 512
Igashira M., Kamada S., Katabuchi T., Mizumoto M., 2011, Jour-
nal of the Korean Physical Society, 59, 1665
Iliadis C., Longland R., Coc A., Timmes F. X., Champagne A. E.,
2014, preprint, 702 (arXiv:1409.5541)
Jaeger M., Kunz R., Mayer A., Hammer J. W., Staudt G., KratzK. L., Pfeiffer B., 2001, Physical Review Letters, 87, 202501
Jones S., Hirschi R., Pignatari M., Heger A., Georgy C.,Nishimura N., Fryer C., Herwig F., 2015, MNRAS, 447, 3115
Kamada S., Igashira M., Katabuchi T., Mizumoto M., 2010, Jour-
nal of nuclear science and technology, 47, 634
Kappeler F., Gallino R., Bisterzo S., Aoki W., 2011, Reviews of
Modern Physics, 83, 157
Kikuchi Y., Ono M., Matsuo Y., Hashimoto M., Fujimoto S.,
2012, Progress of Theoretical Physics, 127, 171
Longland R., Iliadis C., Karakas A. I., 2012, Phys. Rev. C, 85,065809
Nishimura N., et al., 2014, in Jeong S., Imai N., Miyatake H., Ka-jino T., eds, American Institute of Physics Conference Series
Vol. 1594, American Institute of Physics Conference Series.
pp 146–151, doi:10.1063/1.4874059
Pearson K., 1895, Proceedings of the Royal Society of London,
58, 240
Pignatari M., Gallino R., Meynet G., Hirschi R., Herwig F., Wi-escher M., 2008, ApJ, 687, L95
Pignatari M., Gallino R., Heil M., Wiescher M., Kappeler F.,Herwig F., Bisterzo S., 2010, ApJ, 710, 1557
Pignatari M., et al., 2013, ApJ, 762, 31
Pignatari M., et al., 2016, ApJS, 225, 24
Prantzos N., Hashimoto M., Nomoto K., 1990, A&A, 234, 211
Raiteri C. M., Gallino R., Busso M., 1992, ApJ, 387, 263
Rauscher T., 2012, ApJS, 201, 26
Rauscher T., Thielemann F.-K., 2000, Atomic Data and Nuclear
Data Tables, 75, 1
Rauscher T., Heger A., Hoffman R. D., Woosley S. E., 2002, ApJ,576, 323
Rauscher T., Mohr P., Dillmann I., Plag R., 2011, ApJ, 738, 143
Rauscher T., Nishimura N., Hirschi R., Cescutti G., Murphy
A. S. J., Heger A., 2016, MNRAS, 463, 4153
Roederer I. U., Lawler J. E., Sneden C., Cowan J. J., SobeckJ. S., Pilachowski C. A., 2008, in O’Shea B. W., HegerA., eds, American Institute of Physics Conference Series
Vol. 990, First Stars III. pp 172–174 (arXiv:0712.2473),doi:10.1063/1.2905533
Seeger P. A., Fowler W. A., Clayton D. D., 1965, ApJS, 11, 121
Suda T., Hirschi R., Fujimoto M. Y., 2011, ApJ, 741, 61
Taggart M., et al., 2010, in Nuclei in the Cosmos. p. 45Takahashi K., Yokoi K., 1987, Atomic Data and Nuclear Data
Tables, 36, 375
Tur C., Heger A., Austin S. M., 2009, ApJ, 702, 1068Xu Y., Goriely S., Jorissen A., Chen G. L., Arnould M., 2013,
A&A, 549, A106
This paper has been typeset from a TEX/LATEX file prepared bythe author.
MNRAS 000, 1–18 (2016)