Embed Size (px)
Citation preview

UNIVERSIDAD POLITÉCNICA DE MADRID
ESCUELA TÉCNICA SUPERIOR DE INGENIERÍA AGRÓNOMICA,
ALIMENTARIA Y DE BIOSISTEMAS
DEPARTAMENTO DE PRODUCCIÓN AGRARIA
INFLUENCE OF PARTICLE SIZE OF THE CEREAL OF
THE DIET ON EGG PRODUCTION, EGG QUALITY, AND
THE DEVELOPMENT OF THE GASTROINTESTINAL
TRACT OF BROWN-EGG LAYING HENS
TESIS DOCTORAL
JORGE HERRERA LLORENTE
VETERINARIO
2017
UNIVERSIDAD POLITÉCNICA DE MADRID
ESCUELA TÉCNICA SUPERIOR DE INGENIERÍA AGRÓNOMICA,
ALIMENTARIA Y DE BIOSISTEMAS
DEPARTAMENTO DE PRODUCCIÓN AGRARIA
Ph.D. THESIS
INFLUENCE OF PARTICLE SIZE OF THE CEREAL OF
THE DIET ON EGG PRODUCTION, EGG QUALITY, AND
THE DEVELOPMENT OF THE GASTROINTESTINAL
TRACT OF BROWN-EGG LAYING HENS
JORGE HERRERA LLORENTE
VETERINARIO
DIRECTOR DE LA TESIS
GONZALO GONZÁLEZ MATEOS
Dr. INGENIERO AGRÓNOMO
2017
AGRADECIMIENTOS
La realización de esta Tesis Doctoral ha sido posible gracias a la
ayuda inestimable de todos los miembros que forman parte de Camar
Agroalimentaria y El Canto Agroalimentaria, equipo del cual me siento muy
orgulloso de formar parte; en especial, a: Cipriano Lorenzo por su confianza
incondicional, Medin de Vega y Julio García por todos los momentos que
compartimos, Emilio Rocco y a todo el equipo de granjeros de El Canto
Agroalimentaria.
Mi más sincero agradecimiento a Julio Tovar Andrada, Catedrático
de Producción Animal de la Facultad de Veterinaria de la Universidad de
Extremadura, con el que empecé esta aventura, compartí muchos momentos,
y que fue un gran apoyo en momentos difíciles de mi vida.
Al profesor Luis Fernando de la Fuente, Catedrático de Genética de
la Facultad de Veterinaria de la Universidad de León, partícipe también en
los inicios de mi tesis.
También agradecer a los miembros del Departamento de Producción
Agraria de la Universidad Politécnica de Madrid, por su interés,

disponibilidad y paciencia en todo este tiempo; especialmente a Lourdes,
Beatriz y Husham y Yolanda.
A mi director de tesis Gonzalo González Mateos, al cual admiro
profundamente, y del que he aprendido mucho en todo este tiempo.
A mi familia: mi mujer Beatriz, por su dedicación y apoyo siempre,
sobre todo en mis ausencias, a mis dos hijos Jorge y Carmen, por ser como
son; y a mi madre Mª Cruz, cimiento de quien soy hoy en día. A mi hermano
Emilio, por su apoyo incondicional.
Finalmente, a mi Padre Jesús, al cual le prometí realizar esta tesis, y seguro
que estará orgulloso del esfuerzo y trabajo realizado, valores que supo
trasmitirme con maestría.
Con toda mi gratitud
Jorge Herrera

INDEX OF CONTENTS

Index
INDEX OF CONTENTS
RESUMEN 1
SUMMARY 6
CHAPTER 1: LITERATURE REVIEW AND OBJECTIVES 10
1. Literature review 11
1.1. Introduction 11
1.2. Main cereal of the diet 14
1.2.1. Effect on poultry performance 14
1.2.2. Effect on gastrointestinal tract development 18
1.3. Particle size of the diet 19
1.3.1. Methods for particle size reduction 20
1.3.2. Effect on poultry performance 21
1.3.3. Effect on gastrointestinal tract development 23
2. Objectives of the thesis 26
CHAPTER 2: INFLUENCE OF PARTICLE SIZE OF THE MAIN CEREAL OF
THE DIET ON EGG PRODUCTION AND EGGS QUALITY OF BROWN EGG
LAYING HENS FROM 33 TO 65 WEEKS OF AGE 27
1. Introduction 28
2. Materials and methods 29
2.1. Husbandry, diets, and experiment design 29
2.2. Laboratory analysis 30
2.3. Measurements 31
2.3.1. Hen production 31
2.3.2. Egg quality 31
2.4. Statistical analysis 32
3. Results 33
3.1. Hen production and egg quality 33
3.1.1. Main cereal of the diet 33
3.1.2. Screen size 33
Index
4. Discussion 34
4.1. Main cereal of the diet 34
4.2. Screen size 36
CHAPTER 3: INFLUENCE OF PARTICLE SIZE OF THE MAIN CEREAL OF
THE DIET ON EGG PRODUCTION, GASTROINTESTINAL TRACT TRAITS,
AND BODY MEASUREMENTS OF BROWN LAYING HENS 46
1. Introduction 47
2. Materials and methods 48
2.1. Husbandry, diets, and experiment design 48
2.2. Laboratory analysis 50
2.3. Measurements 50
2.3.1. Hen productivity 50
2.3.2. Egg quality 51
2.3.3. Gastrointestinal tract traits and body measurements 52
2.4. Statistical analysis 53
3. Results 53
3.1. Hen productivity and egg quality 53
3.1.1. Main cereal of the diet 53
3.1.2. Screen size 54
3.2. Gastrointestinal tract traits and body measurements 54
3.2.1. Main cereal of the diet 54
3.2.2. Screen size 54
4. Discussion 55
4.1. Hen productivity and egg quality 55
4.1.1. Main cereal of the diet 55
4.1.2. Screen size 57
4.2. Gastrointestinal tract traits and body measurements 59
4.2.1. Main cereal of the diet 59
4.2.2. Screen size 59
Index
CHAPTER 4: PARTICLE SIZE AFFECTS SHORT TERM PREFERENCE
BEHAVIOR OF BROWN-EGG LAYING HENS FED DIETS BASED ON CORN
OR BARLEY 69
1. Introduction 70
2. Materials and methods 72
2.1. Husbandry, diets, and experiment design 72
2.2. Laboratory analysis 74
2.3. Statistical analysis 75
3. Results 75
4. Discussion 77
CHAPTER 5: GENERAL DISCUSSION AND CONCLUSIONS 93
1. General discussion 94
1.1. Main cereals 94
1.1.1. Influence on hen production 94
1.1.2. Influence on egg quality traits 96
1.1.3. Influence on gastrointestinal tract development and body
measurements 98
1.2. Particle size 99
1.2.1. Influence on hen production 99
1.2.2. Influence on egg quality traits 102
1.2.3. Influence on gastrointestinal tract development and body
measurements 103
1.2.4. Influence on preference behavior 104
2. General conclusions 106
CHAPTER 6: REFERENCES 108

ABBREVIATIONS

Abbreviations
ABBREVIATIONS
AA Amino acid
ADFI Average daily feed intake
AMEn Apparent metabolisable energy, corrected for nitrogen
BMI Body mass index
BW Body weight
cm Centimeter
CF Crude fiber
CP Crude protein
d Day
DM Dry matter
EE Ether extract
EMAn Energía metabolizable aparente, corregida en nitrógeno
ES Enzyme supplementation
EU European union
FCR Feed conversion ratio
FI Feed intake
g Gram
GIT Gastrointestinal tract
GMD Geometric mean diameter
GSD Geometric standard deviation
h Hour
kg kilogram
LNL Linoleic acid
mm Millimeters
MT Million tons

Abbreviations
NDF Neutral detergent fiber
NSP Non-starch polysaccharides
SCWL Single comb white leghorn
SEM Standard error of the mean
TSAA Total sulfur amino acids
μm Micrometer
wk Week

1
RESUMEN
Resumen
2
RESUMEN
El objetivo general de esta tesis doctoral fue estudiar los efectos del tamaño de la
criba utilizado para moler el cereal principal del pienso sobre el consumo, los
rendimientos productivos y las características del tracto gastrointestinal (TGI) en
gallinas ponedoras rubias. Con este proposito, se estudió la inclusión de maíz, trigo y
cebada en piensos de gallinas ponedoras en tres experimentos.
En el experimento 1 (capítulo 2), se estudió la influencia del tamaño de partícula
del cereal principal del pienso en la producción y la calidad del huevo en gallinas
ponedoras rubias de 33 a 65 sem de edad. El experimento se diseñó completamente al
azar, con 6 tratamientos organizados en un factorial 3 x 2 en base a 3 cereales (cebada,
maíz y trigo) y 2 tamaños de molienda del cereal (criba de 6 y 10 mm). Cada
tratamiento se replicó 11 veces (10 gallinas por repetición). Las dietas se formularon
para ser isonutritivas y contenían 2.740 Kcal/kg EMAn y 16.8% de proteína bruta. La
producción de huevos, el consumo de pienso, el peso del huevo y el índice de
conversión se calcularon por período (4 sem) y para el global del experimento. Así
mismo se midieron los parámetros de calidad del huevo: porcentaje de huevos sucios,
rotos y sin cáscara; proporción de albumen, yema y cáscara y espesor, fuerza y color de
la cáscara al final de cada período. Al final de la prueba, no se observaron interacciones
entre el cereal principal y el diámetro geométrico medio del pienso para ninguna de las
variables estudiadas. Ni el pienso ni el tamaño de partícula afectaron el consumo de
pienso, la producción de huevos o la ganancia de peso corporal. Los huevos fueron más
pesados (P <0,01) en las gallinas alimentadas con cebada que en las gallinas
alimentadas con maíz o trigo, probablemente debido al mayor contenido de grasa de los
piensos de cebada. Además, el Índice de Conversión tendió a ser mejor (P<0.07) en las
Resumen
3
gallinas alimentadas con cebada que en las gallinas alimentadas con maíz o trigo. El
tipo de pienso no afectó a ninguno de los parámetros de calidad del huevo. En resumen,
cebada y trigo convenientemente suplementados con enzimas, pueden utilizarse en
sustitución del maíz a niveles de hasta el 55%, en piensos para gallinas ponedoras, sin
efecto adverso alguno sobre la producción o los parámetros de calidad del huevo.
Además, la sustitución del maíz por una combinación de cebada y grasa aumentó el
tamaño del huevo. En consecuencia, el uso de uno u otro cereal del pienso dependerá
principalmente de su coste relativo y de la preferencia del mercado por el huevo grande.
Dentro del rango estudiado, el tamaño de partícula de los cereales no afectó a la
producción de las aves.
En el experimento 2 (capítulo 3), se estudió la influencia del tamaño de la criba
utilizado para moler el cereal sobre la producción de huevos, el desarrollo del TGI y las
medidas corporales en gallinas de 17 a 49 sem de edad. Se utilizaron 10 piensos,
utilizando un factorial 2 × 5 con 2 cereales principales (maíz vs. cebada) y 5 tamaños de
criba del cereal (4, 6, 8, 10 y 12 mm). Cada tratamiento se replicó 5 veces (10 gallinas
por repetición). No se observaron interacciones entre el cereal principal y el tamaño de
la criba, para ninguno de los factores estudiados. El tipo de cereal y el tamaño de la
criba no afectaron al consumo de pienso, la producción de huevos, o ganancia de peso
vivo o parámetros de calidad de los huevos. Los huevos tendieron a ser más grandes (P
= 0.09) en las gallinas alimentadas con cebada que en las gallinas alimentadas con maíz.
Además, el índice de conversión tendió a aumentar (P = 0,08) al moler el cereal del
pienso con una criba de 4 mm comparado con la media de los otros piensos. A las 49
sem de edad, el peso relativo (% BW) del TGI y de la molleja fue superior (P <0,05) en
las gallinas alimentadas con cebada que en las alimentadas con maíz. Un aumento del
tamaño de la criba aumentó linealmente el peso relativo del TGI (P = 0,09), de la
Resumen
4
molleja (P <0,01) y del hígado (P = 0,06). Ninguna de las otras medidas del TGI o
corporal, se vieron afectadas por el cereal principal del pienso o por el tamaño de la
criba. En resumen, la cebada puede sustituir hasta un 45% del maíz en piensos para
gallinas ponedoras sin ningún efecto adverso sobre la producción de huevos. Por lo
tanto, el uso de uno u otro cereal dependerá de su coste relativo. Al aumentar el tamaño
de la criba mejoró el desarrollo de la molleja, sin llegar a afectar la productividad de las
aves. Dentro del rango estudiado, el tamaño de la criba utilizada para moler el cereal
tuvo poco efecto sobre la productividad de las gallinas, aunque la criba de 4 mm tendió
a incrementar los índices de conversión pero al mismo tiempo mejoró el desarrollo de la
molleja.
En el experimento 3 (capítulo 4), se estudió la influencia del tamaño de partícula
del cereal principal del pienso sobre la preferencia en el consumo de las gallinas
ponedoras. Los piensos se diseñaron formando un factorial 2x5 con 2 cereales
principales (maíz vs. cebada) y 5 tamaños de molienda del cereal (4, 6, 8, 10 y 12 mm
de criba). Cada tratamiento se replicó 5 veces (10 gallinas por repetición). Tras un
período de ayuno de 8 h, las gallinas recibieron sus respectivos piensos experimentales
de 6,00 a.m. a 14,00 p.m. El tamaño geométrico medio y la desviación estándar
geométrica de los piensos se determinaron cada 2 h. Además se determinó el contenido
en proteína bruta, cenizas y Ca de los piensos al inicio y al final del experimento. El
diseño experimental fue completamente al azar y los datos se analizaron con medidas
repetidas con el tamaño de partícula y el cereal como factores principales. El tamaño
geométrico medio de los piensos originales aumentó al aumentar el tamaño de la criba
y fue mayor para los piensos basados en cebada que para los piensos basados en maíz.
La diferencia en el tamaño geométrico medio entre las piensos originales y los residuos
de este pienso medidos a intervalos de 2 h, disminuyó a medida que transcurria el
Resumen
5
experimento (P <0,001 para la interacción). La proteína bruta, la ceniza y el Ca de
piensos y residuos en comederos se concentraron en la fracción grosera tanto en los
piensos originales como en el pienso sobrante con los efectos más pronunciados para
los minerales. Independientemente del tamaño del tamiz, el contenido en cenizas y Ca
fue mayor en el pienso sobrante no consumido a las 14.00 h p.m que en los piensos
iniciales. Las gallinas mostraron una clara preferencia por las partículas groseras,
independientemente de la concentración de proteína bruta, ceniza o Ca en las diferentes
fracciones de los piensos. Los datos mostraron que las gallinas consumen menos Ca
durante la mañana, un período en el que los requisitos para la deposición mineral son
bajos. En resumen, las gallinas mostraron una preferencia significativa por las partículas
más gruesas, un efecto que fue más evidente cuando los cereales fueron molidos
gruesos. Sin embargo, las gallinas no mostraron ninguna preferencia por consumir
aquellas fracciones de pienso con mayores contenidos en proteína bruta, cenizas o Ca.
6
SUMMARY

Summary
7
SUMMARY
The general objective of this thesis was to study the effects of the screen size
used to grind the main cereal of the diet on FI, performance, and GIT traits of brown-
egg laying hens. With this purpose, the inclusion of corn, wheat, and barley in the diet
of laying hens was studied in three experiments.
In experiment 1 (chapter 2), the influence of particle size of the main cereal of
the diet on production and egg quality traits was studied in brown hens from 33 to 65
wk of age. The experiment was completely randomized with 6 treatments arranged as a
3 x 2 factorial with 3 main cereals (barley, corn, and wheat) and 2 grinding size of the
cereal (6 and 10 mm screen). Each treatment was replicated 11 times (10
hens/replicate). Diets were isonutritive and contained 2,740 kcal/kg AMEn and 16.8%
CP. Egg production, ADFI, egg weight, and feed conversion ratio (FCR) were
determined by period (4 wk) and for the entire experiment. Egg quality traits
(percentage of undergrads, proportion of albumen, yolk, and shell, Haugh units, and
thickness, strength, and color of the shell) were measured also by period. No
interactions between main cereal and geometric mean diameter of the diet were
observed for any of the traits studied. Feed intake, egg production, and BW gain were
not affected by diet or particle size. Eggs were heavier (P < 0.01) in hens fed barley than
in hens fed corn or wheat, probably because of the higher fat content of the barley diets.
Also, FCR tended to be better in hens fed barley than in hens fed corn or wheat (P =
0.07). Diet did not affect any of the egg quality traits studied. In summary, barley and
wheat conveniently supplemented with enzymes, can be used in substitution of corn at
levels of up to 55% in diets for laying hens, without any adverse effect on egg
production or egg quality traits. Moreover, the substitution of corn by a combination of

Summary
8
barley and supplemental fat increased egg size. Consequently, the inclusion of one or
other cereal in the diet will depend primarily on their relative cost. Within the range
studied, particle size of the cereal did not have any effect on hen production.
In experiment 2 (chapter 3), the influence of the screen size used to grind the
main cereal of the diet on egg production, GIT development, and body measurements
was studied in hens from 17 to 49 wk of age. Diets were arranged as a 2 × 5 factorial
with 2 main cereals (corn vs. barley) and 5 screen sizes of the cereal (4, 6, 8, 10, and 12
mm). Each treatment was replicated 5 times. No interactions between main cereal and
screen size were observed for any of the traits studied. Cereal type and screen size did
not affect feed intake, egg production, BW gain, or quality traits of the eggs. Eggs
tended to be larger (P = 0.092) in hens fed the barley than in hens fed corn. Also, feed
conversion ratio tended to increase (P = 0.081) when the cereal of the diet was ground
with a 4-mm screen as compared with the average of the other diets. At 49 wk of age,
the relative weight (% BW) of the GIT and gizzard was greater (P < 0.05) in hens fed
barley than in hens fed corn. An increase in the screen size increased linearly the
relative weight of the GIT (P = 0.089), gizzard (P < 0.01), and liver (P = 0.056). None
of the other GIT traits or body measurements was affected by the main cereal or the
screen size. In summary, barley can substitute up to 45% of the corn in diets for laying
hens without any adverse effect on egg production. Therefore, the use of one or other
cereal will depend on their relative cost. An increase in screen size improved gizzard
development but had little effect on hen productivity. Within the range studied, the size
of the screen used for grinding the cereal had little effect on hen productivity, although
the use of a 4-mm screen might increase feed conversion ratio and gizzard development.
In experiment 3 (chapter 4), we studied the influence of particle size of the main
cereal of the diet on preference behavior of laying hens. Diets were arranged as a 2x5

Summary
9
factorial with 2 main cereals (corn vs. barley) and 5 grinding sizes of the cereal (4, 6, 8,
10, and 12 mm screen). Each treatment was replicated 5 times (10 hens per replicate).
After a fasting period of 8 h, hens received their respective experimental diets from 6.00
a.m. to 14.00 p.m. The geometric mean diameter (GMD) and the geometric standard
deviation of the feeds were determined every 2 h. In addition, CP, ash, and Ca contents
of the feeds were determined at the start and at the end of the experiment. The
experimental design was completely randomized with data analyzed as repeated
measures with particle size and cereal as main effects. The GMD of the original feeds
increased with increases in screen size and was greater for the barley than for the corn
diets. The difference in GMD between the original diets and the residuals measured at 2
h intervals decreased as the experiment progressed (P < 0.001 for the interaction).
Crude protein, ash, and Ca concentrated in the coarse fraction of the original diets and
of the uneaten feed with effects being more pronounced for the minerals. Independent of
the coarseness of the feed sieve, ash and Ca contents were higher in the uneaten feed at
14.00 p.m than in the original diets. Hens showed a clear preference for coarse particles
irrespective of the concentration of CP, ash, or Ca in the different fractions of the diets.
The data showed that hens under-consumed Ca during the morning, a period in which
the requirements for mineral deposition are low. In summary, hens showed a significant
preference for coarser particles, an effect that was more evident when the cereals were
ground coarse. Hens, however, did not show any preference for consuming those feed
fractions with greater CP, ash, or Ca contents.

10
CHAPTER 1:
LITERATURE REVIEW AND OBJECTIVES

Chapter 1: Literature review and objectives
11
1. Literature review
1.1. Introduction
From 2000-2014, world egg production increased by 36.5% an average of 2.8%
per year. In 2014, 7,200 M hens produced 1,320 billion eggs, worldwide. In 2016, there
were 374 M hens in the European Union (EU-28), with a total egg production of 7.5
MT of eggs (European Commission, 2017). Spain, with 44 M hens (13.4 % of the total
EU-28 census) and 828,000 tons of kg of eggs production was the fourth largest egg
producer in the EU-28, after France, Germany, and Italy (USDA-FAS, 2015; European
Commission, 2017) (Figure 1). Moreover, in 2014, Spain exported approximately
170,041 tons of eggs, mostly to other European countries with some exports to Africa
and Asia.
In 2016, world cereal production was 2,569 MT an increase of 15.7% compared
with the production of 2,221 Mt in 2006 (FAO, 2016) (Figure 2). In this year, cereal
production reached 316.4 Mt in the EU-28 of which, 19.2 MT were produced in Spain
(FAO, 2016). The production of corn, wheat, and barley in Spain was 4.6, 6.4, and 6.7
MT, respectively blow the requirements of the industry, (MAPAMA, 2017) (Figure 3).
The demand for grains in Spain is increasing and the feed production sector needs to
import from other countries. In fact, Spain is one of the main customer for cereals of
other EU-28 countries.
Genetics, management of the flock, and feeding practices are key points for
successful egg production. The profitability of the egg industry depends of many
factors, including length of the laying period, number of eggs per hen housed, egg size,
and percentage of eggs that reach the table of the final consumer. Cereals are the main
constituents of laying hen diets with levels of use of up to 60%. Consequently, cereal

Chapter 1: Literature review and objectives
12
selection is important in the control of cost because they provide up to 70% of the
AMEn and 40% of the protein content of diets for laying hens.
One of the most critical points to improve egg rate and egg quality is proper
management and feeding practices. Feed technology is of paramount importance in this
respect (Amerah et al., 2007; Amerah et al., 2008; Frikha et al. 2011). Type of cereal
and particle size of the cereal used in diets have gained increasing attention from the
poultry industrial in recent years.
Figure 1. Egg production in the 10 largest country of the EU-28 in 2016 (European
Commission, 2017).
953
876840 828
777715
590
360
200156
0
200
400
600
800
1000
1200
x 1
03
ton
ne
s

Chapter 1: Literature review and objectives
13
Figure 2. Cereal production in the world (FAO, 2016).
Figure 3. Production of cereals (corn, wheat, and barley) in Spain (MAPAMA,
2017).
2.0
2.2
2.4
2.6
2.8
2006/07 2008/09 2010/11 2012/13 2014/15 2016/17
x 1
06
ton
nes
10.00
15.00
20.00
25.00
2.00
5.00
8.00
11.00
2010 2011 2012 2013 2014 2015 2016
Mill
ion
to
nn
es
Corn
Wheat
Barley
Total
Chapter 1: Literature review and objectives
14
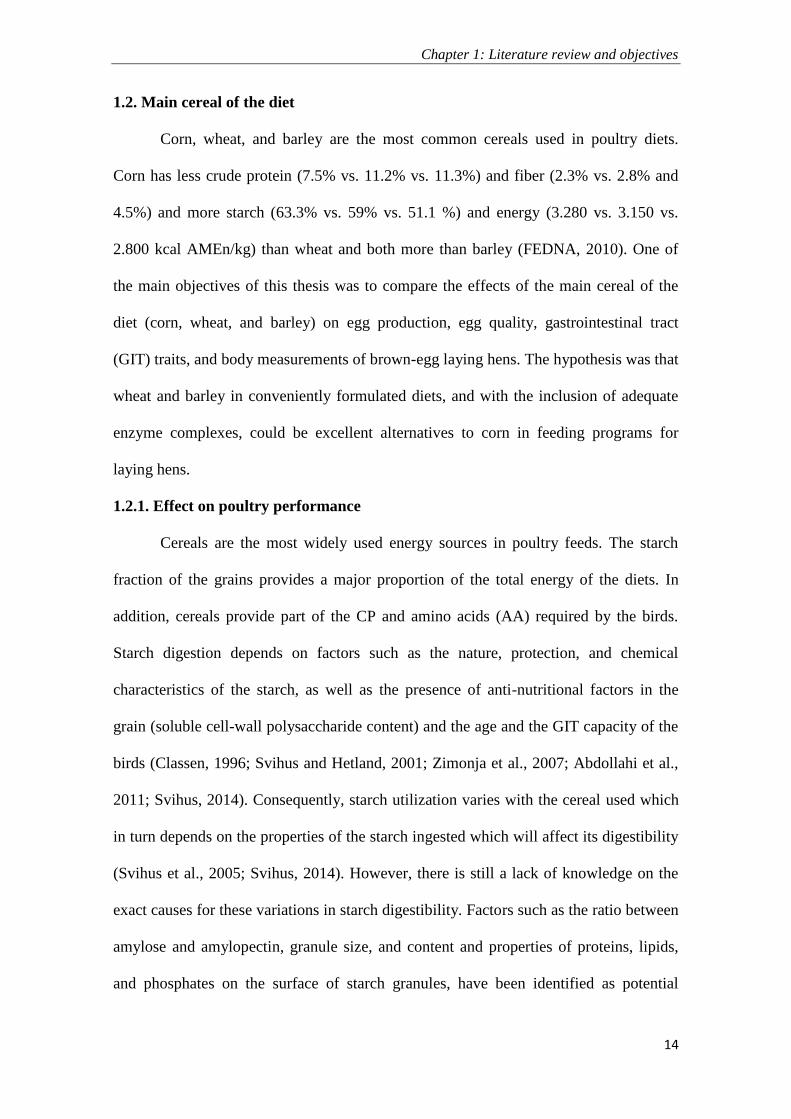
1.2. Main cereal of the diet
Corn, wheat, and barley are the most common cereals used in poultry diets.
Corn has less crude protein (7.5% vs. 11.2% vs. 11.3%) and fiber (2.3% vs. 2.8% and
4.5%) and more starch (63.3% vs. 59% vs. 51.1 %) and energy (3.280 vs. 3.150 vs.
2.800 kcal AMEn/kg) than wheat and both more than barley (FEDNA, 2010). One of
the main objectives of this thesis was to compare the effects of the main cereal of the
diet (corn, wheat, and barley) on egg production, egg quality, gastrointestinal tract
(GIT) traits, and body measurements of brown-egg laying hens. The hypothesis was that
wheat and barley in conveniently formulated diets, and with the inclusion of adequate
enzyme complexes, could be excellent alternatives to corn in feeding programs for
laying hens.
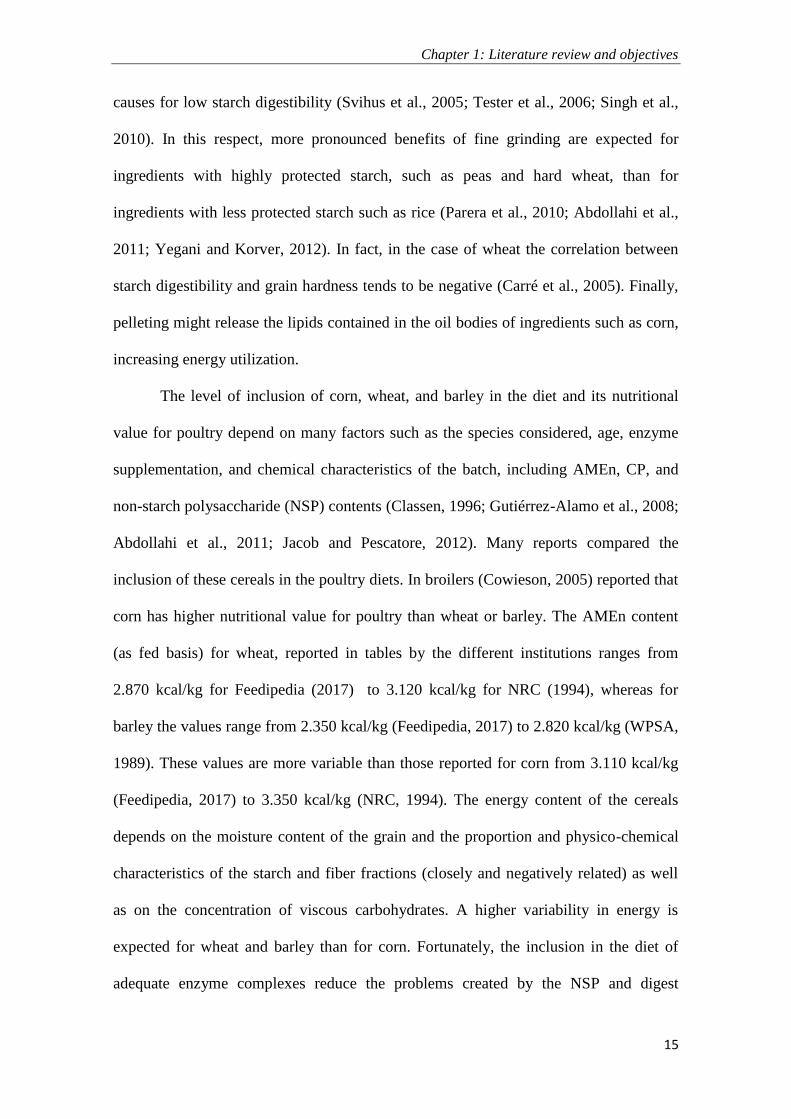
1.2.1. Effect on poultry performance
Cereals are the most widely used energy sources in poultry feeds. The starch
fraction of the grains provides a major proportion of the total energy of the diets. In
addition, cereals provide part of the CP and amino acids (AA) required by the birds.
Starch digestion depends on factors such as the nature, protection, and chemical
characteristics of the starch, as well as the presence of anti-nutritional factors in the
grain (soluble cell-wall polysaccharide content) and the age and the GIT capacity of the
birds (Classen, 1996; Svihus and Hetland, 2001; Zimonja et al., 2007; Abdollahi et al.,
2011; Svihus, 2014). Consequently, starch utilization varies with the cereal used which
in turn depends on the properties of the starch ingested which will affect its digestibility
(Svihus et al., 2005; Svihus, 2014). However, there is still a lack of knowledge on the
exact causes for these variations in starch digestibility. Factors such as the ratio between
amylose and amylopectin, granule size, and content and properties of proteins, lipids,
and phosphates on the surface of starch granules, have been identified as potential
Chapter 1: Literature review and objectives
15
causes for low starch digestibility (Svihus et al., 2005; Tester et al., 2006; Singh et al.,
2010). In this respect, more pronounced benefits of fine grinding are expected for
ingredients with highly protected starch, such as peas and hard wheat, than for
ingredients with less protected starch such as rice (Parera et al., 2010; Abdollahi et al.,
2011; Yegani and Korver, 2012). In fact, in the case of wheat the correlation between
starch digestibility and grain hardness tends to be negative (Carré et al., 2005). Finally,
pelleting might release the lipids contained in the oil bodies of ingredients such as corn,
increasing energy utilization.
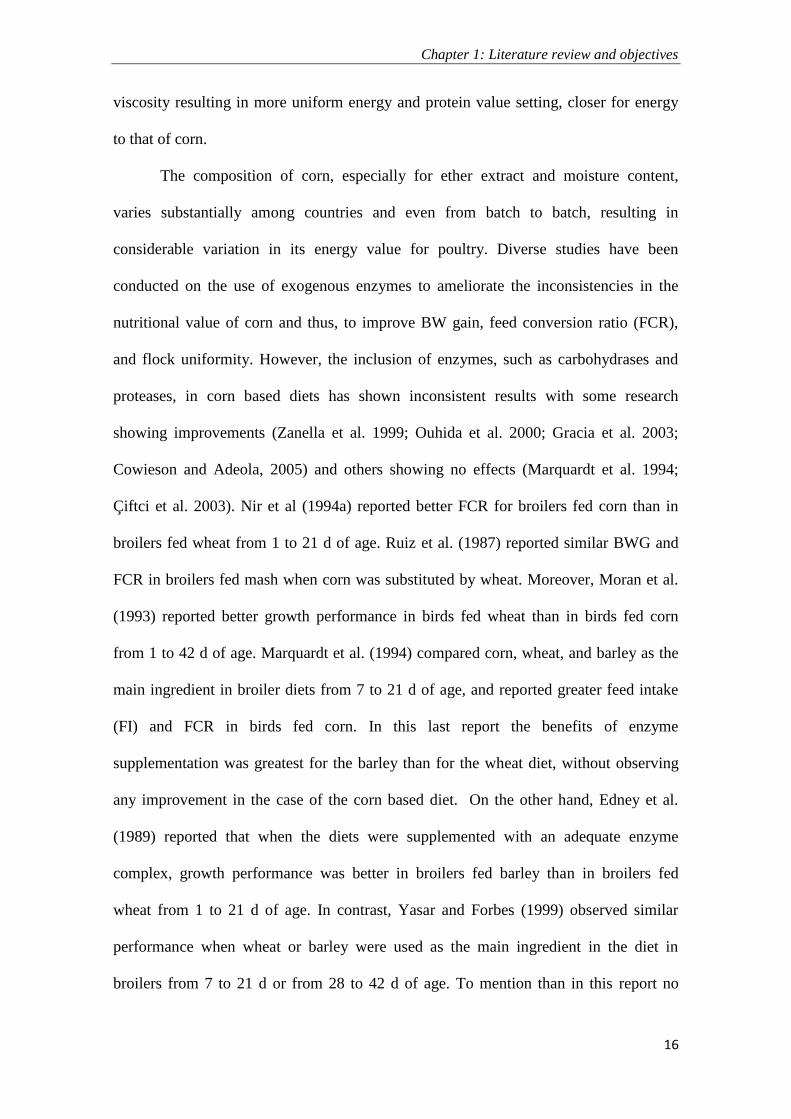
The level of inclusion of corn, wheat, and barley in the diet and its nutritional
value for poultry depend on many factors such as the species considered, age, enzyme
supplementation, and chemical characteristics of the batch, including AMEn, CP, and
non-starch polysaccharide (NSP) contents (Classen, 1996; Gutiérrez-Alamo et al., 2008;
Abdollahi et al., 2011; Jacob and Pescatore, 2012). Many reports compared the
inclusion of these cereals in the poultry diets. In broilers (Cowieson, 2005) reported that
corn has higher nutritional value for poultry than wheat or barley. The AMEn content
(as fed basis) for wheat, reported in tables by the different institutions ranges from
2.870 kcal/kg for Feedipedia (2017) to 3.120 kcal/kg for NRC (1994), whereas for
barley the values range from 2.350 kcal/kg (Feedipedia, 2017) to 2.820 kcal/kg (WPSA,
1989). These values are more variable than those reported for corn from 3.110 kcal/kg
(Feedipedia, 2017) to 3.350 kcal/kg (NRC, 1994). The energy content of the cereals
depends on the moisture content of the grain and the proportion and physico-chemical
characteristics of the starch and fiber fractions (closely and negatively related) as well
as on the concentration of viscous carbohydrates. A higher variability in energy is
expected for wheat and barley than for corn. Fortunately, the inclusion in the diet of
adequate enzyme complexes reduce the problems created by the NSP and digest
Chapter 1: Literature review and objectives
16
viscosity resulting in more uniform energy and protein value setting, closer for energy
to that of corn.
The composition of corn, especially for ether extract and moisture content,
varies substantially among countries and even from batch to batch, resulting in
considerable variation in its energy value for poultry. Diverse studies have been
conducted on the use of exogenous enzymes to ameliorate the inconsistencies in the
nutritional value of corn and thus, to improve BW gain, feed conversion ratio (FCR),
and flock uniformity. However, the inclusion of enzymes, such as carbohydrases and
proteases, in corn based diets has shown inconsistent results with some research
showing improvements (Zanella et al. 1999; Ouhida et al. 2000; Gracia et al. 2003;
Cowieson and Adeola, 2005) and others showing no effects (Marquardt et al. 1994;
Çiftci et al. 2003). Nir et al (1994a) reported better FCR for broilers fed corn than in
broilers fed wheat from 1 to 21 d of age. Ruiz et al. (1987) reported similar BWG and
FCR in broilers fed mash when corn was substituted by wheat. Moreover, Moran et al.
(1993) reported better growth performance in birds fed wheat than in birds fed corn
from 1 to 42 d of age. Marquardt et al. (1994) compared corn, wheat, and barley as the
main ingredient in broiler diets from 7 to 21 d of age, and reported greater feed intake
(FI) and FCR in birds fed corn. In this last report the benefits of enzyme
supplementation was greatest for the barley than for the wheat diet, without observing
any improvement in the case of the corn based diet. On the other hand, Edney et al.
(1989) reported that when the diets were supplemented with an adequate enzyme
complex, growth performance was better in broilers fed barley than in broilers fed
wheat from 1 to 21 d of age. In contrast, Yasar and Forbes (1999) observed similar
performance when wheat or barley were used as the main ingredient in the diet in
broilers from 7 to 21 d or from 28 to 42 d of age. To mention than in this report no

Chapter 1: Literature review and objectives
17
enzymes were added to the diets. In brown egg laying pullets, Frikha el al. (2011)
reported that the substitution of 500 g of corn by 500 g of wheat/kg as the main cereal in
the diet did not affect productive performance from 1 to 120 d of age. However, in a
previous report, Frikha et al. (2009a) reported significantly greater BW gain from 1 to
120 d of age in pullets fed corn than in pullets fed wheat, although FCR was not
affected. Moreover, Saldaña et al. (2015a) reported that pullets fed corn had similar BW
gain but poorer FCR than pullets fed wheat from hatching to 17 wk of age. In laying
hens, Lillie and Denton (1968) reported similar production and FCR in Single Comb
White Leghorn (SCWL) fed diets based on corn, wheat, or barley, although in this
report no enzymes were added to the diet. Lázaro et al. (2003a) reported that the
substitution of corn by wheat or barley did not affect FI, egg production, or egg quality
of SCWL hens from 20 to 44 wk of age. Similarly, Safaa et al. (2009) and Pérez-Bonilla
et al. (2011) observed similar performance when corn was substituted by wheat as the
main ingredient of the diet in brown-egg laying hens from 20 to 48 wk and from 22 to
54 wk of age, respectively. In contrast, Kim et al. (1976) found that SCWL hens fed a
diet based on corn ate more feed and produced bigger eggs than hens fed a diet based on
wheat from 21 to 43 wk of age. In addition, Pérez-Bonilla et al. (2014) reported that
feed intake was greater in brown egg-laying hens fed wheat or corn than in hens fed
barley from 24 to 59 wk of age. However, none of the other productive or egg quality
traits was affected by the main cereal of the diet. Overall, the information available
indicates that poultry responds well to the inclusion of barley or wheat in the diets as a
substitute of corn. The data indicate also that the results of the different cereals on
poultry production are less variable when adequate enzyme complexes are included in
the diet.

Chapter 1: Literature review and objectives
18
1.2.2. Effects on gastrointestinal tract development
There is a growing interest on the influence of the main cereal of the diet on the
development of the GIT of chickens (Ravindran et al., 2006; Gabriel et al., 2008;
Jiménez-Moreno et al., 2009c; Saldaña et al., 2015a). The GIT is a major consumer of
the nutrients supplied by the diet in all animals, especially in those with rapid cell
turnover which utilizes significant quantities of both AA and energy (Thomas and
Ravindran, 2008). An increase in the size of the GIT will increase nutrient demand by
the gut and will reduce feed efficiency in birds. It has been shown that cereals with a
high NSP content increase the size and length of the GIT (Jorgensen et al., 1996;
Steenfeldt, 2001; Thomas and Ravindran, 2008). In broilers, the growth of the different
organs of the GIT and the production of HCL and of endogenous digestive enzymes
depends on age, feed form, and diet composition (González-Alvarado et al., 2007;
Svihus, 2011). Gizzard function reduces the particle size of feed ingredients by applying
increasing amount of mechanical grinding pressure. The gizzard, the most muscular
organ of the GIT, requires a large amount of energy in birds. Nir et al. (1994a) reported
heavier relative weights (% BW) of the gizzard of broilers at 21 d of age when fed corn
than when fed wheat. Similar differences between corn and wheat diets have been
reported by Abdollahi et al. (2013b) comparing mash and pelleted diets. In contrast,
Amerah et al. (2008) did not observe any difference in the relative weight of the gizzard
at 21 d of age of broilers fed a corn or a wheat based diet, although the relative length
(cm/kg BW) of the different segments of the GIT was shorter in birds fed wheat.
Thomas and Ravindran (2008) reported similar relative weight of the GIT and the
gizzard at 14 d of age in birds fed diets based on corn or wheat. In brown egg laying
pullets, Frikha et al. (2009a) observed heavier relative weight of the gizzards in pullets
fed corn than in pullets fed wheat at 45 d of age. In this report, gizzard pH and the

Chapter 1: Literature review and objectives
19
relative length of the different segments of the GIT were not affected by the main cereal
of the diet at this age. Similar data in young pullets has been produced by Saldaña et al.
(2015a) which indicated that because of its chemical composition and structure, the corn
grain is more difficult to grind than the wheat grain. Consequently, the gizzard needs to
work harder for corn than for wheat based diets. In contrast, Frikha et al. (2011) did not
observe any difference in relative weight of the GIT or the gizzard, or gizzard pH at 120
d of age in pullets fed corn or wheat. The author has not found any report on the
influence of the main cereal of the diet on the development of the GIT in laying hens.
1.3. Particle size of the diet
The term `particle size` refers to the average diameter of the individual particles
of a given feed, or simply to the “fineness of grind” of the feed (Amerah et al., 2007).
The reduction in size of feed particles is the largest cost of energy in feed manufacturing
for the layer industry (Deaton et al., 1989) and the second largest energy cost, after
pelleting, in feed manufacturing for broilers industry (Reece et al., 1985). Consequently,
any reduction in energy consumption during the grinding process, prior to ingredient
mixing, can reduce significantly nutrition cost. In nutritional studies the particle size of
a diet is defined by two variables: the geometric mean diameter (GMD) and the
geometric standard deviation (GSD), variables that are calculated as indicated by the
(ASAE, 1999). Feed particle size is typically determined by dry sieving a representative
sample of 100 g (Baker and Herrman, 2002). The feed sample is passed through a sieve
stack on a shaker for 10 minutes. The amount of particles retained on each screen size is
then determined, and the GMD and GSD of the sample calculated using standard
formula or computer software (ASAE, 1999). A reduction in particle size allows for a
better mixing of the ingredients but influences also GIT development, nutrient
utilization, and bird performance (Amerah et al., 2007; Koch, 2008; Jiménez-Moreno et

Chapter 1: Literature review and objectives
20
al., 2010). In the 50’s and 60’s, scientific reports on the effects of to the particle size of
the feeds on animal performance defined particle size by using very general qualitative
terms, such as fine, medium, and coarse (Davis et al., 1951). However, this approach
does not allow to define accurately the size, uniformity, and the physical characteristics
of the feed.
The interest on the effects of particle size of the diet on poultry growth, health,
and production has increased in recent years, as the industry continues to search for new
practices to optimize feed efficiency (Frikha et al., 2009b; Safaa et al., 2009; Svihus,
2010; Ruhnke et al., 2015). In addition, the renewed attention on this area is driven
partly by the increasing interest in feeding whole grains to birds specifically broilers, to
reduce the incidence of digestive problems in the absence of in feed antibiotics. Physical
form of the feed, complexity of the diet, grinding technology, grain type, endosperm
hardness, and particle size distribution, might modify the effects of screen size on
poultry production. Consequently, research efforts on this area of laying hen feeding, is
of paramount interest for both feed cost and egg production.
1.3.1. Methods for particle size reduction
Two major processing equipments available to reduce the particle size of the
grains are the hammer mill and the roller mill (Koch, 1996; Waldroup, 1997; Pérez-
Bonilla et al., 2014). The hammer mill consists of a set of hammers moving at high
speed in the grinding chamber, which reduce the size of the grains until the particles are
able to pass through a screen of designated size. Thus, the size and spectrum of particles
produced depends not only on the screen size but also on the equipment and the speed
of the hammer pieces (Koch, 1996; Amerah et al., 2007). The roller mill consists of one
or more pairs of horizontal rollers in a supporting frame, the distance between which
may be varied according to the particle size required. The size of the grain is reduced by

Chapter 1: Literature review and objectives
21
a constant compression force as they pass between the rotating rollers (Amerah et al.,
2007). Again, numerous factors affect the final size and uniformity of the ultimate feed.
Irrespective of the cereal used, the GSD of the diets is reduced when roller mills
rather than hammer mills are used, results that agree with data of Koch (1996) who
indicated that the uniformity of the particle size of the diet was higher when using a
roller mills than when using a hammer mills. Pérez-Bonilla et al., (2014) reported that
the GMD of a barley diet was not affected by the type of mill used but those of the corn
and wheat diet were lower when using a roller mill. These recorded differences reflect
probably, differences in NDF content among the 3 cereals. Also, roller mills are more
efficient and require less energy for grinding than the hammer mill. Other differences
among mills, are that the undersized grains may escape the grinding process in the roller
mill (Douglas et al., 1990) and that the shape of the particles produced is more irregular,
being cubic or rectangular compared to those from a hammer mill, which tend to be
spherical with more uniform shape (Reece et al., 1985; Koch, 1996). Hammer mill
equipment however, are cheaper, easier to handle, and have lower maintenance cost
than roller mill equipment, which favours its use by the feed compound industry (Koch,
1996; Amerah et al., 2007; Pérez-Bonilla et al., 2014).
1.3.2. Effects on poultry performance
Most studies on the effects of particle size reduction of corn, barley, wheat, and
sorghum of poultry diets have been conducted in broilers. Nir et al. (1994a) reported
that birds fed mash had the best performance when the GMD of the grain portion of the
diet was within the range of 1,130 to 1,230 μm, independent of the type of cereal used
(corn, wheat, or sorghum). These authors reported lower ADFI when the feed particles
were smaller than 570 μm or larger than 2,100 μm. Also, Nir et al. (1995) reported that
broilers fed diets based on wheat or sorghum, in mash form, had heavier BW and better
Chapter 1: Literature review and objectives
22
FCR when ground coarse than when ground fine. Hamilton and Proudfoot (1995a)
observed that BW gain was improved when birds were fed mash diets containing coarse
or very coarse corn particles compared to those containing fine corn particles. Similar
results were found by Reece et al. (1985). In contrast, Lott et al. (1992) reported that
corn ground through a hammer mill with a screen opening of 9.59 mm, which resulted
in coarse particles (GMD ≃,1,200 μm), significantly decreased 21 d BW and increased
FCR compared with corn ground through a screen with an opening of 3.18 mm (GMD
≃, 680 μm). In brown-egg laying pullets, Frikha et al. (2011) reported that pullets fed
the finer diet (6-mm screen) had higher BW gain and better FCR than pullets fed the
medium and the coarser diets (8- and 10-mm screen) from 1 to 45 d of age, but not
thereafter. These data emphasize the importance of age on FI and FCR of the bird. In
brown-egg laying hens, Safaa et al. (2009) reported similar production but higher ADFI
in hens fed diets with the cereal (corn or wheat) ground through a 10-mm screen (GMD
of 1,165 μm and 1,250 μm, respectively) than in hens fed the same cereals ground
through a 6-mm screen (GMD of 774 μm and 922 μm for corn and wheat diets,
respectively). However, Deaton et al. (1989) did not observe any difference in ADFI or
productive performance when SCWL hens were fed corn based diets with a GMD
varying between 873 and 1,501 μm. Similar results have been reported by Hamilton and
Proudfoot (1995b) in hens fed mash diets based on wheat either coarsely or finely
ground.
The existing interactions between cereals, particle size, and feed form of the diet
on growth performance and productivity of poultry is well documented (Hamilton and
Proudfoot, 1995b; Amerah et al. 2007; Abdollahi et al., 2013a,b). Many studies suggest
that the particle size of the grain is more critical in mash feeds than in pelleted or
crumbled feeds (Reece et al., 1985; Hamilton and Proudfoot, 1995a,b; Nir et al., 1995;

Chapter 1: Literature review and objectives
23
Svihus et al., 2004). The improvements observed for BW gain and FCR were consistent
with the greater FI and the reduction in feed wastage detected. Amerah et al. (2008)
reported higher ADFI and poorer efficiency in broilers from 1 to 21 d of age fed
pelleted diets, based on fine corn or wheat (1-mm screen), than in those fed diets based
on coarse corn or wheat (7-mm screen). Fine particles are retained for less time in the
gizzard than coarse particles (Abdollahi et al., 2013a). Consequently, fine particles pass
rapidly to the small intestine with minor effects on muscle development or gizzard
function (Amerah et al. 2007; Svihus, 2011). However, a decrease in particle size might
increase the voluntary FI of the birds, because of the faster emptying of the upper part
of the GIT but also the dysfunction of the proventriculus-gizzard complex (Svihus et al.,
2010). Hamilton and Proudfoot (1995b), however, reported that layers fed a mash diet
performed better than those fed a crumbled diet, although this is not a current finding in
laying hens (Wahlström et al., 1999). Similarly, Berg and Bearse (1948) reported that
the rate of egg production and BW gain of laying hens were not influenced by the
particle size of the cereal in mash diets.
1.3.3. Effects on gastrointestinal tract development
The development of digestive tract of poultry, especially the gizzard, is known
to be influenced by feed particle size, which is evident already in chickens at 7 d of age
(Amerah et al. 2007). Nir et al. (1994b) reported greater gizzard development and lower
gizzard pH in 7 d of age chicks fed medium or coarse particle size diets compared with
those fed fine particle size diets. Also, Nir et al. (1994a) reported that the weight of the
gizzard and its contents were positively related to the coarseness of the feed (1.13 vs.
1.23 mm) in broilers at 21 d of age. In this report, the pH of the gizzard contents was
greater in broilers fed the fine ground diet than in broilers fed the medium or coarse
mash diets. The rate of passage of the digesta through the gizzard is faster with fine
Chapter 1: Literature review and objectives
24
particles than with coarse particles, because coarse particles need to be grinded before
exiting the gizzard and therefore, coarse particle remain for longer in this organ.
Hetland et al. (2004) indicated that the gizzard has a remarkable ability to grind all the
constituents of the feed to a consistent fine size, regardless of the original particle size
of the feed. When the digesta is retained in the gizzard for long, organ function is
improved because of greater muscular development which in turn improves gizzard
function. A more functional gizzard increases HCl and enzyme secretion and improves
GIT motility and anti-peristaltic movements and gastro-duodenal refluxes of the GIT,
facilitating the exposition of nutrient to digestive enzymes. An improvement in digesta
mixing may increase nutrient digestibility (Duke, 1992; Carré, 2000; Svihus, 2011). In
contrast, fine grinding reduces gizzard size and increase the incidence of proventriculitis
(Taylor and Jones, 2004a,b). When the feed is finely ground, the small particles will
pass quickly through the gizzard to the distal part of the GIT without any further
reduction in size. Parsons et al. (2006) reported that at 42 d of age, broilers had heavier
gizzards when fed mash diets based on corn with coarse particle size than when fed the
same diet with fine particle size. Amerah et al. (2008) reported that at 21 d of age,
broilers had heavier gizzards when fed coarse corn (7-mm screen) than when fed fine
corn (1-mm screen), but no difference between coarse and fine grinding was observed in
birds fed wheat based diets. Also, fine grinding of the corn but not of the wheat, reduced
the relative length of the different segments of the GIT. In 120 d of age brown egg
laying pullets, Frikha et al. (2011) reported no differences in relative weight of the GIT
and of the gizzard and on gizzard pH when fed mash diets based on corn or wheat, with
fine, medium, or coarse particle size. Moreover, Saldaña et al. (2015a) reported at 17
wk of age, that pullets had heavier gizzard and GIT when fed mash diets based on corn
or wheat than when fed crumble diets based on the same cereals. This information
Chapter 1: Literature review and objectives
25
indicates the importance of feed particle size which affects the residence time of the
feed particles in the gizzard, an effect that will depend on the type and age of the bird as
well as on the ingredient composition of the diet. Probably, response to these stimuli is
greater in young birds than in older birds.
When diets are fed mash diets, feed particle size and relative gizzard weight are
positively related (Nir and Ptichi, 2001). In pelleted diets, however, the relation is not
clear and probably will depend on the particle size and uniformity of the digesta. Svihus
et al. (2004) found no effect of pre-pelleting particle size on gizzard weight in birds fed
a hard wheat with a GMD varying between 600 and 1,700 μm. The reason for this
finding probably lies in the reduction of the difference in particle size distribution after
pelleting. In contrast, Péron et al. (2005) reported that particle size differences remained
even after pelleting in very hard wheat-based diets, with GMD values varying from 380
to 955 μm. The authors indicated that pelleted diets made with ingredients coarsely
ground significantly increased gizzard weights compared to those made from fine
wheat. Probably, the high resistance of the hard particulate material to reduction by the
pelleting process, might explain the outcome of this experiment. Chewning et al. (2012)
reported that 44 d of age, broilers had heavier gizzards when fed mash diets than when
fed pellet diets based on coarsely or finely ground corn. The author has not found any
information on the influence of particle size of the main cereal of the diet on GIT of
laying hens fed mash or pelleted diets.

Chapter 1: Literature review and objectives
26
2. Objectives of the thesis
The general objective of this thesis was to study the effects of the size of the
screen used to grind the main cereal of the diet on FI, production performance, and GIT
traits of brown-egg laying hens. With this purpose, the inclusion of corn, wheat, and
barley in the diet of laying hens was studied in three experiments.
The individual objectives of the three assays of this research were as follow:
In experiment 1 (chapter 2), we evaluated the effects of the screen size (6 mm
vs. 10 mm) used to grind the cereal on egg production and egg quality of brown-egg
laying hens fed diets based on barley, corn, and wheat from 33 to 65 wk of age.
In experiment 2 (chapter 3), we evaluated the effects of the screen size used to
grind the cereal on egg production, egg quality, GIT traits, and body measurements of
brown egg laying hens fed diets based on corn or barley from 17 to 49 wk of age.
In experiment 3 (chapter 4), we evaluated the effect of the size of the screen
used to grind the cereal on preference behavior of brown-egg laying hens fed diets
based on corn or barley from 06.00 a.m. to 14.00 p.m., after a night fasting period of 8
h.
27
CHAPTER 2:
INFLUENCE OF PARTICLE SIZE OF THE
MAIN CEREAL OF THE DIET ON EGG
PRODUCTION AND EGGS QUALITY OF
BROWN EGG LAYING HENS FROM 33 TO 65
WEEKS OF AGE
Chapter 2: Particle size and hen production
28
1. Introduction
Corn and wheat are the main sources of energy in poultry diets worldwide,
although barley is also commonly used in laying hens (Frikha et al. 2009; Jacob and
Pescatore, 2012). Barley and wheat contain variable amounts of non-starch
polysaccharides (NSP) which increase digesta viscosity and reduce nutrient absorption
and performance in broilers (Edney et al., 1989; Wang et al., 2005; García et al., 2008)
and laying hens (Lázaro et al., 2003; Mirzaie et al., 2012). In layers, a high NSP content
of the diet is associated with an increase in dirty eggs (Francesch and Brufau, 2004).
However, the incidence of dirty eggs decreases and even disappear with the use of
convenient enzyme complexes (Lázaro et al., 2003; Garcia et al., 2008; Saki et al.,
2010).
Egg weight has been associated traditionally to the level of methionine, the most
limiting amino acid in hen diets, as well as to the linoleic acid (LNL) content (Shutze et
al. 1962; Balnave 1970, 1971). Corn contains more LNL than wheat or barley, which
favors its use in laying hen diets (Grobas et al., 1999a, b). However, it is unclear if the
increase in egg size observed is due to the LNL concentration per se or to an increase in
the level of supplemental fat, because under most practical conditions both factors are
confounded (Grobas et al., 1999a).
Numerous factors affect voluntary feed intake (FI) in poultry fed mash diets. In
this respect, the optimal geometric mean diameter (GMD) of the diet that maximizes FI
and hen production is a major challenge for the egg industry. Most studies indicate that
when allowed to choose, hens show a clear performance for coarse particles (Isa Brown,
2009). Herrera et al. (2017) reported that feed efficiency tended to improve when diets
based on corn or barley were ground with a 6 to 12 mm screen compared with a 4-mm
screen but no other production or egg quality traits were affected. The hypothesis of this
Chapter 2: Particle size and hen production
29
research was that the size of the screen used to grind the main cereal of the diet could
affect hen production, and effect that could depend on the type of cereal used. The
objective of this research was to evaluate the effects of the GMD of the main cereal of
the diet on production and egg quality traits of brown-egg laying hens fed diets based on
barley, corn, and wheat from 33 to 65 wk of age.
2. Materials and methods
2.1. Husbandry, diets, and experiment design
The procedures described in this research were approved by the Animal Ethics
Committee of Universidad Politécnica de Madrid and followed the Spanish guidelines
for the care and use of animals in research (Boletín Oficial del Estado, 2007). In total,
660 Lohmann Brown Classic hens were selected at random from an 80,000-bird flock at
30 wk of age and housed in an environmentally controlled barn. Hens were randomly
allotted in groups of 10 into 66 enriched cages (120 cm × 63 cm × 45 cm; Facco S.p.A.,
Padova, Italy) with similar average BW per cage. Then, the hens were fed a common
diet based on equal proportions of corn, wheat, and barley for 3 wk and weighed again
(1,811 ± 31.9 g BW). The cages were provided with an open trough feeder and 2 low
pressure nipple drinkers. The lighting program consisted in 16 h light/day throughout
the experiment. Room temperature was recorded daily during the experiment, with a
maximum average value of 26 ± 3ºC (June, last period of the experiment) and a
minimum of 21 ± 3°C (February). Feed in mash form and water were provided for ad
libitum consumption.
Three diets with similar CP (16.8%) and AMEn (2,740 kcal/kg) contents but
differing in the main cereal used (corn, wheat, or barley) were formulated. Two batches
of the experimental diets, with same ingredient composition were manufactured and
used from 33 to 44 wk and from 45 to 64 wk of age, respectively. The diets met or

Chapter 2: Particle size and hen production
30
exceeded the nutrient requirements of laying hens as recommended by FEDNA (2008).
All diets were supplemented with a commercial enzyme complex with xylanase and β-
glucanase activity (Roxazyme, DSM SA., Madrid, Spain). In the formulation of the
diets it was assumed that the inclusion of the enzyme complex increased the AMEn
content of the barley and wheat grains by 2% (from 2,800 to 2,856 kcal/kg of barley and
from 3,150 to 3,213 kcal/kg of wheat) but had no effects on the energy content of the
corn or of the other ingredients of the diets (FEDNA, 2010). Before feed manufacturing,
a batch of each of the 3 cereals were divided into 2 portions and each portion was
ground using a horizontal hammer mill (Mecafa S.A., Ciudad Real, Spain) provided
with a 6- or a 10-mm screen and included as such in their respective experimental diets.
The experiment was conducted as a completely randomized design with 6 diets
arranged factorially with 3 main cereals and 2 GMD of the cereal. Each treatment was
replicated 11 times and the experimental unit was the cage with 10 hens for all
measurements.
2.2. Laboratory analysis
Representative samples of the feeds were ground using a laboratory mill (Retsch
Model Z-I, Stuttgart, Germany) equipped with a 1-mm screen and analyzed for moisture
by oven-drying (method 930.15), total ash in a muffle furnace (method 942.05), and
nitrogen by Dumas (method 968.06) using a Leco analyzer (Model FP-528, Leco Corp.,
St. Joseph, MI) as described by AOAC International (2005). Ether extract was
determined by Soxhlet analysis after 3 N HCl acid hydrolysis and crude fiber (CF) by
sequential extraction with diluted acid and alkali (Boletín Oficial Estado, 1995). Gross
energy was determined using an adiabatic bomb calorimeter (model 1356, Parr
Instrument Company, Moline, IL, USA) with benzoic acid as the calibration standard.

Chapter 2: Particle size and hen production
31
The LNL content of the diets was determined by gas-liquid chromatography (GC-14B,
Shimadzu, Kyoto, Japan) as shown by Grobas et al. (1999a) and the amino acid content
by ion-exchange chromatography (Hewlett-Packard 1100, Waldbronn, Germany) after
acid hydrolysis, as indicated by de Coca-Sinova et al. (2008). Particle size distribution
and mean particle size of the diets, expressed as the GMD and geometric standard
deviation (GSD; log normal SD), were determined in 100 g samples using a shaker
equipment (Retsch, Stuttgart, Germany) provided with 8 sieves ranging in mesh from
5,000 to 40 µm as indicated by ASAE (1995). All the analyses were conducted in
duplicate except for the GMD of the diets that were determined in triplicate. The
ingredient composition and chemical analyses of the diets are shown in Table 1. The
GMD and GSD of the two batches of the diets used during the experiment are shown in
Table 2.
2.3. Measurements
2.3.1. Hen production
Egg production, feed disappearance, and BW of the hens were determined by
cage at 4 wk intervals. Eggs produced the last 2 d of each week were weighed, and the
average value of the 4 wk was used to estimate egg weight by period. From these data,
ADFI, egg production, egg weight, egg mass, feed conversion ratio (FCR) per kilogram
and per dozen of eggs, and BW gain of the hens were calculated for each of the 8
periods and for the entire experiment (33 to 65 wk of age). Any mortality was recorded
and weighed as produced.
2.3.2. Egg quality
Undergrades (dirty, broken, and shell-less eggs) were recorded daily by replicate
in all eggs produced. An egg was considered as dirty when a spot of any kind or size
Chapter 2: Particle size and hen production
32
was detected on the shell (Lázaro et al., 2003). Other egg quality traits, including haugh
units, shell strength, shell color, and shell thickness, were measured in 12 fresh eggs
collected randomly from each cage replicate the last 2 d of each of the 8 experimental
periods. Haugh units was measured using a multitester equipment (QCMSystem,
Technical Services and Supplies, Dunnington, York, UK) as indicated by Pérez-Bonilla
et al. (2012). Shell thickness, was measured at the two pole ends and at the middle
section of the egg shell with a digital micrometer (model IT-014UT, Mitotuyo,
Kawasaki, Japan). The average of the 3 measurements of each of the 12 eggs was used
for further analyses (Safaa et al., 2008). Shell strength and shell color were measured in
6 eggs collected randomly from each replicate on the same days. Shell strength,
expressed in g/cm2, was evaluated applying increased pressure to the broad pole of the
egg using a press meter (Egg Force Reader, SANOVO Technology A/S, Odense,
Denmark) as indicated by Safaa et al. (2008). Shell color was measured using a Minolta
colorimeter (Chroma Meter Model CR-200, Minolta Corp., Ramsey, NJ) and the Hunter
color values, L* (lightness), a* (green to red), and b* (blue to yellow), were recorded
(Table 3).
2.4. Statistical analysis
Data were analyzed as a completely randomized design with 6 treatments
arranged as a 3x2 factorial with cereal and GMD of the diet as main effects using the
MIXED procedure of SAS (SAS Institute, 2004). Results in tables are presented as
means and differences were considered significant at P < 0.05.
Chapter 2: Particle size and hen production
33
3. Results
The GMD was higher for the barley than for the corn diets with the wheat diets
being intermediate in both periods (Table 2). Also, the GMD of the diets increased as
the screen size used to grind the cereals increased. The GSD was lower for the barley
diets than for the wheat or the corn diets and in all cases decreased as the screen size
increased.
3.1. Hen production and egg quality
No interactions between the main cereal of the diet and the screen size used to
grind the cereal were observed for any of the traits studied and consequently, only main
effects are discussed.
3.1.1. Main cereal of the diet
Egg production, egg mass, ADFI, and BW gain were not affected by the main
cereal of the diet in any of the periods considered (Figure 1). Mortality tended to be
higher in hens fed corn than in hens fed wheat or barley (4.9% vs. 2.6 and 1.9%; P=
0.06). Cumulatively (33 to 65 wk of age), egg weight was greater in hens fed barley
than in hens fed corn or wheat (65.7 g vs. 64.7 and 64.4 g; P < 0.05; Table 3). Also,
FCR tended to be better for the barley- than for the corn- or the wheat diets (1.94 vs.
1.98 and 1.98; P = 0.07). None of the egg quality traits studied (percentage of broken
and dirty eggs, egg shell-less eggs, Haugh units, strength, thickness, and color of the
shell, and percentage of albumen, yolk, and shell of the eggs) was affected by the main
cereal of the diet (Table 3).
3.1.2. Screen size
The screen size used to grind the cereal did not affect any of the egg production
or egg quality traits studied.

Chapter 2: Particle size and hen production
34
4. Discussion
The GMD of the diets was higher for the barley than for the corn diet with that
of the wheat diet being intermediate. The differences reported were expected because
the barley grain had very flexibles glumes and contain more neutral detergent fiber than
the corn grain. Consequently, more barley particles pass intact through the screen,
increasing the GMD of the diet. The GSD was higher for the corn- and wheat diets than
for barley diets. On the other hand, the GMD and the GSD of the diets increased as the
screen size used to grind the cereals increased. Similar results comparing these three
cereals were reported by Perez-Bonilla et al. (2014) and Herrera et al. (2017), indicating
that the structure of the feed depends not only on the size of the screen used but also on
the characteristics of the grain.
4.1. Main cereal of the diet
Egg production, egg mass, ADFI, and BW gain were not affected by the main
cereal of the diet, consistent with most published research in which the wheat and barley
diets were supplemented with an adequate combination of exogenous enzymes (Pérez-
Bonilla et al., 2011; Herrera et al., 2017). However, hens fed barley produced heavier
egg than hens fed corn or wheat. The information available on the effects of main cereal
of the diet on egg size is scarce. Herrera et al. (2017) observed that egg size was greater
in hens fed barley that in hens fed corn, in agreement with the data reported herein. In
contrast, Coon et al. (1988) and Pérez-Bonilla et al. (2011) reported similar egg size in
hens fed barley based diets than in hens fed corn based diets. The reason for the
inconsistencies reported among researches is not known but might be related to
differences in the physico-chemical characteristics of the cultivars and batch of cereal
used in the different experiments or to changes in the ingredient composition of the
diets which result of the different nutrient value of the cereals. In this respect, when

Chapter 2: Particle size and hen production
35
corn is substituted by barley, the level of supplemental fat and the LNL content of the
diet increases to compensate for the lower AMEn content of barley. As has been shown
by Jensen et al. (1958), Grobas et al. (1999 a,c), and Ravindran et al. (2014) an increase
in these 2 dietary components might increase egg size. Published data on the minimum
requirement of LNL to optimize egg size in laying hens are not consistent. Scragg et al.
(1987) reported that brown egg-laying hens required more than 2.0% LNL to maximize
egg size. Moreover, Lohmann (2016) recommend a minimum of 1.8% in diets for
commercial laying hens. In contrast, Pérez-Bonilla et al. (2014) observed that egg size
was maximized with as little as 1.1% of LNL in the diet. In fact, Grobas et al. (1999c)
and Safaa et al. (2008) demonstrated that an increase in the LNL content of the diet
from 1.15% to 1.65% and from 1.12% to 1.60%, respectively, did not affect egg weight
in brown egg-laying hens from 22 to 65 wk and 59 to 70 wk of age, respectively. In
these two experiments, however, egg size increased significantly when extra amounts of
supplemental fat were included in the diet, irrespective of their LNL content. In the
current experiment, feeding barley resulted in heavier eggs compared with feeding corn
or wheat. Probably, the higher level of supplemental fat of the barley diets, compared
with that of the corn and wheat diets (4.9% vs. 1.8 and 1.6%, respectively) rather than
the LNL content that was high and above 1.8% in all cases, was responsible for the
increase in egg weight observed in hens fed barley. The results reported herein are
consistent with data of Herrera et al. (2017) who reported heavier eggs in hens fed diets
based on barley containing 5.3% supplemental fat and 3.4% LNL than in hens fed diets
based in corn containing 4.7% supplemental fat and 3.7% LNL. These results confirm
that once the LNL requirement of the hens are reached (around 1.0 to 1.2% of the diet),
an increase in the level of supplemental fat, rather than a further increase in LNL, is
responsible for the increase in egg weight often observed.

Chapter 2: Particle size and hen production
36
For the entire experimental period, FCR tended to be better with the barley- than
with the wheat- and corn diets. In the current research, we accepted that the exogenous
enzymes increase the energy content of barley by 2%. Probably, the enzyme complex
used improved the AMEn content of barley more than expected (Mateos et al., 2017a).
In this respect, Lázaro et al. (2003) reported that the supplementation of the diet with a
complex based on β-glucanase and xylanase, similar to that used in the current research,
improved energy utilization of the barley diet by up to 5.5% whereas no improvement
was observed for the wheat and corn diets.
Mortality tended to be higher in hens fed corn than in hens fed wheat or barley,
probably because of differences in CF among the diets (Mateos et al., 2012; 2017).
Similarly, Hartini et al. (2002) reported higher mortality in laying hens fed corn diets
than in laying hens fed barley diets (2.9% vs. 5.3% CF, respectively) from 17 to 24 wk
of age. Diets with a low fiber content increase aggressiveness and feather pecking in
poultry resulting in higher mortality. In this respect, Francesch et al. (2005) reported
greater mortality in laying hens fed corn based diets than in laying hens fed barley based
diets (4.3% vs. 5.1%, respectively) from 22 to 46 wk of age.
4.2. Screen size
It is widely accepted that, when allowed to choose, hens show a preference for
consuming the larger feed particles. Consequently, finely ground diets might reduce
voluntary FI (Safaa et al., 2009; Lohmann, 2016; Herrera et al., 2017, 2018) and
therefore, egg size and egg production (Isa Brown, 2009). In the current research,
however, the size of the screen used to grind the cereals had little effect on hen
production or egg quality traits. Similarly, Herrera et al. (2017) did not detect any
difference on these traits using screens varying in size from 6 to 12 mm. In contrast,
Safaa et al. (2009) reported a significant 2.5% increase in FI in hens fed corn or wheat
Chapter 2: Particle size and hen production
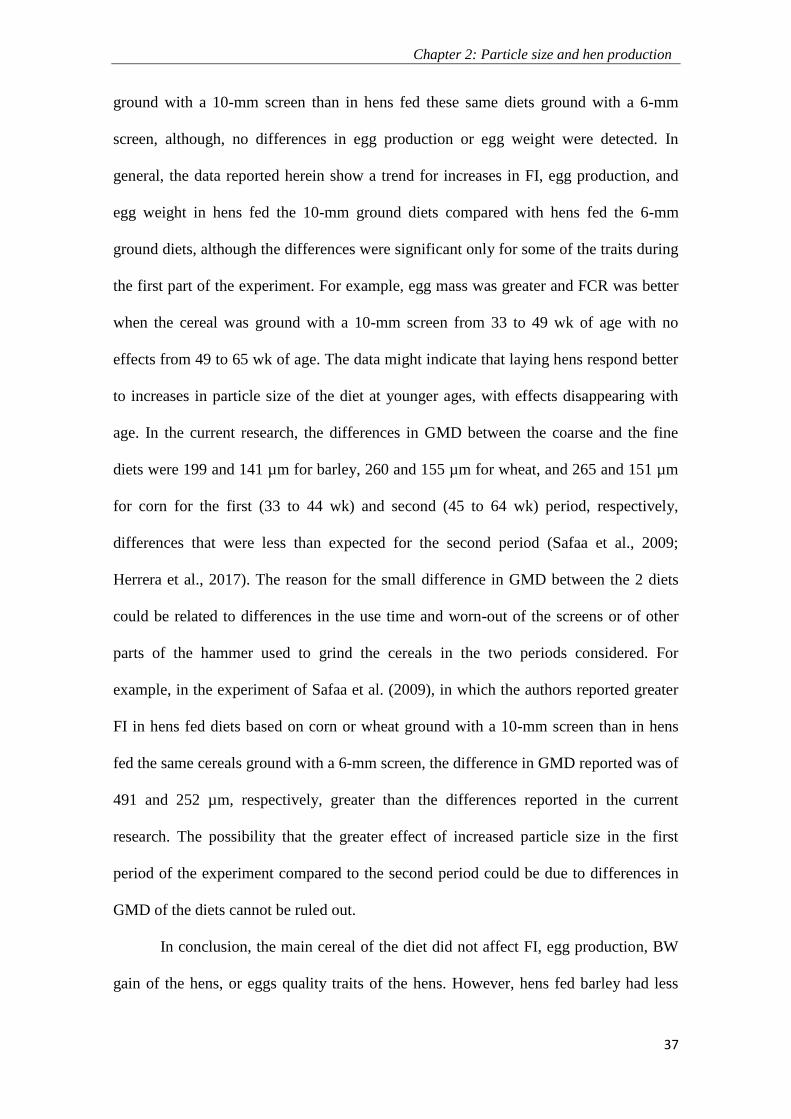
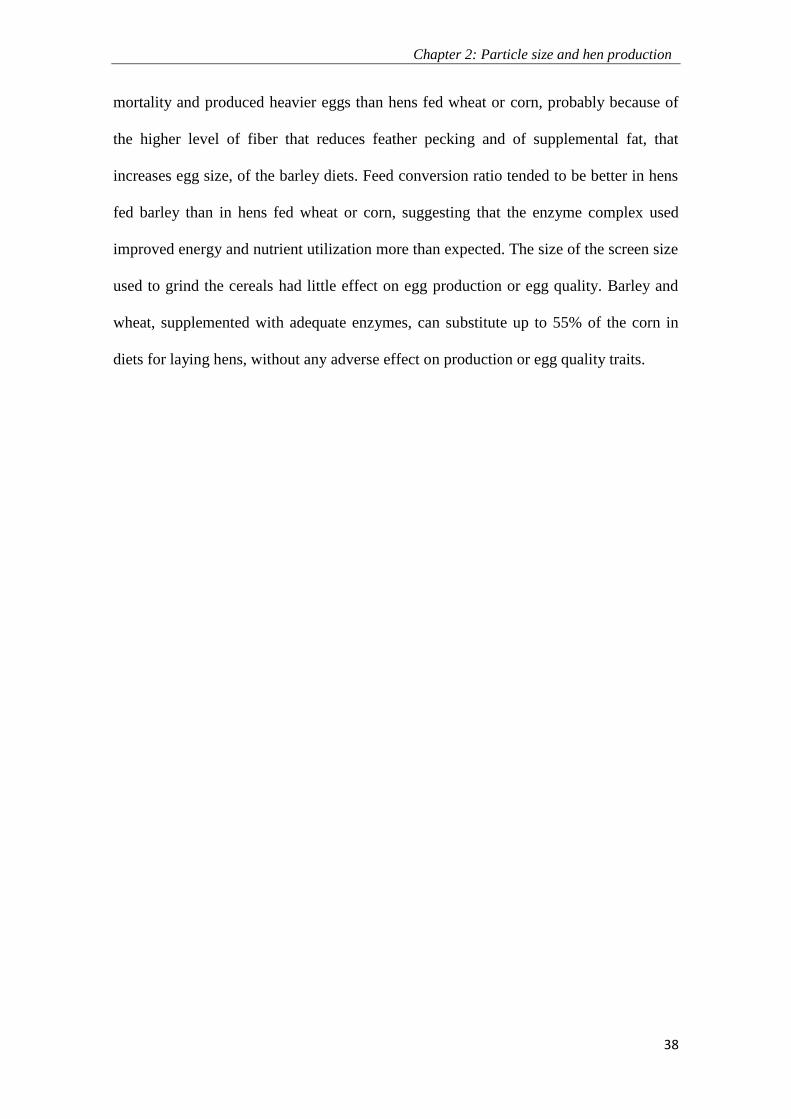
37
ground with a 10-mm screen than in hens fed these same diets ground with a 6-mm
screen, although, no differences in egg production or egg weight were detected. In
general, the data reported herein show a trend for increases in FI, egg production, and
egg weight in hens fed the 10-mm ground diets compared with hens fed the 6-mm
ground diets, although the differences were significant only for some of the traits during
the first part of the experiment. For example, egg mass was greater and FCR was better
when the cereal was ground with a 10-mm screen from 33 to 49 wk of age with no
effects from 49 to 65 wk of age. The data might indicate that laying hens respond better
to increases in particle size of the diet at younger ages, with effects disappearing with
age. In the current research, the differences in GMD between the coarse and the fine
diets were 199 and 141 µm for barley, 260 and 155 µm for wheat, and 265 and 151 µm
for corn for the first (33 to 44 wk) and second (45 to 64 wk) period, respectively,
differences that were less than expected for the second period (Safaa et al., 2009;
Herrera et al., 2017). The reason for the small difference in GMD between the 2 diets
could be related to differences in the use time and worn-out of the screens or of other
parts of the hammer used to grind the cereals in the two periods considered. For
example, in the experiment of Safaa et al. (2009), in which the authors reported greater
FI in hens fed diets based on corn or wheat ground with a 10-mm screen than in hens
fed the same cereals ground with a 6-mm screen, the difference in GMD reported was of
491 and 252 µm, respectively, greater than the differences reported in the current
research. The possibility that the greater effect of increased particle size in the first
period of the experiment compared to the second period could be due to differences in
GMD of the diets cannot be ruled out.
In conclusion, the main cereal of the diet did not affect FI, egg production, BW
gain of the hens, or eggs quality traits of the hens. However, hens fed barley had less
Chapter 2: Particle size and hen production
38
mortality and produced heavier eggs than hens fed wheat or corn, probably because of
the higher level of fiber that reduces feather pecking and of supplemental fat, that
increases egg size, of the barley diets. Feed conversion ratio tended to be better in hens
fed barley than in hens fed wheat or corn, suggesting that the enzyme complex used
improved energy and nutrient utilization more than expected. The size of the screen size
used to grind the cereals had little effect on egg production or egg quality. Barley and
wheat, supplemented with adequate enzymes, can substitute up to 55% of the corn in
diets for laying hens, without any adverse effect on production or egg quality traits.

Chapter 2: Particle size and hen production
39
Table 1. Ingredient composition and chemical analyses (%, as fed basis) of the
experimental diets.
Corn Wheat Barley
Ingredient
Barley - - 55.12
Corn 60.89 9.92 4.81
Wheat - 55.08 -
Soybean meal (47% CP) 23.80 16.40 24.30
Calcium carbonate 8.20 8.50 8.50
Sunflower meal (35% CP) 2.70 6.20 -
Soy oil soapstock 1.80 1.60 4.90
Dicalcium phosphate 1.54 1.14 1.29
Sodium chloride 0.34 0.34 0.34
L-Lisine-HCl (78%) 0.02 0.10 0.02
DL-Methionine (99%) 0.21 0.22 0.22
Premix1 0.50 0.50 0.50
Calculated analysis2
AMEn (kcal/kg) 2,740 2,740 2,740
Digestible amino acid
Lys 0.76 0.76 0.77
Met 0.39 0.38 0.39
Met + Cys 0.62 0.62 0.62
Thr 0.55 0.50 0.53
Total ash 12.00 12.00 12.00
Neutral detergent fiber 8.56 10.33 12.62
Available P 0.38 0.38 0.38
Determined analysis3
Dry matter 90.10 90.20 90.0
Gross energy (kcal/kg) 3,661 3,601 3,752
Ether extract 3.70 2.90 5.80
Linoleic acid (C18:2) 2.20 1.80 2.60
Crude fiber 2.70 3.60 3.40
Crude protein 17.30 17.00 17.40
Total amino acid
Lys 0.94 0.93 0.95
Met 0.39 0.40 0.42
Met + Cys 0.63 0.62 0.64
Thr 0.56 0.54 0.55
Total ash 11.80 12.10 11.80
Calcium 3.80 3.86 3.70
Phosphorus 0.60 0.63 0.58 1Provided the following (per kilogram of diet): vitamin A (trans-retinyl acetate), 10,000 IU;
vitamin D3 (cholecalciferol), 3,750 IU; vitamin E (dl-α-tocopheryl acetate), 10 mg; vitamin B1,
1.3 mg; vitamin B2, 5 mg; vitamin B6, 2 mg; vitamin B12 (cyanocobalamin), 15 mg; niacin, 25
mg; pantothenic acid (d-calcium pantothenate), 10 mg; folic acid, 1 mg; biotin, 15 mcg; choline
(choline chloride), 250 mg; manganese (MnO), 90 mg; zinc (ZnO), 60 mg; iron (FeSO4.H2O), 40
mg; copper (CuSO4 5H2O), 8 mg; iodine [Ca(IO3)2], 0.7 mg; selenium (Na2SeO3), 0.3 mg;
Roxazyme, 200 mg [1,600 U of endo-1,4-β-glucanase (EC 3.2.1.4), 3,600 U of endo-1,3 (4)-β-

Chapter 2: Particle size and hen production
40
glucanase (EC 3.2.1.6), and 5,200 U of endo-1,4-β-xylanase (EC 3.2.1.8)] supplied by DSM S.A.,
Madrid, Spain; Natuphos 5,000 (300 FTU/kg supplied by Basf Española, S.A., Tarragona, Spain),
60 mg. All diets included 0.18 g canthaxantin/kg. The barley and wheat diets included also 0.18
g/kg and 0,16 g/kg, respectively of the ester of β-apo-8-carotenoic/kg (supplied by Basf Española,
S.A., Tarragona, Spain).
2According to FEDNA (2010).
3Data correspond to the average of duplicate analyses of the 2 diets differing in the GMD of the
cereal used in the 2 batches manufactured (33 to 44 wk and 45 to 64 wk of age). Within
each cereal type, the determined chemical analyses were similar for the 2 diets (CV below 4%).
Table 2. Geometric mean diameter (GMD, µm) and geometric standard deviation
(GSD) of the experimental diets
Period Screen size
Corn Wheat Barley Mean
33 to 44 wk
of age
6 mm 940 ± 2.13 1,010 ± 2.14 1,181 ± 2.09 1,044 ± 2.13
10 mm 1,205 ± 2.16 1,270 ± 2.12 1,380 ± 2.05 1,285 ± 2.12
Mean 1,072 ± 2.17 1,140 ± 2.14 1,280 ± 2.08 1,164 ± 2.14
45 to 54 wk
of age
6 mm 972 ± 2.21 1,116 ± 2.26 1,245 ± 2.11 1,111 ± 2.19
10 mm 1,123 ± 2.19 1,271 ± 2.19 1,386 ± 2.02 1,260 ± 2.13
Mean 1,047 ± 2.20 1,193 ± 2.23 1,315 ± 2.06 1,185 ± 2.14
Chapter 2: Particle size and hen production
41
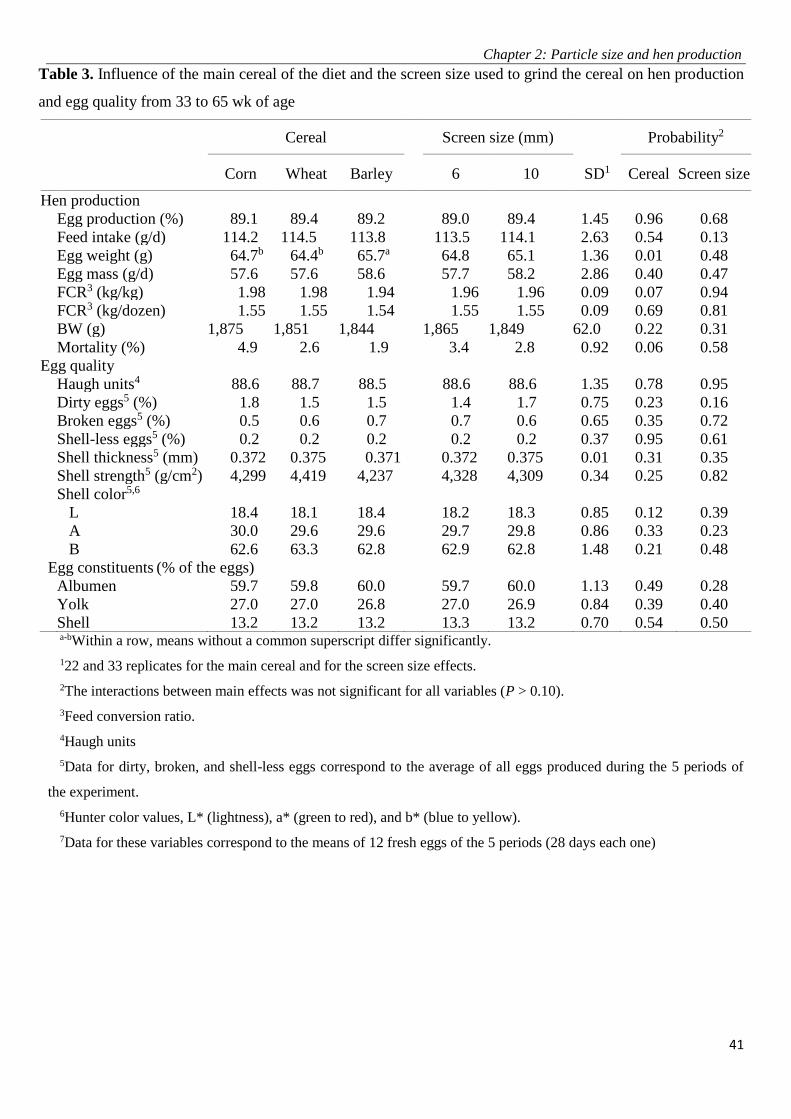
Table 3. Influence of the main cereal of the diet and the screen size used to grind the cereal on hen production
and egg quality from 33 to 65 wk of age
Cereal Screen size (mm)
SD1
Probability2
Corn Wheat Barley 6 10 Cereal Screen size
Hen production
Egg production (%) 89.1 89.4 89.2 89.0 89.4 1.45 0.96 0.68
Feed intake (g/d) 114.2 114.5 113.8 113.5 114.1 2.63 0.54 0.13
Egg weight (g) 64.7b 64.4b 65.7a 64.8 65.1 1.36 0.01 0.48
Egg mass (g/d) 57.6 57.6 58.6 57.7 58.2 2.86 0.40 0.47
FCR3 (kg/kg) 1.98 1.98 1.94 1.96 1.96 0.09 0.07 0.94
FCR3 (kg/dozen) 1.55 1.55 1.54 1.55 1.55 0.09 0.69 0.81
BW (g) 1,875 1,851 1,844 1,865 1,849 62.0 0.22 0.31
Mortality (%) 4.9 2.6 1.9 3.4 2.8 0.92 0.06 0.58
Egg quality
Haugh units4 88.6 88.7 88.5 88.6 88.6 1.35 0.78 0.95
Dirty eggs5 (%) 1.8 1.5 1.5 1.4 1.7 0.75 0.23 0.16
Broken eggs5 (%) 0.5 0.6 0.7 0.7 0.6 0.65 0.35 0.72
Shell-less eggs5 (%) 0.2 0.2 0.2 0.2 0.2 0.37 0.95 0.61
Shell thickness5 (mm) 0.372 0.375 0.371 0.372 0.375 0.01 0.31 0.35
Shell strength5 (g/cm2) 4,299 4,419 4,237 4,328 4,309 0.34 0.25 0.82
Shell color5,6
L 18.4 18.1 18.4 18.2 18.3 0.85 0.12 0.39
A 30.0 29.6 29.6 29.7 29.8 0.86 0.33 0.23
B 62.6 63.3 62.8 62.9 62.8 1.48 0.21 0.48
Egg constituents (% of the eggs)
Albumen 59.7 59.8 60.0 59.7 60.0 1.13 0.49 0.28
Yolk 27.0 27.0 26.8 27.0 26.9 0.84 0.39 0.40
Shell 13.2 13.2 13.2 13.3 13.2 0.70 0.54 0.50 a-bWithin a row, means without a common superscript differ significantly.
122 and 33 replicates for the main cereal and for the screen size effects.
2The interactions between main effects was not significant for all variables (P > 0.10).
3Feed conversion ratio.
4Haugh units
5Data for dirty, broken, and shell-less eggs correspond to the average of all eggs produced during the 5 periods of
the experiment.
6Hunter color values, L* (lightness), a* (green to red), and b* (blue to yellow).
7Data for these variables correspond to the means of 12 fresh eggs of the 5 periods (28 days each one)
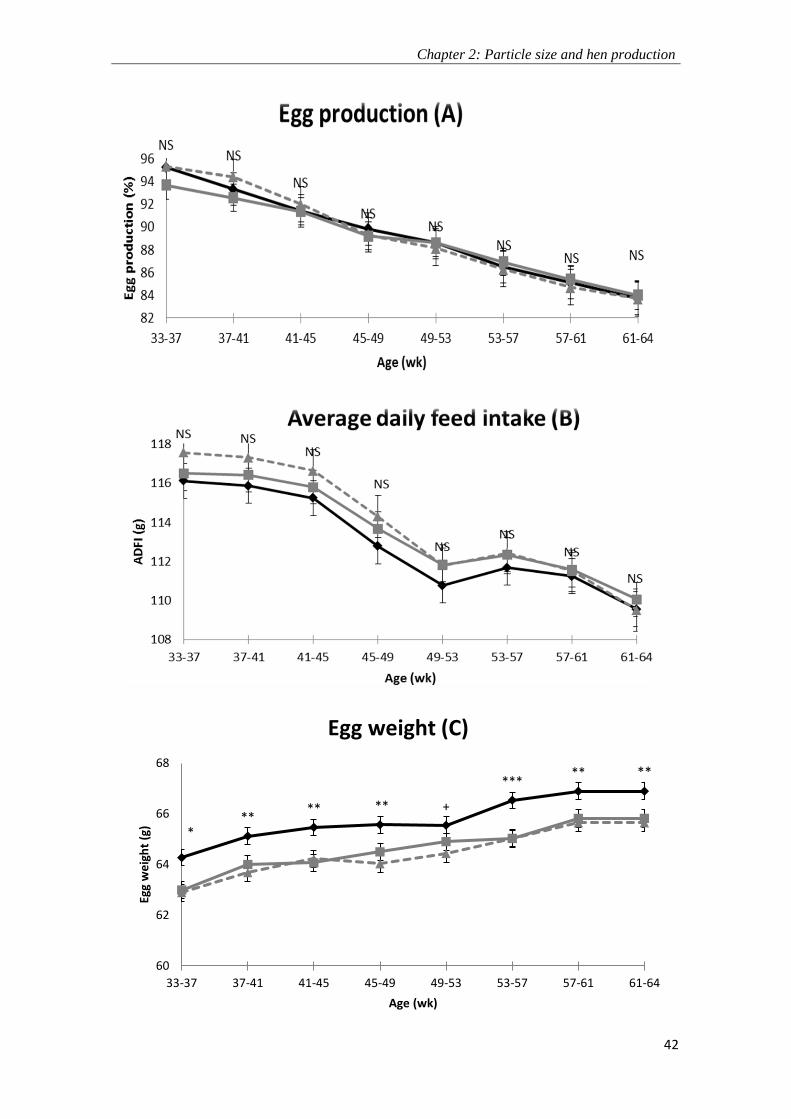
Chapter 2: Particle size and hen production
42
***
** ** +
***** **
60
62
64
66
68
33-37 37-41 41-45 45-49 49-53 53-57 57-61 61-64
Egg
we
igh
t (g
)
Age (wk)
Egg weight (C)
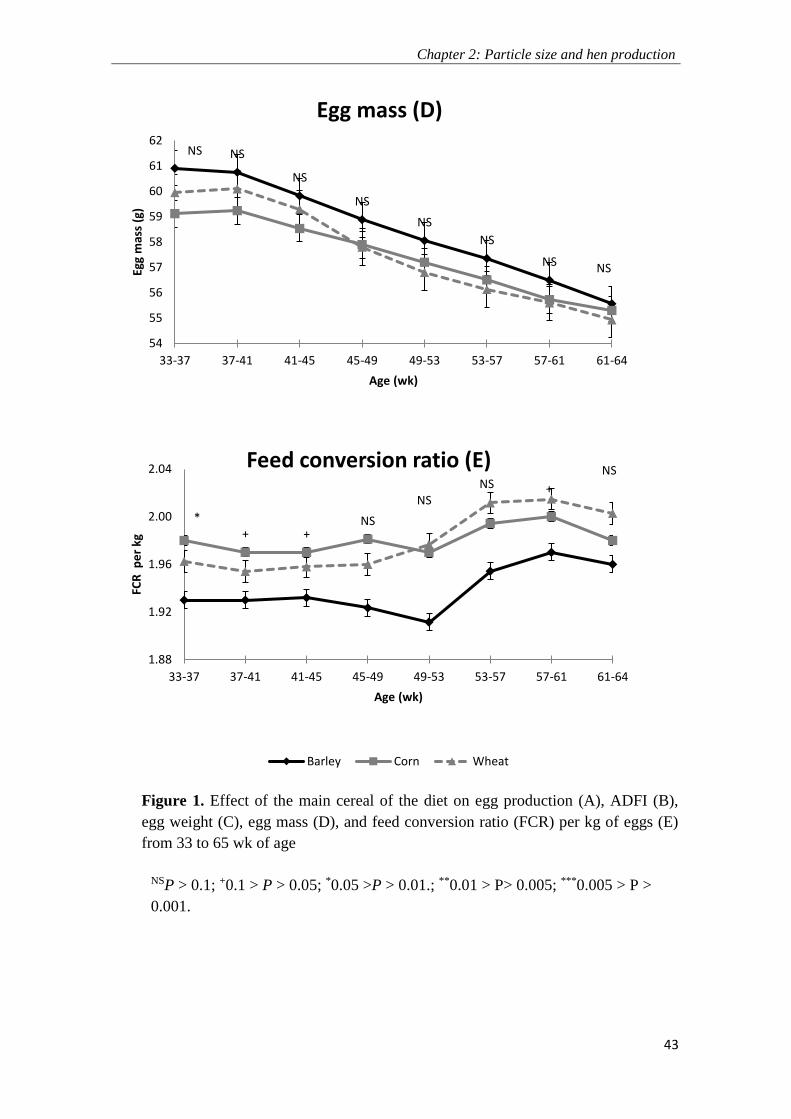
Chapter 2: Particle size and hen production
43
Figure 1. Effect of the main cereal of the diet on egg production (A), ADFI (B),
egg weight (C), egg mass (D), and feed conversion ratio (FCR) per kg of eggs (E)
from 33 to 65 wk of age
NSP > 0.1; +0.1 > P > 0.05; *0.05 >P > 0.01.; **0.01 > P> 0.005; ***0.005 > P >
0.001.
NS NS
NS
NS
NS
NS
NS NS
54
55
56
57
58
59
60
61
62
33-37 37-41 41-45 45-49 49-53 53-57 57-61 61-64
Egg
mas
s (g
)
Age (wk)
Egg mass (D)
*+ +
NS
NSNS +
NS
1.88
1.92
1.96
2.00
2.04
33-37 37-41 41-45 45-49 49-53 53-57 57-61 61-64
FCR
pe
r kg
Age (wk)
Feed conversion ratio (E)
Barley Corn Wheat

Chapter 2: Particle size and hen production
44
+
NS
NS
NSNS
NS
NSNS
82
84
86
88
90
92
94
96
33-37 37-41 41-45 45-49 49-53 53-57 57-61 61-64
Egg
pro
du
ctio
n (
%)
Age (wk)
Egg production (A)
* NS
NS
NS
NS NSNS
*
108
110
112
114
116
118
33-37 37-41 41-45 45-49 49-53 53-57 57-61 61-64
AD
FI (
g/d
)
Age (wk)
Average daily feed intake (B)
*
NSNS NS
NS
NS
NS NS
63
64
65
66
67
33-37 37-41 41-45 45-49 49-53 53-57 57-61 61-64
Egg
we
igh
t (g
)
Age (wk))
Egg weight (C)
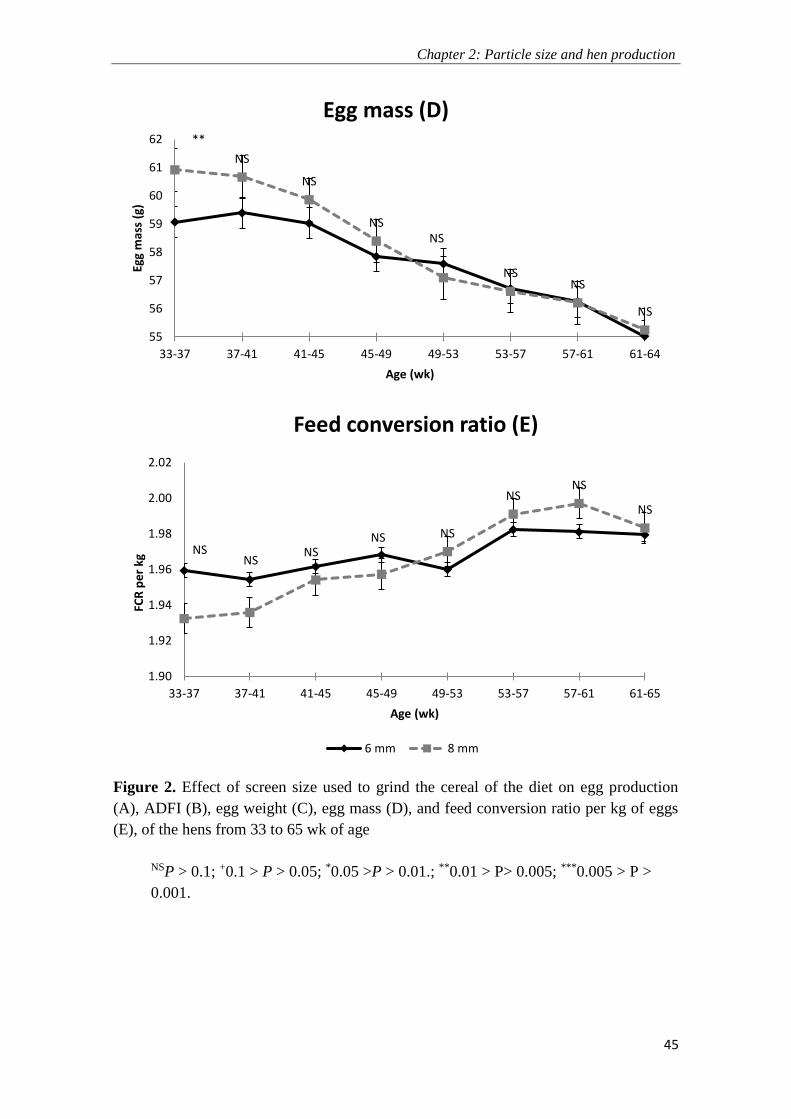
Chapter 2: Particle size and hen production
45
Figure 2. Effect of screen size used to grind the cereal of the diet on egg production
(A), ADFI (B), egg weight (C), egg mass (D), and feed conversion ratio per kg of eggs
(E), of the hens from 33 to 65 wk of age
NSP > 0.1; +0.1 > P > 0.05; *0.05 >P > 0.01.; **0.01 > P> 0.005; ***0.005 > P >
0.001.
**
NS
NS
NSNS
NSNS
NS
55
56
57
58
59
60
61
62
33-37 37-41 41-45 45-49 49-53 53-57 57-61 61-64
Egg
mas
s (g
)
Age (wk)
Egg mass (D)
NSNS
NSNS NS
NSNS
NS
1.90
1.92
1.94
1.96
1.98
2.00
2.02
33-37 37-41 41-45 45-49 49-53 53-57 57-61 61-65
FCR
pe
r kg
Age (wk)
Feed conversion ratio (E)
6 mm 8 mm

46
CHAPTER 3:
INFLUENCE OF PARTICLE SIZE OF THE
MAIN CEREAL OF THE DIET ON EGG
PRODUCTION, GASTROINTESTINAL TRACT
TRAITS, AND BODY MEASUREMENTS OF
BROWN LAYING HENS

Chapter 3: Particle size and hen productivity
47
1. Introduction
Corn (Zea mays L.) and barley (Hordeum vulgare L.) are extensively used in
diets for laying hens. As an average, corn has less protein (7.5 vs. 11.3%) but more
starch (63.3 vs. 51.1%), EE (3.6 vs. 2.0%), linoleic acid (LNL; 1.81 vs. 0.78%), and
energy (3,280 vs. 2,800 kcal AMEn/kg) than barley (FEDNA, 2010). In addition, the
nutritive value of corn is less variable than that of barley, probably because of its lower
content in non-starch polysaccharides (NSP) (García et al., 2008; Jacob and Pescatore,
2012). The β-glucans and arabino-xylans present in barley increase digesta viscosity and
might affect the development of the gastrointestinal tract (GIT) (Mateos et al., 2002),
nutrient digestibility and absorption (Lázaro et al., 2003a), and bird performance
(García et al., 2008). A high content in NSP is associated also with an increase in the
incidence of dirty eggs (Francesch et al., 1995; Lázaro et al., 2003a). Enzyme
supplementation (ES), however, reduces or even eliminates the negative effects of NSP
on nutrient digestibility and egg production, improving the feeding value of barley
(Gracia et al., 2003; Saki et al., 2010).
Ingredient composition and size of the screen used to grind the cereals affect the
structure and particle size of the diet. Mechanoreceptors located in the beak detect
differences in texture which might affect feed intake (FI) and performance in broilers
(Amerah et al., 2007; Jiménez-Moreno et al., 2016) and laying hens (Safaa et al., 2009;
Pérez-Bonilla et al., 2014). A reduction in particle size facilitates the contact between
nutrients and endogenous enzymes, improving nutrient digestibility (Parsons et al.,
2006). However, fine particles result often in a less developed gizzard and GIT (Hetland
et al., 2002) which might affect poultry performance (Nir et al., 1994a; González-
Alvarado et al., 2007). On the other hand, when the diets are coarsely ground, bird
selection increases which may affect feed efficiency (Nir et al., 1994b). These opposite

Chapter 3: Particle size and hen productivity
48
effects might counteract each other and the final effect on hen productivity might
depend on factors such as the characteristic and the ingredient composition of the
experimental diets. However, no research is available comparing the influence of corn
or barley of diets ground with different screen size on productive performance of hens.
Body measurements are useful criteria to predict body composition and the size and
future performance of birds, including broilers (Van Roovert-Reijrink, 2013), pullets
(Guzmán et al., 2015), and laying hens (Guzmán et al., 2016). However, the information
available on the effects of the particle size and the characteristics of the diet on these
variables in laying hens is scarce.
The hypothesis of this research was that screen size used to grind the cereal
could affect FI, GIT development, and egg production in laying hens, effects that could
vary depending on the cereal. The objective of this research was to compare the effects
of the screen size used to grind the cereal on egg production, egg quality, GIT traits, and
body measurements of brownegg laying hens fed diets based on corn or barley.
2. Materials and methods
2.1. Husbandry, diets, and experiment design
The procedures described in this research were approved by the Animal Ethics
Committee of Universidad Politécnica de Madrid, in compliance with the Spanish
guidelines for the care and use of animals in research (Boletín Oficial del Estado, 2007).
In total, 500 Lohmann Brown Classic hens were housed at 16wk of age in an
environmentally controlled barn. Hens were weighed individually at 17 wk of age
(1,407 ± 31.9 g BW) and randomly allotted in groups of 10 into 50 enriched cages (40
cm × 80 cm × 68 cm; Facco S.p.A., Padova, Italy) with similar average BW per cage.
The cages were provided with an open trough feeder and 2 low pressure nipple drinkers.
Room temperature was recorded daily throughout the experiment, with a maximum
Chapter 3: Particle size and hen productivity
49
average value of 26 ± 3oC (July, first period of the experiment) and a minimum of 21 ±
3◦C (February, last period of the experiment). Feed in mash form and water were
provided for ad libitum consumption. The lighting program consisted in 16 h of light
per day throughout the experiment.
Two diets with similar AMEn (2,750 kcal/kg) and CP (17.5%) content but
differing in the main cereal used (corn vs. barley) were formulated. The diets met or
exceeded the nutrient requirements of laying hens as recommended by FEDNA (2008).
All diets were supplemented with the same dose of a commercial enzyme complex with
xylanase and β-glucanase activity (Roxazyme, DSM S.A., Madrid, Spain). In the
formulation of the diets it was accepted that the inclusion of the enzyme complex
increased the AMEn content of the barley by 2% (from 2,800 to 2,856 kcal/kg) but had
no effects on the energy content of any of the other ingredients of the diet (FEDNA,
2010). Before feed manufacturing, the batch of each of the 2 cereals was divided into 5
portions, and each portion was ground using a horizontal hammer mill (Mecafa S.A.,
Ciudad Real, Spain) provided with a 4, 6, 8, 10, or 12 mm screen and then included in
their respective experimental diets.
The experiment was conducted as a completely randomized design with 10 diets
in a factorial arrangement with 2 main cereals and 5 screen size used to grind the cereal.
Each treatment was replicated 5 times and the experimental unit was the cage with 10
hens for all measurements.

Chapter 3: Particle size and hen productivity
50
2.2. Laboratory analysis
Representative samples of the feeds were ground using a laboratory mill (Retsch
Model Z-I, Stuttgart, Germany) equipped with a 1-mm screen and analyzed for moisture
by the oven-drying (method 930.15), total ash in a muffle furnace (method 942.05), and
nitrogen by Dumas (method 968.06) using a Leco analyzer (Model FP-528, Leco Corp.,
St. Joseph, MI) as indicated by AOAC International (2005). Ether extract, gross energy,
and the neutral detergent fiber were determined as indicated by Pérez-Bonilla et al.
(2011) and expressed on an ash-free basis. The LNL content of the diets was determined
by gas-liquid chromatography (GC-14B, Shimadzu, Kyoto, Japan) as shown by Grobas
et al. (1999a) and the amino acid (AA) content by ion-exchange chromatography
(Hewlett- Packard 1100, Waldbronn, Germany) after acid hydrolysis, as indicated by de
Coca-Sinova et al. (2008). Particle size distribution and mean particle size of the diets,
expressed as the geometric mean diameter (GMD) and geometric standard deviation
(log normal SD; GSD), were determined in 100 g samples using a shaker equipment
(Retsch, Stuttgart, Germany) provided with 8 sieves ranging in mesh from 5,000 to 40
μm as indicated by ASAE (1995). All the analyses were conducted in duplicate except
for the GMD of the diets that was determined in triplicate. The ingredient composition
and chemical analyses of the diets and their GMD and particle size distribution are
shown in Tables 1 and 2 and Figure 1, respectively.
2.3. Measurements
2.3.1. Hen productivity
Feed disappearance, egg production, and BW of the hens were determined by
age at 4 wk intervals. Any mortality was recorded and weighed as produced. All eggs
produced the last 2 d of each week were weighed, and the average value of the 4 weeks
was used to estimate egg weight by period. From these data, ADFI, egg production, egg

Chapter 3: Particle size and hen productivity
51
weight, egg mass, feed conversion ratio (FCR) per kilogram and per dozen of eggs, and
BW gain were calculated by period as well as for the entire experiment (17 to 49wk of
age).
2.3.2. Egg quality
The number of undergrades, dirty, broken, and shell-less eggs was recorded
daily by replicate in all eggs produced. An egg was considered as dirty when a spot of
any kind or size was detected on the shell. Other egg quality traits, including yolk color,
Haugh units, and shell thickness were measured in 12 fresh eggs collected randomly
from each cage replicate the last 2 d of each of the 8 experimental periods. Haugh units
and yolk color (Roche Color Fan) were measured using a multitester equipment
(QCMSystem, Technical Services and Supplies, Dunnington, York, UK). Shell
thickness was measured at the two pole ends and at the middle section of the egg shell
with a digital micrometer (model IT-014UT, Mitotuyo, Kawasaki, Japan) and the
average of the 3 measurements of each of the 12 eggs was used for further analyses.
Shell strength and shell color were measured in 6 eggs collected randomly from each
replicate the same days. Egg shell strength, expressed in g/cm2, was evaluated applying
increased pressure to the broad pole of the egg using a press meter (Egg Force Reader,
SANOVO Technology A/S, Odense, Denmark). Shell color was measured using a
Minolta colorimeter (Chroma Meter Model CR-200, Minolta Corp., Ramsey, NJ) and
the Hunter color values, L∗ (lightness), a∗ (green to red), and b∗ (blue to yellow), were
recorded.

Chapter 3: Particle size and hen productivity
52
2.3.3. Gastrointestinal tract traits and body measurements
At 49 wk of age, after the corresponding performance control, 2 hens per
replicate were randomly selected, weighed individually, and euthanized by CO2
inhalation. The digestive tract, from the post-crop esophagus to the cloaca, including the
digesta content and the annex organs (liver, pancreas, and spleen) was removed and
weighed. Then, the proventriculus, gizzard, and the liver were excised and weighed and
the weight expressed relative to BW. In addition, the gizzard was emptied from any
digesta content, cleaned, dried with desiccant paper, and weighed again. The weight of
the digesta content of the gizzard was expressed relative to the full organ weight (%).
Gizzard pH was measured in situ in all these hens in duplicate using a digital pH meter
fitted with a fine tip glass electrode (model 507, Crison Instruments S.A., Barcelona,
Spain) as indicated by Jiménez-Moreno et al. (2009a). The length of the duodenum
(from the gizzard to the pancreo-biliary ducts), jejunum (from the pancreo-biliary ducts
to the Meckel’s diverticulum), ileum (from the Meckel’s diverticulum to the ileo-cecal
valvue), and the two ceca (from the ostium to the tip of the right and left ceca) were
measured on a glass surface using a flexible tape with a precision of 1 mm. The length
of the small intestine was determined by adding that of the duodenum, jejunum, and
ileum. In addition, hen length, from the tip of the beak to the end of the longest phalanx,
was measured in extended birds as indicated for the small intestine and body mass index
(BMI) was estimated. Also, the length and diameter of the tarsus of these hens were
measured with the aid of a digital caliper and expressed relative to BW. The average
value of the 2 hens was used for further statistical analysis.

Chapter 3: Particle size and hen productivity
53
2.4. Statistical analysis
Data were analyzed as a completely randomized design with 10 treatments
arranged as a 2 × 5 factorial with main cereal of the diet and screen size used as main
effects using the MIXED procedure of SAS (SAS Institute, 2004). In addition, treatment
sum of squares of the effects of screen size on all variables studied was partitioned into
the linear and quadratic components. Also, a non-orthogonal contrast comparing the
effects of the average of the 2 diets based on corn or barley ground through a 4-mm
screen and the average of all the other diets (ground through a 6- to 12-mm screen size)
was included in the statistical analysis. The Pearson correlation analyses (SAS Institute,
2004) was used to study the effect of diet on the relation between BW and BMI, body
length, tarsus length, and tarsus diameter of the hens at 49 wk of age. Results in tables
are presented as means and differences were considered significant at P < 0.05.
3. Results
The GMD was higher for the barley than for the corn diets and increased as the
screen size used to grind the cereals increased (Table 2). The GSD, however, was higher
for the corn than for the barley diets and increased with the size of the screen used.
3.1. Hen productivity and egg quality
Mortality was 0.6% and was not related to any treatment (data not shown). No
interactions between main cereal of the diets and the screen size used were observed for
any of the traits studied and therefore, only main effects are discussed.
3.1.1. Main cereal of the diet
For the entire experimental period, none of the production traits studied, except
egg weight that tended (P = 0.092) to increase with barley, were affected by the main
cereal of the diet (Table 3). In fact, egg production, ADFI, and BW gain were not
Chapter 3: Particle size and hen productivity
54
affected by the main cereal in any of the periods studied. Egg mass, however, increased
with barley feeding in some of the periods considered (Figure 2). The main cereal of the
diet did not affect any of the egg quality traits studied (dirty, broken, and shell-less
eggs, Haugh units, and strength, thickness, and color of the shell) (Table 3).
3.1.2. Screen size
From 17 to 49 wk of age, the screen size used to grind the cereal did not affect
any of the production or egg quality traits studied, except for FCR that tended (P =
0.081) to be higher in hens fed the 4- mm screen ground diet as compared with the
average of hens fed the 6- to 12-mm screen ground diets (Table 3). Egg production, egg
mass, and FCR were affected by the screen size used to grind the cereal in some of the
periods considered (Figure 3). The screen size used to grind the cereal did not affect any
of the egg quality traits studied.
3.2. Gastrointestinal tract traits and body measurements
3.2.1. Main cereal of the diet
At the end of the experiment, the GIT (126 vs. 122 g/kg BW; P < 0.05) and the
gizzard (29.1 vs. 27.7 g/kg BW; P < 0.05) were heavier in hens fed barley than in hens
fed corn. Gizzard pH, gizzard content, and body measurements traits, however, were not
affected by the main cereal of the diet (Tables 4 and 5).
3.2.2. Screen size
The relative weight of the full gizzard (P < 0.01), GIT (P = 0.089), and liver (P =
0.056) increased linearly as the screen size used increased (Table 4). Body
measurements, however, were not affected by the screen size (Table 5).

Chapter 3: Particle size and hen productivity
55
A significant positive relation between BW of the hens and BMI (P < 0.001),
body length (P < 0.05), and tarsus length and diameter (P < 0.01) were observed at 49
wk of age (Table 6).
4. Discussion
The chemical composition of the experimental diets was close to expected
values, confirming that the ingredients were mixed correctly. The GMD was greater for
the barley than for the corn diets, in agreement with data of Pérez-Bonilla et al. (2011).
The glumes of the barley grains are coarse and flexible and barley has a higher NDF
content than corn. Consequently, the chances of the fiber fraction of barley passing
intact through the screen increase, resulting in an increase in the GMD of the diet. In
contrast, the GSD was higher for the corn than for the barley diets, in agreement with
data of Pérez-Bonilla et al. (2014) comparing different types of grinding in diets for
laying hens. The data suggest that the structure of the feed (mean particle size and
uniformity) depends not only on the size of the screen but also on the characteristics of
the grain used. As expected, the GMD of the diets increased as the screen size
increased. In fact, the GMD of the diet (average of the corn and barley diet) increased
by 42.3% (1,003 to 1,427 μm) as the size of the screen increased from 4 to 12 mm. The
GSD tended to increase with increases in screen size.
4.1. Hen productivity and egg quality
4.1.1. Main cereal of the diet
For the entire experimental period, the main cereal of the diet did not affect egg
production, ADFI, FCR, or egg quality traits, results that agree with previous studies
(Safaa et al., 2009; Pérez-Bonilla et al., 2011). In contrast, Coon et al. (1988) reported
higher ADFI but reduced feed efficiency in hens fed barley than in hens fed corn but in
this research the diets were not supplemented with enzymes. Yu et al. (1998) reported

Chapter 3: Particle size and hen productivity
56
also better growth performance of broilers when fed a corn diet than when fed a barley
diet supplemented with enzymes. The chemical composition and nutritive value of
barley is less uniform than that of corn because of its higher content in NSP (Jacob and
Pescatore, 2012). Consequently, the use of corn favors poultry performance as
compared with the use of barley. However, the potential differences in nutritive value
among the two cereals might be reduced and even disappear when the barley diets are
supplemented with adequate exogenous enzymes (Lázaro et al., 2003a; Gracia et al.,
2003; Pérez-Bonilla et al., 2011), as occurred in the current experiment. On the other
hand, moisture content is more variable in corn than in barley (FEDNA, 2010).
Consequently, FCR could increase in those flocks fed diets based on corn with a higher
moisture content.
Eggs tended to be heavier in hens fed barley than in hens fed corn. The
information available on the effects of the main cereal of the diet on egg weight is
limited and conflicting, with reports showing higher (Nahashon et al., 1994; Lázaro et
al., 2003a), similar (Brufau et al., 1994; Pérez-Bonilla et al., 2011), or reduced (Coon et
al., 1988) egg weight with barley. Total sulfur AA, LNL, and supplemental fat are the
main dietary factors affecting egg weight in commercial layer operations (Grobas et al.,
1999b; Safaa et al., 2008). In the current research, the contents in TSAA and all others
indispensable AA of the 2 diets was above recommendations (FEDNA, 2008; Lohmann,
2014) and the LNL content was also in excess of hen requirements for optimal hen
productivity (Grobas et al., 1999a). Consequently, no effect of an excess of TSAA or
LNL on egg production was expected. On the other hand, the level of supplemental fat
was higher for the barley than for the corn diet (5.3 vs. 4.7%) which might have resulted
in the small increase in egg weight observed (Pérez-Bonilla et al., 2011).

Chapter 3: Particle size and hen productivity
57
4.1.2. Screen size
In the current research, FI was not affected by the screen size used to grind the
cereal. Most published research, however, showed that hens had a preference for larger
feed particles and that fine grinding reduced voluntary FI in laying hens (Safaa et al.,
2009). In this respect, Safaa et al. (2009) observed a 2.5% greater FI in hens fed corn or
wheat ground with a 10-mm screen than in hens fed the same cereals ground with a 6-
mm screen. Moreover, many laying hens management guides (i.e., Lohmann, 2014)
recommend the use of coarse texture diets when the objective is to maximize FI. In this
respect, Nir et al. (1994b) indicated that coarse particles are better adapted to the size of
the beak than fine particles. The lack of effect of the screen size used to grind the cereal
on FI of the hens observed in the current experiment is not consistent with most
published research and we do not have a clear explanation for the difference in behavior
observed. In our research, the proportion of very fine particles (<315 μm) was low in all
the diets (between 7.9% for the 4-mm screen diet and 4.0% for the 12-mm screen diet)
which might have reduced the negative impact of fine grinding on FI. In addition, all
diets included extra amounts of supplemental fat (4.7 to 5.3%) which could have reduce
dust formation and hen selection. The data suggest that laying hens adapt well their
voluntary FI to diets varying widely in particle size, provided that the proportion of very
fine particles is limited and that some extra supplemental fat is included in the diet.
In the current research, FCR from 17 to 49 wk of age tended to be reduced in
hens fed the 4-mm screen ground diets as compared with the average of the hens fed the
other diets. Also, a reduction in egg production and egg mass was observed in hens fed
the 4-mm screen ground diet in some of the feeding periods. The available data on the
effects of coarse particle size on nutrient digestibility and feed efficiency in poultry are
contradictory with some research showing an improvement (Nir et al., 1994a,b; Röhe et
Chapter 3: Particle size and hen productivity
58
al., 2014; Ruhnke et al., 2015) and some research showing no effects (Maclsaac and
Anderson, 2007; Safaa et al., 2009). Coarsely ground diets have a stimulating effects of
the development of the GIT, improving gizzard and pancreas weight (Röhe et al., 2014)
and starch digestibility (Ruhnke et al., 2015). Fine particles, however, are not retained
for long in the gizzard, which reduce gizzard activity and nutrient digestibility in
poultry (Nir et al., 1994a; Mateos et al., 2012). In this respect, Amerah et al. (2007)
suggested that coarse particles increase the antiperistaltic movements in the GIT of the
birds, leading to better mixing and utilization of the nutrients. Also, a reduction in
particle size increases the surface of contact between nutrients and endogenous enzymes
which might favor nutrient digestibility (Amerah et al., 2007). On the other hand, the
vitamins, minerals, and crystalline AA might concentrate in the fine fraction of the diet.
Consequently, a preference for coarse particles affects the balance of nutrients ingested,
which eventually might reduce egg weight and hen production. These opposite effects
of particle size on feed efficiency might counteract each other, and the final outcome
might depend on factors such as ingredient composition of the diet and age,
management, and health status of the birds.
The screen size used to grind the cereal did not affect any of the egg quality
traits studied. Most published data (Safaa et al., 2009) do not show any influence of
particle size on egg traits, including different measurements of shell and albumen
quality. Moreover, Hafeez et al. (2015) indicated that differences in albumen weight and
shell quality due to particle size were of little practical interest. Also, these authors
recorded that the proportion of shell, yolk, and albumen of the eggs were not affected by
particle size. Consequently, the screen size use to grind the cereal can be modified
according to specific requirements without any effect on egg quality.

Chapter 3: Particle size and hen productivity
59
4.2. Gastrointestinal tract traits and body measurements
4.2.1. Main cereal of the diet
None of the GIT traits studied was affected by the main cereal of the diet, except
the gizzard that was heavier in hens fed barley. The GMD of the diets was greater for
the barley than for the corn diets and coarser particles are associated with greater
development of the gizzard in broilers (Nir et al., 1994a) and pullets (Saldaña et al.,
2015b). Also, the NDF content was higher (11.3 vs. 10.4%) in the barley than in the
corn diets and consequently, barley feeding might stimulate more gizzard and GIT
development than corn feeding (González-Alvarado et al., 2007; Mateos et al., 2012;
Sacranie et al., 2012).
4.2.2. Screen size
None of the GIT traits studied were affected by the screen size, except gizzard
weight that increased as the screen size used to grind the cereal increased, in agreement
with the data of Röhe et al. (2014). Fine particles pass faster through the upper part of
the GIT than coarse particles (Hetland et al., 2002) and consequently, gizzard size and
function will increase with coarse grinding (Jiménez-Moreno et al., 2009b; Mateos et
al., 2012).
Body mass index, body length, and tarsus length and diameter are used to
estimate the BW and size of broilers (Van Roovert-Reijrink, 2013), pullets (Saldaña et
al., 2015b), and laying hens (Guzmán et al., 2016). In the current research, none of these
traits was affected by the main cereal of the diet or the screen size used to grind the
cereal, results that are consistent with the lack of effect of the characteristics of the diets
on BW gain. On the other hand, the significant positive relation detected between BW
and BMI, body length, and tarsus length and diameter, confirm that these traits can be
used as good estimators of BW in hens.

Chapter 3: Particle size and hen productivity
60
In summary, barley can substitute up to 45% of the corn in diets for laying hens
provided that the feed is supplemented with adequate enzymes. The size of the screen
used to grind the cereal had no impact on hen productivity or egg quality provided that
the proportion of very fine particles (<160 μm) remains low and that the diets are
supplemented with fat. Gizzard development, however, improves as the screen size
increases. The data suggest that corn and barley ground through a 6 to 10-mm screen
can be used indistinctly in diets for laying hens, without any effect on hen performance.
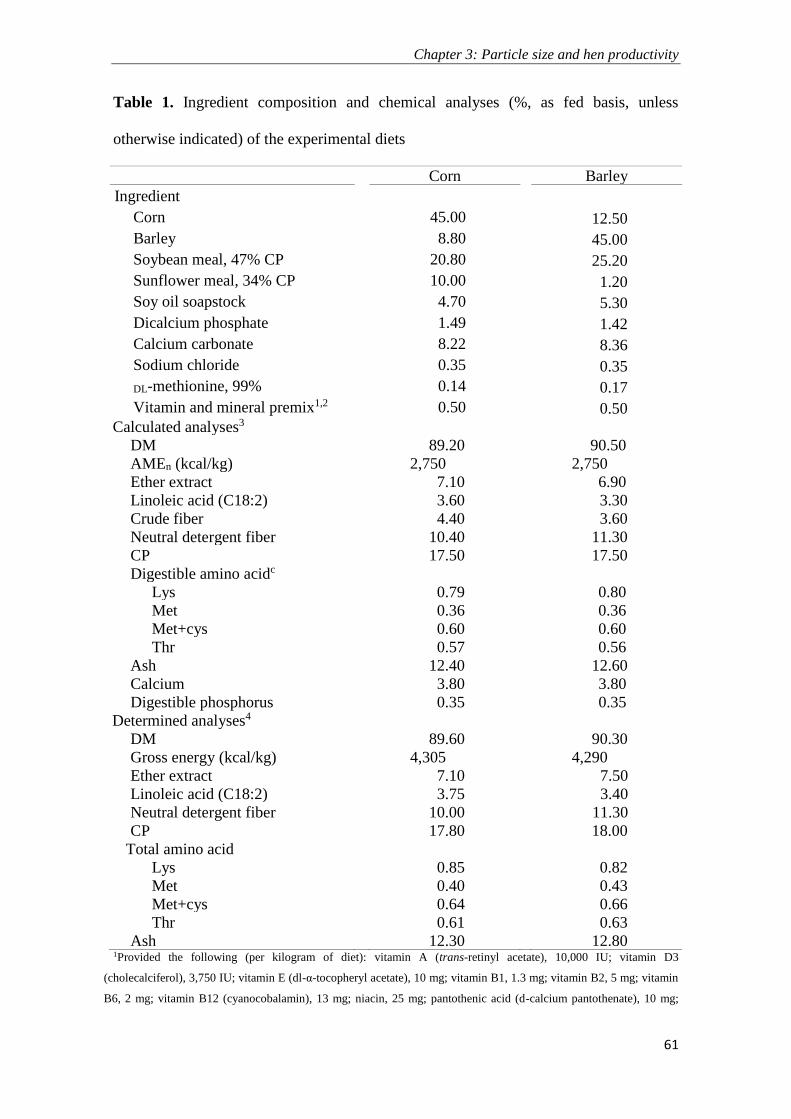
Chapter 3: Particle size and hen productivity
61
Table 1. Ingredient composition and chemical analyses (%, as fed basis, unless
otherwise indicated) of the experimental diets
Corn Barley
Ingredient
Corn 45.00 12.50
Barley 8.80 45.00
Soybean meal, 47% CP 20.80 25.20
Sunflower meal, 34% CP 10.00 1.20
Soy oil soapstock 4.70 5.30
Dicalcium phosphate 1.49 1.42
Calcium carbonate 8.22 8.36
Sodium chloride 0.35 0.35
DL-methionine, 99% 0.14 0.17
Vitamin and mineral premix1,2 0.50 0.50
Calculated analyses3
DM 89.20 90.50
AMEn (kcal/kg) 2,750 2,750
Ether extract 7.10 6.90
Linoleic acid (C18:2) 3.60 3.30
Crude fiber 4.40 3.60
Neutral detergent fiber 10.40 11.30
CP 17.50 17.50
Digestible amino acidc
Lys 0.79 0.80
Met 0.36 0.36
Met+cys 0.60 0.60
Thr 0.57 0.56
Ash 12.40 12.60
Calcium 3.80 3.80
Digestible phosphorus 0.35 0.35
Determined analyses4
DM 89.60 90.30
Gross energy (kcal/kg) 4,305 4,290
Ether extract 7.10 7.50
Linoleic acid (C18:2) 3.75 3.40
Neutral detergent fiber 10.00 11.30
CP 17.80 18.00
Total amino acid
Lys 0.85 0.82
Met 0.40 0.43
Met+cys 0.64 0.66
Thr 0.61 0.63
Ash 12.30 12.80 1Provided the following (per kilogram of diet): vitamin A (trans-retinyl acetate), 10,000 IU; vitamin D3
(cholecalciferol), 3,750 IU; vitamin E (dl-α-tocopheryl acetate), 10 mg; vitamin B1, 1.3 mg; vitamin B2, 5 mg; vitamin
B6, 2 mg; vitamin B12 (cyanocobalamin), 13 mg; niacin, 25 mg; pantothenic acid (d-calcium pantothenate), 10 mg;

Chapter 3: Particle size and hen productivity
62
folic acid, 1 mg; biotin, 13 mcg; choline (choline chloride), 250 mg; manganese (MnO), 88 mg; zinc (ZnO), 63 mg;
iron (FeSO4.H2O), 38 mg; copper (CuSO4 5H2O), 8 mg; iodine [Ca(IO3)2], 0.7 mg; selenium (Na2SeO3), 0.3 mg;
Roxazyme, 200 mg [1,600 U of endo-1,4-β-glucanase (EC 3.2.1.4), 3,600 U of endo-1,3 (4)-β-glucanase (EC 3.2.1.6),
and 5,200 U of endo-1,4-β-xylanase (EC 3.2.1.8)] supplied by DSM S.A., Madrid, Spain; Natuphos 5,000 (300 FTU/kg
supplied by Basf Española, S.A., Tarragona, Spain), 60 mg.
2All diets included 2.4 g canthaxantin/kg. The barley diet included also 1.7 g of ester of β-apo-8-carotenoic/kg
(supplied by Basf Española, S.A., Tarragona, Spain).
3According to FEDNA (2010).
4Data correspond to the average of analyses conducted by duplicate in the 5 diets that differed in the size of the screen
used per each cereal. Within each cereal, the determined chemical analyses were similar for the 5 diets, with a CV
below 5% in all cases
Table 2. Geometric mean diameter (GMD1 ± GSD2, µm) of the experimental diets
Screen size (mm) Cereal
Mean Corn Barley
4 960 ± 2.07 1,045 ± 2.01 1,003 ± 2.04
6 1,041 ± 2.12 1,165 ± 2.07 1,103 ± 2.10
8 1,180 ± 2.20 1,335 ± 2.06 1,258 ± 2.13
10 1,232 ± 2.21 1,458 ± 2.08 1,345 ± 2.15
12 1,302 ± 2.20 1,551 ± 2.07 1,427 ± 2.14
Mean 1,143 ± 2.16 1,311 ± 2.06 1GMD = Geometric mean diameter.
2GSD = Geometric standard deviation (Log normal SD).

Chapter 3: Particle size and hen productivity
63
Table 3. Influence of the main cereal of the diet and the screen size used to grind the cereal on hen productivity and egg quality from 17 to 49 wk of age
Main cereal Screen size (mm) SD1
Probability2,3
Corn
Barley
4
6
8
10
12
1
2
3
Productivity
Egg production (%) 93.3 93.3 92.7 93.4 93.4 93.8 93.2 1.44 0.946 0.342 0.140
ADFI (g/d) 112.1 112.9 112.4 112.4 112.3 112.6 112.8 2.07 0.220 0.571 0.824
FCR4 (kg/kg) 1.96 1.95 1.98 1.95 1.95 1.95 1.95 0.041 0.310 0.304 0.081
FCR (kg/dozen) 1.44 1.45 1.46 1.44 1.44 1.44 1.45 0.027 0.308 0.653 0.236
Egg weight (g) 61.5 62.2 61.5 62.0 61.8 61.7 62.3 1.44 0.092 0.398 0.413
Egg mass (g/d) 57.4 58.1 57.1 58.0 57.8 58.0 58.1 1.48 0.119 0.195 0.109
BW gain (g) 565 564 599 550 538 574 561 36.5
0.998
0.856
0.672
Egg quality traits5
Dirty eggs (%) 1.47 1.30 1.30 1.34 1.50 1.43 1.46 0.402 0.295 0.309 0.628
Broken eggs (%) 0.46 0.65 0.49 0.73 0.44 0.31 0.80 0.460 0.140 0.684 0.163
Shell-less eggs (%) 0.13 0.15 0.18 0.16 0.10 0.13 0.14 0.142 0.686 0.526 0.723
Haugh units 88.5 88.8 88.8 88.5 88.4 88.4 89.1 1.27 0.360 0.672 0.595
Yolk color 10.7 10.7 10.6 10.7 10.6 10.7 10.7 0.25 0.955 0.355 0.200
Shell strength (g/cm2) 5,165 5,147 5,194 5,232 5,221 5,155 4,977 412 0.880 0.221 0.993
Shell thickness (mm) 0.382 0.382 0.383 0.381 0.380 0.382 0.383 0.0071 0.710 0.793 0.786
Shell color6
L 61.3 61.6 61.3 62.4 60.9 61.2 61.4 1.07 0.371 0.321 0.431
a 15.6 15.4 15.6 14.9 16.0 15.6 15.6 0.75 0.391 0.341 0.667
b 32.6 32.6 32.7 32.4 32.7 32.6 32.7 0.52 0.690 0.617 0.943 125 replicates for the main cereal and 10 replicates for the screen size effects.
21) Effect of the main cereal; 2) Linear effect of the screen size; 3) Comparison between the average of the 2 diets ground at 4 mm vs. the average of all the other diets (ground at 6 to 12 mm).
3The interactions between main effects, and the quadratic effect of the screen size were not significant for all variables (P > 0.10).
4Feed conversion ratio.
5The data correspond to the means of 8 periods (28-d each) measured in 12 fresh eggs per period.
6Hunter color values, L* (lightness), a* (green to red), and b* (blue to yellow).

Chapter 3: Particle size and hen productivity
64
Table 4. Influence of the main cereal of the diet and the screen size used to grind the cereal on the relative weight (g/kg full BW) and length (cm/kg full BW) of
the gastrointestinal tract (GIT) traits and gizzard content (% organ weight) and pH of the hens1 at 49 wk of age
Cereal Screen size (mm) SD2
Probability3,4
Corn
Barley
4
6
8
10
12
1
2
3
Hen BW (g)
1,782
1,771
1,770
1,783
1,804
1,747
1,780
GIT relative weight
GIT5
122b
126a
122
123
124
124
126
5.7
0.031
0.089
0.163
Full proventriculus
5.51
5.65
5.43
5.67
5.59
5.58
5.44
0.548
0.362
0.649
0.676
Full gizzard
27.8b
29.1a
27.1
28.3
28.5
28.8
29.5
1.85
0.018
0.006
0.017
Liver 26.4 26.8 25.3 26.7 27.2 26.7 27.3 2.16 0.495 0.056 0.232
GIT relative length
Duodenum
14.3
14.6
14.4
14.0
13.9
15.0
14.9
1.45
0.600
0.189
0.269
Jejunum
40.6
41.2
40.9
40.5
41.4
41
40.7
3.01
0.527
0.966
0.617
Ileum
46.0
46.0
45.6
45.1
46.7
46.7
45.9
3.63
0.957
0.542
0.935
Small intestine
101
102
101
100
102
103
102
7.16
0.860
0.625
0.766
Ceca 20.2 20.6 19.5 20.0 20.9 21.2 20.5 2.33 0.567 0.180 0.403
Gizzard content 29.3 29.0 30.4 29.3 27.7 28.8 29.7 3.50 0.767 0.577 0.730
Gizzard pH 3.93 3.99 4.02 4.01 3.90 3.86 4.01 0.269 0.456 0.536 0.495 a-bWithin a row, means without a common superscript differ significantly.
1Average of 2 hens per replicate chosen at random.
225 replicates for the main cereal and 10 replicates for the screen size effects.
31) Effect of the main cereal; 2) Linear effect of the screen size; 3) Comparison between the average of the 2 diets ground at 4 mm vs. the average of all the other diets (ground at 6 to 12 mm).
4The interactions between main effects, and the quadratic effect of the screen size were not significant for all variables (P > 0.1).
5From the post-crop esophagus to the cloaca, including the digesta content and the annex organs (liver, pancreas, and spleen).
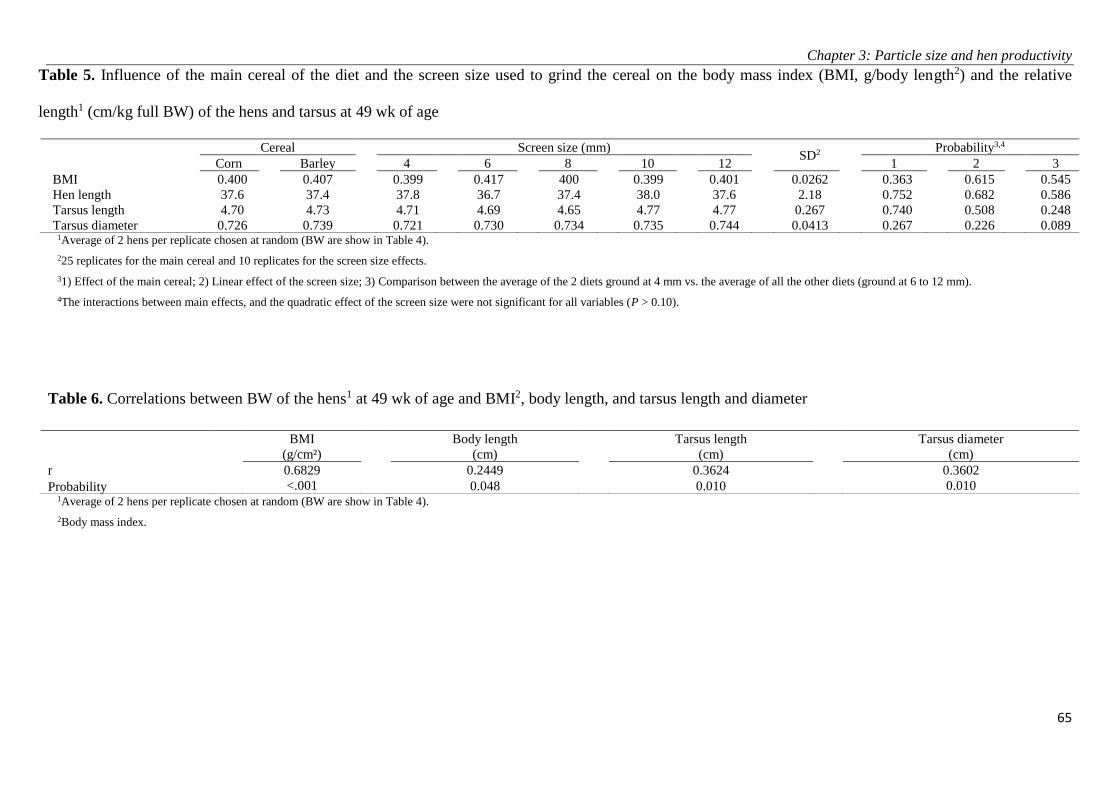
Chapter 3: Particle size and hen productivity
65
Table 5. Influence of the main cereal of the diet and the screen size used to grind the cereal on the body mass index (BMI, g/body length2) and the relative
length1 (cm/kg full BW) of the hens and tarsus at 49 wk of age
Cereal Screen size (mm) SD2
Probability3,4
Corn
Barley
4
6
8
10
12
1
2
3
BMI 0.400 0.407 0.399 0.417 400 0.399 0.401 0.0262 0.363 0.615 0.545
Hen length
37.6
37.4
37.8
36.7
37.4
38.0
37.6
2.18
0.752
0.682
0.586
Tarsus length
4.70
4.73
4.71
4.69
4.65
4.77
4.77
0.267
0.740
0.508
0.248
Tarsus diameter 0.726 0.739 0.721 0.730 0.734 0.735 0.744 0.0413 0.267 0.226 0.089 1Average of 2 hens per replicate chosen at random (BW are show in Table 4).
225 replicates for the main cereal and 10 replicates for the screen size effects.
31) Effect of the main cereal; 2) Linear effect of the screen size; 3) Comparison between the average of the 2 diets ground at 4 mm vs. the average of all the other diets (ground at 6 to 12 mm).
4The interactions between main effects, and the quadratic effect of the screen size were not significant for all variables (P > 0.10).
Table 6. Correlations between BW of the hens1 at 49 wk of age and BMI2, body length, and tarsus length and diameter
1Average of 2 hens per replicate chosen at random (BW are show in Table 4).
2Body mass index.
BMI
(g/cm²)
Body length
(cm)
Tarsus length
(cm)
Tarsus diameter
(cm)
r 0.6829 0.2449 0.3624 0.3602
Probability <.001 0.048 0.010 0.010

Chapter 3: Particle size and hen productivity
66
Figure 1. Particle size distribution1 of the corn (A) and barley (B) diets
1 The percentage of particles smaller than 160 µm and bigger than 2,500 µm were negligible for all diets.
Screen size (mm)

Chapter 3: Particle size and hen productivity
67
Figure 2. Effect of the main cereal of the diet on egg production (A), feed intake (B), egg weight (C), and feed conversion ratio per kg of eggs (D) of the
hens from 17 to 49 wk of age
+ P < 0.10; * P < 0.05
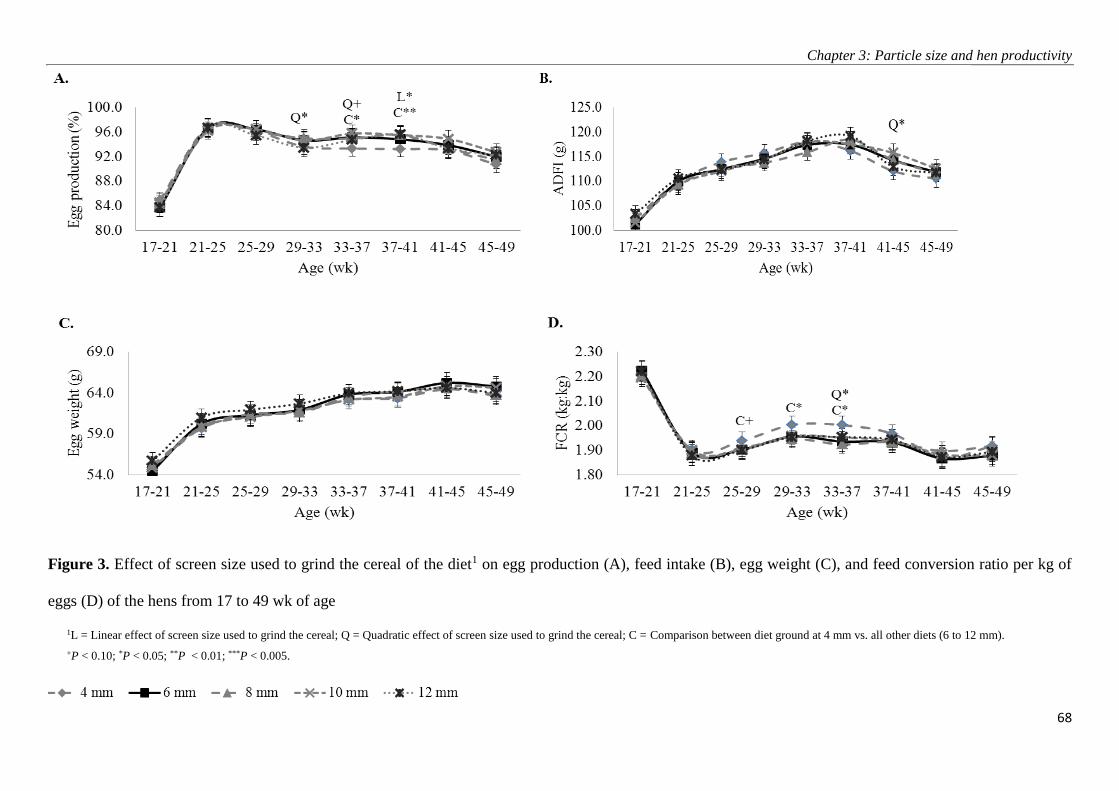
Chapter 3: Particle size and hen productivity
68
Figure 3. Effect of screen size used to grind the cereal of the diet1 on egg production (A), feed intake (B), egg weight (C), and feed conversion ratio per kg of
eggs (D) of the hens from 17 to 49 wk of age
1L = Linear effect of screen size used to grind the cereal; Q = Quadratic effect of screen size used to grind the cereal; C = Comparison between diet ground at 4 mm vs. all other diets (6 to 12 mm).
+P < 0.10; *P < 0.05; **P < 0.01; ***P < 0.005.

69
CHAPTER 4:
PARTICLE SIZE AFFECTS SHORT TERM
PREFERENCE BEHAVIOR OF BROWN-EGG
LAYING HENS FED DIETS BASED ON CORN
OR BARLEY
Chapter 4: Particle size preference in laying hen
70
1. Introduction
Several researchers (Benabdeljelil and Arbaoui, 1994; Lázaro et al., 2003a;
Herrera et al. 2017) have compared the effects of diets based on corn or barley on feed
intake (FI), egg production, and egg quality in laying hens. In most cases, the main
cereal of the diet did not affect egg production provided that the feed was supplemented
with an adequate enzyme complex. Berg (1959) reported also similar egg production
but greater BW gain and lower FI in hens fed corn than in hens fed barley. Pérez-
Bonilla et al. (2011) compared diets based on corn or barley and reported similar egg
production but greater BW gain in hens fed corn. In contrast, Coon et al. (1988)
reported higher FI, lower egg size, and reduced feed efficiency and BW gain in hens fed
a barley diet than in hens fed a corn diet, probably because in this research the diets
were not supplemented with exogenous enzymes.
The information available on particle size preference by brown-egg laying hens
is limited. Schiffman (1968) and Allen and Perry (1977) observed that poultry had a
pecking preference for coarse textured feed over non-textured feed, a preference that
increased with age. ISA Brown (1999) recorded a 3.4% increase in FI and egg
production in hens fed coarsely ground feeds compared with hens fed finely ground
feeds (9% vs. 31% of particles smaller than 0.5 mm, respectively). More recently, Safaa
et al. (2009) recorded higher FI in hens fed diets with a geometric mean diameter
(GMD) of 1,375 µm than in hens fed diets with a GMD of 1,007 µm. In fact, most
guidelines for laying hens (ISA Brown, 2010; Lohmann, 2016) recommend feeding
coarse diets with less than 15% to 20% particles smaller than 0.5 mm when the
objective is to increase FI. However, Herrera et al. (2017) did not detect any difference
in FI or egg production in brown egg-laying hens fed diets in which the cereal was

Chapter 4: Particle size preference in laying hen
71
ground using sieves varying in screen size from 4 to 12 mm (GMD of 1,003 µm and
1,427 µm, respectively).
The physico-chemical characteristics of the cereal and the diameter of the screen
used to grind the cereal affect diet structure (Amerah et al., 2007; Jiménez-Moreno et
al., 2016) and FI (Schiffman, 1968; Xu et al., 2015). The mechanoreceptors located in
the beak of the bird detect differences in feed texture and discriminate against the
consumption of fine particles (Gentle, 1979; González-Alvarado et al., 2007; Pérez-
Bonilla et al., 2014) which may reduce voluntary FI. On the other hand, coarse particles
are retained for longer in the upper part of the gastrointestinal tract (GIT) than fine
particles, which might result in better development and function of the gizzard and in an
improvement in nutrient utilization (Jiménez-Moreno et al., 2010; Svihus, 2011). The
relative smaller surface area of the coarse particles, however, penalizes the contact
between digestive enzymes and nutrients, reducing feed utilization (Amerah et al.,
2007). Moreover, coarse grinding reduces feed uniformity and might induce a
preference of the hens for coarse particles, resulting in the consumption of unbalanced
diets and a reduction in feed efficiency (Davis et al., 1951; Nir et al., 1994a). In this
respect, mash diets based on cereals with different physico-chemical characteristics
might result in feeds with different particle size distribution and GMD, even when
ground using the same screen size (Douglas et al., 1990; Nir et al., 1995; Jiménez-
Moreno et al., 2009c; Perez-Bonilla et al., 2014). All these contrasting effects might
counteract each other and the final outcome might depend on other uncontrolled
variables, such as age of the bird, management practices, and nutritional characteristics
of the diet (Mateos and Sell, 1980; Grobas et al., 1999a; González-Alvarado et al.,
2010).

Chapter 4: Particle size preference in laying hen
72
Laying hens show a specific appetite for some components of the diet, such as
protein, fiber, and Ca. When given a choice, birds might be able to balance the final diet
by selecting nutrients and increasing the consumption of those feed particles rich in the
deficient nutrient (Hughes and Wood-Gush, 1971; Mongin and Sauveur, 1974;
Holcombe et al., 1975; Abdollahi et al., 2016). For example, Forbes and Shariatmadari
(1994) showed that poultry offered diets differing in CP content, choose the correct
amount of the different feeds to meet protein requirements. Poultry show also an
appetite for structural dietary components, and when fed low fiber diets, they consume
extra amounts of fibrous components if have free access to the litter (Hetland et al.,
2003; Mateos et al., 2012).
We hypothesized that grinding size could affect FI and preference behavior in
laying hens, with effects that could depend on the physico-chemical characteristics of
the main cereal used. Also, it was hypothesized that differences in the nutritional
composition of the coarse and the fine fractions of the diets, could affect the feeding
behavior of the hens. The objective of this research was to compare the effect of the size
of the screen used to grind the cereal on the preference behavior of brown-egg laying
hens fasted for 8 h and then fed diets based on corn or barley from 06.00 a.m. to 14.00
p.m.
2. Materials and methods
2.1. Husbandry, diets, and experiment design
All procedures were approved by the Animal Ethics Committee of the
Universidad Politécnica de Madrid and were in compliance with the Spanish guidelines
for the care and use of animals in research (Boletín Oficial del Estado, 2007). Details on
husbandry, ingredient composition, feeding program, and nutrient content of the diets,
Chapter 4: Particle size preference in laying hen
73
were reported by Herrera et al. (2017). Briefly, two diets with similar nutrient content
but differing in the main cereal used (corn vs. barley) were formulated. Before feed
manufacturing, the batches of the 2 cereals were divided into 5 portions, and each
portion was ground using a horizontal hammer mill (Mecafa S.A., Ciudad Real, Spain)
provided with a 4, 6, 8, 10, or 12 mm screen and included in their respective
experimental diets. Each of the 10 diets was fed to 5 replicates that consisted in an
enriched cage with 10 brown egg-laying hens.
The soybean meal used in the manufacturing of the diets was used as received
whereas the the sunflower meal (received in pellets) was ground using a 10-mm screen.
The GMD ± geometric standard deviation (GSD; log normal SD) of the soybean meal
and sunflower meal were 1,069 ± 1.79 and 699 ± 2.23 µm, respectively (Table 1). The
limestone included in the diets was presented 50% as powder (GMD = 597 ± 2.31 µm)
and 50% in granular (GMD = 2,166 ± 1.39 µm) form. This ratio was representative of
diets used in laying hens under Spanish commercial conditions (Pérez-Bonilla et al.,
2014). The ingredient composition and the calculated (FEDNA, 2010) and determined
nutrient content of the experimental diets are shown in Table 2. As reported by Herrera
et al. (2017), feed intake, egg production, and BW gain of the hens from 17 to 48 wk of
age (previous to the start of the experiment) were not affected by the main cereal or the
screen size used to grind the cereal.
The night before the start of the experiment, feeders were emptied at 22.00 p.m.
and the hens fasted for 8 h. At 06.00 a.m. of the following day, all replicates were
offered 2.2 kg of their respective experimental feeds for ad libitum consumption. The
amount of feed supplied at the start of the experiment was chosen to allow a complete
filling of the feeders while avoiding feed wastage. Consequently, hens consumed the
different fractions of the original feeds according to their preference throughout the
Chapter 4: Particle size preference in laying hen
74
experiment. Representative samples (300 g) of the feed remaining in the feeders were
collected every 2 h during the experiment (from 06.00 a.m. to 14.00 p.m.) and the
particle size distribution and the GMD ± GSD were determined per cage at the end of
each interval. Feed intake was measured by replicate as the difference between the
amount of feed present in the feeder at the start and end of the experiment. Feed
wastage was not determined.
The experiment was conducted as a completely randomized design with 10 diets
in a factorial arrangement with 2 cereals and 5 screen sizes. Each treatment was
replicated 5 times and the experimental unit was the cage with 10 hens for all
measurements.
2.2. Laboratory analysis
Representative samples of the feeds were ground with a laboratory mill (Retsch
Model Z-I, Stuttgart, Germany) equipped with a 1-mm screen and analyzed in duplicate
for major nutrients as indicated by AOAC International (2005) (Table 2). The particle
size distribution of the main ingredients, the original diets, and the uneaten feed
remaining in the feeders was determined in triplicate in representative samples (100 g)
every 2 h (Tables 1 and 3, and Figure 1). The data was expressed as GMD ± GSD
(ASAE, 1995).
At the end of the experiment (14.00 p.m.), the feed remaining in the feeders of
all the replicates was collected and pooled by treatment. The reason for pooling the
uneaten feed of the 5 replicates of each of the 10 treatments, was the limited amount of
residual feeds present in some replicates, which did not allow to estimate precisely the
nutrient composition of each of the sieve fractions in the replicates. Representative
samples of the 5 sieve fractions of each of the 10 original diets and of the 50 composite
uneaten feed samples collected at 14.00 p.m. (10 treatments and 5 sieve fractions per
Chapter 4: Particle size preference in laying hen
75
treatment) were ground (1-mm screen) and analyzed for moisture, CP, total ash, and Ca
as indicated by Herrera et al. (2017).
2.3. Statistical analysis
The experiment was conducted as a completely randomized design with 10
treatments arranged as a 2x5 factorial with 2 main cereals (corn and barley) and 5 mean
particle size of the cereal (4, 6, 8, 10, and 12 mm screen). The effects of type of cereal
and grinding size of the cereal on FI and their interactions were analyzed by the GLM
procedure of SAS (SAS Institute, 2004). For particle size selection, the same effects and
the interaction between sampling time and the main effects were analyzed by the
MIXED procedure of SAS (SAS Institute, 2004), using time as repeated measure. The
individual cage represented the experimental unit for all measurements. When the
model was significant, treatment means were separated using the Tukey test. Results in
tables are presented as means and differences were considered significant at P < 0.05.
For data on CP, ash, and Ca content of the different sieve fractions of the original diets
and of the residual feeds at 14.00 p.m., no replicates were available and therefore, only
average values per treatment are presented.
3. Results
The effects of the cereal and screen size on the GMD and the GSD of the diets
are shown in Table 3. Independent of the screen used, the GMD of the feeds was greater
(average of 1,311 µm vs. 1,143 µm) for the barley- than for the corn diets. However, an
opposite effect was observed for the GSD (2.06 vs. 2.16). Feed intake from 06.00 a.m.
to 14.00 p.m. (56.6 ± 5.4 g) was not affected by the main cereal or the screen size used
to grind the cereal (data not shown).
The effects of the main cereal, screen size, and time on particle size distribution
of diets and feed refusals are shown in Table 4. The GMD and the GSD of the diets

Chapter 4: Particle size preference in laying hen
76
decreased (P < 0.001) as the experiment progressed, irrespective of the size of the
screen used to grind the cereal. The differences in GMD between the corn and barley
based diets decreased with time (P < 0.001 for the interaction; Figure 2A). For the GSD,
the decrease with sampling time observed was more pronounced for the corn than for
the barley diets (P < 0.001 for the interaction; Figure 2B).
As an average of the corn and barley diets, both GMD (from 948 µm to 1,246
µm) and the GSD (from 2.00 to 2.10) increased (P < 0.001) as the screen size used to
grind the cereal increased from 4 to 12 mm (Table 4). The differences in GMD among
screen sizes of the corn and barley diets decreased with time (P < 0.001 for the
interaction; Figure 3) but no interactions were detected for the GSD.
The CP content of the sieved fractions of the original diets and of the residual
feeds, measured after 8 h of ad libitum feeding, is shown in Table 5. When the cereal,
either corn or barley, was finely ground (4 and 6 mm screen), the protein accumulated
primarily in the coarser fraction (average of the 1,250 and 2,500 µm sieves) of the
original diets. However, no such an effect was observed when the cereal was coarsely
ground (10 and 12 mm screen), with more protein accumulating in the finer fraction
(160 and 315 µm sieves). In fact, the CP content of the coarser fraction was 18.6% and
19.2% for the corn and barley diets, when the cereal was ground with a 4 mm screen but
14.3% and 14.4% when ground with a 12 mm screen. Similar but less pronounced
effects were observed in the residual feeds after 8 h of ad libitum feeding; the CP
content of the coarser fractions was 17.1% and 16.8% for the corn and barley diets
when the cereal was finely ground (4 mm screen) but 15.0% and 16.6% when the cereal
was coarsely ground (12 mm screen).
The ash and Ca contents of the sieving of the original diets and of the residual
feeds, measured after 8 h of ad libitum feeding are shown in Tables 6 and 7,

Chapter 4: Particle size preference in laying hen
77
respectively. Ash and Ca concentrated in the coarser fractions of the original and the
residual feeds in both set of diets, with differences being more pronounced when the
cereals were ground fine than when ground coarse. In fact, the Ca content of the coarser
fraction (1,250 and 2,500 µm sieves) of the original corn and barley diets was 8.2% and
7.8% when the cereal was ground at 4 mm but 4.4% and 3.7% when ground at 12 mm
(Table 7). Similarly, the Ca content of the coarser fraction (1,250 and 2,500 µm sieves)
of the residual feed after 8 h of ad libitum feeding was 13.2% and 11.7% for the corn
and barley diets when the cereal was ground at 4 mm but 9.7% and 6.7% when ground
at 12 mm. Similar response was observed for the ash, which concentrated in the coarser
fraction of the original and of the residual feeds, with more pronounced effects when the
cereal was ground fine (4- and 6 mm screen) than when ground coarse (10- and 12 mm
screen).
4. Discussion
The GMD of the original diets was greater for the barley- than for the corn diets
(1,311 vs. 1,143 µm), consistent with data of Pérez-Bonilla et al. (2011) comparing the
two cereals. The glumes of the barley grains are quite flexible, and when ground, a high
proportion passes intact through the screen, resulting in an increase in the GMD of diets
based on barley compared with diets based on corn. These results confirm that the
structure of the feed depends not only on the size of the sieve but also on the main
cereal of the diet, consistent with data of Douglas et al. (1990) and Nir et al. (1995).
The beak of the chicken is not well adapted to consume fine particles and
consequently, coarse particles tended to be preferred (Picard et al., 1997; Mateos et al.,
2002). In fact, most management guides (ISA Brown, 2010; Lohmann, 2016)
recommended coarse grinding when the objective is to maximize FI. In this respect,
Safaa et al. (2009) observed a significant 2.5% increase in FI in hens fed corn or wheat

Chapter 4: Particle size preference in laying hen
78
ground with a 10-mm screen compared with hens fed the same cereals ground with a 6-
mm screen. However, in the current research in which diets based on corn or barley
were compared, no differences in FI because of particle size were observed. The reasons
for the discrepancy among experiments is not apparent but could be related to the
proportion of very fine particles present in the diets rather than to their GMD. In this
respect, Portella et al. (1988a) suggested that hen preference for coarse particles might
be altered not only by the average size of the particles of the diet but also by the
proportion of very fine particles. Herrera et al. (2017) suggested that supplemental fat
might agglomerate the fines of the diet, improving palatability and reducing the
rejection rate for fine particles. In the current research supplemental, fat was high in
both corn and barley diets (4.7% and 5.3%, respectively) which might have reduced the
preference of the hens for coarse vs. fine particles.
The GMD of the diets decreased with time, reflecting the preference behavior of
the hens for coarse particles, in agreement with previous studies with broilers
(Schiffman, 1968; Portella et al., 1988b; Xu et al., 2015) and laying hens (Portella et al.,
1988a; Safaa et al., 2009). The data confirm that when allowed to choose, laying hens
prefer coarse particles. In contrast, Herrera et al. (2017) reported no differences in FI of
brown laying hens fed diets from 17 to 49 wk of age when the cereal was ground using
screens varying in size from 4 to 12 mm. The reasons for the discrepancy among
researches are not known but might depend on the chemical composition of the
experimental diets as well as on the feeding strategy used (i.e., frequency of feeding)
and feeder design which might affect feed particle size distribution. When allowed to
choose, hens might prefer coarse particles as observed in the current experiment.
However, when new feed is constantly added to the uneaten feed or when the hens are
Chapter 4: Particle size preference in laying hen
79
obliged to clean the feeders at specific times, as occurred often under practical
conditions, the effects might be less pronounced or even disappear.
The differences in GMD of the residual feeds between the two cereals based
diets and among screen sizes, decreased with time, reflecting the increased uniformity
of the particles in the uneaten feed. Portella et al. (1988a) reported also that the
disappearance of coarse particles was overwhelming when the feed had an excess of
large particles (> 2.36 mm). However, the preference was less obvious as the
experiment progressed and the percentage of coarse particle was reduced, consistent
with the results reported herein. The GSD of the diets was greater for the corn- than for
the barley diets, differences that increased with increases in the size of the screen. In
contrast, the differences in GSD for both main effects (type of cereal and screen size)
decreased with time, reflecting the higher rate of disappearance of the coarser particles
of the uneaten feed for the first hours after the start of the experiment.
Birds show a specific appetite for some components of the diet, such as CP,
fiber, or Ca (Hughes and Wood-Gush, 1971; Mongin and Sauveur, 1974; Holcombe et
al., 1975). When the diet is deficient in a given nutrient, birds might choose to eat those
sieving fractions richer in the deficient nutrient (Portella et al., 1988a). As a result, hen
preference might depend not only on particle size but also on the physical distribution
of the limiting nutrient within the sieving fractions. In the current research, however, the
differences in CP, ash, and Ca content among the sieving fractions of the original diets
were similar to those of the residuals at the end of the experiment, suggesting that feed
preference was not modulated by differences in nutrient content of the sieve fractions of
the diet.
An observation that deserves further attention is the difference in Ca
concentration between the original diets and the residual feeds after 8 h of ad libitum

Chapter 4: Particle size preference in laying hen
80
consumption. For the corn diet, the percentage of Ca across fractions of the diet,
independent of the sieving fraction considered and of the screen size used to grind the
corn, was 8.6% to 63.4% higher in the residual feeds than in the original diets. Similar
data were observed for the barley diets, in which the percentage of Ca was 11.1% to
58.3% higher in the residual feed than in the original diets. Similar distribution pattern
was observed for ash content but not for CP. The reasons of these contrasting
observations are unknown but might be related to the timing at which the feed (and the
Ca included in the feed) was available for consumption and the Ca needs for shell
formation according to the period of the day. Hughes et al. (1972) reported that laying
hens under-consume Ca during the morning but tend to over-consume Ca late in the
day, when most of the shell formation process occurs. In the evening, hens try to
balance Ca intake and Ca requirements, giving preference to those particles rich in the
deficient nutrient, regardless of feed coarseness, whereas an opposite pattern might
occur during the morning.
The current research was conducted from 06.00 a.m. to 14.00 p.m., a period of
the day in which Ca deposition is relatively low. Consequently, hens chose to under-
consume Ca because Ca requirements are lower. The higher Ca concentration of the
residual feeds after 8 h of ad libitum consumption, compared to that of the original diets
observed, is consistent with this suggestion. Also, it was noticed that Ca concentrated in
the coarse fractions of the original feeds, probably because 50% of the CaCO3 of the
diets was supplied in granular form. Similar Ca distribution pattern was observed in the
residual feeds of all diets after 8 h of ad libitum consumption, confirming that hens
preference for coarse particles was independent of its Ca content. In contrast, Portella et
al. (1988a) observed that the proportion of Ca in the different sieving fractions of a
mash diet was not homogenous and decreased as the GMD of the diet increased,
Chapter 4: Particle size preference in laying hen
81
opposite to the results reported herein. The reasons for the discrepancy are not known.
We do not have information on the time of the day and the size of the Ca carbonate used
by Portella et al. (1988a) and thus, no comparison of the results of the two experiments
can be made.
The consumption pattern observed was different for CP than for Ca. Hens
showed a clear preference for consuming coarse particles and were unable to choose
those fractions of the feed with a higher or lower protein content. Traineau et al. (2015),
however, reported that when hens were allowed to choose between two feeds varying in
CP content, they over-consumed of the diet rich in protein after oviposition, early in the
morning, a period in which the albumen of the egg is formed. In the research of
Traineau et al. (2015), hens were offered two different feeds to choose, whereas a single
feed was supplied in the current research, limiting the capacity of the hens for selecting
feed particles based on its protein content. In this respect, Forbes and Shariatmadari
(1994) showed that the ability of the hens to choose ingredients according to its CP
needs, when offered a single diet, was limited. Moreover, Pousga et al. (2005) reported
that hens offered a single conventional feed were not able to choose those feed fractions
with higher CP content, consistent with the data reported herein.
In conclusion, type of cereal and size of the screen used to grind the cereal
affected feed preference behavior of the hens. The CP, ash, and Ca contents of the diet
were not uniform and varied with the screen used to grind the cereal and with the sieving
fraction (fine vs. coarse) of the diets. The data demonstrate that under the condition of the
current research, hen preference for coarse particles was not modulated by the desire to
meet any potential requirement for the missing nutrient. In fact, in relative terms, the
concentration of CP, ash, and Ca of the sieve fractions of the original diets and the
residuals after 8 h of ad libitum consumption, followed a similar pattern, demonstrating

Chapter 4: Particle size preference in laying hen
82
that the composition of the sieving fractions of the diet did not affect the preference
behavior of the hens for coarse particles. When allowed to choose, and no extra quantities
of feed are added to the feeder during the experimental period, hens showed a clear
preference for consuming coarse particles. Crude protein content of the different sieve
fractions, did not affect hen preference behavior. In fact, hens did not show any
preference for consuming extra amounts of protein during the early part of the day. In
contrast, Ca intake of the hens was reduced during the morning, resulting in residual
feeds with greater concentration of ash and Ca than in the original diets, irrespective of
the size of the feed fractions. It should be noticed that in the current research hens were
offered at all times the leftovers of the previous feeding periods, reducing its potential
capacity to choose coarse particles. Hen preference behavior might be different under
commercial conditions, when the residuals are remixed constantly with new feed coming
from the auger and the hens are obliged often to consume the fine particles previously
refused.

Chapter 4: Particle size preference in laying hen
83
Table 1. Particle size distribution and geometric mean diameter (GMD) and Log normal SD (GSD) of the
main ingredients1
Soybean meal
(47% CP)
Sunflower meal
(34% CP)
Calcium carbonate
Powder Granular
Sieve diameter, µm
5,000 0.0 0.5 0.0 0.2
2,500 3.6 3.6 0.1 29.2
1,250 36.0 18.5 18.5 70.3
630 47.7 34.6 35.2 0.2
315 10.2 27.3 23.4 0.0
160 1.4 11.8 14.8 0.0
80 0.7 3.2 6.0 0.1
40 0.4 0.5 1.9 0.0
0 0.0 0.0 0.1 0.0
GMD 1,069 699 597 2,166
GSD 1.79 2.23 2.31 1.39 1Measured in the original ingredients before the manufacturing of the diets.

Chapter 4: Particle size preference in laying hen
84
Table 2. Ingredient composition and chemical analyses (% as fed basis) of the experimental diets
Corn Barley
Ingredient
Corn 45.00 12.50
Barley 8.80 45.00
Soybean meal, 47% CP 20.80 25.20
Sunflower meal, 34% CP 10.00 1.20
Soy oil soapstock 4.70 5.30
Dicalcium phosphate 1.49 1.42
Calcium carbonate (powder) 4.11 4.18
Calcium carbonate (granular size) 4.11 4.18
Sodium chloride 0.35 0.35
DL-methionine, 99% 0.14 0.17
Vitamin and mineral premix1 0.50 0.50
Calculated analyses2
AMEn (Kcal/kg) 2,750 2,750
Crude fiber 4.40 3.60
Digestible amino acids2
Lys 0.80 0.80
Met 0.35 0.35
Met + cys 0.59 0.59
Thr 0.56 0.56
Determined analyses3
Dry matter 89.60 90.30
Gross energy (Kcal/kg) 4,305 4,290
Crude protein 17.70 17.90
Neutral detergent fiber 10.00 11.30
Ether extract 7.10 7.50
Linoleic acid (C18:2) 3.75 3.40
Ash 12.30 12.80
Calcium 3.85 3.94
Total phosphorus 0.65 0.62 1Provided the following (per kilogram of diet): vitamin A (trans-retinyl acetate), 10,000 IU; vitamin D3
(cholecalciferol), 3,750 IU; vitamin E (dl-α-tocopheryl acetate), 10 mg; vitamin B1, 1.3 mg; vitamin B2, 5 mg;
vitamin B6, 2 mg; vitamin B12 (cyanocobalamin), 13 mg; niacin, 25 mg; pantothenic acid (d-calcium pantothenate),
10 mg; folic acid, 1 mg; biotin, 0.13 mg; choline (choline chloride), 250 mg; manganese (MnO), 90 mg; zinc (ZnO),
65 mg; iron (FeSO4.H2O), 40 mg; copper (CuSO4 5H2O), 8 mg; iodine [Ca(IO3)2], 0.7 mg; selenium (Na2SeO3), 0.3
mg; Roxazyme, 200 mg [1,600 U of endo-1,4-β-glucanase (EC 3.2.1.4), 3,600 U of endo-1,3 (4)-β-glucanase (EC
3.2.1.6), and 5,200 U of endo-1,4-β-xylanase (EC 3.2.1.8)] supplied by DSM S.A., Madrid, Spain; Natuphos 5,000
(300 FTU/kg supplied by Basf Española, S.A., Tarragona, Spain), 60 mg. 2According to FEDNA (2010). 3Data correspond to the average of duplicate analyses of the 5 diets ground with different screen size of each
cereal. Within each cereal type, the determined chemical analyses were similar for all the diets (CV below 5%),
independent of the screen size.
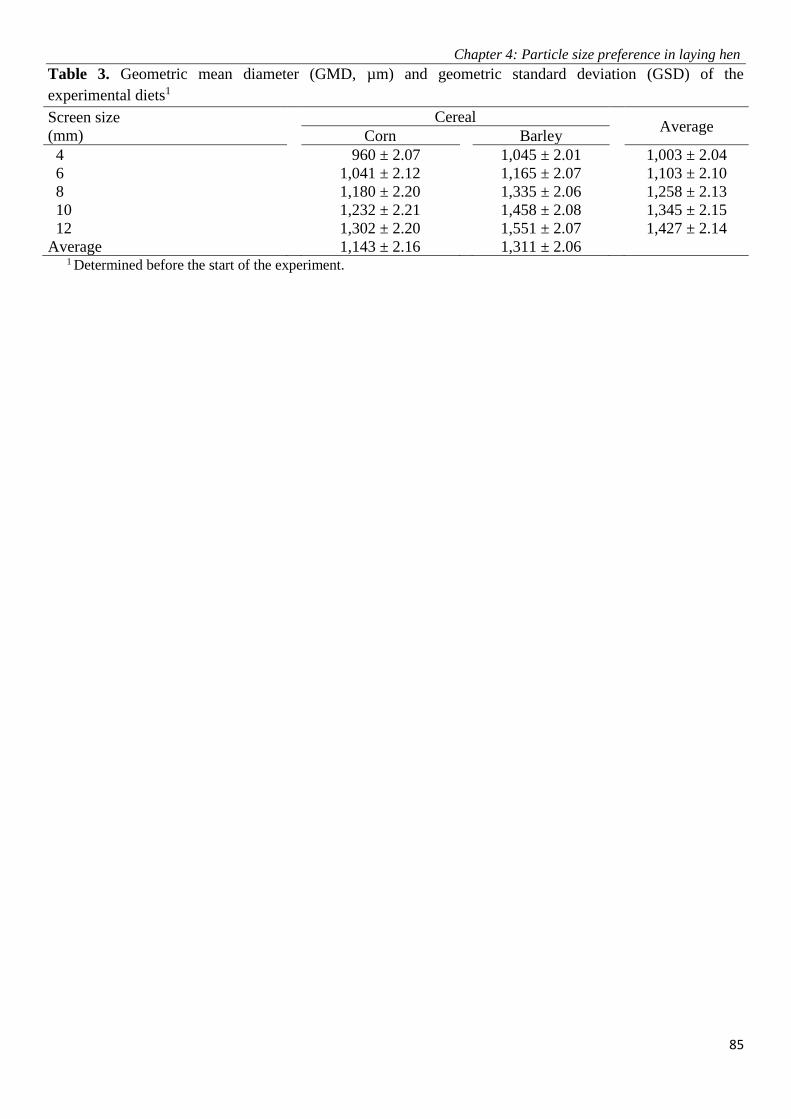
Chapter 4: Particle size preference in laying hen
85
Table 3. Geometric mean diameter (GMD, µm) and geometric standard deviation (GSD) of the
experimental diets1
Screen size
(mm)
Cereal Average
Corn Barley
4 960 ± 2.07 1,045 ± 2.01 1,003 ± 2.04
6 1,041 ± 2.12 1,165 ± 2.07 1,103 ± 2.10
8 1,180 ± 2.20 1,335 ± 2.06 1,258 ± 2.13
10 1,232 ± 2.21 1,458 ± 2.08 1,345 ± 2.15
12 1,302 ± 2.20 1,551 ± 2.07 1,427 ± 2.14
Average 1,143 ± 2.16 1,311 ± 2.06 1 Determined before the start of the experiment.
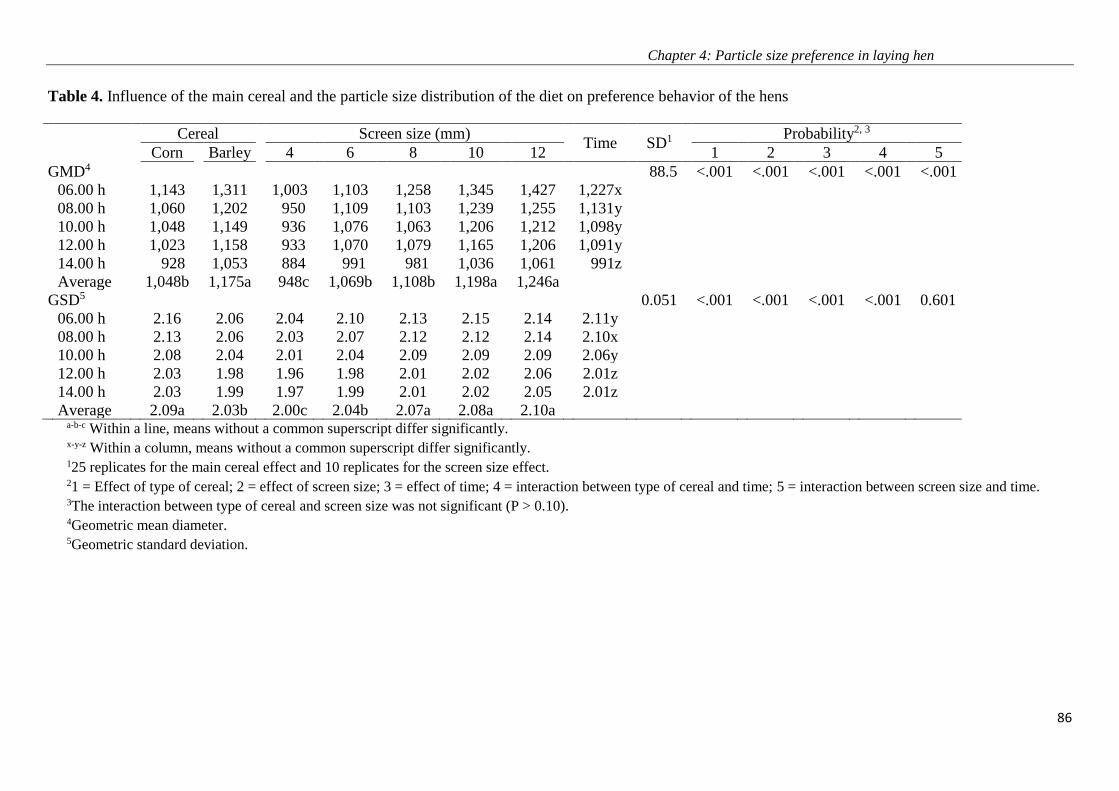
Chapter 4: Particle size preference in laying hen
86
Table 4. Influence of the main cereal and the particle size distribution of the diet on preference behavior of the hens
Cereal Screen size (mm)
Time SD1
Probability2, 3
Corn Barley 4 6 8 10 12
1 2 3 4 5
GMD4
88.5
<.001 <.001 <.001 <.001 <.001
06.00 h
1,143 1,311 1,003 1,103 1,258 1,345 1,427
1,227x
08.00 h
1,060 1,202 950 1,109 1,103 1,239 1,255
1,131y
10.00 h
1,048 1,149 936 1,076 1,063 1,206 1,212
1,098y
12.00 h
1,023 1,158 933 1,070 1,079 1,165 1,206
1,091y
14.00 h
928 1,053 884 991 981 1,036 1,061
991z
Average
1,048b 1,175a 948c 1,069b 1,108b 1,198a 1,246a
GSD5
0.051
<.001 <.001 <.001 <.001 0.601
06.00 h
2.16 2.06 2.04 2.10 2.13 2.15 2.14
2.11y
08.00 h
2.13 2.06 2.03 2.07 2.12 2.12 2.14
2.10x
10.00 h
2.08 2.04 2.01 2.04 2.09 2.09 2.09
2.06y
12.00 h
2.03 1.98 1.96 1.98 2.01 2.02 2.06
2.01z
14.00 h
2.03 1.99 1.97 1.99 2.01 2.02 2.05
2.01z
Average
2.09a 2.03b 2.00c 2.04b 2.07a 2.08a 2.10a
a-b-c Within a line, means without a common superscript differ significantly. x-y-z Within a column, means without a common superscript differ significantly. 125 replicates for the main cereal effect and 10 replicates for the screen size effect. 21 = Effect of type of cereal; 2 = effect of screen size; 3 = effect of time; 4 = interaction between type of cereal and time; 5 = interaction between screen size and time. 3The interaction between type of cereal and screen size was not significant (P > 0.10). 4Geometric mean diameter. 5Geometric standard deviation.

Chapter 4: Particle size preference in laying hen
87
Table 5. Crude protein content (%) of the sieved fractions of the original diets at the start of the experiment
(06.00 h) and of the residual feeds at the end of the experiment (14.00 h)
Original diet1
Main cereal Corn Barley
Screen size (mm) 4 6 8 10 12 4 6 8 10 12
Sieve diameter, μm
160 15.0 14.7 15.1 15.5 16.0 13.0 13.4 13.7 14.3 16.9
315 15.9 16.6 16.2 17.1 19.3 14.6 14.6 16.0 16.2 18.3
630 17.4 18.4 19.3 20.9 20.9 17.9 18.4 19.0 21.2 21.6
1,250 17.4 17.6 19.8 18.8 18.5 18.9 18.2 19.1 21.0 18.9
2,500 19.9 19.5 12.3 11.4 10.1 19.4 15.2 13.4 11.0 9.8
Pooled fractions
Fine fraction2 15.5 15.7 15.7 16.3 17.7 13.8 14.0 14.9 15.3 17.6
Coarse fraction3 18.6 18.5 16.1 15.1 14.3 19.2 16.7 16.3 16.0 14.4
Residual feed4
Main cereal Corn Barley
Screen size (mm) 4 6 8 10 12 4 6 8 10 12
Sieve diameter, μm
160 14.1 15.0 15.7 15.5 15.7 12.4 12.8 13.2 13.4 13.5
315 16.3 17.7 18.1 17.4 19.2 14.9 16.6 17.1 17.6 19.5
630 19.4 20.1 20.6 21.0 22.2 19.2 21.4 21.2 23.5 23.5
1,250 19.0 18.3 18.7 19.9 17.9 18.8 18.9 18.9 18.7 19.4
2,500 15.1 13.7 15.9 13.2 12.1 14.7 12.4 15.0 13.9 13.8
Pooled fractions
Fine fraction 15.2 16.4 16.9 16.5 17.5 13.7 14.7 15.2 15.5 16.5
Coarse fraction 17.1 16.0 17.3 16.6 15.0 16.8 15.7 17.0 16.3 16.6 1The analyzed CP content was 17.7% and 17.9% for the corn and barley diets, respectively. 2The fine fraction was defined as the proportion of particles with a geometric mean diameter no more than 315 µm. 3The coarse fraction was defined as the proportion of particles with a geometric mean diameter of at least 1,250
µm. 4The feed remaining in the feeders of all the replicates of each of the 10 experimental diets was collected and
pooled by treatment. Consequently, only average data are presented.
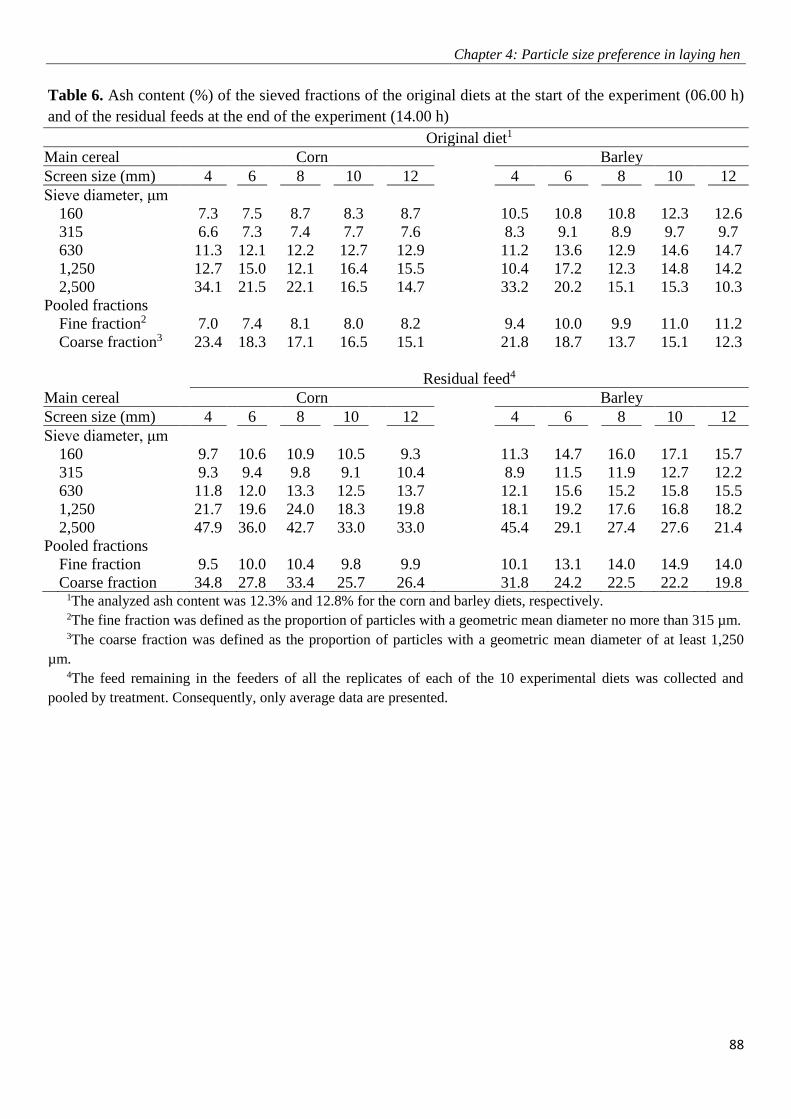
Chapter 4: Particle size preference in laying hen
88
Table 6. Ash content (%) of the sieved fractions of the original diets at the start of the experiment (06.00 h)
and of the residual feeds at the end of the experiment (14.00 h)
Original diet1
Main cereal Corn Barley
Screen size (mm) 4 6 8 10 12 4 6 8 10 12
Sieve diameter, μm
160 7.3 7.5 8.7 8.3 8.7 10.5 10.8 10.8 12.3 12.6
315 6.6 7.3 7.4 7.7 7.6 8.3 9.1 8.9 9.7 9.7
630 11.3 12.1 12.2 12.7 12.9 11.2 13.6 12.9 14.6 14.7
1,250 12.7 15.0 12.1 16.4 15.5 10.4 17.2 12.3 14.8 14.2
2,500 34.1 21.5 22.1 16.5 14.7 33.2 20.2 15.1 15.3 10.3
Pooled fractions
Fine fraction2 7.0 7.4 8.1 8.0 8.2 9.4 10.0 9.9 11.0 11.2
Coarse fraction3 23.4 18.3 17.1 16.5 15.1 21.8 18.7 13.7 15.1 12.3
Residual feed4
Main cereal Corn Barley
Screen size (mm) 4 6 8 10 12 4 6 8 10 12
Sieve diameter, μm
160 9.7 10.6 10.9 10.5 9.3 11.3 14.7 16.0 17.1 15.7
315 9.3 9.4 9.8 9.1 10.4 8.9 11.5 11.9 12.7 12.2
630 11.8 12.0 13.3 12.5 13.7 12.1 15.6 15.2 15.8 15.5
1,250 21.7 19.6 24.0 18.3 19.8 18.1 19.2 17.6 16.8 18.2
2,500 47.9 36.0 42.7 33.0 33.0 45.4 29.1 27.4 27.6 21.4
Pooled fractions
Fine fraction 9.5 10.0 10.4 9.8 9.9 10.1 13.1 14.0 14.9 14.0
Coarse fraction 34.8 27.8 33.4 25.7 26.4 31.8 24.2 22.5 22.2 19.8 1The analyzed ash content was 12.3% and 12.8% for the corn and barley diets, respectively. 2The fine fraction was defined as the proportion of particles with a geometric mean diameter no more than 315 µm. 3The coarse fraction was defined as the proportion of particles with a geometric mean diameter of at least 1,250
µm. 4The feed remaining in the feeders of all the replicates of each of the 10 experimental diets was collected and
pooled by treatment. Consequently, only average data are presented.
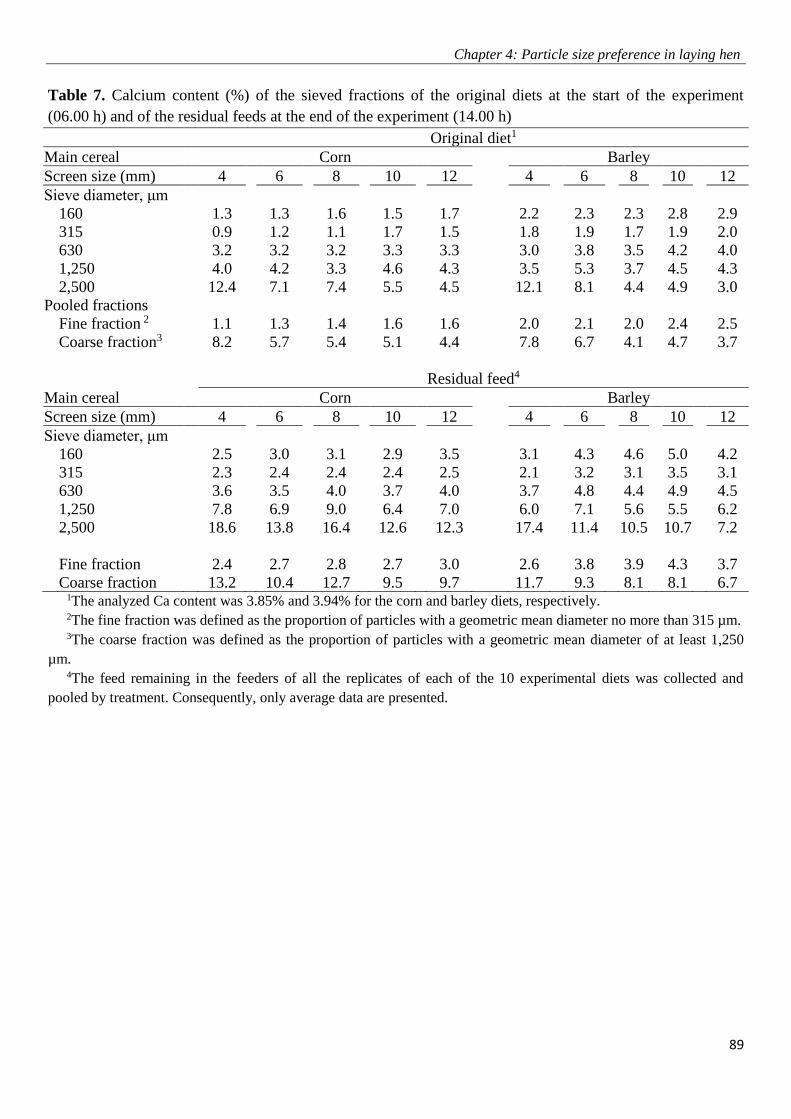
Chapter 4: Particle size preference in laying hen
89
Table 7. Calcium content (%) of the sieved fractions of the original diets at the start of the experiment
(06.00 h) and of the residual feeds at the end of the experiment (14.00 h)
Original diet1
Main cereal Corn Barley
Screen size (mm) 4 6 8 10 12 4 6 8 10 12
Sieve diameter, μm
160 1.3 1.3 1.6 1.5 1.7 2.2 2.3 2.3 2.8 2.9
315 0.9 1.2 1.1 1.7 1.5 1.8 1.9 1.7 1.9 2.0
630 3.2 3.2 3.2 3.3 3.3 3.0 3.8 3.5 4.2 4.0
1,250 4.0 4.2 3.3 4.6 4.3 3.5 5.3 3.7 4.5 4.3
2,500 12.4 7.1 7.4 5.5 4.5 12.1 8.1 4.4 4.9 3.0
Pooled fractions
Fine fraction 2 1.1 1.3 1.4 1.6 1.6 2.0 2.1 2.0 2.4 2.5
Coarse fraction3 8.2 5.7 5.4 5.1 4.4 7.8 6.7 4.1 4.7 3.7
Residual feed4
Main cereal Corn Barley
Screen size (mm) 4 6 8 10 12 4 6 8 10 12
Sieve diameter, μm
160 2.5 3.0 3.1 2.9 3.5 3.1 4.3 4.6 5.0 4.2
315 2.3 2.4 2.4 2.4 2.5 2.1 3.2 3.1 3.5 3.1
630 3.6 3.5 4.0 3.7 4.0 3.7 4.8 4.4 4.9 4.5
1,250 7.8 6.9 9.0 6.4 7.0 6.0 7.1 5.6 5.5 6.2
2,500 18.6 13.8 16.4 12.6 12.3 17.4 11.4 10.5 10.7 7.2
Fine fraction 2.4 2.7 2.8 2.7 3.0 2.6 3.8 3.9 4.3 3.7
Coarse fraction 13.2 10.4 12.7 9.5 9.7 11.7 9.3 8.1 8.1 6.7 1The analyzed Ca content was 3.85% and 3.94% for the corn and barley diets, respectively. 2The fine fraction was defined as the proportion of particles with a geometric mean diameter no more than 315 µm. 3The coarse fraction was defined as the proportion of particles with a geometric mean diameter of at least 1,250
µm. 4The feed remaining in the feeders of all the replicates of each of the 10 experimental diets was collected and
pooled by treatment. Consequently, only average data are presented.
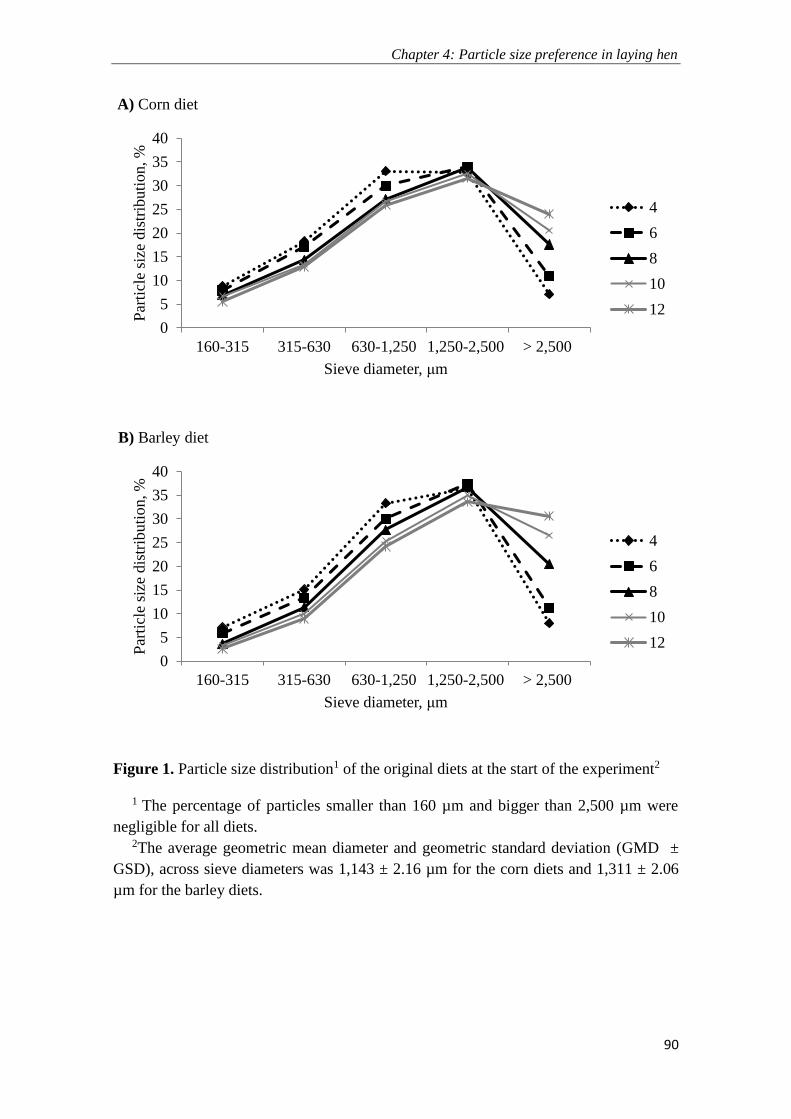
Chapter 4: Particle size preference in laying hen
90
Figure 1. Particle size distribution1 of the original diets at the start of the experiment2
1 The percentage of particles smaller than 160 µm and bigger than 2,500 µm were
negligible for all diets. 2The average geometric mean diameter and geometric standard deviation (GMD ±
GSD), across sieve diameters was 1,143 ± 2.16 µm for the corn diets and 1,311 ± 2.06
µm for the barley diets.
0
5
10
15
20
25
30
35
40
160-315 315-630 630-1,250 1,250-2,500 > 2,500
Par
ticl
e si
ze d
istr
ibu
tio
n, %
Sieve diameter, μm
A) Corn diet
4
6
8
10
12
0
5
10
15
20
25
30
35
40
160-315 315-630 630-1,250 1,250-2,500 > 2,500
Par
ticl
e si
ze d
istr
ibuti
on, %
Sieve diameter, μm
B) Barley diet
4
6
8
10
12

Chapter 4: Particle size preference in laying hen
91
A) Geometric mean diameter (GMD, µm)
B) Geometric standard deviation (GSD, µm)
Figure 2. Interaction between the main cereal of the diet and sampling time on
geometric mean diameter (GMD) and Log normal SD (GSD) of the diets
800
900
1000
1100
1200
1300
1400
06.00 a.m 08.00 a.m. 10.00 a.m. 12.00 a.m. 02.00 p.m
GM
D,
μm
Time, h
P < 0.001
SD = 88.5
Corrn
Barley
1.80
1.85
1.90
1.95
2.00
2.05
2.10
2.15
2.20
06.00 a.m 08.00 a.m. 10.00 a.m. 12.00 a.m. 02.00 p.m
GS
D, μ
m
Time, h
P < 0.001
SD = 0.051
Corrn
Barley

Chapter 4: Particle size preference in laying hen
92
Figure 3. Interaction between the screen size (mm) used to grind the cereal and
sampling time on the geometric mean diameter (GMD) of the diet
800
900
1000
1100
1200
1300
1400
1500
1600
06.00 a.m 08.00 a.m. 10.00 a.m. 12.00 a.m. 02.00 p.m
GM
D (
μm
)
Time (h)
P <0.001
SD = 88.5
4
6
8
10
12
93
CHAPTER 5:
GENERAL DISCUSSION AND CONCLUSIONS

Chapter 5: General discussion and conclusions
94
1. General discussion
The aim of this thesis was to gain scientific insights on the use of the most
available cereals (corn, wheat, and barley), ground at different particle size, in diets for
laying hens. In all the experiments exogenous enzymes complexes were used as a
supplement of the diets. In this chapter, the main findings of the three experiments
conducted are combined to generate a general discussion.
1.1. Main cereal
1.1.1. Influence on hen production
In experiment 1, egg production, egg mass, ADFI, BW gain, and FCR were not
affected by the main cereal of diet (corn, wheat, and barley) from 33 to 65 wk of age.
Similarly, in experiment 2, the main cereal of the diet (corn vs. barley) did not affect
egg production, ADFI, FCR, or BW gain of brown-egg laying hens from 17 to 49 wk of
age. Similarly, FI was not affected by the main cereal of diet (corn vs. barley) as
indicated in experiment 3, confirming previous results. All these data are in agreement
with previous studies (Craig and Goodman, 1993; Safaa et al., 2009; Pérez-Bonilla et
al., 2011). Safaa et al. (2009) did not observe any effect on productive performance of
layers from 20 to 48 wk of age when 50% corn was substituted by wheat. Similarly,
Pérez-Bonilla et al. (2011) reported that the substitution of 45% of corn by the same
amount of wheat or barley did not affect productive performance of brown-egg laying
hens from 22 to 54 wk of age. In contrast, Coon et al. (1988) reported higher FI and
poorer FCR per kilogram of eggs in hens fed barley based diets than in hens fed corn
based diets, although in this research diets were not supplemented with an adequate
exogenous enzyme complex. Also, Pérez-Bonilla et al. (2014) reported greater FI in
brown-egg laying hens fed corn and wheat than in hens fed barley from 24 to 59 wk of
Chapter 5: General discussion and conclusions
95
age, although in this research none of the other production traits was affected by the
main cereal of the diet.
In the current experiment, all diets, including those based on corn, were
supplemented with exogenous carbohydrases and therefore, no effect of NSP content of
the diet on productive performance was expected. Lázaro et al. (2003a) reported in
SCWL hens that corn could be substituted by high soluble fiber content cereals (wheat,
barley, or rye) without any negative effect on performance. These authors observed also
that the supplementation of the wheat, barley, and rye diets with enzymes (a
combination of β-glucanases and xylanases) improved nutrient digestibility, probably
because of the decrease in digesta viscosity caused by enzyme supplementation. Lillie
and Denton (1968) reported also similar production and FCR in SCWL fed diets based
on corn, wheat, or barley, even though in this report no enzyme were added to the diet.
Because of its higher content in NSP, barley and wheat are less uniform in chemical
composition and nutritive value than corn (Jacob and Pescatore, 2012). Consequently,
under commercial practices the use of corn tends to favor poultry performance
compared with the use of wheat or barley. However, the potential differences in
nutritive value among cereals are reduced and even disappear when the small, white
grain based diets are supplemented with an adequate exogenous enzyme complex
(Lázaro et al., 2003a; Gracia et al., 2003; Pérez-Bonilla et al., 2011).
In experiments 1 and 2, the only variable affected by the main cereal of the diet
was egg weight that was heavier for hens fed barley than for hens fed corn. The
scientific information available on the effects of the main cereal of the diet on egg
weight is limited and conflicting (Coon et al., 1988; Lázaro et al., 2003a, Pérez-Bonilla
et al., 2011). For example, Nahashon et al. (1994) and Lázaro et al. (2003a) reported
heavier eggs in hens fed barley than in hens fed corn, results that are consistent with the
Chapter 5: General discussion and conclusions
96
data of the current research. However, Pérez-Bonilla et al. (2011) reported similar egg
weight when corn was substituted by wheat or barley as the main ingredient of the diet
in brown-egg laying hens from 22 to 54 wk of age. Mathlouthi et al. (2002) reported
also similar egg weight when wheat was substituted by barley as the main ingredient of
the diet of white laying hens from 28 to 40 wk of age. In contrast, Coon et al. (1988)
reported heavier eggs in hens fed corn than in hens fed barley as the main ingredient of
the diet in white hens from 36 to 64 wk of age. Total sulfur AA, linoleic acid (LNL),
and supplemental fat are the main dietary factors affecting egg weight in commercial
layer operations (Coon et al., 1988; Grobas et al., 1999a; Safaa et al., 2008). In this
respect, Coon et al. (1988) reported that eggs from hens fed barley diets with lower
lysine and methionine that was 0.68% and 0.29% respectively, were about 1 g lighter
than weights of eggs from layers fed the corn and a second barley diets in hens from 36
to 64 wk of age. In the current experiments, the contents in TSAA and all others
indispensable AA of the diets was above recommendations (FEDNA, 2008; Lohmann,
2016) and the LNL content was also in excess of hen requirements for optimal hen
productivity (Grobas et al., 1999a). Consequently, no effect of an excess of TSAA or
LNL on egg production was expected. In experiments 1 and 2 of the current thesis, the
levels of supplemental fat was higher for the barley- than for the corn diet (4.9% vs.
1.8% in experiment 1 and 5.3% vs. 4.7% in experiment 2) which might have resulted in
heavier in eggs (Pérez-Bonilla et al., 2011). The results of the current experiments
confirm that wheat and barley, supplemented with adequate enzymes, are a good
alternative to corn in diets for brown-egg laying hens.
1.1.2. Influence on egg quality traits
The effects of the main cereal of the diet on egg quality traits were studied in
experiments 1 and 2. The hypothesis was that the inclusion of barley and wheat in the

Chapter 5: General discussion and conclusions
97
diet in substitution of corn could not affect any of the variables studied, except the
incidence of dirty eggs that could increase and yolk color that could reduced. However,
in none of the two experiments the cereal used affected any of the egg quality traits
studied, including HU, yolk color, shell strength, shell thickness, and shell color. To
notice that in the current researches, an enzyme complex and adequate amounts of
canthaxantin and β-apo-8-carotenoic, yellow and red pigments, were added to the diets
as needed, and therefore no effects of diet on the percentage of dirty eggs or yolk color
were expected. In experiment 1, the only quality traits affected were the percentage of
undergrades and of dirty eggs, that tended to be higher in hens fed corn and wheat than
in hens fed barley, and the number of broken eggs that tended to be greater in hens fed
the barley diet. Francesch et al. (1995) reported that the inclusion of barley and wheat in
diets without any enzyme supplementation, increased the incidence of dirty eggs
compared with the inclusion of corn. The available information on the effect of the main
cereal of the diet on egg quality traits, other than incidence of dirty eggs, is scarce. To
our knowledge, the only reports available comparing egg quality in hens fed these 3
cereals are those of Lázaro et al. (2003a) and Pérez-Bonilla et al. (2011). Lázaro et al.
(2003a) reported that hens fed barley or wheat based diets showed an increase in the
percentage of dirty eggs compared with hens fed a control corn diet. However, none of
the other quality traits studied (shell weight, percentage of shell-less, and HU) was
affected. The authors reported that when an enzyme complex was added to the wheat
and barley diets, the incidence of dirty eggs decreased to levels similar to those found
for the corn diet. In this respect, Mathlouthi et al. (2002), Lázaro et al. (2003b, 2004),
and García et al. (2008) reported that enzymes reduced intestinal viscosity in poultry,
improving the consistency of the excreta, and thus, reducing or even eliminating the
incidence of dirty eggs. Pérez-Bonilla et al. (2011) observed that the substitution of corn

Chapter 5: General discussion and conclusions
98
by wheat and barley in enzyme supplemented diets fed to brown-egg laying hens from
22 to 54 wk of age did not affect any of the egg quality traits studied (HU, shell
thickness, shell density, and number of undergrads eggs) except yolk color, that was
higher for hens fed corn than for hens fed wheat or barley. Moreover, Çiftci et al. (2003)
and Safaa et al. (2009) reported that the substitution of corn by wheat in enzyme
supplemented diets did not affect any egg quality trait in SCWL or brown-egg laying
hens, respectively. Also, Jamroz et al. (2001) reported similar egg quality in hens fed
wheat or barley diets supplemented with enzymes
1.1.3. Influence on gastrointestinal tract development and body measurements
The effect of the main cereal of the diet on GIT traits was studied in experiment
2, exclusively. The authors have not found any published report on the effects of the
main cereal of the diet on GIT measurements in brown-egg layer hens to compare with
the data of the current research. In this experiment the relative weight of the GIT and
the gizzard at 49 wk of age was greater in hens fed the barley diets than in hens fed the
corn diets. However, none of the others GIT traits studied (proventriculus and liver
weights) was affected by the main cereal of the diet. The GMD of the diets was greater
for the barley than for the corn feeds (1,311 vs. 1,143 µm) and coarser particles are
associated with greater development of the gizzard in broilers (Nir et al., 1994a) and
pullets (Saldaña et al., 2015b). Also, the NDF content was higher (11.3 vs. 10.4%) in
the barley than in the corn diets and consequently, barley feeding might stimulate more
the muscular layers of the gizzard and the development of the GIT than corn feeding
(González-Alvarado et al., 2007; Mateos et al., 2012; Sacranie et al., 2012).
Body mass index (BMI), body length, and tarsus length are useful criteria to
evaluate body size and predict future performance of broilers (Mendes et al., 2007; Van
Roovert-Reijrink, 2013), pullets (Saldaña et al., 2015b), and layers (Guzmán et al.,

Chapter 5: General discussion and conclusions
99
2016). In experiment 2, none of these traits was affected by the main cereal of the diet.
The only report available comparing the relative length of the pullets and the tarsus in
pullets fed the corn or wheat diets is that of Saldaña et al. (2015b). These authors
reported that the relative length of the pullets tended to be higher in birds fed corn than
in birds fed wheat at 5 and 17 wk of age. However, tarsus length was not affected. The
authors have not found any published report on the effects of the main cereal of the diet
on hens or tarsus length to compare with the results reported herein.
1.2. Particle size
1.2.1. Influence on hen production
The effects of the particle size of the diet on productive performance of the hens
were studied in experiments 1, 2, and 3. In all these experiments, the GMD of three
cereals increased as the screen size used to grind the ingredient increased but the
magnitude of the increase was greater for barley and wheat than for corn, in agreement
with data of Pérez-Bonilla et al. (2011). The glumes of barley are coarser and flexible
and also, barley grains have higher NDF content than corn. Consequently, the chances
of the different fractions of barley passing intact through the screen increased compared
with corn, resulting in an increase in the GMD of the diet. Safaa et al. (2009) reported
that the GMD of wheat was greater than that of corn when both cereals were hammer
milled through an 8 or a 10-mm screen. In contrast, the GSD was higher for the corn
and wheat diets than for the barley diets in these experiments, in agreement with data of
Pérez-Bonilla et al. (2011, 2014) comparing different cereals in diets for laying hens.
The data suggest that the structure of the feed (mean particle size and uniformity)
depends not only of the size of the screen used for grinding but also of the
characteristics of the ingredient (i.e., cereal) used.

Chapter 5: General discussion and conclusions
100
The effect of particle size of the diet on poultry production is a subject of debate.
The authors have not found any scientific report in the literature comparing the
influence of particle size of corn, wheat, and barley on production of brown-egg laying
hens. In experiment 2, from 17 to 49 wk of age, the screen size used to grind the cereals
(corn or barley) did not affect any of the production traits studied, except for FCR that
tended to increase in hens fed the cereals ground with a 4- mm screen compared with
the average of hens fed the 6- to 12-mm screen ground cereals. In experiment 1, from 33
to 65 wk of age, the screen size (6 mm vs. 10 mm) used to grind the cereal (corn, wheat
or barley) did not affect any of the production traits studied, in agreement with data of
Deaton et al. (1989) who did not observe any effect on ADFI, FCR, or egg production
in SCWL hens when fed diets based on coarse (873 μm) or fine (1,501μm) corn from 23
to 71 wk of age. Similarly, Maclsaac and Anderson (2007) reported that coarsely
ground corn and wheat (milled to pass through a 7-mm vs. a 5-mm screen) did not
affect egg production, egg weight, FI, or FCR of SCWL from 20 to 64 wk of age.
Moreover, Hamilton and Proudfoot (1995b) observed that BW, egg production, egg
weight, and FCR were not affected when diets based on coarse or fine soft wheat were
fed to SCWL from 20 to 70 wk of age. In any of the 3 experiments of this thesis, FI was
affected by the screen size used to grind the cereal. Most published research, however,
showed that hens had a preference for larger feed particles and that coarse grinding
increased voluntary FI in laying hens. In this respect, Safaa et al. (2009) observed a
2.5% increase in FI in hens fed corn or wheat ground with a 10-mm screen compared
with hens fed the same cereals ground with a 6-mm screen. In fact, many laying hen
management guides (i.e., Lohmann, 2016) recommend the use of coarse texture diets
when the objective is to maximize FI. It is worthy to notice that in experiment 3 (50 wk
of age) laying hens showed a clear preference for ingesting coarse particles from diets
Chapter 5: General discussion and conclusions
101
based on corn or barley, with differences being more notorious for the first hours after
feed provision. The reasons for the discrepancy among experiments is not apparent but
could be related to the proportion of very fine particles of the diet rather than to the
GMD. In experiments 2 and 3 less than 20% of the feed particles of the original diets
had a GMD of less than 0.5 mm, a percentage recommended as maximum by most
guidelines for maximizing FI in laying hens. Moreover, supplemental fat of the diets
might agglomerate the very fine particles, improving palatability and reducing the
rejection rate for fine particles and thus, limiting the preference of the hens for coarse
vs. fine particles. In fact, in these two experiments, the supplemental fat was high for
both corn and barley diets (4.7% and 5.3%, respectively) which might have reduced the
rejection of fine particles by the hen.
The data available on the effects of coarse particle size on nutrient digestibility
and FCR in poultry are contradictory with some research showing an improvement (Nir
et al., 1994a,b; Röhe et al., 2014; Ruhnke et al., 2015) and some research showing no
effects (Maclsaac and Anderson, 2007; Safaa et al., 2009). In experiment 2, FCR tended
to increase in hens fed the 4-mm screen ground diets compared with the average FCR of
the hens fed the other diets from 17 to 49 wk of age. Ouart et al. (1986) reported no
differences in FCR between SCWL hens fed diets based on coarse or fine wheat from
20 to 68 wk of age. In this respect, Amerah et al. (2007) suggested that coarse particles
increase the antiperistaltic movements in the GIT of the birds, leading to better mixing
and utilization of the nutrients. Also, a reduction in particle size increases the surface of
contact between nutrients and endogenous enzymes which might favor nutrient
digestibility. On the other hand, vitamins, minerals, and crystalline AA might
concentrate in the fine fraction of the diet. Consequently, a preference for coarse
particles affects the balance of nutrients ingested, which eventually might reduce egg

Chapter 5: General discussion and conclusions
102
weight and hen production. These opposite effects of particle size on feed efficiency
might counteract each other, and the final outcome might depend on factors such as
ingredient composition of the diet, age, management, and health status of the birds.
1.2.2. Influence on egg quality traits
The effects of particle size of the diet on egg quality were studied in experiments
1 and 2. In both experiments, an increase in the size of the screen used to grind the
cereal did not affect any of the egg quality traits studied, consistent with data of Safaa et
al. (2009) who observed that egg quality traits were similar in brown egg-laying hens
fed fine-, medium-, or coarse- ground corn and wheat diets from 20 to 48 wk of age.
Hamilton and Proudfoot (1995b) observed that specific gravity, HU, and percentage of
blood spots were similar in SCWL hens fed fine- or coarse-ground wheat diets from 20
to 70 wk of age. Moreover, Deaton et al. (1989) reported that an increase in the GMD of
a corn diet from 814 to 873 µm did not affect shell-breaking strength of the eggs from
23 to 71 wk of age. In contrast, Ouart et al. (1986) noticed that SCWL hens fed diets
based on coarsely ground wheat from 68 to 71 wk of age had lower egg-specific gravity
than hens fed diets based on finely ground wheat. Hafeez et al. (2015) indicated that
differences in albumen weight and shell quality due to particle size of the feed were in
all cases of little practical interest. Most of these authors recorded that the proportion of
shell, yolk, and albumen of the eggs were not affected by particle size. Consequently,
the screen size use to grind the cereal can be modified according to specific
requirements without any effect on egg quality.

Chapter 5: General discussion and conclusions
103
1.2.3. Influence on gastrointestinal tract development and body measurements
The effects of particle size of the diet on GIT development were studied in
experiment 2. None of the GIT traits was affected by the screen size, except gizzard
weight that increased as the screen size used to grind the cereal increased. Röhe et al.
(2014) observed that brown hens fed coarsely ground feeds showed heavier gizzards
than hens fed finely ground diets at 23 wk of age. The authors have not found any report
comparing the influence of particle size of corn, wheat, and barley on GIT development
of brown-egg laying hens but these observations agree with data of numerous studies
conducted in broilers (Nir et al., 1994a; Svihus et al., 2004; Amerah et al., 2007). The
reason for the increase in gizzard development is not known. The gizzard grinds feed
particles until reaching a consistent fine particle size, irrespective of the physical
characteristics and particle size distribution of the diet (Hetland et al., 2004). Fine
particles pass faster through the upper part of the GIT than coarse particles (Hetland et
al., 2002) and consequently, gizzard size and function will increase with coarse grinding
(Jiménez-Moreno et al., 2009b; Mateos et al., 2012). However, some authors showed
that coarser particles can pass the gizzard at some extent and enter the small intestine,
affecting negatively digestive efficiency of the bird (Lentle et al., 2006; Amerah et al.,
2007). Probably, particle density might be as important as particle size in this respect.
BMI, body length, and tarsus length and diameter are used to estimate BW of
broilers (Van Roovert-Reijrink, 2013), pullets (Saldaña et al., 2015b), and laying hens
(Guzmán et al., 2016). In the current research, none of these traits was affected by the
screen size used to grind the cereal, results that are consistent with the lack of effect of
the characteristics of the diets on BW gain. On the other hand, the significant positive
relation detected between BW and BMI, body length, and tarsus length and diameter,
confirm that these traits can be used at a certain extent, to estimate BW in hens.

Chapter 5: General discussion and conclusions
104
1.2.4. Influence on preference behavior
The effects of the particle size of the diet on preference behavior of the hens
were studied in experiment 3. We hypothesized that grinding size could affect
preference behavior in laying hens with effects that could depend on the physico-
chemical characteristics of the main cereal used. Also, it was hypothesized that
differences in the nutritional composition of the coarse and the fine fractions of the
diets, could affect the feeding behavior of the hens. Hens showed a significant
preference for coarser particles, an effect that was more evident when the cereals were
ground coarsely. In general, chickens are known to have a preference for larger feed
particles (Schiffman, 1968) which is observed at all ages (Portella et al., 1988a). Also, it
has been reported that particle size preference is thought to increase with age (Nir et al.,
1994a). This may be related to the size of the birds ‘gape’ (width of the beak), that
increases with age (Gentle, 1979). It is possible that the particle size be increase with
age is of important interest, for optimal poultry performance. The information available
on particle size preference by brown-egg laying hens is limited and contradictory.
Schiffman (1968) suggested that birds have a pecking preference for textured feed over
non-textured feed and that as they become older their preference for larger particles
increases. Portella et al. (1988a) suggested that the preference for coarse particles of the
laying hens might be altered not only by the average size but also by the proportion of
very fine particles. These authors reported also that the disappearance of small particles
was overwhelming when the feed had an excess of large particles (> 2.36 mm), but was
less obvious as the experiment progressed and the percentage of coarse particle was
reduced, consistent with the results of the current experiment. The data confirm that
when allowed to choose, laying hens show a clear preference for coarse particles.
Chapter 5: General discussion and conclusions
105
Also, a possible explanation for particle size preference could be that birds
selected particles sizes in order to obtain a balanced diet. When the diet is deficient in a
given nutrient, birds might choose to eat the sieving fraction that is richer in the
deficient nutrient (Portella et al., 1988a). As a result, hen preference might depend not
only on particle size but also on the physical distribution of the limiting nutrient or feed
component within the sieving fractions. In the current experiment, hens did not show
any preference for consuming those feed fractions with a greater proportion of CP, ash,
or Ca content. In fact, Ca concentration in the different feed fractions was in relative
terms, in-dependent of their size. Moreover, Ca content of the feed refusals increased
with time showing a dislike of the hens for eating Ca in the early hours of the day. This
observation deserves further attention because it might be related to differences in Ca
requirements of the hens along the day and the timing at which the feed was available
for consumption. Birds have a specific appetite for calcium, and thus, particle selection
by the hens may be influenced by the requirement in this nutrient. It has been suggested
that Ca and feed intake are regulated independently (Mongin and Sauveur 1979) and if
given a choice, laying hens are able to choose between different feed sources to regulate
their Ca intake (Holcombe et al. 1975). In this respect, Portella et al. (1988a) reported
that birds tend to regulate their Ca intake more efficiently when fine particles were fed
than when coarse particles are offered. When fed coarse diets, birds apparently ate large
particles which contained less Ca while smaller particles with higher Ca content were
less eagerly consumed. This may explain why in the current experiment the percentage
of Ca was higher in the residual feed than in the original diets. Hughes et al. (1972)
reported that laying hens tended to over-consume Ca late in the day, when most of the
shell formation process occurs, but tended to under-consume Ca during the morning. In
the evening, however, hens might try to balance Ca intake and Ca requirements, giving

Chapter 5: General discussion and conclusions
106
preference to those particles rich in the deficient nutrient, regardless of feed coarseness,
whereas an opposite pattern might occur during the morning. The data demonstrate that
under the condition of the current research, hen preference for coarse particles was not
modulated by the desire to meet any potential requirement for CP or Ca.
2. General conclusions
➢ Wheat and barley can be used in substitution of corn, at level of up to 45 %
in diets for brown-egg laying hens provided that the feed is supplemented
with adequate enzymes. Therefore, the use of one or other cereal will depend
on their relative purchasing cost.
➢ Eggs were heavier in hens fed barley than in hens fed wheat or corn,
probably because of differences in the level of supplemental fat, rather than
because of differences in linoleic acid content.
➢ Type of cereal and the screen size used to grind the cereal did not affect any
egg quality trait of the hens.
➢ Corn, wheat, and barley ground through a 6 to 12-mm screen can be used
indistinctly in commercial diets for laying hens, without any effect on hen
performance.
➢ An increase in screen size from (4 to 12 mm) improved gizzard development
in hens at 49 wk of age.
➢ Hens show a preference behavior for coarse particles, with differences that
are more pronounced when the feed is coarsely ground than when the feed is
finely ground.
Chapter 5: General discussion and conclusions
107
➢ The CP, ash, and Ca contents of the diet were not uniform and varied with
the diameter of the screen used to grind the cereal and also with the sieving
fractions (fine vs. coarse).
➢ Brown hens reduced Ca intake during the morning after the lights were
switch on, resulting in residual feeds with greater concentration of ash and
Ca than in the original diets, irrespective of the size of the feed fractions.
➢ Crude protein content of the different sieve fractions, did not affect hen
preference behavior. In fact, hens did not show any preference for
consuming extra amounts of protein during the early part of the day.
➢ The preference of hens for consuming coarse particle is not affected by the
desire of the hens to ingest faulty nutrients to meet their nutrient
requirements.
108
CHAPTER 6:
REFERENCES

Chapter 6: References
109
REFERENCES
Abdollahi, M. R., V. Ravindran, T. J. Wester, G. Ravindran, and D. V. Thomas. 2011.
Influence of feed form and conditioning temperature on performance, apparent
metabolisable energy and ileal digestibility of starch and nitrogen in broiler
starters fed wheat-based diet. Anim. Feed Sci. Technol. 168:88-99.
Abdollahi, M. R., V. Ravindran, and B. Svihus. 2013a. Pelleting of broiler diets: An
overview with emphasis on pellet quality and nutritional value. Anim. Feed Sci.
Technol. 179:1-23.
Abdollahi, M. R., V. Ravindran, and B. Svihus. 2013b. Influence of grain type and feed
form on performance, apparent metabolisable energy and ileal digestibility of
nitrogen, starch, fat, calcium and phosphorus in broiler starters. Anim. Feed Sci.
Technol. 186:193-203.
Abdollahi, M. R., Y. Duangnumsawang, R. P. Kwakkel, S. Steenfeldt, S. M. Bootwalla,
and V. Ravindran. 2016. Investigation of the interaction between separate calcium
feeding and phytase supplementation on growth performance, calcium intake,
nutrient digestibility and energy utilisation in broiler starters. Anim. Feed Sci.
Technol. 219:48-58.
Allen, J. and G. C. Perry 1977. Feeding patterns and food selection of caged birds. Br.
Vet. J. 133:99 (Abstr.).
Amerah, A.M., V. Ravindran, R. G. Lentle, and D. G. Thomas. 2007. Feed particle size:
implications on the digestion and performance of poultry. World’s Poult. Sci. J.
63:439-451.
Amerah, A. M., V. Ravindran, R. G. Lentle, and D. G. Thomas. 2008. Influence of feed
particle size on the performance, energy utilization, digestive tract development,
Chapter 6: References
110
and digesta parameters of broiler starters fed wheat- and corn- based diets. Poult.
Sci. 87:2320-2328.
AOAC International. 2005. Official Methods of Analysis of the AOAC International.
18th ed. AOAC Int., Gaithersburg, MD.
ASAE (American Society of Agriculture Engineers). 1995. Method of determining and
expressing fineness of feed material by sieving. Standard S319.2. In: Agriculture
Engineers Yearbook of Standard. ASAE, St Joseph, MO, pp. 461-462.
Baker, S., and T. Herrman. 2002. Evaluating particle size. MF-2051 feed
manufacturing, department of grain science and industry, Kansas State University.
Manhattan, KS.
Balnave, D. 1970. Essential fatty acids in poultry nutrition. World’s Poult. Sci. J.
26:442-460.
Balnave, D. 1971. Response of laying hens to dietary supplementation with
energetically equivalent amounts of maize starch or maize oil. J. Sci. Food Agric.
22:125-128.
Benabdeljelil, K. and M. I. Arbaoui. 1994. Effects of enzyme supplementation of
barley-based diets on hen performance and egg quality. Anim. Feed Sci. Technol.
48:325-334.
Berg, L. R., and G. E. Bearse. 1948. Studies of the granulation of chicken laying
mashes. Poult. Sci. 27:653 (Abstr.).
Berg, L. R. 1959. Enzyme supplementation of barley diets for laying hens. Poult. Sci.
38:1132-1139

Chapter 6: References
111
Boletín Oficial del Estado. 1995. Real Decreto 2257/1994 por el que se aprueba los
métodos oficiales de análisis de piensos o alimentos para animales y sus primeras
materias. BOE 52:7161-7237.
Boletín Oficial del Estado. 2007. Ley 32/2007 de 7 de Noviembre para el cuidado de los
animales, en su explotación, transporte, experimentación y sacrificio. BOE
268:45914-45920.
Brufau, J., R. Cos, A. Pérez-Vendrell, and E. Esteve-García. 1994. Performance of
laying hens as affected by the supplementation of a barley-based diet with a crude
enzyme preparation from Trichoderma viride. Can. J. Anim. Sci. 74:129-133.
Carré, B. 2000. Effet de la taille des particules alimentaires sur les processus digestifs
chez les oiseaux d’élevage. INRA Prod. Anim. 13:131-136.
Carré, B., N. Muley, J. Gomez, F. X. Oury, E. Laffite, D. Guillow, and C. Signoret.
2005. Soft wheat instead of hard wheat in pelleted diets results in high starch
digestibility in broiler chickens. Br. Poult. Sci. 46:66-74.
Chewning, C. G., C. R. Stark, and J. Brake. 2012. Effects of particle size and feed form
on broiler performance. J. Appl. Poult. Res. 21:830-837.
Çiftci, I., E. Yenice, and H. Eleroglu. 2003. Use of triticale alone and in combination
with wheat or maize: effects of diet type and enzyme supplementation on hen
performance, egg quality, organ weights, intestinal viscosity, and digestive system
characteristics. Anim. Feed Sci. Technol. 105:149-161.
Classen, H. L. 1996. Cereal grain starch and exogenous enzymes in poultry diets. Anim.
Feed Sci. Technol. 62:21-27.
Coon, C. N., I. Obi, and M. L. Hamre. 1988. Use of barley in laying hens diets. Poult.
Sci. 67:1306-1313.

Chapter 6: References
112
Cowieson, A. J. 2005. Factors that affect the nutritional value of maize for broilers.
Anim. Feed Sci. Technol. 119:293-305.
Cowieson, A. J., and O. Adeola. 2005. Carbohydrases, protease, and phytase have an
additive beneficial effect in nutritionally marginal diets for broiler chicks. Poult.
Sci. 84:126-141.
Craig, L.W. and T. Goodman. 1993. Utilization of feed enzymes in laying hen rations.
J. Appl. Poult. Res. 2:68-74.
Davis, R. L., E. G. Hill, H. J. Sloan, and G. M. Briggs. 1951. Detrimental effect of corn
of coarse particle size in rations for chicks. Poult. Sci. 30:325-328.
Deaton, J. W., B. D. Lott, and J. D. Simmons. 1989. Hammer mill versus roller mill
grinding of corn for commercial egg layer. Poult. Sci. 68:1342-1344.
De Coca-Sinova, A. D., G. Valencia, E. Jiménez-Moreno, J. M. González-Alvarado, R.
Lázaro, and G. G. Mateos. 2008. Apparent ileal digestibility of nitrogen, amino
acids, and energy of soybean meals from different origins in broilers. Poult. Sci.
87:2613-2623.
Douglas, J. H., T. W. Sullivan, P. L. Bond, F. J. Struwe, J. G. Baier, and L. G. Robeson.
1990. Influence of grinding, rolling, and pelleting on the nutritional value of grain
sorghums and yellow corn for broilers. Poult. Sci. 69:2150-2156.
Duke, G. E. 1992. Recent studies on regulation of gastric motility in turkeys. Poult. Sci.
81:1-8.
Edney, M. J., G. L. Campbell, and H. L. Classen. 1989. The effect of ß-glucanase
supplementation on nutrient digestibility and growth in broilers given diets
containing barley, oat groats or wheat. Anim. Feed Sci. Technol. 25:193-200.

Chapter 6: References
113
European Commission, 2017. EU market situation for eggs. Committee for the common
organization of the agricultural markets. http://ec.europa.eu/agriculture/markets
/indexen.htm. Accessed May 2017.
FAO, 2016. Food Agriculture Organization of the United Nations. Food outlook.
Biannual report on global food markets, issn 1560-8182 (online)
http://www.fao.org/. Accessed May 2017.
FEDNA (Fundación Española Desarrollo Nutrición Animal). 2008. Necesidades
Nutricionales para Avicultura: Pollos de Carne y Aves de Puesta. In: R. Lázaro,
and G. G. Mateos (Eds). Fund. Esp. Desarro. Nutr. Anim., Madrid, Spain.
FEDNA (Fundación Española Desarrollo Nutrición Animal). 2010. Normas FEDNA
para la Formulación de Piensos Compuestos. 3rd ed. In: C. de Blas, G. G. Mateos,
and P. G. Rebollar (Eds). Fund. Esp. Desarro. Nutr. Anim., Madrid, Spain.
Feedipedia. 2017. Animal Feed Resources Information System. Accessed July 2017.
http://www.feedipedia.org/.
Forbes, J. M., and F. S., Shariatmadari. 1994. Diet selection for protein by poultry.
Word’s Poult. Sci. J. 50:7-24.
Francesch, M., A. M. Pérez-Vendrell, E. Esteve-García, and J. Brufau. 1995. Enzyme
supplementation of a barley and sunflower-based diet on laying hen performance.
J. Appl. Poult. Res. 4:32-40.
Francesch, M., and L. Brufau. 2004. Nutritional factors affecting excreta/litter moisture
and quality. World's Poult. Sci. J. 60:64-75.
Francesch, M., J. Broza, and J. Brufau. 2005. Effects of an experimental phytase on
performance, egg quality, tibia ash content and phosphorus bioavailability in
laying hens fed on maize- or barley based diets. Br. Poult. Sci.46:340-348.

Chapter 6: References
114
Frikha, M., H.M. Safaa, M.P. Serrano, X. Arbe, and G.G. Mateos. 2009a. Influence of
the main cereal and feed form of the diet on performance and digestive tract of
brown-egg laying pullets. Poult. Sci. 88:994-1002.
Frikha, M., H. M. Safaa, E. Jiménez-Moreno, R. Lázaro, M. Serrano, G. G. Mateos.
2009b. Influence of energy concentration and feed form of the diet on growth
performance and digestive traits of brown egg-laying pullets from 1 to 120 days
of age. Anim. Feed Sci. Technol. 153:292-302.
Frikha, H., H. M. Safaa, M.P. Serrano, E. Jiménez-Moreno, R. Lázaro, and G. G.
Mateos. 2011. Influence of the main cereal in the diet and particle size of the
cereal on productive performance and digestive traits of brown-egg laying pullets.
Anim. Feed Sci. Technol. 164:106-115.
Gabriel, I., S. Mallet, M. Leconte, A. Travel, and J. P. Lalles. 2008. Effects of whole
wheat feeding on the development of the digestive tract of broiler chickens. Anim.
Feed Sci. Technol. 142:144-162.
García, M., R. Lázaro, M. A. Latorre, M. I. Gracia, and G. G. Mateos. 2008. Influence
of enzyme supplementation and heat processing of barley on digestive traits and
productive performance of broilers. Poult. Sci. 87:940-948.
Gentle, M. J. 1979. Sensory control of feed intake. In: Food Intake Regulation in
Poultry, (K. N. Boorman and B. M. Freeman, eds.). Edinburg: Br. Poult. Sci. Ltd,
pp. 259-273.
González-Alvarado, J. M., E. Jiménez-Moreno, R. Lázaro, and G. G. Mateos. 2007.
Effect of type of cereal, heat processing of the cereal, and inclusion of fiber in the
diet on productive performance and digestive traits of broilers. Poult. Sci.
86:1705-1715.

Chapter 6: References
115
González-Alvarado, J. M., E. Jiménez-Moreno, D. González-Sánchez, R. Lázaro, and
G. G. Mateos. 2010. Effect of inclusion of oat hulls and sugar beet pulp in the diet
on productive performance and digestive traits of broilers from 1 to 42 days of
age. Anim. Feed Sci. Technol. 162:37-46.
Gracia, M. I., M. A. Latorre, M. García, R. Lázaro, and G. G. Mateos. 2003. Heat
processing of barley and enzyme supplementation of diets for broilers. Poult. Sci.
82:1281-1291.
Grobas, S., J. Méndez, C. de Blas, and G. G. Mateos. 1999a. Influence of dietary
energy, supplemental fat and linoleic acid concentration on performance of laying
hens at two ages. Br. Poult. Sci. 40:681-687.
Grobas, S., G. G. Mateos, and J. Méndez. 1999b. Influence of dietary linoleic acid on
production and egg weight of eggs and egg components in young brown hens. J.
Appl. Poult. Res. 8:177-184.
Grobas, S., J. Méndez, C. de Blas, and G. G. Mateos. 1999c. Laying hen productivity as
affected by energy, supplemental fat, and linoleic acid concentration of the diet.
Poult. Sci. 78:1542-1551.
Gutiérrez-Alamo, A., P. Pérez de Ayala, M. W. A. Verstegen, L. A. Den Hartog, and M.
J. Villamide. 2008. Variability in wheat: factors affecting its nutritional value.
World’s Poult. Sci. J. 64:20-39.
Guzmán, P., B. Saldaña, M. V. Kimiaeitalab, J. García, and G. G. Mateos. 2015.
Inclusion of fiber in diets for brown-egg laying pullets: effects on growth
performance and digestive tract traits from hatching to 17 weeks of age. Poult.
Sci. 94:2722-2733.
Guzmán, P., B. Saldaña, O. Bouali, L. Cámara, and G. G. Mateos. 2016. Effect of level
of fiber of the rearing phase diets on egg production, digestive tract traits, and
Chapter 6: References
116
body measurements of brown egg-laying hens fed diets differing in energy
concentration. Poult. Sci. 95:1836-1847.
Hafeez, A., A. Mader, I. Röhe, I. Ruhnke, F. G. Boroojeni, M. S.Yousaf, K. Männer,
and J. Zentek. 2015. The effect of milling methods, thermal treatment, and
particle size of feed on exterior and interior egg quality in laying hens. Eur. Poult.
Sci. 79: ISSN 1612-9199. doi:10.1399/eps.2015.76.
Hamilton, R.M.G., and F. G. Proudfoot. 1995a. Ingredient particle size and feed texture
effects on the performance of broiler chickens. Anim. Feed Sci. Technol. 51:203-
210.
Hamilton, R.M.G., and F. G. Proudfoot. 1995b. Effects of ingredient particle size and
feed form on the performance of leghorn hens. Can. J. Anim. Sci. 75:109-114.
Hartini, S., M. Choct, G. Hinch, A. Kocher, and J. V. Nolan. 2002. Effects of light
intensity during rearing and beak trimming and dietary fiber sources on mortality,
egg production, and performance of Isa brown laying hens. J. Appl. Poult. Res.
11:104-110.
Herrera, J., B. Saldaña, P. Guzmán, L. Cámara, and G.G. Mateos. 2017. Influence of
particle size of the main cereal of the diet on egg production, gastrointestinal tract
traits, and body measurements of brown laying hens. Poult. Sci. 96:440-448.
Herrera, J., B. Saldaña, P. Guzmán, M. A. Ibáñez, H. Mandalawi, L. Cámara, and G. G.
Mateos. 2018. Particle size affects short term preference behavior of brown-egg
laying hens fed diets based on corn or barley. Poult. Sci. (In press).
Hetland, H., B. Svihus, and V. Olaisen. 2002. Effect of feeding whole cereals on
performance, starch digestibility and duodenal particle size distribution in broiler
chickens. Br. Poult. Sci. 43:416-423.

Chapter 6: References
117
Hetland H., B. Svihus, and Å. Krögdahl. 2003. Effects of oat hulls and wood shavings
on digestion in broilers and layers fed diets based on whole or ground wheat. Br.
Poult. Sci. 44:275-282.
Hetland, H., M. Choct, and B. Svihus. 2004. Role of insoluble non-starch
polysaccharide in poultry nutrition. World’s Poult. Sci. J. 60:415-422.
Holcombe, D. J., D. A. Roland, and R. H. Harms. 1975. The ability of hens to adjust
calcium intake when given a choice of diets containing two levels of calcium.
Poult. Sci. 54:552-561.
Hughes, B. O., and D. G. M. Wood-Gush. 1971. A specific appetite for calcium in
domestic chickens. Anim. Behav. 19:490-499.
Hughes, B. O., 1972. A circadian rhythm of calcium intake in the domestic fowl. Br.
Poult. Sci. 13:485-493.
ISA Brown. 1999. Energy levels and feed presentation for laying hens: effects on
performance and intake. Institut de Selection Animale. B. V, Boxmeer, The
Netherlands.
ISA Brown, 2009. Nutrition Management Guide. Institut de Selection Animale. B.V.
Boxmeer, The Netherlands.
ISA Brown. 2010. Nutrition Management Guide. Isa Brown Commercial Layer. Institut
de Selection Animale. B. V, Boxmeer, The Netherlands.
Jacob, J. P., and A. J. Pescatore. 2012. Using barley in poultry diets-A review. J. Appl.
Poult. Res. 21:915-940.
Jamroz, D., J. Skokupinska, J. Orda, A. Wiliczkiewicz, and A. M. Klunter. 2001. Use of
wheat, barley or triticale in feed for laying hens supplemented with carbohydrates
derived from Trichoderma longibrachiatum. J. Appl. Anim. Res. 19:255-263.

Chapter 6: References
118
Jensen, L. S., J. B. Allred, R. E. Fry, and J. McGinnis. 1958. Evidence for an
unidentified factor necessary for maximum egg weight in chickens. J. Nutr.
65:219-233.
Jiménez-Moreno, E., J. M. González-Alvarado, A. de Coca-Sinova, R. Lázaro, and G.
G. Mateos. 2009a. Effects of source of fiber on the development and pH of the
gastrointestinal tract of broilers. Anim. Feed Sci. Technol. 154:93-101.
Jiménez-Moreno, E., J. M. González-Alvarado, A. González-Serrano, R. Lázaro, and G.
G. Mateos. 2009b. Effect of dietary fiber and fat on performance and digestive
traits of broilers from one to twenty-one days of age. Poult. Sci. 88:2562-2574.
Jiménez-Moreno, E., J. M. González-Alvarado, R. Lázaro, and G. G. Mateos. 2009c.
Effects of type of cereal, heat processing of the cereal, and fiber inclusion in the
diet on gizzard pH and nutrient utilization in broilers at different ages. Poult. Sci.
88:1925-1933.
Jiménez-Moreno, E., J. M. González-Alvarado, D. González-Sánchez, R. Lázaro, G. G.
Mateos. 2010. Effects of type and particle size of dietary fiber on growth
performance and digestive traits of broilers from 1 to 21 days of age. Poult. Sci.
89: 2197-2212.
Jiménez-Moreno, E., A. De Coca-Sinova, J. M. González-Alvarado, and G. G. Mateos.
2016. Inclusion of insoluble fiber sources in mash or pellet diets for young
broilers. 1. Effects on growth performance and water intake. Poult. Sci. 95:41-52.
Jorgensen, H., X. Zhao, K. E. B. Knudsen, and B. O. Eggum. 1996. The influence of
dietary fibre source and level on the development of gastrointestinal tract,
digestibility and energy metabolism in broiler chickens. Br. J. Nutr. 75:379-395.

Chapter 6: References
119
Kim, S. M., M. B. Patel, S. J. Reddy, and J. McGinnis. 1976. Effects of different cereal
grains in diets for laying hens on production parameters and liver fat content.
Poult. Sci. 55:520-530.
Koch, K. 1996. Hammermills and rollermills. MF-2048 feed manufacturing. Dept.
Grain Sci. Ind. Kansas State University, Manhattan, KS.
Koch, B. K. 2008. Feed Mill Efficiency.16th Annual American Soybean Association.
International Marketing, S.E.A. Feed Technology and Nutrition Workshop,
Singapore, pp. 1-13.
Lázaro, R., M. García, M. J. Araníbar, and G.G. Mateos. 2003a. Effect of enzyme
addition to wheat-, barley- and rye-based diets on nutrient digestibility and
performance of laying hens. Br. Poult. Sci. 44:256-265.
Lázaro, R., M. García, P. Medel, and G.G. Mateos. 2003b. Influence of enzymes on
performance and digestive parameters of broilers fed rye-based diets. Poult. Sci.
82:132-140.
Lázaro, R., M. A. Latorre, P. Medel, M. I. Gracia, and G.G. Mateos. 2004. Feeding
regimen and enzyme supplementation to rye-based diets for broilers. Poult. Sci.
83:152-160.
Lentle, R. G., V. Ravindran, G. Ravindran, and D. V. Thomas. 2006. Influence of feed
particle size on the efficiency of broiler chickens fed wheat-based diets. Jpn.
Poult. Sci. 43:135-142.
Lillie, R. J., and C. A. Denton. 1968. Evaluation of four cereal grain and three protein
level combinations for layer performance. Poult. Sci. 47:1000-1004.
Lohmann. 2014. Management Guide for Lohmann Brown-Classic. Lohmann Tierzucht.
GMBH. Cuxhaven, Germany.

Chapter 6: References
120
Lohmann, 2016. Management Guide for Lohmann Brown-Classic. Lohmann Tierzucht.
GMBH. Cuxhaven, Germany.
Lott, B. D., E. J. Day, J. W. Deaton, and J. D. May. 1992. The effect of temperature,
dietary energy level, and corn particle size on broiler performance. Poult. Sci.
71:618-624.
Maclsaac, J. L., and D. M., Anderson. 2007. Effect of whole wheat, enzyme
supplementation and grain texture on the production performance of laying hens.
Can. J. Anim. Sci. 87:579-589.
MAPAMA (Ministerio de Agricultura, Pesca, Alimentación y Medio Ambiente). 2017.
http://www.mapama.gob.es/es/estadistica/temas/publicaciones/anuario-de-
stadistica/ . Accessed May 2017.
Marquardt, R.R., D. Boros, W. Guenter, and G. Crow. 1994. The nutritive value of
barley, rye, wheat and corn for young chicks as affected by use of a trichoderma
reesei enzyme preparation. Anim. Feed Sci. Technol. 45:363-378.
Mateos, G. G., and J. L. Sell. 1980. Influence of carbohydrate and supplemental fat
source of the metabolizable energy of the diet. Poult. Sci. 59:2129-2135.
Mateos, G. G., R. Lázaro, and. M. I. Gracia. 2002. The feasibility of using nutritional
modifications to replace drugs in poultry feeds. J. Appl. Poult. Res. 11:437-452.
Mateos, G. G., E. Jiménez-Moreno, M. P. Serrano, and R. Lázaro. 2012. Poultry
response to high levels of dietary fiber sources varying in physical and chemical
characteristics. J. Appl. Poult. Res. 21:156-174.
Mateos, G. G., L. Cámara, G. Fondevila, and R. P. Lázaro. 2017a. Critical review of the
procedures used for estimation of the energy content of diets and ingredients in
poultry. J. Appl. Poult. Res. (in press).

Chapter 6: References
121
Mateos, G.G., L. Cámara, G. Fondevila, H. Mandalawi, J. Arch, and R. Lázaro. 2017b.
Insoluble fiber for gut development, microbial management and performance.
Poultry Beyond 2023 6th Broiler Nutritionist’s Conference. R. Ravindran (ed).
Queenstown, New Zealand.
Mathlouthi, N., M. Larbier, M. A. Mohamed, and M. Lessire. 2002. Performance of
laying hens fed wheat, wheat-barley or wheat-barley-wheat bran based diets
supplemented with xylanase. Can. J. Anim. Sci. 82:193-199.
Mendes, M., D. Ecmel, and E. Arslan. 2007. Profile analysis and growth curve for body
mass index of broiler chickens reared under different feed restrictions in early age.
Arch. Tierz. 50:403-411.
Mirzaie, S., M. Zaghari, M. Aminzadeh, M. Shivazad, and G. G. Mateos. 2012. Effects
of wheat inclusion and xylanase supplementation of the diet on productive
performance, nutrient retention, and endogenous intestinal enzyme activity of
laying hens. Poult. Sci. 91:413-425.
Mongin, P., and B. Sauveur. 1974. Volundary food and calcium intake by the laying
hens. Br. Poult. Sci. 15:349-359.
Mongin, P. and B. Sauveur. 1979. The specific calcium appetite of the domestic fowl.
Food Intake Regulation, (K. N. Boorman and B. M. Freeman, eds.). Edinburgh:
Br. Poult. Sci. Ltd, pp. 171-189.
Moran, E. T. JR., X. Chen, and J. P. Blake. 1993. Comparison of broiler strain crosses
developed in the US and UK using corn and wheat based feeds: live performance
and processing of male for nine piece cuts. J. Appl. Poult. Res. 2:26-32.
Nahashon, S. N., H. S. Nakaue, S. P. Snyder, and L. W. Mirosh. 1994. Performance of
Single Comb White Leghorn layers fed corn-soybean meal and barley-corn-
Chapter 6: References
122
soybean meal diets supplemented with a direct-fed microbial. Poult. Sci. 73:1712-
1723.
Nir, I., R. Hillel, I. Ptichi, and G. Shefet. 1994a. Effect of grain particle size on
performance. 2. Grain texture interaction. Poult. Sci. 73:781-791.
Nir, I., G. Shefet, and Y. Aaroni. 1994b. Effect of particle size on performance. 1. Corn.
Poult. Sci. 73:45-49.
Nir, I., Hillel, R., Ptichi, I., and G. Shefet. 1995. Effect of particle size on performance.
3. Grinding pelleting interaction. Poult. Sci. 74:771-783.
Nir, I., and I. Ptichi. 2001. Feed particle size and hardness: Influence on performance,
nutritional, behavioral and metabolic aspects. In: Proceedings of the 1st World
Feed Conference, Utrecht, the Netherlands, pp. 157-186.
NRC. 1994. Nutrient Requirements of Poultry. 9th rev. ed. Natl. Acad. Press,
Washington, DC.
Ouart, M. D., J. E. Marion, and R. H. Harms. 1986. Research notes: Influence of wheat
particle size in diets of laying hens. Poult. Sci. 65:1015-1017.
Ouhida, I., J. F. Perez, J. Gasa, and F. Puchal. 2000. Enzymes (ß-glucanase and
arabinoxylanase) and/or sepiolite supplementation and the nutritive value of
maize-barley-wheat based diets for broiler chickens. Br. Poult. Sci. 41:617-624.
Parera, N., R. P. Lázaro, M. P. Serrano, D. G. Valencia, and G. G. Mateos. 2010.
Influence of the inclusion of cooked cereals and pea starch in diets based on soy
or pea protein concentrate on nutrient digestibility and performance of young pigs.
J. Anim. Sci. 88:671-679.
Parsons, A. S., N. P. Buchanan, K. P. Blemings, M. E. Wilson, and J. S. Moritz. 2006.
Effect of corn particle size and pellet texture on broiler performance in the
growing phase. J. Appl. Poult. Res. 15:245-255.
Chapter 6: References
123
Pérez-Bonilla, A., M. Frikha, S. Mirzaie, J. García, and G. G. Mateos. 2011. Effects of
the main cereal and type of fat of the diet on productive performance and egg
quality of brown egg-laying hens from 22 to 54 weeks of age. Poult. Sci. 90:2801-
2810.
Pérez-Bonilla, A., S. Novoa, J. García, M. Mohiti-Asli, M. Frikha, and G. G. Mateos.
2012. Effects of energy concentration of the diet on productive performance and
egg quality of brown egg-laying hens differing in initial body weight. Poult. Sci.
91:3156-3166.
Pérez-Bonilla, A., M. Frikha, R. Lázaro, and G. G. Mateos. 2014. Type of grinding of
the main cereal of the diet affects production of brown egg-laying hens. Anim.
Feed Sci. Technol. 194:121-130.
Péron, A., D. Bastianelli, F. X. Oury, J. Gomez, and B. Carré. 2005. Effects of food
deprivation and particle size of ground wheat on digestibility of food components
in broilers fed on a pelleted diet. Br. Poult. Sci. 46:223-230.
Picard, M., J. P. Melcion, C. Bouchot, and J. M. Faure. 1997. Picorage et préhensibilité
des particules alimentaires chez les volailles. INRA Prod. Anim. 10:403-414..
Portella, F. J., L. J. Caston, and S. Leeson. 1988a. Apparent feed particle size preference
by laying hens. Can. J. Anim. Sci. 68:915-922.
Portella, F. J., L. J. Caston, and S. Leeson. 1988b. Apparent feed particle size
preference by broilers. Can. J. Anim. Sci. 68:923-930.
Pousga, S., H. Boly, and B. Ogle. 2005. Choice feeding of poultry: a review. Liv. Res.
Rural Develop. Vol. 17, Article 45. Retrieved from http://www.lrrd.
org/lrrd17/4/pous17045.htm.
Chapter 6: References
124
Ravindran, V., Y. B. Wu, D. G. Thomas, and C. H. Morel. 2006. Influence of whole
wheat feeding on the development of gastrointestinal tract and performance of
broiler chickens. Aust. J. Agric. Res. 57:21-26.
Ravindran, V., P Tancharoenrat, F Zaefarian and G. Ravindran. 2016. Fats in poultry
nutrition: digestive physiology and factors influencing their utilization. Anim.
Feed Sci. Technol. 213:1-21.
Reece, F. N., B. D. Lott, and J. W. Deaton. 1985. The effects of feed form, grinding
method, energy level, and gender on broiler performance in a maderate (21℃)
environment. Poult. Sci. 64:1834-1839.
Röhe, I., I. Ruhnke, F. Knorr, A. Mader, F. G. Boroojeni, R. Lowe, and J. Zentek. 2014.
Effects of grinding method, particle size, and physical form of the diet on
gastrointestinal morphology and jejunal glucose transport in laying hens. Poult.
Sci. 93:2060-2068.
Ruiz, N., J. E, Marion, R. D. Miles, and R. B. Barnett. 1987. Nutritive value of new
cultivars of triticale and wheat for broiler chick diets. Poult. Sci. 66:90-97.
Ruhnke, I., I. Röhe, C. Krämer, F. G. Boroojeni, F. Knorr, A. Mader, E. Schulze, A.
Hafeez, K. Neumann, R. Löwe, and J. Zentek. 2015. The effects of particle size,
milling method, and thermal treatment of feed on performance, apparent ileal
digestibility, and pH of the digesta in laying hens. Poult. Sci. 94:692-699.
Sacranie, A., B. Svihus, V. Denstadli, B. Moen, P. A. Iji, and M. Choct. 2012. The
effect of insoluble fiber and intermittent feeding on gizzard development, gut
motility, and performance of broiler chickens. Poult. Sci. 91:693-700.
Safaa, H. M., M. P. Serrano, D. G. Valencia, X. Arbe, E. Jiménez-Moreno, R. Lázaro,
and G. G. Mateos. 2008b. Effects of the levels of methionine, linoleic acid, and

Chapter 6: References
125
added fat in the diet of productive performance and egg quality of brown laying
hens in the late phase of production. Poult. Sci. 87:1595-1602.
Safaa, H. M., E. Jiménez-Moreno, D. G. Valencia, M. Frikha, M. P. Serrano, and G. G.
Mateos. 2009. Effect of main cereal of the diet and particle size of the cereal on
productive performance and egg quality of brown egg-laying hens in early phase
of production. Poult. Sci. 88:608-614.
Saki, A. A., S. Mirzayi, S. Ghazi, M. M. Moini, R. N. Harsini, M. Haghighat, and R.,
Mahdavi. 2010. Effect of various level of treated barley on small intestinal content
viscosity, litter moisture, uric acid and broiler chicken performance. J. Anim. Vet.
Adv. 9:2627-2632.
Saldaña, B., P. Guzmán, H. M. Safaa, R. Harzalli, and G. G. Mateos. 2015a. Influence
of the main cereal and feed form of the rearing phase diets on performance and
digestive tract and body traits of brown-egg laying pullets from hatch to 17 weeks
of age. Poult. Sci. 94:2650-2661.
Saldaña, B., P. Guzmán, L. Cámara, J. García, and G. G. Mateos. 2015b. Feed form and
energy concentration of the diet affect productive performance and digestive tract
traits of brown-egg laying pullets from hatching to 17 weeks of age. Poult. Sci.
94:1879-1893.
SAS Institute. 2004. SAS/STAT User’s Guide. Version 9.1. SAS Inst. Inc., Cary, NC.
Schiffman, H. R. 1968. Texture preference in the domestic chick. J. Comp. Physiol.
Psychol. 66:540-541.
Scragg, R. H., N. B. Logan, and N. Geddes. 1987. Response of egg weight to the
inclusion of various fats in layer diets. Br. Poult. Sci. 28:15-21.
Chapter 6: References
126
Shutze, J. V., L. S. Jensen, and J. McGinnis. 1962. Accelerated increase in egg weight
of young pullets fed practical diets supplemented with corn oil. Poult. Sci.
41:1846-1851.
Singh, J., A. Dartois, and L. Kaur. 2010. Starch digestibility in food matrix: A review.
Trends Food Sci. Technol. 21:168-180.
Steenfeldt, S. 2001. The dietary effect of different wheat cultivars for broiler chickens.
Br. Poult. Sci. 42:595-609.
Svihus, B., and H. Hetland. 2001. Ileal starch digestibility in growing broiler chickens
fed on a wheat-based diet is improved by mash feeding, dilution with cellulose or
whole wheat inclusion. Br. Poult. Sci. 42:633-637.
Svihus, B., E. Juvik, H. Hetland and Å. Krogdahl. 2004. Causes for improvement in
nutritive value of broiler chicken diets with whole wheat instead of ground wheat.
Br. Poult. Sci. 45:55-60.
Svihus, B., A. K. Uhlen, and O. M. Harstad. 2005. Effect of starch granule structure,
associated components and processing on nutritive value of cereal starch: A
review. Anim. Feed Sci. Technol. 122:303-320.
Svihus, B., 2010. Challenging current poultry feeding dogmas by feed intake estriction
and the use of coarse feed ingredients. 21st. Proc. of the Austr. Poult. Sci. Symp.,
pp 9–16, Sydney Australia.
Svihus, B. 2011. The gizzard: function, influence of diet structure and effects on
nutrient availability. World's Poult. Sci. J. 67:207-224.
Svihus, B. 2014. Starch digestion capacity of poultry. Poult. Sci. 93:2394–2399.
Taylor, R. D., and G. P. D. Jones. 2004a. The incorporation of whole grain into pelleted
broiler chicken diet. II. Gastrointestinal and digesta characteristics. Br. Poult. Sci.
37:237-246.

Chapter 6: References
127
Taylor, R. D., and G. P. D. Jones. 2004b. The influence of whole grain inclusion in
pelleted broiler diets on proventricular dilatation and ascites mortality. Br. Poult.
Sci. 37:247-254.
Tester, R. F., X. Qi, and J. Karkalas. 2006. Hydrolysis of native starches with amylases.
Anim. Feed Sci. Technol. 130:39-54.
Thomas, D.V., and V. Ravindran. 2008. Effect of cereal type on the performance,
gastrointestinal tract development and intestinal morphology of the newly hatched
broiler chick. J. Poult. Sci. 45:46-50.
Traineau, M., I. Bouvarel, C. Mulsant, L. Roffidal, C. Launay, and P. Lescoat. 2015.
Modulation of energy and protein supplies in sequential feeding in laying hens.
Animal 9:49-57.
USDA-FAS (United States Department of Agriculture- Foreign Agricultural Service),
2015. Spain’s Poultry Meat and Egg Production Report, Gain Report Number:
SP1538. (USDA-FAS) https://gain.fas.usda.gov/.
Van Roovert-Reijrink, I. 2013. Incubation affects chick quality. World Poult. 29:22-23.
Wahlström, A., R. Tauson, and K. Elwinger. 1999. Production and egg quality as
influenced by mash or crumbled diets fed to laying hens in an aviary system.
Poult. Sci. 78:1675-1680.
Waldroup, P.W. 1997. Particle size reduction of cereal grains and its significance in
Poultry Nutrition. Technical Bulletin PO34-1997, American Soybean Association,
Singapore. 14 pp.
Wang, Z. R., S. Y. Qiao, W. Q. Lu, and D. F. Li. 2005. Effects of enzyme
supplementation on performance, nutrient digestibility, gastrointestinal
morphology, and volatile fatty acid profiles in the hindgut of broilers fed wheat-
based diets. Poult. Sci. 84:875-881.

Chapter 6: References
128
WPSA (World´s Poultry Science Association). 1989. European Table of Energy Values
for Poultry Feedstuffs, 3rd ed. Subcommittee of Energy of the Working Group no
2. Nutrition of the European Federation of Branches of the World´s Poultry
Science Association, Spelderholt Centre for Poultry Research, Beekbergen, The
Netherlands.
Xu, Y., C. R. Stark, P. R. Ferket, C. M. Williams, and J. Brake. 2015. Effects of feed
form and dietary coarse ground corn on broiler live performance, body weight
uniformity, relative gizzard weight, excreta nitrogen, and particle size preference
behaviors. Poult. Sci. 94:1549-1556.
Yasar, S., and J. M. Forbes. 1999. Performance and gastro-intestinal response of broiler
chickens fed on cereal grain based foods soaked in water. Br. Poult. Sci. 40:65-76.
Yegani, M., and D. R. Korver. 2012. Review: Prediction of variation in energetic value
of wheat for poultry. Can. J. Anim. Sci. 92:261-273.
Yu, B., J. C. Hsu, and P. W. S. Chiou. 1998. Effects of β-glucanase supplementation of
barley diets on growth performance of broilers. Anim. Feed Sci. Technol. 70:353-
361.
Zanella, I., N. K. Sakomura, F.G. Silversides, A. Fiqueirdo, and M. Pack. 1999. Effect
of enzyme supplementation of broiler diets based on maize and soybeans. Poult.
Sci. 78: 561-568.
Zimonja, O., A. Stevnebø, and B. Svihus. 2007. Nutritional value of diets for broiler
chickens as affected by fat source, amylose level and diet processing. Can. J.
Anim. Sci. 87:553-562.