Embed Size (px)
Citation preview
IAEA-TECDOC-1331
Use of electron paramagnetic resonance dosimetry with
tooth enamel for retrospective dose assessment
Report of a co-ordinated research project
December 2002
The originating Section of this publication in the IAEA was:
Dosimetry and Medical Radiation Physics Section International Atomic Energy Agency
Wagramer Strasse 5 P.O. Box 100
A-1400 Vienna, Austria
USE OF ELECTRON PARAMAGNETIC RESONANCE DOSIMETRY WITH TOOTH ENAMEL FOR RETROSPECTIVE DOSE ASSESSMENT
IAEA, VIENNA, 2002 IAEA-TECDOC-1331
ISBN 92–0–119402–1ISSN 1011–4289
© IAEA, 2002
Printed by the IAEA in Austria December 2002
FOREWORD
Electron paramagnetic resonance (EPR) dosimetry is a physical method for the assessment of absorbed dose from ionising radiation. It is based on the measurement of stable radiation induced radicals in human calcified tissues (primarily in tooth enamel). EPR dosimetry with teeth is now firmly established in retrospective dosimetry. It is a powerful method for providing information on exposure to ionising radiation many years after the event, since the ‘signal’ is ‘stored’ in the tooth or the bone. This technique is of particular relevance to relatively low dose exposures or when the results of conventional dosimetry are not available (e.g. in accidental circumstances). The use of EPR dosimetry, as an essential tool for retrospective assessment of radiation exposure is an important part of radioepidemiological studies and also provides data to select appropriate countermeasures based on retrospective evaluation of individual doses. Despite well established regulations and protocols for maintaining radiation protection dose limits, the assurance that these limits will not be exceeded cannot be guaranteed, thus providing new challenges for development of accurate methods of individual dose assessment.
To meet some of these challenges, in 1998 the IAEA initiated a co-ordinated research project (CRP) with the objective to review the available methods, current research and development in EPR biodosimetry technology, which may be of practical use. The major goal of this CRP was to investigate the use of EPR biodosimetry for reconstruction of absorbed dose in tooth enamel with the aim of providing Member States with up-to-date, and generally agreed upon advice regarding the most suitable procedures and the best focus for their research. The co-ordinated research project was conducted over four years and this publication presents the results and findings by a group of investigators from different countries.
The available cytogenetic methods for radiation dose assessment were studied and reviewed in a recently published manual (IAEA TRS 405). A comprehensive review with recommendations on the use of different methods of radiation dose reconstruction (including the EPR biodosimetry) is the subject of an International Commission on Radiological Units and Measurements (ICRU) report on Retrospective Assessment of Exposures to Ionizing Radiation (ICRU 68).
The present IAEA TECDOC is addressed to those who need guidance in applying EPR tooth biodosimetry and also to technical specialists producing retrospective dosimetric results.
The IAEA wishes to express its thanks to all authors and reviewers of this document as listed at the end of the TECDOC. Editorial contributions of M. Desrosiers (USA), A. Wieser (Germany) and A. Romanyukha (Russian Federation) are especially acknowledged.
The project officers responsible for this CRP were K. Mehta (1998–1999) and S. Vatnitsky (2000–2002) of the Division of Human Health. The staff member responsible for the preparation of this publication was S. Vatnitsky.

EDITORIAL NOTE
The use of particular designations of countries or territories does not imply any judgement by the publisher, the IAEA, as to the legal status of such countries or territories, of their authorities and institutions or of the delimitation of their boundaries.
The mention of names of specific companies or products (whether or not indicated as registered) does not imply any intention to infringe proprietary rights, nor should it be construed as an endorsement or recommendation on the part of the IAEA.

CONTENTS
1. INTRODUCTION ............................................................................................................ 1
1.1. Need for retrospective dosimetry........................................................................ 1 1.2. History of EPR biodosimetry method................................................................. 2 1.3. Advantages and disadvantages of the EPR method............................................ 3 1.4. Future aims ......................................................................................................... 3 1.5. Purpose and organisation of the report ............................................................... 4
2. TEETH AND EPR............................................................................................................ 5
2.1. Teeth: Anatomy, histology, and physiology ....................................................... 5 2.2. Human dentition ................................................................................................. 7 2.3. Principle of the EPR method ............................................................................ 10 2.4. EPR spectrum of tooth enamel ......................................................................... 11
3. SAMPLE PREPARATION ............................................................................................ 14
3.1. Introduction....................................................................................................... 14 3.2. Tooth collection................................................................................................ 14
3.2.1. Tooth selection ................................................................................... 14 3.2.2. Tooth disinfection............................................................................... 16 3.2.3. Tooth storage ...................................................................................... 16
3.3. Sample preparation ........................................................................................... 17 3.3.1. Separation of roots from crown.......................................................... 17 3.3.2. Separation of enamel from dentine..................................................... 17 3.3.3. Grinding of the enamel sample........................................................... 18 3.3.4. Etching................................................................................................ 19
3.4. Pause between sample preparation and measurement ...................................... 19 3.5. Other methods................................................................................................... 20 3.6. Separation of dentine ........................................................................................ 20
4. EPR MEASUREMENTS ............................................................................................... 21
4.1. Spectrometer parameters .................................................................................. 21 4.1.1. Microwave parameters ....................................................................... 21 4.1.2. Magnetic field parameters .................................................................. 22 4.1.3. Signal channel .................................................................................... 22
4.2. Assessment of radiation response..................................................................... 23 4.3. System bias ....................................................................................................... 24 4.4. Sample position in the cavity............................................................................ 25 4.5. EPR spectrometers............................................................................................ 25 4.6. Additional instrumentation ............................................................................... 25
5. DOSE ESTIMATION..................................................................................................... 27
5.1. Description of the problem ............................................................................... 27 5.2. Calibration of EPR radiation response in terms of absorbed
dose in tooth enamel ......................................................................................... 27 5.3. Sample irradiation............................................................................................. 28 5.4. Conversion of absorbed dose in enamel to air kerma, whole
body dose and specific organ doses .................................................................. 28
6. UNCERTAINTIES IN DETERMINATION OF ABSORBED DOSE IN ENAMEL................................................................................................................... 31
6.1. Introduction....................................................................................................... 31 6.2. Analysis sources of uncertainties...................................................................... 31
6.2.1. Fading ................................................................................................. 31 6.2.2. Sample preparation............................................................................. 31 6.2.3. EPR measurements............................................................................. 32 6.2.4. Numerical treatment of spectra and EPR dose calculation................. 33 6.2.5. Calibration of EPR dose response ...................................................... 34
6.3. Estimation of the combined uncertainty of EPR dose reconstruction .............. 34 6.4. Experimental validation of the method for the determination of
absorbed dose in enamel................................................................................... 34 6.4.1. Sources of uncertainties in personal dose reconstruction................... 35
7. CALCULATION OF EMERGENCY DOSE................................................................. 36
7.1. Summary of results on practical application..................................................... 36 7.1.1. A-bomb survivors, Hiroshima, Japan................................................. 36 7.1.2. Mayak nuclear workers, Russian Federation...................................... 36 7.1.3. Techa riverside population, Russian Federation................................. 36 7.1.4. Totskoye nuclear test eyewitnesses, Russian Federation.................... 37 7.1.5. Goiânia radiation accident victims, Brazil ......................................... 37 7.1.6. Retired personnel of atomic submarines, Russian Federation............ 37 7.1.7. Chernobyl cleanup workers (liquidators) in Ukraine
and Russian Federation....................................................................... 37 7.1.8. Population of the areas contaminated by Chernobyl fallout,
Russian Federation. Background population, Russian Federation ..... 38 7.1.9. Population of the areas close to Semipalatinsk Nuclear Test Site,
Kazakhstan ......................................................................................... 38
8. EXECUTIVE SUMMARY ............................................................................................ 40
GLOSSARY............................................................................................................................. 43
REFERENCES......................................................................................................................... 45
EPR BIODOSIMETRY PARTICIPANTS .............................................................................. 55
CONTRIBUTORS TO DRAFTING AND REVIEW.............................................................. 57
1. INTRODUCTION
1.1. Need for retrospective dosimetry
The latter half of the twentieth century has been witness to a variety of releases of radioactive materials from industrial facilities, military program activities, or to overexposure of persons due to the improper use and disposal of radiation sources. These events resulted in a broad range of ionising radiation exposure to a considerable number of people. There have been about 400 radiation accidents registered in 1944–2000 worldwide leading to confirmed significant overexposure of 3000 persons [1]. Besides these accidents there are other exposures to tens of thousands of persons at Hiroshima and Nagaski, Techa River basin, Mayak facilities and Chernobyl [2, 3]. History has demonstrated that despite all precautions accidents are unavoidable, and preparation for future incidents is a prudent course of action. Follow-up examinations of these events have commonly found that measurements of the radioactive contamination and dose rates were insufficient to judge the full extent of the situation. This complicates, and in some cases even prevents, proper dose assessment for exposed individuals or critical groups. Therefore, retrospective assessment of the radiation exposure is of fundamental importance to the analysis of the radiation risk and is an essential part of many radio-epidemiological studies. Retrospective dosimetry is also an essential tool for the assessment of individual doses as a basis for the selection of appropriate countermeasures. In addition, despite well-established regulations and protocols for maintaining radiation protection dose limits for professionals, the assurance that these limits will not be exceeded is not guaranteed. Alternative methods to routine dosimetry for individual dose assessment are desirable under circumstances where dose limits may be exceeded. Dose reconstruction has been applied to several different radiation events and accidents. It was used to evaluate the exposure of the survivors of the atomic bomb explosions in Hiroshima and Nagasaki, the plant workers of nuclear weapon production facilities in the USA and former USSR, the general populations of many countries in the vicinity of nuclear weapons testing, and the exposure to cleanup workers (liquidators) and the local population due to the Chernobyl nuclear accident. Dose reconstruction was also used to assess the extent and consequences of the improper use and the disposal of radiation sources used in industry and medicine (e.g., Goiânia, Brazil and Kiisa, Estonia). Dose reconstruction can be accomplished through various physical and biological measurement methods as well as numerical analysis of data records of radioactivity measurements done during the course of an event. The method that is actually applied is dependent on the aim of the intended study, the relevant pathway of radiation exposure and the data record availability. Numerical dose reconstruction methods use data records from measurements of radioactive contamination in the human body, foodstuffs and soil, or gamma dose-rate measurements in the air. Frequently, it is necessary to obtain supplementary information about the living conditions and habits of the people during the radiation event through questionnaires. Numerical dose reconstruction was applied to the assessment of thyroid doses for the Chernobyl accident population [4, 5] and for evacuees of Pripjat [6]. The external exposure for Pripiat evacuees was determined in combination with Monte Carlo simulation calculations [7]. The cytogenetic method for biological dosimetry involves the evaluation of doses to individuals by chromosomal analysis. The method calls for the scoring of dicentric chromosome aberrations in metaphases prepared from human lymphocytes [8]. The dicentric aberrations are unstable, that is why they are eliminated from the peripheral blood after the
1
exposure, and doses can be reconstructed up to several months after acute irradiation of whole-body or large part of the body. Reciprocal translocations and insertions are classified as stable aberrations and can be scored by fluorescence in situ hybridisation (FISH) with composite chromosome-specific DNA probes; it is also known as chromosome painting [9]. The use of this method for the assessment of individual doses below 500 mGy is not yet definitive. A fast estimation of the exposure is possible by simple scoring of micro nuclei [10]. The recently available cytogenetic methods for radiation dose assessment; their merits, disadvantages and application are being reviewed by the IAEA [11]. Luminescence dosimetry is a physical dose reconstruction method comprised of thermoluminescence (TL) dosimetry [12] and the recently introduced technique of optically stimulated luminescence (OSL) [13]. The method is based on the measurement of the luminescence emission from certain minerals, mostly quartz and feldspar that are held in ceramic materials. Construction materials such as brick, tiles and porcelain are frequently used for dose reconstruction. Luminescence dosimetry has the capability to measure integrated doses long after the radiation incident. The lowest measurable doses are some tens of mGy. The method provides accumulated doses at certain reference locations in the environment. Additional model calculations are required for the estimation of individual doses. Electron paramagnetic resonance (EPR) biodosimetry is a physical method based on the measurement of stable radiation-induced radicals in the calcified tissues (primarily in tooth enamel) of the human body. The application of this method for future assessment of radiation risk coefficients in epidemiological cohorts is relatively recent (within the past 5–7 years). A compressive review with recommendations on the use of different methods of radiation dose reconstruction (including the EPR biodosimetry method) is the subject of the ICRU report on Retrospective Assessment of Exposures to Ionising Radiation [14] The present document will focus exclusively on the EPR biodosimetry method.
1.2. History of EPR biodosimetry method
The individual dose can best be reconstructed using probes that are close to, or part of, the exposed individual. Therefore, human tissues are of special interest to retrospective dosimetry. Hydroxyapatite (Ca10 (PO4)6(OH)2) contained in bones and teeth is a suitable probe for dose reconstruction because it contains stable radiation-induced radicals that are a diagnostic signature of radiation exposure. Electron paramagnetic resonance (also known as electron spin resonance, ESR) is an extremely sensitive method for the measurement of free radicals. Brief information about the EPR technique and EPR spectrometer design will be given in Section 2 of this report. However, this information is limited since the subject of EPR itself would require considerable space. There are many books that provide detailed descriptions of the principles and applications of EPR spectroscopy. A list of some books devoted to EPR methodology is given in References [15, 16, 17, 18, 19, 20, 21, 22]. One book, in particular by Motoji Ikeya [18], is recommended as an introduction to the method. Tooth enamel as a detector for in vivo dosimetry has been known for more than three decades [23]. The usefulness of enamel for dosimetry results from its high content of hydroxyapatite [24]. Carbonate impurities, which are incorporated into or attached to the surface of hydroxyapatite crystals during formation, are converted to CO2
- radicals through absorption of ionising radiation [25]. The concentration of radicals increases with absorbed dose. The intensity of the resultant EPR absorption is a measure for the absorbed dose. Examples of the use of EPR in dose reconstruction include the dose evaluation of: survivors of the atomic bomb explosions in Hiroshima and Nagasaki [26, 27] nuclear workers in the South Urals [28], residents of the Techa river basin [29], the populations of contaminated areas in the Urals [30], the population living near the Chernobyl nuclear reactor
2

[31, 32, 33, 34] and workers in the Chernobyl Sarcophagus [35]. Finally, EPR dosimetry was applied to a population from an uncontaminated area in Russia [36] demonstrating the potential to estimate the absorbed dose from natural background radiation. Within the framework of joint EU/CIS projects, international comparisons on EPR tooth dosimetry were carried out in 1993/94 [37, 38, 39, 40] and in 1998/99 [41]. These comparisons were designed to check the consistency and reliability of EPR dose reconstruction among different laboratories. These comparisons led to critical revisions and improvements to the different variations of the EPR dosimetry method applied by the participants. Moreover, the capability of EPR dosimetry to measure low doses in the range of 100 mGy was demonstrated. Today, EPR dosimetry with tooth enamel is a leading method for retrospective dosimetry of individual radiation exposures.
1.3. Advantages and disadvantages of the EPR method
Teeth that are extracted for health reasons are readily available for dose reconstruction and can be archived for a prolonged period before examination. EPR dosimetry has the capability to measure the volume of samples required for epidemiological studies [37]. Dose reconstruction can be applied to the distinctive tissues that comprise a tooth, namely enamel, and dentine. Tooth enamel is preferred in retrospective dosimetry because this tissue is completely formed in childhood and once formed, is never remodelled, even after abrasion. Therefore, the accumulated concentration of radiation-induced radicals in the exposed enamel is preserved. At 25°C, a lifetime of 107 years was determined for the CO2
--radicals in fossil tooth enamel [42]. Hence, EPR dosimetry with tooth enamel is suitable for dose reconstruction after long periods of exposure and for many years after the exposure. The complementary measurement of the absorbed dose in dentine offers the possibility to measure the dose resulting from ingested radionuclides deposited in dentine, in addition to the dose from external sources. This technique has been applied to the measurement of the accumulated dose resulting from the intake of the bone-seeking radionuclide strontium [29]. There are several strong indications that EPR dosimetry gives correct and accurate dose assessment even long after the exposure event. Among them are the results of two international comparisons [40,43], several blind comparisons of the results of EPR dose reconstruction, and data of operational personal monitoring for nuclear workers [28, 30, 44]. However, the success to date should not lead to over-optimism; there remain several aspects of the method that, as discussed in this report, require further investigation see, e.g. [45].
There are also certain shortcomings of EPR biodosimetry. It is not always possible to obtain extracted teeth from all individuals in the study group. For bone-seeking radionuclides (e.g. 90Sr) the reconstruction of the individual dose is complicated and in certain cases impossible [46]. EPR dose reconstruction procedures are also considered to be time-and labour-consuming. For these reasons, at present, EPR biodosimetry will likely not be used as the sole method applied to large cohorts, but will remain invaluable for validation purposes.
1.4. Future aims
Despite the common principles and ideas found among the experienced users of this method, there remains diversity in the method, especially in the sample preparation and dose determination steps. The recent international comparisons do not reveal a preference for any particular procedure of those that are currently in use. Therefore, in the present report different methods of sample preparation and EPR spectral processing, which have been validated through comparisons, are described. Standardisation would foster confidence in the method and facilitate its dissemination and use; standardisation programmes should be encouraged
3
and supported. Performance standards and quality assurance procedures for EPR tooth enamel dosimetry are required and should be established, to ensure the traceability of the reconstructed doses to an internationally recognised standard.
1.5. Purpose and organisation of the report
This report applies to the use of EPR biodosimetry for reconstruction of absorbed dose in tooth enamel due to photon exposure and does not include the aspects of biodosimetry for particle exposure and evaluation of quantities relevant to assess radiation risk like whole body dose or organ dose. The report contains three distinct areas of focus. The first area in Section 2 gives general information on the tooth structure and physiology, physicochemical properties of different dental tissues, and a brief description of EPR technique. The second area in Sections 3, 4, and 5 is devoted to a technical description of the EPR dose reconstruction process, which consists of several main processes: sample preparation, EPR spectral recording, radiation response evaluation, dose reconstruction, dose conversion and results interpretation. The third area in Section 6 and 7 gives information on the main sources of uncertainties at the EPR dose assessment, and examples of its applications for determination of emergency doses. Section 8 is an executive summary with practical recommendations of EPR biodosimetry.
4
2. TEETH AND EPR
2.1. Teeth: anatomy, histology, and physiology
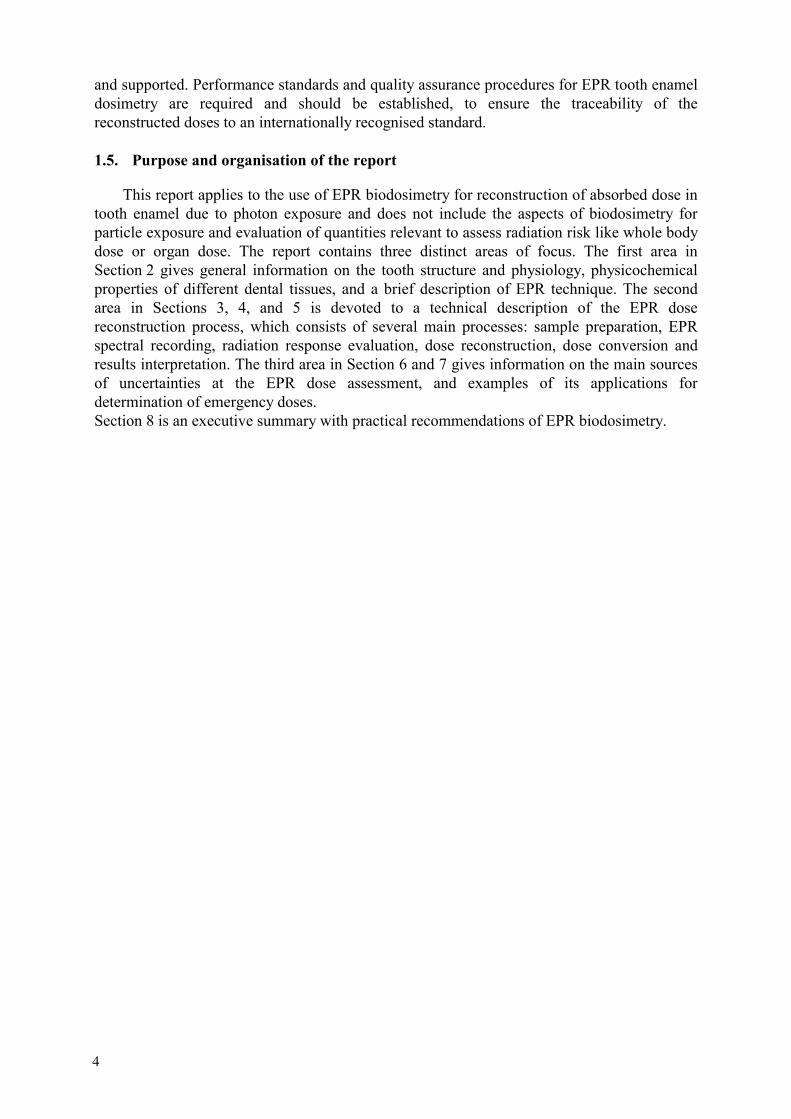
Detailed information on anatomy, histology, and physiology of human teeth can be found in [47, 48, 49, 50, 51]. Anatomically, the tooth consists of the crown and root. The root fixes the tooth to the jawbone in the gum and supports the crown in its masticator function
Dentine
Fig. 2.1. Anatomy of a tooth and locations of tooth tissues.
The tooth is composed of the following four tissues (three of them are calcified and one is a soft tissue):
• Enamel is the hard external covering of the anatomical crown of the tooth. It forms a protective covering of variable thickness (1.0–2.5 mm) over the entire surface of the crown. The enamel density is about 2.9 g/cm3. The chemical composition of normal healthy human tooth enamel is given in Table I.
• Dentine comprises most of the tooth. Unlike enamel, which is very hard and brittle, dentine is subject to slight deformation and is highly elastic. Under polarized light, dentine exhibits a slight positive birefringence. It is fluorescent under ultraviolet irradiation. The dentine density is about 2.5 g/cm3. The chemical composition of normal healthy human dentine is given in Table I.
• Cementum is the external covering of the root. The main function of cementum is to attach the tooth to the connective tissue fibers of the periodontal membrane, as well as to support the tooth as a whole and keep it functional. It is a special connective tissue that shares some physical, chemical, and structural characteristics with compact bone. The hardness of fully mineralized cementum is less than that of dentine. Unfortunately, the cementum chemical composition remains unpublished; therefore, data for the chemical composition of bone are shown in Table I.
• Pulp is the soft connective (non-mineralized) tissue inside the central cavity of the dentine. It communicates with the periodontal membrane through a small opening at the apex of the root.
5
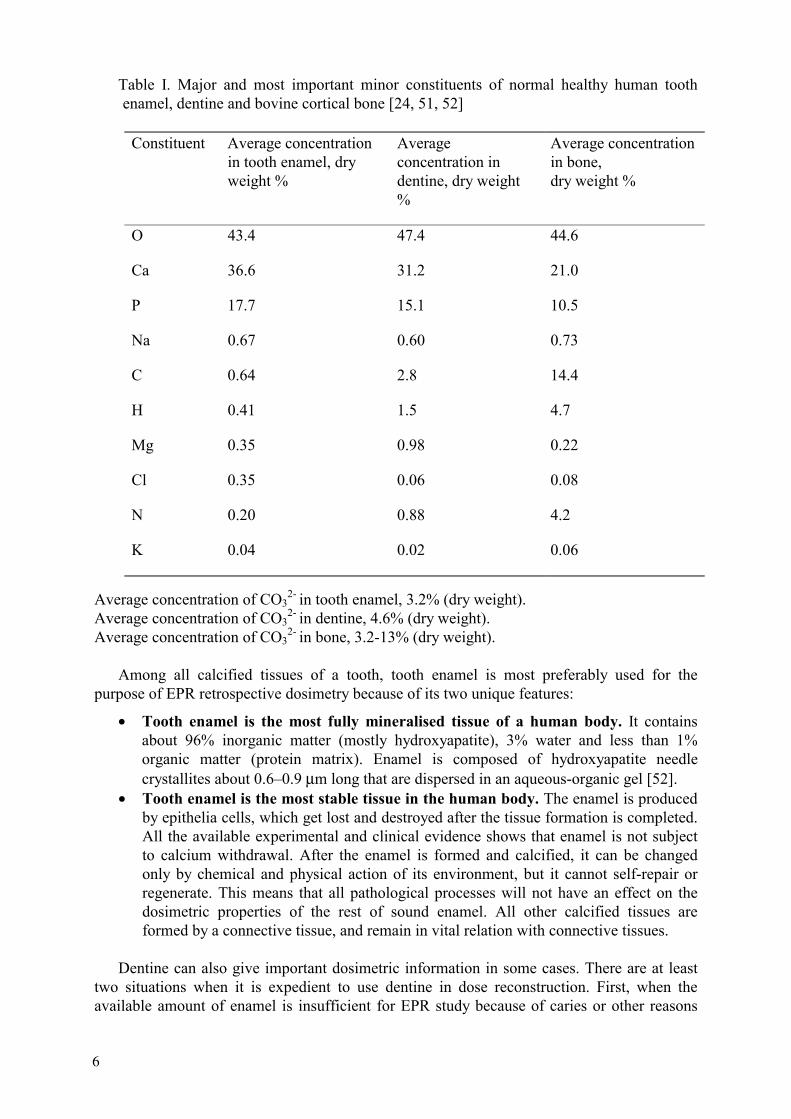
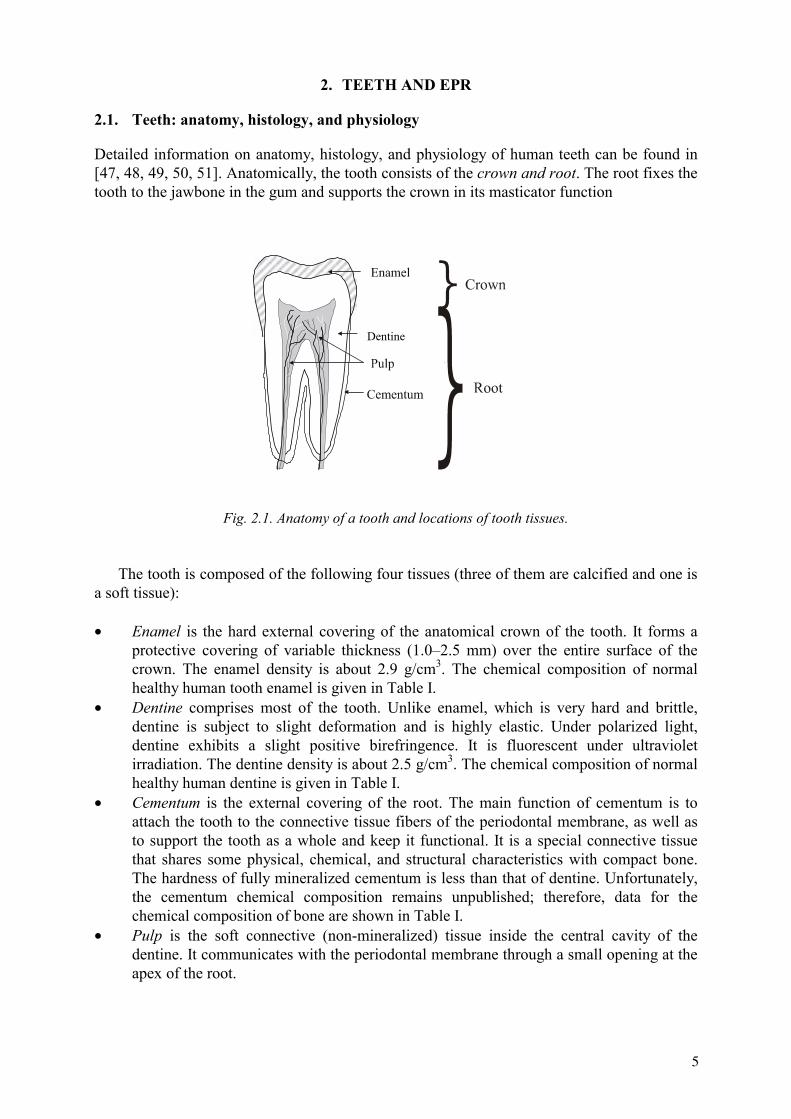
Table I. Major and most important minor constituents of normal healthy human tooth enamel, dentine and bovine cortical bone [24, 51, 52]
Constituent Average concentration in tooth enamel, dry weight %
Average concentration in dentine, dry weight %
Average concentration in bone,dry weight %
O 43.4 47.4 44.6
Ca 36.6 31.2 21.0
P 17.7 15.1 10.5
Na 0.67 0.60 0.73
C 0.64 2.8 14.4
H 0.41 1.5 4.7
Mg 0.35 0.98 0.22
Cl 0.35 0.06 0.08
N 0.20 0.88 4.2
K 0.04 0.02 0.06
Average concentration of CO32- in tooth enamel, 3.2% (dry weight).
Average concentration of CO32- in dentine, 4.6% (dry weight).
Average concentration of CO32- in bone, 3.2-13% (dry weight).
Among all calcified tissues of a tooth, tooth enamel is most preferably used for the purpose of EPR retrospective dosimetry because of its two unique features:
• Tooth enamel is the most fully mineralised tissue of a human body. It contains about 96% inorganic matter (mostly hydroxyapatite), 3% water and less than 1% organic matter (protein matrix). Enamel is composed of hydroxyapatite needle crystallites about 0.6–0.9 µm long that are dispersed in an aqueous-organic gel [52].
• Tooth enamel is the most stable tissue in the human body. The enamel is produced by epithelia cells, which get lost and destroyed after the tissue formation is completed. All the available experimental and clinical evidence shows that enamel is not subject to calcium withdrawal. After the enamel is formed and calcified, it can be changed only by chemical and physical action of its environment, but it cannot self-repair or regenerate. This means that all pathological processes will not have an effect on the dosimetric properties of the rest of sound enamel. All other calcified tissues are formed by a connective tissue, and remain in vital relation with connective tissues.
Dentine can also give important dosimetric information in some cases. There are at least two situations when it is expedient to use dentine in dose reconstruction. First, when the available amount of enamel is insufficient for EPR study because of caries or other reasons
6
and, second, when it is necessary to reconstruct the dose of internal exposure from osteal radionuclides. However, there are considerable differences between dentine and tooth enamel:
• The degree of dentine mineralization. Dentine consists of 30% organic matter and water, and only 70% inorganic material. The organic matter consists of collagenous fibrils and mucopolysaccharides. According to X ray diffraction data, the inorganic component consists of hydroxyapatite. Dentine is composed of a matrix of collagen fibers arranged in a random network. As it calcifies, the hydroxyapatite crystals mask the individual collagen fibers. Polarized light studies have shown that the mineralization of dentine is largely a result of crystallization within and between the collagen fibrils. The size of hydroxyapatite crystals in dentine is about 0.04 µm, that is, much smaller (up to a factor of 20) than in enamel.
• Vitality of dentine. A living tissue, dentine consists of specialized cells called odonoblasts. The bodies of the odonoblasts are arranged on the pulpal surface of the dentine. Every odonoblast has one branch (cytoplasmic extension), called a tubule, which traverses the entire dentine layer to terminate at the junction with enamel or cementum. All living processes occur in dentineal tubules. However, the main body of dentine is composed of intertubular dentine. Dentine continues to be deposited throughout a lifetime, although, after the teeth have erupted, its continued formation is much slower. The dentine formed later in life is called secondary dentine, it is separated from the dentine formed previously by a darkly stained line. This dentine is deposited on the entire pulpal surface. Secondary dentine is observed best in premolars and molars, where more of it is produced on the floor and on the roof of the pulpal chamber than on the sidewalls. Thus, to some approximation, it is possible to say that the development of dentine is similar to the development of tree rings.
From the point of view of dosimetric applications, the vitality of dentine can also mean that the dose reconstructed with this tissue could be underestimated because of dilution by post-exposure secondary dentine formation (for teeth extracted many years after the radiation event). Moreover, in the case of internal exposure, it would be interesting to separate the secondary and the primary dentine for separate dose reconstruction, if possible. The remaining calcified tissue, cementum, is similar to bone and offers the narrowest dosimetric opportunities. Cementum forms a thin layer with thickness of 20 – 50 µm at the enamel-cementum junction and 150 – 200 µm at the apex of the root [48]. It is difficult to separate from dentine and obtain a sufficient amount of material for EPR measurement. Cementum is mineralized with a content of about 50% hydroxyapatite. The organic portion of cementum consists of collagen and protein polysaccharides. Biologically, it is a very inhomogeneous material. Not all layers of cementum incorporate cells. Unlike bone, cementum does not remodel and is generally more resistant to resorption than bone [48].
2.2. Human dentition
The human dentition, like those of most mammals, consists of two generations (Table II). The first generation is known as the deciduous (primary) dentition and the second as the permanent (secondary) dentition. Deciduous teeth are often called milk or baby teeth. The necessity for the two dentitions exists because infant jaws are small and the size and number of teeth that they can support is limited. In spite of the wide availability of deciduous teeth, their number of published EPR dose reconstruction studies is very limited. This results from essential differences between the properties of deciduous and permanent teeth that complicate EPR measurement and limit dosimetry to a short period in childhood (age 1–
7
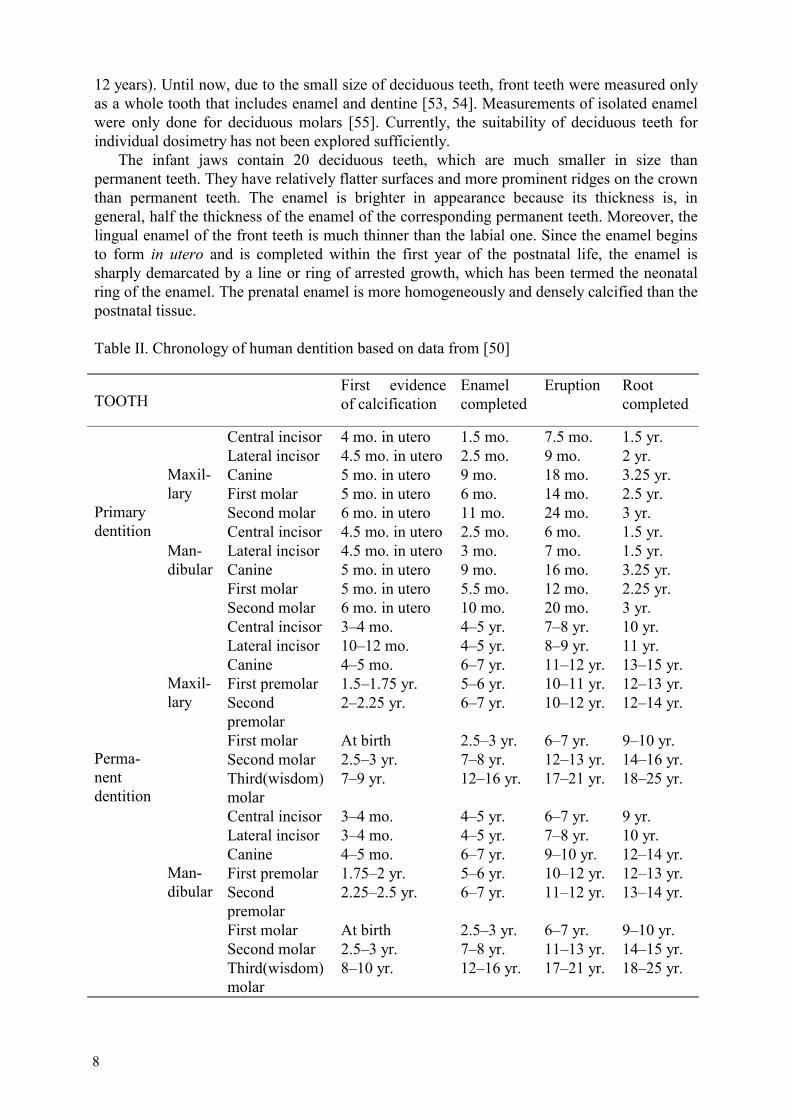
12 years). Until now, due to the small size of deciduous teeth, front teeth were measured only as a whole tooth that includes enamel and dentine [53, 54]. Measurements of isolated enamel were only done for deciduous molars [55]. Currently, the suitability of deciduous teeth for individual dosimetry has not been explored sufficiently. The infant jaws contain 20 deciduous teeth, which are much smaller in size than permanent teeth. They have relatively flatter surfaces and more prominent ridges on the crown than permanent teeth. The enamel is brighter in appearance because its thickness is, in general, half the thickness of the enamel of the corresponding permanent teeth. Moreover, the lingual enamel of the front teeth is much thinner than the labial one. Since the enamel begins to form in utero and is completed within the first year of the postnatal life, the enamel is sharply demarcated by a line or ring of arrested growth, which has been termed the neonatal ring of the enamel. The prenatal enamel is more homogeneously and densely calcified than the postnatal tissue.
Table II. Chronology of human dentition based on data from [50]
TOOTHFirst evidence of calcification
Enamel completed
Eruption Root completed
Central incisor 4 mo. in utero 1.5 mo. 7.5 mo. 1.5 yr. Lateral incisor 4.5 mo. in utero 2.5 mo. 9 mo. 2 yr. Canine 5 mo. in utero 9 mo. 18 mo. 3.25 yr. First molar 5 mo. in utero 6 mo. 14 mo. 2.5 yr.
Maxil- lary
Second molar 6 mo. in utero 11 mo. 24 mo. 3 yr. Central incisor 4.5 mo. in utero 2.5 mo. 6 mo. 1.5 yr. Lateral incisor 4.5 mo. in utero 3 mo. 7 mo. 1.5 yr. Canine 5 mo. in utero 9 mo. 16 mo. 3.25 yr. First molar 5 mo. in utero 5.5 mo. 12 mo. 2.25 yr.
Primary dentition
Man-dibular
Second molar 6 mo. in utero 10 mo. 20 mo. 3 yr. Central incisor 3–4 mo. 4–5 yr. 7–8 yr. 10 yr. Lateral incisor 10–12 mo. 4–5 yr. 8–9 yr. 11 yr. Canine 4–5 mo. 6–7 yr. 11–12 yr. 13–15 yr. First premolar 1.5–1.75 yr. 5–6 yr. 10–11 yr. 12–13 yr. Secondpremolar
2–2.25 yr. 6–7 yr. 10–12 yr. 12–14 yr.
First molar At birth 2.5–3 yr. 6–7 yr. 9–10 yr. Second molar 2.5–3 yr. 7–8 yr. 12–13 yr. 14–16 yr.
Maxil- lary
Third(wisdom)molar
7–9 yr. 12–16 yr. 17–21 yr. 18–25 yr.
Central incisor 3–4 mo. 4–5 yr. 6–7 yr. 9 yr. Lateral incisor 3–4 mo. 4–5 yr. 7–8 yr. 10 yr. Canine 4–5 mo. 6–7 yr. 9–10 yr. 12–14 yr. First premolar 1.75–2 yr. 5–6 yr. 10–12 yr. 12–13 yr. Secondpremolar
2.25–2.5 yr. 6–7 yr. 11–12 yr. 13–14 yr.
First molar At birth 2.5–3 yr. 6–7 yr. 9–10 yr. Second molar 2.5–3 yr. 7–8 yr. 11–13 yr. 14–15 yr.
Perma-nentdentition
Man-dibular
Third(wisdom)molar
8–10 yr. 12–16 yr. 17–21 yr. 18–25 yr.
8
100 1000 100000
20
40
60
80
100
60%
Min
eral
65%
Min
eral
92%
Min
eral
Bone
Dentin
Enamel
Min
eral
into
tal v
olum
e of
tiss
ue m
atrix
(%)
Time, days
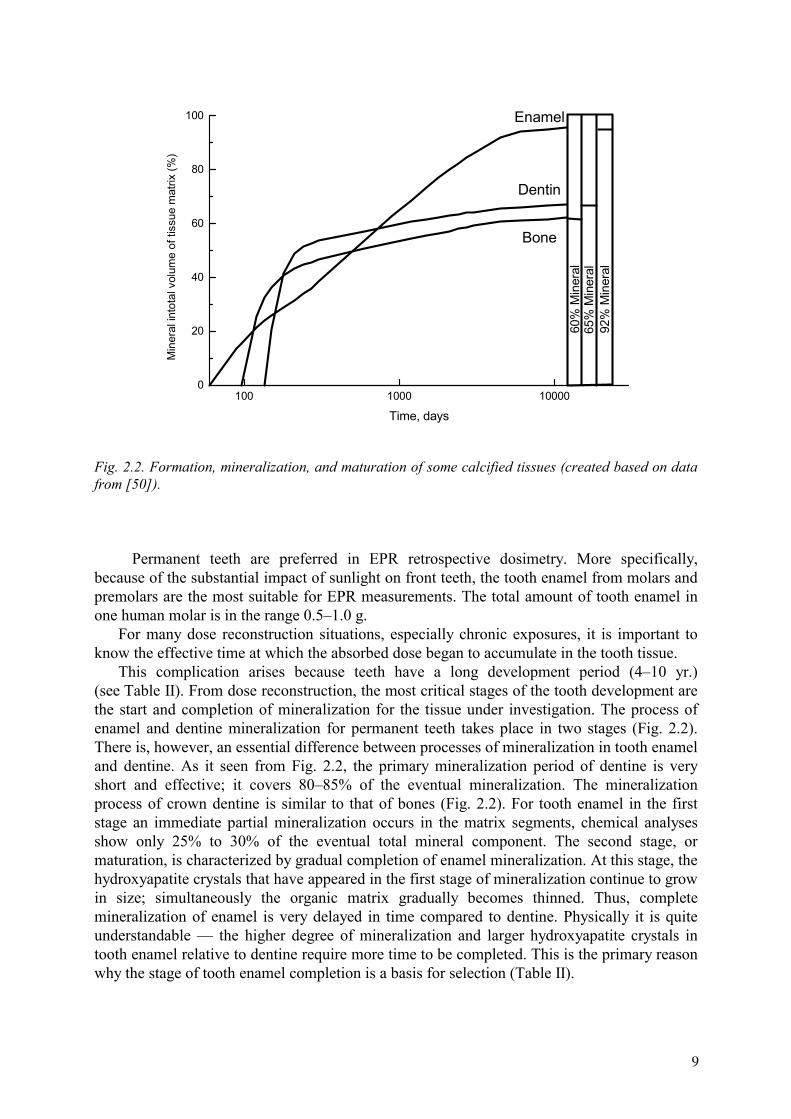
Fig. 2.2. Formation, mineralization, and maturation of some calcified tissues (created based on data from [50]).
Permanent teeth are preferred in EPR retrospective dosimetry. More specifically, because of the substantial impact of sunlight on front teeth, the tooth enamel from molars and premolars are the most suitable for EPR measurements. The total amount of tooth enamel in one human molar is in the range 0.5–1.0 g. For many dose reconstruction situations, especially chronic exposures, it is important to know the effective time at which the absorbed dose began to accumulate in the tooth tissue. This complication arises because teeth have a long development period (4–10 yr.) (see Table II). From dose reconstruction, the most critical stages of the tooth development are the start and completion of mineralization for the tissue under investigation. The process of enamel and dentine mineralization for permanent teeth takes place in two stages (Fig. 2.2). There is, however, an essential difference between processes of mineralization in tooth enamel and dentine. As it seen from Fig. 2.2, the primary mineralization period of dentine is very short and effective; it covers 80–85% of the eventual mineralization. The mineralization process of crown dentine is similar to that of bones (Fig. 2.2). For tooth enamel in the first stage an immediate partial mineralization occurs in the matrix segments, chemical analyses show only 25% to 30% of the eventual total mineral component. The second stage, or maturation, is characterized by gradual completion of enamel mineralization. At this stage, the hydroxyapatite crystals that have appeared in the first stage of mineralization continue to grow in size; simultaneously the organic matrix gradually becomes thinned. Thus, complete mineralization of enamel is very delayed in time compared to dentine. Physically it is quite understandable — the higher degree of mineralization and larger hydroxyapatite crystals in tooth enamel relative to dentine require more time to be completed. This is the primary reason why the stage of tooth enamel completion is a basis for selection (Table II).
9
2.3. Principle of the EPR method
Stable radiation-induced radicals in tooth enamel present a unique opportunity to reconstruct the absorbed dose for the tooth donor. To realize this opportunity an appropriate method for the dose readout should be selected. There have been unsuccessful attempts to use thermo- and optically stimulated luminescence for dose readout [56, 57]. Currently, EPR remains the only feasible method for dose reconstruction with tooth enamel. EPR consists of the resonant absorption of electromagnetic energy at electron-spin transitions. A static magnetic field should be applied to resolve different electron-spin levels. Unpaired electrons of free radicals have spin equal to ½. In a magnetic field there are two magnetic levels, +½ and –½ with different energies. The transition between two these levels is possible under following resonance condition
hν = gµBB, (2.1) where ν is resonance frequency, h is Plank’s constant, g is the g-factor, which is a constant approximately equal to 2 for spin of ½, µB is the Bohr magneton, which is the elementary electronic magnetic moment, and, B is the magnetic field induction An important conclusion derived from this formula is the linear dependence between the applied magnetic field and the resonance frequency. The most frequently used microwave energies lie in what is called the X band. This is because it is a good compromise between sensitivity, sample size and water content effects. For X band ν 9.8 GHz and B 350 mT.
The device for EPR registration is called an EPR spectrometer. The three main components of the EPR spectrometer are:
• an electromagnet with a regulated power supply to provide scanning of the resonance conditions;
• a microwave module consisting of microwave generator, microwave cavity and detector(s);
• a signal channel that provides amplification, purification and a record of the microwave absorption by the sample during the magnetic field scan through the resonance condition (2.1).
340 342 344 346 348-1500
-1000
-500
0
500
1000
1500
A
Br
Base line
∆ B
1st d
eriv
atio
n of
mw
abs
orpt
ion,
arb
. un.
Magnetic field, mT
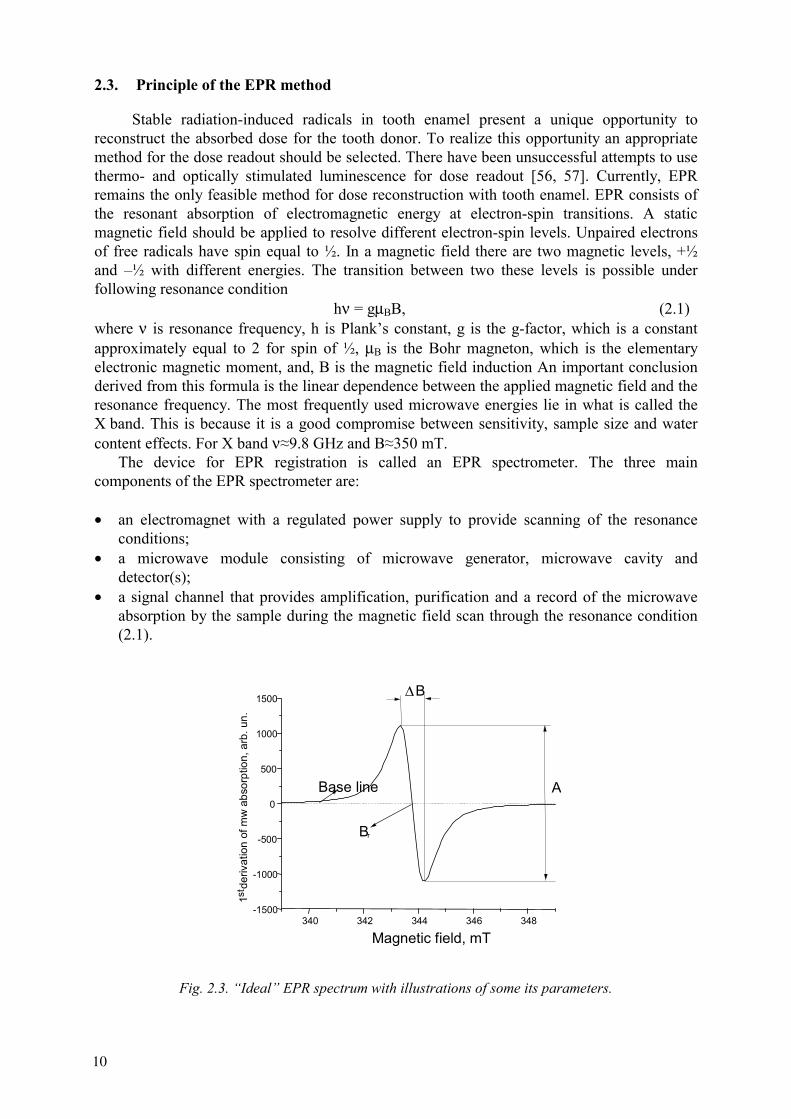
Fig. 2.3. “Ideal” EPR spectrum with illustrations of some its parameters.
10
To improve the signal-to-noise ratio, modern EPR spectrometers employ high-frequency magnetic field modulation in combination with phase-sensitive detection. A sinusoidal magnetic field (typically a few tenths of mT in amplitude and 30–100 kHz in frequency) is imposed on the much stronger external magnetic field, which slowly changes linearly. This superposition produces a slight oscillation of the total magnetic field, which, when scanning a spectral line, results in the oscillation of the degree of absorption and, hence, oscillation of the diode current. Technically, it is much easier to magnify oscillations than a constant current, and, on the other hand, the contributions of noise are restricted only to the frequencies that are close to the frequency of modulation. As a result, this arrangement produces signal-to-noise ratios that are orders of magnitude larger than would be possible without it. However, because of this system, the original spectrum line is produced not in the form of an absorption curve, as in most other spectroscopy methods, but in the form of its first derivative.
The first derivative of the resonance microwave absorption is commonly called the EPR signal. It is characterised by the following parameters (Fig. 2.3): peak-to-peak linewidth, ∆B; resonance field, Br; peak-to-peak amplitude, A.
Every free radical species has a unique EPR spectrum, which is distinguished by its line-width, shape and resonant field. The latter value is proportional to the g-factor (see Eq. 2.1), which is about the same (equal to 2) for all ½ spins. This is an unfortunate circumstance that causes most EPR signals to overlap in the spectrum. Sometimes the different line-widths and shapes are an aid, but in some cases they create problems. The peak-to-peak amplitude is usually proportional to the number of spins, and in turn for EPR dosimetry, it is also related to the radiation-induced radical yield and therefore, to the absorbed dose.
Operation of the EPR spectrometer is achieved by three sets of technical parameters chosen through its microwave, field and signal channel components. Parameter selection specific to tooth enamel samples will be given in Section 4. The most important technical EPR spectrometer parameters are sensitivity (or minimal measurable concentration of the spins per unit of the linewidth), long and short term stability, and signal-to-noise ratio. Time stability is important because EPR spectra are accumulated as a sequential passage through resonance conditions. Therefore any relative shift of the frequency or magnetic field with time will cause spectral distortion.
2.4. EPR spectrum of tooth enamel
Recently, Callens et al [58] made a comprehensive review of the EPR spectral components in carbonated hydroxyapatite. The EPR spectrum of irradiated tooth enamel contains a multitude of signals that can be divided into two categories, radiation-induced and radiation insensitive signals (Fig. 2.4). This approach is an approximation because the intensity of the so-called non-radiation sensitive EPR spectral components from tooth enamel are also slightly affected by irradiation, which is evident after irradiation with doses above one hundred Gray. However, these EPR spectral components can be considered as radiation insensitive in the application range of retrospective dosimetry.
The majority of radiation-induced radicals in tooth enamel are carbonate derived, i.e., CO2
-, CO3-, CO-, CO3
3-, but also radicals derived from phosphate, i.e., PO42-, and oxygen, i.e.,
O- and O3- were identified. The identification of radicals was based on EPR and ENDOR
(Electron Nuclear Double Resonance) measurements of irradiated synthetic hydroxyapatite doped with 13C [58]. Not all radiation-induced radicals are thermally stable, e.g., the CO3
-
radical, with g-value of the EPR signal ranging from 2.0060 to 2.0122, decays completely at room temperature during the first two weeks after irradiation [58, 59, 60]. For dose reconstruction the asymmetric EPR signal with g⊥=2.0018 and g||=1.9971 (signal maximum at g=2.0032 and minimum at g=1.9971) is used. The signal is predominantly derived from stable
11
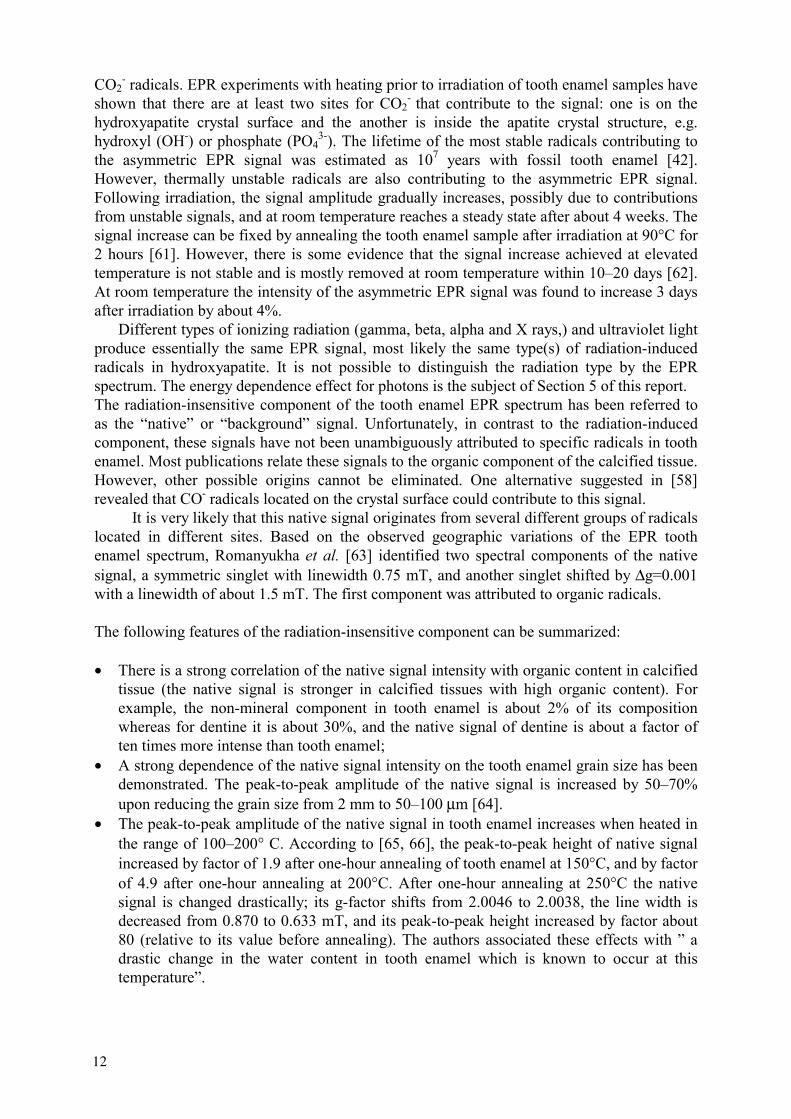
CO2- radicals. EPR experiments with heating prior to irradiation of tooth enamel samples have
shown that there are at least two sites for CO2- that contribute to the signal: one is on the
hydroxyapatite crystal surface and the another is inside the apatite crystal structure, e.g. hydroxyl (OH-) or phosphate (PO4
3-). The lifetime of the most stable radicals contributing to the asymmetric EPR signal was estimated as 107 years with fossil tooth enamel [42]. However, thermally unstable radicals are also contributing to the asymmetric EPR signal. Following irradiation, the signal amplitude gradually increases, possibly due to contributions from unstable signals, and at room temperature reaches a steady state after about 4 weeks. The signal increase can be fixed by annealing the tooth enamel sample after irradiation at 90°C for 2 hours [61]. However, there is some evidence that the signal increase achieved at elevated temperature is not stable and is mostly removed at room temperature within 10–20 days [62]. At room temperature the intensity of the asymmetric EPR signal was found to increase 3 days after irradiation by about 4%. Different types of ionizing radiation (gamma, beta, alpha and X rays,) and ultraviolet light produce essentially the same EPR signal, most likely the same type(s) of radiation-induced radicals in hydroxyapatite. It is not possible to distinguish the radiation type by the EPR spectrum. The energy dependence effect for photons is the subject of Section 5 of this report.The radiation-insensitive component of the tooth enamel EPR spectrum has been referred to as the “native” or “background” signal. Unfortunately, in contrast to the radiation-induced component, these signals have not been unambiguously attributed to specific radicals in tooth enamel. Most publications relate these signals to the organic component of the calcified tissue. However, other possible origins cannot be eliminated. One alternative suggested in [58] revealed that CO- radicals located on the crystal surface could contribute to this signal.
It is very likely that this native signal originates from several different groups of radicals located in different sites. Based on the observed geographic variations of the EPR tooth enamel spectrum, Romanyukha et al. [63] identified two spectral components of the native signal, a symmetric singlet with linewidth 0.75 mT, and another singlet shifted by ∆g=0.001 with a linewidth of about 1.5 mT. The first component was attributed to organic radicals.
The following features of the radiation-insensitive component can be summarized:
• There is a strong correlation of the native signal intensity with organic content in calcified tissue (the native signal is stronger in calcified tissues with high organic content). For example, the non-mineral component in tooth enamel is about 2% of its composition whereas for dentine it is about 30%, and the native signal of dentine is about a factor of ten times more intense than tooth enamel;
• A strong dependence of the native signal intensity on the tooth enamel grain size has been demonstrated. The peak-to-peak amplitude of the native signal is increased by 50–70% upon reducing the grain size from 2 mm to 50–100 µm [64].
• The peak-to-peak amplitude of the native signal in tooth enamel increases when heated in the range of 100–200° C. According to [65, 66], the peak-to-peak height of native signal increased by factor of 1.9 after one-hour annealing of tooth enamel at 150°C, and by factor of 4.9 after one-hour annealing at 200°C. After one-hour annealing at 250°C the native signal is changed drastically; its g-factor shifts from 2.0046 to 2.0038, the line width is decreased from 0.870 to 0.633 mT, and its peak-to-peak height increased by factor about 80 (relative to its value before annealing). The authors associated these effects with ” a drastic change in the water content in tooth enamel which is known to occur at this temperature”.
12
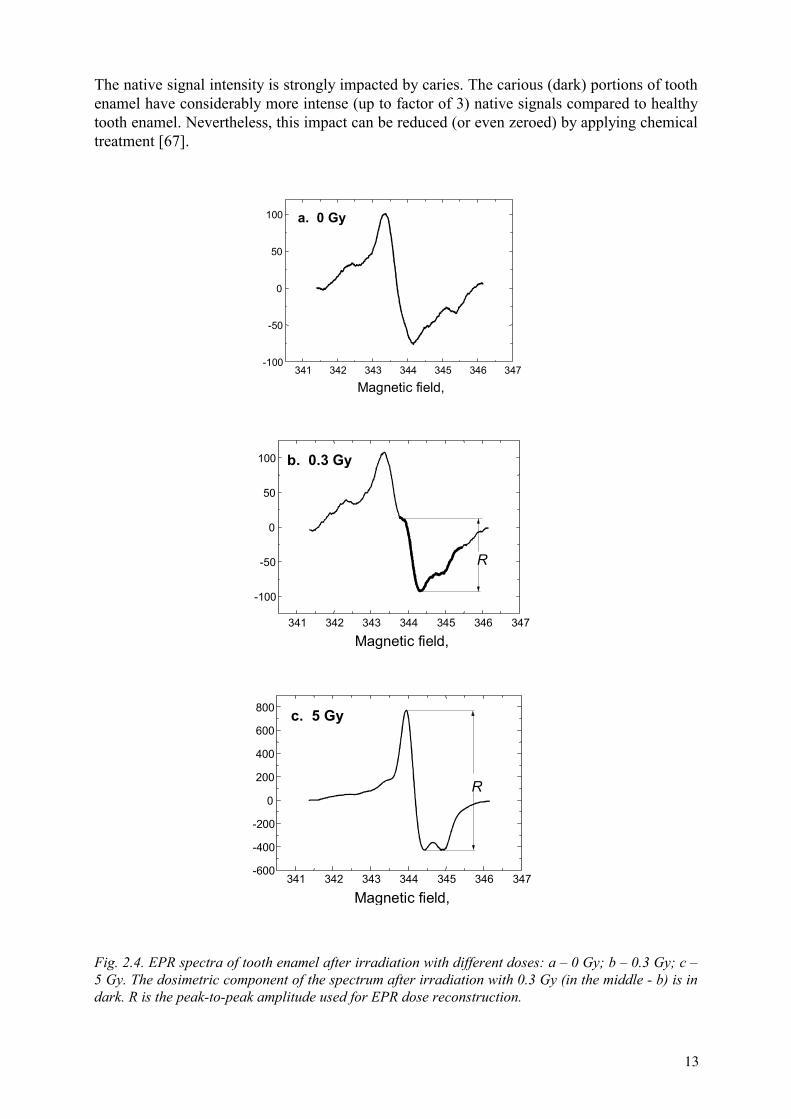
The native signal intensity is strongly impacted by caries. The carious (dark) portions of tooth enamel have considerably more intense (up to factor of 3) native signals compared to healthy tooth enamel. Nevertheless, this impact can be reduced (or even zeroed) by applying chemical treatment [67].
341 342 343 344 345 346 347-100
-50
0
50
100 a. 0 Gy
Magnetic field,
341 342 343 344 345 346 347
-100
-50
0
50
100
R
b. 0.3 Gy
Magnetic field,
341 342 343 344 345 346 347-600
-400
-200
0
200
400
600
800
R
c. 5 Gy
Magnetic field,
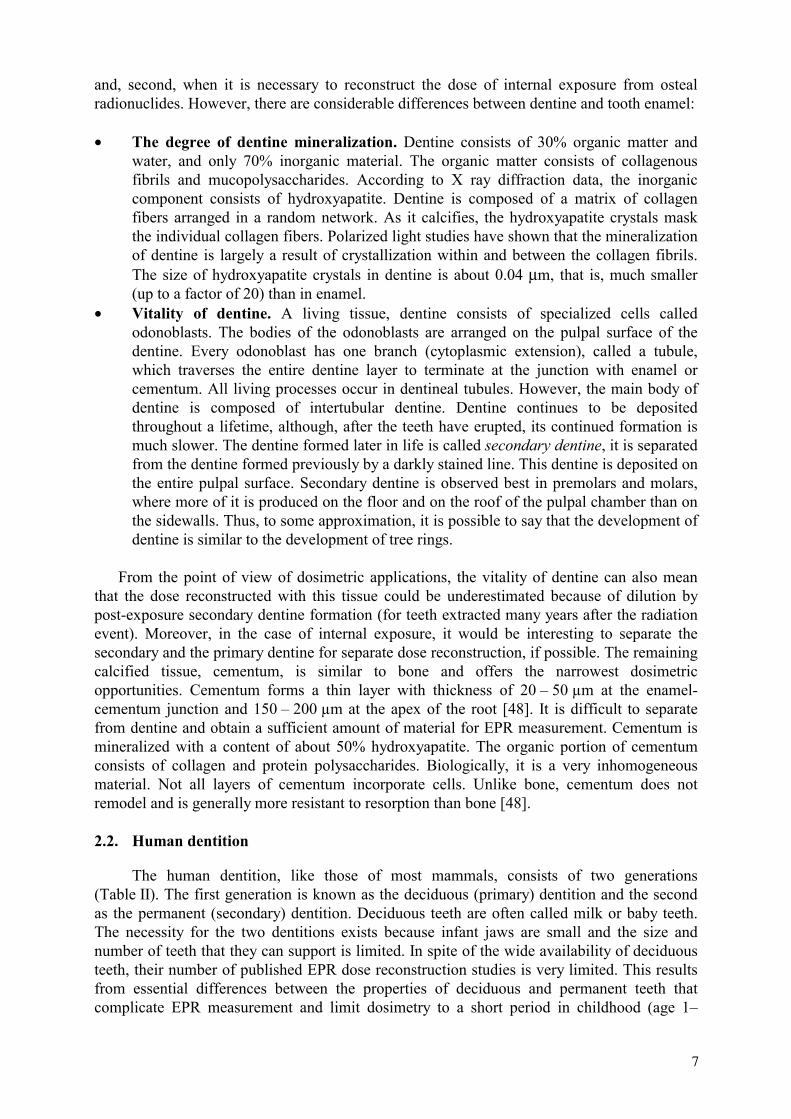
Fig. 2.4. EPR spectra of tooth enamel after irradiation with different doses: a – 0 Gy; b – 0.3 Gy; c – 5 Gy. The dosimetric component of the spectrum after irradiation with 0.3 Gy (in the middle - b) is in dark. R is the peak-to-peak amplitude used for EPR dose reconstruction.
13
3. SAMPLE PREPARATION
3.1. Introduction
Tooth enamel sample preparation is one of the essential steps of EPR dosimetry. It contributes significantly to the sample quality and consequently to the reliability of dose assessment. The goal is to obtain pure enamel samples free of residual dentine. Unfortunately, there are other sources that may also induce spurious signals or alter the tooth radiation sensitivity. The age of the tooth donor, as well as the position and health of the tooth must be established at the time of the tooth collection. Care in sample preparation is important since mechanical, thermal and chemical treatments may generate new radicals with interfering EPR signals in both the organic and inorganic components of enamel or alter EPR signals already present.
Dose reconstruction is commonly performed with powdered enamel samples. The present document will mainly focus on the methods applied to isolate enamel from the other tooth tissues and reduce it to a powder. Since sometimes enamel fragments or dentine samples are used, a brief discussion of these methods is included.
3.2. Tooth collection
The following steps will be considered: Tooth selection Tooth disinfection Tooth storage
3.2.1. Tooth selection
3.2.1.1. Sources of tooth samples
There are three potential sources of teeth that can be used for EPR dose reconstruction:
• Deciduous teeth that accumulate dosimetric information for a relatively short period of time, namely 8–10 years of childhood;
• Permanent teeth extracted or lost because of dental diseases and orthodontic reasons. They can be used for radiation dose assessment over a long period of time, namely beginning from age 8–12 years up to the time of tooth extraction. The effective time of dose accumulation depends on the tooth position (Table II). Therefore information of tooth position should be recorded. The teeth of different positions in the mouth have a different suitability for dose reconstruction. The most suitable are molars and premolars. The buccal side of the front teeth (incisors and canines) can have a considerable contribution from sunlight. It is possible to use the only lingual side of the front teeth for EPR measurements;
• Wisdom teeth (third molars) are frequently extracted during routine dental practice in the Western countries. It is an important not to confuse wisdom teeth with molars and premolars, because of their late development.
All calcified dental tissues (enamel, dentine and cementum) are suitable for retrospective dosimetry. However, tooth enamel is preferred for its high degree of mineralization and extremely low calcium withdrawal over its lifetime. Dentine remains useful for EPR dose reconstruction despite its lower quality dosimetric properties and more labor intensive
14
sample preparation. Dentine’s primary use arrives in the case of internal exposure or a lack (or a complete absence) of tooth enamel. However, it is important to keep in mind that dentine is an inhomogeneous material; portions are formed at different times, and it is continuously being laid down over its lifetime. Moreover, the radiation geometry for crown and root dentine differs. Cementum is only of minor use in dosimetry because of its high organic content fraction and inhomogeneity.
3.2.1.2. Dependence on tooth age
There are at least two reasons why tooth age should be considered in the tooth sample selection process:
• The tooth is exposed to radiation prior to its eruption, when it is not completely matured. Tooth maturation induces changes in the composition and the structure of the tooth tissues. During maturation the mineral concentration increases and the carbonate content decreases. Concurrently, an increase in the enamel mineral crystallinity occurs [68]. These modifications could affect the enamel sensitivity to radiation and lead to different radiation sensitivities of the enamel before and after eruption; however Wieser et al. [54] did not find any dependence of sensitivity with age.
• The natural background radiation contributes to the radiation-induced (CO2-) signal
intensity, and its magnitude increases with tooth age. The CO2- concentration in enamel
should increase with tooth age at a rate equivalent to approximately 1–2 mGy per year, which corresponds to the mean natural background [69]. Ivannikov et al. [36] reported a value of 0.9±0.3 mGy per year for the slope of the linear regression of the reconstructed dose relative to tooth age, obtained from molars and premolars aged up to 70 years. The most common way of accounting for the exposure to natural background radiation is to evaluate the value of the CO2
- signal of a large number of healthy teeth
that are known to have received no medical exposures. Lifetime integrated doses in the 20 mGy to 150 mGy range have been reported [30, 70, 71, 72, 73, 74].
3.2.1.3. Influences of tooth position
No difference in enamel sensitivity to ionizing radiation among teeth from different tooth positions has been detected [54, 70]. However, the use of front teeth (incisors and canines) should be avoided because exposure to sunlight can induce signals in the enamel. It was demonstrated that UV radiation induces at least two signals in enamel with spectral parameters similar to the native and radiation-induced (CO2
-) signals [36, 61, 64, 75, 76, 77].
Subsequently it was shown that the UV spectral component of sunlight may contribute to the CO2
- dosimetric signal in front teeth. Values as high as a few hundred mGy have been
reported for adult human front teeth [36, 61]. When possible, only wisdom teeth, molars and premolars should be used. In cases when only front teeth become available, it is advisable to use only the inner (lingual) side of the tooth.
3.2.1.4. Effect of the health condition of the teeth
Teeth available for EPR dosimetry are typically extracted for medical reasons, and most of these teeth are diseased. When it is not possible to discard the diseased portions of the tooth enamel, some points should be considered:
15
• The chemical composition of carious teeth differs from that of healthy teeth. In particular, the carbonate content is lower in carious enamel than in healthy enamel [52, 78, 79]. Therefore, a possible difference in the native signal intensity and its sensitivity to ionizing radiation is expected. In general, the available data on carious teeth confirm these expectations [67, 78]. In particular, Sholom et al. [67] reported an increased native signal and the same radiation sensitivity for carious parts of teeth as compared to healthy parts of the same teeth. The latter property makes use of carious teeth for retrospective dosimetry possible.
• Moreover, caries increase the porosity of enamel, which could cause a different effectiveness of chemical agents in carious teeth with respect to healthy teeth. It was found that the percent decrease in the native signal is greater in carious teeth treated with potassium hydroxide compared to healthy teeth [63, 78]. This observation should be considered when applying a sample preparation protocol that includes chemical operations to carious teeth.
• Finally, caution should also be taken in the use of repaired teeth. Some of the techniques used by dentists for tooth repair involve blue (UV) lamps, lasers, chemical etching, and mechanical operations, which may change the enamel structure or induce undesirable signals.
3.2.2. Tooth disinfection
Extracted teeth should be considered infectious because they contain blood and have the potential to cause harm. The safe handling of extracted teeth requires methods for antimicrobial and antiviral control [80]. Common methods for dental material sterilization are: formalin or sodium hypochlorite irrigation; ultrasonic bath; ethylene oxide; dry heat; and, an autoclave [81]. The last four are not applicable for teeth used in EPR dosimetry.
The widespread method for sterilization of extracted teeth is the use of about 1–5% sodium hypochlorite for 24 hours [82], although its antimicrobial activity is combined with some disadvantages, such as toxicity and discoloring [83]. Therefore prolonged use should be avoided. Formalin storage is effective for infection control purposes. It cannot, however, be recommended as a storage medium for dentine due to the variation in dentine structure induced by its use [81].
The disinfection of teeth is a mandatory procedure in many countries, however the user should be aware that there is no consensus on the best method of disinfection that could be recommended. Many of the methods are known to have negative effects on EPR signal.
3.2.3. Tooth storage
After extraction, dentists do not disinfect the teeth, but only store them in a variety of solutions for different lengths of time. Typical liquids are physiological solution, bleach, alcohol, oxygenated water, demineralized water. Effects of these storage media on the dentine and enamel have been reported in the literature [81, 83]. Generally speaking, the same consideration for sterilization methods applies to tooth storage. Therefore information should be gained about the liquid the teeth have been stored in, and when possible, dentists who provide teeth for EPR measurements should be informed as to which solution to use. Once the teeth have been collected from the dentist, they have to be disinfected, and then stored in the dark.
After sample preparation, storage temperature and humidity may influence the tooth water content. Because microwaves are strongly absorbed by water, the tooth water content
16
affects the EPR response. Therefore samples should be stored in a controlled environment. The relative humidity of the storage and measurement environments should be similar.
3.3. Sample preparation
Sample preparation of powdered enamel samples is basically performed through three steps:
Separation of roots from crown Separation of enamel from dentine Grinding of the enamel sample
3.3.1. Separation of roots from crown
The separation of crown and roots is usually performed with a power machined wheel saw of low speed below 10,000 rotation/min and preferably coated with diamond or hard alloy. Care must be taken to avoid any temperature increase in the enamel since thermally uncontrolled mechanical operations can heat the tooth to temperatures as high as 1000°C [18]. Water cooling is essential to avoid a temperature increase in enamel. It has been reported that cutting roots and crown with a saw that is not water cooled induces a signal with a g-value of about 2.0020, similar to the signals generated when the enamel is heated at temperatures above 600°C and of an intensity equivalent to that of the CO2
- signal generated by few hundred mGy of 60Co irradiation [66, 84]. The signal is generated only if the saw is used without water cooling.
To facilitate the separation of enamel from dentine, the crown is cut in two halves with saw or crushed into a few large pieces with mortar and pestle. Before proceeding to the separation of enamel from dentine, the crown can be cleaned from metallic impurities with a 0.1 M Ethylendinitrilotetraacetic Acid Disodium Salt (EDTA Na2) solution [54].
3.3.2. Separation of enamel from dentine
The separation of enamel from dentine is essential for at least two reasons:
• the organic component in dentine (30%) is higher than that in enamel (2%) [68]. Even if direct experimental proof has not yet been reported, the current consensus among EPR experts is that the native signal at g=2.0038 is due to the organic component of enamel;
• due to the lower hydroxyapatite content, the dentine response per unit mass to ionizing radiation is lower than that of enamel [85, 86]. The ratio of radiation sensitivities (response per unit dose) of enamel, crown dentine and root dentine was estimated as 7:3:1, respectively [71]. Variations in tooth enamel sensitivity among different teeth might be influenced by dentine residue.
The methods for the separation of enamel from dentine can be grouped basically in two categories: mechanical separation and chemical separation.
3.3.2.1. Mechanical separation
A dental drill is generally used in the mechanical separation method. The drill tools should be made of hard-alloy, in order to avoid metallic contamination of the sample. As in
17
the case of the saw, water cooling should be used. The use of a thermally uncontrolled drill for the separation of enamel and dentine may induce a sharp signal at g-value of about 2.002 [84, 87], similar to that described in 3.1. No effect of the dental drill speed has been reported.
3.3.2.2. Chemical separation
In the chemical method, the enamel is separated from dentine by alkaline denaturation of dentine. Pieces of the crown are treated with a 5–10 M sodium hydroxide solution or a 2 N potassium hydroxide solution [54, 88, 89, 90, 91] for several hours to several days in an ultrasonic cleaner at temperature up to 60°C. To be more effective, the chemical treatment can be prolonged for a few days, while changing the alkaline solution periodically. Nakamura and Miyazawa [10] used an 8M sodium hydroxide solution, without using the ultrasonic bath. This method requires 4 weeks. Scratching of the denatured and hence softened dentine can make the procedure more effective. One advantage of the chemical methods is that no special skill is required and that it is operator independent. The alkaline method is particularly suited for teeth containing many cracks, like those that have undergone long term storage after extraction. These teeth tend to break into small pieces under mechanical manipulations. A supplementary method is heavy liquid separation, based on the different relative densities of dentine (density 2.5 g/cm3) and enamel (density 2.9 g/cm3)[38, 79].
For effective separation of enamel visual inspection may be useful. This can be accomplished by microscopy, since dentine looks darker than enamel [90]. To better distinguish enamel from dentine, Fattibene et al. [64] proposed the use of a 365 nm UV lamp, which stimulates the blue fluorescence of dentine. At this frequency an unstable symmetric signal, which overlaps the native signal and which fades after a few days has been observed [64, 76]. A pause in the measurement cycle can reduce this effect; sample storage in the dark for at least 24 h is recommended. Higher frequency UV lamps are also effective in stimulating blue fluorescence, but should not be used because they may induce production of the CO2
- signal [75, 76].
3.3.3. Grinding of the enamel sample
Once enamel is separated from dentine, it is usually reduced to a powder, mainly by mortar and pestle. This step is recommended because with a powder sample the anisotropy of the dosimetric CO2
- signal is reduced and a higher interspecimen reproducibility of the EPR measurement is achieved. Grain size in the (0.1–1) mm range is commonly used [41]. The choice of the optimal grain size should consider the anisotropy of the dosimetric signal, preparation-induced signals, variation of enamel sensitivity to ionizing radiation, and the possible advantages and constraints of etching. The goal is to achieve the highest possible measurement precision for the dosimetric signal amplitude. Conversely, sample grinding has some disadvantages: an increase in the background signal, generation of stable signals, and dependence of the enamel sensitivity to ionizing radiation on grain size have been reported [64, 91]. The background signal increase and the generation of signals are both related to the mechanical stress to the enamel during crushing, and the effects observed are similar to those observed for the mechanical separation of enamel from dentine. Crushing with a mortar and pestle produces an increase in the native signal at g=2.0038 [34, 64, 87, 91, 92]. Conversely, if crushing is performed in a less gentle way, for instance with a drill, a new sharp signal is generated at g= 2.002 [66, 84, 87]. The signal amplitude is equivalent to that generated by few tens of Gray of 60Co irradiation. A decrease of the enamel sensitivity to ionizing radiation with decreasing grain size has been reported [91].
18
Some of the preparation operations may induce spurious signals, and measures can be used to reduce or to cancel them. Some of the procedures used for this purpose are:
• Chemical etching • Pause between sample preparation and measurement
3.3.4. Etching
Mechanically-induced radicals are stable over time and interfere with the dosimetric signal. Consequently, the mechanical treatment of a tooth should be minimized and performed as gently as possible. The use of water cooling during mechanical treatment is essential to avoid enamel temperature increases that will induce new, intense signals that would interfere with the dosimetric CO2
- signal [84, 93]. Great care should also be used with
UV exposure. However, the signals induced by mechanical operations and UV exposure are likely to be induced on the sample surface and therefore chemical etching may counteract this effect. In general, any acid can be used for chemical etching. One possibility is phosphoric acid. It has been reported that three successive 30 s etching steps with 42% phosphoric acid are effective in removing the mechanically induced signals [64]. The procedure is also effective in reducing the native signal by about 30%. An alternative etching procedure uses a 5-minute immersion of powdered enamel into a 20% acetic acid water solution in an ultrasonic bath [54, 71].
The possibility of removing the mechanically and UV-induced signals by etching proves that they are localized on the surface of the enamel grains. Fattibene et al. [64] reported a value of 35µm for the thickness of the surface layer where the mechanically-induced signals are localized. The depletion of enamel mass during etching prevents the use of too fine a grain size. Indeed, enamel grains less than 100 µm in size would be practically lost during etching. Parts of the tooth affected by caries are characterized by a more intense native signal with respect to healthy parts of the tooth. When a carious tooth must be used, the native signal can be reduced by sodium hydroxide treatment in an ultrasonic bath [67].
3.4. Pause between sample preparation and measurement
Transient signals can be eliminated by heating in a ventilated oven at temperatures around 90–95°C for 2 hours [91]. Higher temperatures should be avoided because they have not been proved to be harmless with respect to the introduction of new signals or to decrease of the radiation-induced signal. An alternative way for eliminating transient signals is to store samples for certain time before EPR measurement. The storage time depends on the lifetime of the unstable signals induced by sample operations, on the type of signals, and on the operations that induced the signals. For the fading of the transient UV-induced signal, a period of 1 week has been suggested, if no chemical etching is performed [76]. If chemical etching is performed, a 24 h period is sufficient to reduce the unstable signal to a negligible intensity [64].
Before EPR measurements, the samples need to be dried well to avoid microwave absorption by water. This drying could be achieved by annealing samples for at least 10 hours at 50oC– 60oC. However, it is sufficient to dry the samples in vacuum (< 5 kPa) at 40°C for 30 minutes or at normal air pressure for 3 days at room temperature and below 60% relative humidity.
19
3.5. Other methods
Sometimes the enamel sample is not prepared as powder but as fragments [55, 94]. Enamel chips are cut by surgical pliers or by diamond cutter. Dentine is further removed from the chips with a chemical treatment, e.g. sodium- or potassium-hydroxide ultrasound washing.
3.6. Separation of dentine
When dentine has to be measured, the methods described above may not be appropriate, since dentine is destroyed in most of the described procedures. Mechanical separation is likely to be the most conservative when dentine has to be used. In the case of dentine the main problem involves the presence of the organic component, which is about 30% relative weight. The reduction of the organic component of EPR spectra in dentine can be obtained with a chemical treatment with diethyltriamine in a Soxhlet apparatus for a few days and then a Soxhlet treatment with distilled water [71, 86]. This treatment was proven effective in reducing the intensity of the EPR signal from the organic component. It does not affect the radiation sensitivity of the sample. Attention should be given to temperature increase during the Soxhlet treatment, which in some cases can be higher than 200°C.
20
4. EPR MEASUREMENTS
4.1. Spectrometer parameters
As mentioned in Section 2 there are three groups of parameters responsible for EPR spectrometer operation: magnetic field, microwave, and signal channel parameters. The aim of this Section is to provide a basis for proper selection of parameters necessary to record an EPR spectrum of CO2
- radicals as well as the overlapping signals. Although EPR spectra can be measured by applying microwaves at frequencies in the 1 GHz (L-band) to 100 GHz (W-band) range, microwaves of the X band (9–10 GHz) are commonly used in tooth enamel dose reconstruction. Therefore, the EPR spectral parameter selection criteria will apply to this frequency band only.
4.1.1. Microwave parameters
The term “microwave frequency” in this report refers to the resonant frequency of the loaded microwave cavity. It is dependent on the type of cavity and properties of the inserted sample. For EPR measurements in the X band the microwave frequency is typically selected to be close to 9.8 GHz.
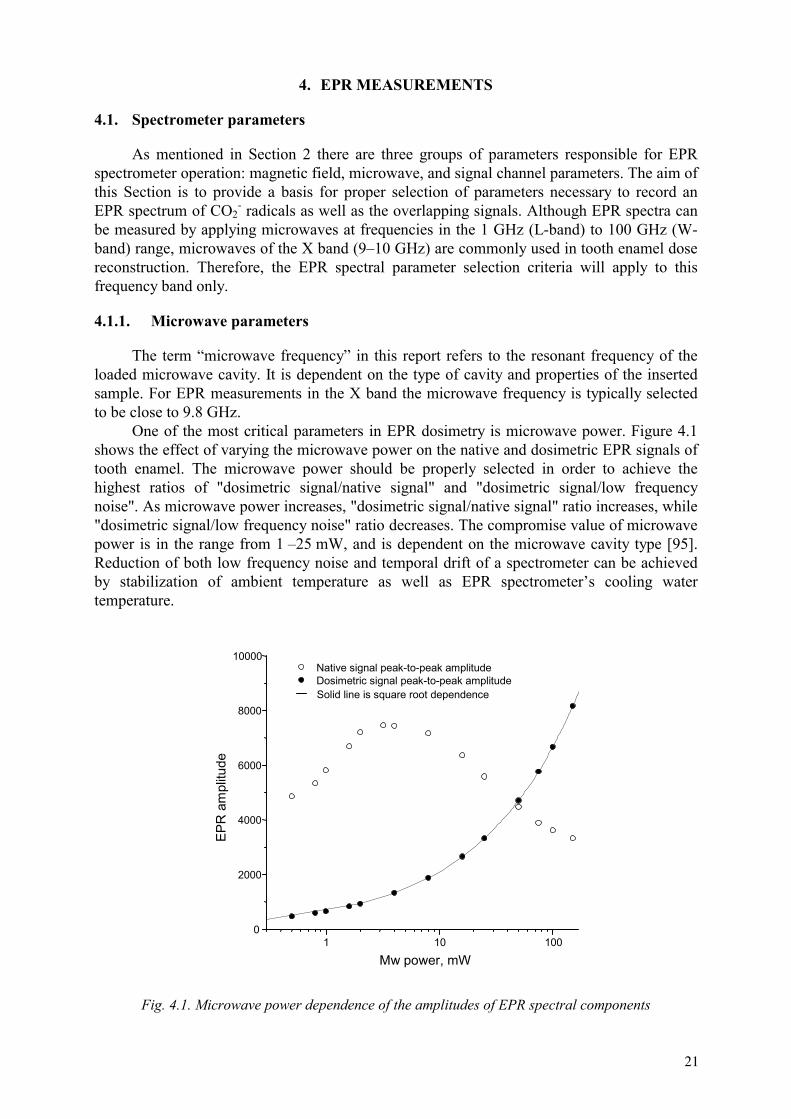
One of the most critical parameters in EPR dosimetry is microwave power. Figure 4.1 shows the effect of varying the microwave power on the native and dosimetric EPR signals of tooth enamel. The microwave power should be properly selected in order to achieve the highest ratios of "dosimetric signal/native signal" and "dosimetric signal/low frequency noise". As microwave power increases, "dosimetric signal/native signal" ratio increases, while "dosimetric signal/low frequency noise" ratio decreases. The compromise value of microwave power is in the range from 1 –25 mW, and is dependent on the microwave cavity type [95]. Reduction of both low frequency noise and temporal drift of a spectrometer can be achieved by stabilization of ambient temperature as well as EPR spectrometer’s cooling water temperature.
1 10 1000
2000
4000
6000
8000
10000
Solid line is square root dependence
Native signal peak-to-peak amplitude Dosimetric signal peak-to-peak amplitude
EPR
am
plitu
de
Mw power, mW
Fig. 4.1. Microwave power dependence of the amplitudes of EPR spectral components
21
4.1.2. Magnetic field parameters
Two parameters are related to magnetic field: center value and sweep width of constant magnetic field. Sweep time, time constant and spectrum resolution are discussed here for practical reasons, though they formally relate to the signal channel parameters (see Section 4.1.3. below).
The central value of magnetic field is determined by microwave frequency (see equation (2.1)) and is chosen in such a way that dosimetric signal of enamel is placed in the center of magnetic field sweep. The center of the magnetic field sweep is approximately 350 mT for a frequency of 9.8 GHz and an EPR signal around g=2.0 (main line of the dosimetric signal). The sweep width of the magnetic field is determined by the type of post-recording spectrum manipulation procedure which is used for dosimetric signal evaluation. If a spectrometer standard sample of Mn2+:MgO or Mn2+:CaO is recorded simultaneously, its typical value is 5 mT or 10 mT [41, 43, 74].
Magnetic field sweep time for modern EPR spectrometers is calculated as a product of the number of channels used in spectrum acquisition (spectrum resolution) and the accumulation time (conversion time) of each channel. EPR signals are recorded practically free of distortion if the sweep time through the signal’s peak-to-peak line width is at least 10 times longer than the time constant of the signal channel low-pass filter. For undistorted recording of the dosimetric EPR signal of tooth enamel (which has approximately 0.4 mT in width), the sweep time should be set up to 250 and 500 times longer than the time constant for a 5 and 10 mT sweep width, respectively. Typical sweep times are in the range between 20 and 80 seconds.
Resolution of the EPR spectrum is determined by the number of channels used by the signal channel ADC (analog-to-digital converter) for spectrum acquisition. Typically, to provide a resolution of 0.01 and 0.005 mT for sweep width of 10 and 5 mT, respectively, 1024 channels are used.
4.1.3. Signal channel
The following signal channel parameters have to be set: modulation frequency, modulation amplitude, harmonic of field modulation signal, time constant, conversion time, number of scans. Selection of time constant and conversion time parameters are discussed in Section 4.1.2.
Frequency of the magnetic field modulation should be set as high as possible to achieve the best signal-to-noise ratio. However, the upper limit is set to provide broadening of very narrow EPR signals at high modulation frequency. In practice, most commercial EPR spectrometers operate with 50 or 100 kHz modulation frequency. For these values of modulation frequency, EPR lines must be broader than about 0.02 or 0.04mT, respectively.
A very important parameter of the signal channel in EPR dosimetry is the modulation amplitude. Usually the modulation amplitude is determined by EPR lines’ width. Since in EPR tooth dosimetry the dosimetric signal strongly overlaps the native signal, the modulation amplitude should not exceed the distance between lines. Hence, 0.4 mT is usually a maximum value of modulation amplitude. The use of the higher values is not practical because it leads to broadening of the dosimetric signal and reduction of signal resolution. It was shown experimentally [95] that the lowest uncertainty of dose assessment was achieved for modulation amplitude in the range of 0.1–0.4 mT.
Other parameters of spectrum registration are described below [41, 43, 74]. The first harmonic of the magnetic field modulation signal is usually used to detect the tooth enamel
22
EPR spectrum. EPR signal accumulation with n scans produces a signal-to-noise ratio
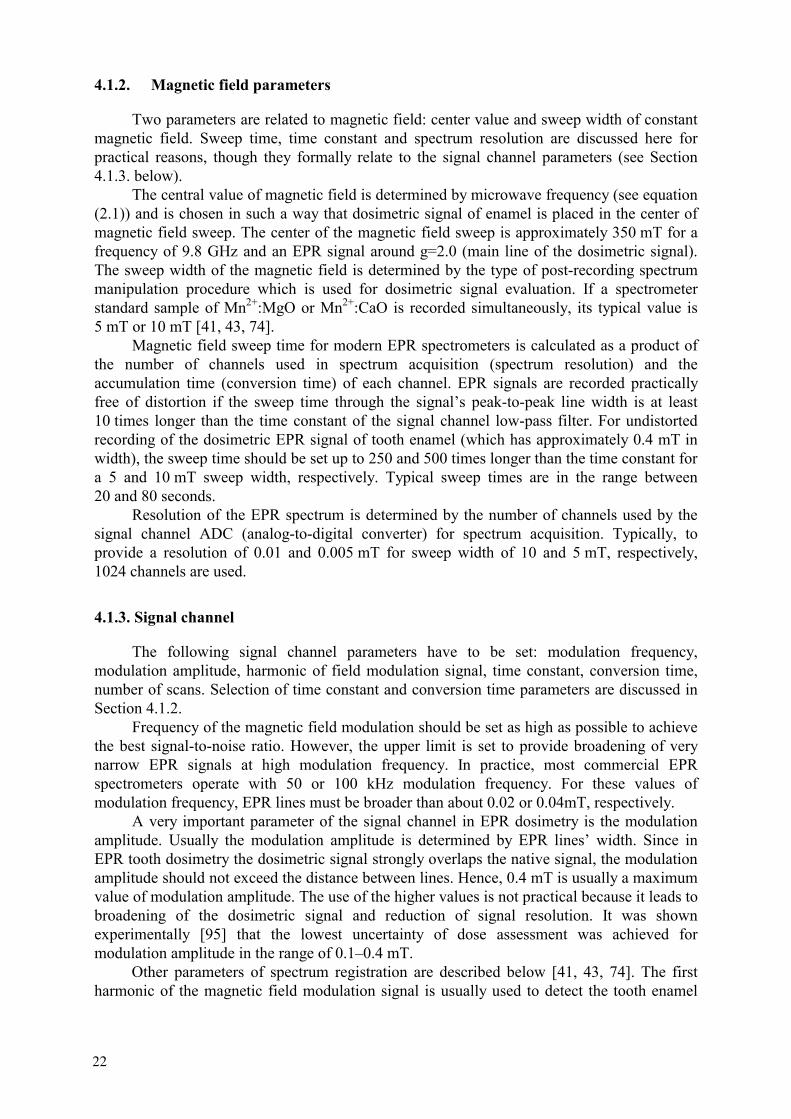
enhancement of n . However, a large number of scans coupled with long scan times can be a disadvantage because of temporal fluctuations in spectrometer sensitivity, including the instability of electronic devices, microwave cavity quality factor and power output. Fluctuations in the stability of the magnetic field and microwave frequency can be compensated by using a field-frequency lock device (see section 4.6). The total spectrum recording time should not exceed about 2 hours. Optimal values for the spectrum registration parameters are summarized in Table III.
Table III. Typical settings of EPR spectrometer parameters for measurement of tooth enamel
Magnetic field parameters Microwave parameters Signal channel parameters Center field: ca. 350 mT
Microwave frequency: ca. 9.8 GHz
Modulation frequency: 50 or 100 kHz
Sweep width: 5 or 10 mT
Microwave power: 1–25 mW
Modulation amplitude: 0.1–0.4 mT
Time of sweep: 20–80 s
Conversion time: 20–160 ms
Resolution: 1024 channels
Time constant: 40–700 ms
Number of scans: 10–160
Harmonic: First
4.2. Assessment of radiation response
The radiation-induced component in the EPR spectrum can be visually distinguished only at doses higher than 0.2–0.3 Gy. At lower doses the broad native signal obscures the radiation-induced signal. Hence, it is necessary to subtract the broad radiation-insensitive signal from the total spectrum, or to extract the obscured information by other methods. Three main techniques of signal evaluation at low doses are currently being applied [41]. These techniques use different procedures to eliminate the native signal and to measure the intensity of the dosimetric signal. The extraction of the spectrum of the empty sample tube from measured spectra is the common option for all techniques.• Deconvolution methods. Mathematical simulation of the native and dosimetric signals is
done to approximate the EPR spectrum of tooth enamel. The method is distinguished by the type of EPR signal simulation and approximation used. The amplitude of the dosimetric signal results from an amplitude parameter providing the best fit to the measured spectrum. Two common approximation routines are used: − The first is a least-square method with optional realizations of the EPR signals by (a)
combination of Gaussian functions [88, 96, 97, 98, 99]; b) combination of Gaussian, Lorentzian and anisotropy functions [100]; (c) EPR powder spectrum simulation [101], and (d) standard EPR spectra obtained from non-irradiated and enamel samples irradiated with high dose (about 5 Gy).
− The second approximation routine is based on the multivariate statistical spectrum decomposition method (Maximum Likelihood Common Factor Analysis (MLCFA)
23
[25]. The principle of the method is based on the assumption that the observed EPR spectrum is influenced linearly by a small number of hypothetical constructs (i.e. the contribution of specific radicals), called common factors. Real component spectra are derived from the calculated common factors and are used to simulate the observed spectrum.
• Spectrum subtraction method. The EPR spectrum of a non-irradiated reference sample is subtracted from the spectrum of the irradiated sample [31, 53, 55, 102, 103, 104]. The reference sample is prepared from homogenized enamel material collected form teeth of several young adults [31]. A single sample is selected if it is needed to have a highly symmetric native EPR line [104]. These methods are similar, but have a few distinctions. First, the methods differ by the native signal spectrum that was chosen as a standard. The EPR spectrum of deciduous tooth enamel was used as a standard by Skvortzov et al. [104] rather than a mixture of unexposed permanent teeth used by Chumak et al. [31] and Haskell et al. [53]. Second, Skvortzov et al. [104] use a spectral fit with regard to the width and position of the native signal before subtraction, while the authors [31] and [53] fit the native signal intensity after g-factor spectrum normalization. A distinctive feature of the method used in [31] is a check of the resulting spectra against a 10-Gy dosimetric signal standard. Since subtraction techniques use a spectrum of an unexposed sample as a native signal standard, both the native signal and the initial dose (see Section 4.3) are eliminated. However, there is some variability in the native signal shape, which either is not considered at all [31, 53], or is considered only partially [104]. The amplitude of the dosimetric signal is measured from the resulting spectrum. Gualtieri et al. [55] suggested to modify this method and to use the low-field wing of the native signal from the sample to construct the non-irradiated spectrum for the subsequent subtraction. As it was shown previously [70, 105], any relatively small deviation of the line shape, its position, or width between the standard of the native signal and the original native signal from the real tooth enamel sample will contribute to the dose response.
The third category of methods for radiation response assessment comprises so-called alternative techniques. At present, the selective saturation method and the second derivative method [106] are included in this group. The selective saturation method [107, 108] is based on the fact that above a certain level of microwave power the intensity of the dosimetric signal monotonically increases with power, while the intensity of the native background signal saturates. The native signal is subsequently eliminated by the subtraction of spectra recorded at two levels of microwave power above the onset of saturation for the native background signal. The amplitude of the dosimetric signal is determined from the resulting spectrum. Another method makes use of the fact that the second-derivative signal of the EPR absorption spectrum demonstrates enhanced spectral resolution [106]. The amplitude of the dosimetric signal is measured in the second-derivative spectrum, without subtracting the native background signal.
4.3. System bias
Various methods of dose response evaluation may introduce a bias into the dosimetric signal intensity estimate. The value of this bias (sometimes called “initial dose” or “intrinsic signal”) can be equivalent to doses up to 300 mGy depending on the method used [30, 36, 74]. Presently, there is no evidence to justify the existence of paramagnetic centers that are the same as the CO2
- radicals and unresponsive to radiation. The detection of this bias and its possible influence on dose reconstruction techniques are mainly determined by the procedure of dosimetric signal evaluation. For example, if the method of native signal subtraction is
24
used, the choice of the standard for the native signal is very important. Specifically, if a standard spectrum is obtained from a mixture of enamel from a few tens of unexposed wisdom teeth from people under 20–25 years [31], the bias will be negligible. If a spectral deconvolution technique is applied, the result will be determined by the degree of adequacy of approximation of the spectra from real samples by the model spectra. Other possible reasons for the bias may be related to the sample-to-sample variation in the native signal shape and parameters [70, 105].
4.4. Sample position in the cavity
The microwave cavity is characterized by a so-called working volume, within which both the distribution of microwave field and modulation amplitude are practically homogeneous. The working volume is localized in the center of the cavity and has dimensions of at least 5 mm in diameter and 10 mm in height. The placement of the sample within the working volume is a necessity but this does not guarantee a linear dependence between the sample mass and EPR signal intensity. For example, a linear response was observed by Iwasaki et al. [109] for sample masses up to 300 mg. This result is only valid for a very large working volume of the cavity when accompanied by a weak perturbation of the microwave field distribution by the sample (the specific type of resonator is not indicated in cited paper [109]). Therefore, before using linear mass normalization, it is necessary to determine the range of masses for the particular type of cavity within which the linear dependence of EPR signal intensity versus sample mass is valid. If the sample mass is out of linear range, an empirical non-linear dependence between the EPR intensity and mass could be used for mass normalization. Frequently, the sample tube placement is fixed in the cavity on a special pedestal in order to improve reproducibility of the EPR measurements. In this case there is a deviation from linear dependence between EPR intensity and mass [110].
4.5. EPR spectrometers
Commercially manufactured EPR spectrometers can be divided in three categories or classes:
• Large research instruments with the highest possible sensitivity, accessories or supplemental hardware, availability of parameter variation, powerful built-in computer, and a potential for broad applications;
• Middle-class spectrometers with more limited opportunities for parameter variations, but with about the same sensitivity and stability as large spectrometers;
• Small, relatively inexpensive, compact spectrometers for narrow applications, with reduced sensitivity.
• EPR tooth biodosimetry requires at least the middle-class EPR spectrometers.
4.6. Additional instrumentation
The use of some optional instrumentation in EPR dosimetry with tooth enamel is described below. A goniometer is used to average the anisotropy of enamel sample even if the sample is finely ground (e.g., grain size of few hundred microns — see Section 3.3.3). A goniometer may be used in two different ways:
25
• The first, to rotate continuously the sample tube during the spectrum registration [111]. • The second, to record the several sample spectra at different angles relative to constant
magnetic field direction with a subsequent summation of all spectra after their g-factor normalization.
Both methods produce the same results if resonance conditions are not changed significantly during rotation. In particular, this is the case for samples with a mass of 100 mg or lower, which are recorded using a standard rectangular resonator. However, if the resonant frequency is significantly changed during the sample rotation, the second method is preferred because it accounts for possible shifts in line positions of spectra recorded at different angles.
A g-factor standard sample is usually used in the EPR technique to improve the measurement reproducibility through manipulation of spectra, which are previously calibrated by their g-factor values [19]. Application of the standard sample replaces, in some way, coupled application of NMR gaussmeter and frequency counter (their simultaneous use in EPR spectrometers permits register spectra in terms of g-factors). In EPR tooth dosimetry, a NMR gaussmeter and frequency counter may also be replaced by the field-frequency lock, which assures the recording of EPR spectra of any sample in the same g-factor region (g ≈2.0). This property of the field-frequency lock is extremely useful in EPR tooth dosimetry since it eliminates the need to align spectra with respect to their g-factor values.
A heat exchanger and temperature controller assure temperature stabilization during EPR measurement sessions. This provides better stability of low-frequency noise in the spectra of measured samples and facilitates the elimination of low-frequency noise when the technique of recording and subtracting the spectrum of an empty tube is employed. An additional advantage of a heat exchanger is the increase in lifetime of the water-cooling system.
26
5. DOSE ESTIMATION
5.1. Description of the problem EPR biodosimetry in tooth enamel provides dose information that will support epidemiological studies concerning the health effects of ionizing radiation, or that may be used by physicians trying to assess treatment plans for an accidental exposure. Therefore, the EPR dose response measured must be translated into absorbed dose units that are relevant to these demands. This procedure is divided in two consecutive steps:
• assignment of the measured EPR radiation response in tooth enamel to the quantity absorbed dose in enamel;
• modification based on additional information such as exposure type, spectrum and conditions, the calculation of air kerma at a reference point outside of the human body and a subsequent calculation of the whole body dose or dose to specific organs.
5.2. Calibration of EPR radiation response in terms of absorbed dose in tooth enamel
The assignment of absorbed dose from the peak-to-peak amplitude of the EPR dosimetric signal (Fig. 2.4) is based on a linear dose dependence. Typically, the peak-to-peak amplitude of the g⊥= 2.0018 line (R on Fig. 2.4; or its corresponding parameter if signal deconvolution methods are applied) approximates the concentration of radiation-induced CO2
- radicals in enamel. The dose response of these radicals in enamel or bone has been studied intensively and was found to be linear at least up to 300 Gy [112, 113, 114, 115, 116, 117]. Since the doses encountered ordinarily in biodosimetry do not exceed a few tens of Gray, linearity is not an issue. The assessment of the absorbed dose in enamel can be done by the additive dose method, partial calibration method, or by dose calibration curve (dose response curve). However, no significant difference in the accuracy of the dose reconstruction was found using different calibration methods [41]. For dose assessment by the additive dose method, the radiation sensitivity of each sample is individually calibrated. Each sample is incrementally irradiated with at least 14 additional doses in increments of 0.1–0.5 Gy [118]. A linear regression analysis is applied to the EPR measurements at each dose increment and the original, laboratory-unirradiated sample measurement. The original absorbed dose in the sample is obtained from the negative intercept of the regression line with the dose axis. In the partial calibration method the individual radiation sensitivity of a sample is determined using only a small fraction (ca. 25 mg) of the whole enamel sample [110, 119] and exposing it to one large dose of about 10 Gy. The original dose is determined from the evaluated sensitivity and the dosimetric signal of the remaining main fraction of the enamel sample (which can be kept for future evaluations). The calibration curve method for dose reconstruction is non-destructive and much less time-consuming, it originates from the assumption that the variation of radiation sensitivity in enamel from different individuals is moderate (see Section 2). A calibration curve can be established by using at least 5 molars of young adults with known external exposures for calculation of the background dose. The teeth should be irradiated with at least four additional doses, e.g., 0.1, 0.5, 1 and 10 Gy. The parameters of the calibration curve, slope and intercept with dose axis are determined by linear regression analysis. The intercept with the dose axis (after subtraction of background dose) represents the bias or intrinsic dose signal (see Section 4).
27
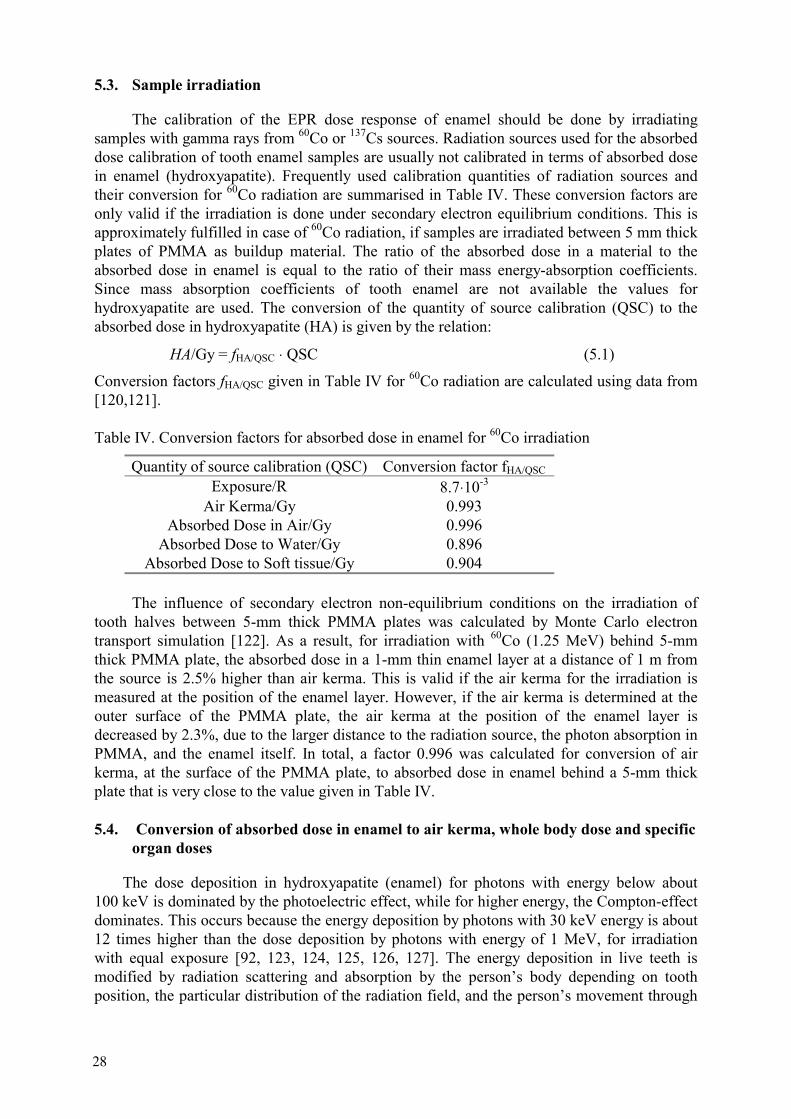
5.3. Sample irradiation
The calibration of the EPR dose response of enamel should be done by irradiating samples with gamma rays from 60Co or 137Cs sources. Radiation sources used for the absorbed dose calibration of tooth enamel samples are usually not calibrated in terms of absorbed dose in enamel (hydroxyapatite). Frequently used calibration quantities of radiation sources and their conversion for 60Co radiation are summarised in Table IV. These conversion factors are only valid if the irradiation is done under secondary electron equilibrium conditions. This is approximately fulfilled in case of 60Co radiation, if samples are irradiated between 5 mm thick plates of PMMA as buildup material. The ratio of the absorbed dose in a material to the absorbed dose in enamel is equal to the ratio of their mass energy-absorption coefficients. Since mass absorption coefficients of tooth enamel are not available the values for hydroxyapatite are used. The conversion of the quantity of source calibration (QSC) to the absorbed dose in hydroxyapatite (HA) is given by the relation:
HA/Gy = fHA/QSC ⋅ QSC (5.1)
Conversion factors fHA/QSC given in Table IV for 60Co radiation are calculated using data from [120,121].
Table IV. Conversion factors for absorbed dose in enamel for 60Co irradiation
Quantity of source calibration (QSC) Conversion factor fHA/QSC
Exposure/R 8.7⋅10-3
Air Kerma/Gy 0.993 Absorbed Dose in Air/Gy 0.996
Absorbed Dose to Water/Gy 0.896 Absorbed Dose to Soft tissue/Gy 0.904
The influence of secondary electron non-equilibrium conditions on the irradiation of tooth halves between 5-mm thick PMMA plates was calculated by Monte Carlo electron transport simulation [122]. As a result, for irradiation with 60Co (1.25 MeV) behind 5-mm thick PMMA plate, the absorbed dose in a 1-mm thin enamel layer at a distance of 1 m from the source is 2.5% higher than air kerma. This is valid if the air kerma for the irradiation is measured at the position of the enamel layer. However, if the air kerma is determined at the outer surface of the PMMA plate, the air kerma at the position of the enamel layer is decreased by 2.3%, due to the larger distance to the radiation source, the photon absorption in PMMA, and the enamel itself. In total, a factor 0.996 was calculated for conversion of air kerma, at the surface of the PMMA plate, to absorbed dose in enamel behind a 5-mm thick plate that is very close to the value given in Table IV.
5.4. Conversion of absorbed dose in enamel to air kerma, whole body dose and specific organ doses
The dose deposition in hydroxyapatite (enamel) for photons with energy below about 100 keV is dominated by the photoelectric effect, while for higher energy, the Compton-effect dominates. This occurs because the energy deposition by photons with 30 keV energy is about 12 times higher than the dose deposition by photons with energy of 1 MeV, for irradiation with equal exposure [92, 123, 124, 125, 126, 127]. The energy deposition in live teeth is modified by radiation scattering and absorption by the person’s body depending on tooth position, the particular distribution of the radiation field, and the person’s movement through
28
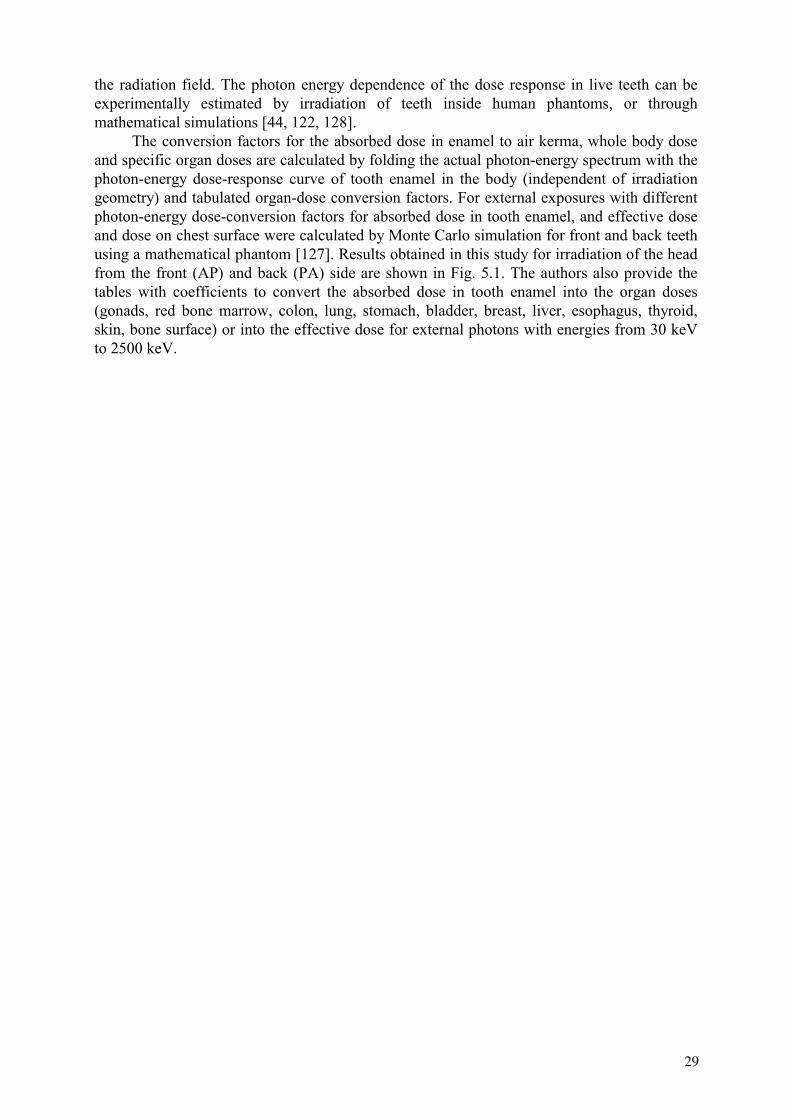
the radiation field. The photon energy dependence of the dose response in live teeth can be experimentally estimated by irradiation of teeth inside human phantoms, or through mathematical simulations [44, 122, 128].
The conversion factors for the absorbed dose in enamel to air kerma, whole body dose and specific organ doses are calculated by folding the actual photon-energy spectrum with the photon-energy dose-response curve of tooth enamel in the body (independent of irradiation geometry) and tabulated organ-dose conversion factors. For external exposures with different photon-energy dose-conversion factors for absorbed dose in tooth enamel, and effective dose and dose on chest surface were calculated by Monte Carlo simulation for front and back teeth using a mathematical phantom [127]. Results obtained in this study for irradiation of the head from the front (AP) and back (PA) side are shown in Fig. 5.1. The authors also provide the tables with coefficients to convert the absorbed dose in tooth enamel into the organ doses (gonads, red bone marrow, colon, lung, stomach, bladder, breast, liver, esophagus, thyroid, skin, bone surface) or into the effective dose for external photons with energies from 30 keV to 2500 keV.
29
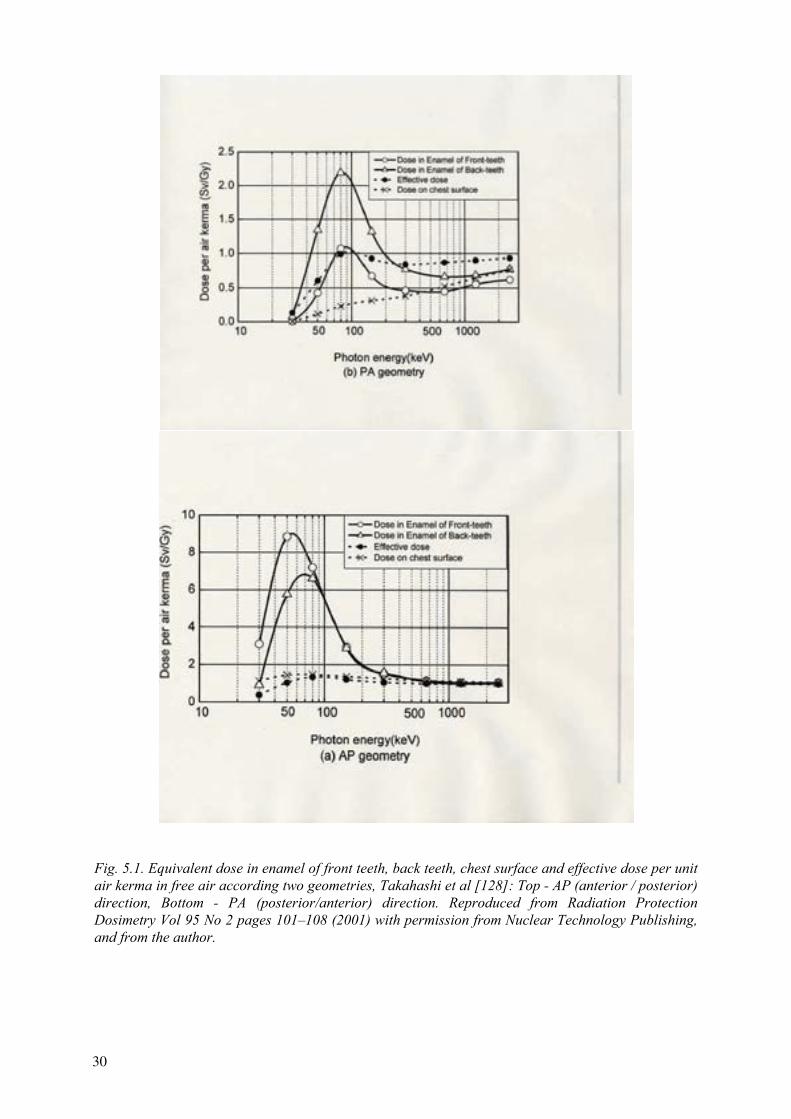
Fig. 5.1. Equivalent dose in enamel of front teeth, back teeth, chest surface and effective dose per unit air kerma in free air according two geometries, Takahashi et al [128]: Top - AP (anterior / posterior) direction, Bottom - PA (posterior/anterior) direction. Reproduced from Radiation Protection Dosimetry Vol 95 No 2 pages 101–108 (2001) with permission from Nuclear Technology Publishing, and from the author.
30
6. UNCERTAINTIES IN DETERMINATION OF ABSORBED DOSE IN ENAMEL
6.1. Introduction
The following uncertainty estimate is related to the measurement of absorbed dose in tooth enamel. Additional sources of uncertainty as given in section 6.2.6 need to be considered for the estimation of uncertainty of an individual dose.
The result of a measurement is only an approximation or estimate of the actual value and thus is complete only when accompanied by a statement of its uncertainty. In order to express the uncertainty of EPR dose reconstruction in tooth enamel, a concept similar to one presented in the ISO recommendations and the ASTM Standards can be used [129, 130]. Among possible sources, that may contribute to the uncertainty of radiation dose assessment by EPR tooth biodosimetry, are:
• Fading (σFADING)• Sample preparation (σSAMPLE)• EPR measurements (σEPR)• Numerical treatment of spectra ( σTREAT)• Calibration of EPR dose response (σCALIB);
Total combined uncertainty of the EPR tooth enamel dose can be expressed as
σEPRDOSE =( σFADING2 + σSAMPLE
2 + σEPR2 + σCALIB
2 + σTREAT2 )1/2 (6.1)
under the assumption that all individual uncertainties are uncorrelated. Here each of components, σN, is in turn an uncertainty combined from several sub-components. According to [129] the uncertainties may be grouped into two categories: Type A (those are evaluated by statistical methods) and Type B (those which are evaluated by non-statistical methods).
6.2. Analysis sources of uncertainties
6.2.1. Fading
In palaeontological dating studies by EPR, the lifetime of CO2- radicals in enamel has
been estimated to be 107 years [42] for fossil enamel. Comparisons of the stability of CO2-
radicals in fossil enamel and enamel of living organisms have been made [62, 79, 131]. Possible problems with carious teeth are also discussed in [132, 133]. There are indications that the radiation-induced CO2
- radicals in sound tooth enamel used for dose reconstruction are stable in vivo during a human lifetime [18, 26, 34, 60, 71, 86, 88]. Thus, there is no evidence that fading contributes to the overall uncertainty of EPR dose reconstruction with sound tooth enamel. Thus, σFADING = 0.
6.2.2. Sample preparation
Currently, there are several approaches to the sample preparation step (see Section 3). From the results of international comparisons of EPR dose reconstruction no influence of the chosen method of sample preparation could be identified within the limits of measurement uncertainty [41, 43]. Small modifications in the application of one method was found to produce variations in sample radiation sensitivity of 10% [124]. Thus, σSAMPLE = 10%.
31
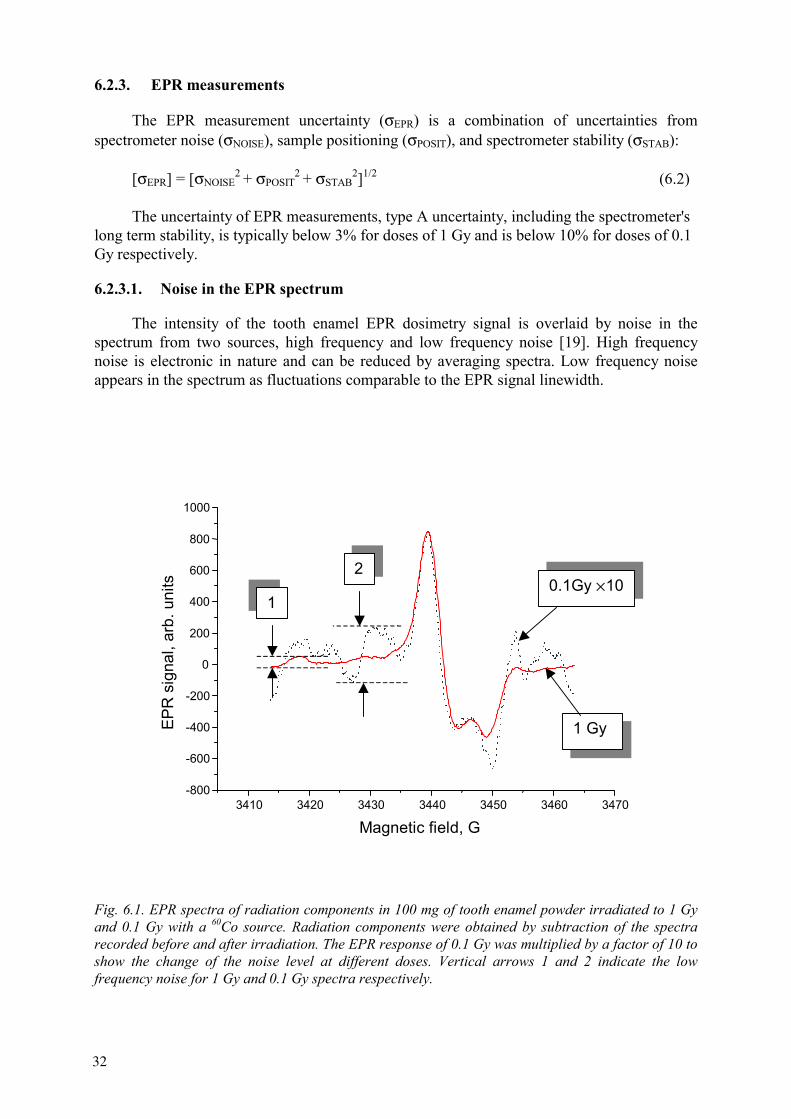
6.2.3. EPR measurements
The EPR measurement uncertainty (σEPR) is a combination of uncertainties from spectrometer noise (σNOISE), sample positioning (σPOSIT), and spectrometer stability (σSTAB):
[σEPR] = [σNOISE2 + σPOSIT
2 + σSTAB2]1/2 (6.2)
The uncertainty of EPR measurements, type A uncertainty, including the spectrometer's long term stability, is typically below 3% for doses of 1 Gy and is below 10% for doses of 0.1 Gy respectively.
6.2.3.1. Noise in the EPR spectrum
The intensity of the tooth enamel EPR dosimetry signal is overlaid by noise in the spectrum from two sources, high frequency and low frequency noise [19]. High frequency noise is electronic in nature and can be reduced by averaging spectra. Low frequency noise appears in the spectrum as fluctuations comparable to the EPR signal linewidth.
3410 3420 3430 3440 3450 3460 3470-800
-600
-400
-200
0
200
400
600
800
1000
EPR
sig
nal,
arb.
uni
ts
Magnetic field, G
1 Gy
0.1Gy ×101
2
Fig. 6.1. EPR spectra of radiation components in 100 mg of tooth enamel powder irradiated to 1 Gy and 0.1 Gy with a 60Co source. Radiation components were obtained by subtraction of the spectra recorded before and after irradiation. The EPR response of 0.1 Gy was multiplied by a factor of 10 to show the change of the noise level at different doses. Vertical arrows 1 and 2 indicate the low frequency noise for 1 Gy and 0.1 Gy spectra respectively.
32

The signal-to-noise ratio of the EPR spectrometer is defined by the ratio of “maximal intensity of EPR signal”, IEPR, to the “maximal intensity of the noise”, INOISE. In the example shown in figure 6.1, the signal-to-noise ratio varies from 3 to 30 for absorbed doses of 0.1 Gy to 1 Gy respectively. These numbers can vary depending on quality of EPR spectrometer. Low-frequency noise results in a type B error of the EPR signal intensity: σNOISE = 30 x (INOISE/IEPR) %, i.e., 10% for 0.1 Gy and 1% for 1Gy. This result was obtained with numerical simulation.
6.2.3.2. Sample positioning
The EPR signal intensity is influenced by sample positioning variations (angular and vertical) in the microwave cavity caused by tolerances in the sample tube dimensions, inhomogeneity of the sample mass distribution, and EPR signal anisotropy. The reproducibility of sample positioning can be improved by accumulating at least 3 measurements after shaking or rotating the powder samples. The Type A uncertainty σPOSITcan be determined experimentally and it is usually about 1%.
6.2.3.3. Spectrometer stability
The EPR spectrometer sensitivity stability is related to the microwave power output, cavity quality factor, and applied magnetic fields. These components are influenced by the temperature and humidity of the sample and equipment, relative humidity and ambient temperature among others influences which vary over the course of a day, and from day-to-day. These are distinguished as short term (several-hour scale) and long term (one or more day) stability. The variation of the EPR spectrometer output can be evaluated experimentally by studying the EPR spectrum intensity of a stable reference sample (e.g., strong or weak pitch) as a fuction of time. Typically long term stability is about 3%. The short term stability gives a Type A uncertainty, σSTAB, of about 1 %.
6.2.4. Numerical treatment of spectra and EPR dose calculation
The experimental EPR spectrum of irradiated tooth enamel is a superposition of the “native” spectrum of the unirradiated enamel and the radiation-induced spectrum. At a “low” radiation dose (50 mGy to 100 mGy) the intensity of a radiation-induced part of the spectrum typically is only 10–20% of the intensity of the whole spectrum. For dosimetry, one should subtract the intensity of a radiation-induced part from total spectrum of tooth enamel. This procedure can be carried out using the methods described in section 4.2. However, it is based on certain assumptions and approximations. Therefore, it increases uncertainty of the dose assessment.
For example, in the spectrum subtraction method (see section 4.2 for more detail), the EPR spectrum of a non-irradiated reference sample is subtracted from the spectrum of the irradiated sample. The combined uncertainty of the difference spectrum intensity is σDIFF = [σEPR1
2 + σEPR22 ]1/2.
Currently the value of the uncertainty, σTREAT is not evaluated directly (separately). Based on the expertise and analysis of the results reported in [41,43] this uncertainty can be estimated as being less than 10%.
33
6.2.5. Calibration of EPR dose response
6.2.5.1. Gamma source dose rate and sample irradiation
For a secondary standard laboratory the combined (Type A and Type B) uncertainty in determining dose to water is about 1.5%. For irradiators calibrated by standards laboratories, the Type B uncertainty in the dose produced inside the irradiator is σSOURCE = 3 %. Uncertainty concerned with sample irradiation is negligible in comparison with σSOURCE.
6.2.5.2. Calibration curve
There are two approaches to the calibration of the tooth enamel radiation sensitivity. The first is an individual calibration for each tooth sample (additive dose method). The second uses an average sensitivity of enamel to radiation (dose calibration curve).
For an additive dose method one needs to obtain the dependence of the radiation-induced signal on the irradiation dose. A linear dependence is assumed and usually a least-square fitting is used. The uncertainty of the calibration curve method is described by Nagy [118].
The calibration curve method introduces Type B error, σCALIB of about 10% for absorbed dose above 400 mGy. For lower doses the uncertainty is about 40 mGy. The uncertainty of 10% is given by the variation of radiation sensitivity of enamel and is independent of the applied dose evaluation method. The uncertainty below an irradiation dose of 400 mGy is strongly dependent on the variation of the bias of the applied method [134].
6.3. Estimation of the combined uncertainty of EPR dose reconstruction
Based on the estimations given above for different contributions, the overall uncertainty of EPR dose reconstruction results in a combined uncertainty (1 ) of 15% and 65% for doses of 1Gy and 0.1Gy, respectively. These uncertainties are multiplied by a coverage factor of 2.0 to obtain the overall combined uncertainties at the 95% confidence level. These uncertainties are only valid for photon exposures with energies above 300 keV.
6.4. Experimental validation of the method for the determination of absorbed dose in enamel The method was validated by several blind tests [41, 43, 53], where the dose
reconstruction was carried out with samples irradiated in vitro to a known dose. The purpose of these studies was to determine accuracy of dose assessment in participating laboratories, that used different protocols. Eighteen international EPR laboratories participated in the comparison program, described in [41]. Each participant prepared enamel samples and evaluated the absorbed dose from molars that were irradiated in vitro in the range 0–1000 mGy. The analysis of the comparison demonstrated consistency and precision of the reconstructed doses for the some EPR protocols. However, due to differences in dose calibration factors of the individual methods, large differences in accuracy of the methods were found. Six of the eighteen EPR methods could reconstruct all applied doses within ±25 %, and ±100 mGy below 400 mGy. The results of the comparison do not identify the procedures that should be preferentially applied in dose reconstruction. However, there is an indication that the quality of the EPR spectrometer used influences the quality of dose reconstruction. This suggests that minimal requirements for EPR spectrometer sensitivity and stability need to be established for tooth dosimetry.
34
6.4.1. Sources of uncertainties in personal dose reconstruction The terms of uncertainty as discussed in previous sections characterize uncertainty of
determination of cumulative dose absorbed by tooth enamel. When reconstruction of personal dose accumulated by a human is concerned, other sources of uncertainty may be involved, often making major contribution to the overall uncertainty of such dose reconstruction. A set of these uncertainties and their magnitude depend on the particular application. Although, sources of these uncertainties are well known, quantification and reduction of their contribution poses problems. The aim of this section is to present most common sources of such uncertainties. Their quantification requires special consideration in each particular case and is beyond the scope of this report.
Typical sources of uncertainties associated with reconstruction of personal dose are listed below.• Unknown photon energy spectra for the radiation fields. • Mixed field irradiation by different sources of α, β and γ irradiation.• Irradiation from natural radiation background, particularly when the age of tooth donor
is unknown.• Lifetime medical irradiation, particularly when low energy photons or X rays are
involved.• Solar UV exposure on the buccal side of incisors and canines. • Cases of partial body exposure. • Unknown irradiation geometry.
35
7. CALCULATION OF EMERGENCY DOSE
7.1. Summary of results on practical application
The principal list of publications that demonstrate practical application of EPR biodosimetry is presented in Table V. A short discussion of the principal results obtained by this method and an evaluation of its correctness is presented below.
7.1.1. A-bomb survivors, Hiroshima, Japan
EPR dose reconstructions of tooth enamel samples from survivors of the nuclear bombardment of Hiroshima were described in several studies [26, 27]. The results were analysed in comparison with doses calculated from information on the distance of the survivors from epicentre at the moment of explosion and shielding factors. The correlation of EPR tooth enamel doses with doses determined from chromosome aberrations analysis was better than the comparison of the EPR results with individual calculated doses [27]. It is difficult to obtain reliable information on the location of the person in the time period during and after the explosion and dose reconstruction by calculations is depend on this factor. It can be considered that in this case, the EPR method gives more realistic estimation of individual doses than that obtained through calculations, as it is directly registers the absorbed energy from ionising radiation.
7.1.2. Mayak nuclear workers, Russian Federation
The personnel of the “Mayak” enterprise that were connected with the manufacture of nuclear materials were the subjects of an EPR dose reconstruction study [28, 44]. The EPR method was compared with individual occupational dosimetry. In all, about 100 teeth for this cohort were studied. The results of the individual dosimetry ranged from 0.2 Gy to 6 Gy.
In general, the conformity between the reconstructed doses and individual dosimetry results (officially reported doses) was satisfactory. However, some divergences were observed. The doses were underestimated by an average of approximately 10–20% in the high dose region or more than 0.5 Gy, and overestimated on the average by about 100 mGy in the region of lower dose in comparison with officially reported doses
Some possible explanations of these observed divergences may be relayed to systematic errors in the calibration of enamel sensitivity, and/or to effects of additional irradiation not registered by conventional individual dosimetry. These divergences require further analysis. The question remains as to which doses should be refined: the doses measured by the EPR method or the doses obtained by conventional dosimetry. The accuracy of the latter method is estimated to be about 20 %). Individual dosimetry does not take into account the contribution of non-occupational irradiation; this can be significant since the territory was contaminated with radioactive waste as a result of the accident. Probably, both EPR results and reported doses are subject to systematic errors which should be corrected to eliminate the contradictions between the two methods.
7.1.3. Techa riverside population, Russian Federation
Doses were estimated using tooth enamel from the population living in the vicinity of the Techa river (Southern Ural), which was polluted as a result of emergency emissions of radioactive waste [30, 89, 135]. The EPR results correlated with the level of radioactive contamination and were consistent with individual doses estimated from calculations based on
36

the level of radioactive contamination of the territory. However, in the dose region below 0.5 Gy some excess dose values were measured by the EPR method in comparison with doses obtained from reconstruction based on the radioactive contamination data. The observed discrepancy can be partially explained by additional contribution to EPR dose due to dental X ray diagnostics. However, the study [135] did not specify whether all teeth or only molars were used. Therefore it is possible, that the additional contribution may be attributed to the influence of solar ultraviolet radiation (if front teeth were used for the analysis).
7.1.4. Totskoye nuclear test eyewitnesses, Russian Federation
For eyewitnesses of the Totskoye nuclear test [136] rather small irradiation dose values were obtained by the EPR tooth enamel method. Only small amount of tooth samples was collected from the thousands of persons that were irradiated during this test and it is possible that this representative sample is insufficient for this cohort. Therefore, the results are inconclusive since doses were expected to be significant higher for some participants of the test.
7.1.5. Goiânia radiation accident victims, Brazil
The results of investigations of tooth samples from victims of Goiânia radiation accident [137] enabled specification of the radiation doses in the head/neck area of the body. Doses to other organs were obtained by extrapolation.
7.1.6. Retired personnel of atomic submarines, Russian Federation
The estimation of radiation doses using tooth enamel from retired personnel of nuclear submarines was described in [138]. As a rule, the measured doses ranged up to 500 mGy, although a dose of 3 Gy was obtained for one person.
7.1.7. Chernobyl cleanup workers (liquidators) in Ukraine and Russian Federation
EPR dose measurements using tooth enamel were performed for the Chernobyl cleanup workers (liquidators) in Ukraine [38] and Russia [139]. Practical EPR dosimetry was performed along two main lines. First there was routine retrospective dosimetry of Chernobyl liquidators [38]. In total about 500 individual doses were reconstructed for the members of this cohort. Another, very important application area for EPR dosimetry in Ukraine was the provision of high quality dose estimates for validation of other dose reconstruction and dosimetric monitoring methods. Several tests, which used EPR doses as a reference standard ("gold standard") were performed, in particular, the validation of new analytical methods of dose assessment, biological FISH dosimetry and verification of existing official dose records. The teeth used for these tests were selected with respect to stringent selection criteria, in particular, an absence of traces of medical X ray exposure. Both applications were dependent on the availability of a large number of teeth collected from liquidators. In order to meet this demand, a widespread tooth acquisition network was established in Ukraine, covering 7 regions with the highest liquidator population and having a central bioprobe bank in its structure. In total, the teeth from about 2000 liquidators were collected and are stored in the bioprobe bank by the end of 2001. The EPR biodosimetry results represent as an additional source of information about the radiation doses and when combined with the official results from conventional individual dosimetry should be used to estimate and forecast health effects. The dose distribution
37
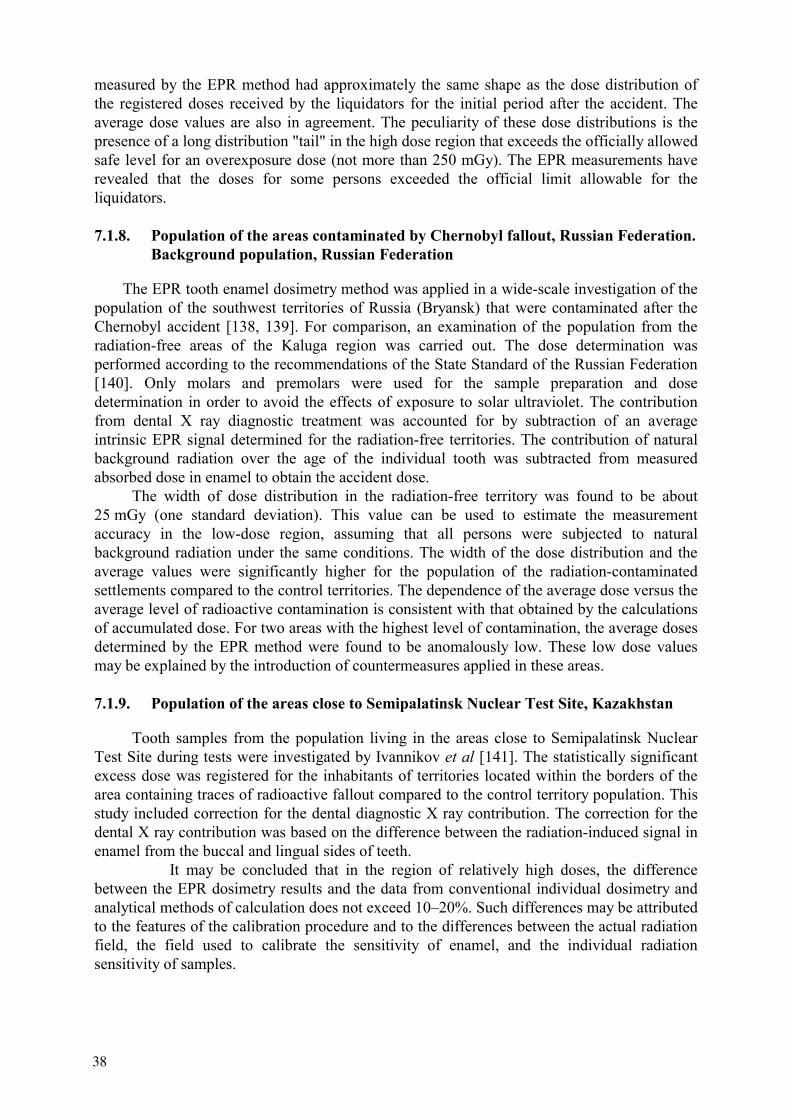
measured by the EPR method had approximately the same shape as the dose distribution of the registered doses received by the liquidators for the initial period after the accident. The average dose values are also in agreement. The peculiarity of these dose distributions is the presence of a long distribution "tail" in the high dose region that exceeds the officially allowed safe level for an overexposure dose (not more than 250 mGy). The EPR measurements have revealed that the doses for some persons exceeded the official limit allowable for the liquidators.
7.1.8. Population of the areas contaminated by Chernobyl fallout, Russian Federation. Background population, Russian Federation
The EPR tooth enamel dosimetry method was applied in a wide-scale investigation of the population of the southwest territories of Russia (Bryansk) that were contaminated after the Chernobyl accident [138, 139]. For comparison, an examination of the population from the radiation-free areas of the Kaluga region was carried out. The dose determination was performed according to the recommendations of the State Standard of the Russian Federation [140]. Only molars and premolars were used for the sample preparation and dose determination in order to avoid the effects of exposure to solar ultraviolet. The contribution from dental X ray diagnostic treatment was accounted for by subtraction of an average intrinsic EPR signal determined for the radiation-free territories. The contribution of natural background radiation over the age of the individual tooth was subtracted from measured absorbed dose in enamel to obtain the accident dose.
The width of dose distribution in the radiation-free territory was found to be about 25 mGy (one standard deviation). This value can be used to estimate the measurement accuracy in the low-dose region, assuming that all persons were subjected to natural background radiation under the same conditions. The width of the dose distribution and the average values were significantly higher for the population of the radiation-contaminatedsettlements compared to the control territories. The dependence of the average dose versus the average level of radioactive contamination is consistent with that obtained by the calculations of accumulated dose. For two areas with the highest level of contamination, the average doses determined by the EPR method were found to be anomalously low. These low dose values may be explained by the introduction of countermeasures applied in these areas.
7.1.9. Population of the areas close to Semipalatinsk Nuclear Test Site, Kazakhstan
Tooth samples from the population living in the areas close to Semipalatinsk Nuclear Test Site during tests were investigated by Ivannikov et al [141]. The statistically significant excess dose was registered for the inhabitants of territories located within the borders of the area containing traces of radioactive fallout compared to the control territory population. This study included correction for the dental diagnostic X ray contribution. The correction for the dental X ray contribution was based on the difference between the radiation-induced signal in enamel from the buccal and lingual sides of teeth.
It may be concluded that in the region of relatively high doses, the difference between the EPR dosimetry results and the data from conventional individual dosimetry and analytical methods of calculation does not exceed 10–20%. Such differences may be attributed to the features of the calibration procedure and to the differences between the actual radiation field, the field used to calibrate the sensitivity of enamel, and the individual radiation sensitivity of samples.
38
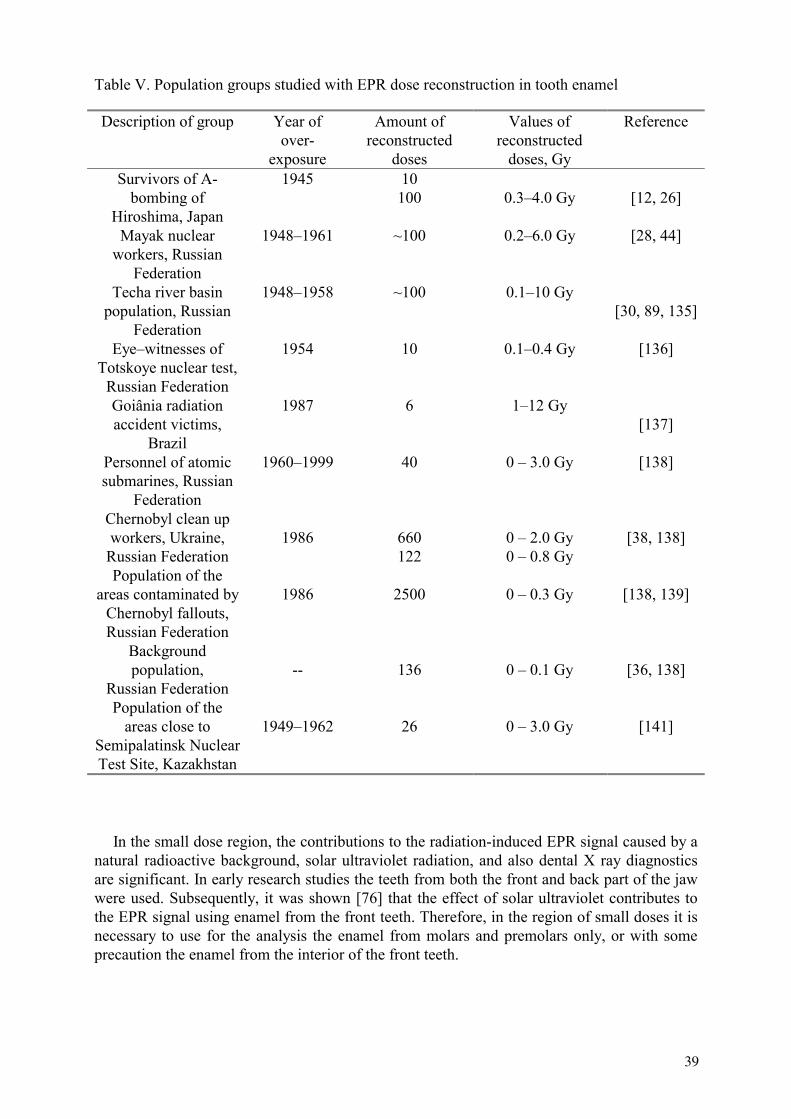
Table V. Population groups studied with EPR dose reconstruction in tooth enamel
Description of group Year of over-
exposure
Amount of reconstructed
doses
Values of reconstructed
doses, Gy
Reference
Survivors of A-bombing of
Hiroshima, Japan
1945 10 100 0.3–4.0 Gy [12, 26]
Mayak nuclear workers, Russian
Federation
1948–1961 ~100 0.2–6.0 Gy [28, 44]
Techa river basin population, Russian
Federation
1948–1958 ~100 0.1–10 Gy [30, 89, 135]
Eye–witnesses of Totskoye nuclear test,
Russian Federation
1954 10 0.1–0.4 Gy [136]
Goiânia radiation accident victims,
Brazil
1987 6 1–12 Gy [137]
Personnel of atomic submarines, Russian
Federation
1960–1999 40 0 – 3.0 Gy [138]
Chernobyl clean up workers, Ukraine,
Russian Federation 1986 660
1220 – 2.0 Gy 0 – 0.8 Gy
[38, 138]
Population of the areas contaminated by
Chernobyl fallouts, Russian Federation
1986 2500 0 – 0.3 Gy [138, 139]
Background population,
Russian Federation -- 136 0 – 0.1 Gy [36, 138]
Population of the areas close to
Semipalatinsk Nuclear Test Site, Kazakhstan
1949–1962 26 0 – 3.0 Gy [141]
In the small dose region, the contributions to the radiation-induced EPR signal caused by a natural radioactive background, solar ultraviolet radiation, and also dental X ray diagnostics are significant. In early research studies the teeth from both the front and back part of the jaw were used. Subsequently, it was shown [76] that the effect of solar ultraviolet contributes to the EPR signal using enamel from the front teeth. Therefore, in the region of small doses it is necessary to use for the analysis the enamel from molars and premolars only, or with some precaution the enamel from the interior of the front teeth.
39
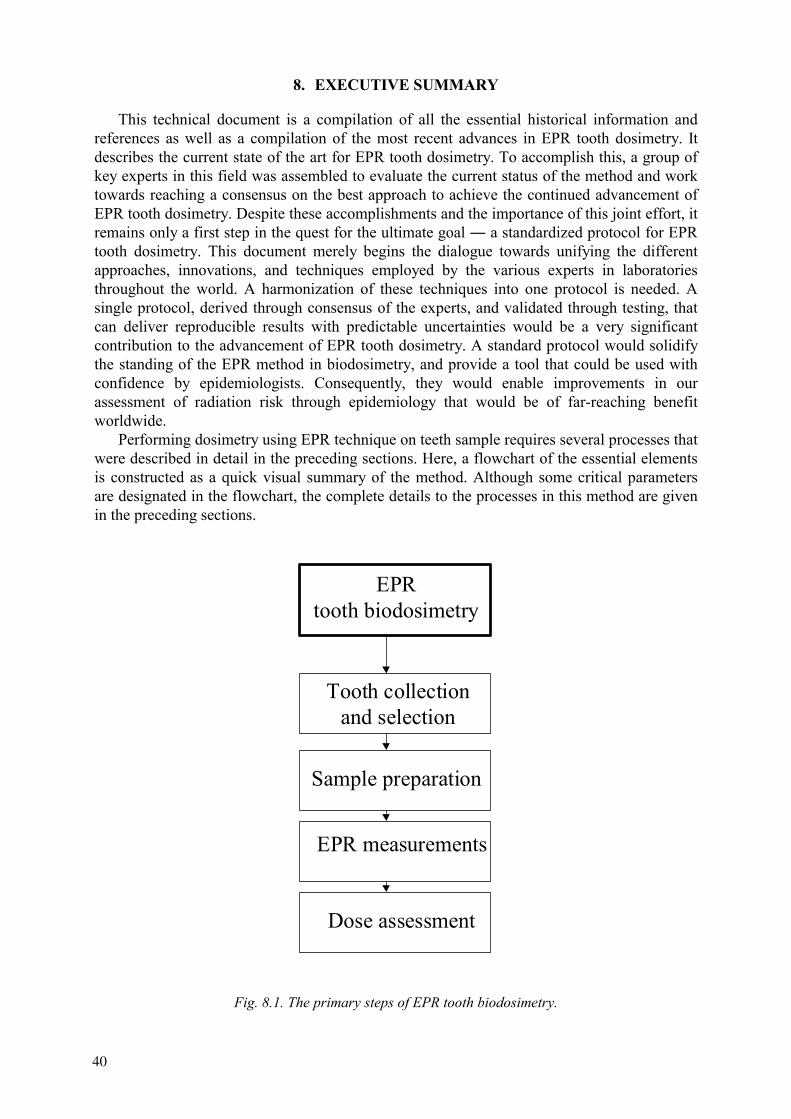
8. EXECUTIVE SUMMARY
This technical document is a compilation of all the essential historical information and references as well as a compilation of the most recent advances in EPR tooth dosimetry. It describes the current state of the art for EPR tooth dosimetry. To accomplish this, a group of key experts in this field was assembled to evaluate the current status of the method and work towards reaching a consensus on the best approach to achieve the continued advancement of EPR tooth dosimetry. Despite these accomplishments and the importance of this joint effort, it remains only a first step in the quest for the ultimate goal a standardized protocol for EPR tooth dosimetry. This document merely begins the dialogue towards unifying the different approaches, innovations, and techniques employed by the various experts in laboratories throughout the world. A harmonization of these techniques into one protocol is needed. A single protocol, derived through consensus of the experts, and validated through testing, that can deliver reproducible results with predictable uncertainties would be a very significant contribution to the advancement of EPR tooth dosimetry. A standard protocol would solidify the standing of the EPR method in biodosimetry, and provide a tool that could be used with confidence by epidemiologists. Consequently, they would enable improvements in our assessment of radiation risk through epidemiology that would be of far-reaching benefit worldwide.
Performing dosimetry using EPR technique on teeth sample requires several processes that were described in detail in the preceding sections. Here, a flowchart of the essential elements is constructed as a quick visual summary of the method. Although some critical parameters are designated in the flowchart, the complete details to the processes in this method are given in the preceding sections.
EPRtooth biodosimetry
Tooth collectionand selection
Sample preparation
EPR measurements
Dose assessment
Fig. 8.1. The primary steps of EPR tooth biodosimetry.
40
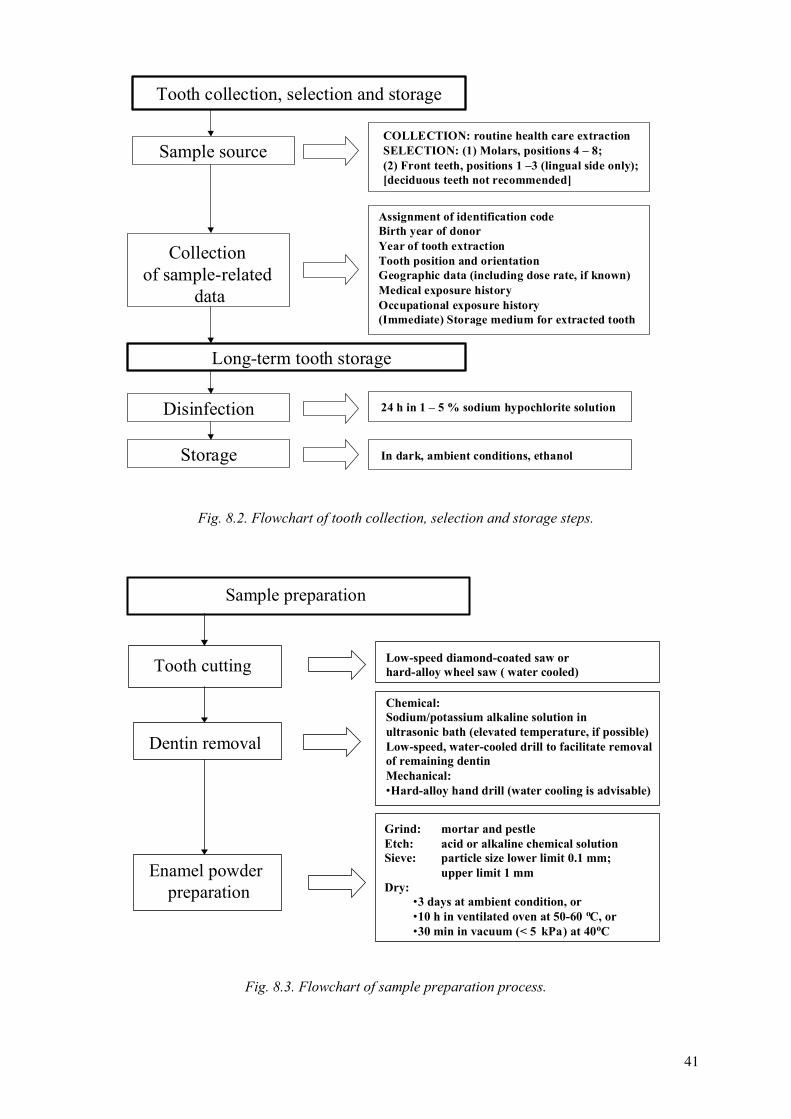
COLLECTION: routine health care extractionSELECTION: (1) Molars, positions 4 – 8;(2) Front teeth, positions 1 –3 (lingual side only);[deciduous teeth not recommended]
Assignment of identification codeBirth year of donorYear of tooth extractionTooth position and orientationGeographic data (including dose rate, if known)Medical exposure historyOccupational exposure history(Immediate) Storage medium for extracted tooth
Tooth collection, selection and storage
Collection of sample-related
data
Sample source
Long-term tooth storage
24 h in 1 – 5 % sodium hypochlorite solutionDisinfection
In dark, ambient conditions, ethanolStorage
Fig. 8.2. Flowchart of tooth collection, selection and storage steps.
Low-speed diamond-coated saw orhard-alloy wheel saw ( water cooled)
Chemical:Sodium/potassium alkaline solution inultrasonic bath (elevated temperature, if possible)Low-speed, water-cooled drill to facilitate removalof remaining dentinMechanical:•Hard-alloy hand drill (water cooling is advisable)
Grind: mortar and pestleEtch: acid or alkaline chemical solutionSieve: particle size lower limit 0.1 mm;
upper limit 1 mmDry:
•3 days at ambient condition, or•10 h in ventilated oven at 50-60 oC, or•30 min in vacuum (< 5 kPa) at 40oC
Sample preparation
Tooth cutting
Dentin removal
Enamel powder preparation
Fig. 8.3. Flowchart of sample preparation process.
41
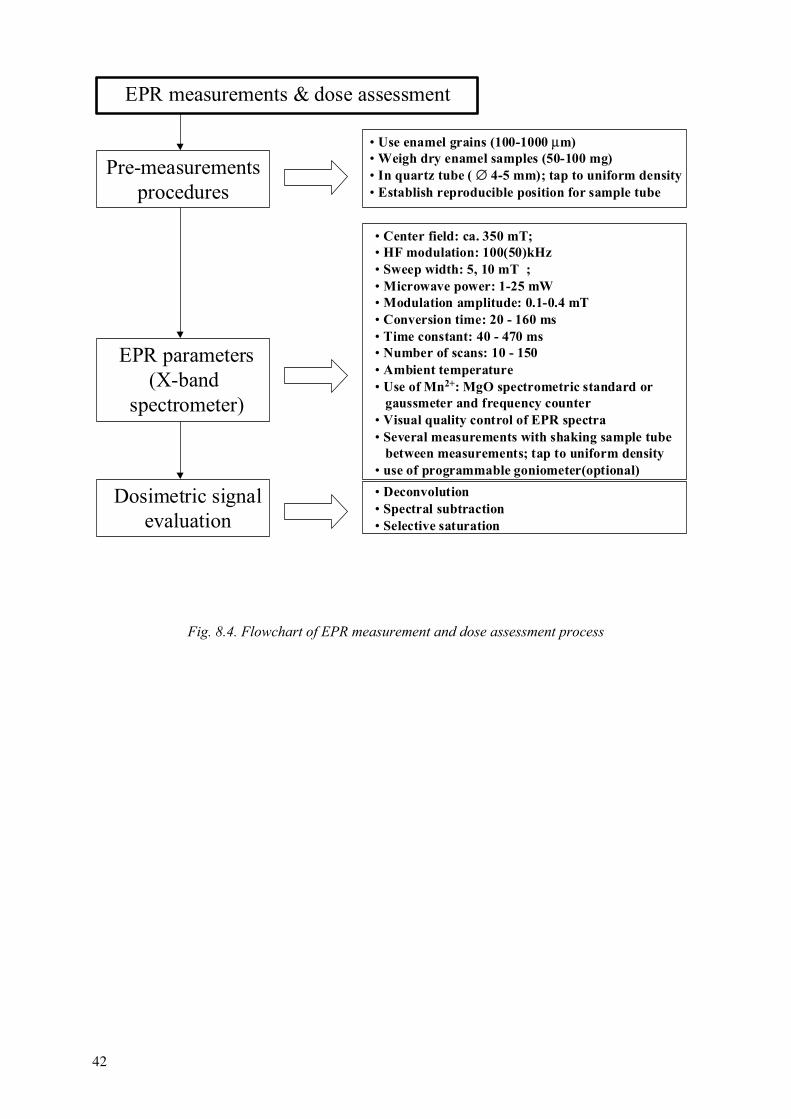
• Use enamel grains (100-1000 µm)• Weigh dry enamel samples (50-100 mg)• In quartz tube ( ∅ 4-5 mm); tap to uniform density• Establish reproducible position for sample tube
• Center field: ca. 350 mT;• HF modulation: 100(50)kHz• Sweep width: 5, 10 mT ;• Microwave power: 1-25 mW• Modulation amplitude: 0.1-0.4 mT• Conversion time: 20 - 160 ms• Time constant: 40 - 470 ms• Number of scans: 10 - 150• Ambient temperature• Use of Mn2+: MgO spectrometric standard or gaussmeter and frequency counter• Visual quality control of EPR spectra• Several measurements with shaking sample tube between measurements; tap to uniform density• use of programmable goniometer(optional)
EPR measurements & dose assessment
Pre-measurementsprocedures
EPR parameters(X-band
spectrometer)
Dosimetric signalevaluation
• Deconvolution• Spectral subtraction• Selective saturation
Fig. 8.4. Flowchart of EPR measurement and dose assessment process
42
GLOSSARY
Accuracy: A qualitative concept, characterizing closeness of the measurement result to the true value. Back teeth: teeth in positions 4–8, namely premolars, molars and wisdom teeth.Calibration: The process whereby the response of a measuring system or measuring instrument is characterized through comparison with an appropriate standard that is traceable to, and consistent with, a nationally or internationally recognized standard. Combined standard uncertainty: represents the estimated standard deviation of the measurement result. It is obtained by combining the individual standard uncertainties, whether arising from a Type A evaluation (statistical methods) or a Type B evaluation (all other non-statistical methods), using the law of propagation of uncertainty for combining standard deviations.Cumulative (absorbed) dose: dose accumulated (e.g., in enamel or dentine) over a tooth lifetime from all radiation sources. It includes, as a component, the accidental dose, which is of primary interest in retrospective dosimetry. Dentine: Mineralized tissue, which comprises most of the tooth. Because of the high organic fraction dentine has limited EPR biodosimetric application. Dosimetric signal: an EPR signal caused by stable radiation-induced radicals (centers), which has g-factor around 2.0 and is used for retrospective estimation of doses. The main contribution to dosimetric signal is due to axial-symmetric CO2
- centers at g⊥=2.002,g =1.997.EPR dosimetry: Determination of absorbed dose in a material with radiation-generated paramagnetism by measurement of the relative concentration of radiation-generated unpaired electrons using EPR spectroscopy and including procedures for calibrating the generation rate per unit dose. EPR powder spectrum: Spectrum of a sample with statistically distributed orientations of its micro crystals. The spectrum is considered to result from the superposition of an infinitely large number of single spectra. EPR spectroscopy: The measurement of resonant absorption of electromagnetic energy resulting from the transition of unpaired electrons between different energy levels, upon application of radio frequency energy to a paramagnetic substance in the presence of a magnetic field. EPR spectrum: The first derivative of the electron paramagnetic absorption spectrum measured as a function of the magnetic field. Experimental standard deviation: a parameter calculated from scatter of the results of experimental replicate measurements (so-called type A evaluation of the uncertainty). Front teeth: teeth in positions 1–3, namely incisors and canines. High-frequency noise: part of spectrometer noise that appears as random narrow EPR signals Intrinsic ("initial") EPR signal: systematic deviation of reconstructed dose from its true value. Normally the value of intrinsic signal is specific to a particular EPR dosimetric technique.Lingual and buccal: related to tongue and cheek sides of teeth, respectively. Low-frequency noise: part of spectrometer noise that appears as random EPR signals of width comparable with the width of the dosimetric signal. Low dose detection limit: The lowest dose that provides an EPR signal that is statistically significantly different from the signal of a blank unirradiated sample. Maxillary and mandibular: related to position in upper and lower jaws, respectively.
43
Native signal: an EPR signal at g=2.0045 with ∆H=8-10 G likely derived from the organic component of enamel (dentine) and practically insensitive to radiation exposure. Reproducibility (or precision): The closeness of the agreement between the results of the measurements of the same quantity under changed conditions (different observer, different instrument, different time, etc). Quality factor (of microwave cavity): ratio of microwave power accumulated inside cavity to power dissipated over one period of microwave oscillation. Typical values of quality factor for modern microwave cavities are in the range 10000–20000. Radiation-induced radicals (centers): paramagnetic centers in enamel (dentine) formed by different kinds of exposure (gamma, X ray, UV etc). Tooth enamel: Outer shell of upper (exposed) part of the tooth that is the most mineralized and hard tissue of the human body and is of primary interest to the EPR biodosimetric application.
44
REFERENCES
[1] TURAI I., CRICK M., NOGUEIRA DE OLIVEIRA C., ORTIZ-LOPEZ P., WRIXON A. Response to radiological accidents: The role of the International Atomic Energy Agency. Radioprotection, 36(4), 1-17, (2001).
[2] KARAOGLOU, A., CHADWICK, K.H. Health consequences of Chernobyl and other radiation accidents. Radiat. Environ. Biophys., 37, 1–9 (1998).
[3] PIERCE D.A., SHIMIZU Y., PRESTON D.L., VAETH M., MABUCHI K., Studies of the mortality of A-bomb survivors. Report 12, Part I. Cancer: 1950–1990. Radiat. Res., 146, 1–27 (1996).
[4] GAVRILIN, Y., KHROUCH, V., SHINKKAREV, S., DROZDOVITCH, V., MINENKO, V., SHEMYAKINA, E., BOUVILLE, A., ANSPAUGH, L. Estimation of thyroid doses received by the population of Belarus as a result of the Chernobyl accident. In: The Radiological Consequences of the Chernobyl Accident. Report EUR 16544 EN, European Commission, Brussels, 1996, 1011–1020 (1996).
[5] LIKHTAREV, I., SOBOLEV, B., KAIRO, I., TABACHY, L., JACOB, P., PRÖHL, G., GOULKO, G. Results of large scale thyroid dose reconstruction in Ukraine. In: The Radiological Consequences of the Chernobyl Accident. Report EUR 16544 EN, European Commission, Brussels, 1996, 1021–1034 (1996).
[6] GOULKO, G., JACOB, P., VOIGT, G., LIKHTAREV, I.A., CHUMAK, V.V., SOBOLEV, B.G., KAIRO, I.A., CHEPURNOY, N.I., REPIN, V.S., HENRICHS, K. Estimation of thyroid doses for the evacuees from Pripjat, Radiation and Environmental Biophysics, 35, 95–104 (1996).
[7] MECKBACH, R., CHUMAK, V.V. Reconstruction of the external dose of evacuees from the contaminated areas based on simulation modelling. In: The Radiological Consequences of the Chernobyl Accident. Report EUR 16544 EN, European Commission, Brussels, 1996, 975–984 (1996).
[8] EDWARDS, A.A. The use of chromosomal aberrations in human lymphocytes for biological dosimetry, Radiat. Res., 148, 39–44 (1997).
[9] BAUCHINGER, M., Retrospective dose reconstruction of human radiation exposure by FISH/chromosome painting. Mutat. Res., 404, 89–96 (1998).
[10] NAKAMURA, N, MIYAZAWA, C. Alkaline denaturation of dentin — a simple way to isolate human tooth enamel for electron spin resonance dosimetry. J Radiat. Res. (Tokyo) Sep. 38(3), 173–7 (1997).
[11] INTERNATIONAL ATOMIC ENERGY AGENCY, Cytogenetic Analysis for Radiation Dose Assessment: A Manual. Technical Reports Series No. 405, IAEA, Vienna (2001).
[12] BAILIFF, I.K., Retrospective dosimetry with ceramics. Radiat. Meas., 27, 923–941 (1997).
[13] BØTTER-JENSEN, L., MCKEEVER, S.W.S., Optically stimulated luminescence dosimetry using natural and synthetic materials. Radiat. Prot. Dosim., 65, 273–280 (1996).
[14] INTERNATIONAL COMMISSION ON RADIOLOGICAL UNITS AND MEASUREMENTS Retrospective assessment of exposures to ionizing radiation. ICRU Report 68, ICRU, Bethesda MD (2002).
[15] ATHERTON, N.M., Electron spin resonance: theory and applications. Chichester (England): E. Horwood; New York: Halsted Press (1973).
[16] EATON, G.R., EATON, S.S., SALIKHOV, K.M. Foundations of modern EPR/Singapore, River Edge, NJ : World Scientific, (1998).
45
[17] Handbook of electron spin resonance: data sources, computer technology, relaxation, and ENDOR / edited by Charles P. Poole, Jr. and Horacio A. Farach. New York: American Institute of Physics, (1994).
[18] IKEYA, M., New application of electron spin resonance — dating, dosimetry and microscopy. Word Scientific, Singapore, 1993.
[19] POOLE C.P. Electron spin resonance: a comprehensive treatise on experimental techniques. 2nd ed. New York: Wiley (1983).
[20] POOLE C.P., FARACH H.A. Theory of magnetic resonance. Edition: 2nd ed. New York : Wiley (1987).
[21] SLICHTER C.P. Principles of magnetic resonance. 3rd enl. and updated edition, Berlin New York: Springer (1996).
[22] WERTZ J.E., BOLTON J.R. Electron spin resonance; elementary theory and practical applications. New York, McGraw-Hill (1972).
[23] BRADY, J.M., AARESTAD, N.O., SWARTZ, H.M., In vivo dosimetry by electron spin resonance spectroscopy. Med. Phys., 15, 43–47 (1968).
[24] DRIESSENS, F.C.M. The mineral in bone, dentine and tooth enamel. Bull. Soc. Chem. Belg., 89, 663–689 (1980).
[25] MOENS P., DE VOLDER P., HOOGEWIJS R., CALLENS F., VERBEECK R., Maximum-likelihood common-factor analysis as a powerful tool in decomposing multicomponent EPR powder spectra. J. Magn. Reson., 101, 1–15 (1993).
[26] IKEYA, M., MIYAJIMA, J., OKAJIMA, S. ESR dosimetry for atomic bomb survivors using shell buttons and tooth enamel. Jpn. J. Appl. Phys., 23, 697–699 (1984).
[27] NAKAMURA N., MIYAZAWA C., AKIYAMA M., SAWADA S., AWA A.A. A close correlation between electron spin resonance (ESR) dosimetry from tooth enamel and cytogenetic dosimetry from lymphocytes of Hiroshima atomic-bomb survivors. Int. J. Radiat. Biol., 73, 619–627 (1998).
[28] ROMANYUKHA A.A., IGNATIEV E.A., VASILENKO E.K., DROZHKO E.G., WIESER A., JACOB P., KERIIM-MARKUS I.B., KLESCHENKO E.D., NAKAMURA N., MIYAZAWA C. EPR dose reconstruction for Russian nuclear workers. Health Phys., 78(1): 15–20 (2000).
[29] WIESER A., ROMANYUKHA A., DEGTEVA M., KOZHEUROV V., PETZOLDT, G. Tooth enamel as a natural beta dosimeter for bone seeking radionuclides. Radiat. Prot. Dosim. 65, 413–416 (1996).
[30] ROMANYUKHA A.A., DEGTEVA M.O., KOZHEUROV V.P., WIESER A., IGNATIEV E.A., VOROBIOVA M.I., JACOB P. Pilot study of the population of the Ural Region by EPR tooth dosimetry. Radiat. Envir. Biophys., 35, 305–310 (1996).
[31] CHUMAK, V., SHOLOM, S., PASALKAYA, L. Application of high precision EPR dosimetry with teeth for reconstruction of doses to Chernobyl populations. Radiat. Prot. Dosim., 84, 515–520 (1999).
[32] CHUMAK, V.V., SHOLOM, S.V., LIKHTAREV, I.A. Some results of retrospective dose reconstruction for selected groups of exposed population in Ukraine. In: The Radiological Consequences of the Chernobyl Accident. Report EUR 16544 EN, European Commission, Brussels, 1996, 1059–1062 (1996).
[33] ISHII, H., IKEYA, M., OKANO, M. ESR dosimetry of teeth of residents close to Chernobyl reactor accident. J. Nucl. Sci. Technol., 27, 1153–1155 (1990).
[34] TATSUMI-MIYAJIMA J, OKAJIMA S. ESR dosimetry using human tooth enamel. In: ESR dating and dosimetry (Ikeya, M. and Miki, T., Editors). IONICS, Tokyo (1985).
[35] SEVAN’KAEV A.V., LLOYD D.C., EDWARDS A.A., MOISEENKO V.V. High exposures to radiation received by workers inside the Chernobyl Sargophagus. Radiat. Prot. Dosim., 59, 85–91 (1995).
46
[36] IVANNIKOV A.I., SKVORTSOV V.G., STEPANENKO V.F., TIKUNOV, D.D., FEDOSOV, I.M., ROMANYUKHA, A.A., WIESER, A. Wide scale EPR retrospective dosimetry. Results and problems. Radiat. Prot. Dosim. 71, 175–180 (1997).
[37] BAILIFF, I.K., STEPANENKO, V., Final report, Experimental Collaboration Project ECP10. Retrospective dosimetry and dose reconstruction, 115 pp. (Eds. Bailiff, I.K., Stepanenko, V.) European Commission. EUR 165540 (1996).
[38] CHUMAK, V., LIKHTAREV I., SHOLOM S., MECKBACH R., AND KRJUCHKOV V. Chernobyl experience in field of retrospective dosimetry: reconstruction of doses to the population and liquidators involved in the accident, Radiat. Prot. Dos. 77, 91–95 (1998).
[39] Retrospective dosimetry and dose reconstruction. Experimental collaboration project No 10. Final Report. Ed. I.K. Bailiff and V. Stepanenko. EUR 16540 EN. 42 p (1996).
[40] WIESER A., CHUMAK V., BAILIFF I., BARAN N., BOUGAI A., BRIK A., DUBROVSKY S., FININ V., HASKELL E., HAYES R., IVANNIKOV A., KENNER G., KIRILLOV V., KOLESNIK S., LIIDJ G., LIPPMAA E., MAKSIMENKO V., MATYASH M., MEIJER A., MINENKO V., PASALSKAYA L., PAST J., PAVLENKO J., PUSKAR J., RADCHUK V., SCHERBINA O., SHOLOM S., SKVORTSOV V., STEPANENKO V., VAHER Ü. International intercomparison of dose measurements using EPR spectrometry of tooth enamel. In: The Radiological Consequences of the Chernobyl Accident. Report EUR 16544 EN, European Commission, Brussels, 1996, 957–964 (1996).
[41] WIESER, A., MEHTA, K., AMIRA, S., ARAGNO, D., BERCEA, S., BRIK, A., BUGAI, A., CALLENS F., CHUMAK V., CIESIELSKI B., DEBUYST R., DUBOVSKY S., DULIU O.G., FATTIBENE P., HASKELL E.H., HAYES R.B., IGNATIEV E.A., IVANNIKOV A., KIRILLOV V., KLESCHENKO E., NAKAMURA N., NATHER M., NOWAK J., ONORI S., PASS B., PIVOVAROV S., ROMANYUKHA A., SCHERBINA O., SHAMES A.I., SHOLOM, S., SKVORTSOV V., STEPANENKO V., TIKOUNOV D.D., TOYODA S. The second international intercomparison on EPR tooth dosimetry. Radiat. Meas. 32, 549–557 (2000).
[42] SCHWARCZ H.P. ESR study of tooth enamel. Nucl. Tracks 10, 865–867 (1985). [43] CHUMAK, V., BAILIFF, I., BARAN, N., BUGAI, A., DUBOVSKY, S., FEDOSOV,
I., FININ, V., HASKELL, E., HAYES, R., IVANNIKOV, A., KENNER, G., KIRILLOV, V., KHAMIDOVA, L., KOLESNIK, S., LIIDJA, G., LIKHTAREV, I., LIPPMAA, E., MAKSIMENKO, V., MEIJER, A., MINENKO, V., PASALSKAYA, L., PAST, J., PUSKAR, J., RADCHUK, V., SHOLOM, S., SKVORTZOV, V., STEPANENKO, V., VAHER, U., WIESER, A. The first international intercomparison of EPR-dosimetry with teeth: first results. Appl. Radiat. Isot., 47, 1281–1286 (1996).
[44] WIESER A., ROMANYUKHA A., ONORI S., VASILENKO E., BAYANKIN S., FATTIBENE P., IGNATIEV E., KNYAZEV V., JACOB P. External exposures of nuclear workers at Mayak: Comparison of occupational film dosimetry and EPR measurements with tooth enamel. Health Phys. (2002) in press.
[45] VANHAELEWYN G., AMIRA S., DEBUYST R., CALLENS F., GLORIEUX-LELOUP G, THIERENS H.A. Critical discussion of the 2nd intercomparison on electron paramagnetic resonance dosimetry with tooth enamel. Radiat. Meas., 33, 417–426 (2001).
[46] ROMANYUKHA A.A., NAGY V., SLEPTCHONOK O., DESROSIERS M.F., JIANG J., HEISS A. Individual biodosimetry at the natural radiation background level. Health Phys., 80, 71–73 (2001).
47
[47] BOROVSKII, E.V., IVANOV, V.S., MAKSIMOVSKII, Yu.M., MAKSIMOVSKAYA, L.N., Terapevticheskaya stomotologiya (Therapeutic stomatology). Moskva, Medicina (in Russian) (1998).
[48] CATE T. Oral histology: development, structure and function. The C.V. Mosby Company, St. Louis-Toronto-Princeton (1985).
[49] GRABER, T.M. Orthodontics. Principles and practice, Second Edition. W. B. Saunders Company, Philadelphia and London, (1966).
[50] Orban’s Oral histology and embryology. Edited by S.N. Bhaskar. The C.V. Mosby Company, Saint Louis (1976).
[51] INTERNATIONAL COMMISSION ON RADIOLOGICAL PROTECTION Report of the Task Group on Reference Man, ICRP Publication No. 23 pp. 290–322, ICRP, Oxford (1975).
[52] DRIESSENS, F.C.M., VERBEECK, R.M.H. Biominerals. CRC Press, Boca Raton, Ann Arbour, Boston, 428 (1990).
[53] HASKELL, E.H., HAYES, R.B., KENNER, G.H., WIESER, A., ARAGNO, D., FATTIBENE, P., ONORI, S. Achievable precision and accuracy in EPR dosimetry of tooth enamel. Radiat. Prot. Dosim. 84. 527–535 (1999).
[54] WIESER A. and EL-FARAMAWY N. Dose reconstruction with EPR spectroscopy of deciduous teeth. Radiat. Prot. Dosim., 101, 545–548 (2002).
[55] GUALTIERI, G., COLACICCHI, S., SGATTONI, R., GIANNONI, M. The Chernobyl accident: EPR dosimetry on dental enamel of children. Appl. Radiat. Isot., 55, 71–79 (2001).
[56] GODFREY-SMITH, D.I., PASS, B. A new method of retrospective radiation dosimetry: optically stimulated luminescence in dental enamel. Health Phys. 72 (5), 1–5, (1997).
[57] JASINSKA, M., NIEWIADOMSKI, T. Thermoluminescence of Biological Materials. Nature 227, 1159–1160 (1970).
[58] CALLENS, F., VANHAELEWYN, G., MATTHYS, P., BOESMAN, E., EPR of carbonated derived radicals: Applications in dosimetry, dating and detection of irradiated food. Appl. Magn. Reson. 14, 235–254 (1998).
[59] CEVC, P., SCHARA, M., RAVNIK, N., Electron paramagnetic resonance study of irradiated tooth enamel. Radiat. Res. 51, 581 (1972).
[60] ROMANYUKHA A.A., WIESER A., REGULLA D. EPR dosimetry with different biological and synthetic carbonated materials. Radiat. Protect. Dosim., 65, 389–392 (1996).
[61] SHOLOM S.V., HASKELL E.H., HAYES R.B., CHUMAK V.V., KENNER G.H. Properties of light induced EPR signals in enamel and their possible interference with gamma induced signals. Radiat. Meas. 29, 113–118 (1998).
[62] SCHERBINA O., BRIK A. Temperature stability of carbonate groups in tooth enamel. Appl. Radiat. Isot., 52, 1071–1075 (2000).
[63] ROMANYUKHA A.A., HAYES R.B., HASKELL E.H., KENNER G.H. Geographic variations in the structure of the EPR spectrum of irradiated tooth enamel. Radiat. Prot. Dosim., 84, 445–450 (1999).
[64] FATTIBENE, P., ARAGNO, D., ONORI, S. Effectiveness of chemical etching for background electron paramagnetic resonance signal reduction in tooth enamel. Health Physics, 75, 500–505 (1998).
[65] HASKELL, E.H., KENNER, G.H., HAYES, R.B., SHOLOM S., CHUMAK V. An EPR intercomparison using teeth irradiated prior to crushing. Radiat. Meas. 27, 419–424 (1997).
48
[66] ALDRICH, J.E., PASS, B., MAILER, C., Changes in the paramagnetic centers in irradiated and heated enamel studied using electron paramagnetic resonance. Int. J. Radiat. Biol. 61, 433–437 (1992).
[67] SHOLOM S.V., HASKELL E.H., HAYES R.B., CHUMAK V.V., KENNER G.H. EPR Dosimetry with carious teeth. Radiat. Meas. 32, 799–803 (2000).
[68] EASTOE, J.E. Chemical aspects of the matrix concept in calcified tissue organization, Calc. Tissue Res 2,1–19 (1968).
[69] UNITED NATIONS SCIENTIFIC COMMITTEE ON THE EFFECTS OF ATOMIC RADIATION (UNSCEAR) Sources and effects of ionizing radiation, UNSCEAR Report (United Nations, New York) (1993).
[70] IVANNIKOV, A.I., SKVORTSOV V.G., STEPANENKO V.F., TSYB A.F., KHAMIDOVA L.G., TIKUNOV D.D. Tooth enamel EPR dosimetry: sources of errors and their correction. Appl. Radiat. Isot. 52, 1291–1296 (2000).
[71] ROMANYUKHA A.A., REGULLA D.F. Aspects of retrospective ESR dosimetry. Appl. Radiat. Isot. 47, 1293–1297 (1996).
[72] ROMANYUKHA A.A., IGNATIEV E.A., DEGTEVA M.O., KOZHEUROV V.P., WIESER A., JACOB P. Radiation doses from Ural region. Nature, 381, 199–200 (1996).
[73] ROMANYUKHA A.A., REGULLA D., VASILENKO E.K., WIESER A., DROZHKO E.G., LYZLOV A.F., KOSHURNIKOVA N. A., SHILNIKOVA N. S., PANFILOV A. P. Verification of occupational doses at the first nuclear plant in the former Soviet Union. Appl. Radiat. Isot., 47, 1277–1280 (1996).
[74] WIESER A., ONORI S., ARAGNO D., FATTIBENE P., ROMANYUKHA A., IGNATIEV E., KOSHTA A., SKVORTZOV V., IVANNIKOV A., STEPANENKO V., CHUMAK V., SHOLOM S., HASKELL E., HAYES R., KENNER G. Comparison of sample preparation and signal evaluation methods for EPR analysis of tooth enamel. Appl. Radiat. Isot. 52, 1059–1064 (2000).
[75] LIIDJA, G., PAST, J., PUSKAR, J., LIPPMAA, E. Paramagnetic resonance in tooth enamel created by ultraviolet light. Appl.Radiat.Isot. 47, 785–788 (1996).
[76] NILSSON, J., LUND, E., LUND, A. The effects of UV-irradiation on the ESR-dosimetry of tooth enamel. Appl. Radiat. Isot., 54 (1), 131–139 (2001).
[77] WIESER A., EL-FARAMAWY N., MEKBACH R. Dependencies of the radiation sensitivity on human tooth enamel in EPR dosimetry. Appl. Radiat. Isot. 54, 793–799 (2001).
[78] AOBA, T., DOI, Y., YAGI, T., OKAZAKI, M., TAKAHASHI, J., MORIWAKI, Y., Electron spin resonance study of sound and carious enamel. Calcif. Tissue Int. 34, Suppl2: 88–92 (1982).
[79] BRIK, A., RADCHUK, V., SCHERBINA, O., MATYASH, M., GAVER, O., Metamorphic modifications and EPR dosimetry in tooth enamel, Appl. Radiat. Isot., 47, 1317–1319 (1996).
[80] FAVERO, M.S., BOND, W.W. Sterilization, disinfection, and antisepsis in the hospital. In: Balows A, Hausler WJ, Herrmann KL, Isenberg HD, Shadomy HJ, eds. Manual of clinical microbiology, 5th ed. Washington, DC: American Society for Microbiology, 1991:183–200.
[81] DEWALD, J.P. The use of extracted teeth for in vitro bonding studies: a review of infection control considerations. Dent Mater. 13(2): 74–81 (1997).
[82] 83AMAECHI, B.T., HIGHAM, S.M., EDGAR, W.M., Efficacy of sterilization methods and their effect on enamel demineralisation. Caries Res., 32(6): 441–446 (1998).
49
[83] Recommended Infection-Control Practices for Dentistry. Centers for Disease Control and Prevention MMWR Recommendations and Reports Vol 42, No RR08;001 05/28/1993 Atlanta (1993).
[84] ARAGNO, D., FATTIBENE, P., ONORI, S., Mechanically induced EPR signal in enamel, Appl. Radiat. Isot., 55, 375–382 (2001).
[85] HASKELL, E.H., KENNER, G.H., HAYES, R.B. Electron paramagnetic resonance dosimetry of dentine following removal of organic material. Health Phys 68: 579–584 (1995).
[86] PASS B., ALDRICH J.E., SCALLION P.L. An analysis of paramagnetic centers in irradiated dentin using electron spin resonance. Calcif.Tissue Int., 46, 166–168 (1990).
[87] DESROSIERS, M.F., SIMIC, M.G., EICHMILLER, F.C., JOHNSTON, A.D., BOWEN, R.L. Mechanically-induced generation of radicals in tooth enamel, Appl. Radiat. Isot., 40, 1195–1197 (1989).
[88] EGERSDÖRFER, S., WIESER, A., MULLER, A. Tooth enamel as a detector material for retrospective EPR dosimetry, Appl. Radiat. Isot. 47, 1299–1304 (1996).
[89] ROMANYUKHA A.A., REGULLA D., VASILENKO E., WIESER A. South Ural nuclear workers: Comparison of individual doses from retrospective EPR dosimetry and operational personal monitoring. Appl. Radiat. Isot. 45, 1195–1199 (1994).
[90] HASKELL, E.H., HAYES, R.B., KENNER, G.H. Preparation-induced Errors in EPR dosimetry of enamel: pre- and post-crushing sensitivity, Appl. Radiat. Isot., 47, 1305–1310 (1996).
[91] SHOLOM S.V., HASKELL E.H., HAYES R.B., KENNER G.H., CHUMAK V.V., Influence of crushing and additive irradiation procedures on EPR of tooth enamel. Radiat. Meas. 29, 105–111 (1998).
[92] PASS B., ALDRICH J. Dental Enamel as an in vivo Radiation Dosimeter. Med. Phys. 12, 3, 305–07 (1985).
[93] FATTIBENE, P., ARAGNO, D., ONORI, S., Thermal induced EPR signals in tooth enamel. Radiat. Meas., 32, 5–6, 393−398 (2000).
[94] CALLENS, F., MOENS, P., VERBEECK, R., An EPR study of intact and powdered human tooth enamel dried at 400°C. Calcif Tissue Int., 56, 543–548 (1995).
[95] IVANNIKOV A.I., TROMPIER F., GAILLARD-LECANU, SKVORTTSOV V.G., STEPANENKO V.F., Optimization of recording conditions for the EPR signal used in dental enamel dosimetry, Rad. Protec. Dosim. (2002) in press.
[96] IVANNIKOV, SKVORTSOV V.G., STEPANENKO V.F., TIKUNOV D.D., TAKADA J., HOSHI M. EPR tooth enamel dosimetry: optimization of the automated spectra deconvolution routine, Health Phys. 81: 124–137 (2001).
[97] DESROSIERS, M.F. EPR bone dosimetry: a new approach to spectral deconvolution problems. Appl. Radiat. Isot. 44, 81–83 (1993).
[98] JONAS, M. Spectral deconvolution of the ESR dating signal in fossil tooth enamel. Quat. Sci. Rev., 14, 431–438 (1995).
[99] KOSHTA, A.A., WIESER, A., IGNATIEV, E.A., BAYANKIN, S., ROMANYUKHA, A.A., DEGTEVA, M.O. New computer procedure for routine EPR-dosimetry on tooth enamel. Description and verification. Appl. Radiat. lsot. 52, 1287–1290 (2000).
[100] DUBOVSKY, S., KIRILLOV, V. Reconstruction of individual absorbed doses by tooth enamel on the base of non-linear simulation of their EPR-spectra, Appl. Radiat. Isot., 54, 833–837 (2001).
[101] ONORI, S., ARAGNO, D., FATTIBENE, P., PETETTI, E., PRESSELLO, M.C. ISS protocol for EPR tooth dosimetry. Radiat. Meas., 32, 787–792 (2000).
50
[102] MOENS P.D.W., CALLENS F.J., VERBEECK R.M.H., NAESSENS D.E. An EPR spectrum decomposition study of precipitated carbonated apatites (NCAP) dried at 25°C: Adsorption of molecules from atmosphere on the apatite powders. Appl. Radiat. Isot., 44, 279–285 (1993).
[103] SHIMANO T., IWASAKI M., MIYAZAWA C., MIKI T., KAI A., IKEYA M. Human tooth dosimetry for gamma rays and dental X rays using ESR. Appl. Radiat. Isot. 40, 1035–1038 (1989).
[104] SKVORTZOV V.G., IVANNIKOV A.I., EICHHOFF U. Assessment of individual accumulated irradiation doses using EPR spectroscopy of tooth enamel. J. Mol. Struct. 347, 321–330 (1995).
[105] DESROSIERS, M.F., NAGY, V.Yu., ROMANYUKHA, A.A., Comment on article by Haskell, Hayes and Kenner. Health Phys., 77, 470–471, (1999).
[106] PASS B., SHAMES, A.I. Signal processing for radiation dosimetry using EPR in dental enamel: comparison of three methods. Radiat. Meas., 32, 163–167 (2000).
[107] IGNATIEV E. A., ROMANYUKHA A. A., KOSHTA A. A., WIESER A. Selective saturation method for EPR dosimetry with tooth enamel. Appl. Radiat. Isot., 47, 333–337 (1996).
[108] MOROZ, I.A., SEREZHENKOV, V.A., KLEVEZAL, G.A., BURBAEV, D.S., VANIN, A.F. New possibilities in the estimation of absorbed doses using an electron paramagnetic resonance method. Biophysics, Vol. 39, No. 6, pp. 1075–1081, (1994).
[109] IWASAKI, M., MIYAZAWA, C., SHIMANO, T. Relation between the weight of human tooth enamel and CO3
3- signal intensity on the ESR dosimetry. Ohu Univ. Dental Journal, 17, 95–100 (1990).
[110] HAYES R.B., HASKELL E.H., BARRUS, J.K., KENNER G.H., ROMANYUKHA A.A., Accurate EPR radiosensitivity calibration using small sample masses. Nuclear Instruments & Methods in Physics Research, A, 441, 535–550 (2000).
[111] HASKELL, E.H, HAYES, R.B, KENNER, G.H. Improved accuracy of EPR dosimetry using a constant rotation goniometer. Radiat. Meas. 27, 325–329 (1997).
[112] DESROSIERS, M.F. Assessing radiation dose to food. Nature, 345, 485 (1996). [113] ISHII, H., IKEYA, M. An electron spin resonance system for in vivo human tooth
dosimetry. Jpn. J. Appl. Phys., 29, 871–875 (1990). [114] GRÜN, R. Present status of ESR-dating. Appl. Radiat. Isot. 40, 1013–1020 (1989).[115] LEE, H.K., RINK, W.J., SCHWARCZ, H.P. Comparison of ESR signal dose responses
in modern and fossil tooth enamels. Radiat. Meas. 27, 405–411 (1997). [116] POLYAKOV V., HASKELL E.H., KENNER G.H., HÜTT G., HAYES R.B. Effect of
mechanically induced background signal on EPR dosimetry of tooth enamel. Radiat. Meas., 24, 249–254 (1995).
[117] WIESER A., GÖKSU H.Y., REGULLA D.F., VOGENAUER A. Dose rate assessment in tooth enamel. Quat. Sci. Rev., 7, 491–495 (1988).
[118] NAGY, V. Accuracy considerations in EPR dosimetry. Appl. Radiat. Isot., 52, 5, 1039–1050, (2000).
[119] HASKELL, E.H., HAYES, R.B., ROMANYUKHA, A.A., KENNER, G.H. Preliminary report on the development of a virtually nondestructive additive dose technique for EPR dosimetry. Appl. Radiat. lsot. 52, 1065–1070 (2000).
[120] HUBBELL, J.H. Photon mass attenuation and energy-absorption coefficients from 1 keV to 20 MeV, Int. J. Appl. Radiat. Isot. 33, 1269–1290 (1982).
[121] HUBBELL, J. H., SELTZER, S. M. Tables of X ray mass attenuation coefficients and mass energy-absorption coefficients 1 keV to 20 MeV for elements Z = 1 to 92 and 48. additional substances of dosimetric interest. Report NISTIR 5632, National Institute of Standards and Technology, Gaithersburg, MD (1995).
51
[122] WIESER A., ARAGNO D., EL-FARAMAWY N., FATTIBENE P., ECKBACH R., ONORI S., PRESSELLO M.C., PUGLIANI L., ULANOVSKY A., ZANKL M. Monte Carlo calculation and experimental verification of the photon energy response of tooth enamel in a head-size plexiglas phantom. Radiat. Prot. Dosim., 101, 549–552 (2002).
[123] COPELAND, J., KASE, K.; CHABOT, G.; GREENAWAY, F.; INGLIS, G. Spectral energy effects in ESR bone dosimetry: photons and electrons. Appl. Radiat Isot. 44 1/2 pp 101–06 (1993).
[124] DESROSIERS, M.F., ROMANYUKHA, A.A. Technical aspects of the electron paramagnetic resonance method for tooth enamel dosimetry. In, Biomarkers: Medical and workplace applications (M.L. Mendelssohn, L.C. Mohr, J.P. Peters, Eds.) Joseph Henry Press, Washington, DC pp. 53–64 (1998).
[125] IWASAKI, M., MIYAZAWA, C.; KUBOTA, A.; SUZUKI, E.; SATO, K.; NAOI, J.; KATOH, A.; NIWA, K. Energy dependence of the CO3
3- Signal Intensity in ESR dosimetry of human tooth enamel. Radioisotopes, 40, 421–424 (1991).
[126] SCHAUER D., DESROSIERS M., LE F., SELTZER S., LINKS J. EPR dosimetry of cortical bone and tooth enamel irradiated with X and gamma rays: study of energy dependence. Radiat. Res., 138, 1–8 (1994).
[127] SEREZHENKOV V., DOMRACHEVA E., KLEVEZAL G., KULIKOV S., KUZNETSOV S., MORDVINTCEV P., SUKHOVSKAYA L., SCHKLOVSKY-KORDI N.E., VANIN A.F. Radiation dosimetry for residents of the Chernobyl region: A Comparison of cytogenetic and electron spin resonance methods. Radiat. Prot. Dosim., 42, 1, 33–36 (1992).
[128] TAKAHASHI F., YAMAGUCHI Y., IWASAKI M., MIYAZAWA C., HAMADA T., Relations between tooth enamel dose and organ doses for the electron spin resonance dosimetry against external photon exposure Radiat. Prot. Dosim, 95, 101–108 (2001).
[129] INTERNATIONAL ORGANIZATION FOR STANDARDIZATION, (ISO). Guide to the expression of uncertainty in measurement, Geneva, Switzerland. ISBN 92–67–10188–9 (1995).
[130] STANDARD PRACTICE FOR USE OF THE ALANINE-EPR DOSIMETRY SYSTEM. ANNUAL BOOK OF ASTM STANDARDS. Section 12. Volume 12.02., 803–809 (1999).
[131] BRIK A.B., HASKELL E.H., BRIK V.B., ATAMANENKO O.N., and SCHERBINA O.I. Anisotropy effects of EPR signals and mechanisms of mass transfer in tooth enamel and bones. Appl. Radiat. Isot., 52, 1077–1083 (2000).
[132] BRIK A.B., BARABOY V.A., ATAMANENKO O.N., and SCHEVCHENKO Yu.B. Metabolism in tooth enamel and reliability of retrospective dosimetry. Appl. Radiat. Isot. 52, 1305–1310 (2000).
[133] BRIK A., ULYANCHICH N., KENNER G., BRIK V., RICE E., KALINICHENKO A., and BAGMUT N. EPR of impurity crystal phases in biominerals and their synthetic analogues, Minearlogical J. 23, 1, 23–37 (2001).
[134] WIESER A., EL-FARAMAWY N., MECKBACH R. Dependencies of the radiation sensitivity of human tooth enamel in EPR dosimetry. Appl. Radiat. Isot. 54, 793–799 (2001).
[135] ROMANYUKHA A.A., SELTZER S., DESROSIERS M., IGNATIEV E.A., IVANOV D.V., BAYANKIN S., DEGTEVA M.O., EICHMILLER F.C., WIESER, A., JACOB P. Correction factors in EPR dose reconstruction for the residents of the Middle and Lower Techa riverside. Health Phys., 81, 554–566 (2001).
[136] ROMANYUKHA A.A., IGNATIEV E.A., IVANOV D.V., VASILYEV A.G. The distance effect on individual exposures evaluated from the Soviet nuclear bomb test at Totskoye test site in 1954. Radiat. Prot. Dosim., 86, 53–58 (1999).
52
[137] ROSSI A.M., WAFCHECK C.C., DE JESUS E.F., PELEGRINI F. Electron spin resonance dosimetry of teeth of Goiania radiation accident victims. Appl. Radiat. Isot. 52, 1297–1303 (2000).
[138] SKVORTSOV V.G., IVANNIKOV A.I., STEPANENKO V.F., TSYB A.F., KHAMIDOVA L.G., KONDRASHOV A.E., TIKUNOV D.D. Application of EPR retrospective dosimetry for large scale accidental situation. Appl. Radiat. Isot. 52, 1275–1282 (2000).
[139] STEPANENKO V., SKVORTSOV V., TSYB A., IVANNIKOV A., KONDRASHOV A., TIKUNOV D., IASKOVA E., SHAKHTARIN V., PETIN D., PARSHKOV E., CHERNICHENKO L., SNYKOV V., ORLOV M., GAVRIHN Yu., KHROUSCH V. SHINKAREV S. Thyroid and whole body dose reconstruction in Russia following the Chernobyl accident: review of progress and results. Radiat. Prot. Dosim., 77, 101–106 (1998).
[140] STATE STANDARD OF RUSSIAN FEDERATION, GOST R 22.3.04-96. SAFETY IN EMERGENCIES. DOSIMETRIC CONTROL OF POPULATION. METHOD OF ABSORBED RADIATION DOSES MEASUREMENT USING ESR-SPECTRA OF TOOTH ENAMEL. Goststandart, Moscow (1996).
[141] IVANNIKOV, A.I., ZHUMADILOV ZH., GUSEV B.I., MIYAZAWA CH., JIAO L., SKVORTSOV V.G., STEPANENKO V.F., TAKADA J. AND HOSHI M. Individual dose reconstruction among residents living in the vicinity of the Semipalatinsk Nuclear test site using EPR spectroscopy of tooth enamel. Health Phys. (2002) in press.
53

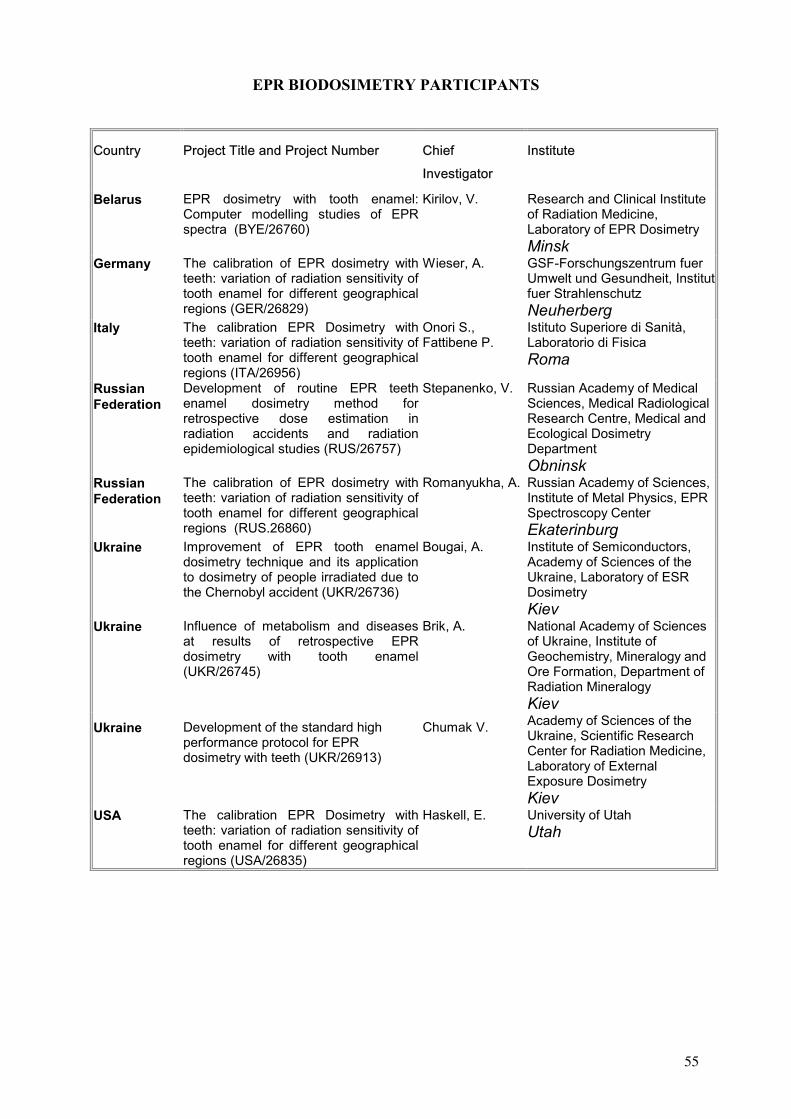
EPR BIODOSIMETRY PARTICIPANTS
Belarus EPR dosimetry with tooth enamel:Computer modelling studies of EPR spectra (BYE/26760)
Kirilov, V. Research and Clinical Institute of Radiation Medicine, Laboratory of EPR Dosimetry Minsk
Germany The calibration of EPR dosimetry with teeth: variation of radiation sensitivity of tooth enamel for different geographical regions (GER/26829)
Wieser, A. GSF-Forschungszentrum fuer Umwelt und Gesundheit, Institut fuer Strahlenschutz Neuherberg
Italy The calibration EPR Dosimetry with teeth: variation of radiation sensitivity of tooth enamel for different geographical regions (ITA/26956)
Onori S., Fattibene P.
Istituto Superiore di Sanità, Laboratorio di Fisica Roma
Russian Federation
Development of routine EPR teeth enamel dosimetry method for retrospective dose estimation in radiation accidents and radiation epidemiological studies (RUS/26757)
Stepanenko, V. Russian Academy of Medical Sciences, Medical Radiological Research Centre, Medical and Ecological Dosimetry Department Obninsk
Russian Federation
The calibration of EPR dosimetry with teeth: variation of radiation sensitivity of tooth enamel for different geographical regions (RUS.26860)
Romanyukha, A. Russian Academy of Sciences, Institute of Metal Physics, EPR Spectroscopy Center Ekaterinburg
Ukraine Improvement of EPR tooth enamel dosimetry technique and its application to dosimetry of people irradiated due to the Chernobyl accident (UKR/26736)
Bougai, A. Institute of Semiconductors, Academy of Sciences of the Ukraine, Laboratory of ESR Dosimetry Kiev
Ukraine Influence of metabolism and diseases at results of retrospective EPR dosimetry with tooth enamel (UKR/26745)
Brik, A. National Academy of Sciences of Ukraine, Institute of Geochemistry, Mineralogy and Ore Formation, Department of Radiation Mineralogy Kiev
Ukraine Development of the standard high performance protocol for EPR dosimetry with teeth (UKR/26913)
Chumak V. Academy of Sciences of the Ukraine, Scientific Research Center for Radiation Medicine, Laboratory of External Exposure Dosimetry Kiev
USA The calibration EPR Dosimetry with teeth: variation of radiation sensitivity of tooth enamel for different geographical regions (USA/26835)
Haskell, E. University of Utah Utah
55

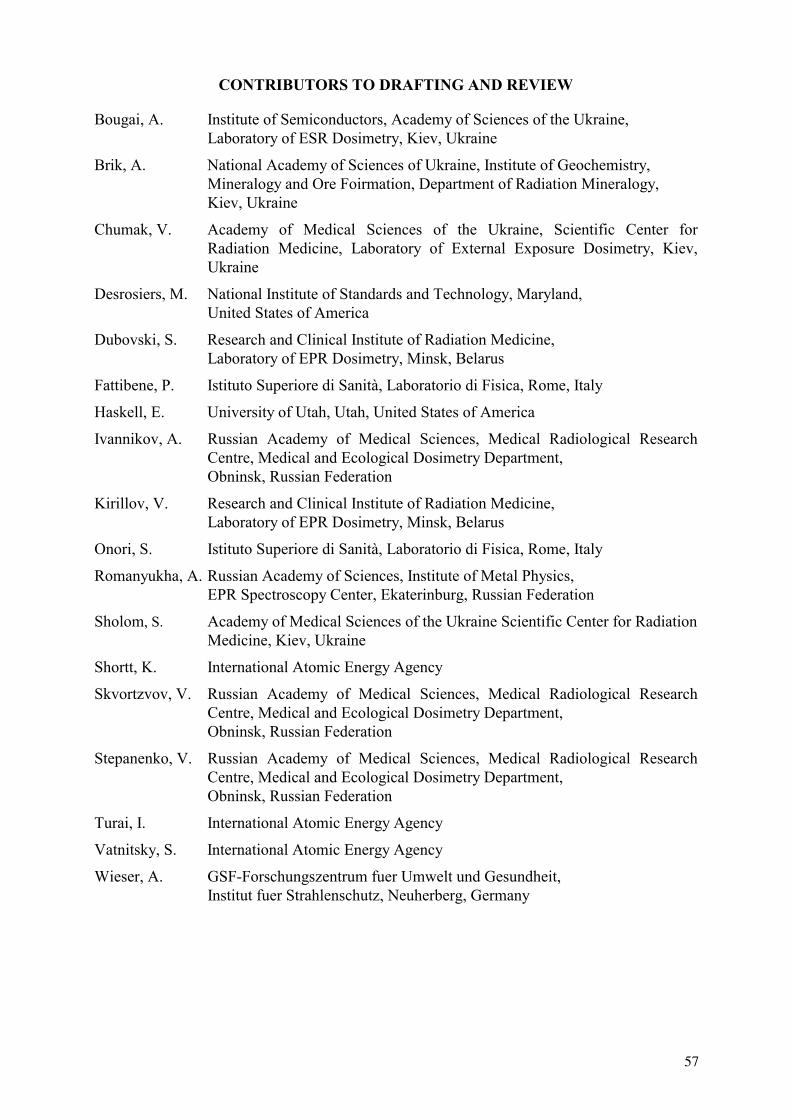
CONTRIBUTORS TO DRAFTING AND REVIEW
Bougai, A. Institute of Semiconductors, Academy of Sciences of the Ukraine, Laboratory of ESR Dosimetry, Kiev, Ukraine
Brik, A. National Academy of Sciences of Ukraine, Institute of Geochemistry, Mineralogy and Ore Foirmation, Department of Radiation Mineralogy, Kiev, Ukraine
Chumak, V. Academy of Medical Sciences of the Ukraine, Scientific Center for Radiation Medicine, Laboratory of External Exposure Dosimetry, Kiev, Ukraine
Desrosiers, M. National Institute of Standards and Technology, Maryland, United States of America
Dubovski, S. Research and Clinical Institute of Radiation Medicine,Laboratory of EPR Dosimetry, Minsk, Belarus
Fattibene, P. Istituto Superiore di Sanità, Laboratorio di Fisica, Rome, Italy
Haskell, E. University of Utah, Utah, United States of America
Ivannikov, A. Russian Academy of Medical Sciences, Medical Radiological Research Centre, Medical and Ecological Dosimetry Department, Obninsk, Russian Federation
Kirillov, V. Research and Clinical Institute of Radiation Medicine,Laboratory of EPR Dosimetry, Minsk, Belarus
Onori, S. Istituto Superiore di Sanità, Laboratorio di Fisica, Rome, Italy
Romanyukha, A. Russian Academy of Sciences, Institute of Metal Physics, EPR Spectroscopy Center, Ekaterinburg, Russian Federation
Sholom, S. Academy of Medical Sciences of the Ukraine Scientific Center for Radiation Medicine, Kiev, Ukraine
Shortt, K. International Atomic Energy Agency
Skvortzvov, V. Russian Academy of Medical Sciences, Medical Radiological Research Centre, Medical and Ecological Dosimetry Department, Obninsk, Russian Federation
Stepanenko, V. Russian Academy of Medical Sciences, Medical Radiological Research Centre, Medical and Ecological Dosimetry Department, Obninsk, Russian Federation
Turai, I. International Atomic Energy Agency
Vatnitsky, S. International Atomic Energy Agency
Wieser, A. GSF-Forschungszentrum fuer Umwelt und Gesundheit, Institut fuer Strahlenschutz, Neuherberg, Germany
57