Embed Size (px)
Citation preview

- 1 -
UNIVERSITI TEKNIKAL MALAYSIA MELAKA PUSAT PENGAJIAN SISWAZAH
LAPORAN KEMAJUAN (PROGRESS REPORT) SEMESTER .....5........ SESI ........2015/2016........
A. MAKLUMAT PELAJAR / DETAILS OF STUDENT
Nama (Name) : Penganjur (Sponsor) :
VASANTHAN A/L SAKTHI VELU My Brain 15 KPT
No. Matrik (Matric No.): Fakulti (Faculty) :
M011310008 FKE
Alamat Surat Menyurat (Corresponding Address) :
NO. 85 PERSIARAN RISHAH 11, TAMAN SILIBIN RIA, 30100, IPOH, PERAK.
MAKLUMAT PENGAJIAN (DETAILS OF PROGRAMME)
Program Pengajian
(Programme of Study)
D. Eng PhD Msc
Bidang Pengkhususan
(Field of Specialization )
Electrical Manufacturing Entrepreneurship
Mechatronics Mechanical Technology
Electronics ICT Management
Jenis Pendaftaran
(Types of Registration)
Semester / Sesi Pendaftaran Pertama (Semester / session of
First Registration)
Jangkaan Tamat Pengajian (Expected Completion of Studies)
Full Time :
Part Time :
Nama Penyelia: 1. ..DR. CHONG SHIN HORNG.................
(Name of Supervisor(s)) 2. ..DR. MARIAM MD GHAZALY...............
3. ...............................................................
UTeM 29/1/14
- 2 -
B. KEMAJUAN PENGAJIAN (PROGRESS OF STUDIES)
i. Tajuk Tesis/Projek Penyelidikan (Title of Thesis/Research Project)
POSITIONING CONTROL OF 1-DOF PNEUMATIC MUSCLE ACTUATOR SYSTEM
ii. Ringkasan Projek (Project Outline)
(Thesis Abstract; Thesis submitted for faculty level approval)
The pneumatic muscle actuator (PMA) is a novel actuator which carries numerous
advantages such as high strength and power/weight ratio, low cost, compact, clean and easy
to maintain features. However, pneumatic muscle actuator has notable nonlinear
characteristics, which makes it difficult to control. The purpose of this research is focused
on experimental system development and parameter characterization of phenomenological
modelling for commercially available Festo Fluidic Muscle Actuator. The model and
parameters obtained from the characterization are validated in simulation and experimental
platform. The major part of the research is focused on the framework of the feedforward +
nonlinear PID control system, and its effectiveness in a 1 degree-of-freedom PMA system
is experimentally demonstrated in comparison with a classical PID controller. The overall
control system comprises of a feedforward controller and a nonlinear PID controller in the
feedback loop which designed based on the exact PMA system characteristics. The design
procedure of the feedforward + nonlinear PID controller is practical and features easy
design procedures. The usefulness and advantages of the proposed controller are shown via
positioning and tracking motion experimental studies. Besides, this study also highlights
the robustness of the feedforward + nonlinear PID controller by examining its performance
in point-to-point and tracking motions in the presence of extra mass. In the robustness
performance, the feedforward + nonlinear PID controller is compared with a classical PID
control systems. The comparative experiments results illustrate that feedforward +
nonlinear PID controller shows the significant motion performances as compared to the
PID controller. The framework used to develop the proposed controller is generally enough
for further investigation in PMA motion control system, further improvement in terms of
positioning accuracy and tracking motion could extend the usefulness of the controller into
other type of rehabilitation applications.
- 3 -
iii. Pengumpulan Data Data Collection (Tick where appropriate) Completion of Data Collection
1 2 3 4 5 6 7 8 9 10
Start Complete
Remarks : Thesis has been submitted for faculty level approval. Expecting for VIVA in the month of
March 2016.
(Thesis Chapter 4: Perfoamnce Evaluation and Resul Analysis)
Introduction
This chapter begins with the open loop performance validation of the phenomenological
model in simulation and experimental environment. Then, this chapter focuses on validating the
usefulness and adaptability of the proposed controller on the 1-DOF pneumatic muscle actuator
system experimentally. The performance validation of the feedforward + nonlinear PID
controller has been focused on point-to-point positioning and tracking performance in
comparison with the classical PID controller. The positioning and tracking performance of the
proposed controller is examined in several step heights. Final part of this chapter covers the
repeatability, robustness evaluation and analysis in comparison with the classical PID controller.
The chapter is ended with a brief summary on chapter 4.
Phenomenological Model Validation
In order to prove the adaptability and usefulness of the phenomenological model,
simulated open-loop responses using the phenomenological model and experimental open-loop
responses using the actual PMA system are compared. The experimentally determined spring
coefficient Km, damping coefficient Bm and the contractile force coefficient Fce are used in
simulation environment. The simulation block diagram is designed based on the
phenomenological model equation of motion. In order to minimize the model linearization
influence, the experimentally determined coefficient values were fed-in the form of nonlinear
curve fit to predict the PMA contraction in the simulation environment. Accordingly, the validity
of the phenomenological model is confirmed. The step input with amplitude: 150-500kPa
(increment of 50kPa under 0N loading condition) are used to command the PMA system in
open-loop.
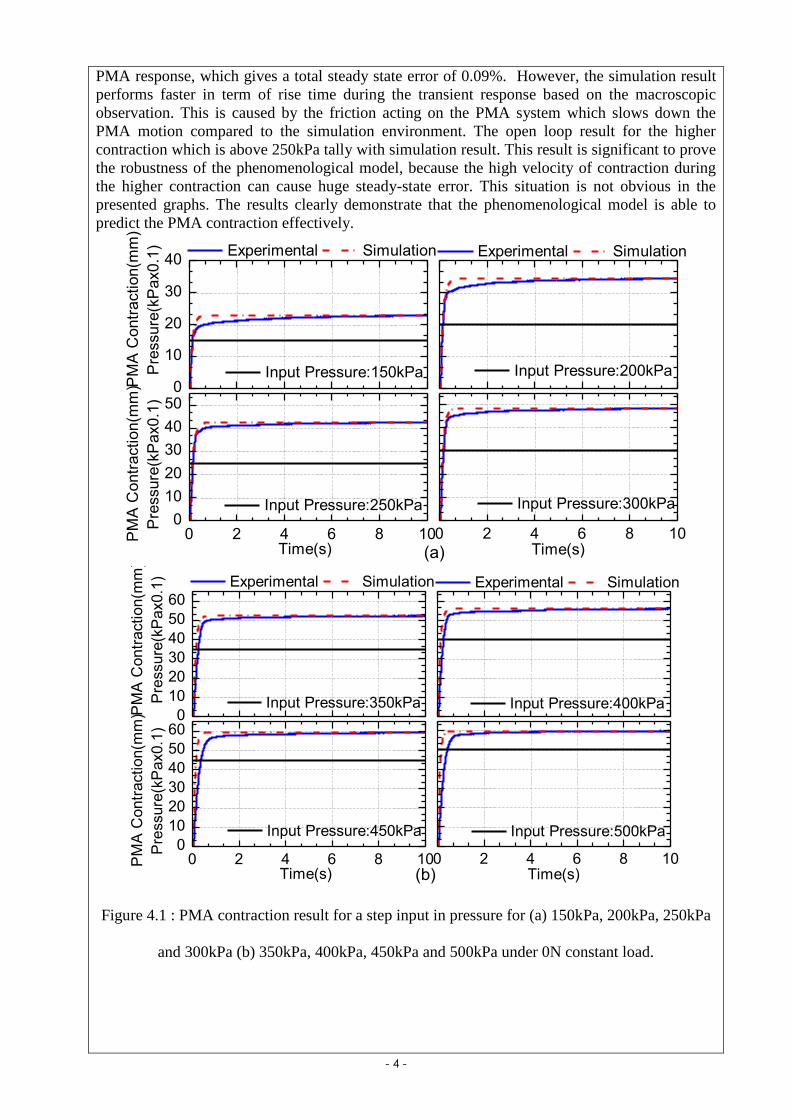
Figure 4.1(a) and Figure 4.1(b) illustrate the experimental and simulation responses of
the system under different pressures. The model was tested with the comparison of pressure of
pressure at 150kPa, 250kPa, 300kPa, 350kPa, 400kPa, 450kPa and 500kPa under 0N external
loads correspondingly. The comparative results show identical open loop contraction
performance with a small steady state error. It can be observed that the simulated results agree
with the experimental ones. Besides that, there is no vibration encountered in the transient and
steady-state phase of the simulation and experimental results. In the first simulation results
presented in Figure 4.1 (a) and Figure 4.1 (b), the PMA is inflated by a constant input pressure
P=150kPa and the response of the phenomenological model and the experimental response are
depicted in Figure 4.1(a). Under this applied pressure, the PMA able to reach a maximum
contraction at x=22.93mm in the simulation environment, and x=22.91mm in the experimental
- 4 -
PMA response, which gives a total steady state error of 0.09%. However, the simulation result
performs faster in term of rise time during the transient response based on the macroscopic
observation. This is caused by the friction acting on the PMA system which slows down the
PMA motion compared to the simulation environment. The open loop result for the higher
contraction which is above 250kPa tally with simulation result. This result is significant to prove
the robustness of the phenomenological model, because the high velocity of contraction during
the higher contraction can cause huge steady-state error. This situation is not obvious in the
presented graphs. The results clearly demonstrate that the phenomenological model is able to
predict the PMA contraction effectively.
0
10
20
30
40
(a)
Experimental Simulation
PM
A C
ontr
action(m
m)
Pre
ssure
(kP
ax0.1
)
Input Pressure:150kPa
Experimental Simulation
Input Pressure:200kPa
0 2 4 6 8 100
10
20
30
40
50
Input Pressure:250kPa
PM
A C
ontr
action(m
m)
Pre
ssure
(kP
ax0.1
)
Time(s)0 2 4 6 8 10
Input Pressure:300kPa
Time(s)
0
10
20
30
40
50
60
Experimental Simulation
PM
A C
ontr
action(m
m)
Pre
ssure
(kP
ax0.1
)
Input Pressure:350kPa
Experimental Simulation
Input Pressure:400kPa
0 2 4 6 8 100
10
20
30
40
50
60
Input Pressure:450kPa
PM
A C
ontr
action(m
m)
Pre
ssure
(kP
ax0.1
)
Time(s) (b)0 2 4 6 8 10
Input Pressure:500kPa
Time(s)
Figure 4.1 : PMA contraction result for a step input in pressure for (a) 150kPa, 200kPa, 250kPa
and 300kPa (b) 350kPa, 400kPa, 450kPa and 500kPa under 0N constant load.
- 5 -
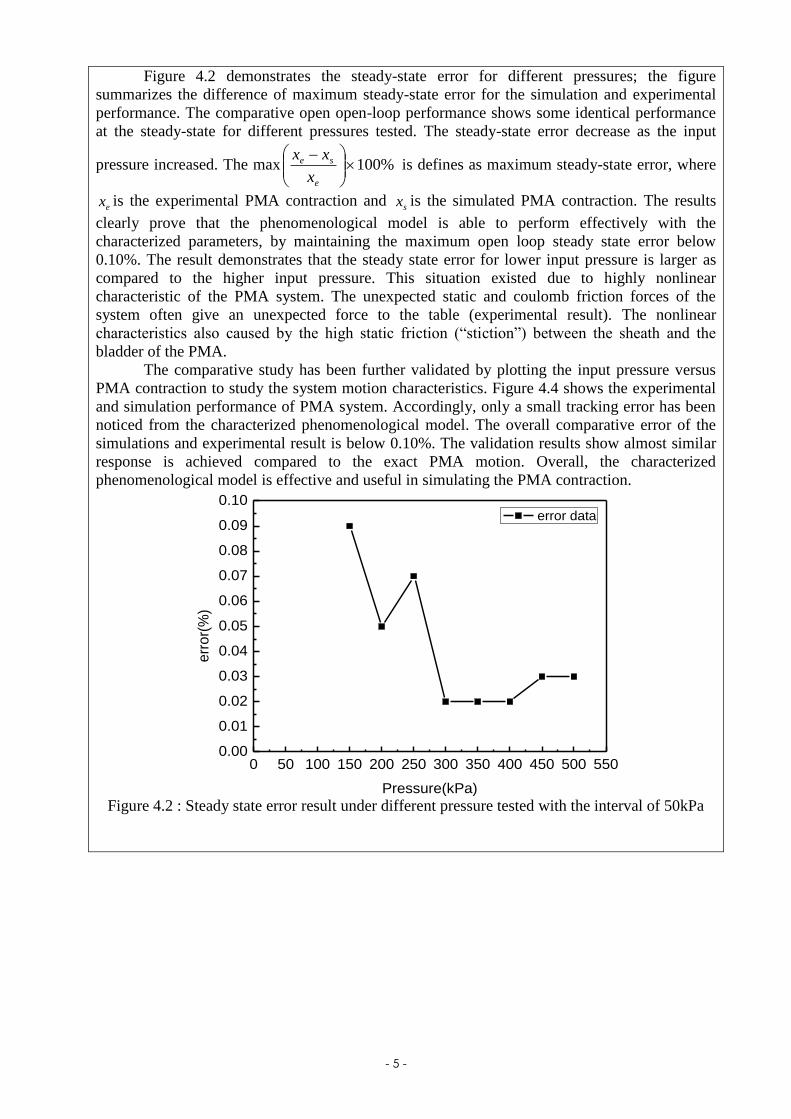
Figure 4.2 demonstrates the steady-state error for different pressures; the figure
summarizes the difference of maximum steady-state error for the simulation and experimental
performance. The comparative open open-loop performance shows some identical performance
at the steady-state for different pressures tested. The steady-state error decrease as the input
pressure increased. The max %100
e
se
x
xx is defines as maximum steady-state error, where
ex is the experimental PMA contraction and sx is the simulated PMA contraction. The results
clearly prove that the phenomenological model is able to perform effectively with the
characterized parameters, by maintaining the maximum open loop steady state error below
0.10%. The result demonstrates that the steady state error for lower input pressure is larger as
compared to the higher input pressure. This situation existed due to highly nonlinear
characteristic of the PMA system. The unexpected static and coulomb friction forces of the
system often give an unexpected force to the table (experimental result). The nonlinear
characteristics also caused by the high static friction (“stiction”) between the sheath and the
bladder of the PMA.
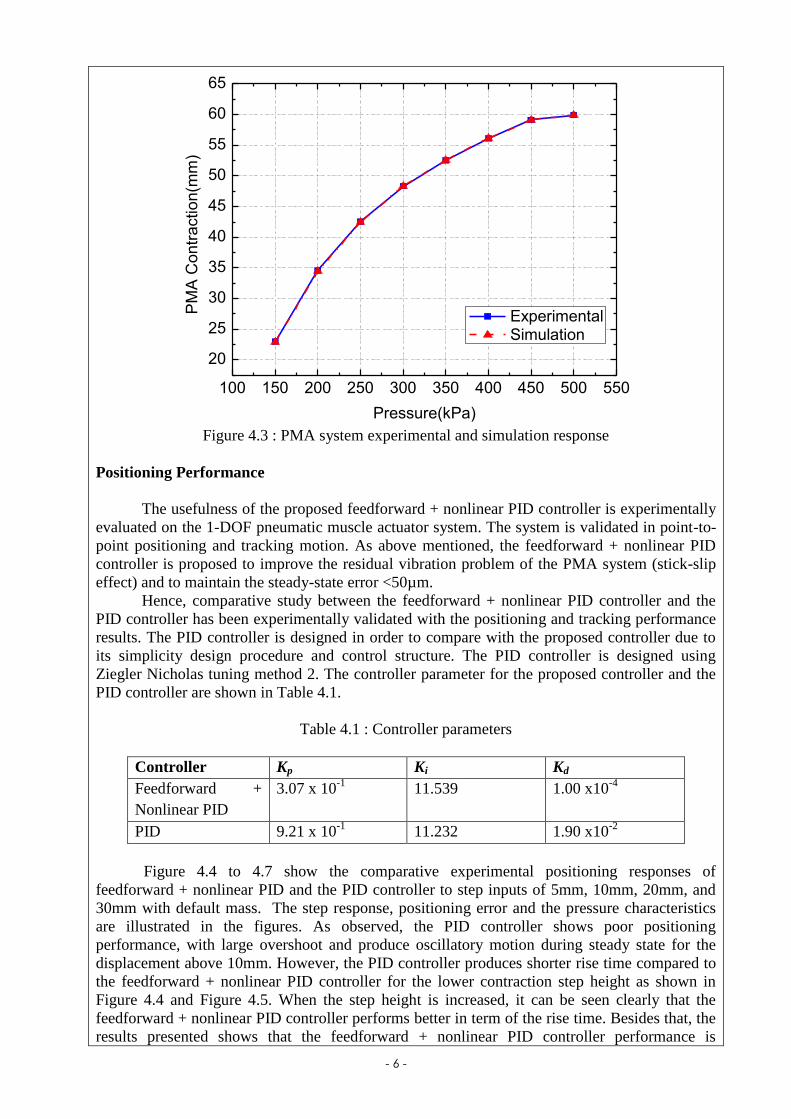
The comparative study has been further validated by plotting the input pressure versus
PMA contraction to study the system motion characteristics. Figure 4.4 shows the experimental
and simulation performance of PMA system. Accordingly, only a small tracking error has been
noticed from the characterized phenomenological model. The overall comparative error of the
simulations and experimental result is below 0.10%. The validation results show almost similar
response is achieved compared to the exact PMA motion. Overall, the characterized
phenomenological model is effective and useful in simulating the PMA contraction.
0 50 100 150 200 250 300 350 400 450 500 5500.00
0.01
0.02
0.03
0.04
0.05
0.06
0.07
0.08
0.09
0.10
err
or(
%)
Pressure(kPa)
error data
Figure 4.2 : Steady state error result under different pressure tested with the interval of 50kPa
- 6 -
100 150 200 250 300 350 400 450 500 550
20
25
30
35
40
45
50
55
60
65
PM
A C
ontr
actio
n(m
m)
Pressure(kPa)
Experimental Simulation
Figure 4.3 : PMA system experimental and simulation response
Positioning Performance
The usefulness of the proposed feedforward + nonlinear PID controller is experimentally
evaluated on the 1-DOF pneumatic muscle actuator system. The system is validated in point-to-
point positioning and tracking motion. As above mentioned, the feedforward + nonlinear PID
controller is proposed to improve the residual vibration problem of the PMA system (stick-slip
effect) and to maintain the steady-state error <50µm.
Hence, comparative study between the feedforward + nonlinear PID controller and the
PID controller has been experimentally validated with the positioning and tracking performance
results. The PID controller is designed in order to compare with the proposed controller due to
its simplicity design procedure and control structure. The PID controller is designed using
Ziegler Nicholas tuning method 2. The controller parameter for the proposed controller and the
PID controller are shown in Table 4.1.
Table 4.1 : Controller parameters
Controller Kp Ki Kd
Feedforward +
Nonlinear PID
3.07 x 10⁻¹
11.539 1.00 x10⁻⁴
PID 9.21 x 10⁻¹
11.232 1.90 x10⁻²
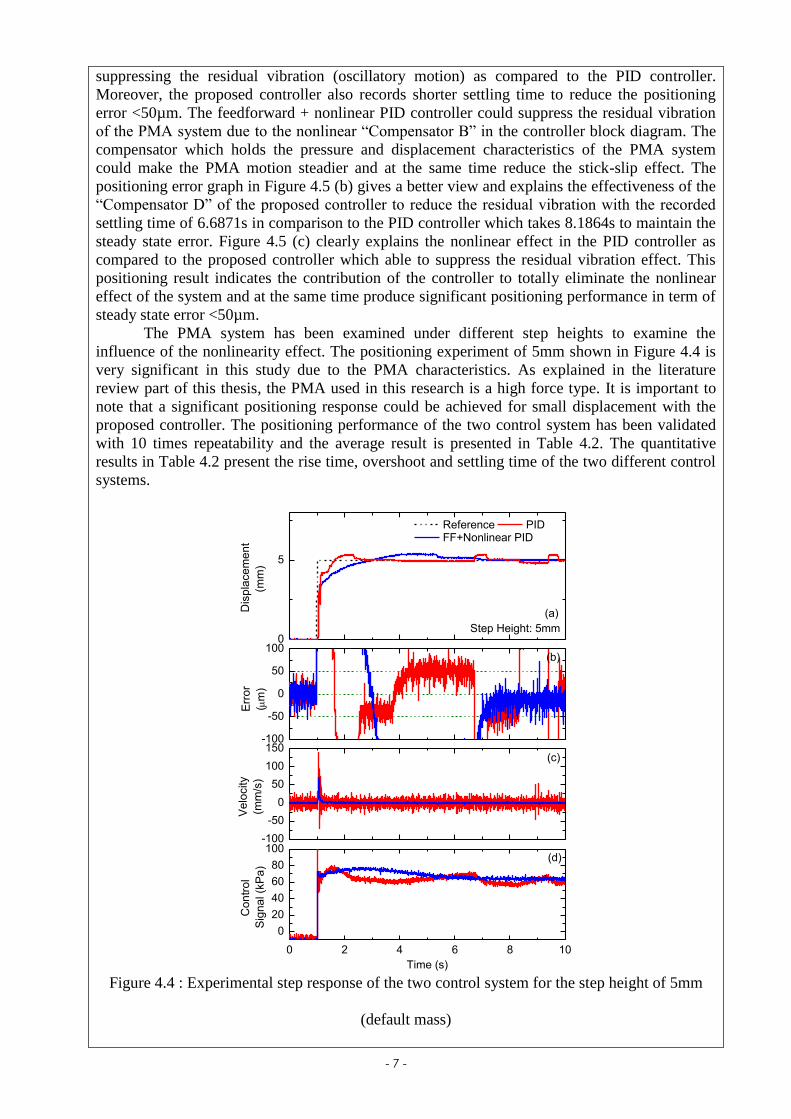
Figure 4.4 to 4.7 show the comparative experimental positioning responses of
feedforward + nonlinear PID and the PID controller to step inputs of 5mm, 10mm, 20mm, and
30mm with default mass. The step response, positioning error and the pressure characteristics
are illustrated in the figures. As observed, the PID controller shows poor positioning
performance, with large overshoot and produce oscillatory motion during steady state for the
displacement above 10mm. However, the PID controller produces shorter rise time compared to
the feedforward + nonlinear PID controller for the lower contraction step height as shown in
Figure 4.4 and Figure 4.5. When the step height is increased, it can be seen clearly that the
feedforward + nonlinear PID controller performs better in term of the rise time. Besides that, the
results presented shows that the feedforward + nonlinear PID controller performance is
- 7 -
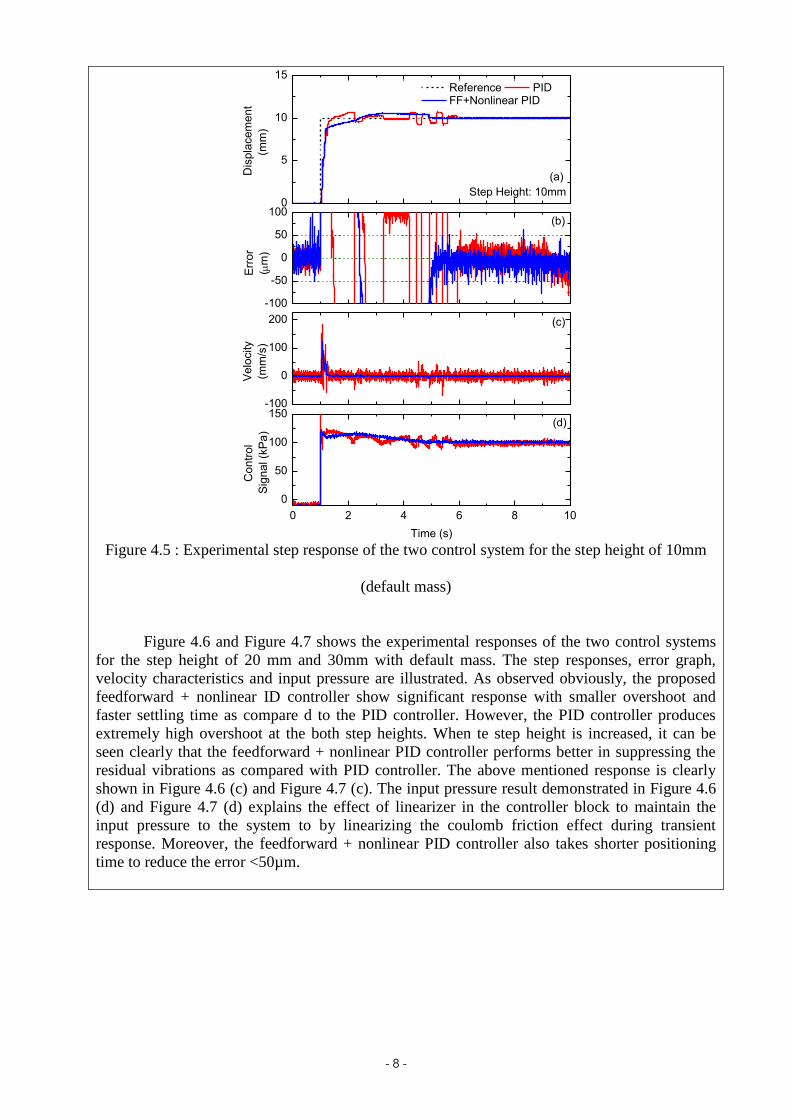
suppressing the residual vibration (oscillatory motion) as compared to the PID controller.
Moreover, the proposed controller also records shorter settling time to reduce the positioning
error <50µm. The feedforward + nonlinear PID controller could suppress the residual vibration
of the PMA system due to the nonlinear “Compensator B” in the controller block diagram. The
compensator which holds the pressure and displacement characteristics of the PMA system
could make the PMA motion steadier and at the same time reduce the stick-slip effect. The
positioning error graph in Figure 4.5 (b) gives a better view and explains the effectiveness of the
“Compensator D” of the proposed controller to reduce the residual vibration with the recorded
settling time of 6.6871s in comparison to the PID controller which takes 8.1864s to maintain the
steady state error. Figure 4.5 (c) clearly explains the nonlinear effect in the PID controller as
compared to the proposed controller which able to suppress the residual vibration effect. This
positioning result indicates the contribution of the controller to totally eliminate the nonlinear
effect of the system and at the same time produce significant positioning performance in term of
steady state error <50µm.
The PMA system has been examined under different step heights to examine the
influence of the nonlinearity effect. The positioning experiment of 5mm shown in Figure 4.4 is
very significant in this study due to the PMA characteristics. As explained in the literature
review part of this thesis, the PMA used in this research is a high force type. It is important to
note that a significant positioning response could be achieved for small displacement with the
proposed controller. The positioning performance of the two control system has been validated
with 10 times repeatability and the average result is presented in Table 4.2. The quantitative
results in Table 4.2 present the rise time, overshoot and settling time of the two different control
systems.
0 2 4 6 8 10
0
20
40
60
80
100-100
-50
0
50
100
150-100
-50
0
50
1000
5
Co
ntr
ol
Sig
na
l (k
Pa
)
Time (s)
(d)
Ve
locity
(mm
/s)
(c)
Err
or
(m
)
(b)
Dis
pla
ce
me
nt
(mm
)
Reference PID FF+Nonlinear PID
(a)
Step Height: 5mm
Figure 4.4 : Experimental step response of the two control system for the step height of 5mm
(default mass)
- 8 -
0 2 4 6 8 10
0
50
100
150-100
0
100
200
-100
-50
0
50
1000
5
10
15
Con
trol
Sig
nal (k
Pa)
Time (s)
(d)
Velo
city
(mm
/s)
(c)
Err
or
(m
)
(b)
Dis
pla
cem
ent
(mm
)
Reference PID FF+Nonlinear PID
(a)
Step Height: 10mm
Figure 4.5 : Experimental step response of the two control system for the step height of 10mm
(default mass)
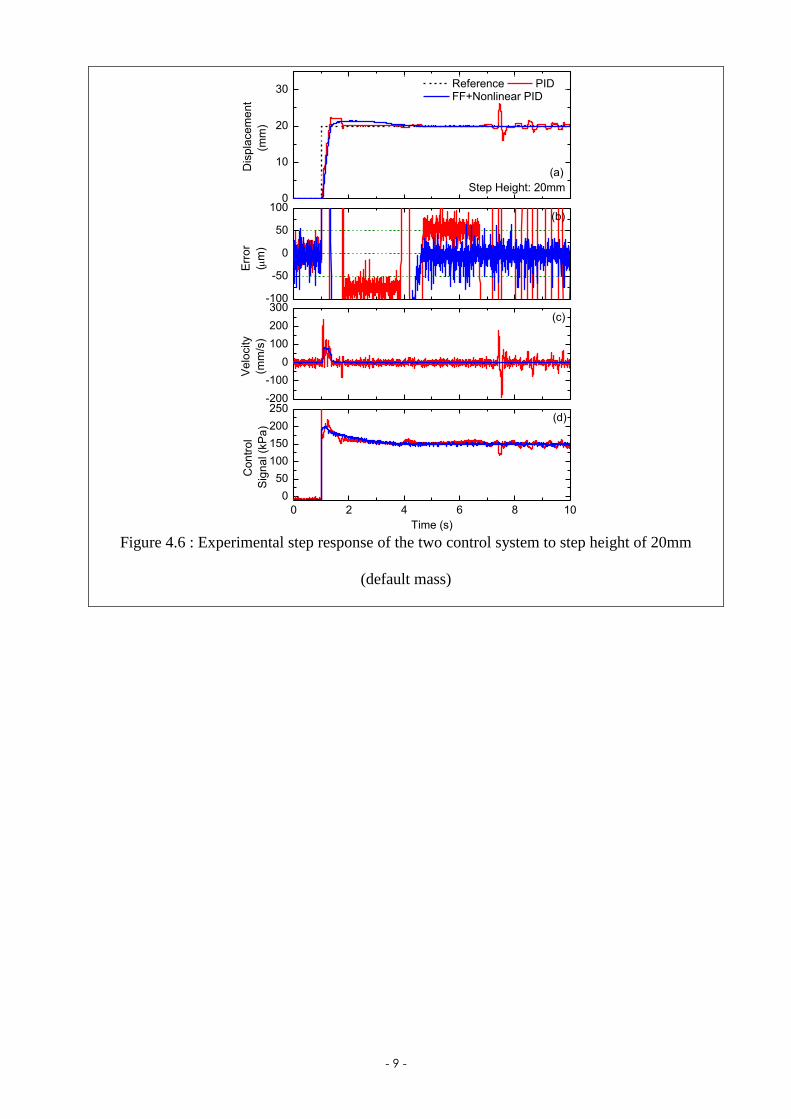
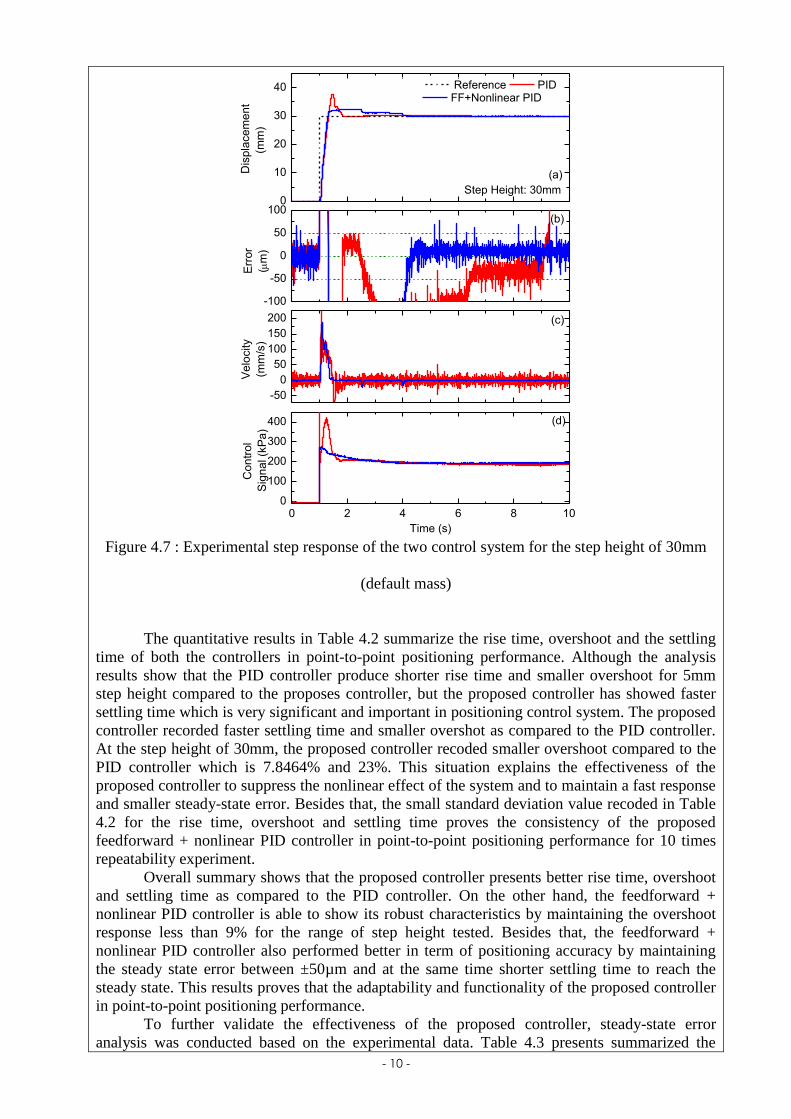
Figure 4.6 and Figure 4.7 shows the experimental responses of the two control systems
for the step height of 20 mm and 30mm with default mass. The step responses, error graph,
velocity characteristics and input pressure are illustrated. As observed obviously, the proposed
feedforward + nonlinear ID controller show significant response with smaller overshoot and
faster settling time as compare d to the PID controller. However, the PID controller produces
extremely high overshoot at the both step heights. When te step height is increased, it can be
seen clearly that the feedforward + nonlinear PID controller performs better in suppressing the
residual vibrations as compared with PID controller. The above mentioned response is clearly
shown in Figure 4.6 (c) and Figure 4.7 (c). The input pressure result demonstrated in Figure 4.6
(d) and Figure 4.7 (d) explains the effect of linearizer in the controller block to maintain the
input pressure to the system to by linearizing the coulomb friction effect during transient
response. Moreover, the feedforward + nonlinear PID controller also takes shorter positioning
time to reduce the error <50µm.
- 9 -
0 2 4 6 8 10
0
50
100
150
200
250-200
-100
0
100
200
300-100
-50
0
50
1000
10
20
30
Co
ntr
ol
Sig
na
l (k
Pa
)
Time (s)
(d)
Ve
locity
(mm
/s)
(c)
Err
or
(m
)
(b)
Dis
pla
ce
me
nt
(mm
)
Reference PID FF+Nonlinear PID
(a)
Step Height: 20mm
Figure 4.6 : Experimental step response of the two control system to step height of 20mm
(default mass)
- 10 -
0 2 4 6 8 100
100
200
300
400
-50
0
50
100
150
200
-100
-50
0
50
1000
10
20
30
40
Con
trol
Sig
nal (k
Pa)
Time (s)
(d)
Velo
city
(mm
/s)
(c)
Err
or
(m
)
(b)
Dis
pla
cem
ent
(mm
)
Reference PID FF+Nonlinear PID
(a)
Step Height: 30mm
Figure 4.7 : Experimental step response of the two control system for the step height of 30mm
(default mass)
The quantitative results in Table 4.2 summarize the rise time, overshoot and the settling
time of both the controllers in point-to-point positioning performance. Although the analysis
results show that the PID controller produce shorter rise time and smaller overshoot for 5mm
step height compared to the proposes controller, but the proposed controller has showed faster
settling time which is very significant and important in positioning control system. The proposed
controller recorded faster settling time and smaller overshot as compared to the PID controller.
At the step height of 30mm, the proposed controller recoded smaller overshoot compared to the
PID controller which is 7.8464% and 23%. This situation explains the effectiveness of the
proposed controller to suppress the nonlinear effect of the system and to maintain a fast response
and smaller steady-state error. Besides that, the small standard deviation value recoded in Table
4.2 for the rise time, overshoot and settling time proves the consistency of the proposed
feedforward + nonlinear PID controller in point-to-point positioning performance for 10 times
repeatability experiment.
Overall summary shows that the proposed controller presents better rise time, overshoot
and settling time as compared to the PID controller. On the other hand, the feedforward +
nonlinear PID controller is able to show its robust characteristics by maintaining the overshoot
response less than 9% for the range of step height tested. Besides that, the feedforward +
nonlinear PID controller also performed better in term of positioning accuracy by maintaining
the steady state error between ±50µm and at the same time shorter settling time to reach the
steady state. This results proves that the adaptability and functionality of the proposed controller
in point-to-point positioning performance.
To further validate the effectiveness of the proposed controller, steady-state error
analysis was conducted based on the experimental data. Table 4.3 presents summarized the
- 11 -
average and standard deviation of maximum steady-state errors in 10 positioning experiments.
As observed obviously, the result presented in Table 4.3 shows that the positioning accuracy of
the proposed controller is maintained between ±50µm although the step height has been
increased. This result proves the adaptability of the controller towards the height changes and the
working range.
iv. Analisis Data
Data Analisis (Tick where appropriate) Completion of Data Analysis
1 2 3 4 5 6 7 8 9 10
Start Complete
Remarks :
(Analysis of Chapter 4)
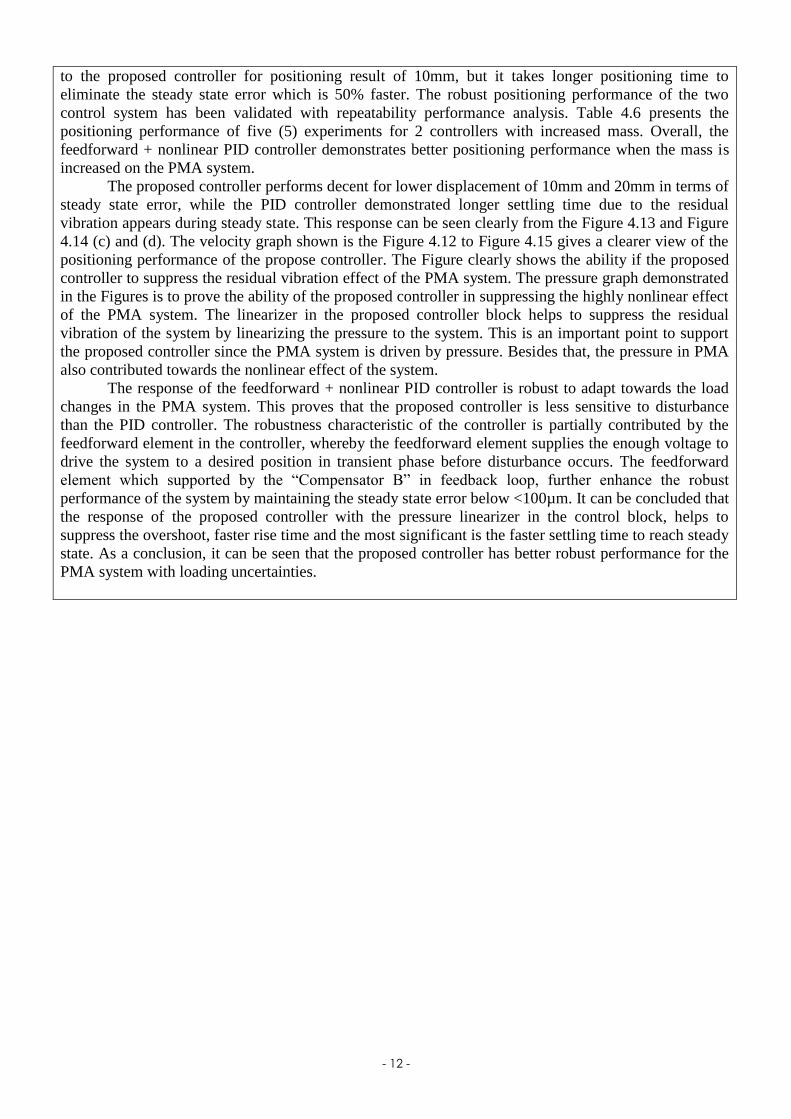
Robustness Performance Evaluation
In practical applications, the loading weight will be changed. In order to validate the robustness
of the proposed feedforward + nonlinear PID controller, it is further validated with an increased mass
experimentally which is extra of 3.115kg (30.558N) from the default of 4.710kg (46.205N). The
positioning responses with the increased mass are shown in Figure 4.12 to Figure 4.15. The control
parameters and the system setting are as per the previous experiment and no modification has been
done. The feedforward + nonlinear PID controller successfully demonstrates satisfactory robust
performance in response to the increase of mass, by producing smaller overshoot as compared to the
default mass tested. This response is obviously seen in Figure 4.12(a) whereby the recorded overshoot
for the proposed controller is about 4.820% as compared to the PID controller which records 9.527%.
The recoded value is smaller if compared to the positioning performance of the proposed controller for
default mass which is about 8.4502%. Besides that, the proposed controller also demonstrated faster rise
time and settling time as compared to the PID controller for the step height below 30mm. This is
obviously seen from the Table 4.5, whereby the proposed controller recorded smallest standard
deviation for the recoded rise time, settling time and overshoot for the step height below 30mm. The
proposed feedforward + nonlinear PID controller able to suppress the nonlinear effect and overshoot
effect to maintain the steady state error between ±50µm at average of 6s for all the step height.
Although the PID controller recoded better performance in term of rise time, overshoot and settling time
but the calculated standard deviation subsets the situation by smaller value for the proposed controller.
The standard deviation value proves the accuracy and consistency of the proposed controller in
repeatability result. The experimental results indicate the strong robust performance of the feedforward
+ nonlinear PID controller. Even though the PID controller demonstrates faster rise time in comparison
- 12 -
to the proposed controller for positioning result of 10mm, but it takes longer positioning time to
eliminate the steady state error which is 50% faster. The robust positioning performance of the two
control system has been validated with repeatability performance analysis. Table 4.6 presents the
positioning performance of five (5) experiments for 2 controllers with increased mass. Overall, the
feedforward + nonlinear PID controller demonstrates better positioning performance when the mass is
increased on the PMA system.
The proposed controller performs decent for lower displacement of 10mm and 20mm in terms of
steady state error, while the PID controller demonstrated longer settling time due to the residual
vibration appears during steady state. This response can be seen clearly from the Figure 4.13 and Figure
4.14 (c) and (d). The velocity graph shown is the Figure 4.12 to Figure 4.15 gives a clearer view of the
positioning performance of the propose controller. The Figure clearly shows the ability if the proposed
controller to suppress the residual vibration effect of the PMA system. The pressure graph demonstrated
in the Figures is to prove the ability of the proposed controller in suppressing the highly nonlinear effect
of the PMA system. The linearizer in the proposed controller block helps to suppress the residual
vibration of the system by linearizing the pressure to the system. This is an important point to support
the proposed controller since the PMA system is driven by pressure. Besides that, the pressure in PMA
also contributed towards the nonlinear effect of the system.
The response of the feedforward + nonlinear PID controller is robust to adapt towards the load
changes in the PMA system. This proves that the proposed controller is less sensitive to disturbance
than the PID controller. The robustness characteristic of the controller is partially contributed by the
feedforward element in the controller, whereby the feedforward element supplies the enough voltage to
drive the system to a desired position in transient phase before disturbance occurs. The feedforward
element which supported by the “Compensator B” in feedback loop, further enhance the robust
performance of the system by maintaining the steady state error below <100µm. It can be concluded that
the response of the proposed controller with the pressure linearizer in the control block, helps to
suppress the overshoot, faster rise time and the most significant is the faster settling time to reach steady
state. As a conclusion, it can be seen that the proposed controller has better robust performance for the
PMA system with loading uncertainties.
- 13 -
0 2 4 6 8 10
0
20
40
60
80
100-50
0
50
100
-100
-50
0
50
1000
5
Co
ntr
ol
Sig
na
l (k
Pa
)
Time (s)
(d)
Ve
locity
(mm
/s)
(c)
Err
or
(m
)
(b)
Dis
pla
ce
me
nt
(mm
)
Reference PID FF+Nonlinear PID
(a)
Step Height: 5mm
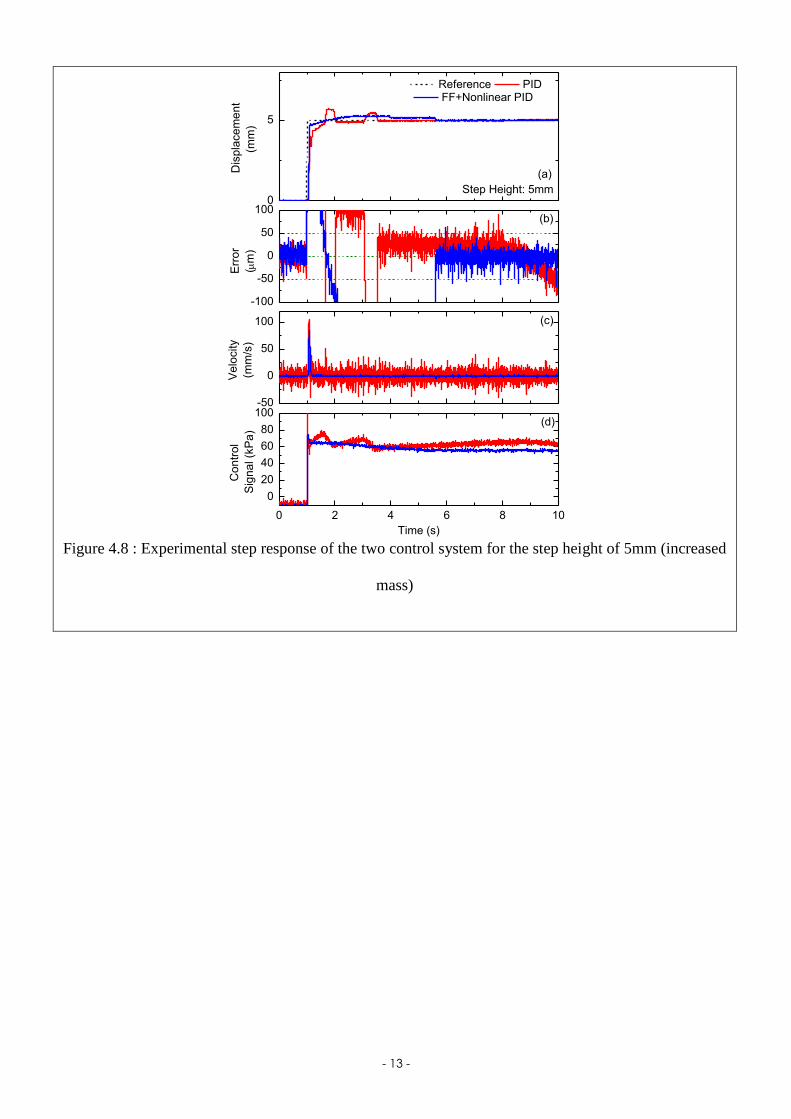
Figure 4.8 : Experimental step response of the two control system for the step height of 5mm (increased
mass)
- 14 -
0 2 4 6 8 10
0
50
100
150-50
0
50
100
150
-100
-50
0
50
1000
5
10
Co
ntr
ol
Sig
na
l (k
Pa
)
Time (s)
(d)
Ve
locity
(mm
/s)
(c)
Err
or
(m
)
(b)
Dis
pla
ce
me
nt
(mm
)
Reference PID FF+Nonlinear PID
(a)
Step Height: 10mm
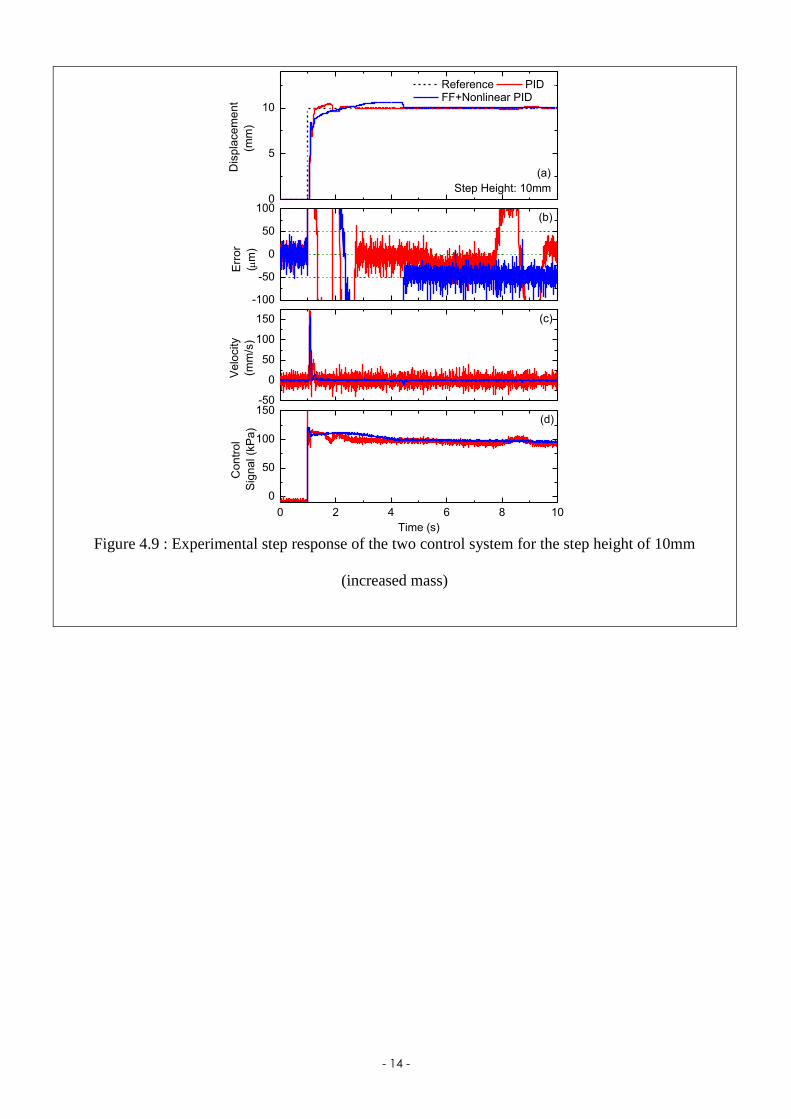
Figure 4.9 : Experimental step response of the two control system for the step height of 10mm
(increased mass)
- 15 -
0 2 4 6 8 10
0
50
100
150
200
250-100
0
100
200
-100
0
100
0
5
10
15
20
25
Co
ntr
ol
Sig
na
l (k
Pa
)
Time (s)
(d)
Ve
locity
(mm
/s)
(c)
Err
or
(m
)
(b)
Dis
pla
ce
me
nt
(mm
)
Reference PID FF+Nonlinear PID
(a)
Step Height: 20mm
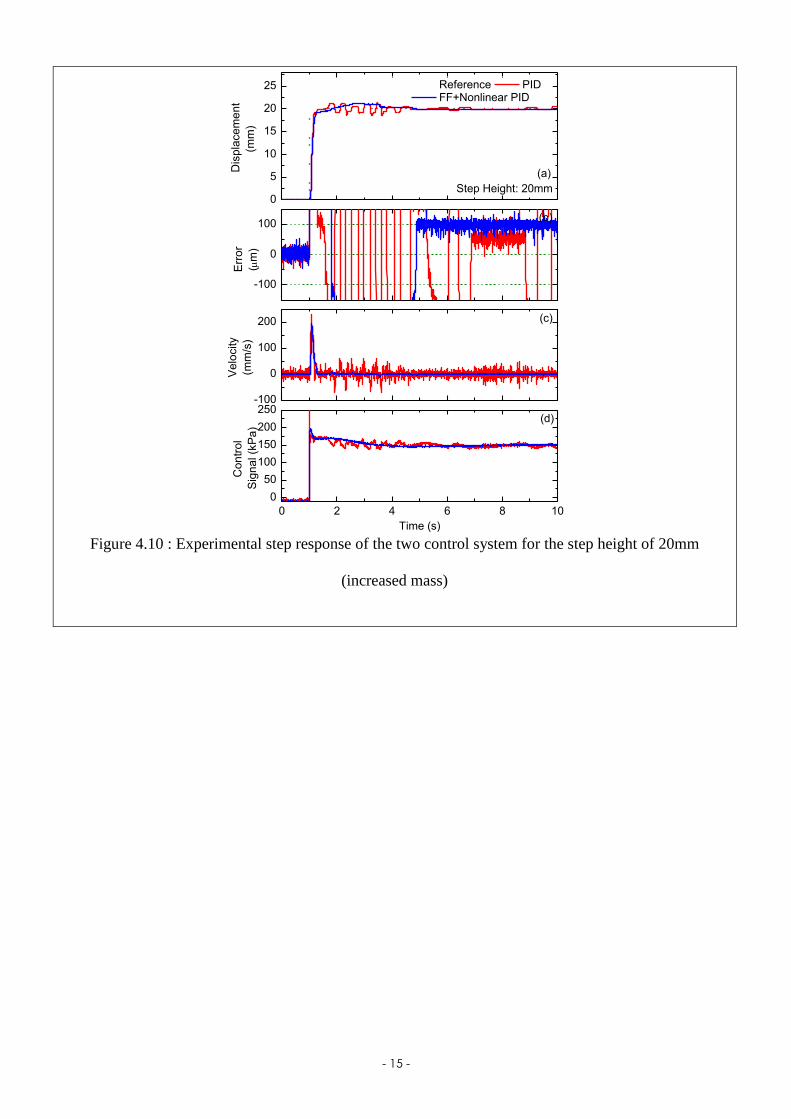
Figure 4.10 : Experimental step response of the two control system for the step height of 20mm
(increased mass)
- 16 -
0 2 4 6 8 10
0
100
200
300-100
0
100
200
300
-100
-50
0
50
1000
10
20
30
40
Con
trol
Sig
nal (k
Pa)
Time (s)
(d)
Velo
city
(mm
/s)
(c)
Err
or
(m
)
(b)
Dis
pla
cem
ent
(mm
)
Reference PID FF+Nonlinear PID
(a)
Step Height: 30mm
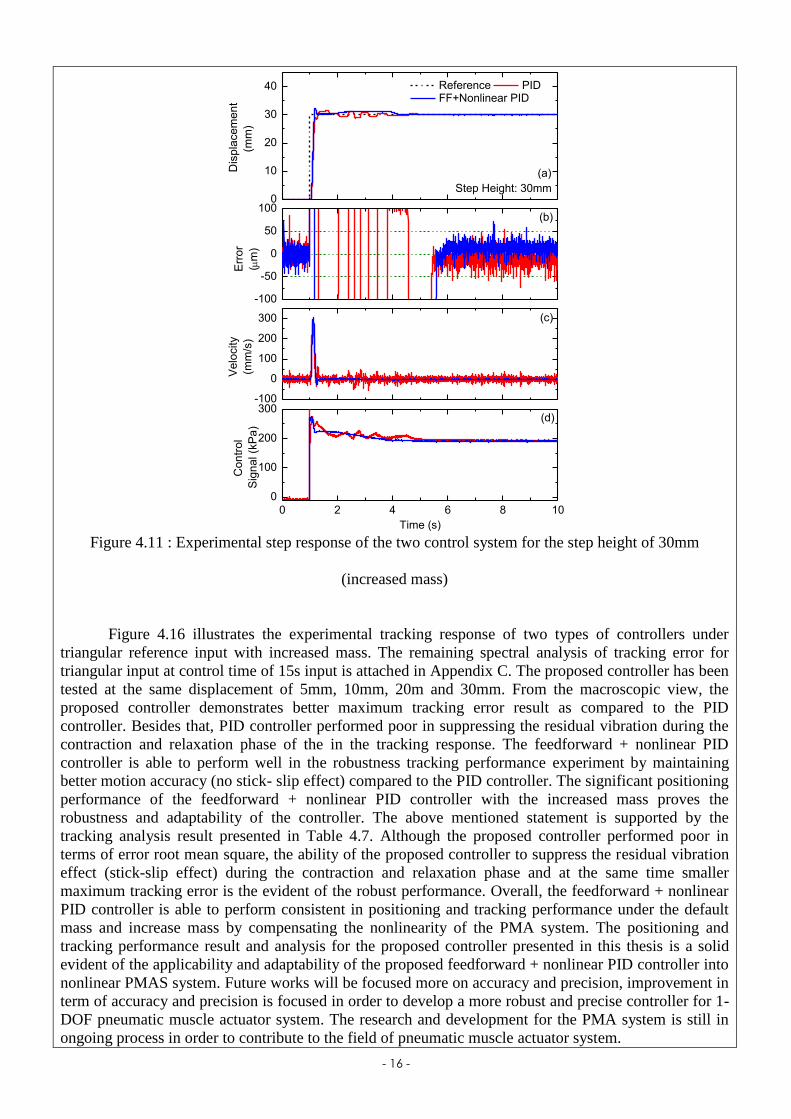
Figure 4.11 : Experimental step response of the two control system for the step height of 30mm
(increased mass)
Figure 4.16 illustrates the experimental tracking response of two types of controllers under
triangular reference input with increased mass. The remaining spectral analysis of tracking error for
triangular input at control time of 15s input is attached in Appendix C. The proposed controller has been
tested at the same displacement of 5mm, 10mm, 20m and 30mm. From the macroscopic view, the
proposed controller demonstrates better maximum tracking error result as compared to the PID
controller. Besides that, PID controller performed poor in suppressing the residual vibration during the
contraction and relaxation phase of the in the tracking response. The feedforward + nonlinear PID
controller is able to perform well in the robustness tracking performance experiment by maintaining
better motion accuracy (no stick- slip effect) compared to the PID controller. The significant positioning
performance of the feedforward + nonlinear PID controller with the increased mass proves the
robustness and adaptability of the controller. The above mentioned statement is supported by the
tracking analysis result presented in Table 4.7. Although the proposed controller performed poor in
terms of error root mean square, the ability of the proposed controller to suppress the residual vibration
effect (stick-slip effect) during the contraction and relaxation phase and at the same time smaller
maximum tracking error is the evident of the robust performance. Overall, the feedforward + nonlinear
PID controller is able to perform consistent in positioning and tracking performance under the default
mass and increase mass by compensating the nonlinearity of the PMA system. The positioning and
tracking performance result and analysis for the proposed controller presented in this thesis is a solid
evident of the applicability and adaptability of the proposed feedforward + nonlinear PID controller into
nonlinear PMAS system. Future works will be focused more on accuracy and precision, improvement in
term of accuracy and precision is focused in order to develop a more robust and precise controller for 1-
DOF pneumatic muscle actuator system. The research and development for the PMA system is still in
ongoing process in order to contribute to the field of pneumatic muscle actuator system.
- 17 -
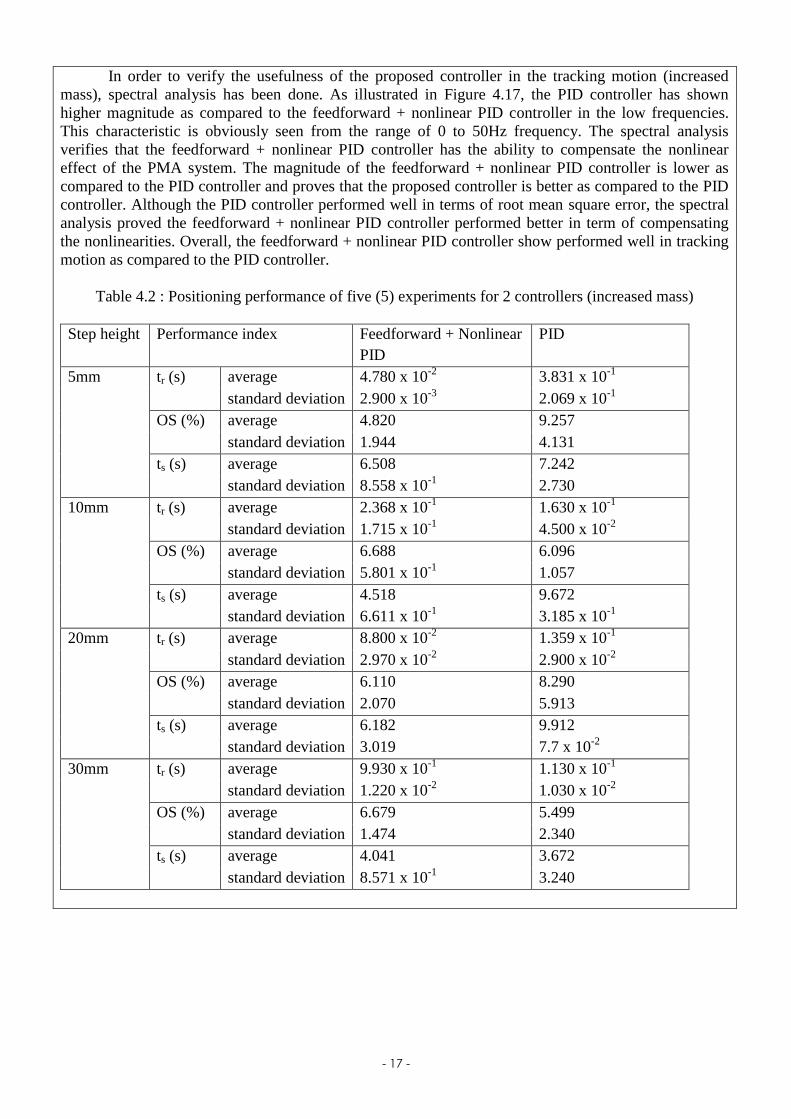
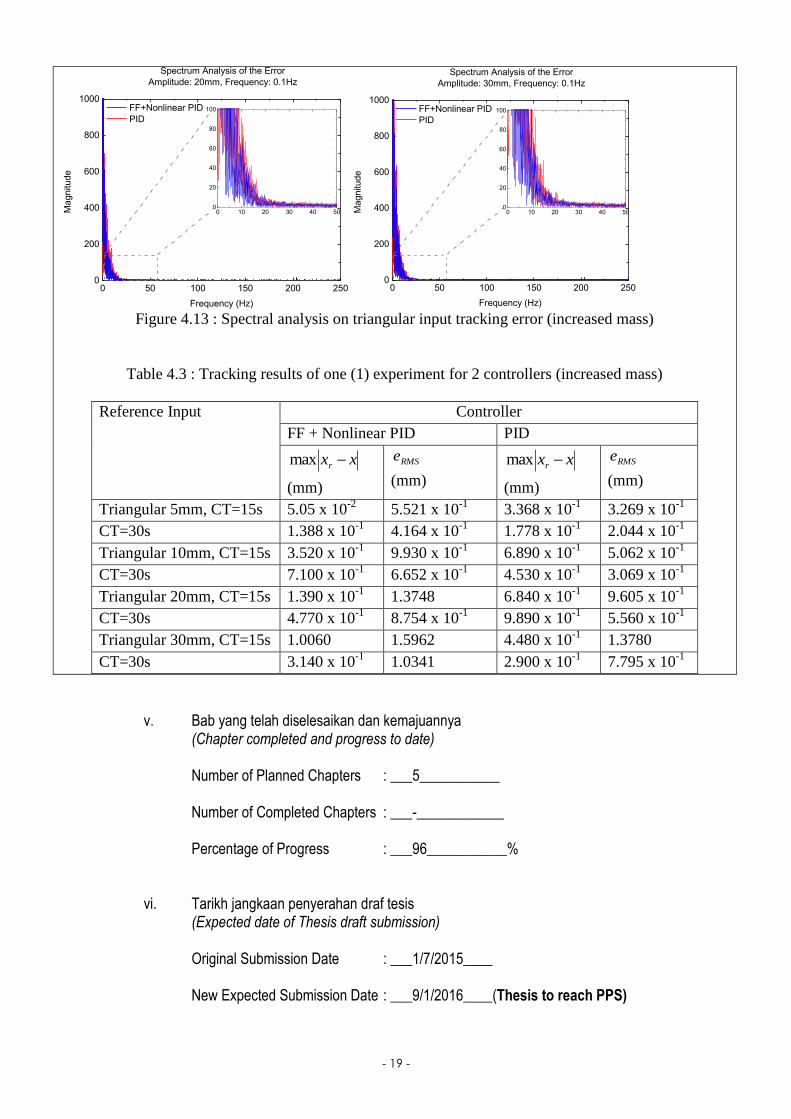
In order to verify the usefulness of the proposed controller in the tracking motion (increased
mass), spectral analysis has been done. As illustrated in Figure 4.17, the PID controller has shown
higher magnitude as compared to the feedforward + nonlinear PID controller in the low frequencies.
This characteristic is obviously seen from the range of 0 to 50Hz frequency. The spectral analysis
verifies that the feedforward + nonlinear PID controller has the ability to compensate the nonlinear
effect of the PMA system. The magnitude of the feedforward + nonlinear PID controller is lower as
compared to the PID controller and proves that the proposed controller is better as compared to the PID
controller. Although the PID controller performed well in terms of root mean square error, the spectral
analysis proved the feedforward + nonlinear PID controller performed better in term of compensating
the nonlinearities. Overall, the feedforward + nonlinear PID controller show performed well in tracking
motion as compared to the PID controller.
Table 4.2 : Positioning performance of five (5) experiments for 2 controllers (increased mass)
Step height Performance index Feedforward + Nonlinear
PID
PID
5mm tr (s) average 4.780 x 10⁻²
3.831 x 10⁻¹
standard deviation 2.900 x 10⁻³
2.069 x 10⁻¹
OS (%) average 4.820 9.257
standard deviation 1.944 4.131
ts (s) average 6.508 7.242
standard deviation 8.558 x 10⁻¹
2.730
10mm tr (s) average 2.368 x 10⁻¹
1.630 x 10⁻¹
standard deviation 1.715 x 10⁻¹
4.500 x 10⁻²
OS (%) average 6.688 6.096
standard deviation 5.801 x 10⁻¹
1.057
ts (s) average 4.518 9.672
standard deviation 6.611 x 10⁻¹
3.185 x 10⁻¹
20mm tr (s) average 8.800 x 10⁻²
1.359 x 10⁻¹
standard deviation 2.970 x 10⁻²
2.900 x 10⁻²
OS (%) average 6.110 8.290
standard deviation 2.070 5.913
ts (s) average 6.182 9.912
standard deviation 3.019 7.7 x 10⁻²
30mm tr (s) average 9.930 x 10⁻¹
1.130 x 10⁻¹
standard deviation 1.220 x 10⁻²
1.030 x 10⁻²
OS (%) average 6.679 5.499
standard deviation 1.474 2.340
ts (s) average 4.041 3.672
standard deviation 8.571 x 10⁻¹
3.240
- 18 -
0 5 10 15 20 25 30
-1
0
1
0
1
2
3
4
5
6
Err
or(
mm
)
Time(s)
Dis
pla
ce
me
nt(
mm
) Reference FF+Nonlinear PID PID
(a)
0 5 10 15 20 25 30
-1
0
1
0
2
4
6
8
10
12
Err
or(
mm
)
Time(s)(b)
Reference FF+Nonlinear PID PID
Dis
pla
ce
me
nt(
mm
)
0 5 10 15 20 25 30-2
-1
0
1
20
5
10
15
20
Err
or(
mm
)
Time(s)
Dis
pla
cem
ent(
mm
) Reference FF+Nonlinear PID PID
0 5 10 15 20 25 30
-2
0
2
05
101520253035
Err
or(
mm
)
Time(s)
Reference FF+Nonlinear PID PID
Dis
pla
ce
me
nt(
mm
)
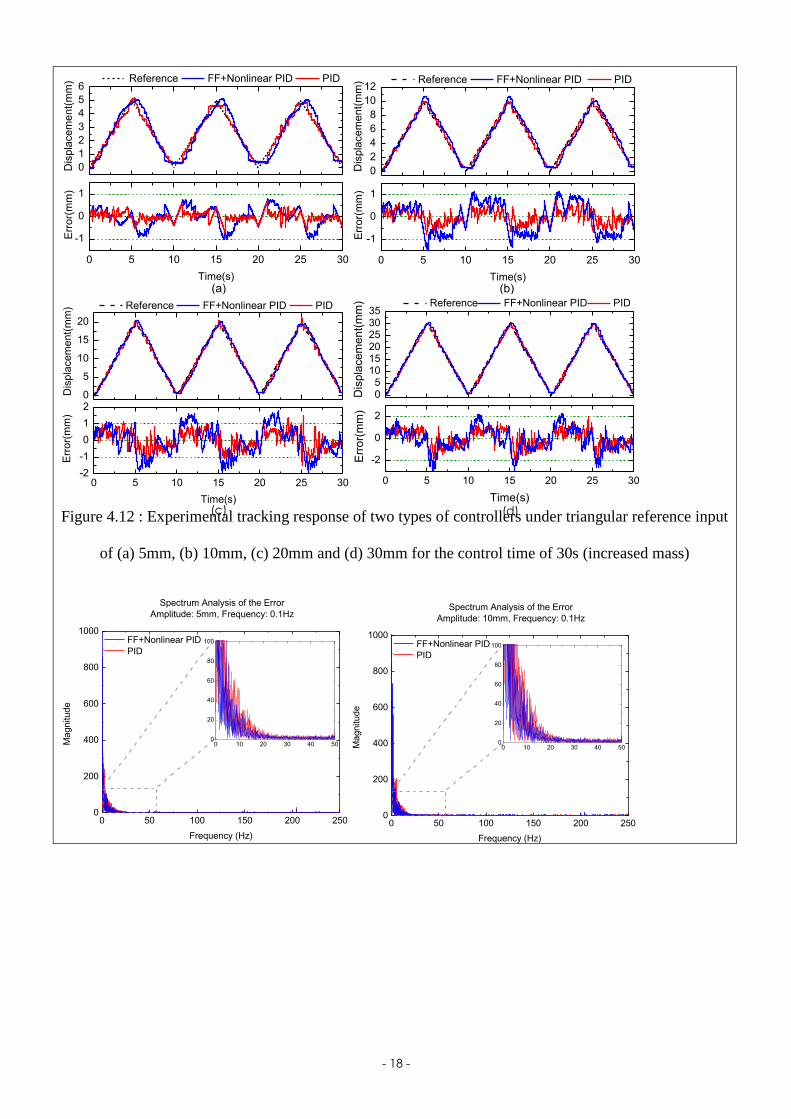
Figure 4.12 : Experimental tracking response of two types of controllers under triangular reference input
of (a) 5mm, (b) 10mm, (c) 20mm and (d) 30mm for the control time of 30s (increased mass)
0 50 100 150 200 2500
200
400
600
800
1000
0 10 20 30 40 500
20
40
60
80
100
Magnitude
Frequency (Hz)
FF+Nonlinear PID
PID
Spectrum Analysis of the Error
Amplitude: 5mm, Frequency: 0.1Hz
0 50 100 150 200 2500
200
400
600
800
1000
0 10 20 30 40 500
20
40
60
80
100
Magnitude
Frequency (Hz)
FF+Nonlinear PID
PID
Spectrum Analysis of the Error
Amplitude: 10mm, Frequency: 0.1Hz
(c) (d)
- 19 -
0 50 100 150 200 2500
200
400
600
800
1000
0 10 20 30 40 500
20
40
60
80
100
Magnitude
Frequency (Hz)
FF+Nonlinear PID
PID
Spectrum Analysis of the Error
Amplitude: 20mm, Frequency: 0.1Hz
0 50 100 150 200 2500
200
400
600
800
1000
0 10 20 30 40 500
20
40
60
80
100
Magnitude
Frequency (Hz)
FF+Nonlinear PID
PID
Spectrum Analysis of the Error
Amplitude: 30mm, Frequency: 0.1Hz
Figure 4.13 : Spectral analysis on triangular input tracking error (increased mass)
Table 4.3 : Tracking results of one (1) experiment for 2 controllers (increased mass)
Reference Input Controller
FF + Nonlinear PID PID
xxr max
(mm)
RMSe
(mm)
xxr max
(mm)
RMSe
(mm)
Triangular 5mm, CT=15s 5.05 x 10⁻²
5.521 x 10⁻¹
3.368 x 10⁻¹
3.269 x 10⁻¹
CT=30s 1.388 x 10⁻¹
4.164 x 10⁻¹
1.778 x 10⁻¹
2.044 x 10⁻¹
Triangular 10mm, CT=15s 3.520 x 10⁻¹
9.930 x 10⁻¹
6.890 x 10⁻¹
5.062 x 10⁻¹
CT=30s 7.100 x 10⁻¹
6.652 x 10⁻¹
4.530 x 10⁻¹
3.069 x 10⁻¹
Triangular 20mm, CT=15s 1.390 x 10⁻¹
1.3748 6.840 x 10⁻¹
9.605 x 10⁻¹
CT=30s 4.770 x 10⁻¹
8.754 x 10⁻¹
9.890 x 10⁻¹
5.560 x 10⁻¹
Triangular 30mm, CT=15s 1.0060 1.5962 4.480 x 10⁻¹
1.3780
CT=30s 3.140 x 10⁻¹
1.0341 2.900 x 10⁻¹
7.795 x 10⁻¹
v. Bab yang telah diselesaikan dan kemajuannya (Chapter completed and progress to date)
Number of Planned Chapters : ___5___________ Number of Completed Chapters : ___-____________ Percentage of Progress : ___96___________%
vi. Tarikh jangkaan penyerahan draf tesis (Expected date of Thesis draft submission)
Original Submission Date : ___1/7/2015____ New Expected Submission Date : ___9/1/2016____(Thesis to reach PPS)

- 20 -
vii. Kekerapan berjumpa Penyelia (Frequency of meeting Supervisor(s))
viii. Faktor yang dikenalpasti mengganggu penyelidikan (jika ada) (Factors affect the progress of research (if any))
-
1) Average meeting: 3 times a week. 2) Progress Presentation to supervisor 2 times a month (presentation style). To summarize the
overall findings for the month, data analysis and discussion. Besides that, session for next step and research plannings.

- 21 -
C. AKTIVITI PELAJAR SEPANJANG PENGAJIAN (STUDENT’S ACTIVITIES THROUGHOUT STUDIES)
i. Senaraikan Pembentangan / Penerbitan Kertas Kerja, menghadiri seminar dll.
(List all Paper published / presented, seminar attended, etc)
(Publications: 1 Journal and 3 conference paper) 1. Vasanthan Sakthivelu, Chong Shin Horng, Mariam Md Ghazaly., 2016.
Phenomenological Modeling and Classical Control of Pneumatic Muscle Actuator
System. Journal of Control, Automation and electrical Systems (IJCA),Vol. 9(1).
[Accepted] (SCOPUS INDEX Q2)
2. S.Vasanthan, and Shin-Horng Chong, 2013. Motion Control of Pneumatic Muscle
Actuator: Experimental Setup and Modeling. Proceedings of the IEEE student
Conference on Research and Development (SCOReD), pp. 60-64.
3. S.Vasanthan, Shin-Horng Chong and Mariam Md Ghazaly, 2014. Modeling the
Pneumatic Muscle Actuator using Phenomenological model. Proceedings of the 2nd
Power and Energy Conversion Symposium (PECS), pp. 339-344.
4. S.Vasanthan, and Shin-Horng Chong, 2015. Motion Control of a 1-DOF Pneumatic
Muscle Actuator Positioning System. 10th
Asian Control Conference (ASCC). [Accepted]
ii. Kegiatan Bukan Akademik
(Non-academic activities)
iii. Penganugerahan/Penghargaan
(Awards/ Recognitions)
1. Certificate of Appreciation for the poster presentation at The 10th Asian Control Conference 2015 (ASCC 2015)
Saya mengaku segala keterangan yang diberi di atas adalah benar. (I declare all the statements above are true)
.........28 December 2015............................ ...............S.Vasanthan................... Tarikh Tandatangan Pelajar (Date) (Signature of Student)