Embed Size (px)
Citation preview
8/3/2019 Vol 49 Vetter Web
http://slidepdf.com/reader/full/vol-49-vetter-web 1/15
VETTER ET AL.: SHORTFIN MAKO SHARK AND JUMBO SQUID INTERACTIONSCalCOFI Rep., Vol. 49, 2008
PREDATORY INTERACTIONS AND NICHE OVERLAP BETWEEN MAKO SHARK,ISURUS OXYRINCHUS , AND JUMBO SQUID, DOSIDICUS GIGAS , IN THE CALIFORNIA CURRENT
RUSS VETTER, SUZANNE KOHIN, ANTONELLA PRETI, SAM MCCLATCHIE AND HEIDI DEWAR
NOAA Fisheries/Southwest Fisheries Science Center 8604 La Jolla Shores Drive
La Jolla, California 92037-1508
ABSTRACTRecent scientific and anecdotal observations have doc-
umented a range expansion of jumbo squid, Dosidicus gigas, into the Southern California Bight (SCB) andnorthward in the California Current Large MarineEcosystem. The increase in squid abundance at higher latitudes has generated hypotheses concerning the ecosys-
tem changes that may have permitted this expansion.Top-down explanations suggest that overharvest of higher trophic level species such as tunas and billfishes createsa trophic cascade that increases survivorship of jumbosquid. Bottom-up explanations suggest that changes inocean climate, including temperature and hypoxia, mayfavor an expanded range for jumbo squid. Here we pre-sent information on: (1) predatory interactions betweenthe mako shark and jumbo squid in the SCB, (2) verti-cal niche of mako sharks and potential for a hypoxicrefuge for jumbo squid, and (3) changes in the oxygenminimum zone (OMZ) and trends in epi- and meso-pelagic prey. Mako sharks examined during the 2006 and
2007 NOAA Fisheries Southwest Fisheries ScienceCenter Juvenile Shark Longline Survey had a high in-cidence of scars inflicted by jumbo squid. Diet studiesbased on the California Drift Gillnet Fishery, 2002–07indicate that jumbo squid accounted for a substantialportion of the mako diet. Bioenergetic calculations sug-gest that the average 18 kg mako taken in the fisherywould need 56–113 kg of squid to meet its annual diet-ary requirements. The high-resolution diel activity recordsof two representative animals indicate makos remainednear the surface at night and were able to exploit thewater column from the surface to a maximum depth of 300 m during the day. The maximum depth of dives
corresponded to oxygen concentrations as low as 1.25ml/L. Previous studies indicate that jumbo squid inhabita depth range from the surface to the upper bounds of the OMZ where oxygen concentration is 0.5 ml/L or less. Jumbo squid in the SCB may have a deepwater refuge from mako sharks below 1.25 ml O
2/L, but are
clearly available to mako during diel vertical migrations.Examination of the CalCOFI database for changes inoxygen content and larval fish counts over the previous56 years indicates a shoaling of the OMZ and periodic
changes in abundance of epi- and mesopelagic preyspecies, but did not reveal a simple relationship betweenoxygen, prey availability, and range expansion. Better es-timates of squid and mako population size and mako re-moval rates are needed to fully understand the impactof mako sharks on jumbo squid abundance.
INTRODUCTIONThe jumbo squid, Dosidicus gigas, is a dominant mid-trophic link in the pelagic food webs of the EasternTropical Pacific (ETP; Olson and Young 2007). Recentstudies originating in the Gulf of California (GOC),where jumbo squid are permanent residents, have de-scribed their age and growth, reproductive biology, andtrophic niche (Markaida and Sosa-Nishizaki 2001, 2003;Markaida et al. 2004). Electronic tagging studies haveprovided new insights into the physical niche includinghorizontal and vertical movements,diel activity patterns,preferred temperatures, and a previously unappreciatedtolerance of low-oxygen, mesopelagic habitats (Gilly et
al. 2006). The mesopelagic oxygen minimum zone(OMZ) is a persistent feature of the ETP (Stramma etal. 2008) and extends northward throughout theCalifornia Current Large Marine Ecosystem (CCLME)usually at depths of 600 to 1000 m (Vetter and Lynn1997; Chan et al. 2008). Two recent studies (Field et al.2007; Zeidberg and Robison 2007) have reported a rangeextension of jumbo squid into the colder waters of thecentral California Current where they have been ob-served to a depth of 2000 m. Historically, the occurrenceof the jumbo squid off California was restricted to pe-riodic outbreaks, often associated with El Niño-SouthernOscillation (ENSO) events (Rodhouse, this volume).
Interest by scientists,management agencies, and the gen-eral public has driven speculation on how the CCLMEmay be changing to allow this persistent northern rangeexpansion.Proposed causes can be grouped into two cat-egories: (1) top-down effects, such as removal of squidpredators and competitors by fishing, which might in-crease jumbo squid survival and (2) bottom-up effects,such as changes in oceanography and prey fish abun-dance, that might increase favorable jumbo squid habi-tat. These speculations are not without controversy
142
8/3/2019 Vol 49 Vetter Web
http://slidepdf.com/reader/full/vol-49-vetter-web 2/15
VETTER ET AL.: SHORTFIN MAKO SHARK AND JUMBO SQUID INTERACTIONSCalCOFI Rep., Vol. 49, 2008
(Watters et al. 2008; Zeidberg and Robison 2008) andare based on limited data. The Southern California Bight(SCB) has not been a focus of jumbo squid research buthas been a focus of many long-term observing programs(e.g., California Cooperative Fisheries Investigations or CalCOFI). Records of potential jumbo squid predators(both fish and marine mammals), prey species, and base-line measurements of physical variables, such as oxygensaturation, are reasonably well known and may provideinsights into the importance of top-down and bottom-up effects on jumbo squid abundance and persistence.
One apex predator that could affect jumbo squid inthe SCB is the shortfin mako shark, Isurus oxyrinchus(Rafinesque 1810). The shortfin mako shark, herein re-ferred to as mako shark, is a lamnid shark that inhabitstemperate and subtropical seas worldwide (Compagnoet al. 2005). Off the U.S. West Coast, the mako is a rel-atively abundant apex predator that utilizes the rich re-
sources of the CCLME. In the U.S. West Coast ExclusiveEconomic Zone (EEZ) it is subject to both commercialand recreational fisheries (Cailliet and Bedford 1983;Hanan et al. 1993; Holts et al. 1998) and is managedunder the Pacific Fishery Management Council’s HighlyMigratory Species Fisheries Management Plan as wellas under state regulations (PFMC 2003). The SCB, be-tween Point Conception and Cape Colonet, BajaCalifornia, Mexico, is said to be an important puppingand nursery area (O’Brien and Sunada 1994). As such,the majority of the U.S. West Coast commercial catchconsists of neonates and juveniles of less than 145 cmfork length (FL) and estimated ages 0 to 3 (Hanan et al.
1993; O’Brien and Sunada 1994; PFMC 2003).Reproductively mature individuals are uncommon butseasonally targeted by the recreational fishery.
As is typical of members of the family Lamnidae, themako shark is endothermic and has important physio-logical and biochemical adaptations that increase oxy-gen delivery, maintain high aerobic muscle performanceand allow heat retention (Bernal et al. 2001). These adap-tations are reflected in the mako’s high metabolic rates(Graham et al. 1990; Sepulveda et al. 2007) resulting ina high caloric demand and daily ration (Stillwell andKohler 1982). High aerobic activity may also limit for-aging under low oxygen conditions. Although compre-
hensive diet studies of makos off the U.S. West Coasthave not yet been conducted, the available data indicatethat sub-adults here and elsewhere consume a diet pri-marily composed of fish and cephalopods with larger sharks consuming billfishes and marine mammals on oc-casion (Mearns et al. 1981; Stillwell and Kohler 1982;PFMC 2003).
To provide biological information for the manage-ment of mako sharks, the NOAA Fisheries SouthwestFisheries Science Center (SWFSC) is actively engaged
in the study of their migratory patterns, foragingactivities, life-history characteristics, and population de-mographics. Primary sources of data include: (1) a long-standing research cruise, the Juvenile Shark LonglineSurvey (JSLS) conducted by the SWFSC, (2) fishery ob-servers monitoring the California Drift Gillnet Fishery(CDGNF), and (3) the SWFSC CalCOFI survey thatmonitors ocean productivity and forage fishes. Throughthe JSLS, information on population biology and abun-dance is obtained and the survey provides a platform for biological sampling and traditional and electronic tag-ging studies. The CDGNF targets swordfish (Xiphias gla-dius), but mako sharks are an important and valuableincidental catch. Fishery observers aboard 20% of thetrips monitor all catch and conduct biological samplingof stomachs, DNA, and gonads in support of studies onage, growth, reproduction, and diet. Both the survey andfishery focus on the SCB from Point Conception to the
U.S.-Mexico border. The CalCOFI sampling program,in addition to shipboard measurements taken in con- junction with the JSLS and the CDGNF observer pro-gram, provides a time series of oceanographic data tohelp characterize the mako shark’s habitat in the SCB.
In this paper we present recent observations on themako shark-jumbo squid association and climate vari-ables as they relate to the apparent increase and persis-tence of jumbo squid in the SCB. We discuss horizontaland vertical movements of mako sharks in the SCB asrevealed by electronic tagging, the relationships betweenmaximum dive depths and the thermal and oxygen pro-file of the mako shark and jumbo squid habitat, the ex-
tent of mako shark predation on jumbo squid, and thepotential bioenergetic consequences of mako shark pre-dation at the population and ecosystem levels. We alsodiscuss changes in the oxygen structure of the SCB andchanges in abundance of epi- and mesopelagic fishes asrevealed by the CalCOFI oceanographic and ichthyo-plankton time series. Our intent is to summarize recentobservations within the SCB portion of the CCLME asthey pertain to predatory interactions and niche overlapof mako shark and jumbo squid.
MATERIALS AND METHODS
JSLS Procedures and Visual Observationsof Squid Scars
The JSLS has been conducted most summers since1994 in the SCB aboard the NOAA RV David Starr
Jordan. Sharks are caught during daylight hours usingshallow-set longline gear baited with Pacific mackerel(Scomber japonicus). Two four-hour sets are conducteddaily, each with two miles of stainless steel gear and 200hooks set in the top 30 m of the water column. If a sharkis caught, it is led to the stern of the vessel and restrained
143
8/3/2019 Vol 49 Vetter Web
http://slidepdf.com/reader/full/vol-49-vetter-web 3/15
VETTER ET AL.: SHORTFIN MAKO SHARK AND JUMBO SQUID INTERACTIONSCalCOFI Rep., Vol. 49, 2008
in a specially designed cradle at the waterline. Depending
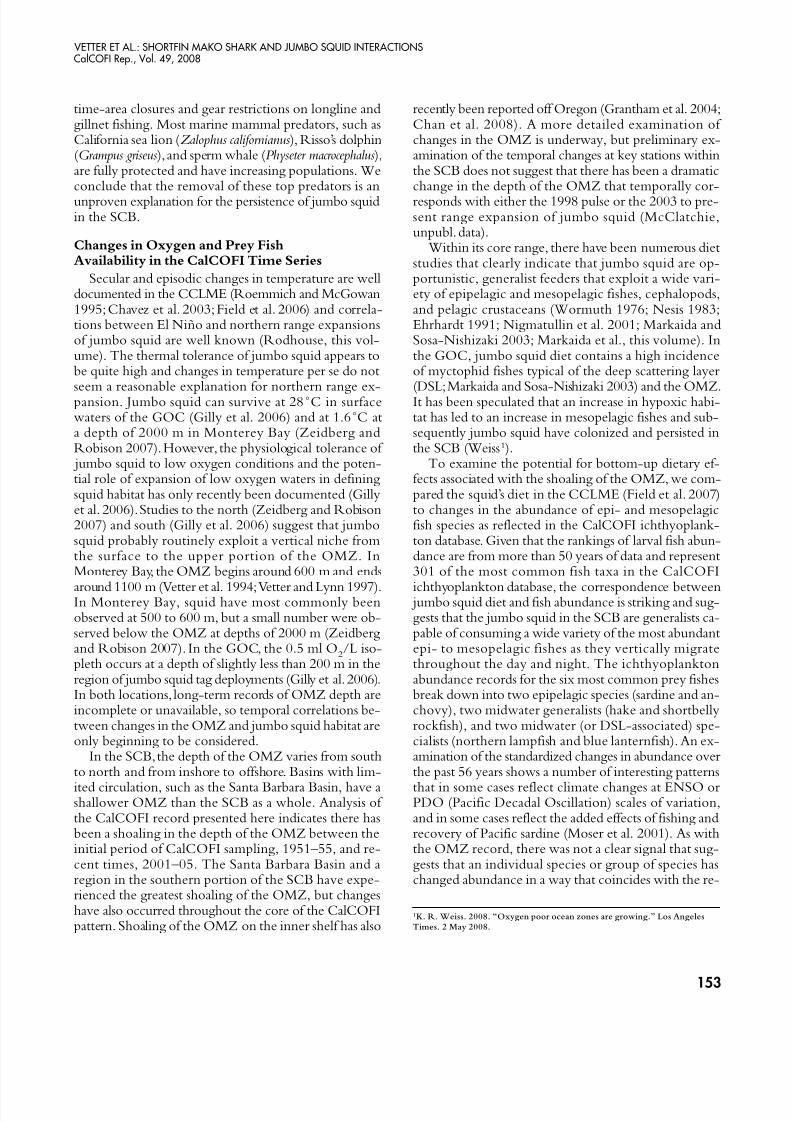
on research needs (see below) different measurementsand procedures may be performed, but at a minimumthe hook is removed, total length or FL, sex, and speciesare recorded, the animal is tagged with conventional tags,and a DNA sample (fin clip) is obtained. Prior to re-lease, each animal is evaluated for overall condition andassigned a score of poor, fair, good or excellent. Duringthe condition evaluation there is time to observe scar-ring due to previous encounters with fishing gear, mat-ing bites, or encounters with jumbo squid. Each sucker on the squid’s arms and tentacles contains a ring of smallgrasping teeth (fig. 1) that produce characteristic marks(Barnes 1987; Nesis 1987).
Electronic Tagging
To study the migratory patterns of mako sharks in theCCLME, we have been deploying electronic tags dur-ing the JSLS as part of a SWFSC and Tagging of PacificPelagics (TOPP) collaborative project. Tags deployed in-clude pop-off archival tags (PAT) which record water temperature, depth, and light level at one-minute inter-vals, and radio transmitting satellite-linked position tags(SPOT) which can be tracked through the Argos sys-tem (www.clsamerica.com) to provide horizontal move-ment information. The PAT (Wildlife Computers, Inc.)is anchored in the dorsal musculature near the first
dorsal fin and the SPOT (Wildlife Computers, Inc.) ismounted high on the first dorsal fin so that it transmitswhenever the fin breaks the surface of the water.
For this study, we focused on the behavior of twomako sharks that remained in the SCB during the fallmonths. For both sharks, we have detailed archival datadue to the recovery of the PAT and accurate locationestimates from the SPOT tags. The first shark, Mako1,was a 114 cm total length (TL) male tagged on 29 July2004 with a model PAT3 tag and a model SPOT4 tag.
The second shark, Mako2, was a 191 cm TL male taggedon 30 June 2006 with a model PAT5 tag and a modelSPOT5 tag. To examine their behaviors with respect tospecific habitats within the SCB (i.e., nearshore vs. off-shore), we identified archival data for which reliableArgos positions (location classes 1-3) indicated overlapin time and space with the CDGNF and the stomachsampling program.
Diet Analyses
Stomachs of mako sharks were collected during the2002–06 fishing seasons by NOAA Fisheries observersaboard CDGNF vessels targeting swordfish. Samplingmonths were August through January and the majority(93%) of stomachs was collected within the SCB wherethe fishery is currently concentrated. The date, time andlocation of capture, shark FL and sex were recorded.Stomachs were frozen onboard and later transferred to
the SWFSC La Jolla, California, laboratory where theywere processed within six months.Stomach contents were analyzed to the lowest pos-
sible taxon following the methods of Preti et al. (2001)using keys when necessary to identify species from hardparts (e.g., Clothier 1950; Iverson and Pinkas 1971).Data were analyzed for each season by prey taxa for relative measures of prey quantities (RMPQs) as fol-lows: percent occurrence by number (%N), percent fre-quency of occurrence (%FO), and percent occurrenceby weight (%W) of prey items. The value %N is thenumber of individuals of a specific taxon found in allstomachs divided by the total number of all prey found
times 100; %FO is the number of stomachs containingprey of a specific taxon divided by the total number of stomachs containing prey times 100; %W is the totalweight of all remains of a specific taxon divided by thetotal weight of all prey remains found times 100 (Hyslop1980; Preti et al. 2001). Weight was the actual weightof the prey remains, not the estimated weight of preyat ingestion. Empty stomachs, slurry, and detritus werenot used when calculating percentages. The values listedabove were used to calculate the Geometric Index of Importance (GII). The GII, in its simplified form, iscalculated as:
n
( V i )i = 1 j
GII j
= , (1)√n
where GII j
= index value for the j -th prey category, V i
= the magnitude of the vector for the i -th RMPQ of the j -th prey category, and n = the number of RMPQsused in the analysis. In our study this is expressed as:
GII j
= (%N j
+ %W j
+ %FO j )/√3. (2)
144
Figure 1. Toothed ring from the sucker of a feeding tentacle of Dosidicus gigas collected in the Southern California Bight during NOAA FisheriesJuvenile Shark Longline Survey.
8/3/2019 Vol 49 Vetter Web
http://slidepdf.com/reader/full/vol-49-vetter-web 4/15
VETTER ET AL.: SHORTFIN MAKO SHARK AND JUMBO SQUID INTERACTIONSCalCOFI Rep., Vol. 49, 2008
We examined the sizes of squid consumed by sharksof different sizes. To calculate the mantle length (ML)of jumbo squid, upper rostral length (URL) was mea-sured and the regression equation from Markaida andSosa-Nishizaki (2003) was used:
ML = 129 + 30.5 URL, (3)
where the unit for ML and URL is mm.Stomach contents were also examined during the JSLS
from sharks which were collected for other ongoing bi-ological studies. Because of the difference in samplingprotocols, these stomachs were not included in the analy-
sis to characterize mako diets. However, D. gigas remainswere found in five stomachs of mako sharks of measuredsize (two samples from June 2004 and three from July2007) and those beaks were measured and included inthe relationship between prey size (squid mantle lengthas estimated from URL) and mako size.
Bioenergetic Estimates of MakoMetabolism and Ration
To calculate the energy requirements of the makoshark, standard energetic equations and equivalents wereused (tab. 1). First, the active metabolic rate was esti-mated by taking the midpoint between the routine and
maximum rates of oxygen consumption determined bySepulveda et al. (2007). This resulted in a 29% increaseabove routine values. Similarly, in their study, Stillwelland Kohler (1982) added 25%–50% to adjust the rou-tine metabolic estimate of mako sharks to an active meta-bolic estimate. Metabolic rate was estimated for a sharkof modal weight taken in the CDGNF during the pe-riod 1990–2006 (NMFS observer data; SWFSC) usinga scaling exponent of 0.75 (Schmidt-Nielsen 1997;Williams 1999). To convert mg O
2to Joules (J), the
oxycalorific equivalent, 13.6 J = 1 mg O2
(Jobling 1994),was used. This value was then adjusted for waste, as-suming that 27% of ingested energy is lost (Brett andGroves 1979). To determine the mass of squid neededto provide the required energy to an average mako shark,
J values were converted to mg of jumbo squid using4.22 J = 1 mg (Cauffope and Heymans 2005). Finally,the overall energetic requirements of the population of mako sharks typically harvested in the CDGNF werecalculated based on the annual fishery landings.
Methods of Analysis of Physical Oceanographic
Data from CalCOFIWe used the Scripps Institution of Oceanography
CalCOFI hydrographic database to compare the depthof the oxygen minimum layer between two five-year time periods (1951 to 1955 and 2001 to 2005). The sur-vey domain was more extensive in the earlier period, sothe comparison was only made for the SCB. We oper-ationally defined the depth of the oxygen minimum layer as the depth of the 0.5 ml O
2/L isopleth (Mullins et al.
1985; Vetter et al. 1994). We averaged isopleth depthsover July to December for all five years, and plotted themean oxygen minimum layer depths as two isosurfacesfor visual comparison.
Methods of Analysis of IchthyoplanktonData from CalCOFI
Larval fish abundance can be used as an indicator of adult spawning biomass for many fish species (Lasker 1985; Ralston et al. 2003; Lo 2007). We obtained aCalCOFI time series (between 1951 and 2006) of lar-val fish data to examine trends in abundance of six speciesthat are common prey in the diets of jumbo squid andmako sharks in the CCLME (Field et al. 2007; Preti
145
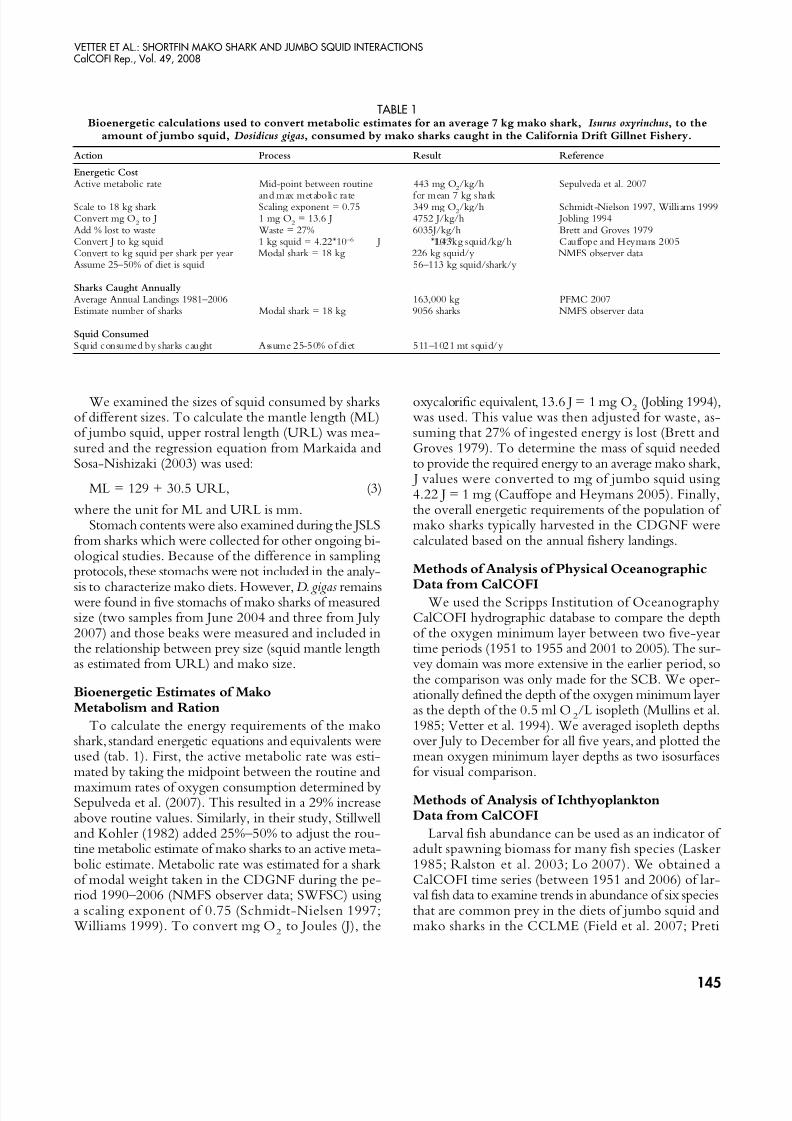
TABLE 1Bioenergetic calculations used to convert metabolic estimates for an average 7 kg mako shark, Isurus oxyrinchus, to the
amount of jumbo squid, Dosidicus gigas, consumed by mako sharks caught in the California Drift Gillnet Fishery.
Action Process Result Reference
Energetic CostActive metabolic rate Mid-point between routine 443 mg O
2/kg/h Sepulveda et al. 2007
and max metabolic rate for mean 7 kg sharkScale to 18 kg shark Scaling exponent = 0.75 349 mg O
2/kg/h Schmidt -Nielson 1997, Willi ams 1999
Convert mg O2
to J 1 mg O2
= 13.6 J 4752 J/kg/h Jobling 1994Add % lost to waste Waste = 27% 6035J/kg/h Brett and Groves 1979Convert J to kg squid 1 kg squid = 4.22*10 –6 J 1.43*10 –3kg squid/kg/h Cauffope and Heymans 2005Convert to kg squid per shark per year Modal shark = 18 kg 226 kg squid/y NMFS observer dataAssume 25–50% of diet is squid 56–113 kg squid/shark/y
Sharks Caught AnnuallyAverage Annual Landings 1981–2006 163,000 kg PFMC 2007Estimate number of sharks Modal shark = 18 kg 9056 sharks NMFS observer data
Squid ConsumedSquid consumed by sharks caught Assume 25-50% of diet 511–1021 mt squid/y
8/3/2019 Vol 49 Vetter Web
http://slidepdf.com/reader/full/vol-49-vetter-web 5/15
VETTER ET AL.: SHORTFIN MAKO SHARK AND JUMBO SQUID INTERACTIONSCalCOFI Rep., Vol. 49, 2008
et al., unpubl. data). They include northern anchovy(Engraulis mordax), Pacific sardine (Sardinops sagax), hake(Merluccius productus), shortbelly rockfish (Sebastes jordani ),
and two mesopelagic myctophid fishes, blue lanternfish(Tarletonbeania crenularis) and northern lampfish (Steno-brachius leucopsarus). Standardized larval abundances (num-ber of larvae in 10/m2) were spatially averaged for eachsurvey over all standard CalCOFI stations in the SCBfor cruises during the spawning periods of each species(Moser et al. 2001). Larval abundances were scaled bysubtracting the series mean and centered by dividing bythe root mean square to make the time series compara-ble before plotting.
RESULTS
Visual Observations of Squid Scars
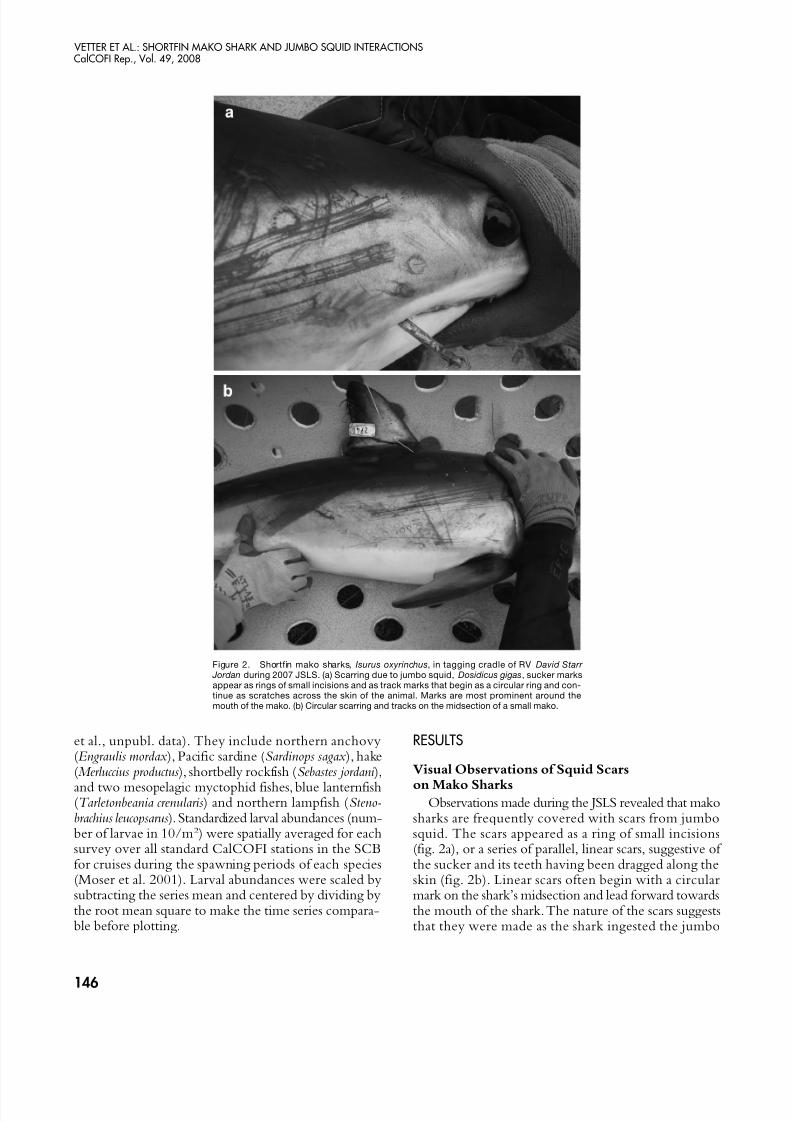
on Mako SharksObservations made during the JSLS revealed that mako
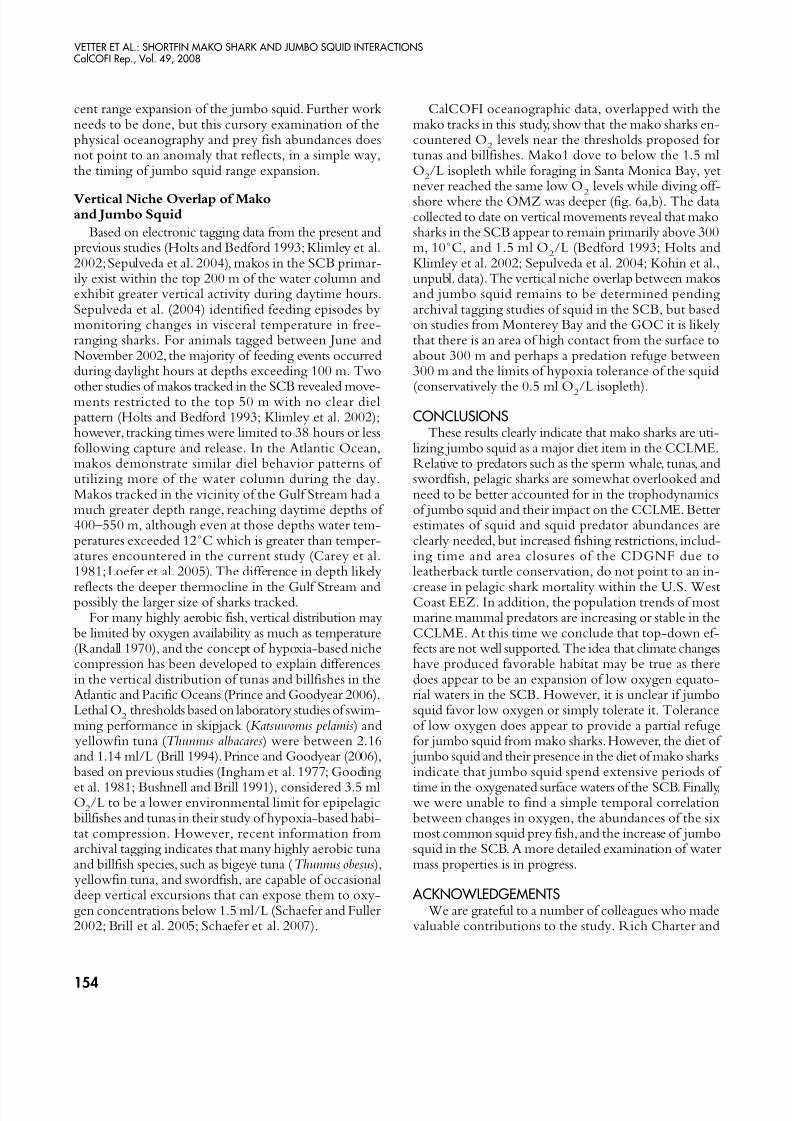
sharks are frequently covered with scars from jumbosquid. The scars appeared as a ring of small incisions(fig. 2a), or a series of parallel, linear scars, suggestive of the sucker and its teeth having been dragged along theskin (fig. 2b). Linear scars often begin with a circular mark on the shark’s midsection and lead forward towardsthe mouth of the shark. The nature of the scars suggeststhat they were made as the shark ingested the jumbo
146
Figure 2. Shortfin mako sharks, Isurus oxyrinchus, in tagging cradle of RV David Starr Jordan during 2007 JSLS. (a) Scarring due to jumbo squid, Dosidicus gigas, sucker marksappear as rings of small incisions and as track marks that begin as a circular ring and con-tinue as scratches across the skin of the animal. Marks are most prominent around themouth of the mako. (b) Circular scarring and tracks on the midsection of a small mako.
8/3/2019 Vol 49 Vetter Web
http://slidepdf.com/reader/full/vol-49-vetter-web 6/15
VETTER ET AL.: SHORTFIN MAKO SHARK AND JUMBO SQUID INTERACTIONSCalCOFI Rep., Vol. 49, 2008
squid. Squid sucker marks have been observed on blue(Prionace glauca) and common thresher sharks ( Alopiasvulpinus), but the marks are faint and infrequent com-pared to those on makos. Although similar scars haveoccasionally been observed on makos during cruises prior to 2005, there is a general impression among the authors(Vetter and Kohin) that the frequency of occurrence andamount of scarring have increased and were particularlynoticeable in 2006 and 2007.
Mako Shark Diet Studies
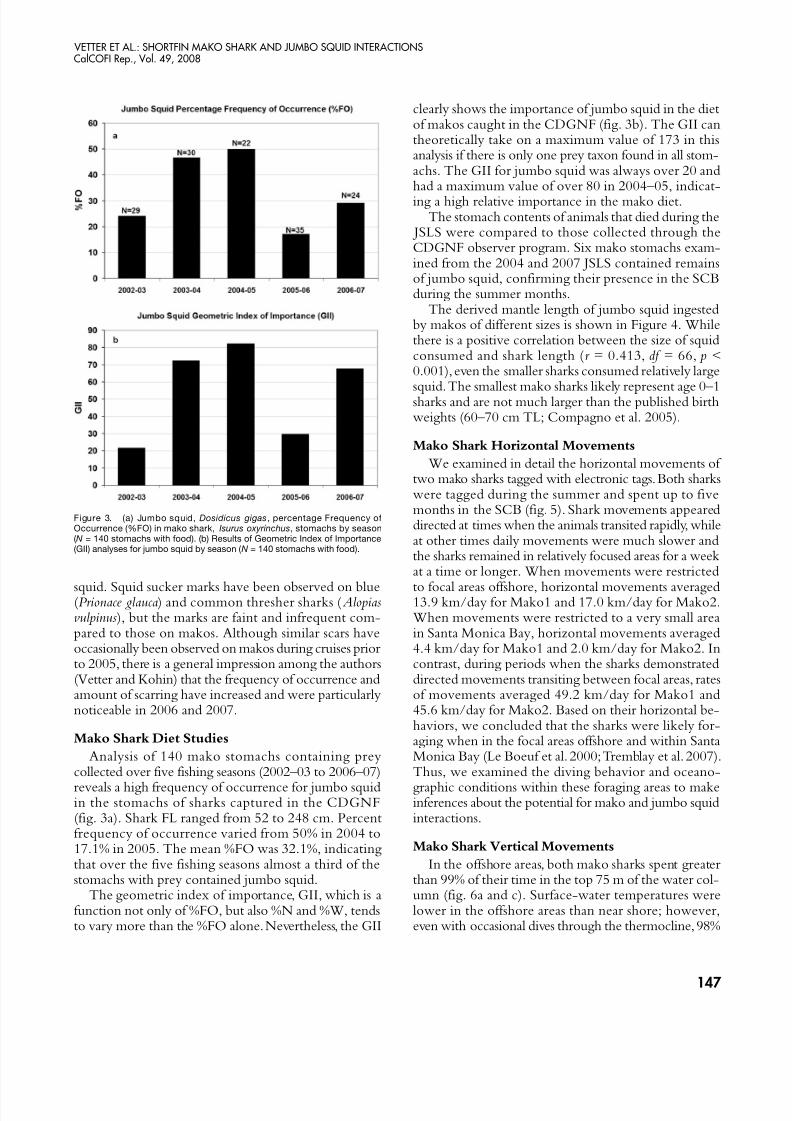
Analysis of 140 mako stomachs containing preycollected over five fishing seasons (2002–03 to 2006–07)
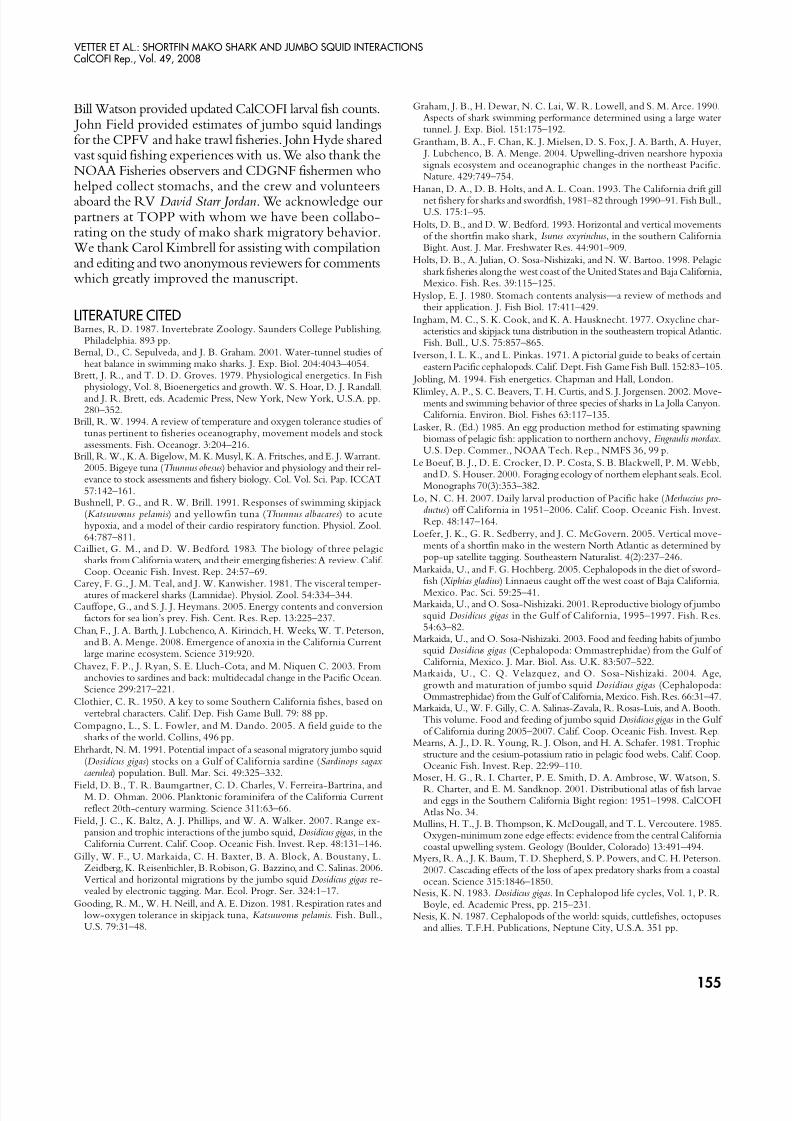
reveals a high frequency of occurrence for jumbo squidin the stomachs of sharks captured in the CDGNF(fig. 3a). Shark FL ranged from 52 to 248 cm. Percentfrequency of occurrence varied from 50% in 2004 to17.1% in 2005. The mean %FO was 32.1%, indicatingthat over the five fishing seasons almost a third of thestomachs with prey contained jumbo squid.
The geometric index of importance, GII, which is afunction not only of %FO, but also %N and %W, tendsto vary more than the %FO alone. Nevertheless, the GII
clearly shows the importance of jumbo squid in the dietof makos caught in the CDGNF (fig. 3b). The GII cantheoretically take on a maximum value of 173 in thisanalysis if there is only one prey taxon found in all stom-achs. The GII for jumbo squid was always over 20 andhad a maximum value of over 80 in 2004–05, indicat-ing a high relative importance in the mako diet.
The stomach contents of animals that died during the JSLS were compared to those collected through theCDGNF observer program. Six mako stomachs exam-ined from the 2004 and 2007 JSLS contained remainsof jumbo squid, confirming their presence in the SCBduring the summer months.
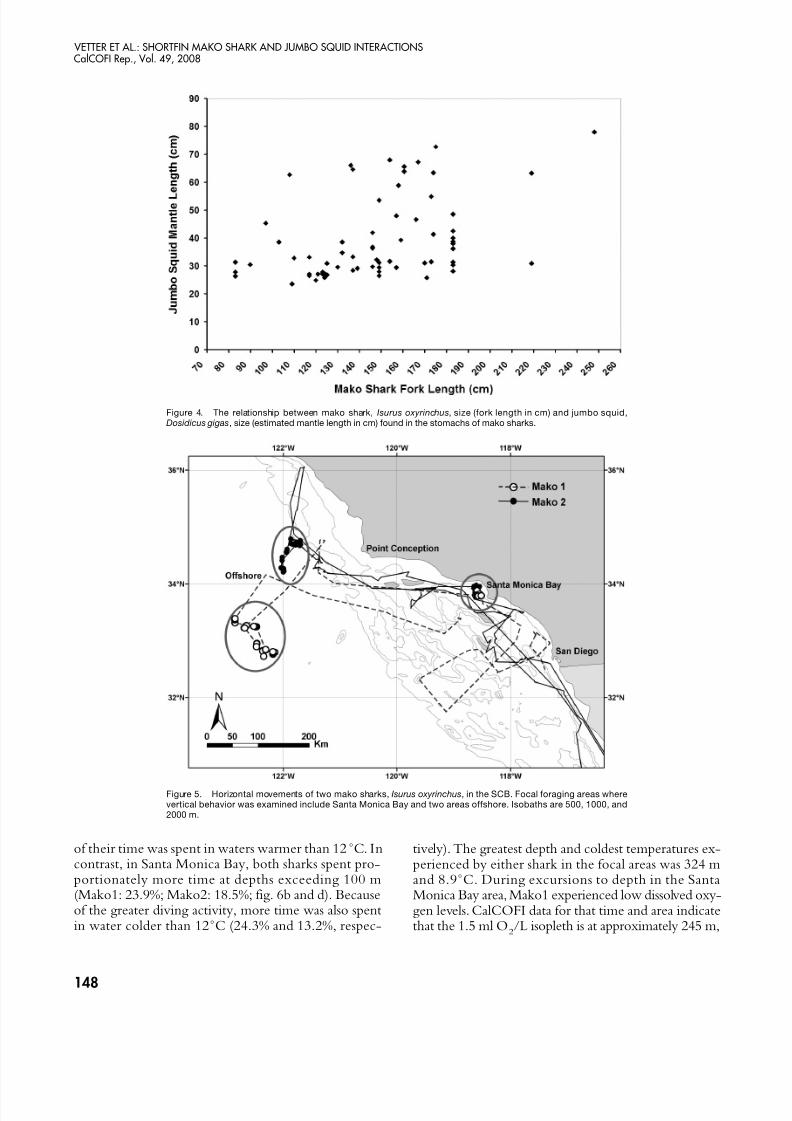
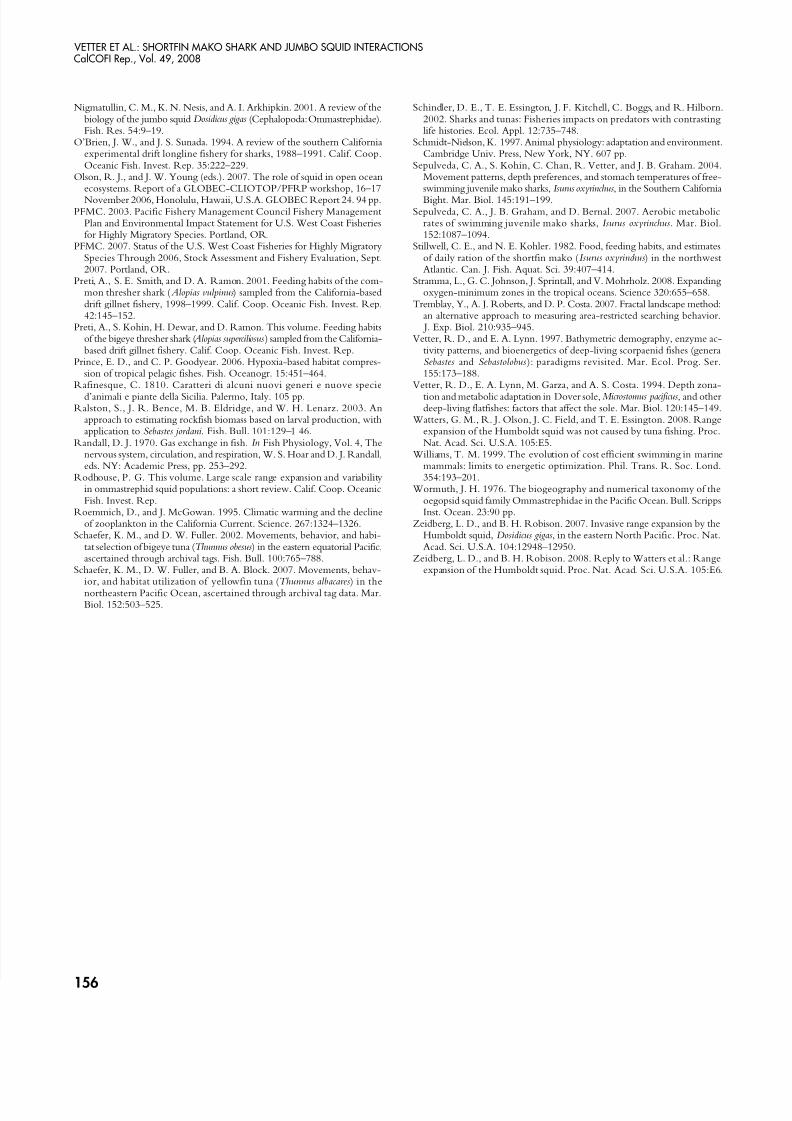
The derived mantle length of jumbo squid ingestedby makos of different sizes is shown in Figure 4. Whilethere is a positive correlation between the size of squidconsumed and shark length (r = 0.413, df = 66, p <0.001), even the smaller sharks consumed relatively large
squid. The smallest mako sharks likely represent age 0–1sharks and are not much larger than the published birthweights (60–70 cm TL; Compagno et al. 2005).
Mako Shark Horizontal Movements
We examined in detail the horizontal movements of two mako sharks tagged with electronic tags. Both sharkswere tagged during the summer and spent up to fivemonths in the SCB (fig. 5). Shark movements appeareddirected at times when the animals transited rapidly, whileat other times daily movements were much slower andthe sharks remained in relatively focused areas for a weekat a time or longer. When movements were restricted
to focal areas offshore, horizontal movements averaged13.9 km/day for Mako1 and 17.0 km/day for Mako2.When movements were restricted to a very small areain Santa Monica Bay, horizontal movements averaged4.4 km/day for Mako1 and 2.0 km/day for Mako2. Incontrast, during periods when the sharks demonstrateddirected movements transiting between focal areas, ratesof movements averaged 49.2 km/day for Mako1 and45.6 km/day for Mako2. Based on their horizontal be-haviors, we concluded that the sharks were likely for-aging when in the focal areas offshore and within SantaMonica Bay (Le Boeuf et al. 2000; Tremblay et al. 2007).Thus, we examined the diving behavior and oceano-
graphic conditions within these foraging areas to makeinferences about the potential for mako and jumbo squidinteractions.
Mako Shark Vertical Movements
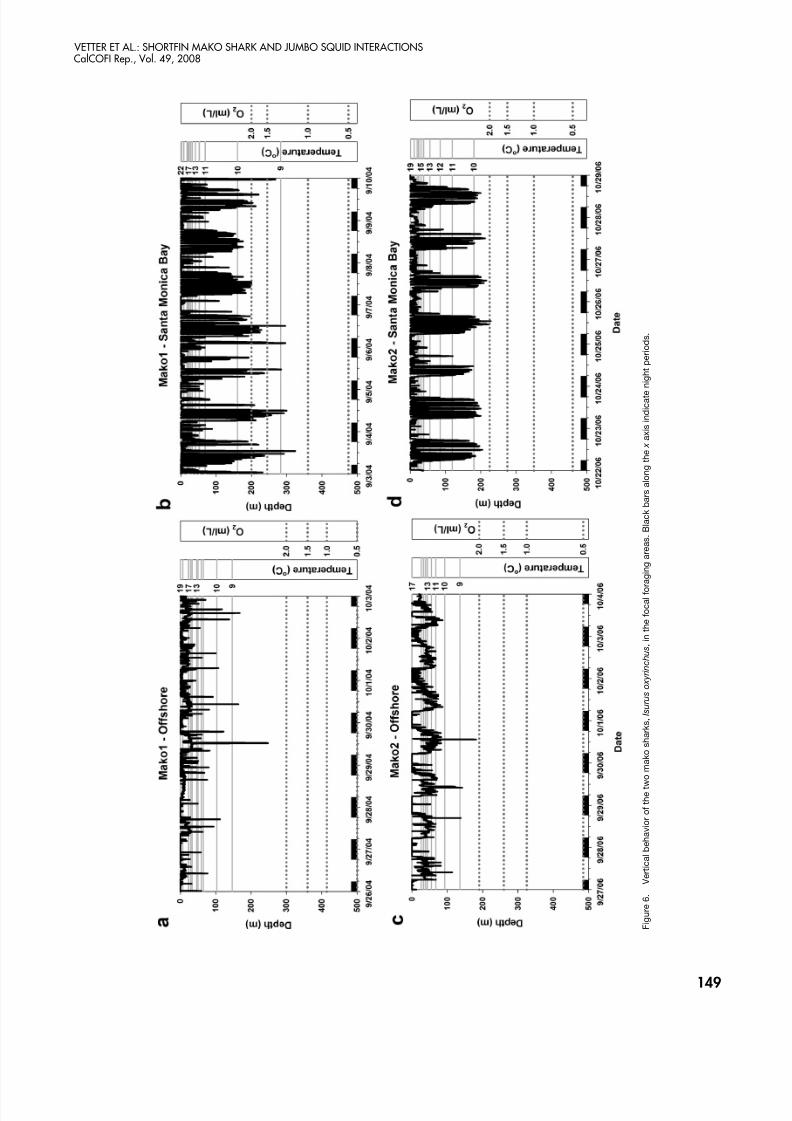
In the offshore areas, both mako sharks spent greater than 99% of their time in the top 75 m of the water col-umn (fig. 6a and c). Surface-water temperatures werelower in the offshore areas than near shore; however,even with occasional dives through the thermocline, 98%
147
Figure 3. (a) Jumbo squid, Dosidicus gigas, percentage Frequency ofOccurrence (%FO) in mako shark, Isurus oxyrinchus, stomachs by season( N = 140 stomachs with food). (b) Results of Geometric Index of Importance(GII) analyses for jumbo squid by season ( N = 140 stomachs with food).
8/3/2019 Vol 49 Vetter Web
http://slidepdf.com/reader/full/vol-49-vetter-web 7/15
VETTER ET AL.: SHORTFIN MAKO SHARK AND JUMBO SQUID INTERACTIONSCalCOFI Rep., Vol. 49, 2008
of their time was spent in waters warmer than 12˚C. Incontrast, in Santa Monica Bay, both sharks spent pro-portionately more time at depths exceeding 100 m(Mako1: 23.9%; Mako2: 18.5%; fig. 6b and d). Becauseof the greater diving activity, more time was also spentin water colder than 12˚C (24.3% and 13.2%, respec-
tively). The greatest depth and coldest temperatures ex-perienced by either shark in the focal areas was 324 mand 8.9˚C. During excursions to depth in the SantaMonica Bay area, Mako1 experienced low dissolved oxy-gen levels. CalCOFI data for that time and area indicatethat the 1.5 ml O
2/L isopleth is at approximately 245 m,
148
Figure 4. The relationship between mako shark, Isurus oxyrinchus, size (fork length in cm) and jumbo squid,Dosidicus gigas, size (estimated mantle length in cm) found in the stomachs of mako sharks.
Figure 5. Horizontal movements of two mako sharks, Isurus oxyrinchus, in the SCB. Focal foraging areas wherevertical behavior was examined include Santa Monica Bay and two areas offshore. Isobaths are 500, 1000, and2000 m.
8/3/2019 Vol 49 Vetter Web
http://slidepdf.com/reader/full/vol-49-vetter-web 8/15
VETTER ET AL.: SHORTFIN MAKO SHARK AND JUMBO SQUID INTERACTIONSCalCOFI Rep., Vol. 49, 2008
149
F i g u r e 6 .
V e r t i c a l b e h a v i o r o f t h e t w
o m a k o s h a r k s ,
I s u r u s
o x y r i n c h u s ,
i n t h e f o c a l f o
r a g i n g a r e a s .
B l a c k b a r s a l o n g t h e x
a x i s i n d i c a t e
n i g h t p e r i o d s .
8/3/2019 Vol 49 Vetter Web
http://slidepdf.com/reader/full/vol-49-vetter-web 9/15
VETTER ET AL.: SHORTFIN MAKO SHARK AND JUMBO SQUID INTERACTIONSCalCOFI Rep., Vol. 49, 2008
150
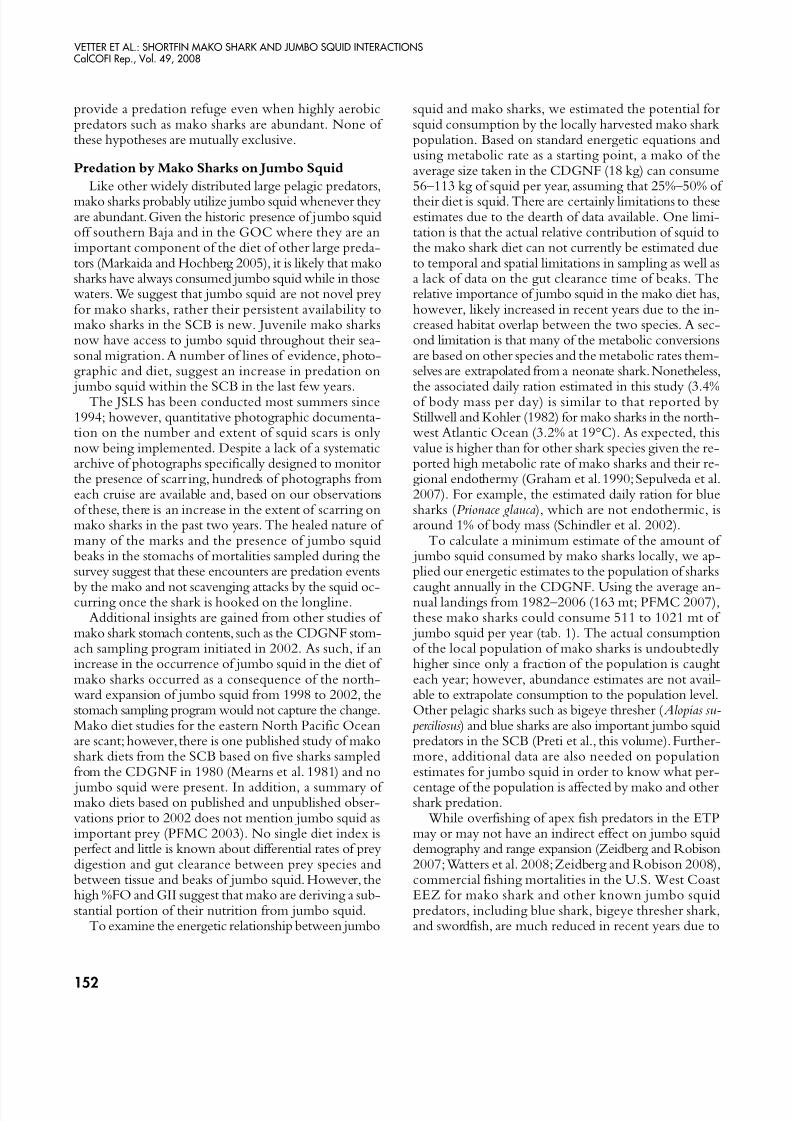
TABLE 2Comparison of ranked frequency of occurrence in the diet of jumbo squid, Dosidicus gigas, in the CCLME
(Table 2 in Field et al. 2007) compared to the ranked abundance of fish larvae as they occur in the CalCOFIichthyoplankton data (1951–98). Rankings are based on the 301 most common larval fish taxa identified
to the lowest taxonomic unit (Table 4 in CalCOFI Atlas 34, Moser et al. 2001).
Rank in Jumbo Rank of Fish CalCOFI LarvalCommon Name Scientific name Squid Diet Prey Only Abundance Rank
Pacific hake Merluccius productus 1 1 2northern lampfish Stenobrachius leucopsarus 2 2 6northern anchovy Engraulis mordax 3 3 1blue lanternfish Tarletonbeania crenularis 4 4 18Pacific sardine Sardinops sagax 5 5 7shortbelly rockfish Sebastes jordani 7 6 9California headlightfish Diaphus theta 8 7 29broadfin lampfish Nannobrachium ritteri 10 8 17rockfish spp. Sebastes spp. 11 9 4California lanternfish Symbolophorous californiensis 14 10 23
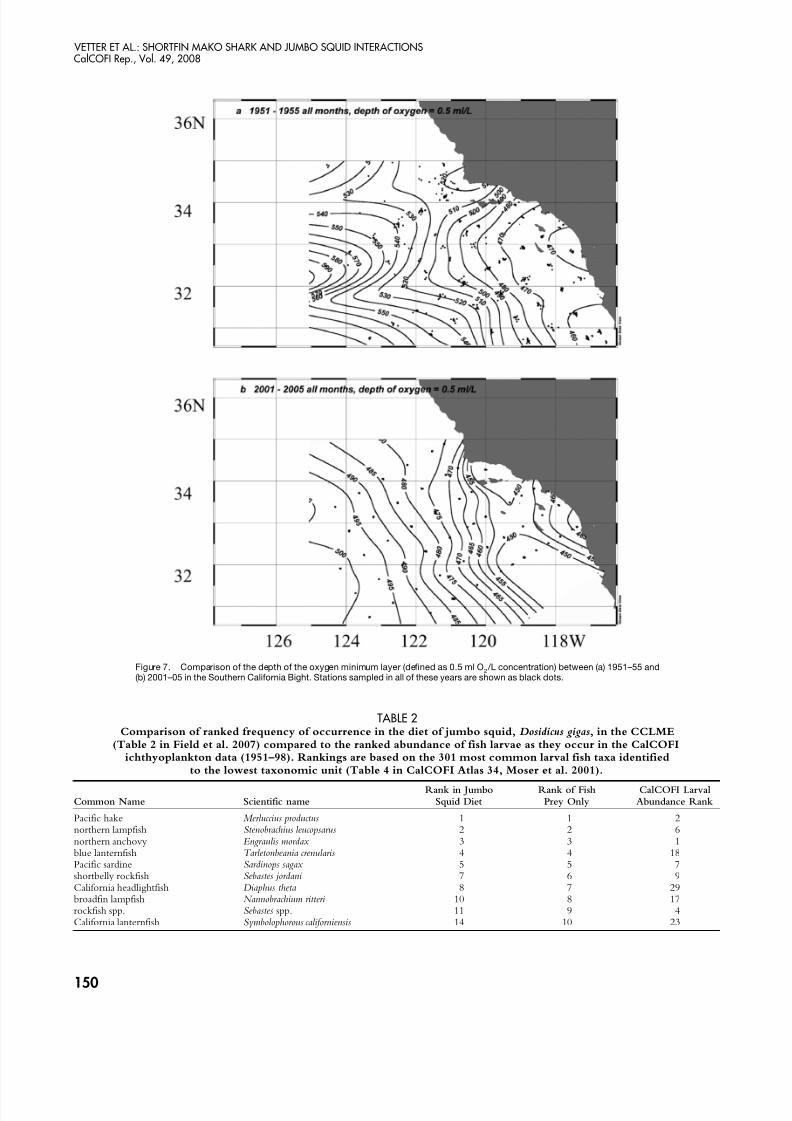
Figure 7. Comparison of the depth of the oxygen minimum layer (defined as 0.5 ml O2 /L concentration) between (a) 1951–55 and
(b) 2001–05 in the Southern California Bight. Stations sampled in all of these years are shown as black dots.
8/3/2019 Vol 49 Vetter Web
http://slidepdf.com/reader/full/vol-49-vetter-web 10/15
VETTER ET AL.: SHORTFIN MAKO SHARK AND JUMBO SQUID INTERACTIONSCalCOFI Rep., Vol. 49, 2008
151
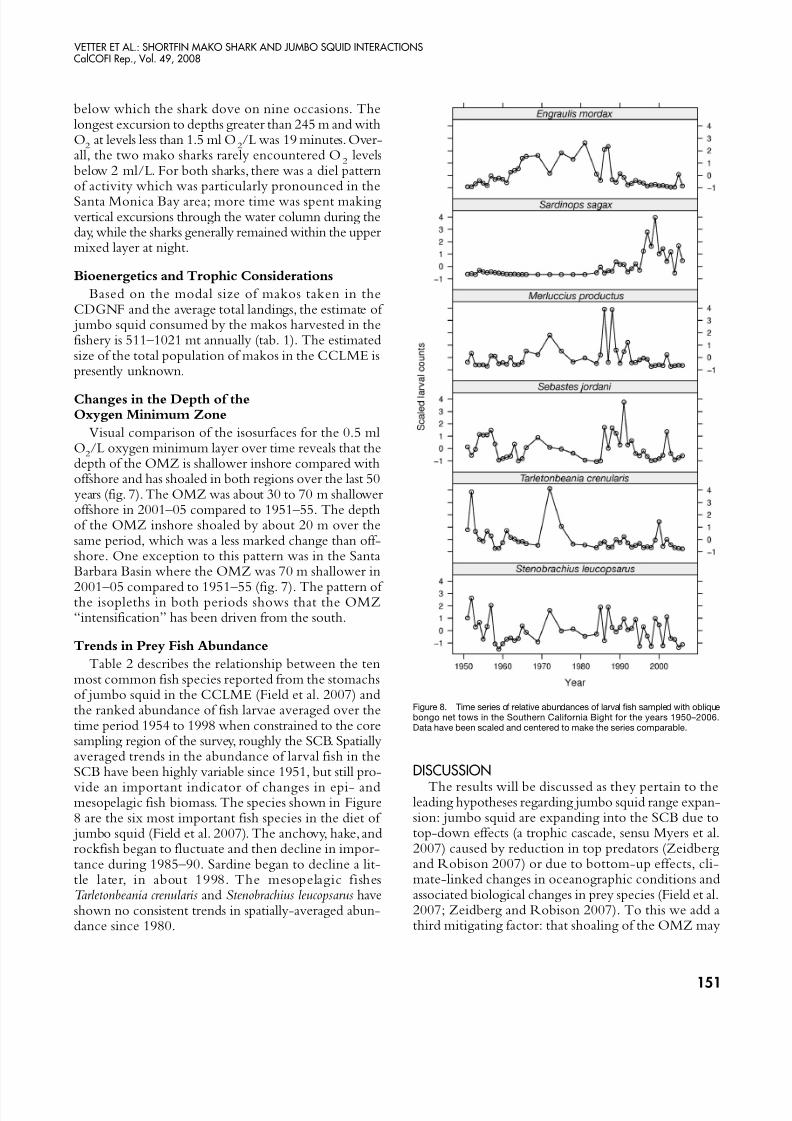
Figure 8. Time series of relative abundances of larval fish sampled with obliquebongo net tows in the Southern California Bight for the years 1950–2006.Data have been scaled and centered to make the series comparable.
below which the shark dove on nine occasions. Thelongest excursion to depths greater than 245 m and withO
2at levels less than 1.5 ml O
2/L was 19 minutes. Over-
all, the two mako sharks rarely encountered O2
levelsbelow 2 ml/L. For both sharks, there was a diel patternof activity which was particularly pronounced in theSanta Monica Bay area; more time was spent makingvertical excursions through the water column during theday, while the sharks generally remained within the upper mixed layer at night.
Bioenergetics and Trophic Considerations
Based on the modal size of makos taken in theCDGNF and the average total landings, the estimate of
jumbo squid consumed by the makos harvested in thefishery is 511–1021 mt annually (tab. 1). The estimatedsize of the total population of makos in the CCLME ispresently unknown.
Changes in the Depth of theOxygen Minimum Zone
Visual comparison of the isosurfaces for the 0.5 mlO
2/L oxygen minimum layer over time reveals that the
depth of the OMZ is shallower inshore compared withoffshore and has shoaled in both regions over the last 50
years (fig. 7). The OMZ was about 30 to 70 m shallower offshore in 2001–05 compared to 1951–55. The depthof the OMZ inshore shoaled by about 20 m over thesame period, which was a less marked change than off-shore. One exception to this pattern was in the SantaBarbara Basin where the OMZ was 70 m shallower in
2001–05 compared to 1951–55 (fig. 7). The pattern of the isopleths in both periods shows that the OMZ“intensification” has been driven from the south.
Trends in Prey Fish Abundance
Table 2 describes the relationship between the tenmost common fish species reported from the stomachsof jumbo squid in the CCLME (Field et al. 2007) andthe ranked abundance of fish larvae averaged over thetime period 1954 to 1998 when constrained to the coresampling region of the survey, roughly the SCB. Spatiallyaveraged trends in the abundance of larval fish in theSCB have been highly variable since 1951, but still pro-
vide an important indicator of changes in epi- andmesopelagic fish biomass. The species shown in Figure8 are the six most important fish species in the diet of
jumbo squid (Field et al. 2007). The anchovy, hake, androckfish began to fluctuate and then decline in impor-tance during 1985–90. Sardine began to decline a lit-tle later, in about 1998. The mesopelagic fishesTarletonbeania crenularis and Stenobrachius leucopsarus haveshown no consistent trends in spatially-averaged abun-dance since 1980.
DISCUSSION
The results will be discussed as they pertain to theleading hypotheses regarding jumbo squid range expan-sion: jumbo squid are expanding into the SCB due totop-down effects (a trophic cascade, sensu Myers et al.2007) caused by reduction in top predators (Zeidbergand Robison 2007) or due to bottom-up effects, cli-mate-linked changes in oceanographic conditions andassociated biological changes in prey species (Field et al.2007; Zeidberg and Robison 2007). To this we add athird mitigating factor: that shoaling of the OMZ may
8/3/2019 Vol 49 Vetter Web
http://slidepdf.com/reader/full/vol-49-vetter-web 11/15
VETTER ET AL.: SHORTFIN MAKO SHARK AND JUMBO SQUID INTERACTIONSCalCOFI Rep., Vol. 49, 2008
provide a predation refuge even when highly aerobicpredators such as mako sharks are abundant. None of these hypotheses are mutually exclusive.
Predation by Mako Sharks on Jumbo Squid
Like other widely distributed large pelagic predators,mako sharks probably utilize jumbo squid whenever theyare abundant.Given the historic presence of jumbo squidoff southern Baja and in the GOC where they are animportant component of the diet of other large preda-tors (Markaida and Hochberg 2005), it is likely that makosharks have always consumed jumbo squid while in thosewaters. We suggest that jumbo squid are not novel preyfor mako sharks, rather their persistent availability tomako sharks in the SCB is new. Juvenile mako sharksnow have access to jumbo squid throughout their sea-sonal migration. A number of lines of evidence, photo-graphic and diet, suggest an increase in predation on
jumbo squid within the SCB in the last few years.The JSLS has been conducted most summers since1994; however, quantitative photographic documenta-tion on the number and extent of squid scars is onlynow being implemented. Despite a lack of a systematicarchive of photographs specifically designed to monitor the presence of scarr ing, hundreds of photographs fromeach cruise are available and, based on our observationsof these, there is an increase in the extent of scarring onmako sharks in the past two years. The healed nature of many of the marks and the presence of jumbo squidbeaks in the stomachs of mortalities sampled during thesurvey suggest that these encounters are predation events
by the mako and not scavenging attacks by the squid oc-curring once the shark is hooked on the longline.
Additional insights are gained from other studies of mako shark stomach contents, such as the CDGNF stom-ach sampling program initiated in 2002. As such, if anincrease in the occurrence of jumbo squid in the diet of mako sharks occurred as a consequence of the north-ward expansion of jumbo squid from 1998 to 2002, thestomach sampling program would not capture the change.Mako diet studies for the eastern North Pacific Oceanare scant; however, there is one published study of makoshark diets from the SCB based on five sharks sampledfrom the CDGNF in 1980 (Mearns et al. 1981) and no
jumbo squid were present. In addition, a summary of mako diets based on published and unpublished obser-vations prior to 2002 does not mention jumbo squid asimportant prey (PFMC 2003). No single diet index isperfect and little is known about differential rates of preydigestion and gut clearance between prey species andbetween tissue and beaks of jumbo squid. However, thehigh %FO and GII suggest that mako are deriving a sub-stantial portion of their nutrition from jumbo squid.
To examine the energetic relationship between jumbo
squid and mako sharks, we estimated the potential for squid consumption by the locally harvested mako sharkpopulation. Based on standard energetic equations andusing metabolic rate as a starting point, a mako of theaverage size taken in the CDGNF (18 kg) can consume56–113 kg of squid per year, assuming that 25%–50% of their diet is squid. There are certainly limitations to theseestimates due to the dearth of data available. One limi-tation is that the actual relative contribution of squid tothe mako shark diet can not currently be estimated dueto temporal and spatial limitations in sampling as well asa lack of data on the gut clearance time of beaks. Therelative importance of jumbo squid in the mako diet has,however, likely increased in recent years due to the in-creased habitat overlap between the two species. A sec-ond limitation is that many of the metabolic conversionsare based on other species and the metabolic rates them-selves are extrapolated from a neonate shark. Nonetheless,
the associated daily ration estimated in this study (3.4%of body mass per day) is similar to that reported byStillwell and Kohler (1982) for mako sharks in the north-west Atlantic Ocean (3.2% at 19°C). As expected, thisvalue is higher than for other shark species given the re-ported high metabolic rate of mako sharks and their re-gional endothermy (Graham et al. 1990; Sepulveda et al.2007). For example, the estimated daily ration for bluesharks (Prionace glauca), which are not endothermic, isaround 1% of body mass (Schindler et al. 2002).
To calculate a minimum estimate of the amount of jumbo squid consumed by mako sharks locally, we ap-plied our energetic estimates to the population of sharks
caught annually in the CDGNF. Using the average an-nual landings from 1982–2006 (163 mt; PFMC 2007),these mako sharks could consume 511 to 1021 mt of
jumbo squid per year (tab. 1). The actual consumptionof the local population of mako sharks is undoubtedlyhigher since only a fraction of the population is caughteach year; however, abundance estimates are not avail-able to extrapolate consumption to the population level.Other pelagic sharks such as bigeye thresher ( Alopias su-
perciliosus) and blue sharks are also important jumbo squidpredators in the SCB (Preti et al., this volume). Further-more, additional data are also needed on populationestimates for jumbo squid in order to know what per-
centage of the population is affected by mako and other shark predation.
While overfishing of apex fish predators in the ETPmay or may not have an indirect effect on jumbo squiddemography and range expansion (Zeidberg and Robison2007; Watters et al. 2008; Zeidberg and Robison 2008),commercial fishing mortalities in the U.S. West CoastEEZ for mako shark and other known jumbo squidpredators, including blue shark, bigeye thresher shark,and swordfish, are much reduced in recent years due to
152
8/3/2019 Vol 49 Vetter Web
http://slidepdf.com/reader/full/vol-49-vetter-web 12/15
VETTER ET AL.: SHORTFIN MAKO SHARK AND JUMBO SQUID INTERACTIONSCalCOFI Rep., Vol. 49, 2008
time-area closures and gear restrictions on longline andgillnet fishing. Most marine mammal predators, such asCalifornia sea lion (Zalophus californianus), Risso’s dolphin(Grampus griseus), and sperm whale (Physeter macrocephalus),are fully protected and have increasing populations. Weconclude that the removal of these top predators is anunproven explanation for the persistence of jumbo squidin the SCB.
Changes in Oxygen and Prey FishAvailability in the CalCOFI Time Series
Secular and episodic changes in temperature are welldocumented in the CCLME (Roemmich and McGowan1995; Chavez et al. 2003; Field et al. 2006) and correla-tions between El Niño and northern range expansionsof jumbo squid are well known (Rodhouse, this vol-ume). The thermal tolerance of jumbo squid appears tobe quite high and changes in temperature per se do not
seem a reasonable explanation for northern range ex-pansion. Jumbo squid can survive at 28˚C in surfacewaters of the GOC (Gilly et al. 2006) and at 1.6˚C ata depth of 2000 m in Monterey Bay (Zeidberg andRobison 2007). However, the physiological tolerance of
jumbo squid to low oxygen conditions and the poten-tial role of expansion of low oxygen waters in definingsquid habitat has only recently been documented (Gillyet al. 2006). Studies to the north (Zeidberg and Robison2007) and south (Gilly et al. 2006) suggest that jumbosquid probably routinely exploit a vertical niche fromthe surface to the upper portion of the OMZ. InMonterey Bay, the OMZ begins around 600 m and ends
around 1100 m (Vetter et al. 1994;Vetter and Lynn 1997).In Monterey Bay, squid have most commonly beenobserved at 500 to 600 m, but a small number were ob-served below the OMZ at depths of 2000 m (Zeidbergand Robison 2007). In the GOC, the 0.5 ml O
2/L iso-
pleth occurs at a depth of slightly less than 200 m in theregion of jumbo squid tag deployments (Gilly et al. 2006).In both locations, long-term records of OMZ depth areincomplete or unavailable, so temporal correlations be-tween changes in the OMZ and jumbo squid habitat areonly beginning to be considered.
In the SCB, the depth of the OMZ varies from southto north and from inshore to offshore. Basins with lim-
ited circulation, such as the Santa Barbara Basin, have ashallower OMZ than the SCB as a whole. Analysis of the CalCOFI record presented here indicates there hasbeen a shoaling in the depth of the OMZ between theinitial period of CalCOFI sampling, 1951–55, and re-cent times, 2001–05. The Santa Barbara Basin and aregion in the southern portion of the SCB have expe-rienced the greatest shoaling of the OMZ, but changeshave also occurred throughout the core of the CalCOFIpattern. Shoaling of the OMZ on the inner shelf has also
recently been reported off Oregon (Grantham et al. 2004;Chan et al. 2008). A more detailed examination of changes in the OMZ is underway, but preliminary ex-amination of the temporal changes at key stations withinthe SCB does not suggest that there has been a dramaticchange in the depth of the OMZ that temporally cor-responds with either the 1998 pulse or the 2003 to pre-sent range expansion of jumbo squid (McClatchie,unpubl. data).
Within its core range, there have been numerous dietstudies that clearly indicate that jumbo squid are op-portunistic, generalist feeders that exploit a wide vari-ety of epipelagic and mesopelagic fishes, cephalopods,and pelagic crustaceans (Wormuth 1976; Nesis 1983;Ehrhardt 1991; Nigmatullin et al. 2001; Markaida andSosa-Nishizaki 2003; Markaida et al., this volume). Inthe GOC, jumbo squid diet contains a high incidenceof myctophid fishes typical of the deep scattering layer
(DSL; Markaida and Sosa-Nishizaki 2003) and the OMZ.It has been speculated that an increase in hypoxic habi-tat has led to an increase in mesopelagic fishes and sub-sequently jumbo squid have colonized and persisted inthe SCB (Weiss1).
To examine the potential for bottom-up dietary ef-fects associated with the shoaling of the OMZ, we com-pared the squid’s diet in the CCLME (Field et al. 2007)to changes in the abundance of epi- and mesopelagicfish species as reflected in the CalCOFI ichthyoplank-ton database. Given that the rankings of larval fish abun-dance are from more than 50 years of data and represent301 of the most common fish taxa in the CalCOFI
ichthyoplankton database, the correspondence between jumbo squid diet and fish abundance is striking and sug-gests that the jumbo squid in the SCB are generalists ca-pable of consuming a wide variety of the most abundantepi- to mesopelagic fishes as they vertically migratethroughout the day and night. The ichthyoplanktonabundance records for the six most common prey fishesbreak down into two epipelagic species (sardine and an-chovy), two midwater generalists (hake and shortbellyrockfish), and two midwater (or DSL-associated) spe-cialists (northern lampfish and blue lanternfish). An ex-amination of the standardized changes in abundance over the past 56 years shows a number of interesting patterns
that in some cases reflect climate changes at ENSO or PDO (Pacific Decadal Oscillation) scales of variation,and in some cases reflect the added effects of fishing andrecovery of Pacific sardine (Moser et al. 2001). As withthe OMZ record, there was not a clear signal that sug-gests that an individual species or group of species haschanged abundance in a way that coincides with the re-
153
1K. R. Weiss. 2008. “Oxygen poor ocean zones are growing.” Los Angeles
Times. 2 May 2008.
8/3/2019 Vol 49 Vetter Web
http://slidepdf.com/reader/full/vol-49-vetter-web 13/15
VETTER ET AL.: SHORTFIN MAKO SHARK AND JUMBO SQUID INTERACTIONSCalCOFI Rep., Vol. 49, 2008
cent range expansion of the jumbo squid. Further workneeds to be done, but this cursory examination of thephysical oceanography and prey fish abundances doesnot point to an anomaly that reflects, in a simple way,the timing of jumbo squid range expansion.
Vertical Niche Overlap of Makoand Jumbo Squid
Based on electronic tagging data from the present andprevious studies (Holts and Bedford 1993; Klimley et al.2002; Sepulveda et al. 2004), makos in the SCB primar-ily exist within the top 200 m of the water column andexhibit greater vertical activity during daytime hours.Sepulveda et al. (2004) identified feeding episodes bymonitoring changes in visceral temperature in free-ranging sharks. For animals tagged between June andNovember 2002, the majority of feeding events occurredduring daylight hours at depths exceeding 100 m. Two
other studies of makos tracked in the SCB revealed move-ments restricted to the top 50 m with no clear dielpattern (Holts and Bedford 1993; Klimley et al. 2002);however, tracking times were limited to 38 hours or lessfollowing capture and release. In the Atlantic Ocean,makos demonstrate similar diel behavior patterns of utilizing more of the water column during the day.Makos tracked in the vicinity of the Gulf Stream had amuch greater depth range, reaching daytime depths of 400–550 m, although even at those depths water tem-peratures exceeded 12˚C which is greater than temper-atures encountered in the current study (Carey et al.1981; Loefer et al. 2005). The difference in depth likely
reflects the deeper thermocline in the Gulf Stream andpossibly the larger size of sharks tracked.
For many highly aerobic fish, vertical distribution maybe limited by oxygen availability as much as temperature(Randall 1970), and the concept of hypoxia-based nichecompression has been developed to explain differencesin the vertical distribution of tunas and billfishes in theAtlantic and Pacific Oceans (Prince and Goodyear 2006).Lethal O
2thresholds based on laboratory studies of swim-
ming performance in skipjack (Katsuwonus pelamis) and yellowfin tuna (Thunnus albacares) were between 2.16and 1.14 ml/L (Brill 1994). Prince and Goodyear (2006),based on previous studies (Ingham et al. 1977; Gooding
et al. 1981; Bushnell and Brill 1991), considered 3.5 mlO
2/L to be a lower environmental limit for epipelagic
billfishes and tunas in their study of hypoxia-based habi-tat compression. However, recent information fromarchival tagging indicates that many highly aerobic tunaand billfish species, such as bigeye tuna (Thunnus obesus),
yellowfin tuna, and swordfish, are capable of occasionaldeep vertical excursions that can expose them to oxy-gen concentrations below 1.5 ml/L (Schaefer and Fuller 2002; Brill et al. 2005; Schaefer et al. 2007).
CalCOFI oceanographic data, overlapped with themako tracks in this study, show that the mako sharks en-countered O
2levels near the thresholds proposed for
tunas and billfishes. Mako1 dove to below the 1.5 mlO
2/L isopleth while foraging in Santa Monica Bay, yet
never reached the same low O2
levels while diving off-shore where the OMZ was deeper (fig. 6a,b). The datacollected to date on vertical movements reveal that makosharks in the SCB appear to remain primarily above 300m, 10˚C, and 1.5 ml O
2/L (Bedford 1993; Holts and
Klimley et al. 2002; Sepulveda et al. 2004; Kohin et al.,unpubl. data). The vertical niche overlap between makosand jumbo squid remains to be determined pendingarchival tagging studies of squid in the SCB, but basedon studies from Monterey Bay and the GOC it is likelythat there is an area of high contact from the surface toabout 300 m and perhaps a predation refuge between300 m and the limits of hypoxia tolerance of the squid
(conservatively the 0.5 ml O2/L isopleth).
CONCLUSIONSThese results clearly indicate that mako sharks are uti-
lizing jumbo squid as a major diet item in the CCLME.Relative to predators such as the sperm whale, tunas, andswordfish, pelagic sharks are somewhat overlooked andneed to be better accounted for in the trophodynamicsof jumbo squid and their impact on the CCLME. Better estimates of squid and squid predator abundances areclearly needed, but increased fishing restrictions, includ-ing time and area closures of the CDGNF due toleatherback turtle conservation, do not point to an in-
crease in pelagic shark mortality within the U.S. WestCoast EEZ. In addition, the population trends of mostmarine mammal predators are increasing or stable in theCCLME. At this time we conclude that top-down ef-fects are not well supported. The idea that climate changeshave produced favorable habitat may be true as theredoes appear to be an expansion of low oxygen equato-rial waters in the SCB. However, it is unclear if jumbosquid favor low oxygen or simply tolerate it. Toleranceof low oxygen does appear to provide a partial refugefor jumbo squid from mako sharks. However, the diet of
jumbo squid and their presence in the diet of mako sharksindicate that jumbo squid spend extensive periods of
time in the oxygenated surface waters of the SCB. Finally,we were unable to find a simple temporal correlationbetween changes in oxygen, the abundances of the sixmost common squid prey fish, and the increase of jumbosquid in the SCB. A more detailed examination of water mass properties is in progress.
ACKNOWLEDGEMENTSWe are grateful to a number of colleagues who made
valuable contributions to the study. Rich Charter and
154
8/3/2019 Vol 49 Vetter Web
http://slidepdf.com/reader/full/vol-49-vetter-web 14/15
VETTER ET AL.: SHORTFIN MAKO SHARK AND JUMBO SQUID INTERACTIONSCalCOFI Rep., Vol. 49, 2008
Bill Watson provided updated CalCOFI larval fish counts. John Field provided estimates of jumbo squid landingsfor the CPFV and hake trawl fisheries. John Hyde sharedvast squid fishing experiences with us. We also thank theNOAA Fisheries observers and CDGNF fishermen whohelped collect stomachs, and the crew and volunteersaboard the RV David Starr Jordan. We acknowledge our partners at TOPP with whom we have been collabo-rating on the study of mako shark migratory behavior.We thank Carol Kimbrell for assisting with compilationand editing and two anonymous reviewers for commentswhich greatly improved the manuscript.
LITERATURE CITEDBarnes, R. D. 1987. Invertebrate Zoology. Saunders College Publishing,
Philadelphia. 893 pp.Bernal, D., C. Sepulveda, and J. B. Graham. 2001. Water-tunnel studies of
heat balance in swimming mako sharks. J. Exp. Biol. 204:4043–4054.Brett, J. R., and T. D. D. Groves. 1979. Physiological energetics. In Fish
physiology, Vol. 8, Bioenergetics and growth. W. S. Hoar, D. J. Randall,and J. R. Brett, eds. Academic Press, New York, New York, U.S.A. pp.280–352.
Brill, R. W. 1994. A review of temperature and oxygen tolerance studies of tunas pertinent to fisheries oceanography, movement models and stockassessments. Fish. Oceanogr. 3:204–216.
Brill, R. W., K. A. Bigelow, M. K. Musyl, K. A. Fritsches, and E. J. Warrant.2005. Bigeye tuna (Thunnus obesus) behavior and physiology and their rel-evance to stock assessments and fishery biology. Col. Vol. Sci. Pap. ICCAT57:142–161.
Bushnell, P. G., and R. W. Brill. 1991. Responses of swimming skipjack(Katsuwonus pelamis) and yellowfin tuna (Thunnus albacares) to acutehypoxia, and a model of their cardio respiratory function. Physiol. Zool.64:787–811.
Cailliet, G. M., and D. W. Bedford. 1983. The biology of three pelagicsharks from California waters, and their emerging fisheries: A review. Calif.Coop. Oceanic Fish. Invest. Rep. 24:57–69.
Carey, F. G., J. M. Teal, and J. W. Kanwisher. 1981. The visceral temper-atures of mackerel sharks (Lamnidae). Physiol. Zool. 54:334–344.
Cauffope, G., and S. J. J. Heymans. 2005. Energy contents and conversionfactors for sea lion’s prey. Fish. Cent. Res. Rep. 13:225–237.
Chan, F., J. A. Barth, J. Lubchenco, A. Kirincich, H. Weeks, W. T. Peterson,and B. A. Menge. 2008. Emergence of anoxia in the California Currentlarge marine ecosystem. Science 319:920.
Chavez, F. P., J. Ryan, S. E. Lluch-Cota, and M. Niquen C. 2003. Fromanchovies to sardines and back: multidecadal change in the Pacific Ocean.Science 299:217–221.
Clothier, C. R. 1950. A key to some Southern California fishes, based onvertebral characters. Calif. Dep. Fish Game Bull. 79: 88 pp.
Compagno, L., S. L. Fowler, and M. Dando. 2005. A field guide to thesharks of the world. Collins, 496 pp.
Ehrhardt, N. M. 1991. Potential impact of a seasonal migratory jumbo squid(Dosidicus gigas) stocks on a Gulf of California sardine (Sardinops sagaxcaerulea) population. Bull. Mar. Sci. 49:325–332.
Field, D. B., T. R. Baumgartner, C. D. Charles, V. Ferreira-Bartrina, andM. D. Ohman. 2006. Planktonic foraminifera of the California Currentreflect 20th-century warming. Science 311:63–66.
Field, J. C., K. Baltz, A. J. Phillips, and W. A. Walker. 2007. Range ex-pansion and trophic interactions of the jumbo squid, Dosidicus gigas, in theCalifornia Current. Calif. Coop. Oceanic Fish. Invest. Rep. 48:131–146.
Gilly, W. F., U. Markaida, C. H. Baxter, B. A. Block, A. Boustany, L.Zeidberg, K. Reisenbichler, B. Robison, G. Bazzino, and C. Salinas. 2006.Vertical and horizontal migrations by the jumbo squid Dosidicus gigas re-vealed by electronic tagging. Mar. Ecol. Progr. Ser. 324:1–17.
Gooding, R. M., W. H. Neill, and A. E. Dizon. 1981. Respiration rates andlow-oxygen tolerance in skipjack tuna, Katsuwonus pelamis. Fish. Bull.,U.S. 79:31–48.
Graham, J. B., H. Dewar, N. C. Lai, W. R. Lowell, and S. M. Arce. 1990.Aspects of shark swimming performance determined using a large water tunnel. J. Exp. Biol. 151:175–192.
Grantham, B. A., F. Chan, K. J. Mielsen, D. S. Fox, J. A. Barth, A. Huyer, J. Lubchenco, B. A. Menge. 2004. Upwelling-driven nearshore hypoxiasignals ecosystem and oceanographic changes in the northeast Pacific.Nature. 429:749–754.
Hanan, D. A., D. B. Holts, and A. L. Coan. 1993. The California drift gillnet fishery for sharks and swordfish, 1981–82 through 1990–91. Fish Bull.,U.S. 175:1–95.
Holts, D. B., and D. W. Bedford. 1993. Horizontal and vertical movementsof the shortfin mako shark, Isurus oxyrinchus, in the southern CaliforniaBight. Aust. J. Mar. Freshwater Res. 44:901–909.
Holts, D. B., A. Julian, O. Sosa-Nishizaki, and N. W. Bartoo. 1998. Pelagicshark fisheries along the west coast of the United States and Baja California,Mexico. Fish. Res. 39:115–125.
Hyslop, E. J. 1980. Stomach contents analysis—a review of methods andtheir application. J. Fish Biol. 17:411–429.
Ingham, M. C., S. K. Cook, and K. A. Hausknecht. 1977. Oxycline char-acteristics and skipjack tuna distribution in the southeastern tropical Atlantic.Fish. Bull., U.S. 75:857–865.
Iverson, I. L. K., and L. Pinkas. 1971. A pictorial guide to beaks of certaineastern Pacific cephalopods. Calif. Dept. Fish Game Fish Bull. 152:83–105.
Jobling, M. 1994. Fish energetics. Chapman and Hall, London.
Klimley, A. P., S. C. Beavers, T. H. Curtis, and S. J. Jorgensen. 2002. Move-ments and swimming behavior of three species of sharks in La Jolla Canyon.California. Environ. Biol. Fishes 63:117–135.
Lasker, R. (Ed.) 1985. An egg production method for estimating spawningbiomass of pelagic fish: application to northern anchovy, Engraulis mordax.U.S. Dep. Commer., NOAA Tech. Rep., NMFS 36, 99 p.
Le Boeuf, B. J., D. E. Crocker, D. P. Costa, S. B. Blackwell, P. M. Webb,and D. S. Houser. 2000. Foraging ecology of northern elephant seals. Ecol.Monographs 70(3):353–382.
Lo, N. C. H. 2007. Daily larval production of Pacific hake (Merluccius pro-ductus) off California in 1951–2006. Calif. Coop. Oceanic Fish. Invest.Rep. 48:147–164.
Loefer, J. K., G. R. Sedberry, and J. C. McGovern. 2005. Vertical move-ments of a shortfin mako in the western North Atlantic as determined bypop-up satellite tagging. Southeastern Naturalist. 4(2):237–246.
Markaida, U., and F. G. Hochberg. 2005. Cephalopods in the diet of sword-fish (Xiphias gladius) Linnaeus caught off the west coast of Baja California,
Mexico. Pac. Sci. 59:25–41.Markaida, U., and O. Sosa-Nishizaki. 2001. Reproductive biology of jumbo
squid Dosidicus gigas in the Gulf of California, 1995–1997. Fish. Res.54:63–82.
Markaida, U., and O. Sosa-Nishizaki. 2003. Food and feeding habits of jumbosquid Dosidicus gigas (Cephalopoda: Ommastrephidae) from the Gulf of California, Mexico. J. Mar. Biol. Ass. U.K. 83:507–522.
Markaida, U., C. Q. Velazquez, and O. Sosa-Nishizaki. 2004. Age,growth and maturation of jumbo squid Dosidicus gigas (Cephalopoda:Ommastrephidae) from the Gulf of California, Mexico. Fish. Res. 66:31–47.
Markaida, U., W. F. Gilly, C. A. Salinas-Zavala, R. Rosas-Luis, and A. Booth.This volume. Food and feeding of jumbo squid Dosidicus gigas in the Gulf of California during 2005–2007. Calif. Coop. Oceanic Fish. Invest. Rep.
Mearns, A. J., D. R. Young, R. J. Olson, and H. A. Schafer. 1981. Trophicstructure and the cesium-potassium ratio in pelagic food webs. Calif. Coop.Oceanic Fish. Invest. Rep. 22:99–110.
Moser, H. G., R. I. Charter, P. E. Smith, D. A. Ambrose, W. Watson, S.
R. Charter, and E. M. Sandknop. 2001. Distributional atlas of fish larvaeand eggs in the Southern California Bight region: 1951–1998. CalCOFIAtlas No. 34.
Mullins, H. T., J. B. Thompson, K. McDougall, and T. L. Vercoutere. 1985.Oxygen-minimum zone edge effects: evidence from the central Californiacoastal upwelling system. Geology (Boulder, Colorado) 13:491–494.
Myers, R. A., J. K. Baum, T. D. Shepherd, S. P. Powers, and C. H. Peterson.2007. Cascading effects of the loss of apex predatory sharks from a coastalocean. Science 315:1846–1850.
Nesis, K. N. 1983. Dosidicus gigas. In Cephalopod life cycles, Vol. 1, P. R.Boyle, ed. Academic Press, pp. 215–231.
Nesis, K. N. 1987. Cephalopods of the world: squids, cuttlefishes, octopusesand allies. T.F.H. Publications, Neptune City, U.S.A. 351 pp.
155
8/3/2019 Vol 49 Vetter Web
http://slidepdf.com/reader/full/vol-49-vetter-web 15/15
VETTER ET AL.: SHORTFIN MAKO SHARK AND JUMBO SQUID INTERACTIONSCalCOFI Rep., Vol. 49, 2008
Nigmatullin, C. M., K. N. Nesis, and A. I. Arkhipkin. 2001. A review of thebiology of the jumbo squid Dosidicus gigas (Cephalopoda: Ommastrephidae).Fish. Res. 54:9–19.
O’Brien, J. W., and J. S. Sunada. 1994. A review of the southern Californiaexperimental drift longline fishery for sharks, 1988–1991. Calif. Coop.Oceanic Fish. Invest. Rep. 35:222–229.
Olson, R. J., and J. W. Young (eds.). 2007. The role of squid in open oceanecosystems. Report of a GLOBEC-CLIOTOP/PFRP workshop, 16–17
November 2006, Honolulu, Hawaii, U.S.A. GLOBEC Report 24. 94 pp.PFMC. 2003. Pacific Fishery Management Council Fishery Management
Plan and Environmental Impact Statement for U.S. West Coast Fisheriesfor Highly Migratory Species. Portland, OR.
PFMC. 2007. Status of the U.S. West Coast Fisheries for Highly MigratorySpecies Through 2006, Stock Assessment and Fishery Evaluation, Sept.2007. Portland, OR.
Preti, A., S. E. Smith, and D. A. Ramon. 2001. Feeding habits of the com-mon thresher shark ( Alopias vulpinus) sampled from the California-baseddrift gillnet fishery, 1998–1999. Calif. Coop. Oceanic Fish. Invest. Rep.42:145–152.
Preti, A., S. Kohin, H. Dewar, and D. Ramon. This volume. Feeding habitsof the bigeye thresher shark ( Alopias superciliosus) sampled from the California-based drift gillnet fishery. Calif. Coop. Oceanic Fish. Invest. Rep.
Prince, E. D., and C. P. Goodyear. 2006. Hypoxia-based habitat compres-sion of tropical pelagic fishes. Fish. Oceanogr. 15:451–464.
Rafinesque, C. 1810. Caratteri di alcuni nuovi generi e nuove specie
d’animali e piante della Sicilia. Palermo, Italy. 105 pp.Ralston, S., J. R. Bence, M. B. Eldridge, and W. H. Lenarz. 2003. An
approach to estimating rockfish biomass based on larval production, withapplication to Sebastes jordani . Fish. Bull. 101:129–1 46.
Randall, D. J. 1970. Gas exchange in fish. In Fish Physiology, Vol. 4, Thenervous system, circulation, and respiration, W. S. Hoar and D. J. Randall,eds. NY: Academic Press, pp. 253–292.
Rodhouse, P. G. This volume. Large scale range expansion and variabilityin ommastrephid squid populations: a short review. Calif. Coop. OceanicFish. Invest. Rep.
Roemmich, D., and J. McGowan. 1995. Climatic warming and the declineof zooplankton in the California Current. Science. 267:1324–1326.
Schaefer, K. M., and D. W. Fuller. 2002. Movements, behavior, and habi-tat selection of bigeye tuna (Thunnus obesus) in the eastern equatorial Pacific,ascertained through archival tags. Fish. Bull. 100:765–788.
Schaefer, K. M., D. W. Fuller, and B. A. Block. 2007. Movements, behav-ior, and habitat utilization of yellowfin tuna (Thunnus albacares) in the
northeastern Pacific Ocean, ascertained through archival tag data. Mar.Biol. 152:503–525.
Schindler, D. E., T. E. Essington, J. F. Kitchell, C. Boggs, and R. Hilborn.2002. Sharks and tunas: Fisheries impacts on predators with contrastinglife histories. Ecol. Appl. 12:735–748.
Schmidt-Nielson, K. 1997. Animal physiology: adaptation and environment.Cambridge Univ. Press, New York, NY. 607 pp.
Sepulveda, C. A., S. Kohin, C. Chan, R. Vetter, and J. B. Graham. 2004.Movement patterns, depth preferences, and stomach temperatures of free-swimming juvenile mako sharks, Isurus oxyrinchus, in the Southern California
Bight. Mar. Biol. 145:191–199.Sepulveda, C. A., J. B. Graham, and D. Bernal. 2007. Aerobic metabolic
rates of swimming juvenile mako sharks, Isurus oxyrinchus. Mar. Biol.152:1087–1094.
Stillwell, C. E., and N. E. Kohler. 1982. Food, feeding habits, and estimatesof daily ration of the shortfin mako ( Isurus oxyrinchus) in the northwestAtlantic. Can. J. Fish. Aquat. Sci. 39:407–414.
Stramma, L., G. C. Johnson, J. Sprintall, and V. Mohrholz. 2008. Expandingoxygen-minimum zones in the tropical oceans. Science 320:655–658.
Tremblay, Y., A. J. Roberts, and D. P. Costa. 2007. Fractal landscape method:an alternative approach to measuring area-restricted searching behavior.
J. Exp. Biol. 210:935–945.Vetter, R. D., and E. A. Lynn. 1997. Bathymetric demography, enzyme ac-
tivity patterns, and bioenergetics of deep-living scorpaenid fishes (generaSebastes and Sebastolobus): paradigms revisited. Mar. Ecol. Prog. Ser.155:173–188.
Vetter, R. D., E. A. Lynn, M. Garza, and A. S. Costa. 1994. Depth zona-
tion and metabolic adaptation in Dover sole, Microstomus pacificus, and other deep-living flatfishes: factors that affect the sole. Mar. Biol. 120:145–149.
Watters, G. M., R. J. Olson, J. C. Field, and T. E. Essington. 2008. Rangeexpansion of the Humboldt squid was not caused by tuna fishing. Proc.Nat. Acad. Sci. U.S.A. 105:E5.
Williams, T. M. 1999. The evolution of cost efficient swimming in marinemammals: limits to energetic optimization. Phil. Trans. R. Soc. Lond.354:193–201.
Wormuth, J. H. 1976. The biogeography and numerical taxonomy of theoegopsid squid family Ommastrephidae in the Pacific Ocean. Bull. ScrippsInst. Ocean. 23:90 pp.
Zeidberg, L. D., and B. H. Robison. 2007. Invasive range expansion by theHumboldt squid, Dosidicus gigas, in the eastern North Pacific. Proc. Nat.Acad. Sci. U.S.A. 104:12948–12950.
Zeidberg, L. D., and B. H. Robison. 2008. Reply to Watters et al.: Rangeexpansion of the Humboldt squid. Proc. Nat. Acad. Sci. U.S.A. 105:E6.