Embed Size (px)
Citation preview
Company Presentation
November 8, 2017
Forward-Looking Statements
This presentation includes “forward-looking statements” within the meaning of Section 27A of the Securities Act of 1933, as amended, and Section 21E of the Securities Exchange Act of 1934, as amended. Forward-looking statements can be identified by terminology such as “may,” will,” “could,” “should,” “expect,” “plan,” “project,” “forecast,” “intend,” “anticipate,” “believe,” “estimate,” “predict,” “potential,” “pursue,” “target,” “outlook,” “continue” the negative of such terms or other comparable terminology. All statements, other than historical facts included in this presentation, that address activities, events or developments that WildHorse Resource Development Corporation (WRD) expects or anticipates will or may occur in the future and such things as WRD’s future capital expenditures (including the amount and nature thereof), business strategy and measures to implement strategy, competitive strengths, goals, expansion and growth of WRD’s business and operations, plans, market conditions, references to future success, references to intentions as to future matters and other such matters are forward-looking statements. All forward looking statements speak only as of the date of this presentation. Although WRD believes that the plans, intentions and expectations reflected in or suggested by the forward-looking statements are reasonable, there is no assurance that these plans, intentions or expectations will be achieved. Therefore, actual outcomes and results could materially differ from what is expressed, implied or forecast in such statements. WRD cautions you that these forward-looking statements are subject to risks and uncertainties, most of which are difficult to predict and many of which are beyond WRD’s control, incident to the exploration for and development, production, gathering and sale of natural gas and oil. These risks include, but are not limited to: commodity price volatility; inflation; lack of availability of drilling and production equipment and services; environmental risks; drilling and other operating risks; regulatory changes; the uncertainty inherent in estimating natural gas and oil reserves and in projecting future rates of production, cash flow and access to capital; and the timing of development expenditures. Information concerning these and other factors can be found in WRD’s filings with the Securities and Exchange Commission (SEC), including its Forms 10-K, 10-Q and 8-K. Consequently, all of the forward-looking statements made in this presentation are qualified by these cautionary statements and there can be no assurances that the actual results or developments anticipated by WRD will be realized, or even if realized, that they will have the expected consequences to or effects on WRD, its business or operations. WRD has no intention, and disclaims any obligation, to update or revise any forward-looking statements, whether as a result of new information, future results or otherwise. Initial production rates subject to decline over time and should not be regarded as reflective of sustained production levels.
2
I. Company Overview
3
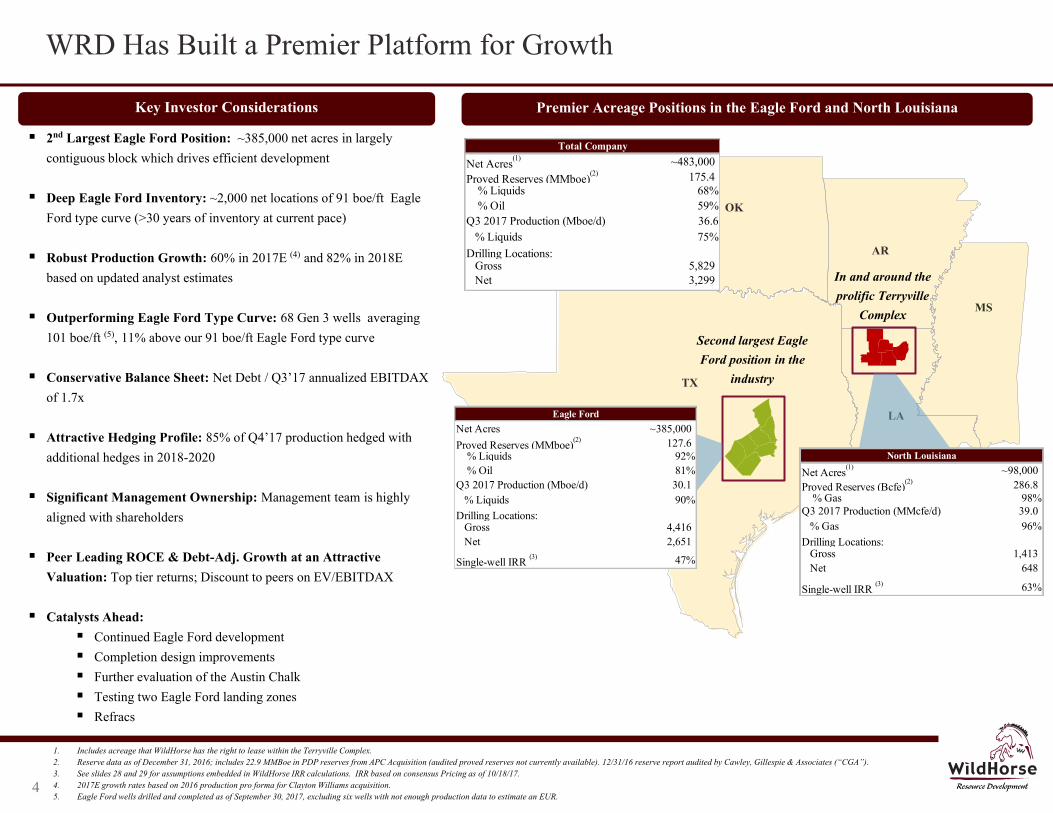
WRD Has Built a Premier Platform for Growth
1. Includes acreage that WildHorse has the right to lease within the Terryville Complex. 2. Reserve data as of December 31, 2016; includes 22.9 MMBoe in PDP reserves from APC Acquisition (audited proved reserves not currently available). 12/31/16 reserve report audited by Cawley, Gillespie & Associates (“CGA”). 3. See slides 28 and 29 for assumptions embedded in WildHorse IRR calculations. IRR based on consensus Pricing as of 10/18/17. 4. 2017E growth rates based on 2016 production pro forma for Clayton Williams acquisition. 5. Eagle Ford wells drilled and completed as of September 30, 2017, excluding six wells with not enough production data to estimate an EUR.
Red: 80
Green: 0
Blue: 0
Red: 0
Green: 60
Blue: 113
Red: 191
Green: 191
Blue: 191
Red: 128
Green: 205
Blue: 237
Red: 17
Green: 143
Blue: 255
Red: 255
Green: 212
Blue: 212
Red: 255
Green: 232
Blue: 167
Red: 191
Green: 191
Blue: 191
Red: 167
Green: 207
Blue: 157
Red: 176
Green: 218
Blue: 255
Premier Acreage Positions in the Eagle Ford and North Louisiana
TX
OK
AR
MS
LA
Second largest Eagle Ford position in the
industry
In and around the prolific Terryville
Complex
4
2nd Largest Eagle Ford Position: ~385,000 net acres in largely contiguous block which drives efficient development
Deep Eagle Ford Inventory: ~2,000 net locations of 91 boe/ft Eagle
Ford type curve (>30 years of inventory at current pace)
Robust Production Growth: 60% in 2017E (4) and 82% in 2018E based on updated analyst estimates
Outperforming Eagle Ford Type Curve: 68 Gen 3 wells averaging
101 boe/ft (5), 11% above our 91 boe/ft Eagle Ford type curve Conservative Balance Sheet: Net Debt / Q3’17 annualized EBITDAX
of 1.7x
Attractive Hedging Profile: 85% of Q4’17 production hedged with additional hedges in 2018-2020
Significant Management Ownership: Management team is highly
aligned with shareholders
Peer Leading ROCE & Debt-Adj. Growth at an Attractive Valuation: Top tier returns; Discount to peers on EV/EBITDAX
Catalysts Ahead: Continued Eagle Ford development Completion design improvements Further evaluation of the Austin Chalk Testing two Eagle Ford landing zones Refracs
Key Investor Considerations
Total Company
Net Acres(1) ~483,000
Proved Reserves (MMboe)(2) 175.4
% Liquids 68% % Oil 59%Q3 2017 Production (Mboe/d) 36.6 % Liquids 75%Drilling Locations: Gross 5,829 Net 3,299
Eagle Ford
Net Acres ~385,000Proved Reserves (MMboe)
(2) 127.6 % Liquids 92% % Oil 81%Q3 2017 Production (Mboe/d) 30.1 % Liquids 90%Drilling Locations: Gross 4,416 Net 2,651
Single-well IRR (3) 47%
North Louisiana
Net Acres(1) ~98,000
Proved Reserves (Bcfe)(2) 286.8
% Gas 98%Q3 2017 Production (MMcfe/d) 39.0 % Gas 96%Drilling Locations: Gross 1,413 Net 648
Single-well IRR (3) 63%
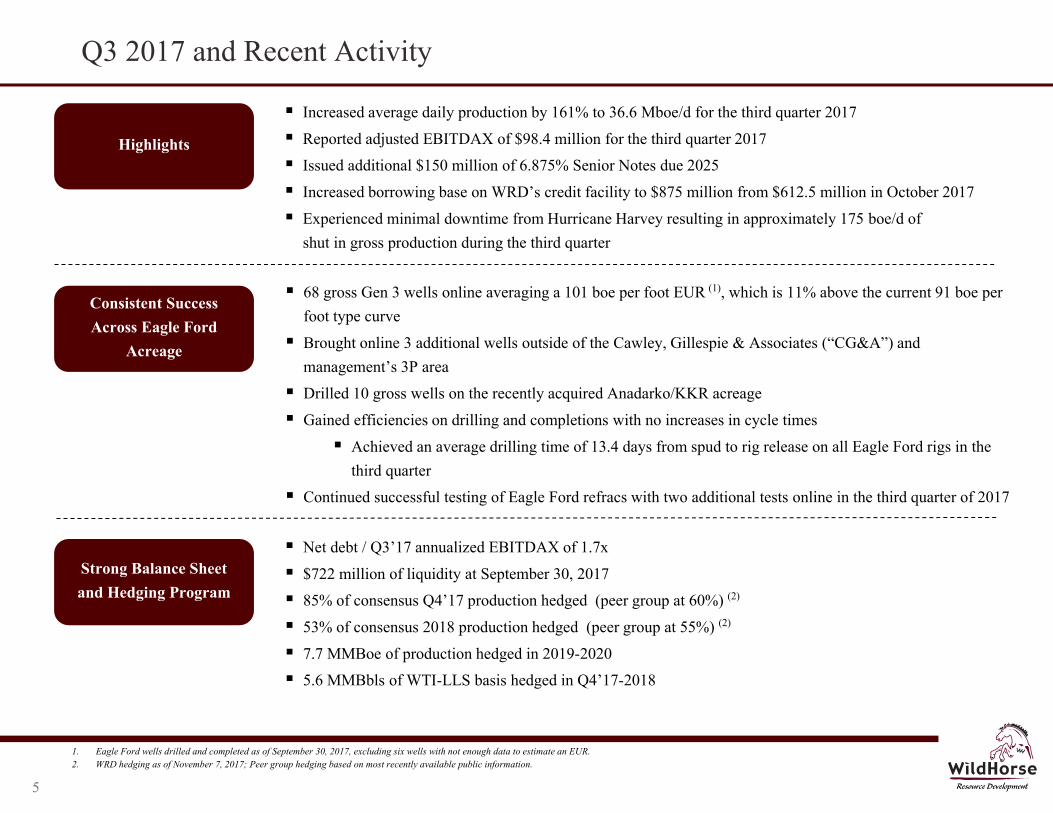
Q3 2017 and Recent Activity
Increased average daily production by 161% to 36.6 Mboe/d for the third quarter 2017
Reported adjusted EBITDAX of $98.4 million for the third quarter 2017
Issued additional $150 million of 6.875% Senior Notes due 2025
Increased borrowing base on WRD’s credit facility to $875 million from $612.5 million in October 2017
Experienced minimal downtime from Hurricane Harvey resulting in approximately 175 boe/d of shut in gross production during the third quarter
68 gross Gen 3 wells online averaging a 101 boe per foot EUR (1), which is 11% above the current 91 boe per foot type curve
Brought online 3 additional wells outside of the Cawley, Gillespie & Associates (“CG&A”) and management’s 3P area
Drilled 10 gross wells on the recently acquired Anadarko/KKR acreage
Gained efficiencies on drilling and completions with no increases in cycle times
Achieved an average drilling time of 13.4 days from spud to rig release on all Eagle Ford rigs in the third quarter
Continued successful testing of Eagle Ford refracs with two additional tests online in the third quarter of 2017
Highlights
Consistent Success Across Eagle Ford
Acreage
Red: 80
Green: 0
Blue: 0
Red: 0
Green: 60
Blue: 113
Red: 191
Green: 191
Blue: 191
Red: 128
Green: 205
Blue: 237
Red: 17
Green: 143
Blue: 255
Red: 255
Green: 212
Blue: 212
Red: 255
Green: 232
Blue: 167
Red: 191
Green: 191
Blue: 191
Red: 167
Green: 207
Blue: 157
Red: 176
Green: 218
Blue: 255
5
1. Eagle Ford wells drilled and completed as of September 30, 2017, excluding six wells with not enough data to estimate an EUR. 2. WRD hedging as of November 7, 2017; Peer group hedging based on most recently available public information.
Net debt / Q3’17 annualized EBITDAX of 1.7x
$722 million of liquidity at September 30, 2017
85% of consensus Q4’17 production hedged (peer group at 60%) (2)
53% of consensus 2018 production hedged (peer group at 55%) (2)
7.7 MMBoe of production hedged in 2019-2020
5.6 MMBbls of WTI-LLS basis hedged in Q4’17-2018
Strong Balance Sheet and Hedging Program
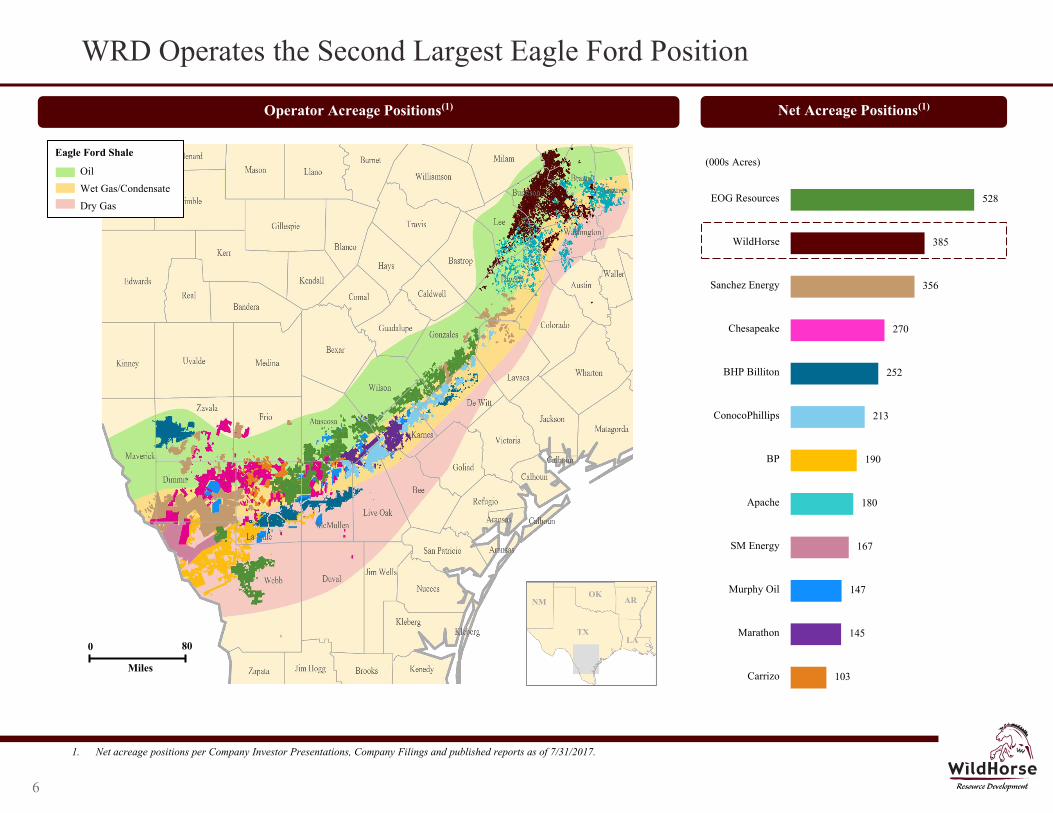
103
145
147
167
180
190
213
252
270
356
385
528
Carrizo
Marathon
Murphy Oil
SM Energy
Apache
BP
ConocoPhillips
BHP Billiton
Chesapeake
Sanchez Energy
WildHorse
EOG Resources
(000s Acres)
Net Acreage Positions(1) Operator Acreage Positions(1)
1. Net acreage positions per Company Investor Presentations, Company Filings and published reports as of 7/31/2017.
WRD Operates the Second Largest Eagle Ford Position
TX LA
AR OK
NM
0 80
Miles
Oil
Wet Gas/Condensate
Dry Gas
Eagle Ford Shale
Hawkwood
Apache
6
1,996 1,996
655
493
155
2,651
648
0
500
1,000
1,500
2,000
2,500
3,000
3,500
Eagle FordEUR (91 Boe/ft)
Other RCT Other TotalLocations
Net Locations(1)
1,910
2,336 2,350 2,350
219
591 646 648
2,129
2,927 2,996 2,998
0
500
1,000
1,500
2,000
2,500
3,000
3,500
$35.00 / $2.00 $45.00 / $2.50 $55.00 / $3.00 $65.00 / $3.50
Eagle Ford North Louisiana
Net Locations
Deep Inventory of Economic Locations
1. As of May 11, 2017, we identified 3,299 net horizontal drilling locations. The locations were specifically identified by management as an estimation of our multi-year drilling activities based on evaluation of applicable geologic and engineering data. We have estimated our drilling locations based on well spacing assumptions and upon the evaluation of our horizontal drilling results and those of other operators across our acreage, combined with our interpretation of available geologic and engineering data. The drilling locations on which we actually drill will depend on the availability of capital, regulatory approval, commodity prices, costs, actual drilling results and other factors. Of our 3,299 estimated drilling locations, 201, 342 and 1,156 are associated with CGA’s proved, probable and possible reserves as of December 31, 2016. Accordingly, 1,599 of these locations are within management’s 3P area and do not have any reserves assigned to them which includes 949 locations associated with the Acquisition. There are no assurances that these locations will perform like we expect. All of our assumptions with respect to our drilling locations, including estimated ultimate recoveries, expected costs to drill and complete, internal rates of return and economic break-even prices are speculative in nature and may prove to be inaccurate.
2. The ~130,000 net acres are located outside of CGA’s and management’s 3P reserve area and currently have no assigned locations.
Net Horizontal Locations by Area Inventory Breakevens (10% Pre-tax IRR)
Multiple decades of drilling inventory across Eagle Ford and North Louisiana based
on net locations(1)
3,299 Net Locations
Additional upside locations in:
~130,000 Eagle Ford net acres with no locations assigned – actively delineating(2)
Austin Chalk, Buda, and Georgetown across much of our Eagle Ford acreage
Testing a stack/stagger development of the Upper and Lower Eagle Ford
Eagle Ford North Louisiana
Eagle Ford Locations
North Louisiana Locations
7
0.0x
1.0x
2.0x
3.0x
4.0x
5.0x
6.0x
7.0x
8.0x
9.0x
0%
5%
10%
15%
20%
25%
EV
/EB
ITD
AX
RO
CE
ROCE
EV / EBITDAX
$0
$5
$10
$15
$20
$25
$30
$35
0% 20% 40% 60% 80% 100%
Cas
h M
argi
n ($
/Boe
)
% Oil Production
0%
15%
30%
45%
60%
75%
SRC
IFA
NG
WR
DR
SPP PE
WPX LPI
CN
XPX
DE
GN
CX
OX
EC
CL
RM
TD
RC
OG
OA
SE
OG
AR
RR
CO
XY
MR
O
Deb
t-A
djus
ted
Prod
ucti
on G
row
th
0%
20%
40%
60%
80%
CL
R
WR
D
SM
RSP
P
GPO
R
CO
G
EO
G
OA
S
DV
N
EPE
NFX
APC
WL
L
SWN
WPX
RR
C
EC
R
AR
CH
K
EB
ITD
AX
Mar
gin
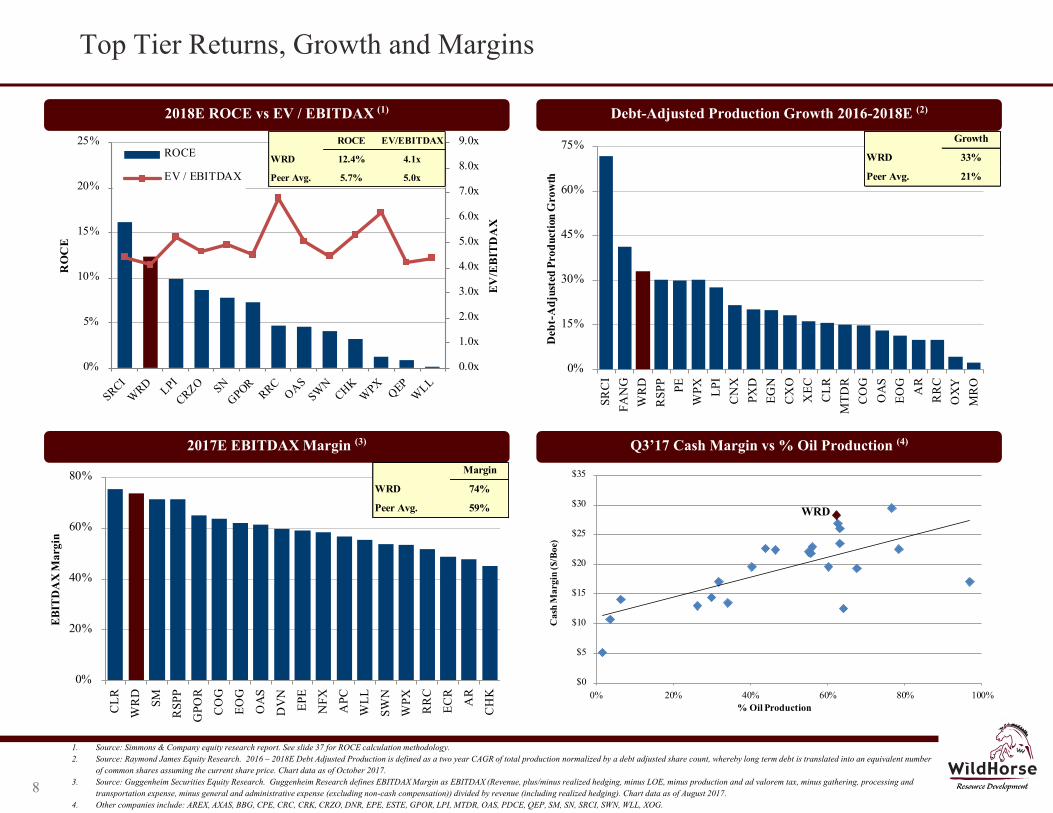
Top Tier Returns, Growth and Margins
8
1. Source: Simmons & Company equity research report. See slide 37 for ROCE calculation methodology. 2. Source: Raymond James Equity Research. 2016 – 2018E Debt Adjusted Production is defined as a two year CAGR of total production normalized by a debt adjusted share count, whereby long term debt is translated into an equivalent number
of common shares assuming the current share price. Chart data as of October 2017. 3. Source: Guggenheim Securities Equity Research. Guggenheim Research defines EBITDAX Margin as EBITDAX (Revenue, plus/minus realized hedging, minus LOE, minus production and ad valorem tax, minus gathering, processing and
transportation expense, minus general and administrative expense (excluding non-cash compensation)) divided by revenue (including realized hedging). Chart data as of August 2017. 4. Other companies include: AREX, AXAS, BBG, CPE, CRC, CRK, CRZO, DNR, EPE, ESTE, GPOR, LPI, MTDR, OAS, PDCE, QEP, SM, SN, SRCI, SWN, WLL, XOG.
ROCE EV/EBITDAX
WRD 12.4% 4.1x
Peer Avg. 5.7% 5.0x
2018E ROCE vs EV / EBITDAX (1) Debt-Adjusted Production Growth 2016-2018E (2)
Q3’17 Cash Margin vs % Oil Production (4)
WRD
2017E EBITDAX Margin (3)
Margin
WRD 74%
Peer Avg. 59%
Growth
WRD 33%
Peer Avg. 21%
60%
82%
47%
30%
0%
20%
40%
60%
80%
100%
2017E Growth Rate 2018E Growth Rate
WRD Peer Group
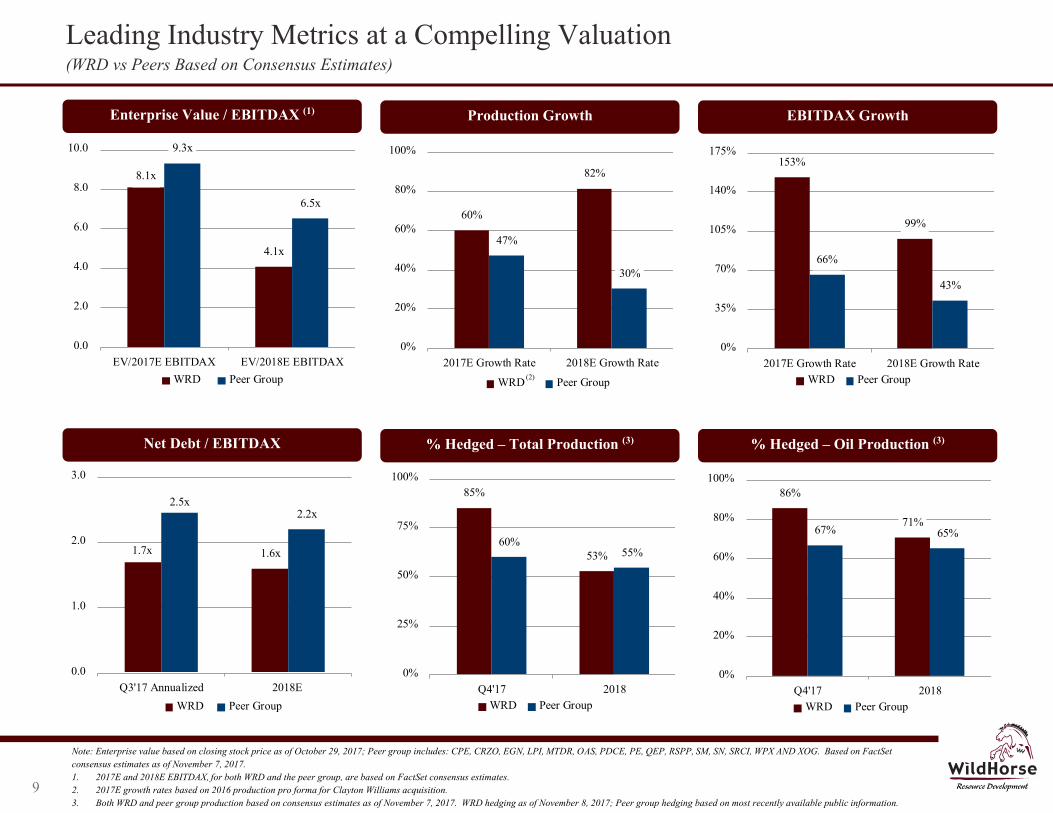
Leading Industry Metrics at a Compelling Valuation (WRD vs Peers Based on Consensus Estimates)
9
Enterprise Value / EBITDAX (1)
Note: Enterprise value based on closing stock price as of October 29, 2017; Peer group includes: CPE, CRZO, EGN, LPI, MTDR, OAS, PDCE, PE, QEP, RSPP, SM, SN, SRCI, WPX AND XOG. Based on FactSet consensus estimates as of November 7, 2017. 1. 2017E and 2018E EBITDAX, for both WRD and the peer group, are based on FactSet consensus estimates. 2. 2017E growth rates based on 2016 production pro forma for Clayton Williams acquisition. 3. Both WRD and peer group production based on consensus estimates as of November 7, 2017. WRD hedging as of November 8, 2017; Peer group hedging based on most recently available public information.
Production Growth EBITDAX Growth
Net Debt / EBITDAX % Hedged – Total Production (3) % Hedged – Oil Production (3)
(2)
8.1x
4.1x
9.3x
6.5x
0.0
2.0
4.0
6.0
8.0
10.0
EV/2017E EBITDAX EV/2018E EBITDAXWRD Peer Group
153%
99%
66%
43%
0%
35%
70%
105%
140%
175%
2017E Growth Rate 2018E Growth RateWRD Peer Group
86%
71%67% 65%
0%
20%
40%
60%
80%
100%
Q4'17 2018WRD Peer Group
85%
53%60%
55%
0%
25%
50%
75%
100%
Q4'17 2018WRD Peer Group
1.7x 1.6x
2.5x2.2x
0.0
1.0
2.0
3.0
Q3'17 Annualized 2018E
WRD Peer Group
II. Eagle Ford Overview
10
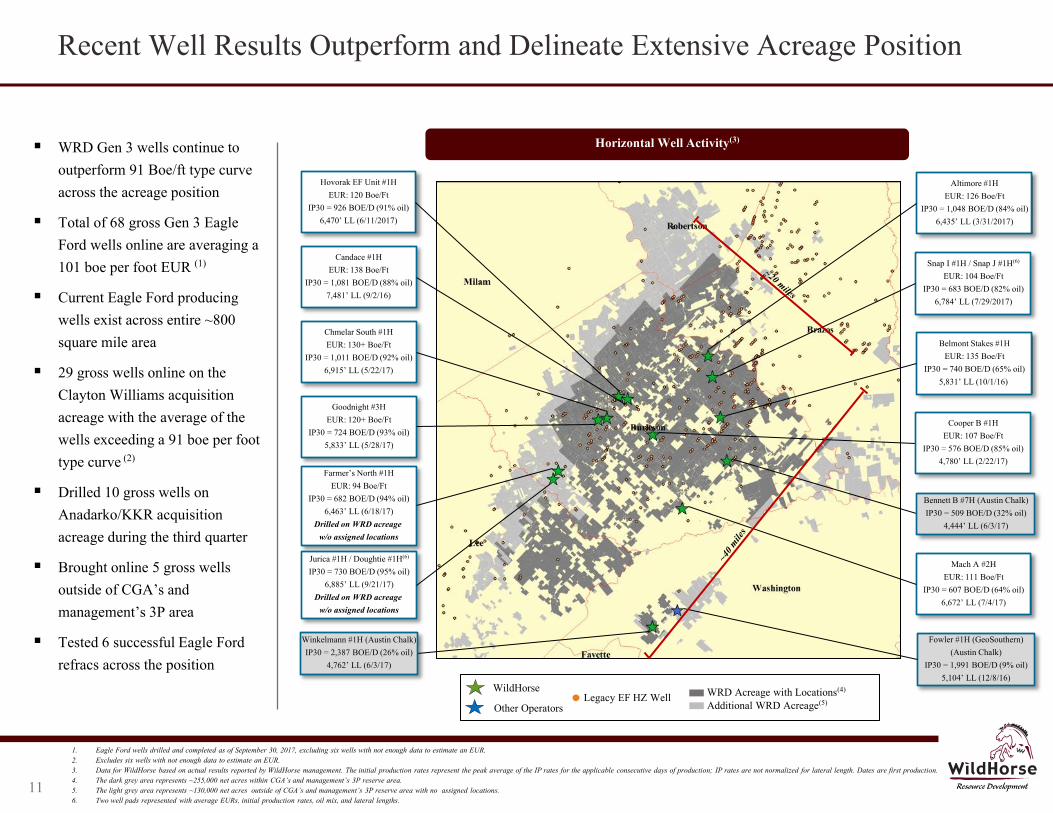
WRD Gen 3 wells continue to outperform 91 Boe/ft type curve across the acreage position
Total of 68 gross Gen 3 Eagle Ford wells online are averaging a 101 boe per foot EUR (1)
Current Eagle Ford producing wells exist across entire ~800 square mile area
29 gross wells online on the Clayton Williams acquisition acreage with the average of the wells exceeding a 91 boe per foot type curve (2)
Drilled 10 gross wells on Anadarko/KKR acquisition acreage during the third quarter
Brought online 5 gross wells outside of CGA’s and management’s 3P area
Tested 6 successful Eagle Ford refracs across the position
1. Eagle Ford wells drilled and completed as of September 30, 2017, excluding six wells with not enough data to estimate an EUR. 2. Excludes six wells with not enough data to estimate an EUR. 3. Data for WildHorse based on actual results reported by WildHorse management. The initial production rates represent the peak average of the IP rates for the applicable consecutive days of production; IP rates are not normalized for lateral length. Dates are first production. 4. The dark grey area represents ~255,000 net acres within CGA’s and management’s 3P reserve area. 5. The light grey area represents ~130,000 net acres outside of CGA’s and management’s 3P reserve area with no assigned locations. 6. Two well pads represented with average EURs, initial production rates, oil mix, and lateral lengths.
Red: 80
Green: 0
Blue: 0
Red: 0
Green: 60
Blue: 113
Red: 191
Green: 191
Blue: 191
Red: 128
Green: 205
Blue: 237
Red: 17
Green: 143
Blue: 255
Red: 255
Green: 212
Blue: 212
Red: 255
Green: 232
Blue: 167
Red: 191
Green: 191
Blue: 191
Red: 167
Green: 207
Blue: 157
Red: 176
Green: 218
Blue: 255
Recent Well Results Outperform and Delineate Extensive Acreage Position
Horizontal Well Activity(3)
Candace #1H EUR: 138 Boe/Ft
IP30 = 1,081 BOE/D (88% oil) 7,481’ LL (9/2/16)
Mach A #2H EUR: 111 Boe/Ft
IP30 = 607 BOE/D (64% oil) 6,672’ LL (7/4/17)
Hovorak EF Unit #1H EUR: 120 Boe/Ft
IP30 = 926 BOE/D (91% oil) 6,470’ LL (6/11/2017)
Belmont Stakes #1H EUR: 135 Boe/Ft
IP30 = 740 BOE/D (65% oil) 5,831’ LL (10/1/16)
11
Chmelar South #1H EUR: 130+ Boe/Ft
IP30 = 1,011 BOE/D (92% oil) 6,915’ LL (5/22/17)
Goodnight #3H EUR: 120+ Boe/Ft
IP30 = 724 BOE/D (93% oil) 5,833’ LL (5/28/17)
Farmer’s North #1H EUR: 94 Boe/Ft
IP30 = 682 BOE/D (94% oil) 6,463’ LL (6/18/17)
Drilled on WRD acreage w/o assigned locations
Cooper B #1H EUR: 107 Boe/Ft
IP30 = 576 BOE/D (85% oil) 4,780’ LL (2/22/17)
Winkelmann #1H (Austin Chalk) IP30 = 2,387 BOE/D (26% oil)
4,762’ LL (6/3/17)
Altimore #1H EUR: 126 Boe/Ft
IP30 = 1,048 BOE/D (84% oil) 6,435’ LL (3/31/2017)
Snap I #1H / Snap J #1H(6)
EUR: 104 Boe/Ft IP30 = 683 BOE/D (82% oil)
6,784’ LL (7/29/2017)
Bennett B #7H (Austin Chalk) IP30 = 509 BOE/D (32% oil)
4,444’ LL (6/3/17)
Jurica #1H / Doughtie #1H(6)
IP30 = 730 BOE/D (95% oil) 6,885’ LL (9/21/17)
Drilled on WRD acreage w/o assigned locations
Fowler #1H (GeoSouthern) (Austin Chalk)
IP30 = 1,991 BOE/D (9% oil) 5,104’ LL (12/8/16)
Additional WRD Acreage(5) WRD Acreage with Locations(4) WildHorse
Legacy EF HZ Well Other Operators
0
20
40
60
80
100
120
140
0 30 60 90 120 150 180 210 240 270 300 330 360
Cum
ulat
ive
Prod
uctio
n (M
Boe
)
Days
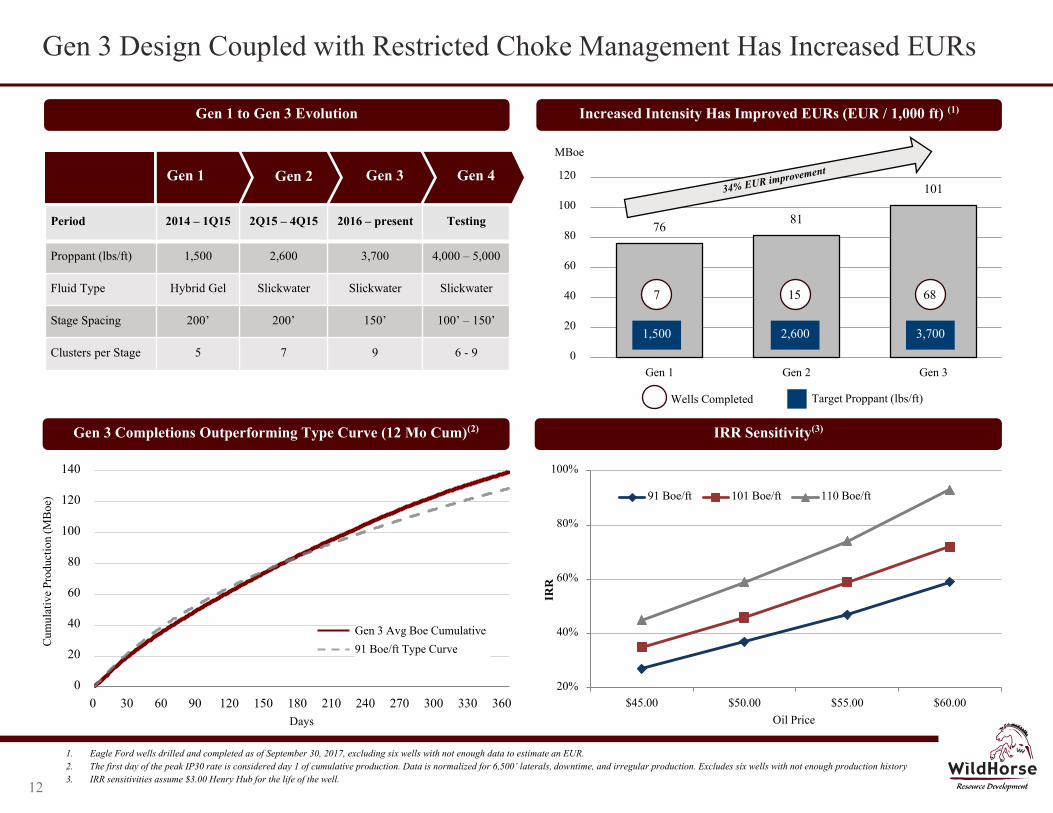
Gen 3 Design Coupled with Restricted Choke Management Has Increased EURs
Gen 3 Completions Outperforming Type Curve (12 Mo Cum)(2) IRR Sensitivity(3)
76 81
101
0
20
40
60
80
100
120
Gen 1 Gen 2 Gen 3
MBoe
15 68
1,500 2,600 3,700
7
Wells Completed Target Proppant (lbs/ft)
Red: 80
Green: 0
Blue: 0
Red: 0
Green: 60
Blue: 113
Red: 191
Green: 191
Blue: 191
Red: 128
Green: 205
Blue: 237
Red: 17
Green: 143
Blue: 255
Red: 255
Green: 212
Blue: 212
Red: 255
Green: 232
Blue: 167
Red: 191
Green: 191
Blue: 191
Red: 167
Green: 207
Blue: 157
Red: 176
Green: 218
Blue: 255
1. Eagle Ford wells drilled and completed as of September 30, 2017, excluding six wells with not enough data to estimate an EUR. 2. The first day of the peak IP30 rate is considered day 1 of cumulative production. Data is normalized for 6,500’ laterals, downtime, and irregular production. Excludes six wells with not enough production history 3. IRR sensitivities assume $3.00 Henry Hub for the life of the well.
12
Period 2014 – 1Q15 2Q15 – 4Q15 2016 – present Testing
Proppant (lbs/ft) 1,500 2,600 3,700 4,000 – 5,000
Fluid Type Hybrid Gel Slickwater Slickwater Slickwater
Stage Spacing 200’ 200’ 150’ 100’ – 150’
Clusters per Stage 5 7 9 6 - 9
Gen 1 Gen 2 Gen 3 Gen 4
91 Boe/ft Type Curve
Gen 3 Avg Boe Cumulative
Gen 1 to Gen 3 Evolution Increased Intensity Has Improved EURs (EUR / 1,000 ft) (1)
20%
40%
60%
80%
100%
$45.00 $50.00 $55.00 $60.00
IRR
Oil Price
91 Boe/ft 101 Boe/ft 110 Boe/ft
Burleson
Lee
Washington
Freshwater Pond
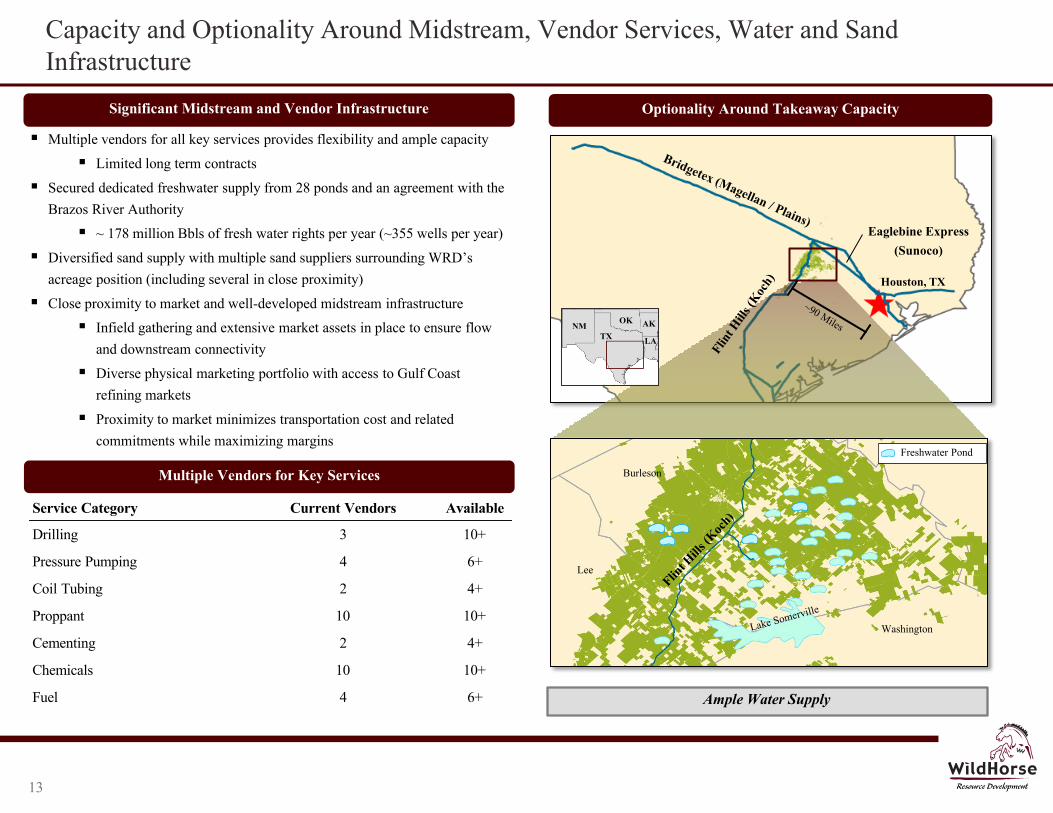
Capacity and Optionality Around Midstream, Vendor Services, Water and Sand Infrastructure
Red: 80
Green: 0
Blue: 0
Red: 0
Green: 60
Blue: 113
Red: 191
Green: 191
Blue: 191
Red: 128
Green: 205
Blue: 237
Red: 17
Green: 143
Blue: 255
Red: 255
Green: 212
Blue: 212
Red: 255
Green: 232
Blue: 167
Red: 191
Green: 191
Blue: 191
Red: 167
Green: 207
Blue: 157
Red: 176
Green: 218
Blue: 255
Optionality Around Takeaway Capacity Significant Midstream and Vendor Infrastructure
Multiple Vendors for Key Services
Multiple vendors for all key services provides flexibility and ample capacity
Limited long term contracts
Secured dedicated freshwater supply from 28 ponds and an agreement with the Brazos River Authority
~ 178 million Bbls of fresh water rights per year (~355 wells per year)
Diversified sand supply with multiple sand suppliers surrounding WRD’s acreage position (including several in close proximity)
Close proximity to market and well-developed midstream infrastructure
Infield gathering and extensive market assets in place to ensure flow and downstream connectivity
Diverse physical marketing portfolio with access to Gulf Coast refining markets
Proximity to market minimizes transportation cost and related commitments while maximizing margins
Houston, TX
TX NM
OK
LA
AK
Ample Water Supply
Eaglebine Express (Sunoco)
13
Service Category Current Vendors Available
Drilling 3 10+
Pressure Pumping 4 6+
Coil Tubing 2 4+
Proppant 10 10+
Cementing 2 4+
Chemicals 10 10+
Fuel 4 6+
Source: Corporate Filings and Company Data. 1. Differentials based on average realized $/Bbl for the three months ended 9/30/17. Companies included in Permian: FANG, LPI, RSPP, CXO; Companies included in Eagle Ford: CRZO, SN;
Companies included in DJ Basin: PDCE and SRCI (XOG excluded due to timing of earning release); Companies included in Bakken: CLR, WLL; Companies included in SCOOP / STACK: NFX.
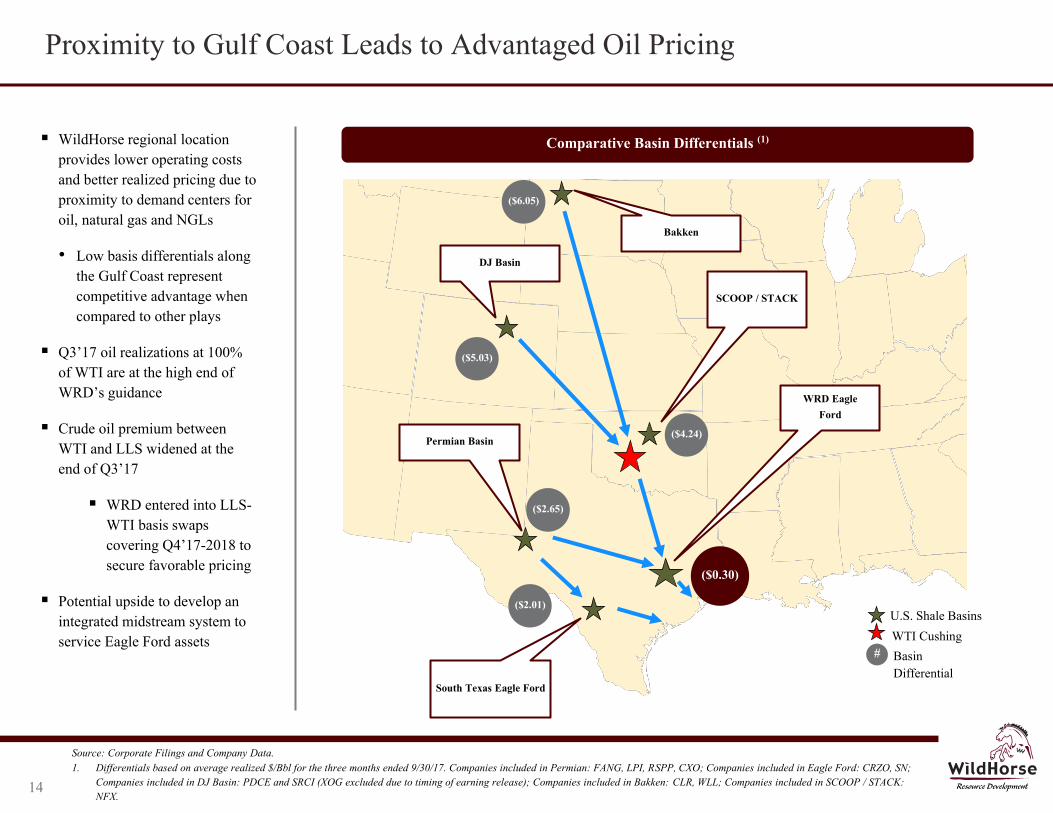
Proximity to Gulf Coast Leads to Advantaged Oil Pricing
Comparative Basin Differentials (1)
WTI Cushing # Basin
Differential
U.S. Shale Basins
Permian Basin
DJ Basin
Bakken
South Texas Eagle Ford
WRD Eagle Ford
($2.65)
($5.03)
($6.05)
($0.30)
SCOOP / STACK
($4.24)
($2.01)
Red: 80
Green: 0
Blue: 0
Red: 0
Green: 60
Blue: 113
Red: 191
Green: 191
Blue: 191
Red: 128
Green: 205
Blue: 237
Red: 17
Green: 143
Blue: 255
Red: 255
Green: 212
Blue: 212
Red: 255
Green: 232
Blue: 167
Red: 191
Green: 191
Blue: 191
Red: 167
Green: 207
Blue: 157
Red: 176
Green: 218
Blue: 255
WildHorse regional location provides lower operating costs and better realized pricing due to proximity to demand centers for oil, natural gas and NGLs
• Low basis differentials along the Gulf Coast represent competitive advantage when compared to other plays
Q3’17 oil realizations at 100% of WTI are at the high end of WRD’s guidance
Crude oil premium between WTI and LLS widened at the end of Q3’17
WRD entered into LLS-WTI basis swaps covering Q4’17-2018 to secure favorable pricing
Potential upside to develop an integrated midstream system to service Eagle Ford assets
14
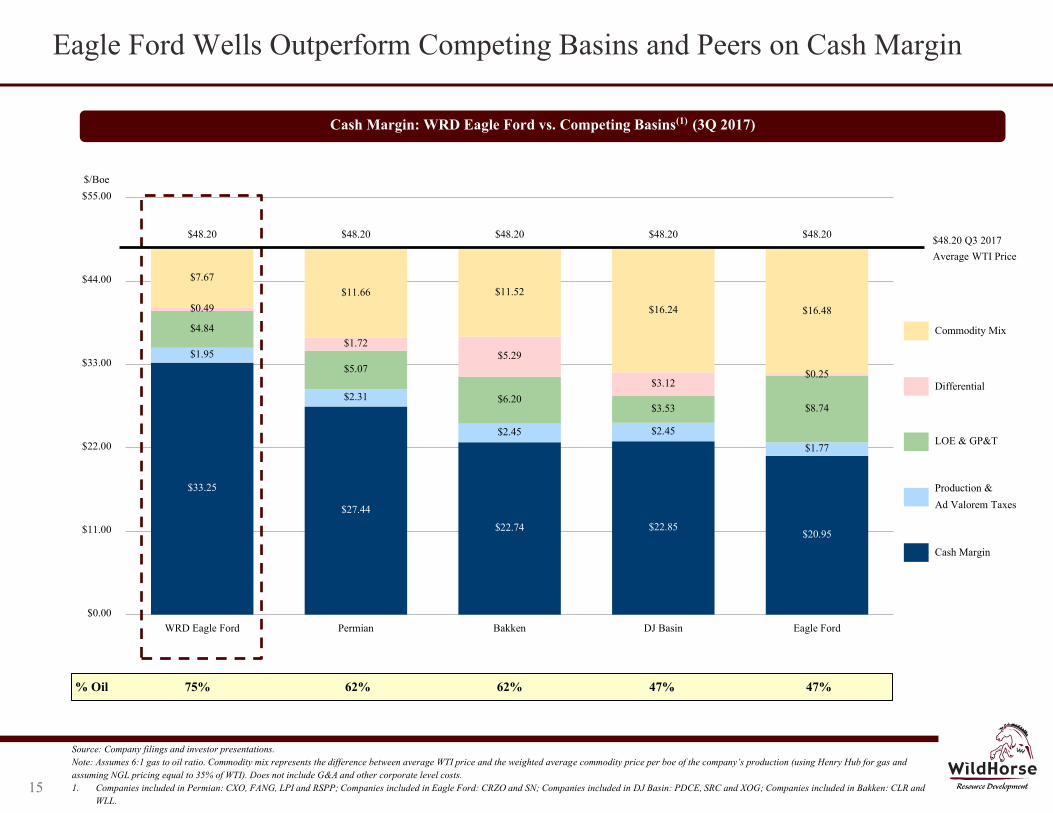
Eagle Ford Wells Outperform Competing Basins and Peers on Cash Margin
$33.25
$27.44
$22.74 $22.85 $20.95
$1.95
$2.31
$2.45 $2.45
$1.77
$4.84
$5.07
$6.20 $3.53 $8.74
$0.49
$1.72 $5.29
$3.12 $0.25
$7.67 $11.66 $11.52
$16.24 $16.48
$48.20 $48.20 $48.20 $48.20 $48.20
$0.00
$11.00
$22.00
$33.00
$44.00
$55.00
WRD Eagle Ford Permian Bakken DJ Basin Eagle Ford
$/Boe
Cash Margin: WRD Eagle Ford vs. Competing Basins(1) (3Q 2017)
Source: Company filings and investor presentations. Note: Assumes 6:1 gas to oil ratio. Commodity mix represents the difference between average WTI price and the weighted average commodity price per boe of the company’s production (using Henry Hub for gas and assuming NGL pricing equal to 35% of WTI). Does not include G&A and other corporate level costs. 1. Companies included in Permian: CXO, FANG, LPI and RSPP; Companies included in Eagle Ford: CRZO and SN; Companies included in DJ Basin: PDCE, SRC and XOG; Companies included in Bakken: CLR and
WLL.
Cash Margin
Production &
Ad Valorem Taxes
LOE & GP&T
Differential
Commodity Mix
15
$48.20 Q3 2017 Average WTI Price
% Oil 75% 62% 62% 47% 47%
III. North Louisiana Overview
16
Athens
Weyerhaeuser
Lincoln
Union Claiborne
Bienville
Jackson
Ouachita
RCT
RRC Terryville
Field
Bear Creek
Athens
Weyerhaeuser
Horizontal Development Focus Area
Low Decline PDP Base with Horizontal Development Upside
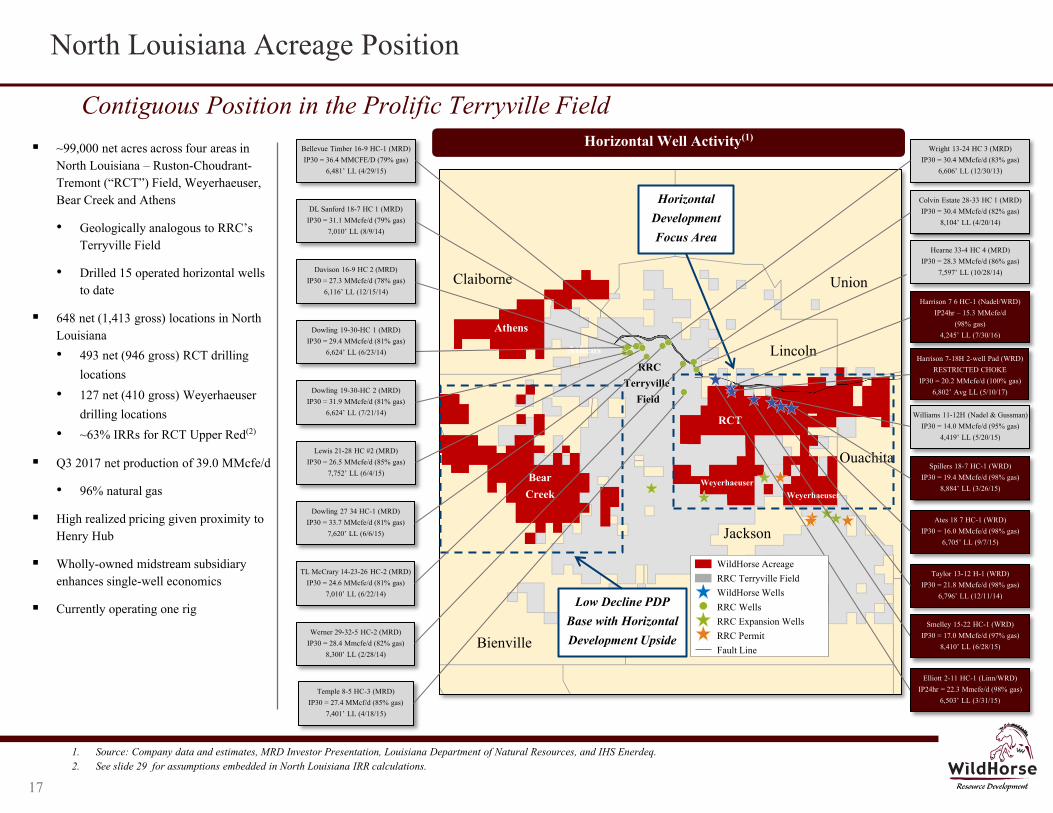
North Louisiana Acreage Position
Contiguous Position in the Prolific Terryville Field ~99,000 net acres across four areas in
North Louisiana – Ruston-Choudrant-Tremont (“RCT”) Field, Weyerhaeuser, Bear Creek and Athens
• Geologically analogous to RRC’s Terryville Field
• Drilled 15 operated horizontal wells to date
648 net (1,413 gross) locations in North Louisiana
• 493 net (946 gross) RCT drilling locations
• 127 net (410 gross) Weyerhaeuser drilling locations
• ~63% IRRs for RCT Upper Red(2)
Q3 2017 net production of 39.0 MMcfe/d
• 96% natural gas
High realized pricing given proximity to Henry Hub
Wholly-owned midstream subsidiary enhances single-well economics
Currently operating one rig
Horizontal Well Activity(1)
Spillers 18-7 HC-1 (WRD) IP30 = 19.4 MMcfe/d (98% gas)
8,884’ LL (3/26/15)
Ates 18 7 HC-1 (WRD) IP30 = 16.0 MMcfe/d (98% gas)
6,705’ LL (9/7/15)
Taylor 13-12 H-1 (WRD) IP30 = 21.8 MMcfe/d (98% gas)
6,796’ LL (12/11/14)
Davison 16-9 HC 2 (MRD) IP30 = 27.3 MMcfe/d (78% gas)
6,116’ LL (12/15/14)
DL Sanford 18-7 HC 1 (MRD) IP30 = 31.1 MMcfe/d (79% gas)
7,010’ LL (8/9/14)
Dowling 27 34 HC-1 (MRD) IP30 = 33.7 MMcfe/d (81% gas)
7,620’ LL (6/6/15)
Dowling 19-30-HC 1 (MRD) IP30 = 29.4 MMcfe/d (81% gas)
6,624’ LL (6/23/14)
Bellevue Timber 16-9 HC-1 (MRD) IP30 = 36.4 MMCFE/D (79% gas)
6,481’ LL (4/29/15)
Wright 13-24 HC 3 (MRD) IP30 = 30.4 MMcfe/d (83% gas)
6,606’ LL (12/30/13)
Colvin Estate 28-33 HC 1 (MRD) IP30 = 30.4 MMcfe/d (82% gas)
8,104’ LL (4/20/14)
Hearne 33-4 HC 4 (MRD) IP30 = 28.3 MMcfe/d (86% gas)
7,597’ LL (10/28/14)
TL McCrary 14-23-26 HC-2 (MRD) IP30 = 24.6 MMcfe/d (81% gas)
7,010’ LL (6/22/14)
Werner 29-32-5 HC-2 (MRD) IP30 = 28.4 Mmcfe/d (82% gas)
8,300’ LL (2/28/14)
Dowling 19-30-HC 2 (MRD) IP30 = 31.9 MMcfe/d (81% gas)
6,624’ LL (7/21/14)
Lewis 21-28 HC #2 (MRD) IP30 = 26.5 MMcfe/d (85% gas)
7,752’ LL (6/4/15)
Williams 11-12H (Nadel & Gussman) IP30 = 14.0 MMcfe/d (95% gas)
4,419’ LL (5/20/15)
Temple 8-5 HC-3 (MRD) IP30 = 27.4 MMcf/d (85% gas)
7,401’ LL (4/18/15)
Smelley 15-22 HC-1 (WRD) IP30 = 17.0 MMcfe/d (97% gas)
8,410’ LL (6/28/15)
Elliott 2-11 HC-1 (Linn/WRD) IP24hr = 22.3 Mmcfe/d (98% gas)
6,503’ LL (3/31/15)
Harrison 7 6 HC-1 (Nadel/WRD) IP24hr – 15.3 MMcfe/d
(98% gas) 4,245’ LL (7/30/16)
1. Source: Company data and estimates, MRD Investor Presentation, Louisiana Department of Natural Resources, and IHS Enerdeq. 2. See slide 29 for assumptions embedded in North Louisiana IRR calculations.
WildHorse Acreage RRC Terryville Field WildHorse Wells RRC Wells RRC Expansion Wells RRC Permit Fault Line
17
Harrison 7-18H 2-well Pad (WRD) RESTRICTED CHOKE
IP30 = 20.2 MMcfe/d (100% gas) 6,802’ Avg LL (5/10/17)
$2.00
$1.54 $1.33
$0.18
$0.09
$0.07
$0.49
$0.71
$0.14
$0.29
$0.96
$0.62 $0.46
$0.12
$0.44
$0.09
$3.07
$3.39
$3.04
$0.00
$0.50
$1.00
$1.50
$2.00
$2.50
$3.00
$3.50
WRD NLA Diversified Gas Marcellus
$/Mcfe
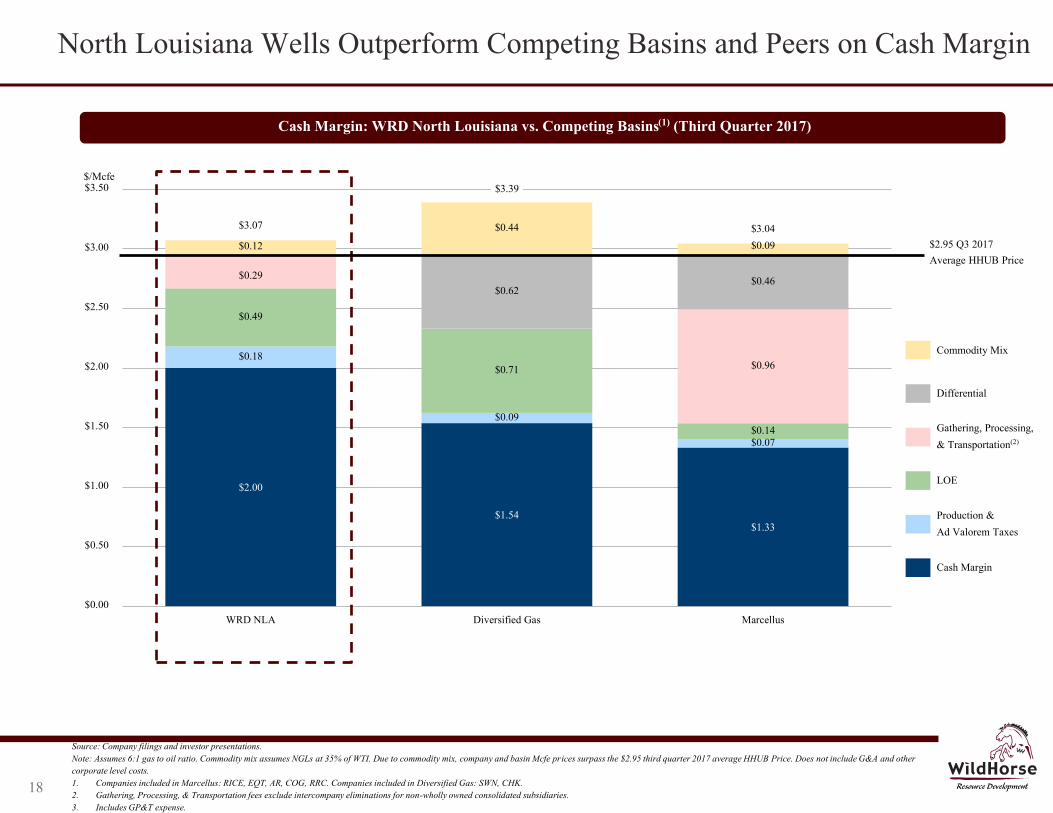
North Louisiana Wells Outperform Competing Basins and Peers on Cash Margin
Cash Margin: WRD North Louisiana vs. Competing Basins(1) (Third Quarter 2017)
Source: Company filings and investor presentations. Note: Assumes 6:1 gas to oil ratio. Commodity mix assumes NGLs at 35% of WTI. Due to commodity mix, company and basin Mcfe prices surpass the $2.95 third quarter 2017 average HHUB Price. Does not include G&A and other corporate level costs. 1. Companies included in Marcellus: RICE, EQT, AR, COG, RRC. Companies included in Diversified Gas: SWN, CHK. 2. Gathering, Processing, & Transportation fees exclude intercompany eliminations for non-wholly owned consolidated subsidiaries. 3. Includes GP&T expense.
Cash Margin
Production &
Ad Valorem Taxes
LOE
Gathering, Processing,
& Transportation(2)
Differential
$2.95 Q3 2017 Average HHUB Price
Commodity Mix
Red: 80
Green: 0
Blue: 0
Red: 0
Green: 60
Blue: 113
Red: 191
Green: 191
Blue: 191
Red: 128
Green: 205
Blue: 237
Red: 17
Green: 143
Blue: 255
Red: 255
Green: 212
Blue: 212
Red: 255
Green: 232
Blue: 167
Red: 191
Green: 191
Blue: 191
Red: 167
Green: 207
Blue: 157
Red: 176
Green: 218
Blue: 255
18
IV. Financial Overview
19
$0
$150
$300
$450
$600
$750
$900
2017 2018 2019 2020 2021 2022 2023 2024 2025
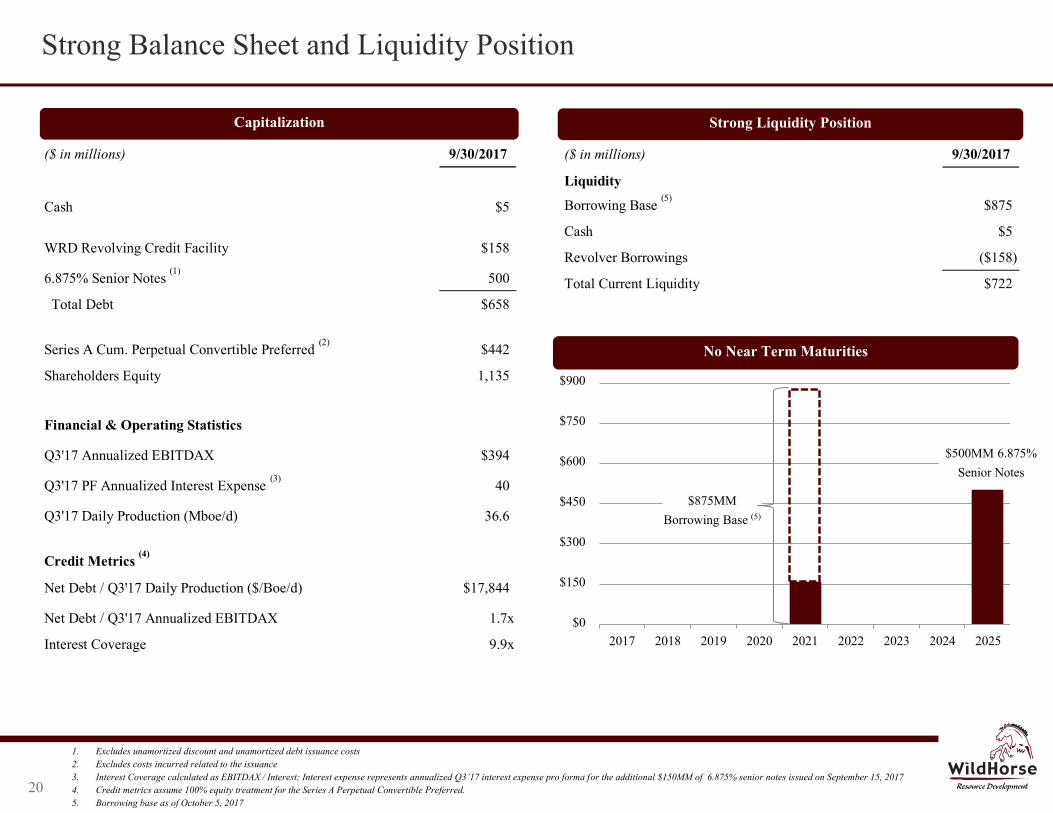
Strong Balance Sheet and Liquidity Position
Capitalization Strong Liquidity Position
1. Excludes unamortized discount and unamortized debt issuance costs 2. Excludes costs incurred related to the issuance 3. Interest Coverage calculated as EBITDAX / Interest; Interest expense represents annualized Q3’17 interest expense pro forma for the additional $150MM of 6.875% senior notes issued on September 15, 2017 4. Credit metrics assume 100% equity treatment for the Series A Perpetual Convertible Preferred. 5. Borrowing base as of October 5, 2017
20
No Near Term Maturities
$500MM 6.875% Senior Notes
$875MM Borrowing Base (5)
($ in millions) 9/30/2017
Cash $5
WRD Revolving Credit Facility $158
6.875% Senior Notes (1)
500
Total Debt $658
Series A Cum. Perpetual Convertible Preferred (2)
$442
Shareholders Equity 1,135
Financial & Operating Statistics
Q3'17 Annualized EBITDAX $394
Q3'17 PF Annualized Interest Expense (3)
40
Q3'17 Daily Production (Mboe/d) 36.6
Credit Metrics (4)
Net Debt / Q3'17 Daily Production ($/Boe/d) $17,844
Net Debt / Q3'17 Annualized EBITDAX 1.7x
Interest Coverage 9.9x
($ in millions) 9/30/2017
Liquidity
Borrowing Base (5)
$875
Cash $5
Revolver Borrowings ($158)
Total Current Liquidity $722
FY 2017 Guidance (as of May 11, 2017)
2017 Guidance (as of May 11, 2017)
Note: Updated guidance includes Acquisition impact beginning July 1, 2017. 1. Excludes non-cash compensation charges associated with grants under our LTIP and incentive units issued to certain of our officers and employees. WRD does not guide to anticipated average non-cash general and administrative costs.
Please see cautionary language under “Cautionary Statements and Additional Disclosures” for additional disclosures because such compensation charges are based in part on the price of our common stock and are too speculative to predict. 2. Based on strip pricing as of May 11, 2017.
21
Guidance
Low High
Net Average Daily Production (Mboe/d)
Oil (% of Production)
Natural Gas (% of Production)
NGLs (% of Production)
Average Costs (per Boe)
Lease Operating Expense
Gathering, Processing, and Transportation
Taxes Other than Income
Cash General and Administrative(1)
Commodity Price Realizations (Unhedged)(2)
Crude Oil Realized Price (% of WTI NYMEX)
Natural Gas Realized Price (% of NYMEX to Henry Hub)
NGL Realized Price (% of WTI NYMEX)
Drilling Program
Wells Spud (Gross)
Wells Completed (Gross)
D&C Capital Expenditure ($MM)
85 - 105
$550 - $675
95% - 100%
95% - 100%
27% - 32%
9% - 11%
$3.25 - $3.75
$0.95 - $1.15
100 - 120
27 - 31
57% - 61%
29% - 33%
$2.00 - $2.25
$2.50 - $3.00
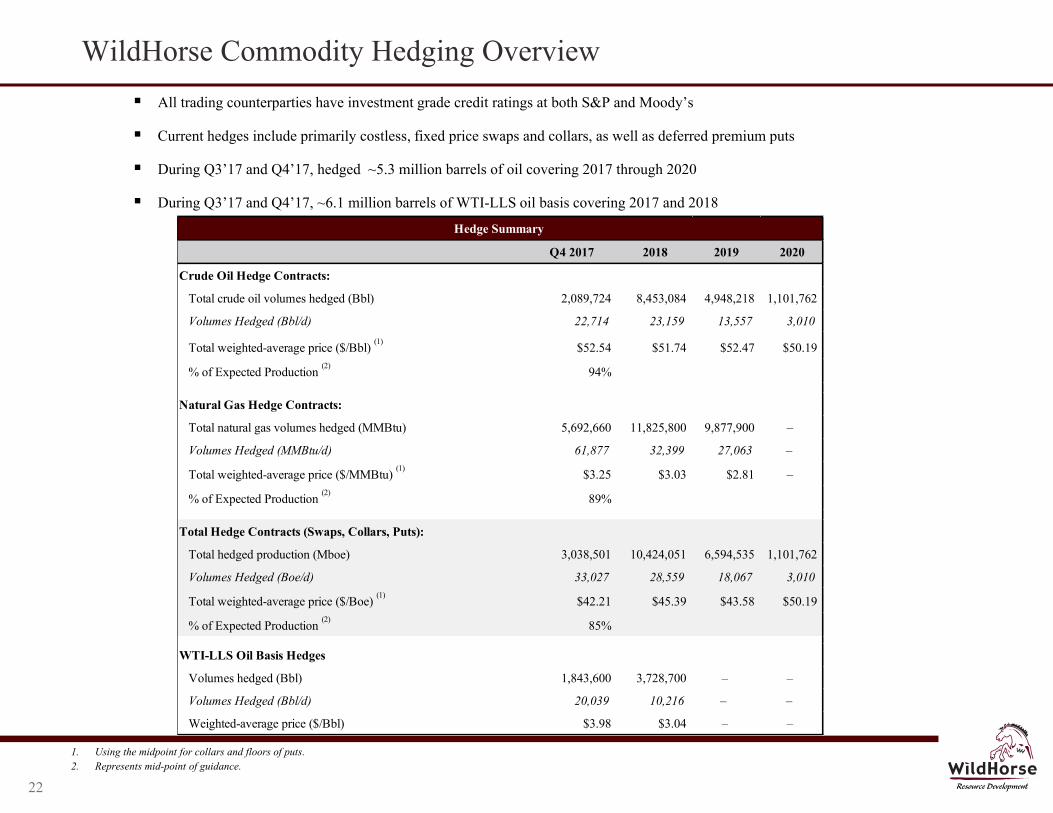
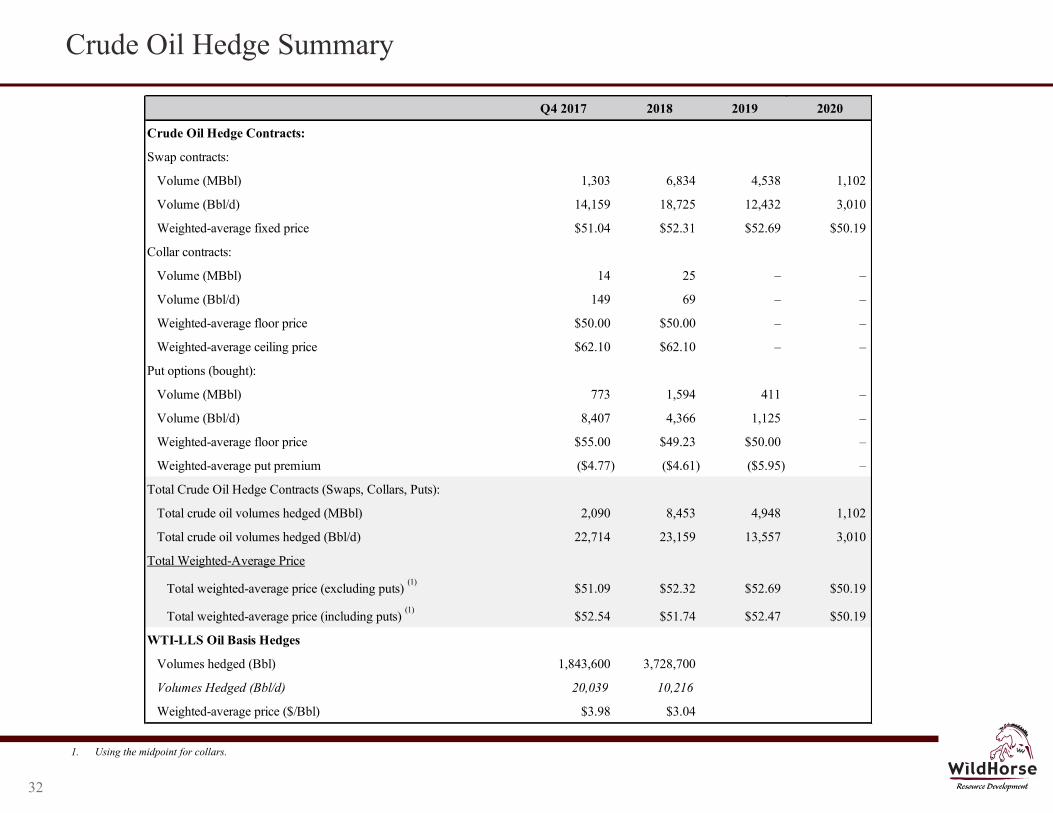
WildHorse Commodity Hedging Overview
All trading counterparties have investment grade credit ratings at both S&P and Moody’s
Current hedges include primarily costless, fixed price swaps and collars, as well as deferred premium puts
During Q3’17 and Q4’17, hedged ~5.3 million barrels of oil covering 2017 through 2020
During Q3’17 and Q4’17, ~6.1 million barrels of WTI-LLS oil basis covering 2017 and 2018
1. Using the midpoint for collars and floors of puts. 2. Represents mid-point of guidance.
22
Hedge Summary
Q4 2017 2018 2019 2020
Crude Oil Hedge Contracts:
Total crude oil volumes hedged (Bbl) 2,089,724 8,453,084 4,948,218 1,101,762
Volumes Hedged (Bbl/d) 22,714 23,159 13,557 3,010
Total weighted-average price ($/Bbl) (1)
$52.54 $51.74 $52.47 $50.19
% of Expected Production (2)
94%
Natural Gas Hedge Contracts:
Total natural gas volumes hedged (MMBtu) 5,692,660 11,825,800 9,877,900 –
Volumes Hedged (MMBtu/d) 61,877 32,399 27,063 –
Total weighted-average price ($/MMBtu) (1)
$3.25 $3.03 $2.81 –
% of Expected Production (2)
89%
Total Hedge Contracts (Swaps, Collars, Puts):
Total hedged production (Mboe) 3,038,501 10,424,051 6,594,535 1,101,762
Volumes Hedged (Boe/d) 33,027 28,559 18,067 3,010
Total weighted-average price ($/Boe) (1)
$42.21 $45.39 $43.58 $50.19
% of Expected Production (2)
85%
WTI-LLS Oil Basis Hedges
Volumes hedged (Bbl) 1,843,600 3,728,700 – –
Volumes Hedged (Bbl/d) 20,039 10,216 – –
Weighted-average price ($/Bbl) $3.98 $3.04 – –
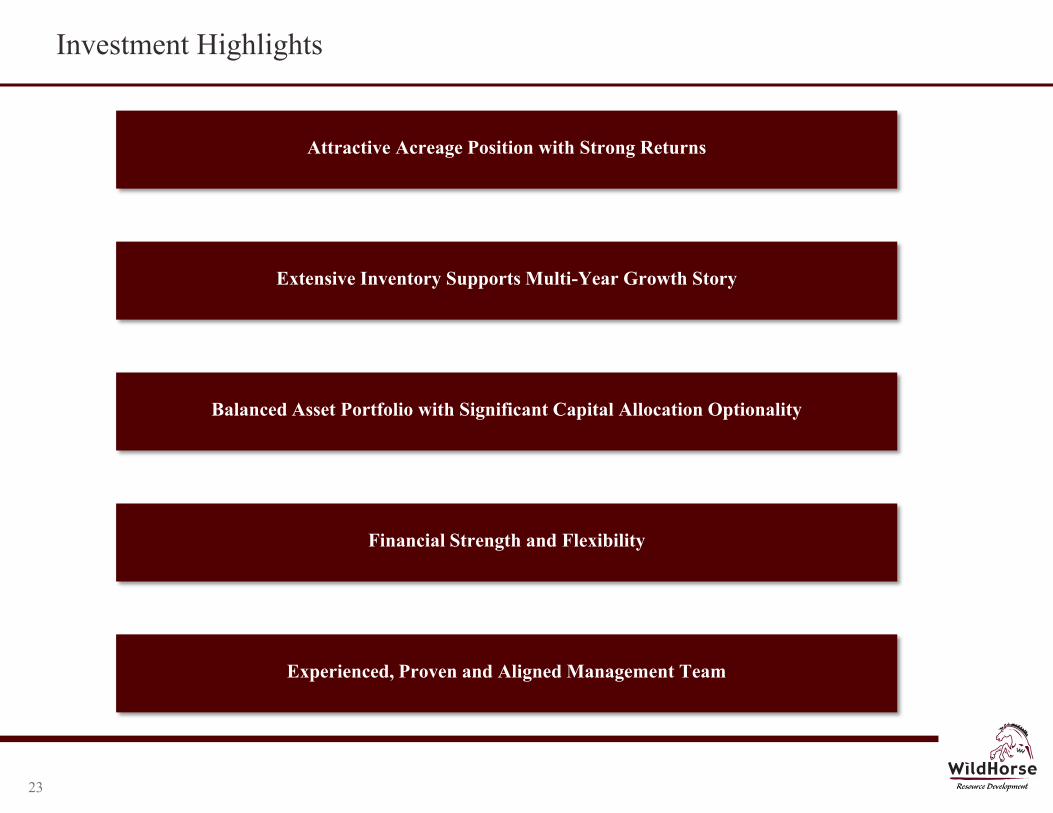
Investment Highlights
Attractive Acreage Position with Strong Returns
Extensive Inventory Supports Multi-Year Growth Story
Balanced Asset Portfolio with Significant Capital Allocation Optionality
Financial Strength and Flexibility
Experienced, Proven and Aligned Management Team
Red: 80
Green: 0
Blue: 0
Red: 0
Green: 60
Blue: 113
Red: 191
Green: 191
Blue: 191
Red: 128
Green: 205
Blue: 237
Red: 17
Green: 143
Blue: 255
Red: 255
Green: 212
Blue: 212
Red: 255
Green: 232
Blue: 167
Red: 191
Green: 191
Blue: 191
Red: 167
Green: 207
Blue: 157
Red: 176
Green: 218
Blue: 255
23
V. Appendix
24
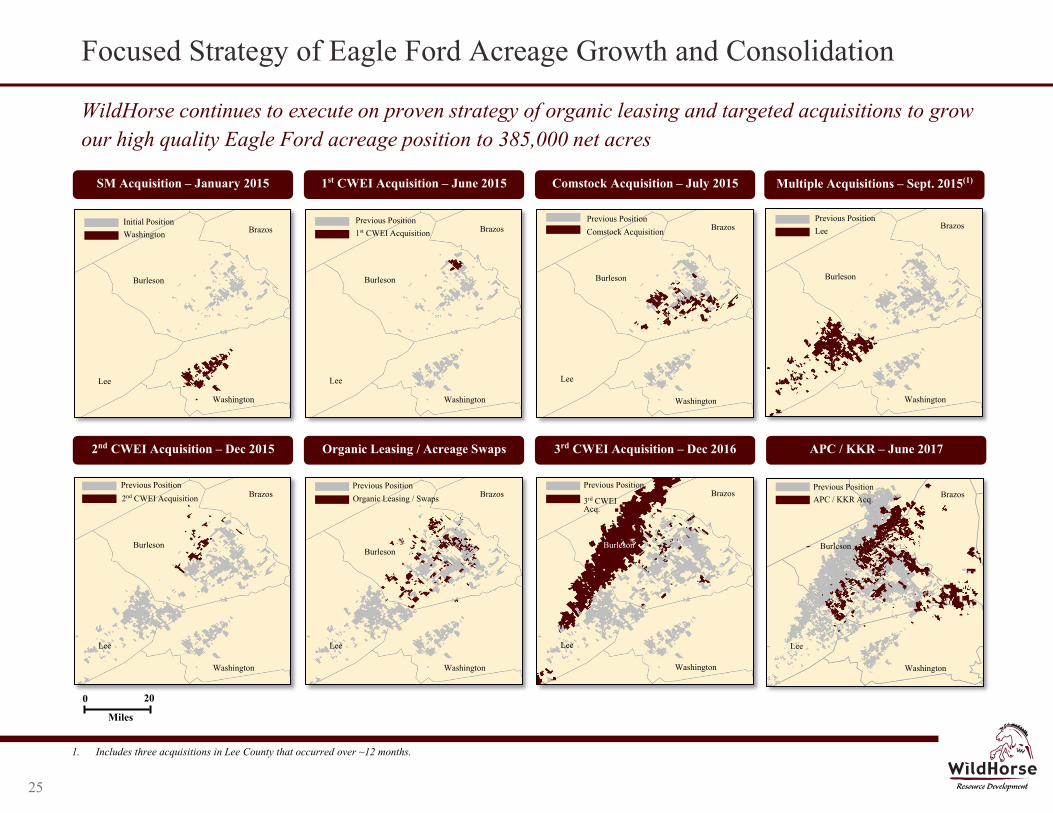
Focused Strategy of Eagle Ford Acreage Growth and Consolidation
WildHorse continues to execute on proven strategy of organic leasing and targeted acquisitions to grow our high quality Eagle Ford acreage position to 385,000 net acres
Multiple Acquisitions – Sept. 2015(1)
Previous Position Lee
Burleson
Brazos
Washington
Lee
Organic Leasing / Acreage Swaps
1st CWEI Acquisition – June 2015
Previous Position 1st CWEI Acquisition
Burleson
Brazos
Washington
Lee
Previous Position
Organic Leasing / Swaps
Burleson
Brazos
Washington
Lee
2nd CWEI Acquisition – Dec 2015
Previous Position
2nd CWEI Acquisition
Burleson
Brazos
Washington
Lee
SM Acquisition – January 2015
Initial Position Washington
Burleson
Brazos
Washington
Lee
1. Includes three acquisitions in Lee County that occurred over ~12 months.
3rd CWEI Acquisition – Dec 2016
Comstock Acquisition – July 2015
Previous Position
Comstock Acquisition
Burleson
Brazos
Washington
Lee
Burleson
Brazos
Washington
Lee
Previous Position
3rd CWEI Acq.
APC / KKR – June 2017
Burleson
Brazos
Washington
Lee
Previous Position APC / KKR Acq.
0 20
Miles
25
WildHorse Acreage Positioned in the Highly Productive, Liquids-Rich Eagle Ford
Top of Eagle Ford Structural Map Gross Thickness Isopach Map
Lee
Washington
Burleson
Milam
Bastrop
Fayette Austin
Waller
Grimes Brazos
Lee
Washington
Burleson
Milam
Austin
Waller
Grimes
Brazos
Fayette
Oil Gravity Gas / Oil Ratio
60.0
57.5
55.0
52.5
50.0
47.5
45.0
42.5
40.0
37.5
35.0
API
10,000
9,000
8,000
7,000
6,000
5,000
4,000
3,000
2,000
1,000
250
Mcf / STB
Deep
Shallow -6,000'
-7,000'
-8,000'
-9,000'
-10,000'
-11,000'
-12,000'
-13,000'
-14,000'
Thin
Thick 500'
450'
400'
350'
300'
250'
200'
150'
100'
50'
Brazos Milam
Washington
Lee
Fayette
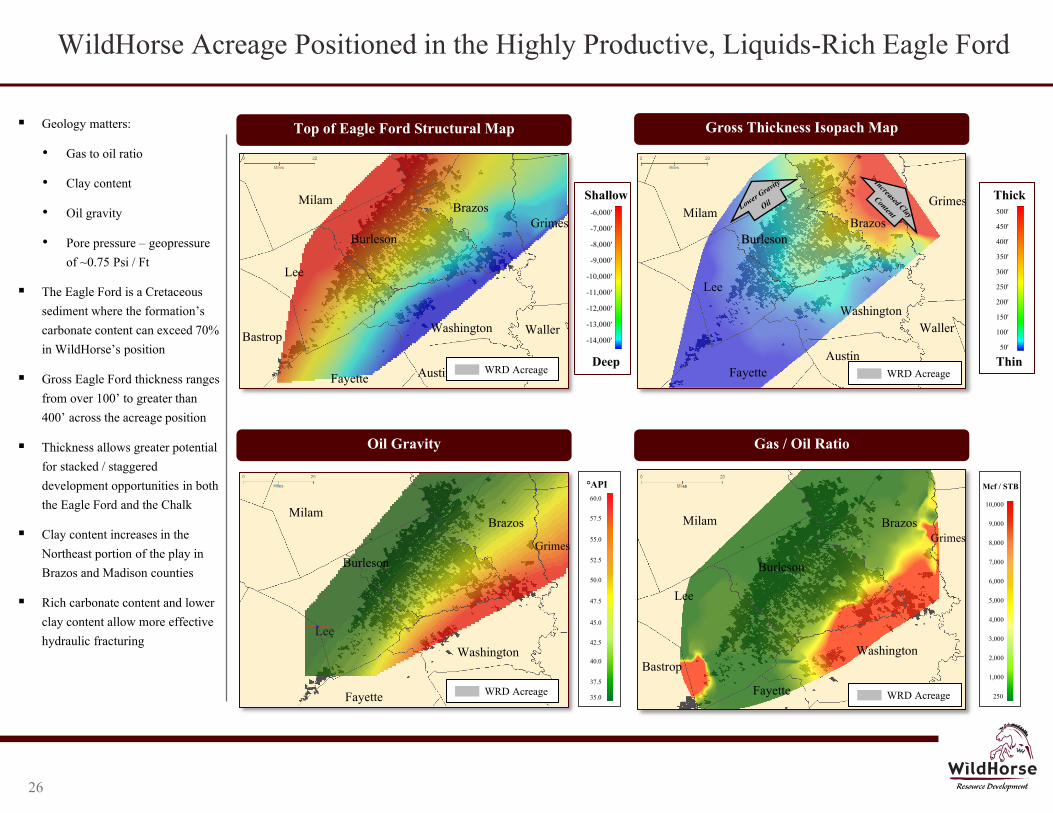
Geology matters:
• Gas to oil ratio
• Clay content
• Oil gravity
• Pore pressure – geopressure of ~0.75 Psi / Ft
The Eagle Ford is a Cretaceous sediment where the formation’s carbonate content can exceed 70% in WildHorse’s position
Gross Eagle Ford thickness ranges from over 100’ to greater than 400’ across the acreage position
Thickness allows greater potential for stacked / staggered development opportunities in both the Eagle Ford and the Chalk
Clay content increases in the Northeast portion of the play in Brazos and Madison counties
Rich carbonate content and lower clay content allow more effective hydraulic fracturing
Lee
Washington
Burleson
Milam
Bastrop
Fayette
Grimes Brazos
Burleson Grimes
WRD Acreage WRD Acreage
WRD Acreage WRD Acreage
26
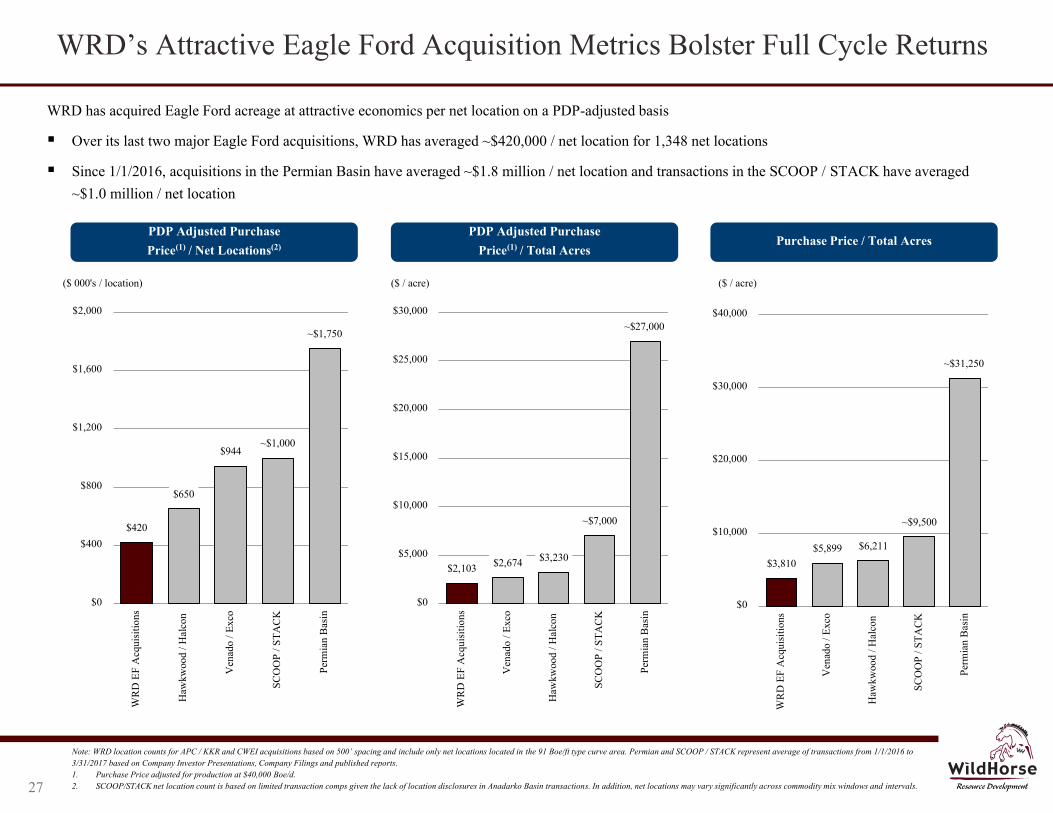
WRD’s Attractive Eagle Ford Acquisition Metrics Bolster Full Cycle Returns
Note: WRD location counts for APC / KKR and CWEI acquisitions based on 500’ spacing and include only net locations located in the 91 Boe/ft type curve area. Permian and SCOOP / STACK represent average of transactions from 1/1/2016 to 3/31/2017 based on Company Investor Presentations, Company Filings and published reports. 1. Purchase Price adjusted for production at $40,000 Boe/d. 2. SCOOP/STACK net location count is based on limited transaction comps given the lack of location disclosures in Anadarko Basin transactions. In addition, net locations may vary significantly across commodity mix windows and intervals.
$3,810 $5,899 $6,211
~$9,500
~$31,250
$0
$10,000
$20,000
$30,000
$40,000
WR
D E
F A
cqui
sitio
ns
Ven
ado
/ Exc
o
Haw
kwoo
d / H
alco
n
SCO
OP
/ ST
AC
K
Perm
ian
Bas
in
$2,103 $2,674 $3,230
~$7,000
~$27,000
$0
$5,000
$10,000
$15,000
$20,000
$25,000
$30,000
WR
D E
F A
cqui
sitio
ns
Ven
ado
/ Exc
o
Haw
kwoo
d / H
alco
n
SCO
OP
/ ST
AC
K
Perm
ian
Bas
in
Purchase Price / Total Acres PDP Adjusted Purchase
Price(1) / Total Acres
($ / acre) ($ / acre)
WRD has acquired Eagle Ford acreage at attractive economics per net location on a PDP-adjusted basis
Over its last two major Eagle Ford acquisitions, WRD has averaged ~$420,000 / net location for 1,348 net locations
Since 1/1/2016, acquisitions in the Permian Basin have averaged ~$1.8 million / net location and transactions in the SCOOP / STACK have averaged ~$1.0 million / net location
$420
$650
$944 ~$1,000
~$1,750
$0
$400
$800
$1,200
$1,600
$2,000
WR
D E
F A
cqui
sitio
ns
Haw
kwoo
d / H
alco
n
Ven
ado
/ Exc
o
SCO
OP
/ ST
AC
K
Perm
ian
Bas
in
PDP Adjusted Purchase Price(1) / Net Locations(2)
($ 000's / location)
27
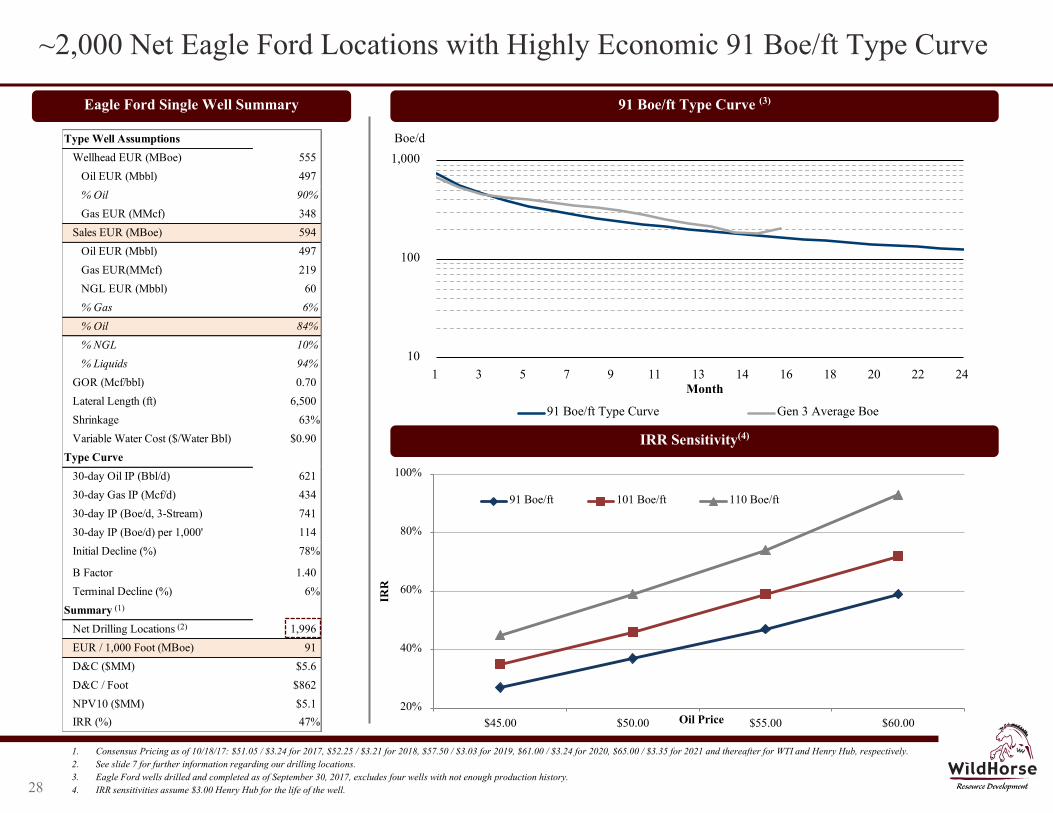
Type Well Assumptions
Wellhead EUR (MBoe) 555
Oil EUR (Mbbl) 497
% Oil 90%
Gas EUR (MMcf) 348
Sales EUR (MBoe) 594
Oil EUR (Mbbl) 497
Gas EUR(MMcf) 219
NGL EUR (Mbbl) 60
% Gas 6%
% Oil 84%
% NGL 10%
% Liquids 94%
GOR (Mcf/bbl) 0.70
Lateral Length (ft) 6,500
Shrinkage 63%
Variable Water Cost ($/Water Bbl) $0.90
Type Curve
30-day Oil IP (Bbl/d) 621
30-day Gas IP (Mcf/d) 434
30-day IP (Boe/d, 3-Stream) 741
30-day IP (Boe/d) per 1,000' 114
Initial Decline (%) 78%
B Factor 1.40
Terminal Decline (%) 6%
Summary
Net Drilling Locations 1,996
EUR / 1,000 Foot (MBoe) 91
D&C ($MM) $5.6
D&C / Foot $862
NPV10 ($MM) $5.1
IRR (%) 47%
10
100
1,000
1 3 5 7 9 11 13 14 16 18 20 22 24
Boe/d
Month
91 Boe/ft Type Curve Gen 3 Average Boe
1. Consensus Pricing as of 10/18/17: $51.05 / $3.24 for 2017, $52.25 / $3.21 for 2018, $57.50 / $3.03 for 2019, $61.00 / $3.24 for 2020, $65.00 / $3.35 for 2021 and thereafter for WTI and Henry Hub, respectively. 2. See slide 7 for further information regarding our drilling locations. 3. Eagle Ford wells drilled and completed as of September 30, 2017, excludes four wells with not enough production history. 4. IRR sensitivities assume $3.00 Henry Hub for the life of the well.
~2,000 Net Eagle Ford Locations with Highly Economic 91 Boe/ft Type Curve
91 Boe/ft Type Curve (3)
IRR Sensitivity(4)
Eagle Ford Single Well Summary
(1)
(2)
28
20%
40%
60%
80%
100%
$45.00 $50.00 $55.00 $60.00
IRR
Oil Price
91 Boe/ft 101 Boe/ft 110 Boe/ft
1
10
100
1,000
10,000
1
10
1 3 5 7 9 11 13 14 16 18 20 22 24
MMcfe/d
Month Type Curve Type Curve Cum Average of Representative Wells
Type Well Assumptions
Wellhead EUR (MMcfe) 14,592
Gas EUR (MMcf) 14,275
Oil EUR (Mbbl) 53
% Gas 98%
Sales EUR (MMcfe) 14,521
Gas EUR(MMcf) 14,204
Oil EUR (Mbbl) 53
% Gas 98%
% Oil 2%
Choke (MMcfd/1,000') 1.5
Flat Time (Days) 120
Oil Yield (bbl/MMcf) 3.7
Lateral Length (Ft) 7,500
Shrinkage 99.5%
BTU Factor 1,090
Type Curve
30-day Gas IP (Mcf/d) 11,250
30-day Oil IP (Bbl/d) 42
30-day IP (Mcfe/d) 11,500
30-day IP (Mcfe/d) per 1,000' 1,533
Initial Decline (%) 65%
B Factor 1.40
Terminal Decline (%) 5%
Summary
Net Drilling Locations 493
EUR / 1,000 Foot (Bcfe) 1.9
D&C ($MM) $8.4
D&C / Foot $1,120
NPV10 ($MM) $9.6
IRR (%) 63%
RCT Upper Red Type Curve Economics
RCT Upper Red Single Well Type Curve
IRR Sensitivity(2)
RCT Upper Red Single Well Summary
1. Consensus Pricing as of 10/18/17: $51.05 / $3.24 for 2017, $52.25 / $3.21 for 2018, $57.50 / $3.03 for 2019, $61.00 / $3.24 for 2020, $65.00 / $3.35 for 2021 and thereafter for WTI and Henry Hub, respectively. Excludes inter-company gathering fees to wholly-owned midstream system.
2. IRR sensitivities assume $50.00 WTI for the life of the well. 3. Representative wells include the Smelley 15-22 HC-1, Ates 18 7 HC-1, Spillers 18-7 HC-1 and Taylor 13-12 H-1. 4. See slide 7 for further information regarding our drilling locations.
Restricted Rate
(3)
(1)
Cumulative Production (Bcfe)
(4)
Red: 80
Green: 0
Blue: 0
Red: 0
Green: 60
Blue: 113
Red: 191
Green: 191
Blue: 191
Red: 128
Green: 205
Blue: 237
Red: 17
Green: 143
Blue: 255
Red: 255
Green: 212
Blue: 212
Red: 255
Green: 232
Blue: 167
Red: 191
Green: 191
Blue: 191
Red: 167
Green: 207
Blue: 157
Red: 176
Green: 218
Blue: 255
29
20%
60%
100%
140%
180%
$2.50 $3.00 $3.50 $4.00
IRR
Gas Price
Type Curve 5% Improvement 10% Improvement
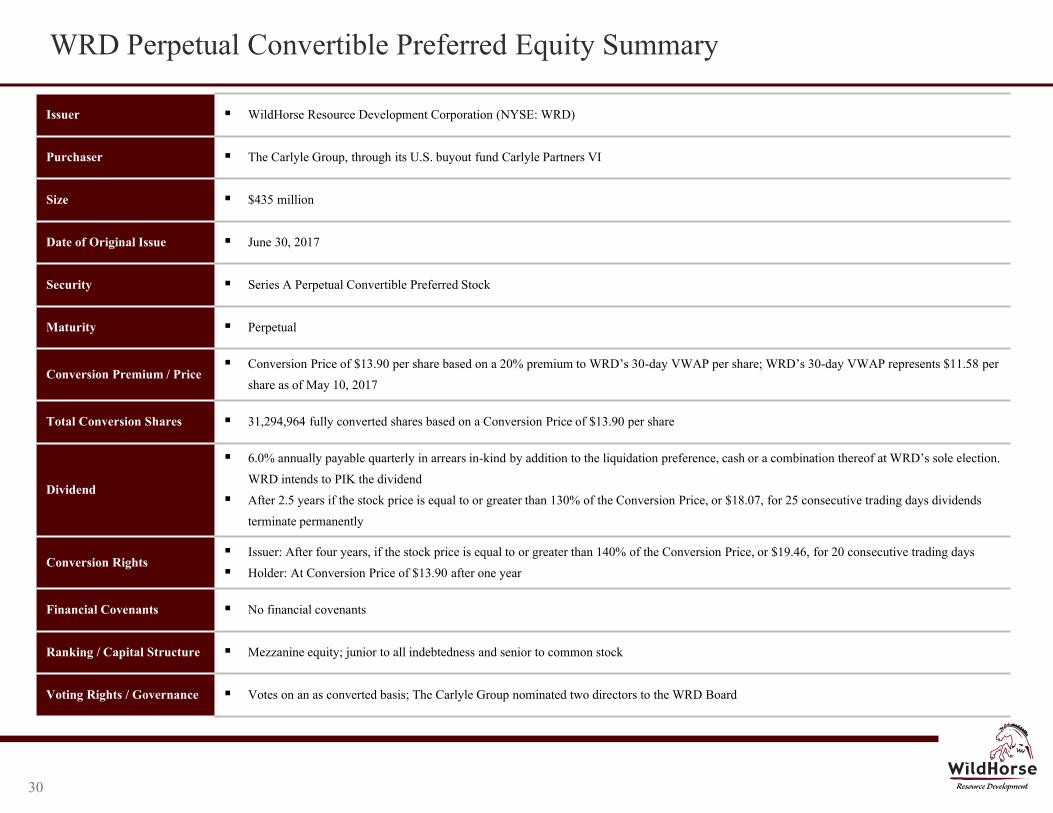
WRD Perpetual Convertible Preferred Equity Summary
Issuer WildHorse Resource Development Corporation (NYSE: WRD)
Purchaser The Carlyle Group, through its U.S. buyout fund Carlyle Partners VI
Size $435 million
Date of Original Issue June 30, 2017
Security Series A Perpetual Convertible Preferred Stock
Maturity Perpetual
Conversion Premium / Price Conversion Price of $13.90 per share based on a 20% premium to WRD’s 30-day VWAP per share; WRD’s 30-day VWAP represents $11.58 per
share as of May 10, 2017
Total Conversion Shares 31,294,964 fully converted shares based on a Conversion Price of $13.90 per share
Dividend
6.0% annually payable quarterly in arrears in-kind by addition to the liquidation preference, cash or a combination thereof at WRD’s sole election.
WRD intends to PIK the dividend
After 2.5 years if the stock price is equal to or greater than 130% of the Conversion Price, or $18.07, for 25 consecutive trading days dividends
terminate permanently
Conversion Rights Issuer: After four years, if the stock price is equal to or greater than 140% of the Conversion Price, or $19.46, for 20 consecutive trading days
Holder: At Conversion Price of $13.90 after one year
Financial Covenants No financial covenants
Ranking / Capital Structure Mezzanine equity; junior to all indebtedness and senior to common stock
Voting Rights / Governance Votes on an as converted basis; The Carlyle Group nominated two directors to the WRD Board
30
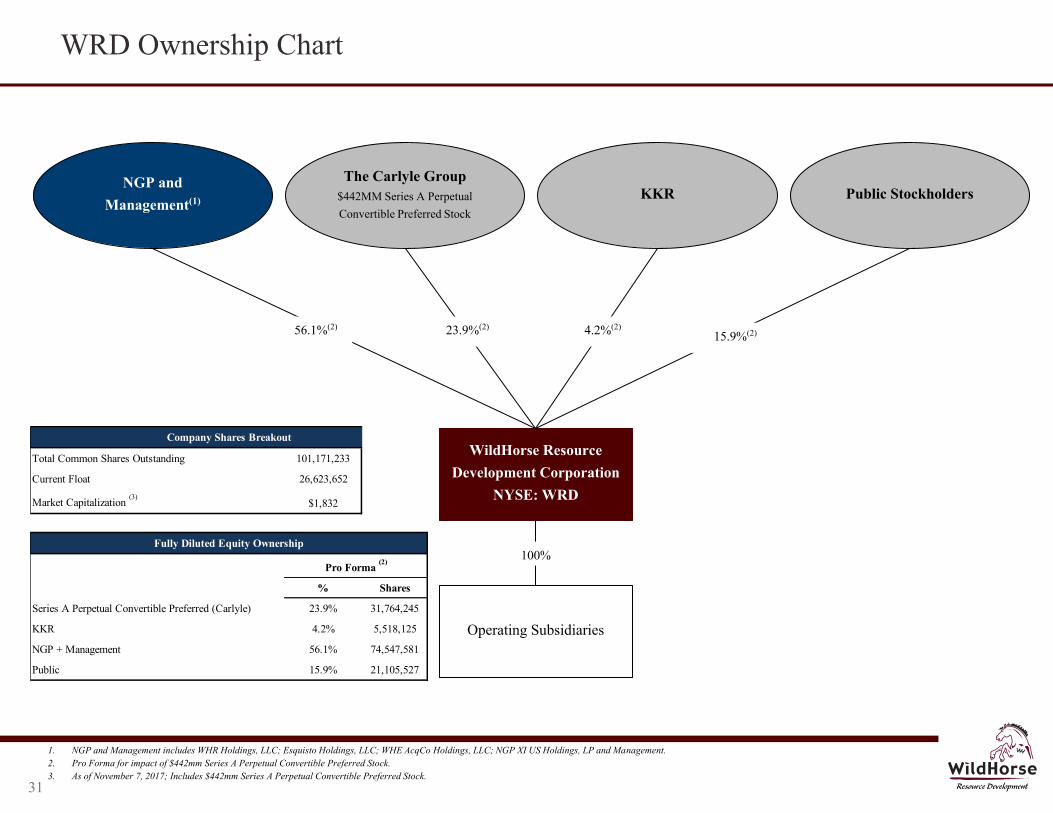
NGP and Management(1)
WildHorse Resource Development Corporation
NYSE: WRD
Operating Subsidiaries
56.1%(2) 23.9%(2) 4.2%(2) 15.9%(2)
100%
Public Stockholders
Red: 255
Green: 212
Blue: 212
Red: 255
Green: 232
Blue: 167
Red: 191
Green: 191
Blue: 191
Red: 167
Green: 207
Blue: 157
Red: 176
Green: 218
Blue: 255
Red: 80
Green: 0
Blue: 0
Red: 0
Green: 60
Blue: 113
Red: 191
Green: 191
Blue: 191
Red: 128
Green: 205
Blue: 237
Red: 17
Green: 143
Blue: 255
The Carlyle Group $442MM Series A Perpetual Convertible Preferred Stock
KKR
WRD Ownership Chart
1. NGP and Management includes WHR Holdings, LLC; Esquisto Holdings, LLC; WHE AcqCo Holdings, LLC; NGP XI US Holdings, LP and Management. 2. Pro Forma for impact of $442mm Series A Perpetual Convertible Preferred Stock. 3. As of November 7, 2017; Includes $442mm Series A Perpetual Convertible Preferred Stock.
31
Company Shares Breakout
Total Common Shares Outstanding 101,171,233
Current Float 26,623,652
Market Capitalization (3)
$1,832
Fully Diluted Equity Ownership
Pro Forma (2)
% Shares
Series A Perpetual Convertible Preferred (Carlyle) 23.9% 31,764,245
KKR 4.2% 5,518,125
NGP + Management 56.1% 74,547,581
Public 15.9% 21,105,527
Crude Oil Hedge Summary
Red: 80
Green: 0
Blue: 0
Red: 0
Green: 60
Blue: 113
Red: 191
Green: 191
Blue: 191
Red: 128
Green: 205
Blue: 237
Red: 17
Green: 143
Blue: 255
Red: 255
Green: 212
Blue: 212
Red: 255
Green: 232
Blue: 167
Red: 191
Green: 191
Blue: 191
Red: 167
Green: 207
Blue: 157
Red: 176
Green: 218
Blue: 255
1. Using the midpoint for collars.
32
Q4 2017 2018 2019 2020
Crude Oil Hedge Contracts:
Swap contracts:
Volume (MBbl) 1,303 6,834 4,538 1,102
Volume (Bbl/d) 14,159 18,725 12,432 3,010
Weighted-average fixed price $51.04 $52.31 $52.69 $50.19
Collar contracts:
Volume (MBbl) 14 25 – –
Volume (Bbl/d) 149 69 – –
Weighted-average floor price $50.00 $50.00 – –
Weighted-average ceiling price $62.10 $62.10 – –
Put options (bought):
Volume (MBbl) 773 1,594 411 –
Volume (Bbl/d) 8,407 4,366 1,125 –
Weighted-average floor price $55.00 $49.23 $50.00 –
Weighted-average put premium ($4.77) ($4.61) ($5.95) –
Total Crude Oil Hedge Contracts (Swaps, Collars, Puts):
Total crude oil volumes hedged (MBbl) 2,090 8,453 4,948 1,102
Total crude oil volumes hedged (Bbl/d) 22,714 23,159 13,557 3,010
Total Weighted-Average Price
Total weighted-average price (excluding puts) (1)
$51.09 $52.32 $52.69 $50.19
Total weighted-average price (including puts) (1)
$52.54 $51.74 $52.47 $50.19
WTI-LLS Oil Basis Hedges
Volumes hedged (Bbl) 1,843,600 3,728,700
Volumes Hedged (Bbl/d) 20,039 10,216
Weighted-average price ($/Bbl) $3.98 $3.04
Natural Gas Hedge Summary
Red: 80
Green: 0
Blue: 0
Red: 0
Green: 60
Blue: 113
Red: 191
Green: 191
Blue: 191
Red: 128
Green: 205
Blue: 237
Red: 17
Green: 143
Blue: 255
Red: 255
Green: 212
Blue: 212
Red: 255
Green: 232
Blue: 167
Red: 191
Green: 191
Blue: 191
Red: 167
Green: 207
Blue: 157
Red: 176
Green: 218
Blue: 255
1. Using the midpoint for collars.
33
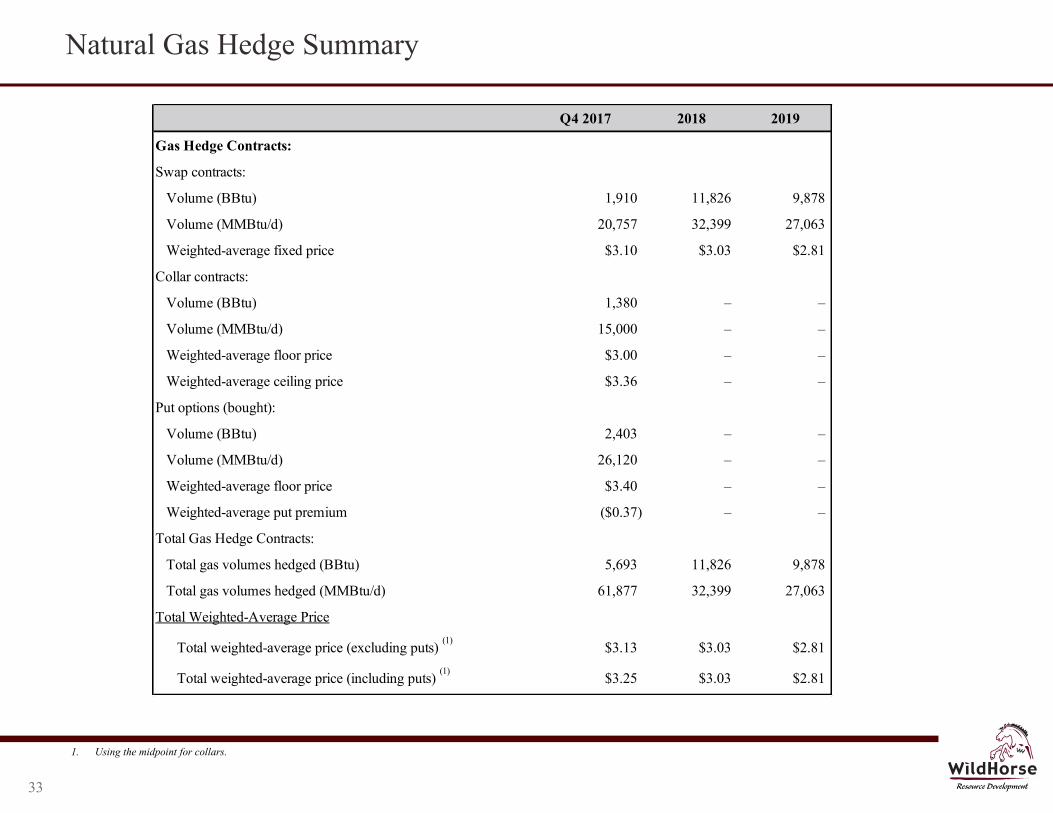
Q4 2017 2018 2019
Gas Hedge Contracts:
Swap contracts:
Volume (BBtu) 1,910 11,826 9,878
Volume (MMBtu/d) 20,757 32,399 27,063
Weighted-average fixed price $3.10 $3.03 $2.81
Collar contracts:
Volume (BBtu) 1,380 – –
Volume (MMBtu/d) 15,000 – –
Weighted-average floor price $3.00 – –
Weighted-average ceiling price $3.36 – –
Put options (bought):
Volume (BBtu) 2,403 – –
Volume (MMBtu/d) 26,120 – –
Weighted-average floor price $3.40 – –
Weighted-average put premium ($0.37) – –
Total Gas Hedge Contracts:
Total gas volumes hedged (BBtu) 5,693 11,826 9,878
Total gas volumes hedged (MMBtu/d) 61,877 32,399 27,063
Total Weighted-Average Price
Total weighted-average price (excluding puts) (1)
$3.13 $3.03 $2.81
Total weighted-average price (including puts) (1)
$3.25 $3.03 $2.81
Reconciliation of Adjusted EBITDAX
Red: 80
Green: 0
Blue: 0
Red: 0
Green: 60
Blue: 113
Red: 191
Green: 191
Blue: 191
Red: 128
Green: 205
Blue: 237
Red: 17
Green: 143
Blue: 255
Red: 255
Green: 212
Blue: 212
Red: 255
Green: 232
Blue: 167
Red: 191
Green: 191
Blue: 191
Red: 167
Green: 207
Blue: 157
Red: 176
Green: 218
Blue: 255
34
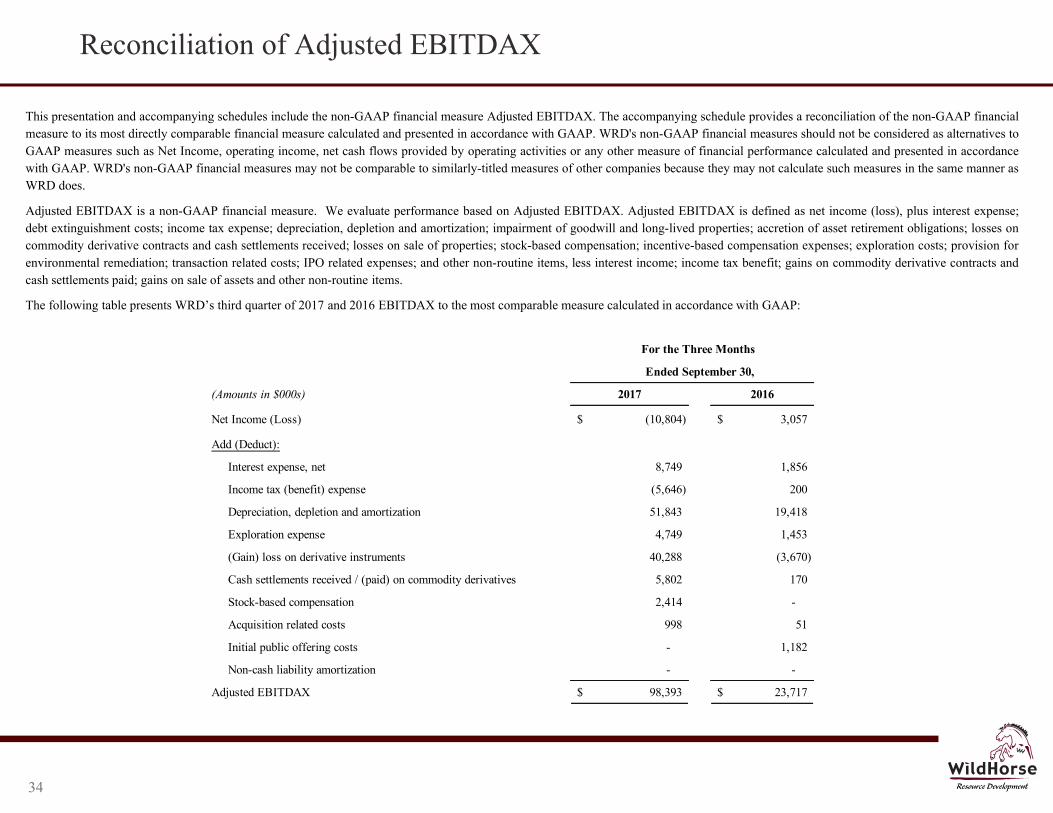
This presentation and accompanying schedules include the non-GAAP financial measure Adjusted EBITDAX. The accompanying schedule provides a reconciliation of the non-GAAP financial measure to its most directly comparable financial measure calculated and presented in accordance with GAAP. WRD's non-GAAP financial measures should not be considered as alternatives to GAAP measures such as Net Income, operating income, net cash flows provided by operating activities or any other measure of financial performance calculated and presented in accordance with GAAP. WRD's non-GAAP financial measures may not be comparable to similarly-titled measures of other companies because they may not calculate such measures in the same manner as WRD does.
Adjusted EBITDAX is a non-GAAP financial measure. We evaluate performance based on Adjusted EBITDAX. Adjusted EBITDAX is defined as net income (loss), plus interest expense; debt extinguishment costs; income tax expense; depreciation, depletion and amortization; impairment of goodwill and long-lived properties; accretion of asset retirement obligations; losses on commodity derivative contracts and cash settlements received; losses on sale of properties; stock-based compensation; incentive-based compensation expenses; exploration costs; provision for environmental remediation; transaction related costs; IPO related expenses; and other non-routine items, less interest income; income tax benefit; gains on commodity derivative contracts and cash settlements paid; gains on sale of assets and other non-routine items.
The following table presents WRD’s third quarter of 2017 and 2016 EBITDAX to the most comparable measure calculated in accordance with GAAP:
For the Three Months
Ended September 30,
(Amounts in $000s) 2017 2016
Net Income (Loss) (10,804)$ 3,057$
Add (Deduct):
Interest expense, net 8,749 1,856
Income tax (benefit) expense (5,646) 200
Depreciation, depletion and amortization 51,843 19,418
Exploration expense 4,749 1,453
(Gain) loss on derivative instruments 40,288 (3,670)
Cash settlements received / (paid) on commodity derivatives 5,802 170
Stock-based compensation 2,414 -
Acquisition related costs 998 51
Initial public offering costs - 1,182
Non-cash liability amortization - -
Adjusted EBITDAX 98,393$ 23,717$
Cautionary Statements and Additional Disclosures
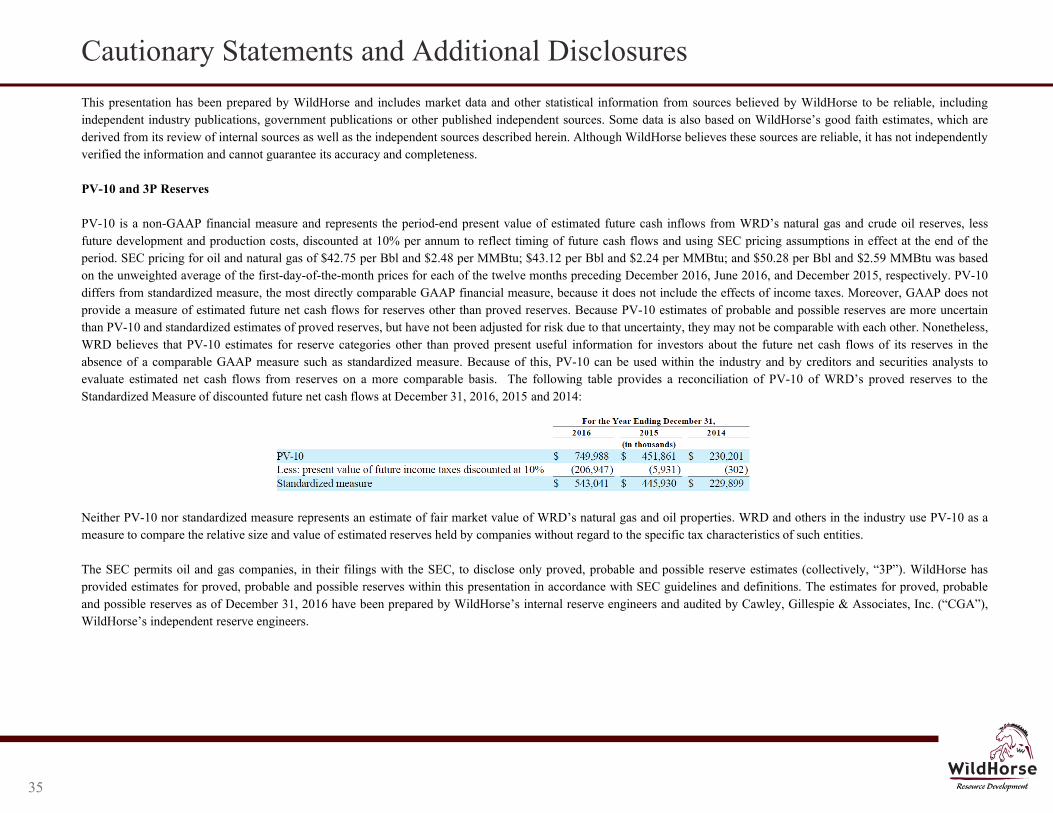
This presentation has been prepared by WildHorse and includes market data and other statistical information from sources believed by WildHorse to be reliable, including independent industry publications, government publications or other published independent sources. Some data is also based on WildHorse’s good faith estimates, which are derived from its review of internal sources as well as the independent sources described herein. Although WildHorse believes these sources are reliable, it has not independently verified the information and cannot guarantee its accuracy and completeness. PV-10 and 3P Reserves PV-10 is a non-GAAP financial measure and represents the period-end present value of estimated future cash inflows from WRD’s natural gas and crude oil reserves, less future development and production costs, discounted at 10% per annum to reflect timing of future cash flows and using SEC pricing assumptions in effect at the end of the period. SEC pricing for oil and natural gas of $42.75 per Bbl and $2.48 per MMBtu; $43.12 per Bbl and $2.24 per MMBtu; and $50.28 per Bbl and $2.59 MMBtu was based on the unweighted average of the first-day-of-the-month prices for each of the twelve months preceding December 2016, June 2016, and December 2015, respectively. PV-10 differs from standardized measure, the most directly comparable GAAP financial measure, because it does not include the effects of income taxes. Moreover, GAAP does not provide a measure of estimated future net cash flows for reserves other than proved reserves. Because PV-10 estimates of probable and possible reserves are more uncertain than PV-10 and standardized estimates of proved reserves, but have not been adjusted for risk due to that uncertainty, they may not be comparable with each other. Nonetheless, WRD believes that PV-10 estimates for reserve categories other than proved present useful information for investors about the future net cash flows of its reserves in the absence of a comparable GAAP measure such as standardized measure. Because of this, PV-10 can be used within the industry and by creditors and securities analysts to evaluate estimated net cash flows from reserves on a more comparable basis. The following table provides a reconciliation of PV-10 of WRD’s proved reserves to the Standardized Measure of discounted future net cash flows at December 31, 2016, 2015 and 2014: Neither PV-10 nor standardized measure represents an estimate of fair market value of WRD’s natural gas and oil properties. WRD and others in the industry use PV-10 as a measure to compare the relative size and value of estimated reserves held by companies without regard to the specific tax characteristics of such entities. The SEC permits oil and gas companies, in their filings with the SEC, to disclose only proved, probable and possible reserve estimates (collectively, “3P”). WildHorse has provided estimates for proved, probable and possible reserves within this presentation in accordance with SEC guidelines and definitions. The estimates for proved, probable and possible reserves as of December 31, 2016 have been prepared by WildHorse’s internal reserve engineers and audited by Cawley, Gillespie & Associates, Inc. (“CGA”), WildHorse’s independent reserve engineers.
35
Cautionary Statements and Additional Disclosures
WRD has provided summations of its proved, probable and possible reserves and summations of its PV-10 for its proved, probable and possible reserves in this presentation. The SEC strictly prohibits companies from aggregating proved, probable and possible reserves in filings with the SEC due to the different levels of certainty associated with each reserve category. Investors should be cautioned that estimates of PV-10 of probable reserves, as well as the underlying volumetric estimates, are inherently more uncertain of being recovered and realized than comparable measures for proved reserves, and that the uncertainty for possible reserves is even more significant. Further, because estimates of probable and possible reserve volumes have not been adjusted for risk due to this uncertainty of recovery, their summation may be of limited use. Actual quantities that may be ultimately recovered from WildHorse’s interests may differ substantially from the estimates in this presentation. Factors affecting ultimate recovery include the scope of WildHorse’s ongoing drilling program, which will be directly affected by commodity prices, the availability of capital, drilling and production costs, availability of drilling services and equipment, drilling results, lease expirations, transportation constraints, regulatory approvals and other factors, and actual drilling results, including geological and mechanical factors affecting recovery rates. “EUR” or “Estimated Ultimate Recovery,” when referring to a currently producing well, refers to the sum of total gross remaining proved reserves attributable to each location in WildHorse’s reserve report and cumulative sales from such location. EUR is shown on a combined basis for oil/condensates, gas and NGLs after the effects of processing. These quantities do not necessarily constitute or represent reserves within the meaning of the Society of Petroleum Engineers Petroleum Resource Management System or the SEC’s rules. Management Locations WRD has disclosed net horizontal drilling locations in this press release in the proved, probable, and possible categories as audited by CG&A as well as 1,599 drilling locations that have been identified by WRD’s management including 949 locations associated with the Acquisition. WRD identified those additional locations using the same methodology as those locations to which probable and possible reserves are attributed—by using existing geologic and engineering data from vertical production and seismic data. Of those 3,299 net horizontal drilling locations, 1,700 lie within the geographic areas to which proved, probable and possible reserves are attributed. The remaining 1,599 management identified net horizontal drilling locations are within geographic areas to which proved, probable or possible reserves are not attributed, but nonetheless are locations that WRD has specifically identified based on its evaluation of applicable geologic and engineering data accrued over our multi-year historical drilling activities in the surrounding area. The locations have been identified by WRD’s management based on its evaluation of applicable geologic and engineering data from historical drilling activities in the surrounding area. The locations on which WRD actually drills wells will ultimately depend upon the availability of capital, regulatory approvals, seasonal restrictions, oil and natural gas prices, costs, actual drilling results and other factors, and may differ from the locations currently identified.
36
Cautionary Statements and Additional Disclosures
Cash General and Administrative Expenses Our presentation of cash general and administrative ("G&A") expenses is a non-GAAP measure. We define cash G&A as total G&A determined in accordance with U.S. GAAP less non-cash equity compensation expenses, and we may express it on a per boe basis. We report and provide guidance on cash G&A per boe because we believe this measure is commonly used by management, analysts and investors as an indicator of cost management and operating efficiency on a comparable basis from period to period. In addition, management believes cash G&A per Boe is used by analysts and others in valuation, comparison and investment recommendations of companies in the oil and gas industry to allow for analysis of G&A spend without regard to stock-based compensation programs which can vary substantially from company to company. Cash G&A per boe should not be considered as an alternative to, or more meaningful than, total G&A per boe as determined in accordance with U.S. GAAP and may not be comparable to other similarly titled measures of other companies. Calculation of Net Debt Net Debt is a supplemental non-GAAP financial measure that is used by external users of WRD’s financial statements. We define Net Debt as total debt minus cash and cash equivalents. We believe Net Debt is useful to investors because it provides readers with a more meaningful measure of our outstanding indebtedness. However, this measure is provided in addition to, not as an alternative for, and should be read in conjunction with, the information contained in our financial statements prepared in accordance with GAAP. Calculation of Return on Capital Employed (“ROCE”) Simmons Equity Research calculates ROCE (on a pre-tax basis) as adjusted Earnings Before Interest and Taxes (“EBIT”) divided by adjusted capital employed. Adjusted EBIT excludes impairments, unrealized hedging, exploration expense, dry hole expense, asset retirement obligations (“ARO”) and any gains or losses on divestitures (if included in revenues). Adjusted capital employed equals adjusted equity plus debt, preferred stock and minority interest. Adjusted equity utilizes 2009 shareholder’s equity and adds the following items on a rolling basis: impairments, unrealized hedging, exploration expense, dry hole expense and ARO expense.
37