Embed Size (px)
Citation preview

Analysis of Variance ANOVA
Professor F. Marefat
Maryam Bolouri

ANOVA and t-test In ANOVA, we will compare three or more
means and the measure of variability used is variance.
In the t-test we compared two means and we also used the standard deviation of the data as measurement of variability in each group as well.

The ANOVA procedure is a powerful and versatile test, for it allows us to compare
several means simultaneously.
the designs that use ANOVA may be 1-way to n-way comparisons. The more directions in which comparisons are drawn,, the more
difficult the interpretation of results becomes.
The type of ANOVA
between-groups comparison repeated-measures comparisons mixed design

Goal of ANOVA The goal of ANOV A is to explain the variance
in the dependent variable in terms of variance in the independent variables. In a one-way design, there is only one dependent variable and only one independent variable with three or more levels.
The comparisons of the means on the dependent variable are made across the
levels

. The levels, however, may be within-groups, a repeated-measures design where the same Ss do different tasks or the same task at different times
between-subjects, where each group is composed of different Ss.
When we compare the scores of our students before instruction, and every two weeks, the comparison is within-groups. When we compare the final exam scores of students in five sections of a course, the comparison is between groups.

Balanced and Unbalanced designs
Designs that are balanced (sometimes called orthogonal) have equal n sizes for all the groups and subgroups to be compared.
Unbalanced designs (non-orthogonal) are those where some groups have more Ss or observations than others.

1. ONE-WAY BETWEEN-GROUPS ANOVA
It will tell you whether there are significant differences in the mean scores on the dependent variable across the groups.
Post-hoc tests can then be used to find out where these differences lie.
In the t-test. we obtained a t-value. In ANOVA, we will obtain an F value. The F value is the ratio of the two sources of variance--between-groups variance over within-group variance.


The assumptions of One-way btw groups ANOVA are:
1. There is one dependent variable and one independent variable ·with three or more levels.
2. The data arc scores or ordinal scale data that are continuous.
3. The data are independent (not repeated-measures).4. There is a normal distribution of scores in each
group. That is, X and variance are the best descriptions of the data.
5. The data in the respective populations from which the samples arc drawn arc normally distributed.
The assumptions of One-way btw groups ANOVA are:
6. There arc equal variances of scores in each group (balanced group)
7. The F statistic allows us to reject or accept the null hypothesis. If there is a statistically significant difference in the groups, it docs not pinpoint precisely where that difference lies.
Tests for Locating Differences Among means
1. planning the comparison ahead of timeThis belief would be built on previous research or on
strong theoretical arguments.2. Post hoc comparison of means exploratory comparisons arc made between all the
different groups The two methods are sometimes called a priori for
the preplanned comparisons and post hoc are carried out after the fact.

Strength of Association: omega2 It talks about the strength of the association in
the data for balanced designs. That is, you can determine the proportion of the
variability in the dependent variable that can be accounted for by the independent variable.
The omega 2 formula can only be used for balanced designs. If the design is not balanced, you can use the eta squared formula

ANOVA one way btw groups a statistical difference in a One-way ANOV A,
to reject the H0 • Post hoc tests to show you precisely which
means differ from each other the strength of the relationship using squared
omega 0.4----0.6 strong association

2. Repeated-Measures One-way ANOVA
Here we compare three or more groups when the data are taken from the same data source.
That is, data are taken from the same Ss at different points in time
Or on a set of different tasks at one time. The data
are not independent. In a one-way repeated measures ANOVA design,
each subject is exposed to two or more different conditions, or measured on the same continuous scale on three or more occasions.

assumptions include: 1. There is one dependent variable and one
independent variable with three or more levels.
2, The data arc from the same Ss (repeated-measures).
3. The data have been measured as ordinal scales or interval scores (continuous measurement).
4. Scores in each sample are normally distributed

assumptions include: 5. The data in the population from which the
samples were drawn is normally distributed with equal variances.
6. The design is balanced 7. There is a minimum of five observations per cell
(and more is better). 8. The F statistic allows us to reject or accept the
null hypothesis. lf there is a statistically significant difference in the samples, it docs not pinpoint precisely where that difference lies.

Tests for Locating Differences Among means
In order to pinpoint the location of the difference, the researcher can use a multiple-range test. Again, the Scheffe, Tukey,
Newman-Keuls are commonly used for this purpose.

eta2 for Repeated-measures omega 2 gives a more conservative estimate than eta 2 • However, with repeated-measures or unbalanced
designs, remember to use the appropriate test of association--eta 2
•

How to run SPSS for ANOVA btw groups
1. Analyze—compare means—one way ANOVA2. Identify dep and indep variables3. Options:Descriptive, Homogeneity of variance test, Brown-
Forsythe, Welch and Means Plot.4. Missing values mark Exclude cases analysis by
analysis5. Post Hoc Tukey.

Interpretation of output from one-way between-groups
ANOVA with post-hoc tests

If this number is greater than .05 (e.g. .08, .28), you have not violated the assumption of homogeneity of variance.The homogeneity of variance option gives you Levene’s test for homogeneity of variances, which tests whether the variance in scores is the same for each of the three groups.

This table gives both between-groups and within-groups sums of squares, degrees of freedom etc.
If the Sig. value is less than or equal to .05 (e.g. .03, .001), there is a signifi cant difference somewhere among the mean scores on your dependent variable for the three groups.

If you have found that you violated the assumptionof homogeneity of variance., you will need to consult the table in the output headed Robust Tests of Equality of Means.

The post-hoc tests in this table will tell you exactly where the differences among the groups occur.Look for any asterisks (*) next to the values listed.If you find an asterisk, this means that the two groups being compared are significantly different from one another at the p<.05 level.

Calculating effect size The omega 2 formula can only be used for
balanced designs. If the design is not balanced, you can use the eta squared formula.
You need a calculator and ANOVA table

effect size Cohen classifies .01 as a small effect, .06 as a medium effect .14 as a large effect.
Always interpret your results carefully, taking into account all the information you have available.
Don’t rely too heavily on statistical significancemany other factors also need to be considered.

How to report? A one-way between-groups analysis of variance was
conducted to explore the impact of X on Y Participants were divided into n groups according to
the levels of X There was a statistically significant difference at the
p < .05 level in Y scores for the n X groups: F (df btw, df within) = A p = .01. The effect size, calculated using eta squared, was B.
Post-hoc comparisons using the Tukey test indicated that the mean score for Group n1 (M = ?, SD = ?) was significantly different from Group n5(M = ?, SD = ?).

How to run SPSS for ONE-WAY REPEATED MEASURES ANOVA
Analyze-General Linear Model-Repeated Measures.
Within Subject Factor Name and number of levels
Within Subjects Variables Tick the Descriptive Statistics and Estimates of effect
size Factor and Factor Interactions section/
independent variable name Tick Compare main effects. Confidence interval adjustment section/
Bonferroni.

Interpretation of output from one-way repeated measuresANOVA
Descriptive statistics

Multivariate teststhe most commonly reported statistic is Wilks’
LambdaEffect size
Using the commonly used guidelines proposed by Cohen

Pair wise comparisonsthere is a difference somewhere among your groups.

How to report? A one-way repeated measures ANOVA was
conducted to compare scores on the X at Time 1, 2, 3…
There was a significant effect for time, Wilks’ Lambda = .?, F (hypo df, error df) = ?, p < .0005, multivariate partial eta squared = ?

The research paper for the analysis
1) One way btw group ANOVAThe valuation of knowledge and normative
reflection in teacher qualificationA comparison of teacher educators, novice
and experienced teachers Jokim Caspersen Teaching and Teacher Education 30 (2013) 109-119

Purpose of Study Teacher educators’, novice teachers’ and
experienced teachers’ valuation of the academic, practical and normative demands of teaching are compared using survey data from teacher education and schools
The article aims to establish whether different groups within the teaching profession have a common understanding of the teacher role.

Research hypotheses
1. Teacher educators emphasize academic knowledge more than teachers in schools.
2. Teachers in school emphasize practical skills more than teacher educators.

Participants a cross-sectional survey of 111 Norwegian
schools, was distributed by e-mail during the summer of 2008; an overall response rate of 62% was achieved. Of the 2205 teachers who
responded, 218 (3 years of experience or less)=novice 677 (8-15 years of experience) 19 of 20 teacher education institutions: 547 teacher educators.

Instrument To examine attitudes toward theoretical and practical knowledge, Survey respondents were
first asked to rate 10 statements on what it takes to be a successful teacher in compulsory education today, on a scale from 1, not
important, to 6, very important.

Procedures
To examine the differences between various groups a one-way Analysis of Variance (ANOVA) was followed by the Scheffé post hoc test to identify significant differences; this allows us to compare group means on different statements.

Resultshypo 1
All three groups considered academic knowledge to be an important part of teacher competence, with a mean score of 5.2 for teacher educators and experienced teachers, and 5.1 for novice teachers. Thus, hypothesis 1a, that teacher educators valued academic knowledge more than the other
two groups, was not supported.

Hypo 2
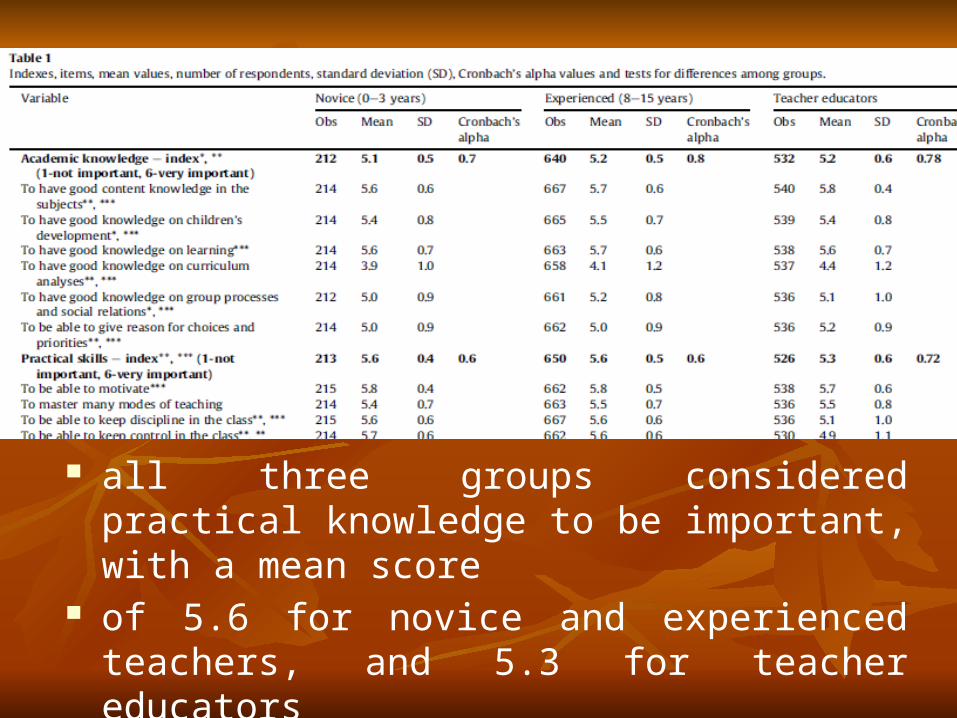
all three groups considered practical knowledge to be important, with a mean score
of 5.6 for novice and experienced teachers, and 5.3 for teacher educators
So hypothesis 2 is partially supported

Results The results of the hypothesis testing seem to
show that teacher educators do not emphasize theoretical knowledge any more than school teachers; thus, hypothesis 1a is rejected. However, compared with teacher educators, teachers in schools seem to place a greater emphasis on practical skills, at least skills concerning order and discipline; hence, hypothesis 1b is partially supported.

The research paper for the analysis
repeated measure ANOVA
A Dynamic System Approach to Willingness to Communicate:
Developing an Idiodynamic Method to Capture Rapidly Changing Affect
PETER D. MACINTYRE and JAMES JASON LEGATTO
Applied Linguistics 2011: 32/2: 149–171
Purpose of Study develops an Idiodynamic approach to
studying fluctuations in WTC that occur from moment-to-moment
a method to capture moment-to-moment changes in WTC
describe changes in WTC over a short period of time and the speaker’s own rationale for the changes.

Research questions To examine changes in WTC over eight communication tasks, some
easy and others difficult. 1 To what extent do the different tasks affect WTC and/or
the amount of speaking time, and do ratings of WTC correlate with speaking time?
2 To what extent do we see variation in WTC over time and is there evidence that a dynamic systems approach can be used to document changing
levels of WTC? 3 What attributions do the individual participants make for
increases and decreases in WTC? 4 Are there visible signs of affect, especially
anxiety, perceived by an interlocutor that are not discussed by the participants themselves
qualitatively)?

Participants The sample includes six female university students, 19–21 years old, all born in Canada,
who speak English as their L1, and all had been involved in a
French immersion program.

Instruments participants completed a questionnaire comprised of three scales
1. WTC, trait level (WTC-Trait; MacIntyre et al. 2003) in Eng and Fr-20 items
2. Anxiety (PRCA-24; McCroskey 1982)-24 items3. Extraversion (Eysenck and Eysenck 1975)-12
items

Procedure Eight oral tasks, presented in the following order (T1) Describe what you are wearing; (T2) Discuss the education system of your home
province in some detail; (T3) Discuss the role of Parliament in the Canadian
system of government; (T4) Order a complete meal as if in a restaurant;
(T5) Describe your hobbies; (T6) Describe what you see happening in this
painting; (T7) Count to 100 by 10s (T8) Give directions to [a local] shopping mall

Results Two within-subjects repeated measures analyses of
variance (ANOVAs) were conducted to examine whether mean dynamic WTC ratings or Speaking Time differed significantly over the eight task
A significant difference was found among the tasks on WTC, F(7, 35) = 3.72, P<0.01, partial-eta squared = 0.43. A Newman–Keuls post hoc analysis of means showed that WTC for T3-government was significantly lower (P<0.05) than WTC for T4,5,6,7.

Results A similar ANOVA revealed significant fluctuations in Speaking Time F(7, 35) = 3.14,
P<0.05, partial-eta squared = 0.39, with the largest difference recorded between speaking time for T3, T8.
Research article3
The effect of cooperative learning techniques on college
students’ reading comprehensionAlireza Jalilifar
System 38 (2010) 96–108

Purpose of the study This study investigated the impact two techniques
of Cooperative Learning, on students’ reading comprehension achievement of English as a Foreign Language (EFL).
The experimental groups (A and B) received instruction according to two techniques respectively whereas the control group was instructed via the Conventional Instruction (CI) technique which followed an individualistic
instructional approach based on the exercises in their regular textbook.
Participants A sample of 90 female college level students who
had registered for the course in General English was chosen based on a systematic random sampling from 140 students in Dehdasht, a city in the South West of Iran.
were divided into three homogeneous groups each with 30 students – two experimental groups (A and B), and a control group (C).

The difference among the participants’ scores on the Nelson English Language Proficiency Test was investigated using one-way ANOVA; F-value (.04) p = .95. This ensured that the three groups were about equal with reference to EFL proficiency before the treatment.
Results In order to investigate whether or not the
observed differences among the participants’ means on the posttest were statistically significant, one-way ANOVA was utilized. The F-value was statistically significant, F(2.87) = 3.46, p = .036. This confirms that the three groups behaved differently on the reading comprehension achievement test


A post hoc Scheffe test used to determine where precisely the significance lay revealed a significant mean difference (MD) between the experimental group (A) receiving instruction through STAD and the control group (C) instructed according to CI (MD = 2.06, p < 0.05). However, the difference between the achievement means of the experimental group receiving instruction through the GI technique and control group instructed through the CI technique (MD = 0.76, p > 0.05) was not statistically meaningful,
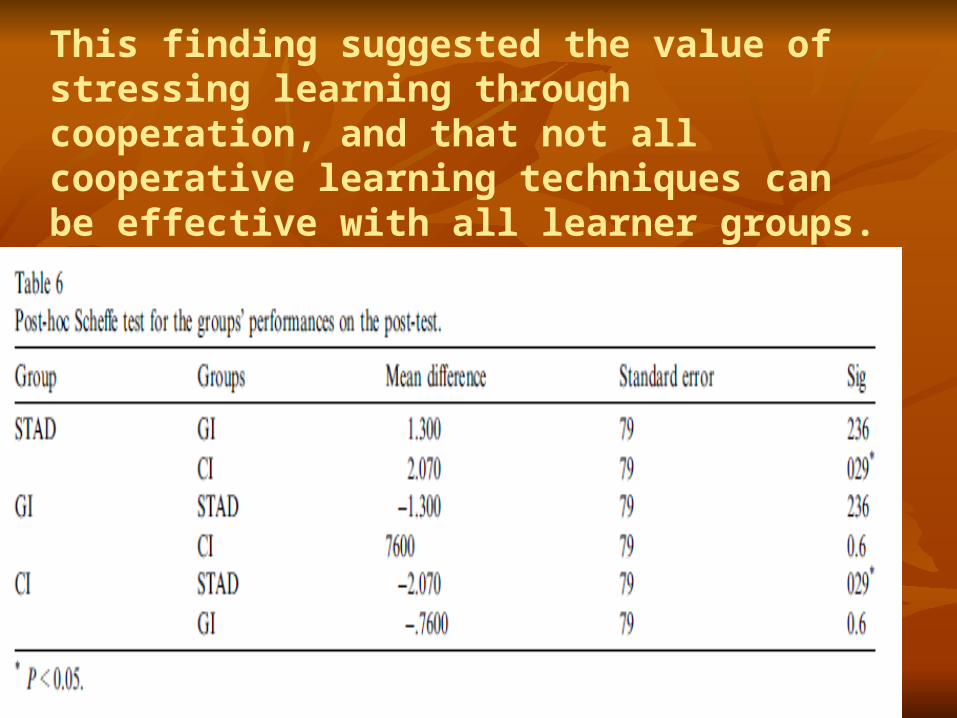
This finding suggested the value of stressing learning through cooperation, and that not all cooperative learning techniques can be effective with all learner groups.

Thank you all