Embed Size (px)
Citation preview
TVET & SOCIO-ECONOMIC DEVELOPMENT IN BANGLADESH:STEPS, CHALLENGES & WAYS FORWARD
Dr. Atiur Rahman
Professor, Dhaka University
Former Governor, Bangladesh Bank
A keynote address given at the International Conference on Skills for the Future World of Work and TVET for Global Competitiveness, 27-29 July 2017, Dhaka

TALKING POINTS
• Background
• Overview of TVET in Bangladesh
• Challenges
• Ways Forward

BACKGROUND
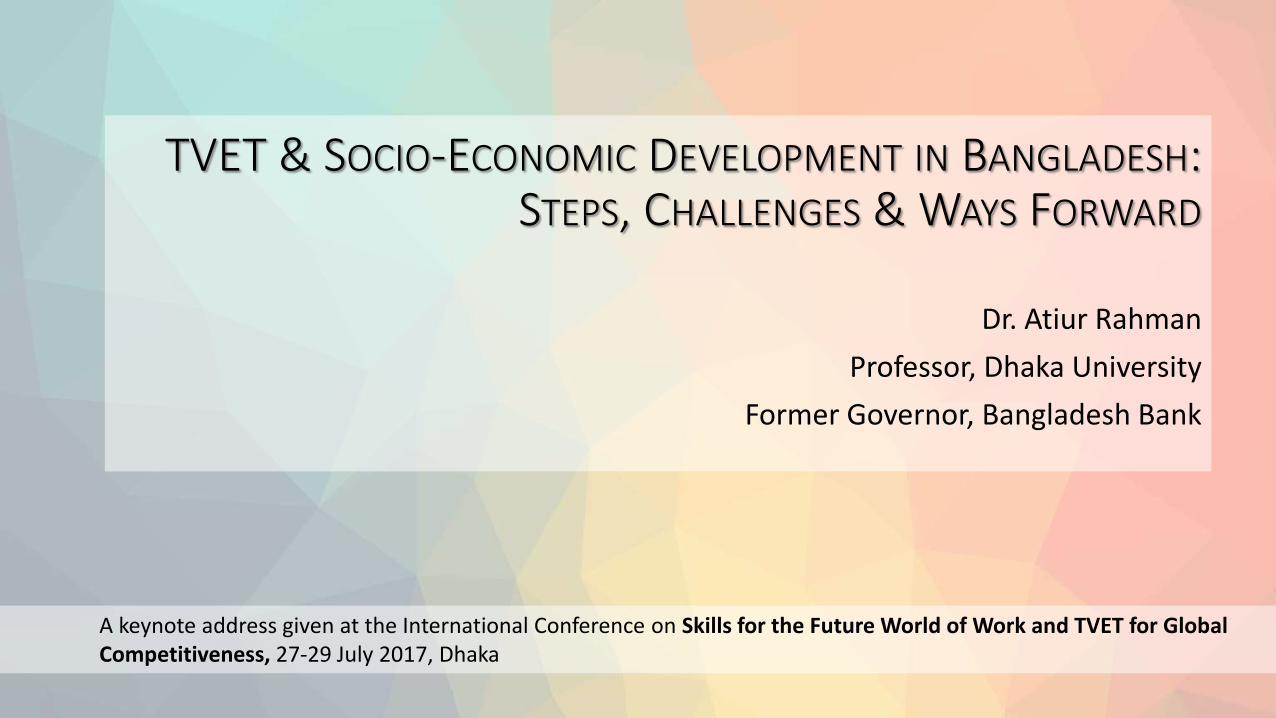
BANGLADESH AT THE CROSS-ROADS
• Undergoing amazing developmental transitions since independence despite many challenges.
• Some expert considered it to be a ‘basket case’ back then. Yet today it is a lower middle income country of 160 million people in the midst of critical transformations.
Rapid Urbanization
Growing Industrial Sector
Demographic Dividend
Extensive Digitization
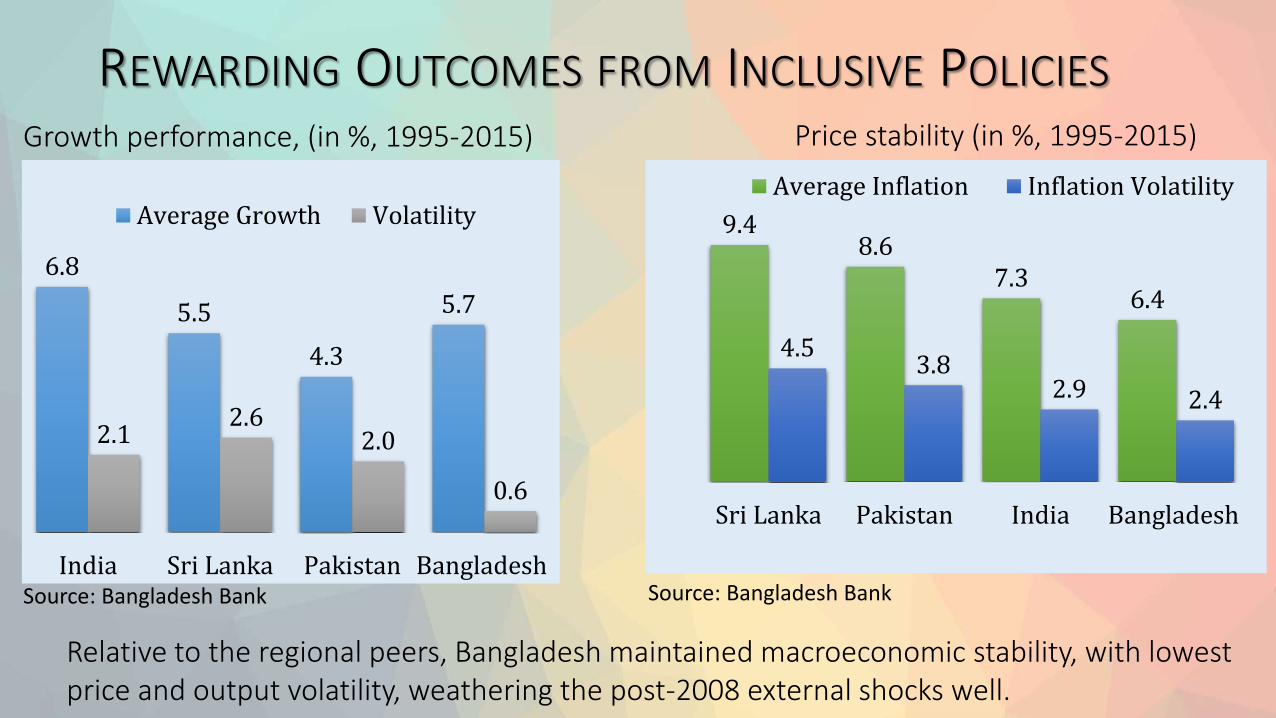
REWARDING OUTCOMES FROM INCLUSIVE POLICIES
Relative to the regional peers, Bangladesh maintained macroeconomic stability, with lowest price and output volatility, weathering the post-2008 external shocks well.
Growth performance, (in %, 1995-2015) Price stability (in %, 1995-2015)
6.8
5.5
4.3
5.7
2.12.6
2.0
0.6
India Sri Lanka Pakistan Bangladesh
Average Growth Volatility 9.48.6
7.36.4
4.53.8
2.9 2.4
Sri Lanka Pakistan India Bangladesh
Average Inflation Inflation Volatility
Source: Bangladesh Bank Source: Bangladesh Bank
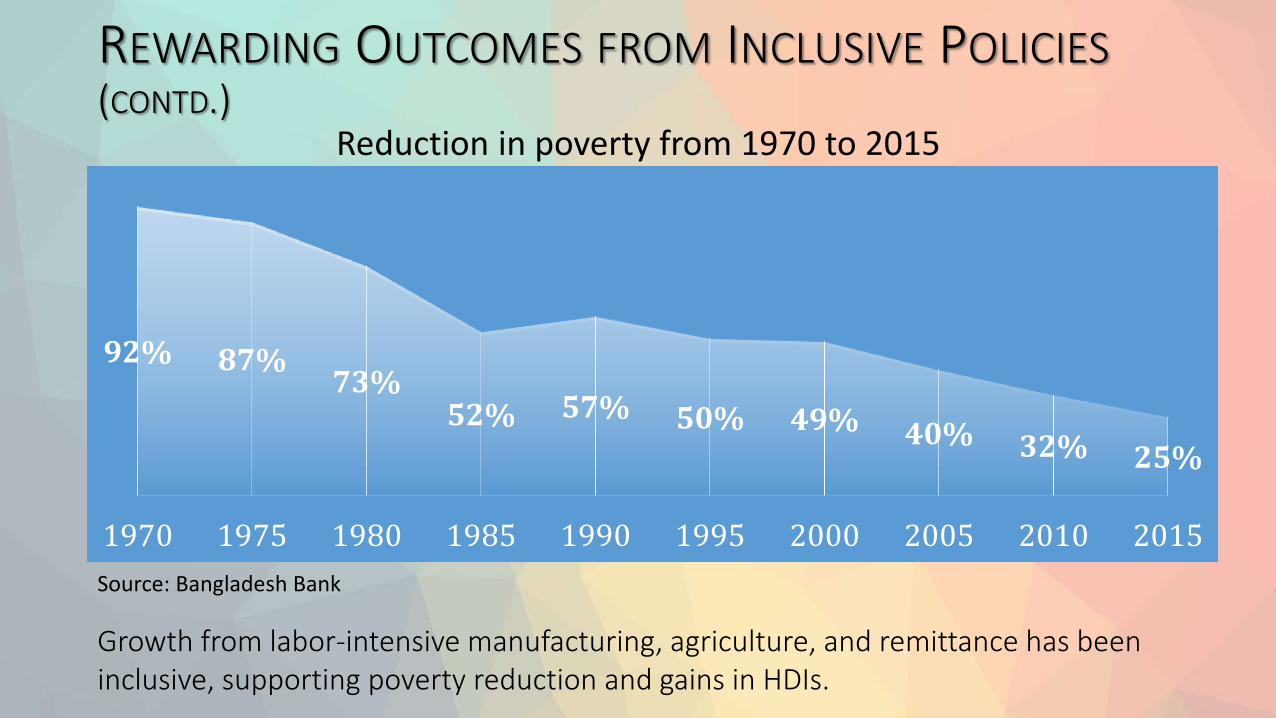
REWARDING OUTCOMES FROM INCLUSIVE POLICIES(CONTD.)
Growth from labor-intensive manufacturing, agriculture, and remittance has been inclusive, supporting poverty reduction and gains in HDIs.
92% 87%73%
52% 57% 50% 49% 40% 32% 25%
1970 1975 1980 1985 1990 1995 2000 2005 2010 2015
Reduction in poverty from 1970 to 2015
Source: Bangladesh Bank
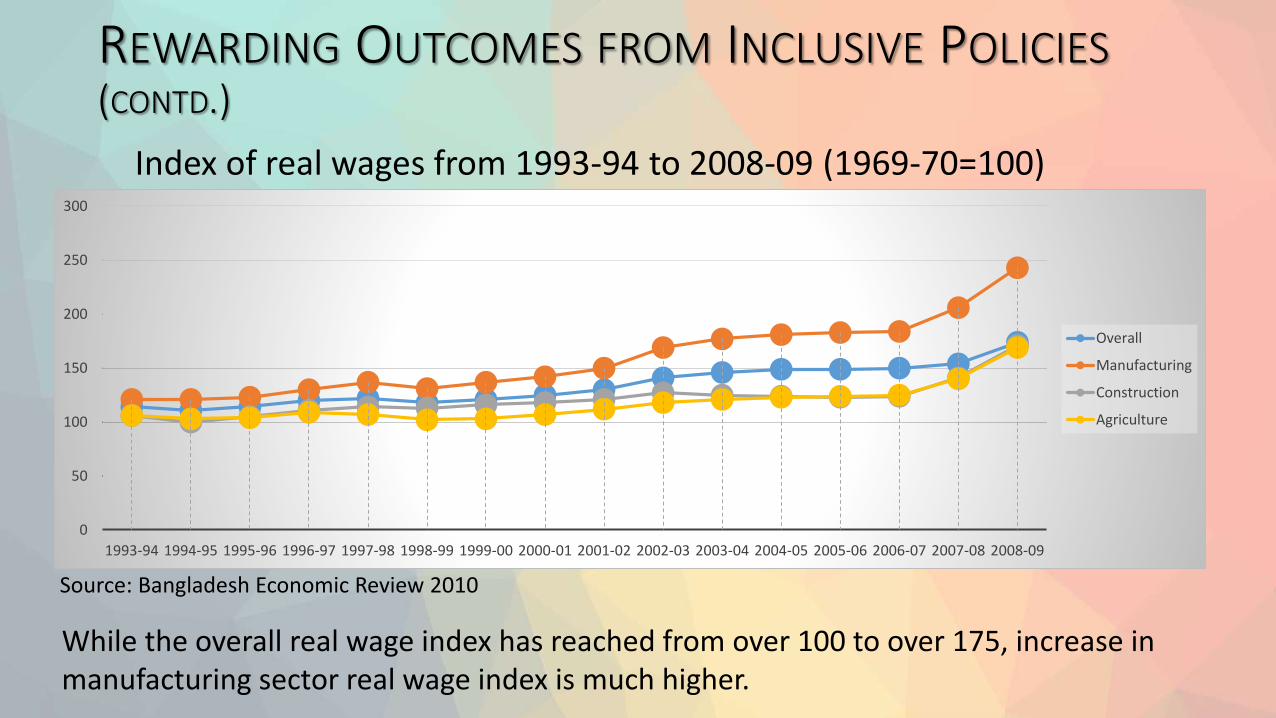
REWARDING OUTCOMES FROM INCLUSIVE POLICIES(CONTD.)
Index of real wages from 1993-94 to 2008-09 (1969-70=100)
0
50
100
150
200
250
300
1993-94 1994-95 1995-96 1996-97 1997-98 1998-99 1999-00 2000-01 2001-02 2002-03 2003-04 2004-05 2005-06 2006-07 2007-08 2008-09
Overall
Manufacturing
Construction
Agriculture
Source: Bangladesh Economic Review 2010
While the overall real wage index has reached from over 100 to over 175, increase in manufacturing sector real wage index is much higher.
BUT, ARE WE CREATING ENOUGH JOBS?
There are three areas to consider-
Our demographic dividend (possible advantages of the population structure).
Prevailing employment scenario (employment, underemployment and unemployment)
Skill level of our labor force.

VISUALIZING THE DEMOGRAPHIC DIVIDEND
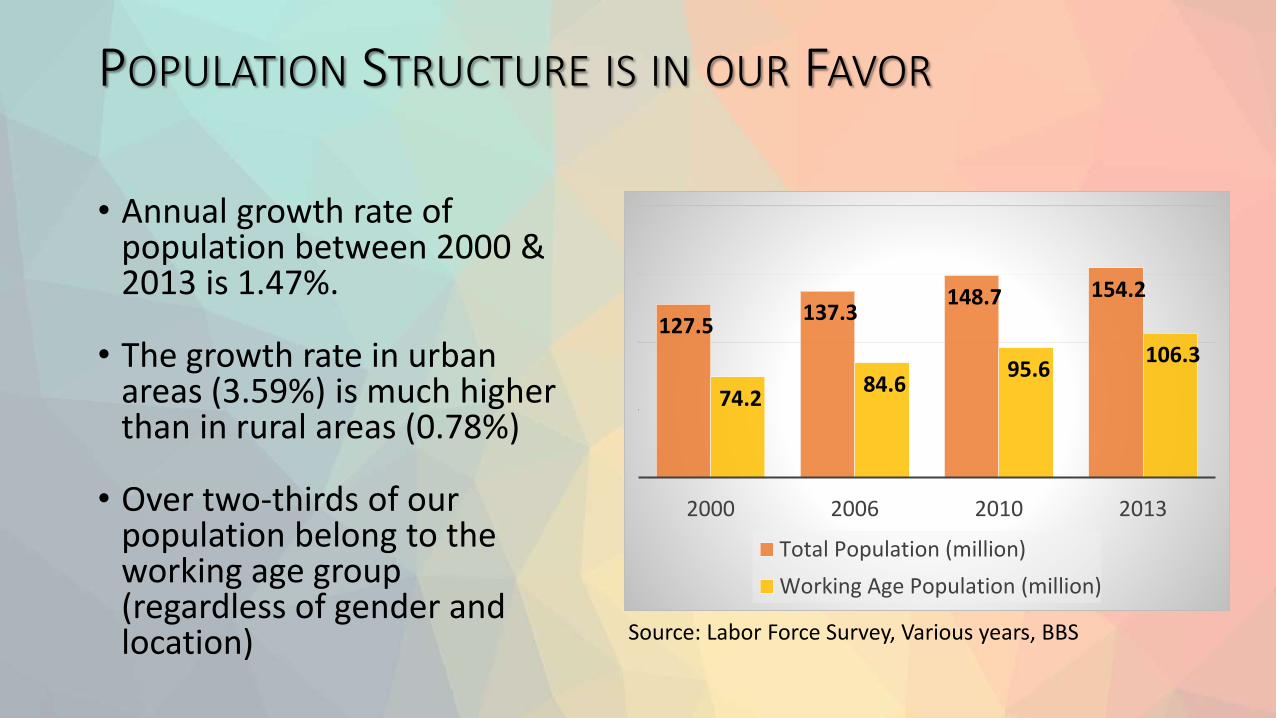
POPULATION STRUCTURE IS IN OUR FAVOR
• Annual growth rate of population between 2000 & 2013 is 1.47%.
• The growth rate in urban areas (3.59%) is much higher than in rural areas (0.78%)
• Over two-thirds of our population belong to the working age group (regardless of gender and location)
127.5 137.3
148.7 154.2
74.2 84.6
95.6 106.3
2000 2006 2010 2013
Total Population (million)
Working Age Population (million)
Source: Labor Force Survey, Various years, BBS
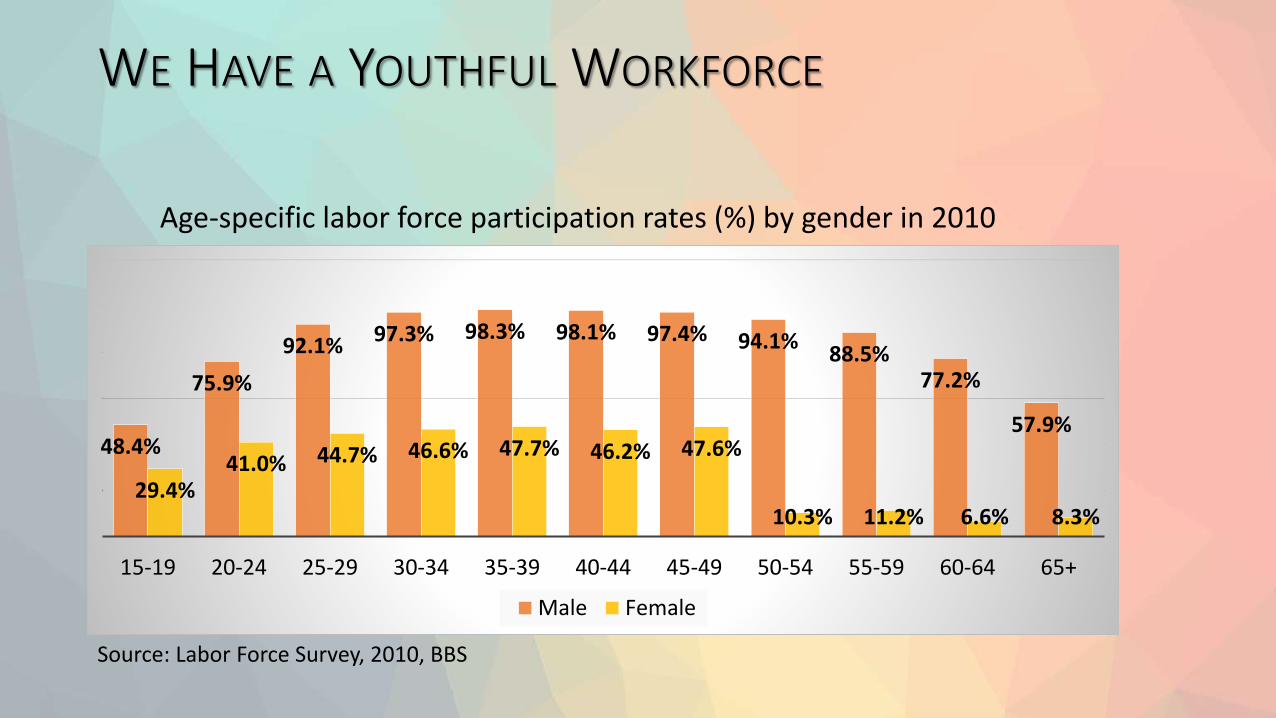
WE HAVE A YOUTHFUL WORKFORCE
Source: Labor Force Survey, 2010, BBS
48.4%
75.9%
92.1% 97.3% 98.3% 98.1% 97.4% 94.1%88.5%
77.2%
57.9%
29.4%41.0% 44.7% 46.6% 47.7% 46.2% 47.6%
10.3% 11.2% 6.6% 8.3%
15-19 20-24 25-29 30-34 35-39 40-44 45-49 50-54 55-59 60-64 65+
Male Female
Age-specific labor force participation rates (%) by gender in 2010

EMPLOYMENT SITUATION
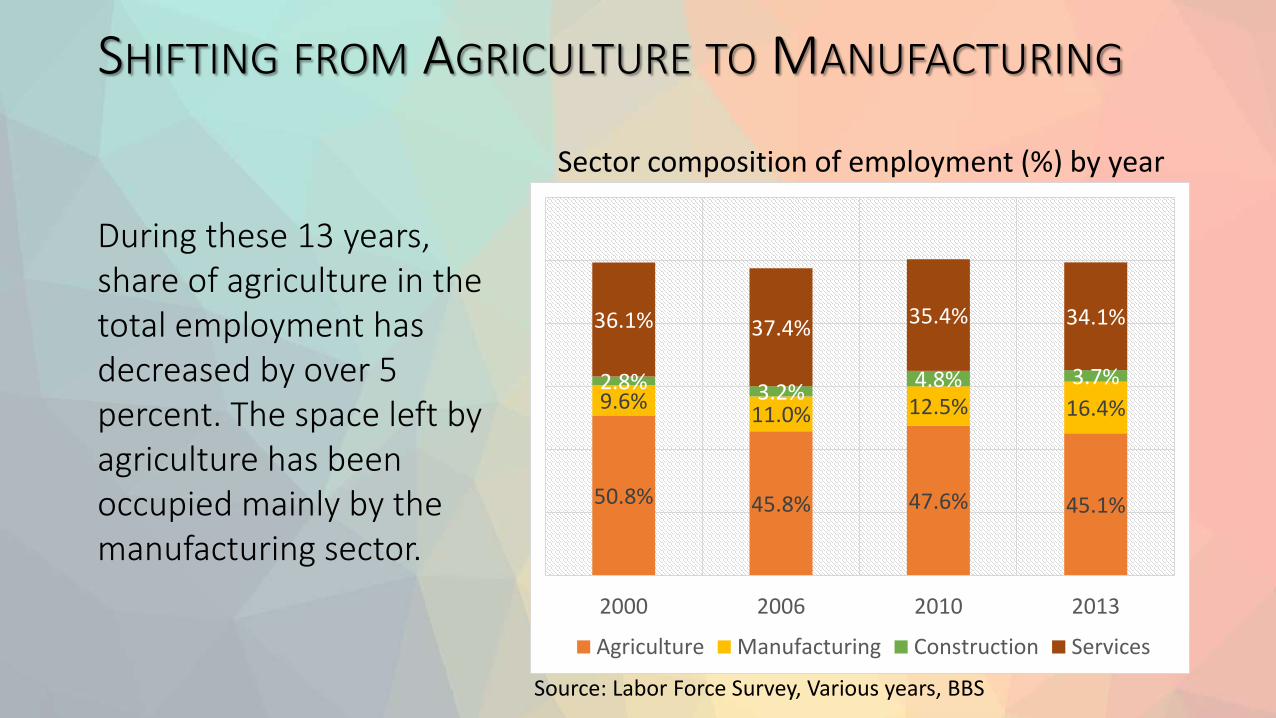
SHIFTING FROM AGRICULTURE TO MANUFACTURING
Sector composition of employment (%) by year
50.8% 45.8% 47.6% 45.1%
9.6%11.0% 12.5% 16.4%
2.8% 3.2%4.8% 3.7%
36.1% 37.4%35.4% 34.1%
2000 2006 2010 2013
Agriculture Manufacturing Construction Services
Source: Labor Force Survey, Various years, BBS
During these 13 years, share of agriculture in the total employment has decreased by over 5 percent. The space left by agriculture has been occupied mainly by the manufacturing sector.
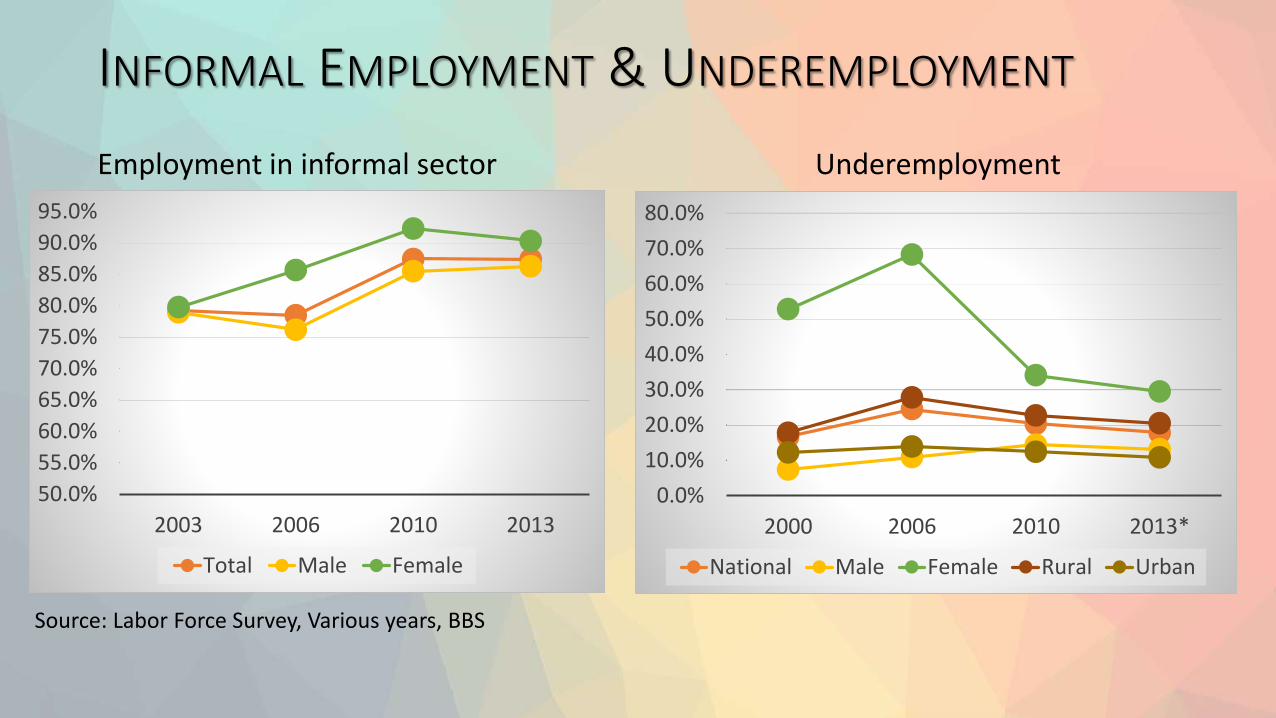
INFORMAL EMPLOYMENT & UNDEREMPLOYMENT
50.0%
55.0%
60.0%
65.0%
70.0%
75.0%
80.0%
85.0%
90.0%
95.0%
2003 2006 2010 2013
Total Male Female
0.0%
10.0%
20.0%
30.0%
40.0%
50.0%
60.0%
70.0%
80.0%
2000 2006 2010 2013*
National Male Female Rural Urban
Employment in informal sector Underemployment
Source: Labor Force Survey, Various years, BBS

DYNAMICS BETWEEN EDUCATION & EMPLOYMENT
Source: Labor Force Survey, 2013, BBS
Unemployment rate (%) in 2013, by gender and level of education1
3.5
8.5
8.4
11
.7
7.9
16
.2
8.7
12
1.9
11
18
.2
8.8 9.8
7 7.4
13
.2
8.7
17
.3
0.7
8.8
Male Female

EDUCATION OF THE WORKFORCE
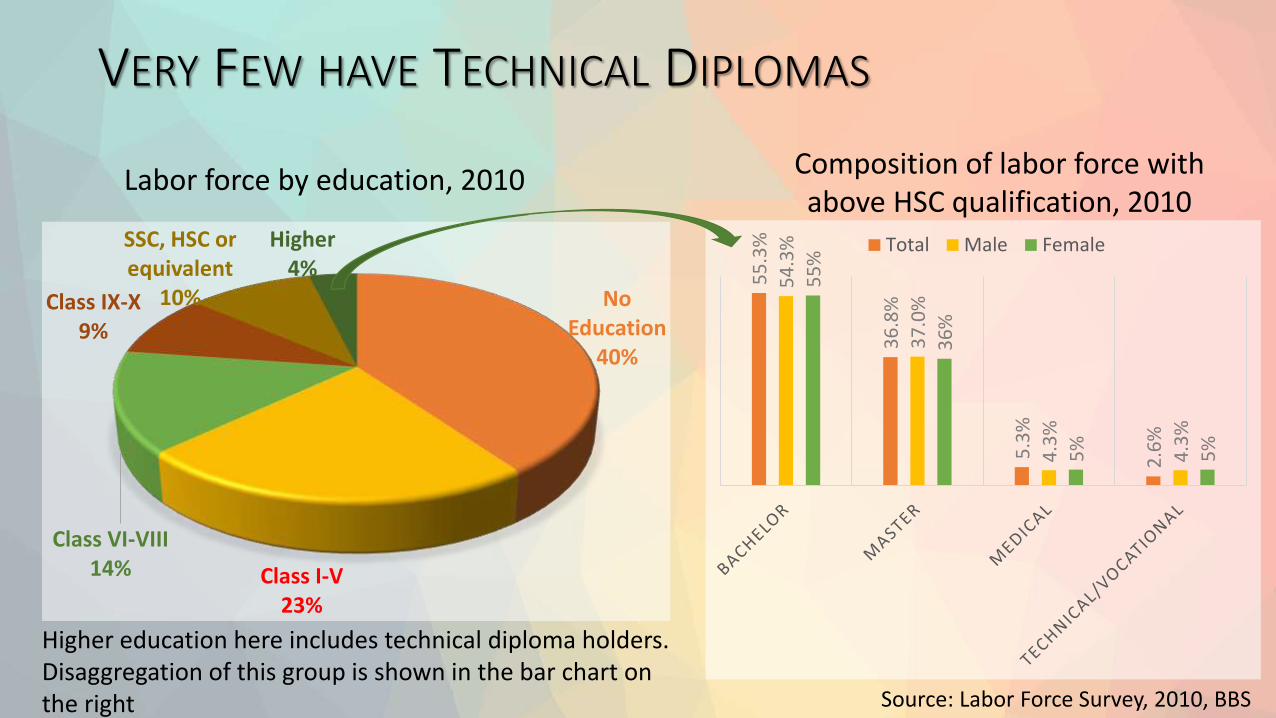
VERY FEW HAVE TECHNICAL DIPLOMAS
Labor force by education, 2010
Source: Labor Force Survey, 2010, BBS
No Education
40%
Class I-V23%
Class VI-VIII14%
Class IX-X9%
SSC, HSC or equivalent
10%
Higher4% 5
5.3
%
36
.8%
5.3
%
2.6
%
54
.3%
37
.0%
4.3
%
4.3
%
55
%
36
%
5%
5%
Total Male Female
Higher education here includes technical diploma holders. Disaggregation of this group is shown in the bar chart on the right
Composition of labor force with above HSC qualification, 2010
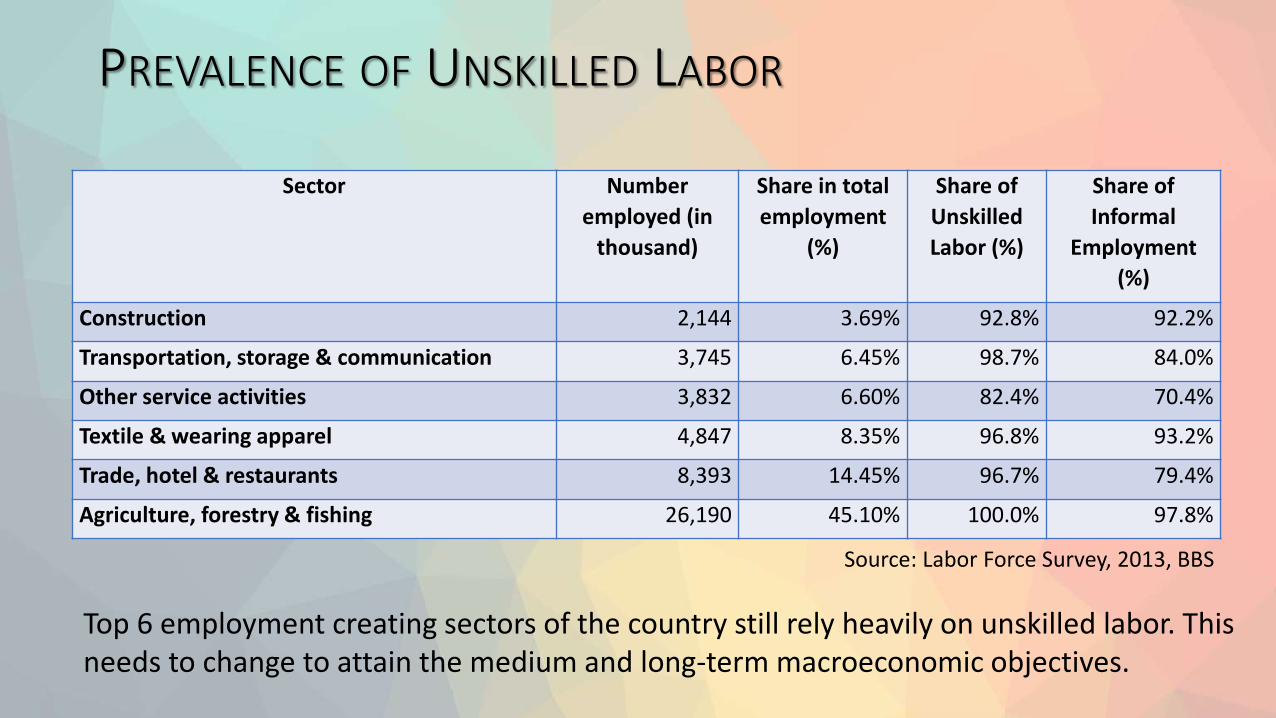
Top 6 employment creating sectors of the country still rely heavily on unskilled labor. This needs to change to attain the medium and long-term macroeconomic objectives.
Sector Number
employed (in
thousand)
Share in total
employment
(%)
Share of
Unskilled
Labor (%)
Share of
Informal
Employment
(%)
Construction 2,144 3.69% 92.8% 92.2%
Transportation, storage & communication 3,745 6.45% 98.7% 84.0%
Other service activities 3,832 6.60% 82.4% 70.4%
Textile & wearing apparel 4,847 8.35% 96.8% 93.2%
Trade, hotel & restaurants 8,393 14.45% 96.7% 79.4%
Agriculture, forestry & fishing 26,190 45.10% 100.0% 97.8%
PREVALENCE OF UNSKILLED LABOR
Source: Labor Force Survey, 2013, BBS
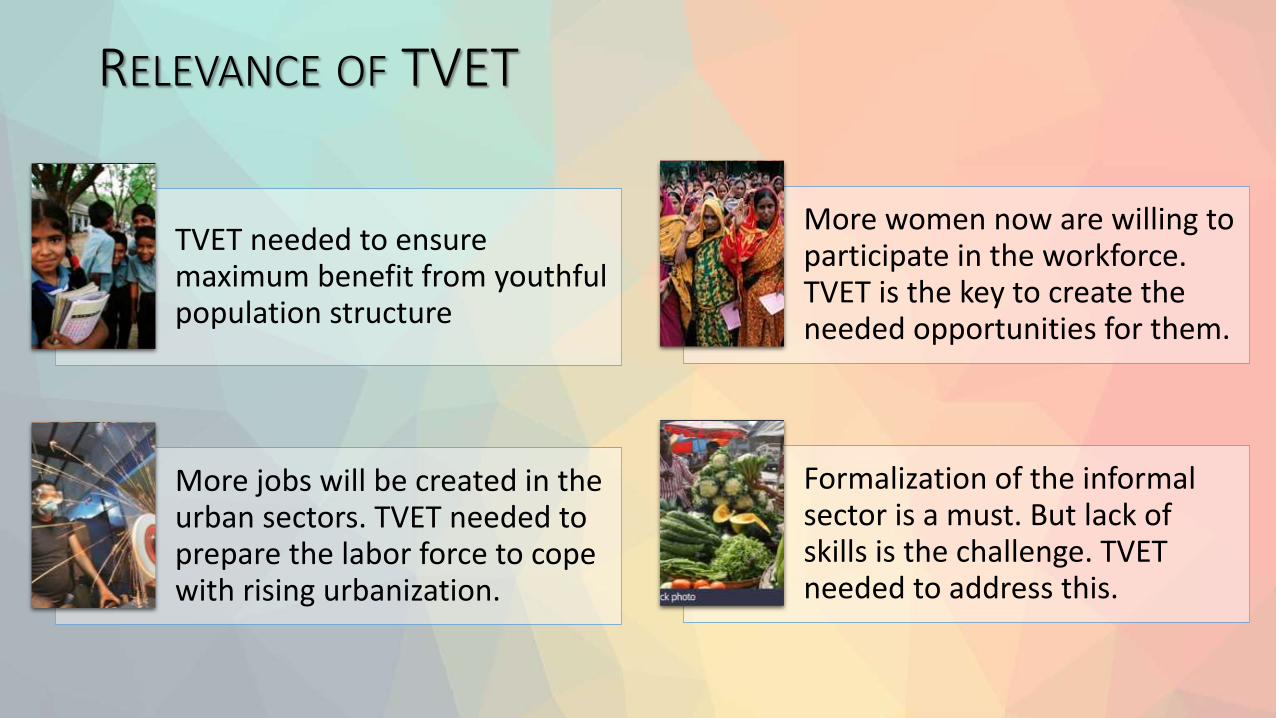
RELEVANCE OF TVET
TVET needed to ensure maximum benefit from youthful population structure
More jobs will be created in the urban sectors. TVET needed to prepare the labor force to cope with rising urbanization.
More women now are willing to participate in the workforce. TVET is the key to create the needed opportunities for them.
Formalization of the informal sector is a must. But lack of skills is the challenge. TVET needed to address this.

OVERVIEW OF TVET IN BANGLADESH
POLICY IMPETUS
• 7th Five Year Plan (2016-2020): Gender equity in TVET, new technical/vocational courses at school & college level, double shift in technical schools, 100 new technical schools at upazila level, emphasis on industry based training & workforce development.
• Vision 2021: Developing skilled manpower for both home & abroad.
• Education Policy 2010: Expansion, access and vertical mobility of TVET prioritized
• National Skills Development Policy: focuses on a demand-oriented strategy and looks for direct connection with the industry owners and overseas employers.

STRUCTURE OF TVET
Public and private polytechnic institutes offer four-year post-secondary engineering diploma courses.
Diploma
SSC (Vocational) & HSC (Vocational).
SSC (Vocational) is equivalent to general SSC.
Certificate
360-hour skills training course. Applicant has to pass at least grade VIII to get enrolled in this program.
Basic384 diploma
institutes covering 42 technological
areas. 50% student from SSC (Vocational). 25% from general SSC.
25% from SSC Dakhil.
TVET PROVIDERS
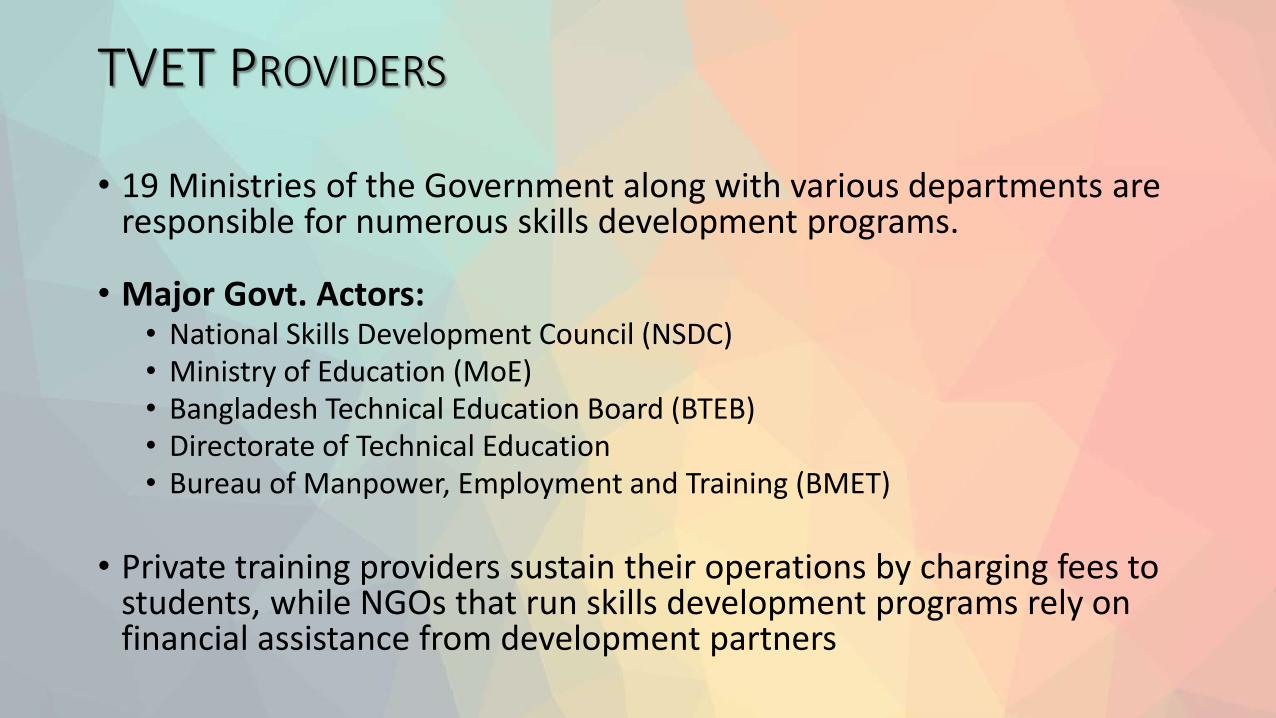
• 19 Ministries of the Government along with various departments are responsible for numerous skills development programs.
• Major Govt. Actors:• National Skills Development Council (NSDC)• Ministry of Education (MoE)• Bangladesh Technical Education Board (BTEB)• Directorate of Technical Education• Bureau of Manpower, Employment and Training (BMET)
• Private training providers sustain their operations by charging fees to students, while NGOs that run skills development programs rely on financial assistance from development partners
TVET PROVIDERS
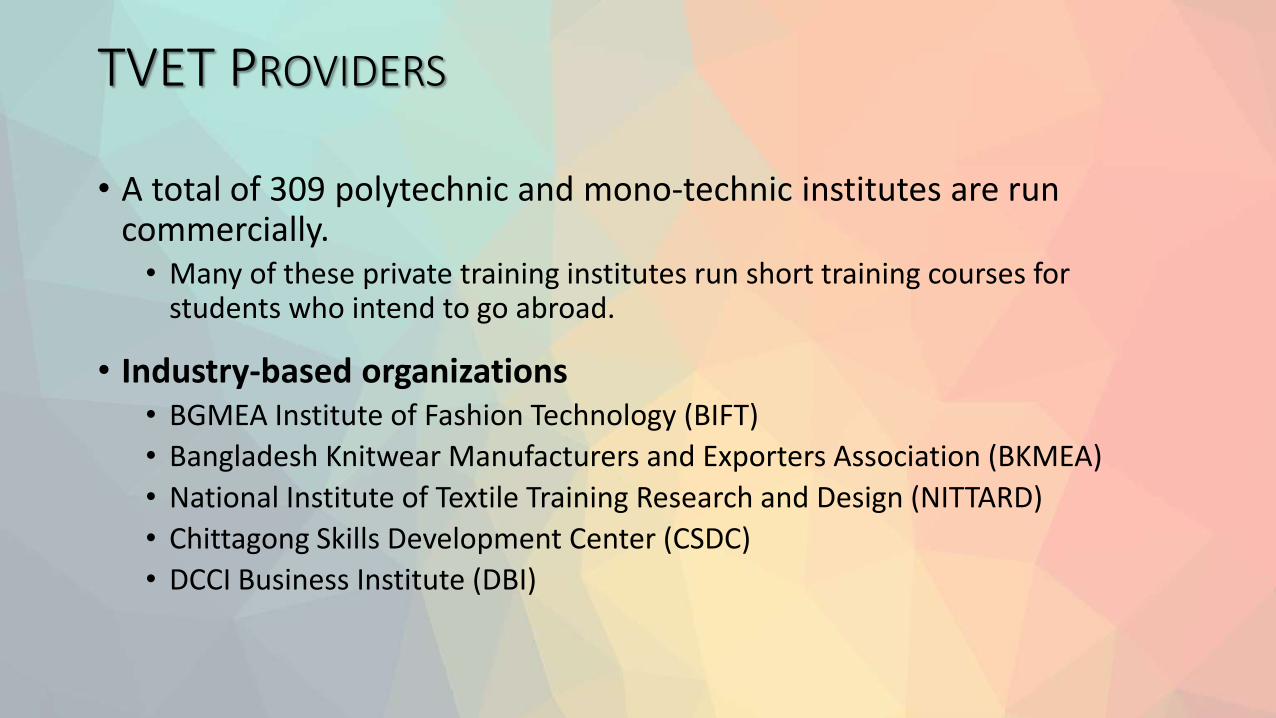
• A total of 309 polytechnic and mono-technic institutes are run commercially. • Many of these private training institutes run short training courses for
students who intend to go abroad.
• Industry-based organizations• BGMEA Institute of Fashion Technology (BIFT)
• Bangladesh Knitwear Manufacturers and Exporters Association (BKMEA)
• National Institute of Textile Training Research and Design (NITTARD)
• Chittagong Skills Development Center (CSDC)
• DCCI Business Institute (DBI)
SOME DEVELOPMENT PARTNER SUPPORTED TVET PROJECTS
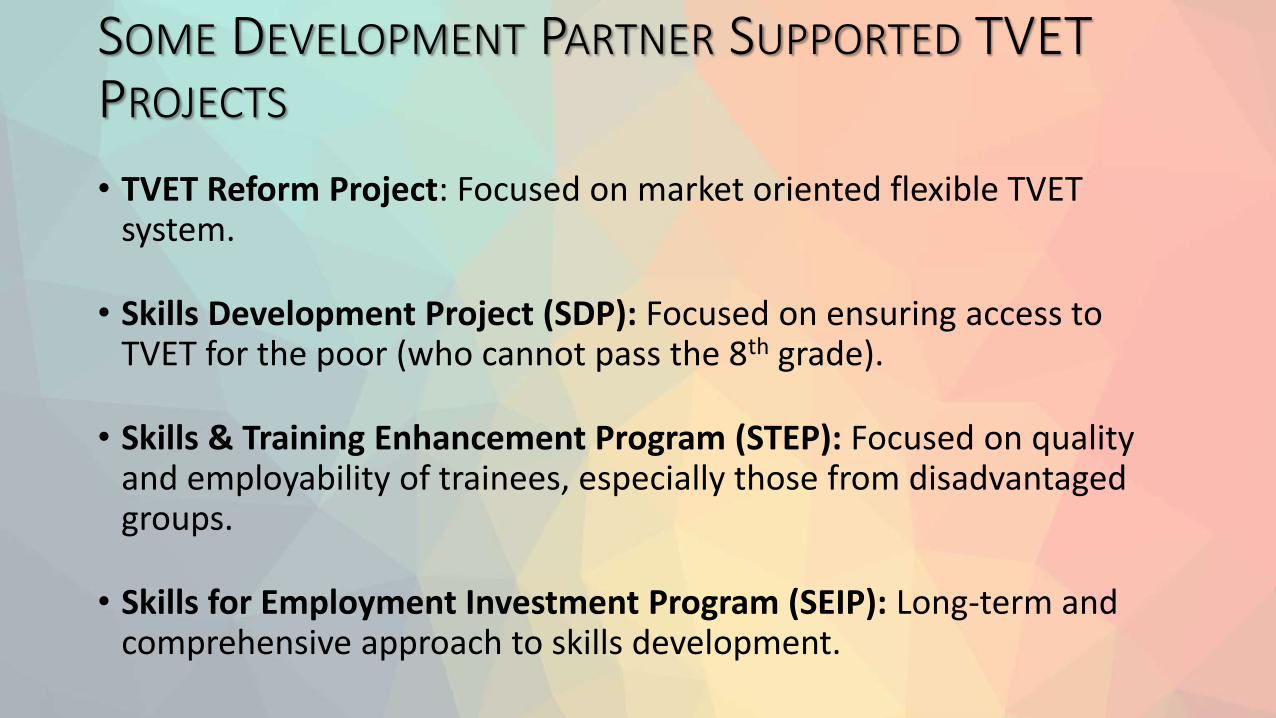
• TVET Reform Project: Focused on market oriented flexible TVET system.
• Skills Development Project (SDP): Focused on ensuring access to TVET for the poor (who cannot pass the 8th grade).
• Skills & Training Enhancement Program (STEP): Focused on quality and employability of trainees, especially those from disadvantaged groups.
• Skills for Employment Investment Program (SEIP): Long-term and comprehensive approach to skills development.

CHALLENGES
WHERE DO WE LACK?
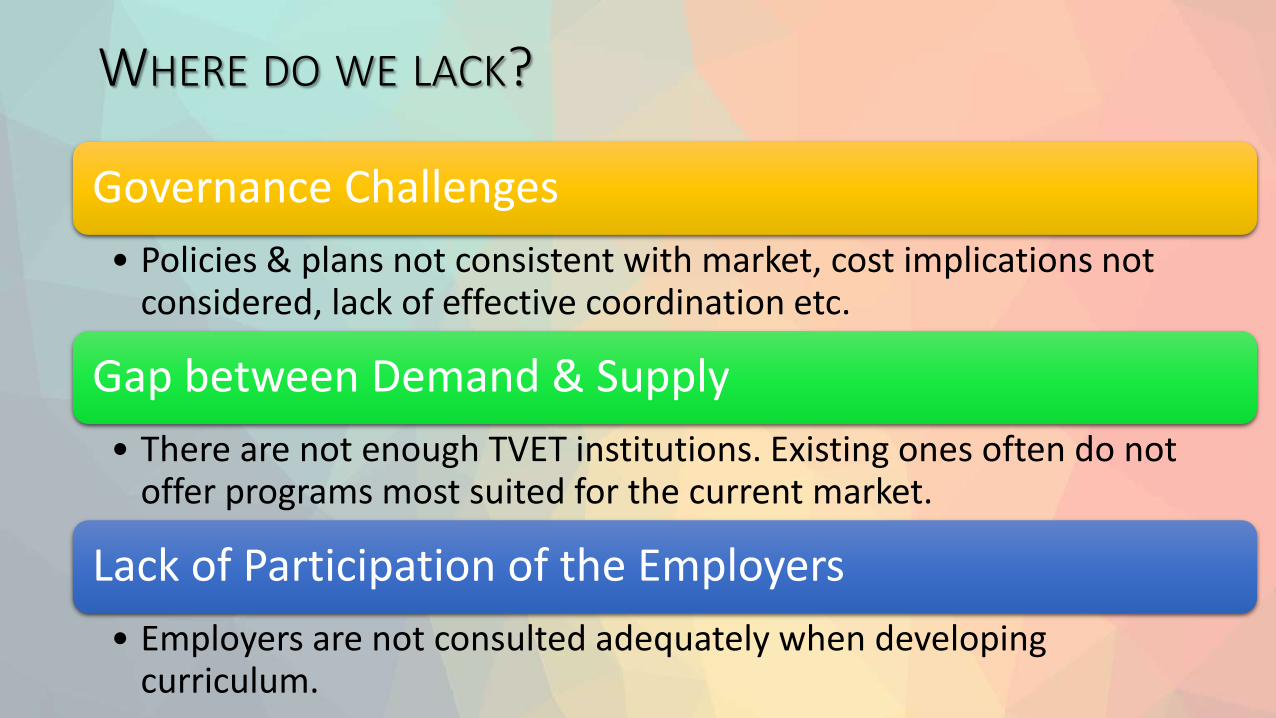
Governance Challenges
• Policies & plans not consistent with market, cost implications not considered, lack of effective coordination etc.
Gap between Demand & Supply
• There are not enough TVET institutions. Existing ones often do not offer programs most suited for the current market.
Lack of Participation of the Employers
• Employers are not consulted adequately when developing curriculum.
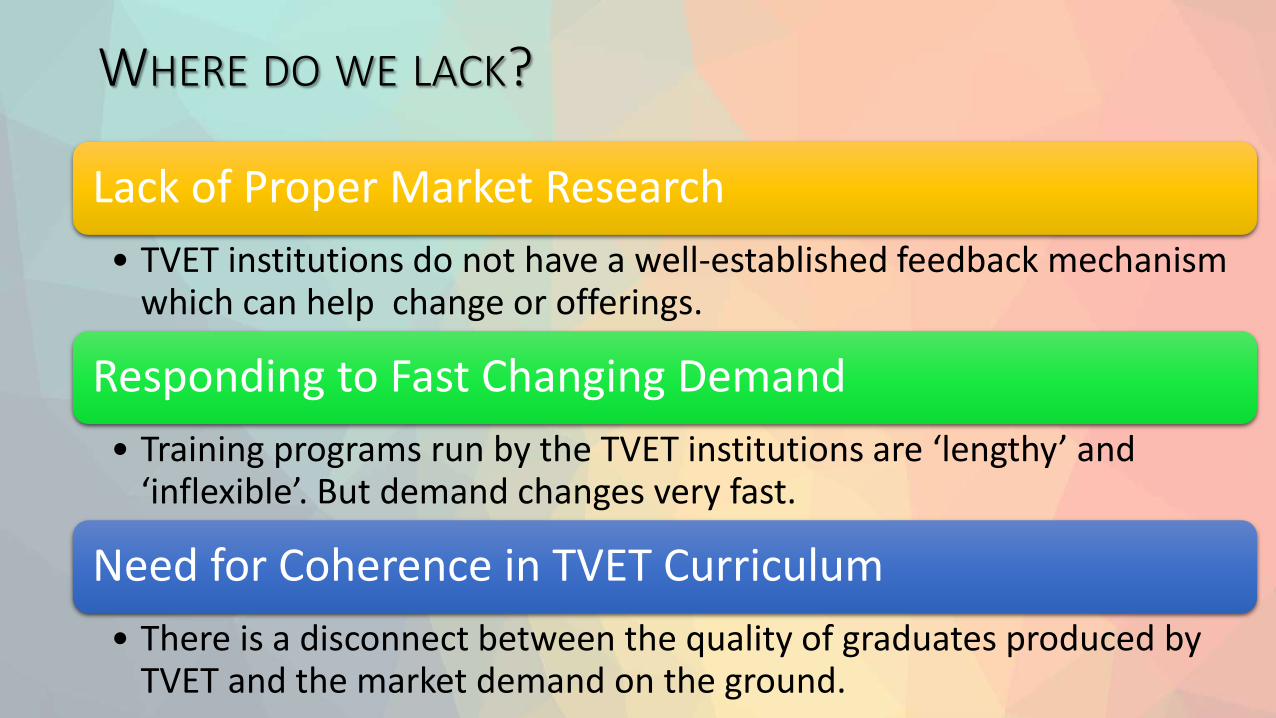
WHERE DO WE LACK?
Lack of Proper Market Research
• TVET institutions do not have a well-established feedback mechanism which can help change or offerings.
Responding to Fast Changing Demand
• Training programs run by the TVET institutions are ‘lengthy’ and ‘inflexible’. But demand changes very fast.
Need for Coherence in TVET Curriculum
• There is a disconnect between the quality of graduates produced by TVET and the market demand on the ground.

WAYS FORWARD
WAYS FORWARD
• Coherence of the policies related to TVET should be ensured.• While all the policies and plans intend to ensure greater access to TVET
system, improving the quality has not received equal emphasis.
• Studies should map out both current situation as well as project future demand (short and medium-term) for TVET.• Policy decision informed through such studies is sure to be more effective.
• Private sector will be naturally interested to participate in TVET related policy making. The public actors need to open up further to capitalize on this interest.
WAYS FORWARD
• TVET system must be able adapt to the changing global scenario (changing skill demand in the global market).• We should not limit ourselves to low paying jobs abroad.
• Instead of gigantic institutes we have to prefer smaller and more flexible institutes spread all over the country.
• Refurbishing existing institutes that lack resources and operational autonomy should be prioritized.
• Mindset must change. We still think desk-based jobs are more desirable than technical jobs.
CONCLUDING REMARKS
TVET can provide us with the opportunity of killing ‘two birds with one stone’.
It will make our youths ready for the changing job market.
It will ensure a stream of potential workforce for our growing industrial sector.

CONCLUDING REMARKS
“In Europe the society evolves itself to mould the minds of the younger generation … and education system tries to capture the direction of those minds.”
Rabindranath Tagore, 1398, Volume 13, Goal and Education, p.696