Embed Size (px)
Citation preview
Media Market OverviewBosnia & Herzegovina
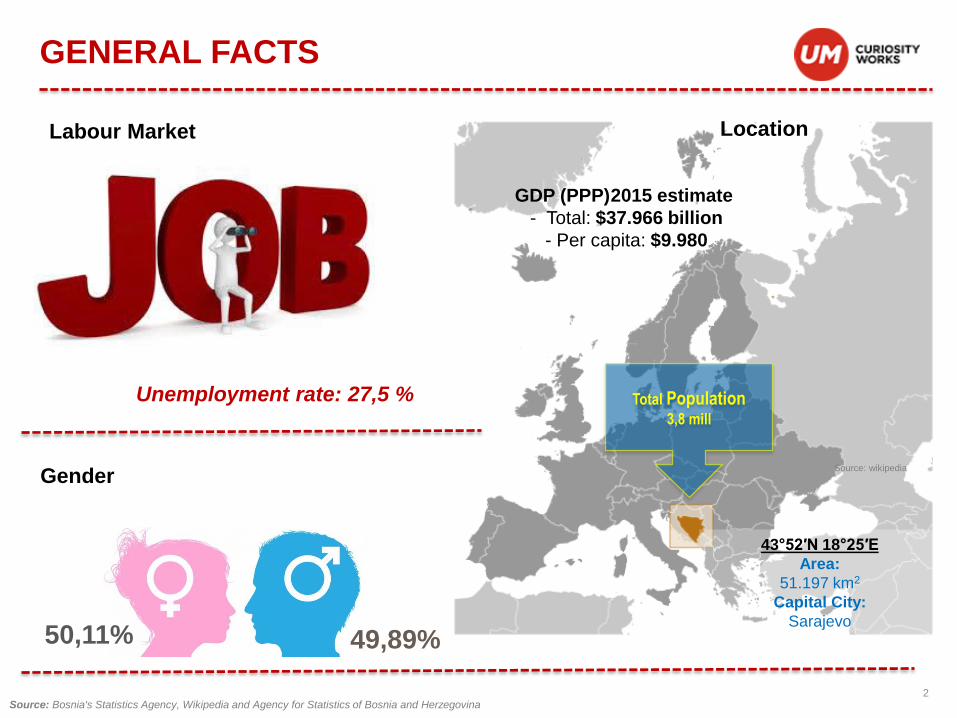
Gender
Labour Market
Source: Mareco Index Bosnia
Location
50,11% 49,89%
Unemployment rate: 27,5 %
Source: Bosnia's Statistics Agency, Wikipedia and Agency for Statistics of Bosnia and Herzegovina
43°52′N 18°25′E
Area:
51.197 km2
Capital City:
Sarajevo
GDP (PPP)2015 estimate
- Total: $37.966 billion
- Per capita: $9.980
GENERAL FACTS
Total Population3,8 mill
2
Source: wikipedia
GENERAL FACTS
HouseholdsStatus (Income)
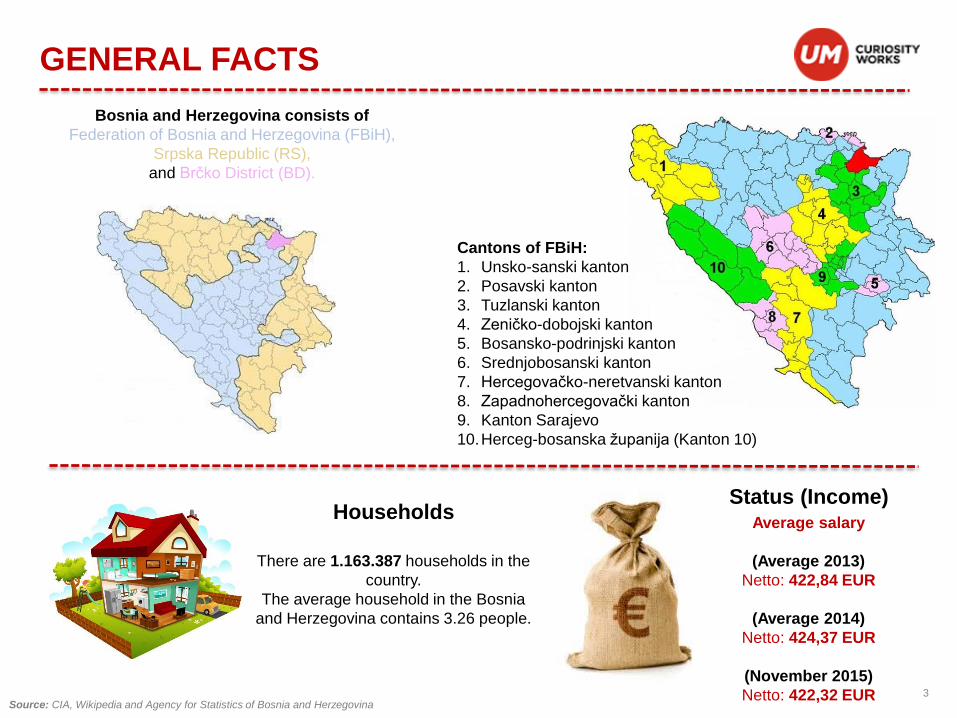
Bosnia and Herzegovina consists of
Federation of Bosnia and Herzegovina (FBiH),
Srpska Republic (RS),
and Brčko District (BD).
Cantons of FBiH:
1. Unsko-sanski kanton
2. Posavski kanton
3. Tuzlanski kanton
4. Zeničko-dobojski kanton
5. Bosansko-podrinjski kanton
6. Srednjobosanski kanton
7. Hercegovačko-neretvanski kanton
8. Zapadnohercegovački kanton
9. Kanton Sarajevo
10.Herceg-bosanska županija (Kanton 10)
Source: CIA, Wikipedia and Agency for Statistics of Bosnia and Herzegovina
Average salary
(Average 2013)
Netto: 422,84 EUR
(Average 2014)
Netto: 424,37 EUR
(November 2015)
Netto: 422,32 EUR
There are 1.163.387 households in the
country.
The average household in the Bosnia
and Herzegovina contains 3.26 people.
3
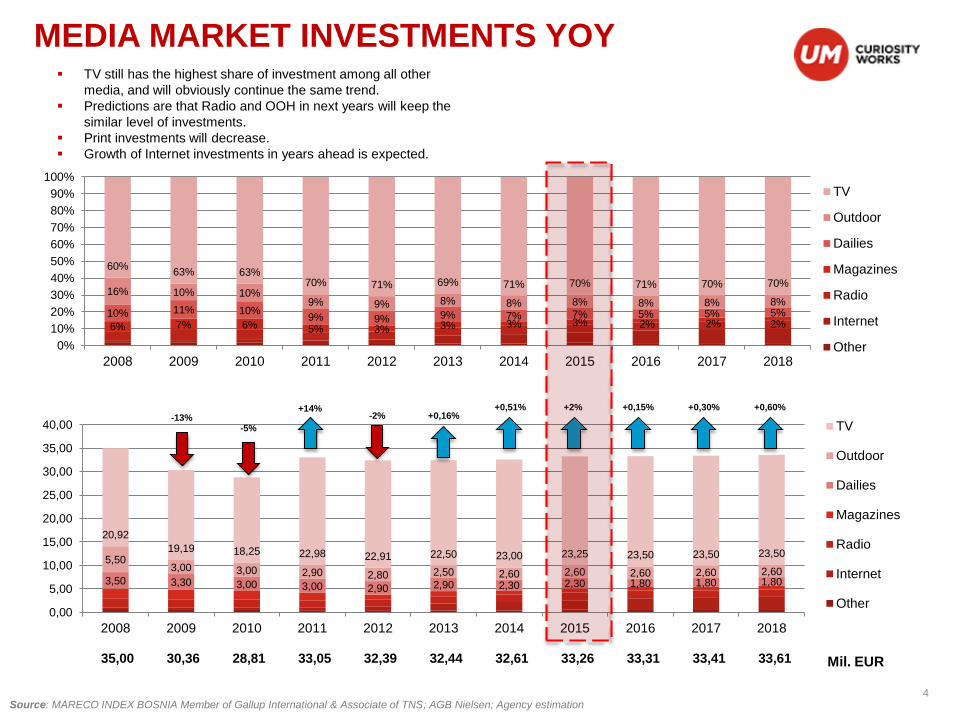
TV still has the highest share of investment among all other
media, and will obviously continue the same trend.
Predictions are that Radio and OOH in next years will keep the
similar level of investments.
Print investments will decrease.
Growth of Internet investments in years ahead is expected.
MEDIA MARKET INVESTMENTS YOY
Source: MARECO INDEX BOSNIA Member of Gallup International & Associate of TNS; AGB Nielsen; Agency estimation
6% 7% 6% 5% 3% 3% 3% 3% 2% 2% 2%10% 11% 10%
9% 9% 9% 7% 7% 5% 5% 5%
16% 10% 10%9% 9% 8% 8% 8% 8% 8% 8%
60%63% 63%
70% 71% 69% 71% 70% 71% 70% 70%
0%
10%
20%
30%
40%
50%
60%
70%
80%
90%
100%
2008 2009 2010 2011 2012 2013 2014 2015 2016 2017 2018
TV
Outdoor
Dailies
Magazines
Radio
Internet
Other
3,50 3,30 3,00 3,00 2,90 2,90 2,30 2,30 1,80 1,80 1,80
5,503,00 3,00 2,90 2,80 2,50 2,60 2,60 2,60 2,60 2,60
20,92
19,19 18,25 22,98 22,91 22,50 23,00 23,25 23,50 23,50 23,50
0,00
5,00
10,00
15,00
20,00
25,00
30,00
35,00
40,00
2008 2009 2010 2011 2012 2013 2014 2015 2016 2017 2018
TV
Outdoor
Dailies
Magazines
Radio
Internet
Other
-13%-5%
+14%-2% +0,16%
+0,51% +2% +0,15% +0,30% +0,60%
35,00 30,36 28,81 33,05 32,39 32,44 32,61 33,26 33,31 33,41 33,61 Mil. EUR
4
5
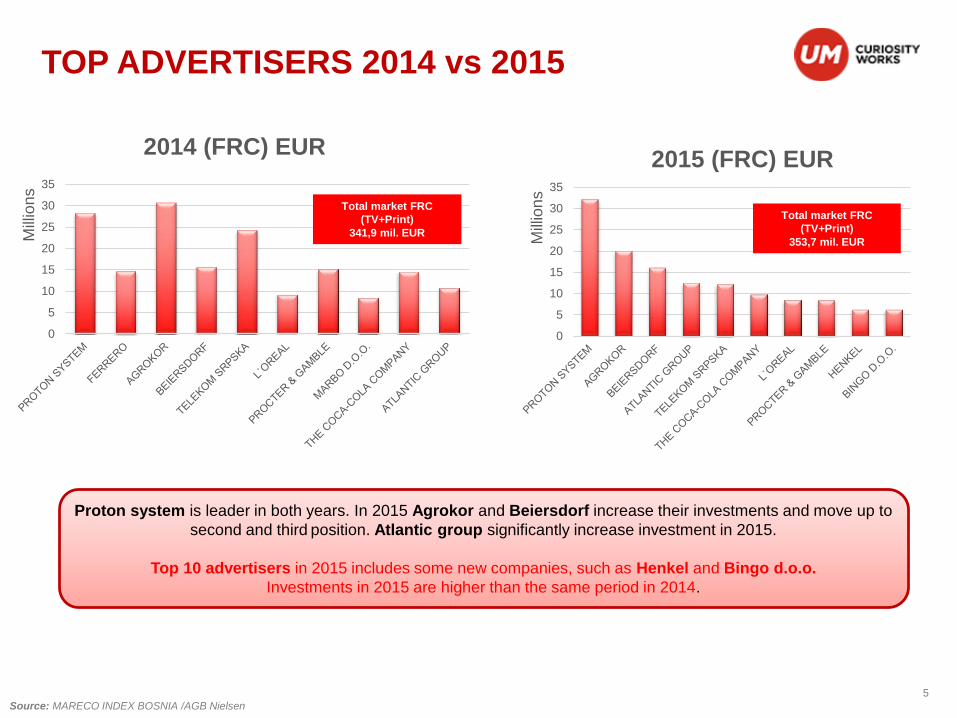
TOP ADVERTISERS 2014 vs 2015
Source: MARECO INDEX BOSNIA /AGB Nielsen
0
5
10
15
20
25
30
35
Mill
ion
s
2014 (FRC) EUR
Total market FRC
(TV+Print)
341,9 mil. EUR
0
5
10
15
20
25
30
35
Mill
ion
s
2015 (FRC) EUR
Total market FRC
(TV+Print)
353,7 mil. EUR
Proton system is leader in both years. In 2015 Agrokor and Beiersdorf increase their investments and move up to
second and third position. Atlantic group significantly increase investment in 2015.
Top 10 advertisers in 2015 includes some new companies, such as Henkel and Bingo d.o.o.
Investments in 2015 are higher than the same period in 2014.
6
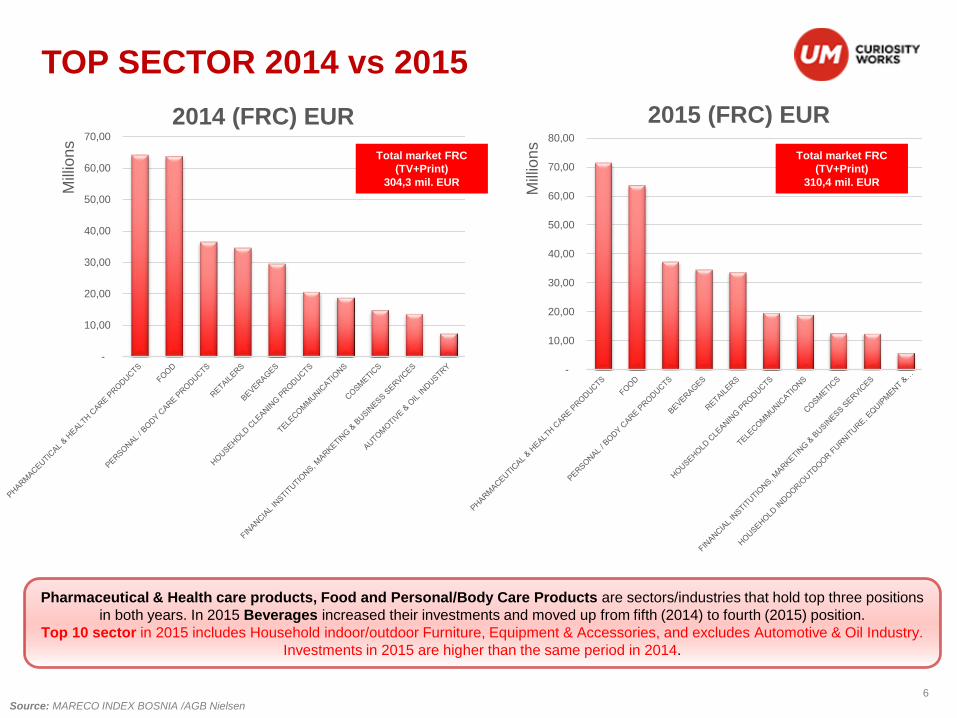
TOP SECTOR 2014 vs 2015
Source: MARECO INDEX BOSNIA /AGB Nielsen
-
10,00
20,00
30,00
40,00
50,00
60,00
70,00
80,00
Mill
ion
s
2015 (FRC) EUR
Total market FRC
(TV+Print)
310,4 mil. EUR
-
10,00
20,00
30,00
40,00
50,00
60,00
70,00
Mill
ion
s
2014 (FRC) EUR
Total market FRC
(TV+Print)
304,3 mil. EUR
Pharmaceutical & Health care products, Food and Personal/Body Care Products are sectors/industries that hold top three positions
in both years. In 2015 Beverages increased their investments and moved up from fifth (2014) to fourth (2015) position.
Top 10 sector in 2015 includes Household indoor/outdoor Furniture, Equipment & Accessories, and excludes Automotive & Oil Industry.
Investments in 2015 are higher than the same period in 2014.
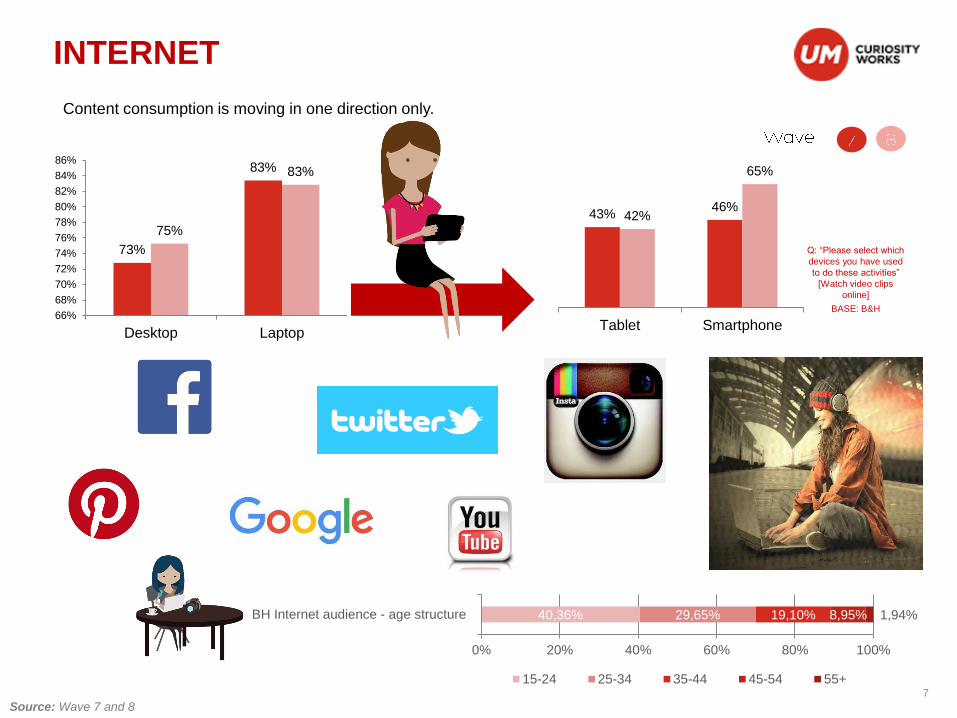
INTERNET
40,36% 29,65% 19,10% 8,95% 1,94%
0% 20% 40% 60% 80% 100%
BH Internet audience - age structure
15-24 25-34 35-44 45-54 55+7
Source: Wave 7 and 8
Content consumption is moving in one direction only.
73%
83%
75%
83%
66%
68%
70%
72%
74%
76%
78%
80%
82%
84%
86%
Desktop Laptop
43%46%
42%
65%
Tablet Smartphone
Q: “Please select which
devices you have used
to do these activities”
[Watch video clips
online]
BASE: B&H
Source: Wave 7 and 8
8
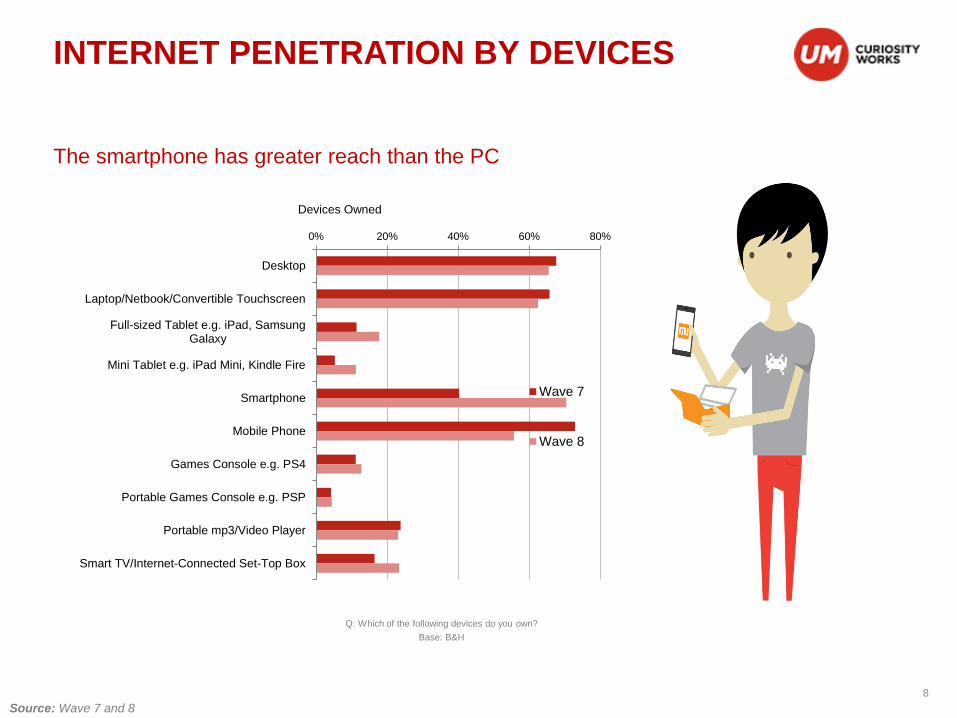
INTERNET PENETRATION BY DEVICES
The smartphone has greater reach than the PC
0% 20% 40% 60% 80%
Desktop
Laptop/Netbook/Convertible Touchscreen
Full-sized Tablet e.g. iPad, SamsungGalaxy
Mini Tablet e.g. iPad Mini, Kindle Fire
Smartphone
Mobile Phone
Games Console e.g. PS4
Portable Games Console e.g. PSP
Portable mp3/Video Player
Smart TV/Internet-Connected Set-Top Box
Devices Owned
Wave 7
Wave 8
Q: Which of the following devices do you own?
Base: B&H
9
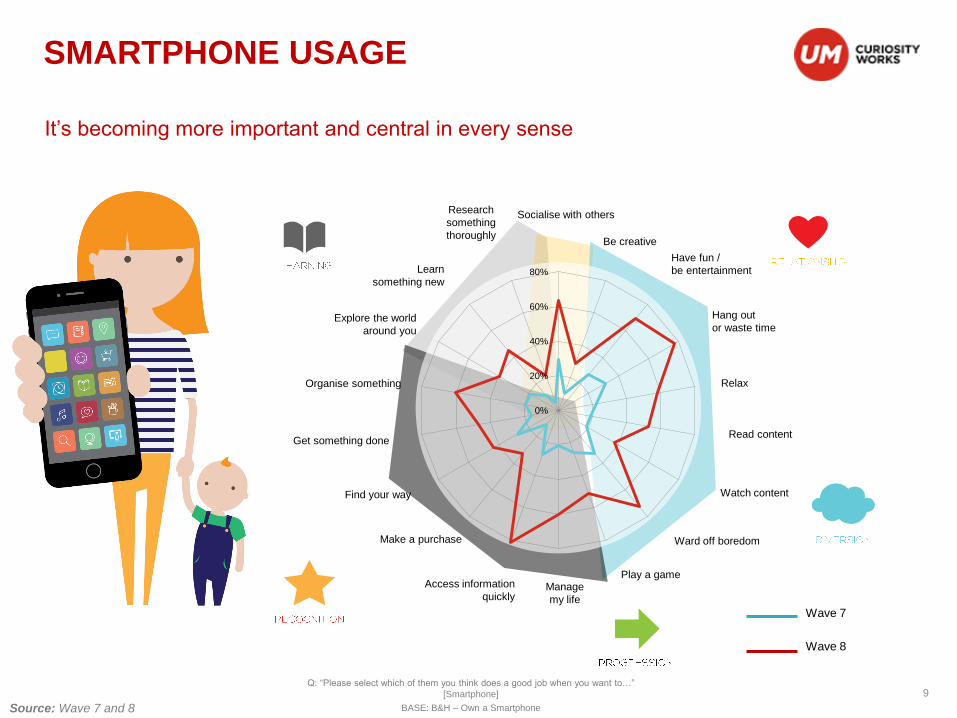
It’s becoming more important and central in every sense
SMARTPHONE USAGE
0%
20%
40%
60%
80%
Socialise with others
Be creative
Have fun /
be entertainment
Hang out
or waste time
Relax
Read content
Watch content
Ward off boredom
Play a gameManage
my life
Access information
quickly
Make a purchase
Find your way
Get something done
Organise something
Explore the world
around you
Learn
something new
Research
something
thoroughly
Wave 7
Wave 8
Q: “Please select which of them you think does a good job when you want to…”
[Smartphone]
BASE: B&H – Own a SmartphoneSource: Wave 7 and 8
10
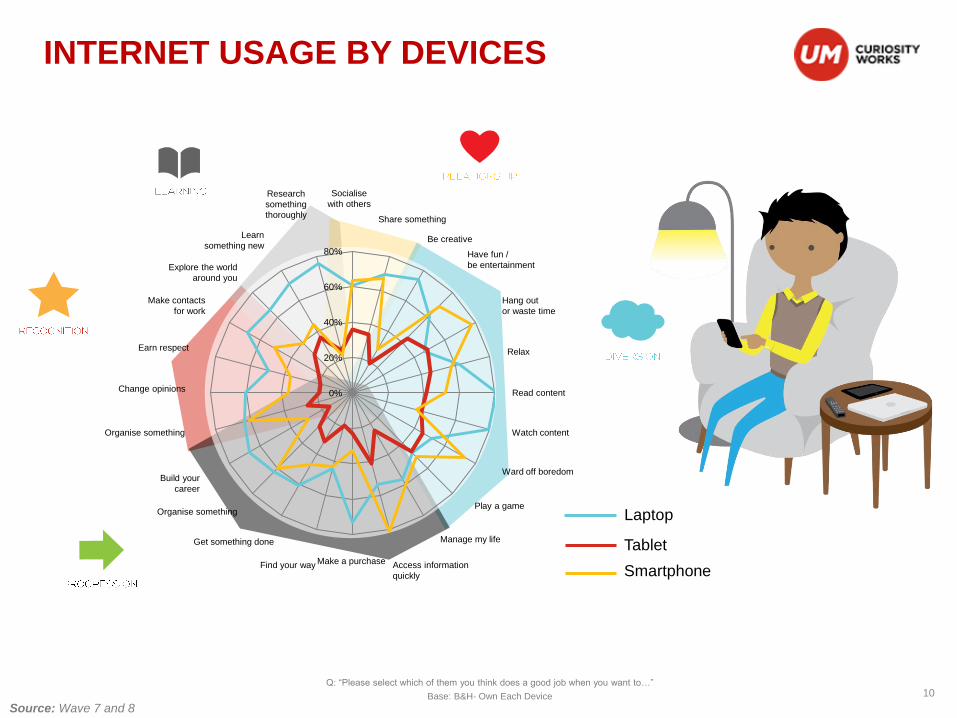
INTERNET USAGE BY DEVICES
Socialise
with others
Share something
Have fun /
be entertainment
Hang out
or waste time
Relax
Read content
Watch content
Ward off boredom
Play a game
Manage my life
Access information
quickly
Make a purchaseFind your way
Get something done
Organise something
Explore the world
around you
Learn
something new
Research
something
thoroughly
0%
20%
40%
60%
80%
Make contacts
for work
Earn respect
Change opinions
Be creative
Organise something
Build your
career
Laptop
Tablet
Smartphone
Q: “Please select which of them you think does a good job when you want to…”
Base: B&H- Own Each Device
Source: Wave 7 and 8
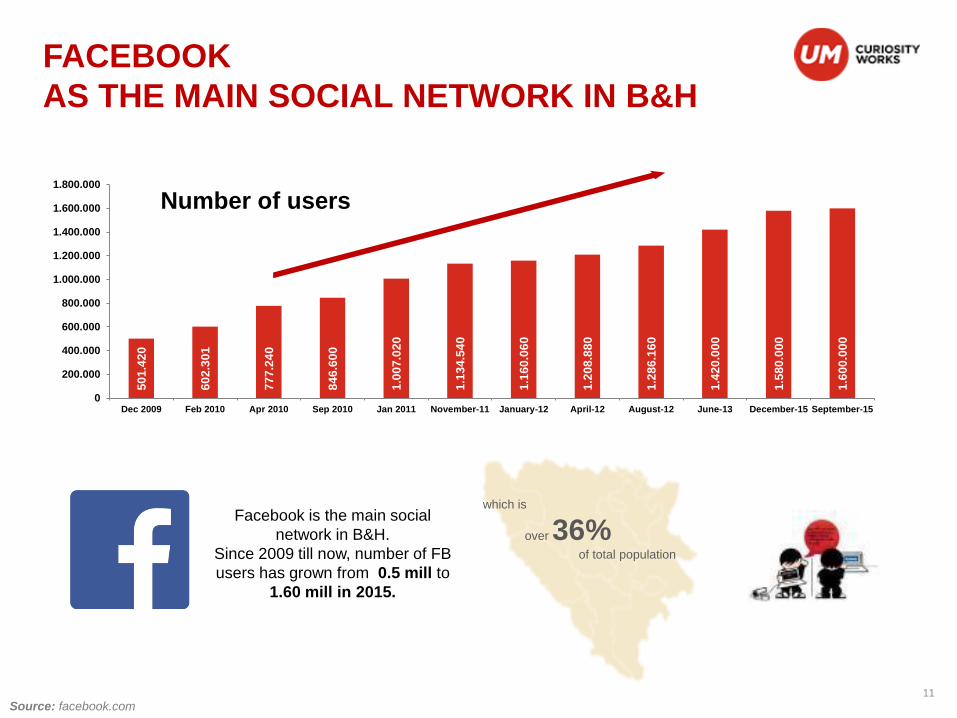
AS THE MAIN SOCIAL NETWORK IN B&H
Facebook is the main social
network in B&H.
Since 2009 till now, number of FB
users has grown from 0.5 mill to
1.60 mill in 2015.
which is
over 36%of total population
50
1.4
20
60
2.3
01
77
7.2
40
84
6.6
00
1.0
07
.02
0
1.1
34
.54
0
1.1
60
.06
0
1.2
08
.88
0
1.2
86
.16
0
1.4
20
.00
0
1.5
80
.00
0
1.6
00
.00
0
0
200.000
400.000
600.000
800.000
1.000.000
1.200.000
1.400.000
1.600.000
1.800.000
Dec 2009 Feb 2010 Apr 2010 Sep 2010 Jan 2011 November-11 January-12 April-12 August-12 June-13 December-15 September-15
Number of users
11
Source: facebook.com
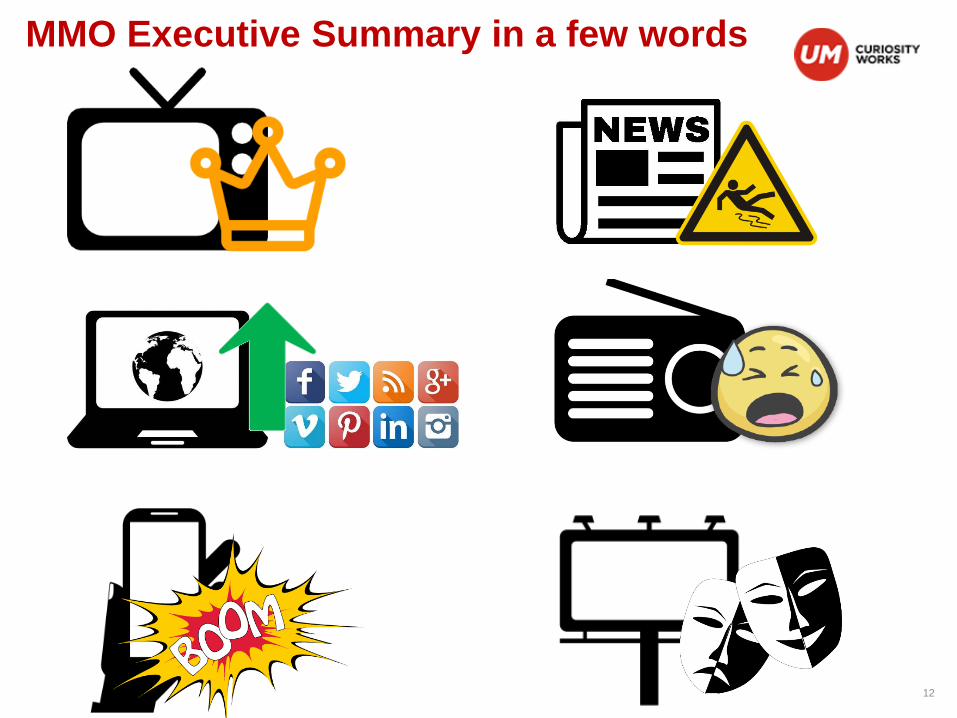
MMO Executive Summary in a few words
12
Media planning and buying agencies
13
Creative and digital agencies
14
15
Market regulators
16
EU Membership Application
Digitalization ?
Tender for TV telemetry system
Challenges

Thank you for your attention!