Embed Size (px)
Citation preview
Copyright © 2015 Splunk Inc.
Data Informed Healthcare Delivery
Process Improvement
2
Agenda
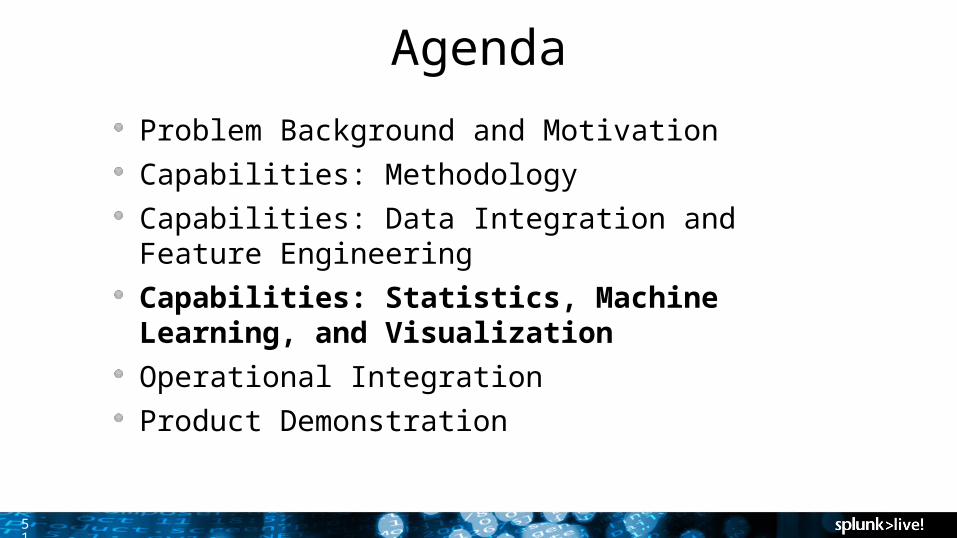
Problem Background and MotivationCapabilities: MethodologyCapabilities: Data Integration and Feature EngineeringCapabilities: Statistics, Machine Learning, and VisualizationOperational IntegrationProduct Demonstration

33
1. Get Ready2. Travel by Car3. Conference
Starts4. Join Reception5. Have Dinner6. Go Home
1. Get Ready2. Travel by Car3. Conference
Starts4. Give a Talk5. Join Reception6. Have Dinner7. Go Home
44
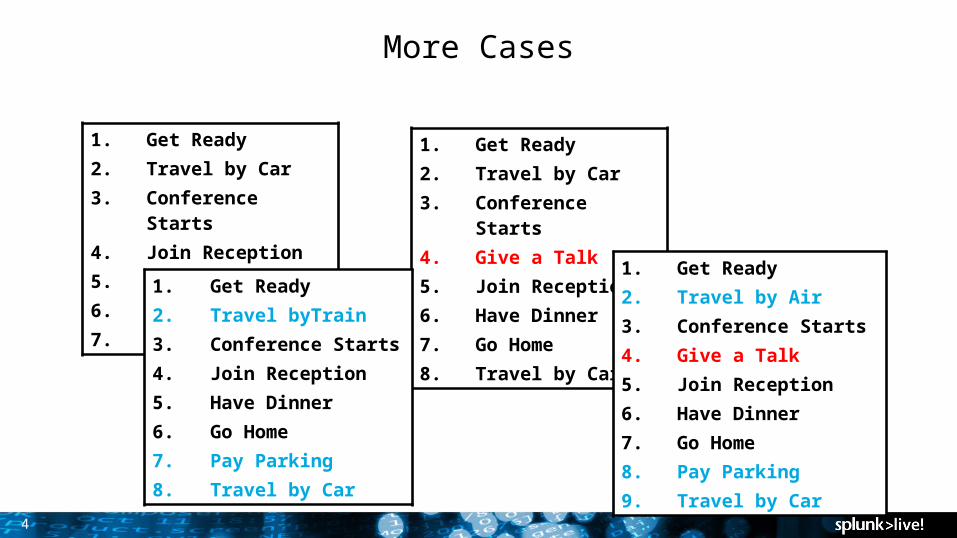
More Cases
1. Get Ready2. Travel by Car3. Conference Starts4. Join Reception5. Have Dinner6. Go Home7. Travel by Car
1. Get Ready2. Travel by Car3. Conference Starts4. Give a Talk5. Join Reception6. Have Dinner7. Go Home8. Travel by Car
1. Get Ready2. Travel by Air3. Conference Starts4. Give a Talk5. Join Reception6. Have Dinner7. Go Home8. Pay Parking9. Travel by Car
1. Get Ready2. Travel byTrain3. Conference Starts4. Join Reception5. Have Dinner6. Go Home7. Pay Parking8. Travel by Car

5

6
Generalized Information Flow Model for Chronic Care
http://www.ncbi.nlm.nih.gov/pmc/articles/PMC3002133/

7
Healthcare Delivery Workflow Examples #1
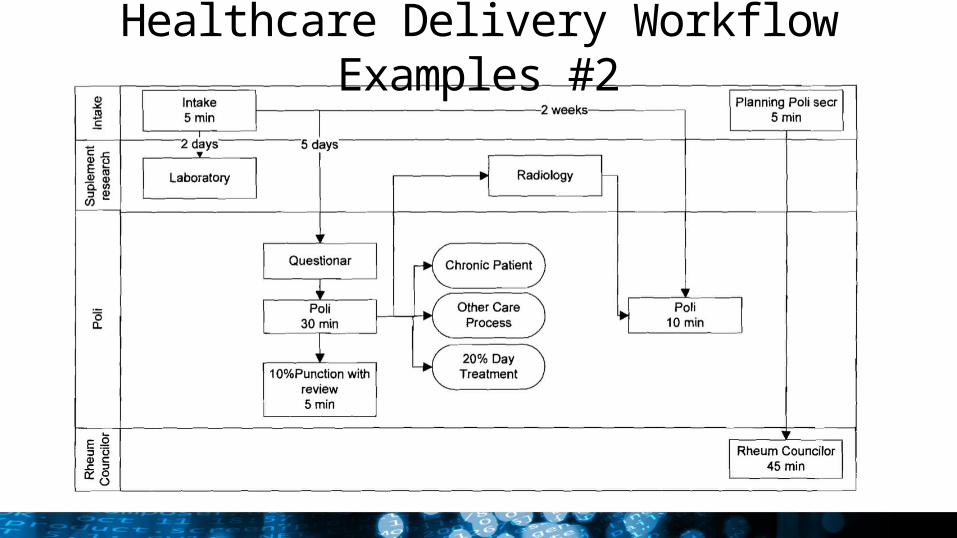
Healthcare Delivery Workflow Examples #2

9
Health Events
1010
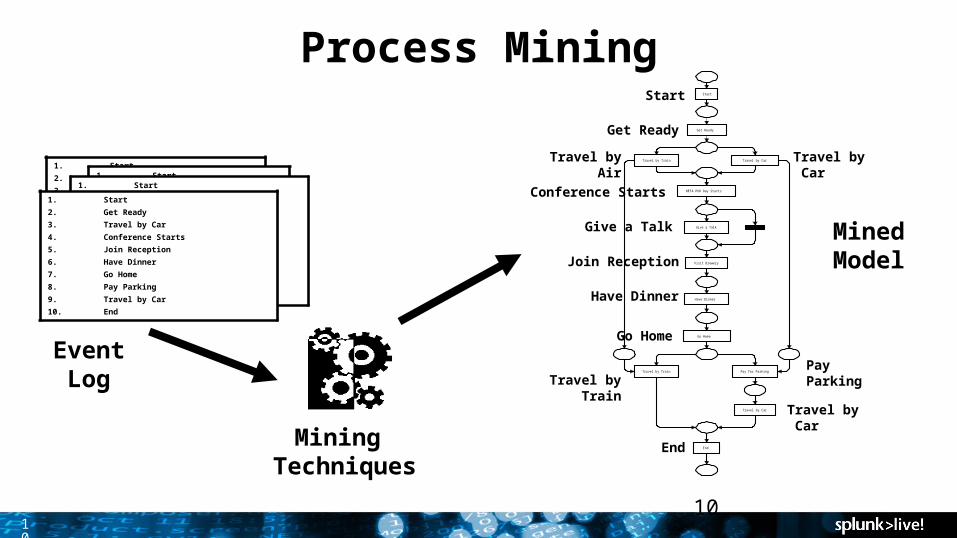
Process Mining
EventLog
Mining Techniques
MinedModel
1. Start2. Get Ready3. Travel by Train4. Beta Event Starts5. Visit Brewery6. Have Dinner7. Go Home8. Travel by Train
1. Start2. Get Ready3. Travel by Train4. Beta Event Starts5. Give a Talk6. Visit Brewery7. Have Dinner8. Go Home9. Travel by Train
1. Start2. Get Ready3. Travel by Car4. Beta Event Starts5. Give a Talk6. Visit Brewery7. Have Dinner8. Go Home9. Pay Parking10. Travel by Car
1. Start2. Get Ready3. Travel by Car4. Conference Starts5. Join Reception6. Have Dinner7. Go Home8. Pay Parking9. Travel by Car10. End
Start
Get Ready
Travel by CarTravel by Train
BETA PhD Day Starts
Visit Brewery
Have Dinner
Go Home
Travel by Train Pay for Parking
Travel by Car
End
Give a Talk
Start
Get Ready
Travel by Air
Travel by Car
Conference Starts
Give a Talk
Join Reception
Have Dinner
Go Home
Travel by Train
Travel by Car
Pay Parking
End
11
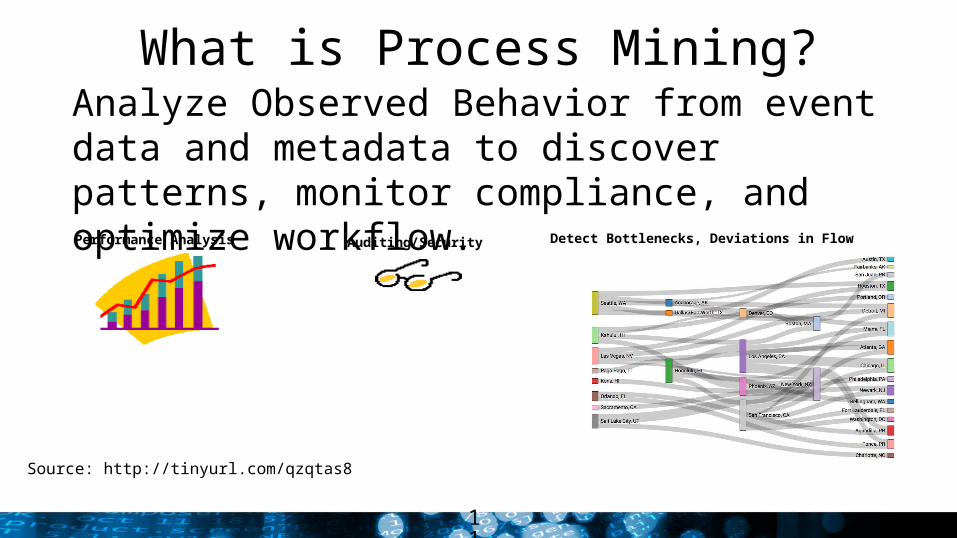
What is Process Mining?
Source: http://tinyurl.com/qzqtas8
Analyze Observed Behavior from event data and metadata to discover patterns, monitor compliance, and optimize workflow.Performance Analysis Auditing/Security Detect Bottlenecks, Deviations in Flow

12
Process Mining Use Cases
ACTION ORIENTED
Redesign Process
Adjust Parameters
Intervene (ad-hoc problem solving)
Support: Detect deviations and bottlenecks
Support: Predict, Recommend
GOAL ORIENTED
Improve KPIs related to Time
Improve KPIs related to Cost
Improve KPIs related to Quality
15
Why Process Mining?Traditional As-Is analysis of business processes strongly based on the opinion of process expert. The basic idea is to assemble an appropriate team and to organize modeling sessions in which the knowledge of the team members is used to build an adequate As-Is process model.
Discover actual behavior of people, organization, and machines and relate to modeled behavior.
Correlate millions of ad-hoc events showing how reality is different from perceptions, opinions, and beliefs.
Provide clue for standardization and better prepare to handle ad-hoc events.
16
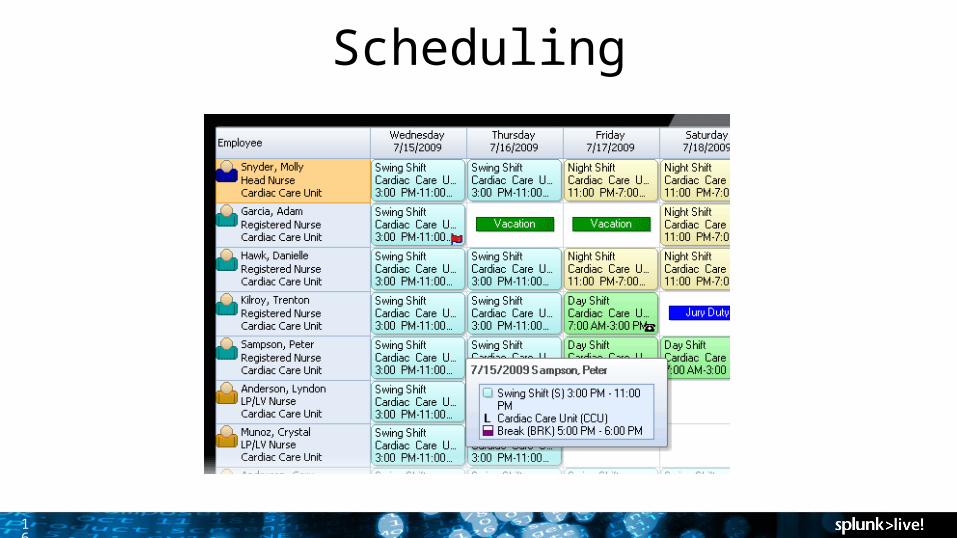
Scheduling

17
Waiting Time

18
Surgical Checklist

19
Care Coordination

20

21
Virtual
Physical
Cloud
Healthcare Data is Time Oriented and Diverse
21
EHR Systems
WebServices
Developers
App Support
Telecoms
Networking
Desktops
Servers
Security
Devices
StorageMessaging
Claims
Clickstream
HIE
PatientPortals
Healthcare Apps IT Systems and Med Devices Patient-Facing Data
MedicalDevices
CDR MedicalRecords
PHI Access Audit Logs
HL7 Messaging
Billing
Departmental and
HomegrownApplications

22
Domains of Data Diversity in Health Data
22
SubjectsPersons, Sensors, Actuators, Mobile
Devices
Information Users
Clinical, Family, Patient
System and Locations
Home, Hospital, ER, Nursing Homes
Ownership and Management

23
Example of Events: Healthcare ServicesEntity ID Event ID Properties
Timestamp Activity Resource
12345678 4798669 02/06/2015 14:00 Primary Care Visit Pete
4798670 04/06/2015 11:00 Surgery Rose
4798671 04/06/2015 12:00 Primary Care Visit Pete
4798672 04/06/2015 10:00 Chemotherapy John
4798673 04/06/2015 15:00 Evaluation Pete
98765432 5798670 03/06/2015 14:00 Primary Care Visit Pete
23
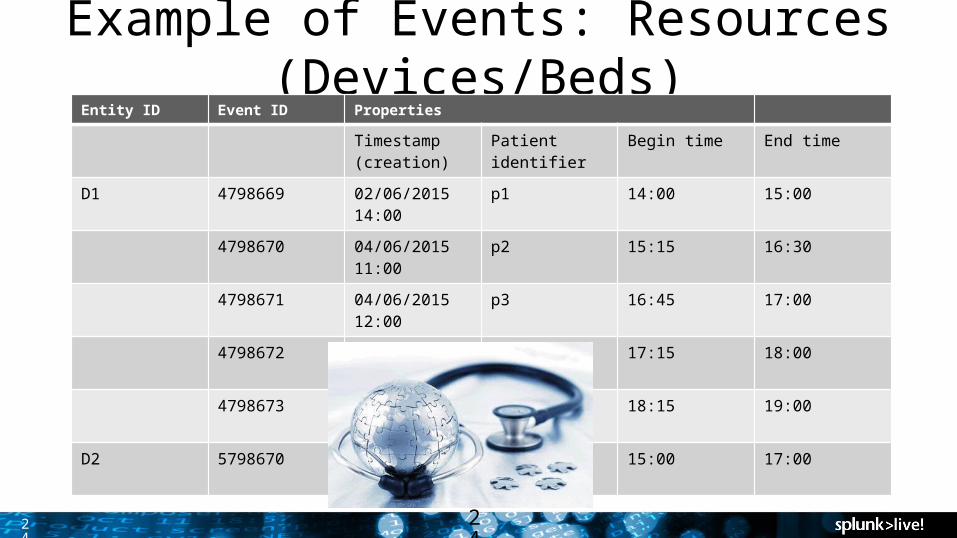
24
Example of Events: Resources (Devices/Beds)Entity ID Event ID Properties
Timestamp (creation)
Patient identifier Begin time End time
D1 4798669 02/06/2015 14:00
p1 14:00 15:00
4798670 04/06/2015 11:00
p2 15:15 16:30
4798671 04/06/2015 12:00
p3 16:45 17:00
4798672 04/06/2015 10:00
p4 17:15 18:00
4798673 04/06/2015 15:00
p5 18:15 19:00
D2 5798670 03/06/2015 14:00
p6 15:00 17:00
24
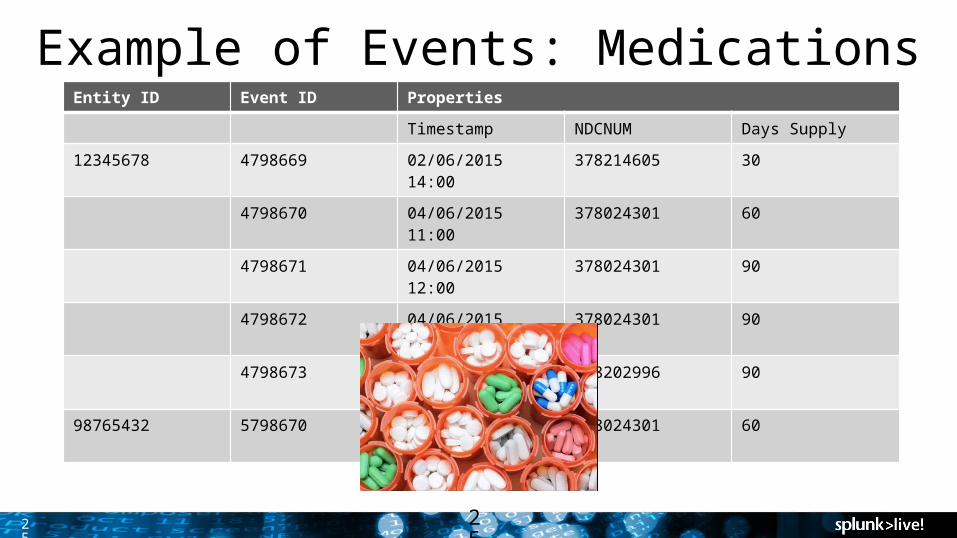
25
Example of Events: MedicationsEntity ID Event ID Properties
Timestamp NDCNUM Days Supply
12345678 4798669 02/06/2015 14:00 378214605 30
4798670 04/06/2015 11:00 378024301 60
4798671 04/06/2015 12:00 378024301 90
4798672 04/06/2015 10:00 378024301 90
4798673 04/06/2015 15:00 228202996 90
98765432 5798670 03/06/2015 14:00 378024301 60
25

26
Example of Events: Lab Entity ID Event ID Properties
Timestamp Key Value
12345678 4798669 02/06/2015 14:00 HbA1C 8%
4798670 04/06/2015 11:00 LDL 100 mg/dl
4798671 04/06/2015 12:00 HDL 50 mg/dl
4798672 04/06/2015 10:00 Systolic 110
4798673 04/06/2015 15:00 Diastolic 75
97865432 5798670 03/06/2015 14:00 HbA1C 9%
26

US Army Dental Command gain operational visibility and improve dental service delivery with Splunk
• Integrate dental device logs, DICOM image metadata, and patient satisfaction surveys.
• Alerts in case of anomalies.
• Correlate wait time with patient satisfaction data and system performance degradations.
• Faster identification of system capacity bottlenecks such as excessive wait time.• Proactively find unused resources and reallocate the resources.• Saved millions by not buying new devices but optimize the current resource allocations
• Limited visibility into device bottlenecks and customer satisfaction factors.
• Limited data for capacity planning and workflow optimization
Key Challenges Key Splunk Functions
Business Value

28
Agenda
Problem Background and MotivationCapabilities: MethodologyCapabilities: Data Integration and Feature EngineeringCapabilities: Statistics, Machine Learning, and VisualizationOperational IntegrationProduct Demonstration

29
Improvement Method

30

31
Systems Engineering

32
Call for efficiency, consistency, and safety

33
Towards a Learning Healthcare System

34
A Connected Healthcare System
3535
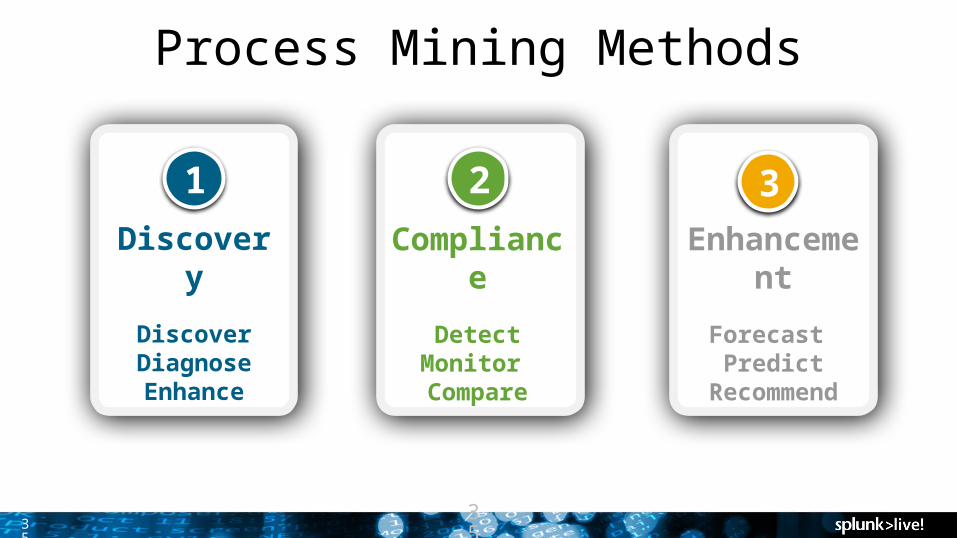
Discovery
Discover Diagnose Enhance
1Compliance
DetectMonitor Compare
2 3Enhancement
Forecast Predict
Recommend
Process Mining Methods
36
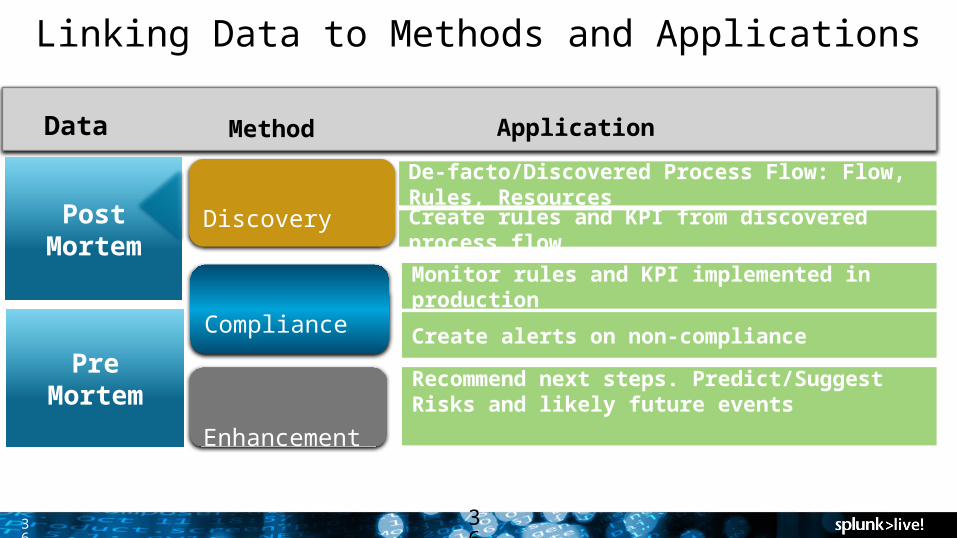
Linking Data to Methods and Applications
Persist, Repeat
36
Discovery
Compliance
Enhancement
Post Mortem
Pre Mortem
De-facto/Discovered Process Flow: Flow, Rules, Resources
Recommend next steps. Predict/Suggest Risks and likely future events
Create rules and KPI from discovered process flow
Monitor rules and KPI implemented in production
Create alerts on non-compliance
Data Method Application

37 37
Real World Business Questions/Formulate
HypothesesData Collection Data Preparation
Modeling/SimulationCommunication,
VisualizationReports, Findings
Evaluation
Data Science for Process Mining in Action
38
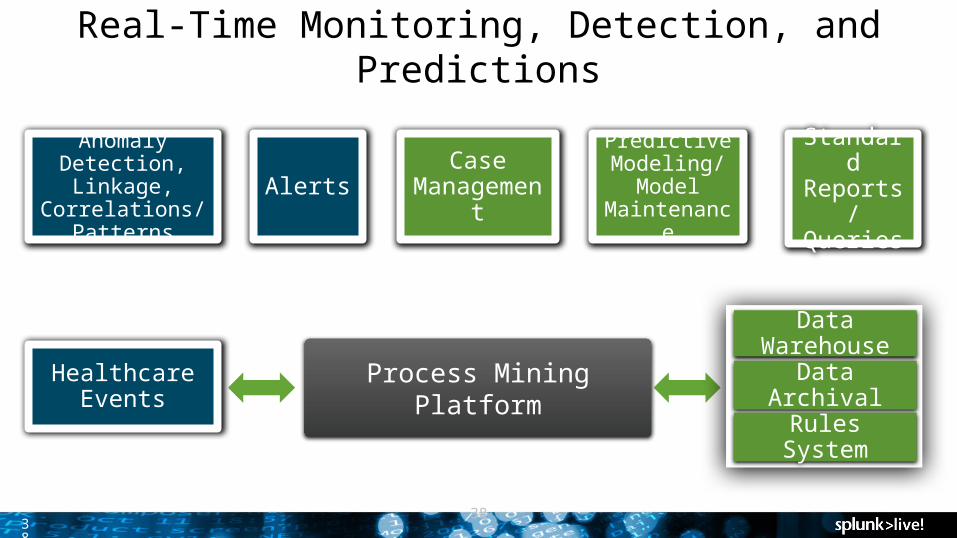
Process Mining Platform
Real-Time Monitoring, Detection, and Predictions
38
CaseManagement
Anomaly Detection, Linkage,
Correlations/ Patterns
AlertsPredictive Modeling/
Model Maintenance
Healthcare Events
Standard Reports/ Queries
Data Warehouse
Data Archival
Rules System
39
Agenda
Problem Background and MotivationCapabilities: MethodologyCapabilities: Data Integration and Feature EngineeringCapabilities: Statistics, Machine Learning, and VisualizationOperational IntegrationProduct Demonstration
40
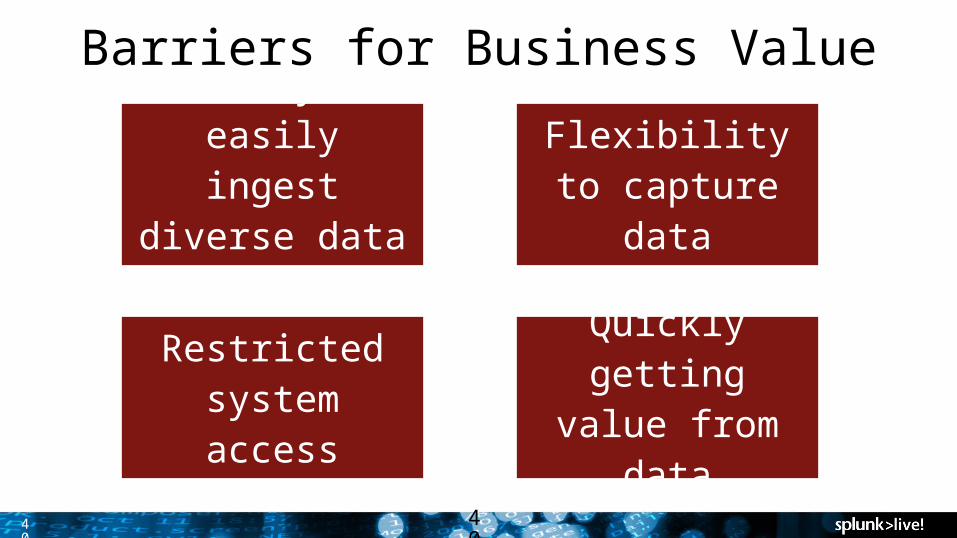
Barriers for Business Value
40
Ability to easily ingest diverse data
setsFlexibility to capture data
Restricted system access
Quickly getting value from data
41
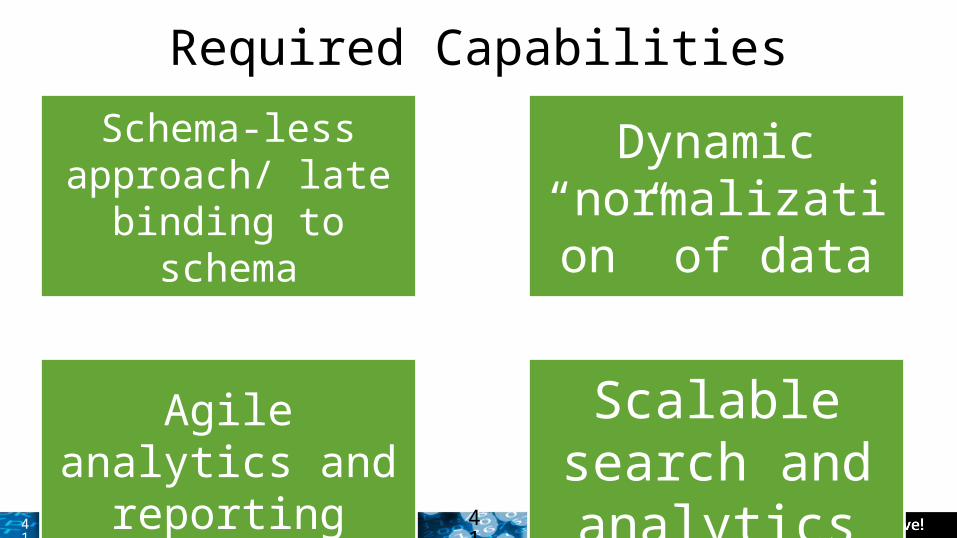
Required Capabilities
41
Schema-less approach/ late
binding to schema
Dynamic “normalization”
of data
Agile analytics and reporting
Scalable search and analytics
Process Data Mining Core Engine
42
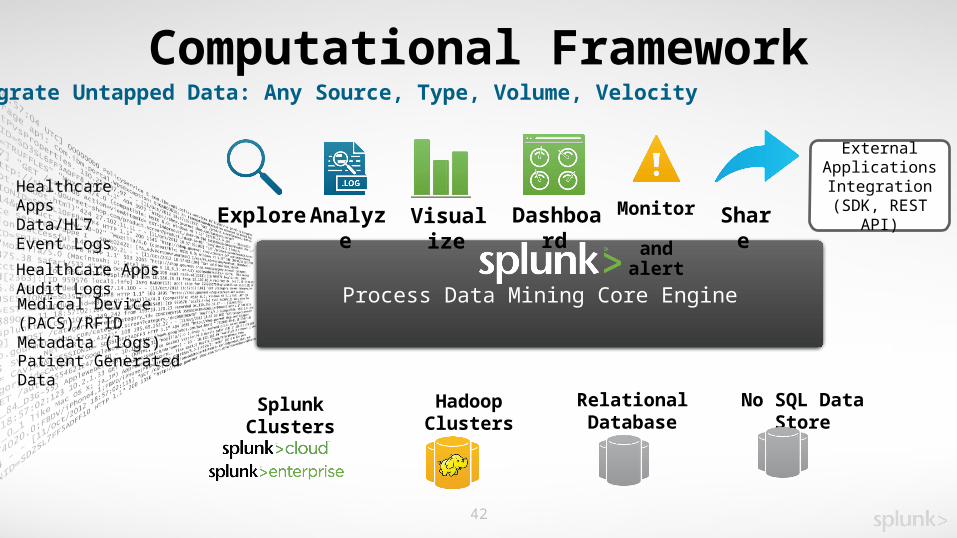
Computational FrameworkIntegrate Untapped Data: Any Source, Type, Volume, Velocity
Healthcare Apps Data/HL7 Event Logs
Healthcare Apps Audit Logs
Medical Device (PACS)/RFID Metadata (logs)
Patient Generated Data
Hadoop Clusters Relational Database No SQL Data StoreSplunk Clusters
Explore Visualize Dashboard ShareAnalyze Monitor and alert
External Applications Integration
(SDK, REST API)
43
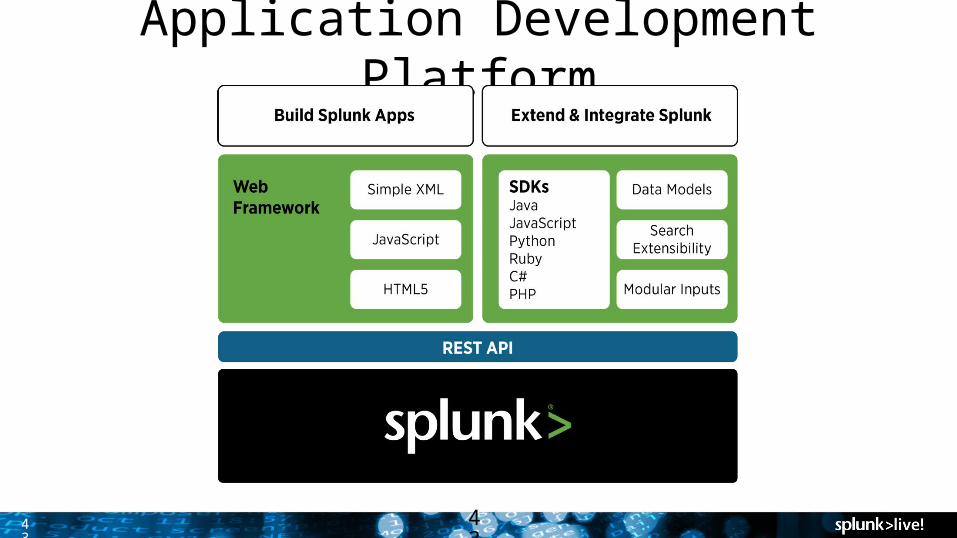
Application Development Platform
43

44
Data Integration: Ingest any text data
44
MSH|^~\&|EPIC|MGH||MGH|20150324190937|OHEDSCRIBE|ADT^A08|725467|T|2.3|||||||||………PID|1||12345^^^EPI^MR||LUCUS^STEPHANEY||19751225|M|||^^^^^US^P|||||||6100215419|999-99-9999|||||||||||N||........
<recordTarget> <patientRole> <id extension="12345" root="PlaceholderOrganization" /> <addr use="HP”> <streetAddressLine>180 Fake Road</streetAddressLine> <city>Providence</city> <state>RI</state> <postalCode>02912</postalCode> <country>US</country> </addr> <telecom use="WP" value="tel:+1-401-867-7949" /> <patient> <name> <given>Stephaney</given> <family>Lucus</family> </name> <administrativeGenderCode code="F" codeSystem="2.16.840.1.113883.3.560.100.2" displayName="Male" />
{ "resourceType": "Patient", "identifier": [ { "system": "urn:oid:1.2.36.146.595.217.0.1", "value": "12345", "period": { "start": "2001-05-06" } } ], "name": [ { "use": "official", "family": [”Lucus"], "given": [”Stephaney”] }, ], "gender": { "coding": [ { "system": "http://hl7.org/fhir/v3/AdministrativeGender", "code": "M", "display": "Male" } ] }, "birthDate": "1974-12-25", "address": [ { "use": "home", "line": ["534 Erewhon St"], "city": "PleasantVille", "state": "Vic", "zip": "3999" } ]}
PatientidentifiernametelecomgenderbirthDatedeceasedaddressmaritalStatus….active

45
Getting Data In
45
Universal and Heavy Forwarders Modular Input
Stream, HTTP Event Collector RDBMS, Hadoop

46
Tagging for “Normalization”
46
PatientidentifiernametelecomgenderbirthDatedeceasedaddressmaritalStatus….active

47
Search events with tag in any field
Search events with tag in a specific field
Search events with tag using wildcards
Adding Metadata Knowledge: Search with Tags
47
Tag=GLYCEMIC, ASTHMA
tag::DX=diabetes type 2
Tag=diabetes*
1
2
3

48
Aliases Normalize field labels to simplify search and correlation Apply multiple aliases to a single field
Example: Username | cs_username | User user Example: pid | patient | patient_id PATIENTID
Aliases appear alongside original fields
49
Event Tagging Classify and group common events Capture and share knowledge Based on search Use in combination with fields and tags to define
event topography
50
1) Regular Expression
2) Natural Language Processing using SDK and REST API
Feature Extraction from Texts
51
AgendaProblem Background and MotivationCapabilities: MethodologyCapabilities: Data Integration and Feature EngineeringCapabilities: Statistics, Machine Learning, and VisualizationOperational IntegrationProduct Demonstration

Sparkline: Visualize frequency distributions Identify co-occurring spikes
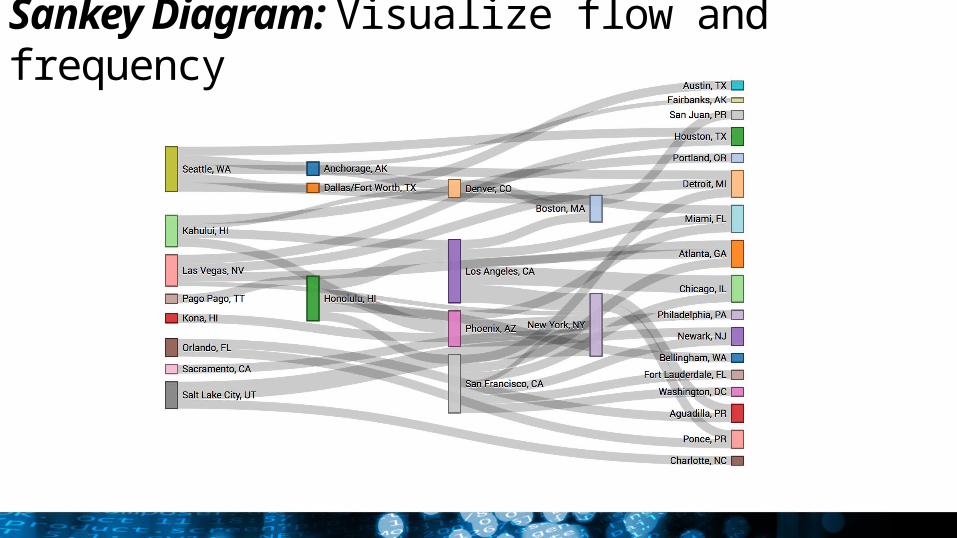
Sankey Diagram: Visualize flow and frequency

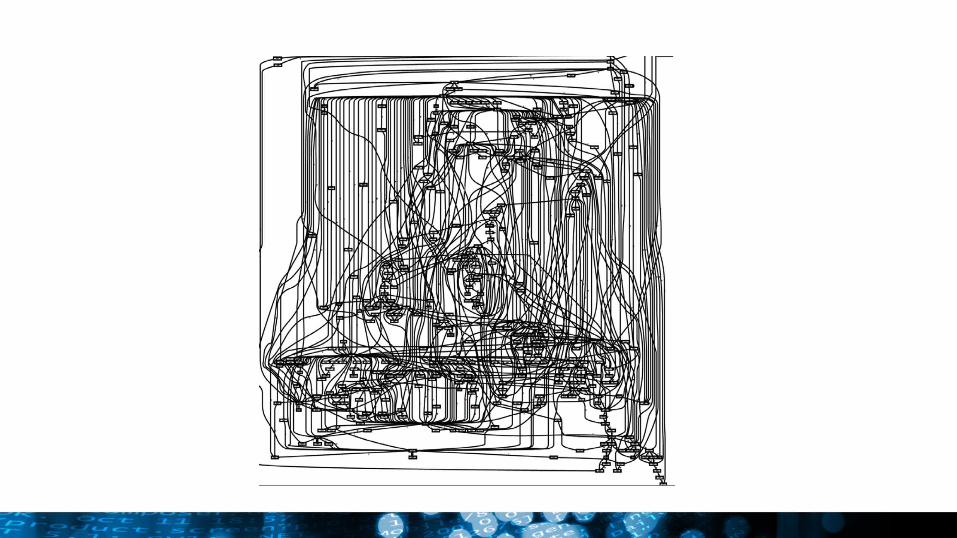
Graphs: Visualize Network and Relations

Find Pathway of Similar Patients:Seeing Millions at a Time and Visualize Pathways
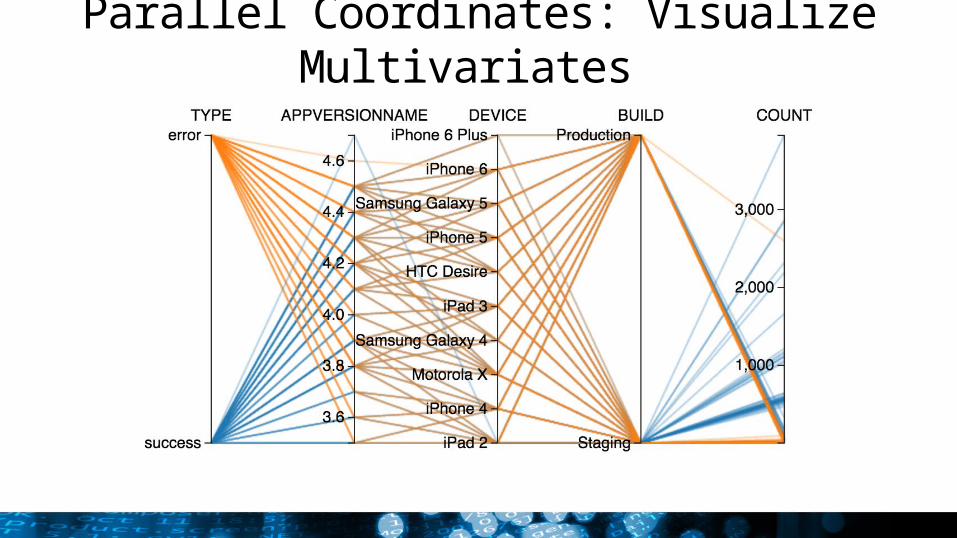
Parallel Coordinates: Visualize Multivariates
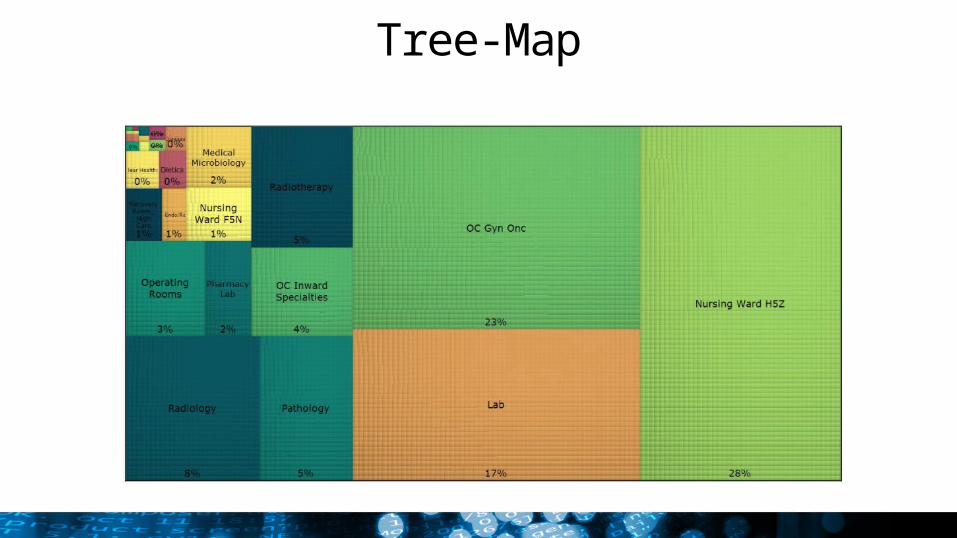
Tree-Map
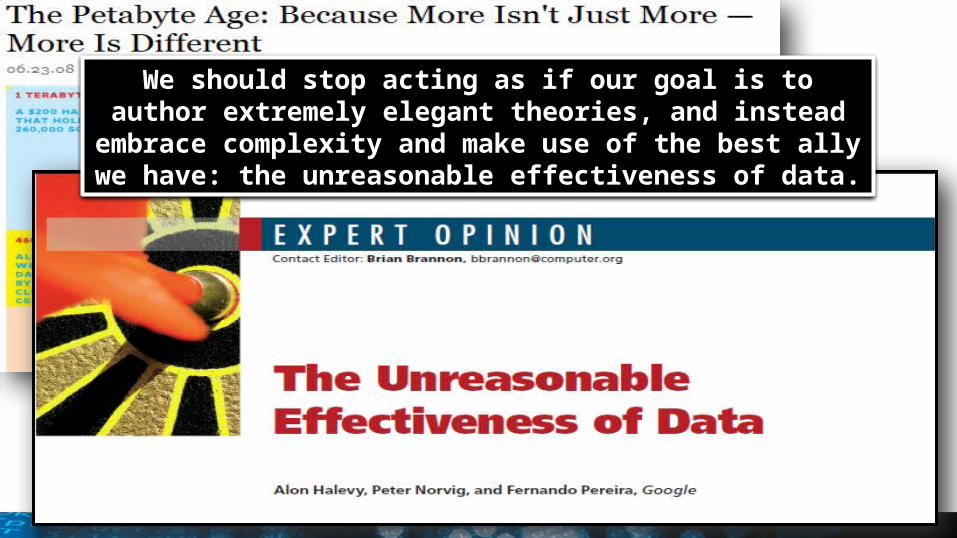
We should stop acting as if our goal is to author extremely elegant theories, and instead embrace complexity and make use of the best
ally we have: the unreasonable effectiveness of data.
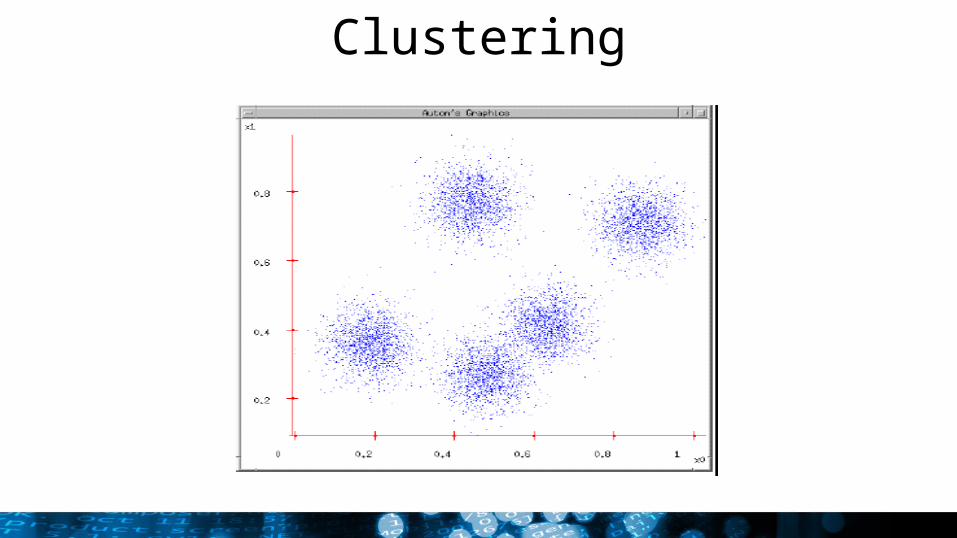
Clustering
61
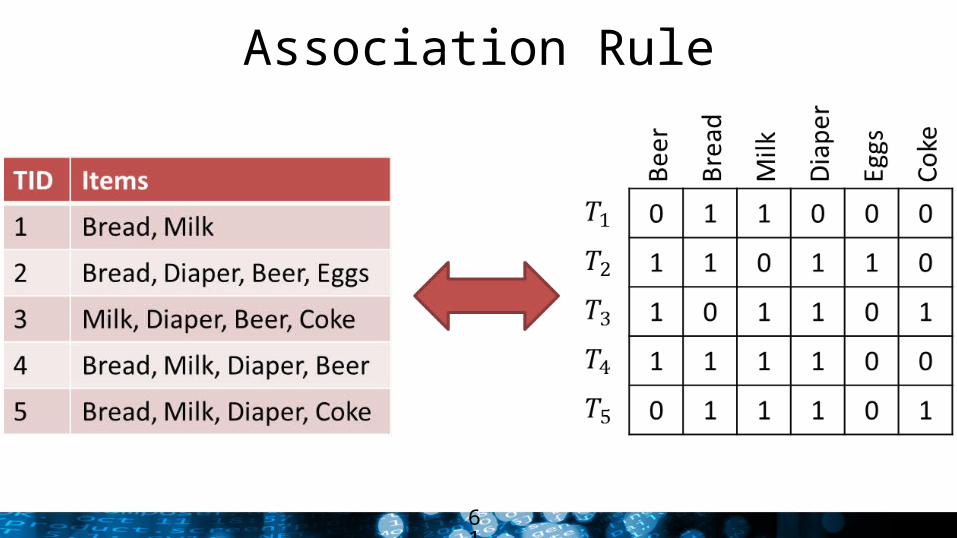
Association Rule

62
Anomaly Detection

63
AgendaProblem Background and MotivationCapabilities: MethodologyCapabilities: Data Integration and Feature EngineeringCapabilities: Statistics, Machine Learning, and VisualizationOperational IntegrationProduct Demonstration
64
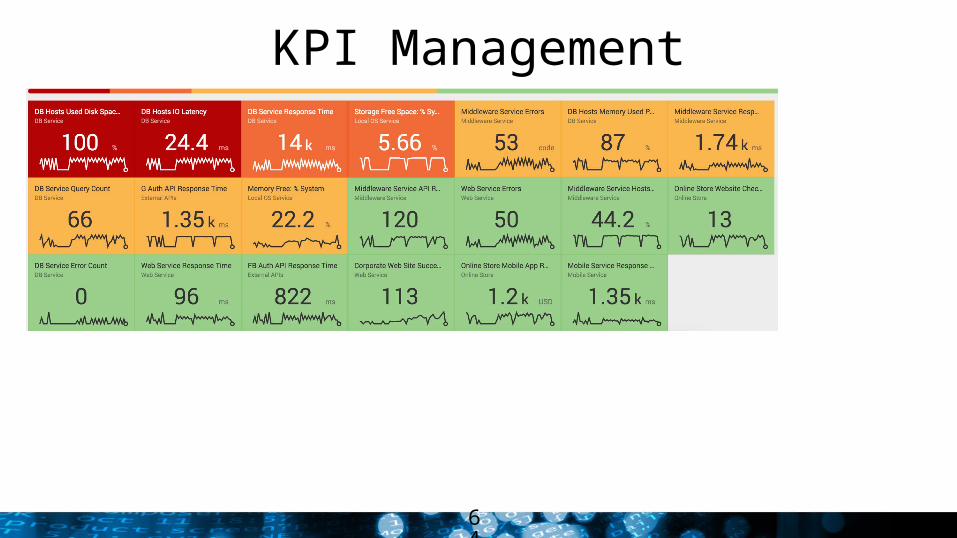
KPI Management
65
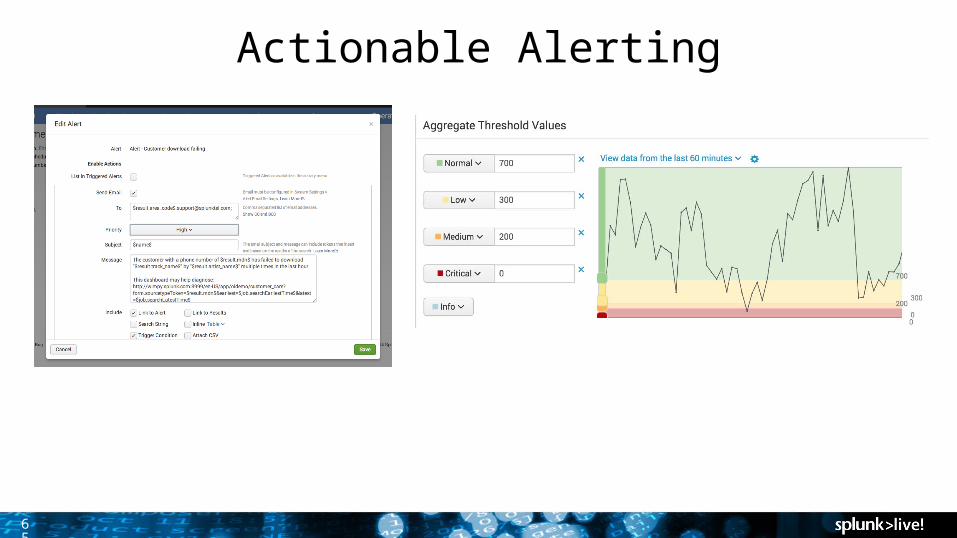
Actionable Alerting
66
6767
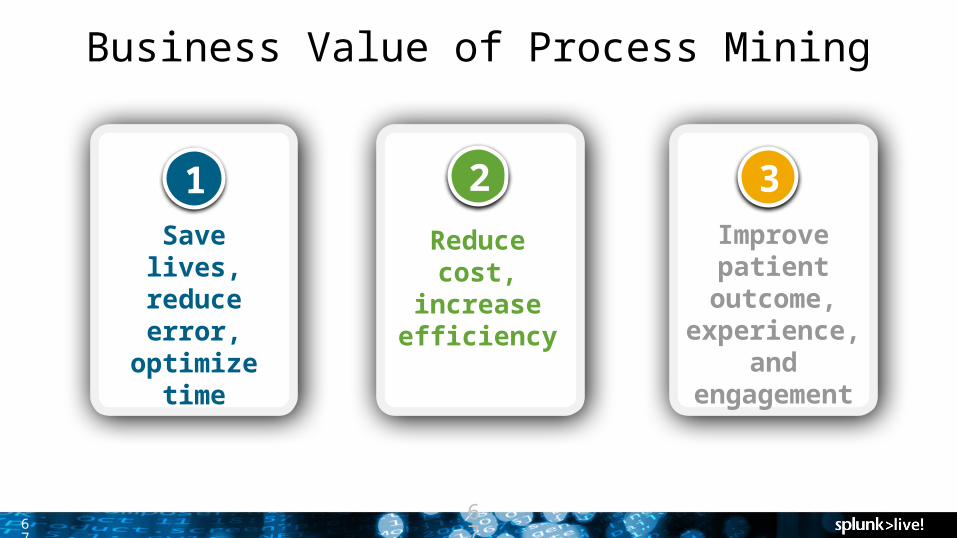
Business Value of Process Mining
Save lives, reduce error, optimize time
1Reduce cost,
increase efficiency
2 3Improve patient
outcome, experience, and
engagement

68
Agenda
Problem Background and MotivationCapabilities: MethodologyCapabilities: Data Integration and Feature EngineeringCapabilities: Statistics, Machine Learning, and VisualizationOperational IntegrationProduct Demonstration

Thank You


![[160530 D.CAMP Healthcare D.PARTY] Program and healthcare companies](https://img.pdfslide.tips/doc/110x75/58f9b296760da3da068bcd1c/160530-dcamp-healthcare-dparty-program-and-healthcare-companies.jpg)