Embed Size (px)
Citation preview
Олимпиада для студентов и выпускников вузов – 2012 г.
Демонстрационный вариант и методические рекомендации
по направлению «Менеджмент»
Профили:
«Маркетинг»
«Маркетинговые коммуникации и реклама в современном бизнесе»
«Стратегическое и корпоративное управление»
«Управление проектами: проектный анализ, инвестиции, технологии реализации»
«Управление человеческими ресурсами»
«Экономика впечатлений: менеджмент в индустрии гостеприимства и туризме»
ДЕМОНСТРАЦИОННЫЙ ВАРИАНТ
Время выполнения задания – 180 мин.
В соответствии со своим выбором программы магистерской подготовки выберите и
прочтите статью, сделайте ее критический анализ на русском языке.
Профиль «Маркетинг»1
While most Chinese consumers still consider foreign companies better in the overall
quality of their products and services, a growing number of multinationals and global brands
such as Toshiba, Wal-Mart, Nestle, KFC, and SK-II have had to face the discontent of Chinese
consumers. As some recent incidents have revealed, such as the well-publicized smashing of a
Mercedes-Benz in public, multinationals as well as the government were caught unprepared by
the displays of dissatisfaction and frustration from some Chinese consumers over shoddy
products and poor services (Chang & Yan, 2002; China Economic Review, 1997). With the
increasing support from government agencies and consumer associations, consumer advocacy or
consumerism has come into the limelight in China (Ho, 2001; Ho & Sin, 1988). Many
multinationals in China have realized that they can no longer take the goodwill of Chinese
consumers for granted. The burgeoning economies in the Big Emerging Markets such as China,
with a large population and growing affluence, have made it all the more important for both local
players and global companies to understand how consumers in these societies perceive
marketing.
Researchers and practitioners have long been interested in consumer attitudes toward
marketing and how they affect consumers' experiences in the marketplace (Chopin & Darrat,
2000; Gaski & Etzel, 2005). Previous studies suggest that given the advanced development of
their economies and their high levels of consumerism development and consumer protection,
consumers in developed economies are more positive toward marketing and want less
government intervention (Barksdale et al., 1982; Varadarajan & Thirunarayana, 1990). Here,
consumerism is referred to as the advocacy of consumer rights and organized consumer
movement instead of the emphasis on consumption and materialism. In comparison with the
previous studies of more advanced economies, recent studies have found that consumers in some
1 Статья составлена по: Cui G., Chan T., Joy A. Consumers' Attitudes toward Marketing: A Cross-cultural Study
of China and Canada. Journal of International Consumer Marketing, Vol. 20 (3-4), 2008.

countries like Hong Kong and mainland China, which are at the crusading stage of the
consumerism lifecycle, are in fact less critical of marketing (Chan et al., 1990, Chan & Cui,
2004). These researchers questioned whether their more favorable attitudes toward marketing
reflect the good behaviors of marketers; instead, they propose that this could be related to the
cultural value of collectivism and the emphasis on being nonjudgmental in Chinese societies.
Thus, the objectives of this research are to test the two competing hypotheses – the consumerism
lifecycle hypothesis and the cultural value hypothesis – to shed light on the inconsistent findings
about the observed country differences in consumers' attitudes toward marketing.
Consumer Attitudes toward Marketing
Recently, several researchers have found that a number of factors influence consumers'
attitudes toward marketing. In a study of advertising – one of the more visible marketing mix
variables, Treise et al. (1994) examine the perceptions of familiar advertising controversies:
targeting practices and message strategies. Their results show that consumers believe that
advertising often violates broad ethical norms. In addition, the degree to which consumers judge
advertising as ethical or unethical varies as a function of their ethical philosophies, such as
relativism and idealism. Similarly, Obermiller & Spangenberg (2000) find that consumer
skepticism significantly affects their perceptions of advertising appeals. Thus, consumer attitudes
toward marketing may vary depending on their ethical ideologies in that consumers with greater
emphasis on idealism and less on relativism tend to be more critical. In addition, Nwachukwu et
al. (1997) find that perceptions of individual autonomy and consumer sovereignty play
significant roles in consumers' ethical judgment of advertising and marketing.
While consumer attitudes toward marketing reflect their evaluations of the marketers'
performance, these perceptions have also been found to be linked to several key macroeconomic
variables and have been used in economic forecasts (Chopin & Darrat, 2000). Gaski & Etzel
(2005) longitudinal analysis based on the data from the U.S. suggest that consumer attitudes
toward marketing have undergone significant changes over time, at least on some of the
dimensions. Their results show a pattern of slightly improving consumer attitudes toward
marketing practices. In addition, the patterns of such changes are significantly related to the
macro-economic indicators of the country, such as the Consumer Price Index (CPI) and savings
rate. Recently, the Barksdale-Darden-Perreault (BDP) longitudinal theme has been reprised by
Fornell et al. (1996) with the American Customer Satisfaction Index (ACSI), which subsequently
has been adopted or modified by researchers in other countries. Therefore, consumer attitudes
toward marketing activities are important from both a theoretical and a managerial standpoint
and represent important knowledge for management decisions and public policies.
Cross-national Comparisons
Due to the rapid globalization of business, rigorous measures of consumer attitudes toward
marketing are needed for cross-cultural comparisons. Several cross-cultural studies have found
some differences between countries in consumer attitudes toward marketing (Barksdale et al.,
1982; Varadarajan & Thirunarayana, 1990; Wee & Chan, 1989). One of the important research
questions is the relationship between the level of consumerism development and consumer
attitudes toward marketing. Straver (1977) proposed a lifecycle of consumerism development
with four stages from crusading, popular movement, organization to bureaucracy. Later,
Barksdale et al. (1982) surveyed six countries including Israel, England, Australia, United States,
Canada and Norway and placed them on a lifecycle of consumerism development. They
proposed that consumers in the countries with advanced levels of consumerism development
tended to be more satisfied with the status quo and were less likely to want additional
government regulation, thus having less positive attitudes towards consumerism. In contrast,
consumers in countries at the introductory or crusading stage would be more critical of
businesses and have positive attitudes towards consumerism.
Despite the cross-country differences in consumer attitudes toward marketing, the findings
from previous studies are inconsistent and inconclusive about which aspects of a society or
culture are relevant in explaining these variations. Researchers have provided alternative
explanations about the sources of the cross-national variations in consumer attitudes toward
marketing – they are either related to the stage of consumerism development (Barksdale et al.,
1982; Varadarajan & Thirunarayana, 1990) or cultural differences such as individualism (Chan,
Yau & Chan, 1990; Chan & Cui, 2004). However, our knowledge about consumerism in the
unique cultures of less developed countries is very rudimentary (Kaynak & Wikstrom, 1985).
RESEARCH DESIGN AND HYPOTHESES
Organized consumerism movement has been largely a Western phenomenon and most
studies of consumerism have been on the developed economies. Consumerism in developing
countries has received little attention in the current literature. Consumers in different societies
face rather distinctive economic and market environments and have different sets of perceptual
characteristics such as their beliefs and priority of needs. For instance, while the advanced
economies are more likely to emphasize love/affection and self-esteem, less developed countries
tend to be dominated by physiological and safety/security needs. Moreover, there is a
predominance of fatalism among consumers of less developed countries. Consumers in LDCs
require sufficient development in terms of socio-economic and cultural variables, such as
consumer education and stronger beliefs in activism, that make it acceptable for people to
become involved in consumer issues (Kaynak & Wikstrom, 1985). Thus, comparing the
consumer attitudes toward marketing and consumerism and examining the influence of cultural
values can help reconcile the inconsistent findings.
The existing literature suggests two alternative explanations for the cross-cultural
differences in consumers' attitudes toward marketing, i.e., the stage of consumerism development
and cultural values (i.e., individualism/collectivism). These two factors form the competing
hypotheses about the sources of cross-cultural differences in consumer attitudes in this study.
First, economic development and consumerism tend to go hand-in-hand (Barksdale et al., 1982;
Straver, 1977). According to the lifecycle concept of consumerism development, several
researchers suggest that consumers in developed economies in Europe and North America such
as Canada have more positive attitudes toward marketing but less positive attitudes toward
consumerism because these countries already have strong institutions for protecting consumer
rights and consumers are in general satisfied with the status quo (Barksdale et al., 1982). In less
developed economies, where consumerism development is at the early stage of the lifecycle,
consumers tend to have less positive attitudes toward marketing and more positive attitudes
toward consumerism, i.e., a stronger consumerism sentiment (Varadarajan & Thirunarayana,
1990). Based on the lifecycle concept of consumerism development, mainland China would be at
the introductory crusading stage, where legal infrastructure and consumer protection policies are
still underdeveloped (Chan & Cui, 2004; Ho, 2001). Thus, given the low level of consumer
protection, Chinese consumers would have more negative attitudes toward marketing yet more
positive attitudes toward consumerism than those in a country such as Canada, where consumer

protection has become more institutionalized. Thus, we propose the following hypotheses based
on the lifecycle concept of consumerism development.
H1: Consumers in China have significantly more negative attitudes toward marketing than
those in Canada.
H2: Consumers in China have significantly more positive attitudes toward consumerism
than those in Canada.
To validate the role of consumerism development in affecting consumer attitudes toward
marketing, it is necessary to adopt other control variables or covariates to ascertain that the
observed differences are consistent and not due to chance (Lenartowicz & Roth, 1999). Thus, as
previous studies suggested (Gaski & Etzel, 1986), consumer attitudes toward marketing can be
validated with other concepts including consumer satisfaction with marketing and frequency of
problems. Consumer attitudes toward marketing are closely related to their satisfaction with
marketing institutions in general. In fact, researchers such as Fornell et al. (1996) have adapted
the original Barksdale scale and developed the American Customer Satisfaction Index (ACSI),
suggesting that the consumer attitudes toward marketing and consumer satisfaction are closely
related concepts. Thus, consumer attitudes toward marketing should be reflected in and
consistent with the satisfaction or dissatisfaction of consumers (Barksdale et al., 1982; Chan &
Cui, 2004; Gaski & Etzel, 2005). Given the inadequate protection of consumer rights, it would
be expected that the Chinese have a lower level of satisfaction than consumers in a country at an
advanced stage of consumerism development. Likewise, if the consumerism lifecycle concept
holds true, in an emerging market economy like China where consumer protection mechanisms
are not yet fully established, consumers would encounter more problems with marketing. In
contrast, in a country like Canada, where consumerism and consumer protection are at an
advanced level of development, consumers would encounter fewer problems with marketing and
are more satisfied with the status quo. Thus, these two variables, i.e., satisfaction with marketing
and frequency of problems would serve as a strong test of the predictive and convergent validity
of the lifecycle concept of consumerism development. We propose the following hypotheses for
testing.
H3: Consumers in China have a significantly lower level of satisfaction with marketing
than those in Canada.
H4: Consumers in China have a significantly higher frequency of problems with marketing
than those in Canada.
On the other hand, as Chan, Yau & Chan (1990) have argued, consumer responses to
evaluative questions about marketing may be grounded in cultural values, such as individualism
or collectivism. Among the great number of cultural values such as man-nature relationship and
power distance, individualism/collectivism (i.e., I/C) is one of the cultural value dimensions that
exert the greatest influences on an individual's perceptions of one's role in the larger social group
(Hofstede, 2001; Yau, 1988). China represents one of the East Asian societies that emphasize the
values of collectivism. Existing research has provided ample evidence about the differences in
individualism or collectivism between Western societies and Eastern cultures such as China, and
such differences have been found to influence many aspects of attitudes and behaviors across
cultures (Hofstede, 2001). Specifically, individualism has been found to influence consumers'
interactions with marketers, such as their complaint behavior (Hui & Au, 2001; Liu & McClure,
2001). Thus, one way to assess the relationship between consumer attitudes toward marketing
and the cultural value of individualism is to examine the complaint behaviors of consumers
across cultures. Several authors argue that compared with consumers in an individualistic society

such as Canada, Chinese consumers are relatively less critical of marketing because of the
Chinese society's emphasis on the cultural value of collectivism, e.g., favoring harmony and
being non-judgmental (Chan, Yau & Chan, 1990). Consumers in collectivist societies are less
likely to ―voice‖ their opinions or complain directly to the marketer than consumers in
individualistic societies (Liu & McClure, 2001). On the other hand, consumers in collectivistic
societies are more likely to resort to public resolution, i.e., third party responses, than those from
individualistic societies such as Canada (Chelminski, 2003; Nyer & Gopinath, 2005). Therefore,
how the cultural value of individualism/collectivism affects consumer attitudes toward marketing
and their satisfaction should be reflected in their complaint behavior. We propose the following
hypotheses for testing.
H5: Consumers in China are significantly less likely to complain about marketing than
consumers in Canada.
H6: Consumers in China are significantly more likely to resort to public resolutions than
consumers in Canada.
METHOD AND MEASURES
To measure consumer attitudes toward marketing, we adopted the Consumer Sentiment
toward Marketing scale that was developed by Gaski & Etzel (1986). The scale has been
validated in several studies outside of the U.S. and used in most studies of consumer attitudes
toward marketing (Chan & Cui, 2004; Wee & Chan, 1989). The questionnaire includes measures
of consumer attitudes toward each of the marketing mix variables – product, retailing,
advertising, and price. Consumers are asked to respond to 28 statements about their attitudes
regarding the marketing mix variables, such as ―I am satisfied with the quality of products that I
have purchased‖. A Likert scale is used for measuring consumer responses, ranging from (1)
strongly agree to (5) strongly disagree with a point of neutrality in the middle. The measures of
attitudes toward consumerism were adapted from previous studies and included six items about
their support for organized consumer movement (Barksdale et al., 1982; Varadarajan &
Thirunarayana, 1990). In addition, the instrument also includes measures of consumer
satisfaction and the frequency of problems with each of the marketing mix variables (Gaski &
Etzel, 1986). For complaint behaviors, we adopted measures from previous studies to measure
complaint to 1) marketers (voice) and 2) negative word-of-mouth (NWOM) or complaining to
others (Liu & McClure, 2001; Singh, 1990). For public resolution, we measured public
complaint responses of consumers and their support for government regulations of marketing
activities (Barksdale et al., 1982; Singh, 1990). Lastly, the 8-item individualism measurement
scale of Hofstede (2001) was included in the questionnaire.
As the consumer revolution has largely been an urban phenomenon in Chinese mainland,
studies of Chinese consumers have focused on major urban areas (Cui & Liu, 2001). In our
study, we conducted a survey in four major cities including Beijing, Shanghai, Guangzhou, and
Chengdu, which represent the north, east, south, and west of China. Two authors of the study are
bilingual speakers of Chinese and English. The English questionnaire was translated into
Chinese by one researcher, and then back translated into English by another. This process was
repeated three times to ensure conceptual correspondence. Based on the results of a small-scale
pilot study, we made further improvement in the Chinese measures of these concepts. Finally,
the Chinese version of the questionnaire was used for data collection in China's cities.
To complete the survey, research assistants were recruited among graduate students
enrolled at local universities in the four cities of China. These assistants were trained to conduct

a central location intercept survey (CLIS) of residents of these cities using the structured
questionnaire. The CLIS method is an effective and widely used method in consumer and
marketing research that can generate results that are comparable to other methods based on
probability samples. To ensure that the sample represents urban consumers in China, multi-stage
random sampling method was used. First, three urban districts were selected from each city, each
of which has about a dozen urban districts. From each district, a neighborhood shopping center
was randomly chosen as the interview site. Then, an intercept survey was conducted at these
shopping centers at different times of day during a ten-day period to interview every fifth person
until the 200th interview was completed. Finally, 200 usable questionnaires were collected from
each of the cities, resulting in a total of 800 cases for the Chinese sample. Since a large-scale
consumer survey is prohibitively expensively in developed countries such as Canada, we
conducted the central location intercept survey (CLIS) in two major cities: Toronto and
Montreal, using the English version of the questionnaire. We recruited and trained research
assistants among graduate students enrolled at local universities in the two cities. A central
location intercept survey was then conducted in each city at a major shopping center at different
times of day during a 14-day period to interview every fifth person until the 250th interview was
completed. Finally, we collected 500 usable questionnaires from the Canadian survey.
RESULTS
First, we compared the key characteristics of the two country samples to ensure their
comparability using a series of chi-square tests. We did not found significant differences between
the two samples in gender distribution and employment status. We also compared the two
samples in terms of age, marital status, occupation, and income distribution. Although we did not
find any major differences, the China sample has a slightly larger group of younger age (under
30), more single people (34% vs. 23%), a smaller group in the lower income category, and less
people in the professional occupation category in comparison with the Canadians. These
differences reflect the overall younger population and the less developed economy in China. All
categorical groups of these variables are represented in both samples. Overall, the major
demographic characteristics of the two relatively large samples are comparable and
representative of their national populations of urban households.
We then performed the same item purification procedure that was used by Gaski & Etzel
(1986). The same five items to measure attitudes toward marketing functions are used for the two
countries. The reliability of each measure toward the marketing mix variables proved to be
satisfactory based on the Cronbach's alpha (Table 1). We also tested the reliability measures of
other key variables, including attitude toward consumerism, individualism, and satisfaction,
which proved to be satisfactory for both samples. The difference between the two countries in
the individualism measure is statistically significant in that China has an average score of 3.92
while Canada has an average score of 4.36 (t-value = - 15.52, sig. < 0.001). This difference is
consistent with that based on the Hofstede's country index scores for China and Canada (20 vs.
80).
Table 1. Reliability of Measures: Cronbach’s Alpha
Factors/Country China Canada
Attitude toward product 0.758 0.771
Attitude toward channel 0.701 0.820
Attitude toward promotion 0.707 0.724

Attitude toward price 0.766 0.802
Attitude toward consumerism 0.774 0.791
Individualism 0.832 0.805
Frequency of problems 0.776 0.733
Satisfactions 0.653 0.706
Complaint 0.712 0.601
NWOM 0.735 0.746
Support for government
actions
0.714 0.809
Public resolution 0.824 0.868
To construct the index score for the overall attitudes toward marketing, we followed the
same procedure that previous studies used (Gaski & Etzel, 1986; Wee & Chan, 1989). The
overall index score is the sum of the weighted measures of all sub-scales for product, retailing,
advertising, and price in a multi-attribute attitude model. The results in Table 2 suggest that the
overall index score for consumer attitudes toward marketing in mainland China is 8.62. By
comparison, the Canadian consumers have an overall index score of 5.51. Thus, the index score
for Chinese consumers is slightly but significantly higher than that of Canada, which is contrary
to hypothesis one. This is similar to the findings of comparisons in a previous study (Chan &
Cui, 2004). Moreover, contrary to hypothesis two, Chinese consumers report significantly less
positive attitudes toward consumerism (mean of 4.02) than their Canadian counterparts (mean of
4.19). Thus, the hypotheses based on the lifecycle concept of consumerism development do not
hold in our empirical analyses.
Table 2. T-tests of Country Differences across Dimensions
Variable/Country China Canada T-value Sig. Level
Overall attitudes
toward Marketing 8.62 5.51 7.92 0.001
Consumerism 4.02 4.19 - 5.49 0.001
Individualism 3.92 4.36 - 15.52 0.001
Frequency of
problems 2.81 2.54 6.25 0.001
Satisfaction 3.24 3.04 5.89 0.001
Complaint 4.17 5.54 - 25.50 0.001
NWOM 3.83 4.86 - 17.99 0.001
Public resolution 3.34 2.94 6.07 0.001
Support for
government
actions
4.26 3.78 10.89 0.001
Note: Overall attitudes toward marketing are measured by the weighted sum of the
attitudes toward the four marketing mix variables, while all other variables are means of the
items measured on a 5-point Likert scale.
We then compare the two countries in the reported consumer satisfaction with marketing
and frequency of problems using t-tests of the mean scores of these variables. According to the
results in Table 2, the overall satisfaction score is significantly higher for the Chinese than for
the Canadians (3.24 vs. 3.04), which is in the opposite direction by predicted by Hypothesis 3.
Thus, one might conjecture that the Chinese businesses are performing the marketing functions
better than their Canadian counterparts. However, consistent with Hypothesis 4, Chinese
consumers report a significantly higher frequency of problems with marketing activities than
their Canadian counterparts (2.81 vs. 2.54), despite the fact that Chinese consumers have
reported more positive attitudes toward marketing and a higher level of satisfaction. The
inconsistency of findings between different measures of similar concepts is indeed puzzling.
These results demonstrate the problems with comparisons of country means in many
comparative studies. At this stage, any conclusions about the relationships among these variables
would be premature.
Then, we examine the findings on the complaint behaviors and support for government
regulations, which are related to the cultural value of individualism. The results in Table 2
indicate that Chinese consumers are significantly less likely to complain directly to stores than
the Canadians (4.17 vs. 5.54), and they also engage in less negative word-of-mouth (3.83 vs.
4.86), i.e., complaining to others. Thus, the Chinese have a weaker tendency for private
complaint behaviors. On the other hand, Chinese consumers report a stronger preference for
resolution by public institutions (3.34 vs. 2.94), including reporting to the press or consumer
protection agencies and resorting to legal procedures. In addition, Chinese consumers also report
greater support for government actions than the Canadians (4.26 vs. 3.78). Thus, both hypotheses
5 and 6 are supported by the results. Overall, Chinese consumers, from a collectivist society, are
less likely to engage in private complaint behaviors (voicing and NWOM) and show stronger
tendency toward public resolution and stronger support for government regulations than their
Canadian counterparts from a more individualistic culture. The results are consistent with the
emphasis of different cultural values in these societies and provide support for the hypotheses
based on cultural value.
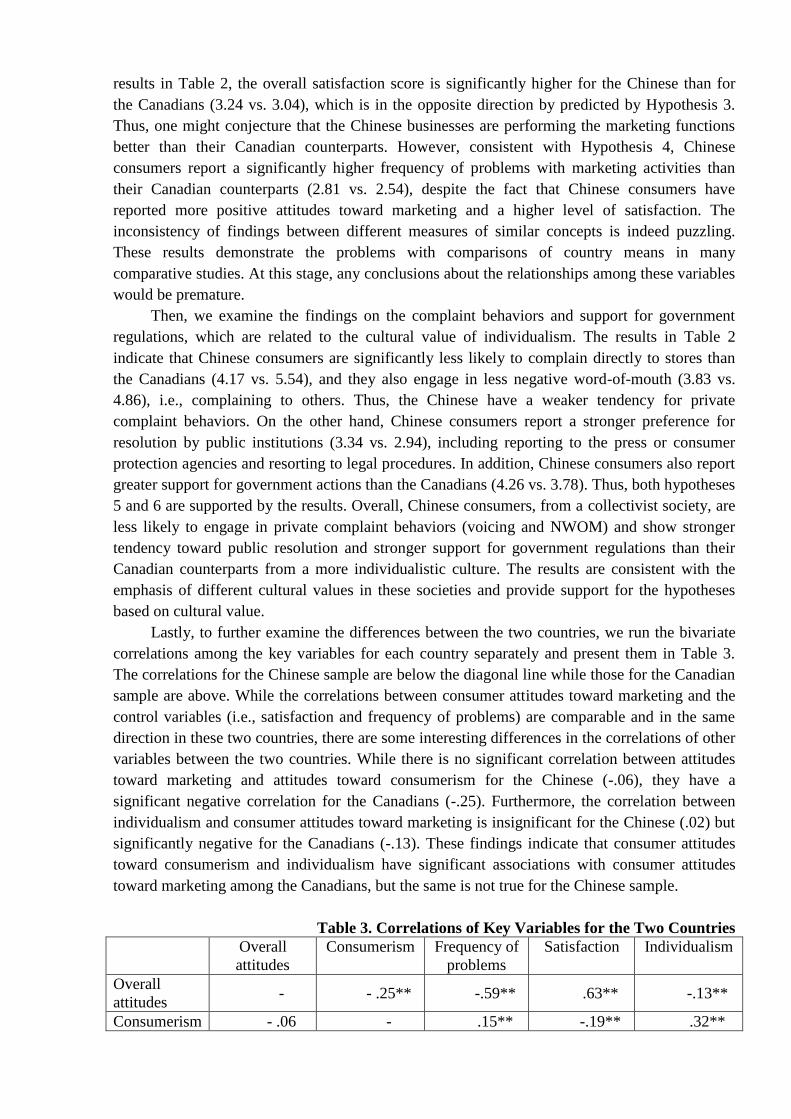
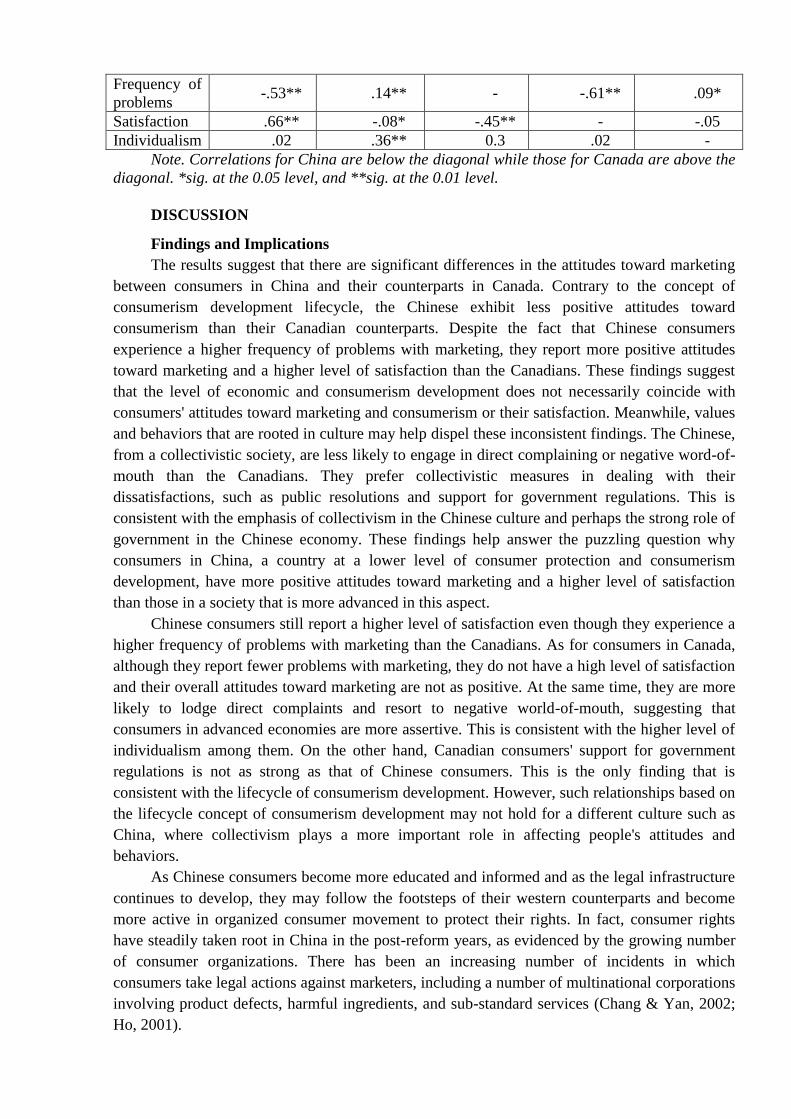
Lastly, to further examine the differences between the two countries, we run the bivariate
correlations among the key variables for each country separately and present them in Table 3.
The correlations for the Chinese sample are below the diagonal line while those for the Canadian
sample are above. While the correlations between consumer attitudes toward marketing and the
control variables (i.e., satisfaction and frequency of problems) are comparable and in the same
direction in these two countries, there are some interesting differences in the correlations of other
variables between the two countries. While there is no significant correlation between attitudes
toward marketing and attitudes toward consumerism for the Chinese (-.06), they have a
significant negative correlation for the Canadians (-.25). Furthermore, the correlation between
individualism and consumer attitudes toward marketing is insignificant for the Chinese (.02) but
significantly negative for the Canadians (-.13). These findings indicate that consumer attitudes
toward consumerism and individualism have significant associations with consumer attitudes
toward marketing among the Canadians, but the same is not true for the Chinese sample.
Table 3. Correlations of Key Variables for the Two Countries
Overall
attitudes
Consumerism Frequency of
problems
Satisfaction Individualism
Overall
attitudes - - .25** -.59** .63** -.13**
Consumerism - .06 - .15** -.19** .32**
Frequency of
problems -.53** .14** - -.61** .09*
Satisfaction .66** -.08* -.45** - -.05
Individualism .02 .36** 0.3 .02 -
Note. Correlations for China are below the diagonal while those for Canada are above the
diagonal. *sig. at the 0.05 level, and **sig. at the 0.01 level.
DISCUSSION
Findings and Implications
The results suggest that there are significant differences in the attitudes toward marketing
between consumers in China and their counterparts in Canada. Contrary to the concept of
consumerism development lifecycle, the Chinese exhibit less positive attitudes toward
consumerism than their Canadian counterparts. Despite the fact that Chinese consumers
experience a higher frequency of problems with marketing, they report more positive attitudes
toward marketing and a higher level of satisfaction than the Canadians. These findings suggest
that the level of economic and consumerism development does not necessarily coincide with
consumers' attitudes toward marketing and consumerism or their satisfaction. Meanwhile, values
and behaviors that are rooted in culture may help dispel these inconsistent findings. The Chinese,
from a collectivistic society, are less likely to engage in direct complaining or negative word-of-
mouth than the Canadians. They prefer collectivistic measures in dealing with their
dissatisfactions, such as public resolutions and support for government regulations. This is
consistent with the emphasis of collectivism in the Chinese culture and perhaps the strong role of
government in the Chinese economy. These findings help answer the puzzling question why
consumers in China, a country at a lower level of consumer protection and consumerism
development, have more positive attitudes toward marketing and a higher level of satisfaction
than those in a society that is more advanced in this aspect.
Chinese consumers still report a higher level of satisfaction even though they experience a
higher frequency of problems with marketing than the Canadians. As for consumers in Canada,
although they report fewer problems with marketing, they do not have a high level of satisfaction
and their overall attitudes toward marketing are not as positive. At the same time, they are more
likely to lodge direct complaints and resort to negative world-of-mouth, suggesting that
consumers in advanced economies are more assertive. This is consistent with the higher level of
individualism among them. On the other hand, Canadian consumers' support for government
regulations is not as strong as that of Chinese consumers. This is the only finding that is
consistent with the lifecycle of consumerism development. However, such relationships based on
the lifecycle concept of consumerism development may not hold for a different culture such as
China, where collectivism plays a more important role in affecting people's attitudes and
behaviors.
As Chinese consumers become more educated and informed and as the legal infrastructure
continues to develop, they may follow the footsteps of their western counterparts and become
more active in organized consumer movement to protect their rights. In fact, consumer rights
have steadily taken root in China in the post-reform years, as evidenced by the growing number
of consumer organizations. There has been an increasing number of incidents in which
consumers take legal actions against marketers, including a number of multinational corporations
involving product defects, harmful ingredients, and sub-standard services (Chang & Yan, 2002;
Ho, 2001).

LIMITATIONS AND SUGGESTIONS
This study compares only two countries and cultures. Studies of other cultures and markets
would help validate the findings of this study. Both surveys in this study use samples of urban
residents, which may not realistically reflect the perceptions of the total population. In addition,
culture and human behaviors are dynamic in nature. In the last two decades, China has been in a
historical transition from central planning to relying on market forces. Reforms and economic
development have led to the adoption of modern marketing practices, the emergence of a
consumer society, and a growing middle-class. There is a great likelihood that Chinese
consumers' attitudes toward marketing will become more critical in the future. Longitudinal
studies of consumer attitudes and cultural values may help examine the evolution of their
perceptions and help gauge the performance of marketers.
To attribute country differences to socio-cultural variables, researchers need to conduct
simultaneous multi-country studies, include all the eligible explanatory variables in the research
design, and test the competing hypotheses. Future studies should consider using direct measures
of individualism and other relevant cultural values. When more countries are included in a study
and more country-level data are available, researchers can develop well-specified theoretical
models and apply sophisticated methods such as hierarchical linear models (HLM) or multi-
group structural equation models (MGSEM) to examine the effects of cultural values across
countries. These procedures can help reveal the differential effect of a variable based on a
theoretical model and help to define the role of cultural values in explaining cross-national
differences for a better understanding of consumer and organizational behaviors in different
societies.
Вопросы для размышления:
1. Каковы основные проблемы, рассматриваемые в статье?
2. Какие из приведенных в статье исследовательских подходов и методов, выводов по
результатам исследования представляются вам спорными, неполными, недостаточно
обоснованными? Почему?
3. Каковы ограничения проведенного исследования?
4. Как вы считаете, каковы дополнительные направления использования маркетологами
результатов этого исследования?
5. Являются ли рассмотренные в статье проблемы актуальными для российских
компаний? Насколько применимы результаты проведенного исследования в российской
практике?
Профиль «Маркетинговые коммуникации и реклама в современном
бизнесе»2
In the process of examining all of the research available, we have been able to demonstrate
that many of the most widely held myths about commercial television are simply wrong. As a
result there seems to have been a noticeable drop in the doom-laden headlines and sense of mild
despair. Here are five of the most prominent myths.
MYTH 1: COMMERCIAL TV IS IN TERMINAL DECLINE
Contrary to what the doom-mongers have been saying, we can see that broadcast viewing
figures have remained at exactly the same levels, or even slightly higher, than through the 1980s
and 1990s. This has happened despite reports of new technologies and platforms taking viewers
away from the domestic set, currently the only device measured by BARB (British Advertising
Research Bureau).
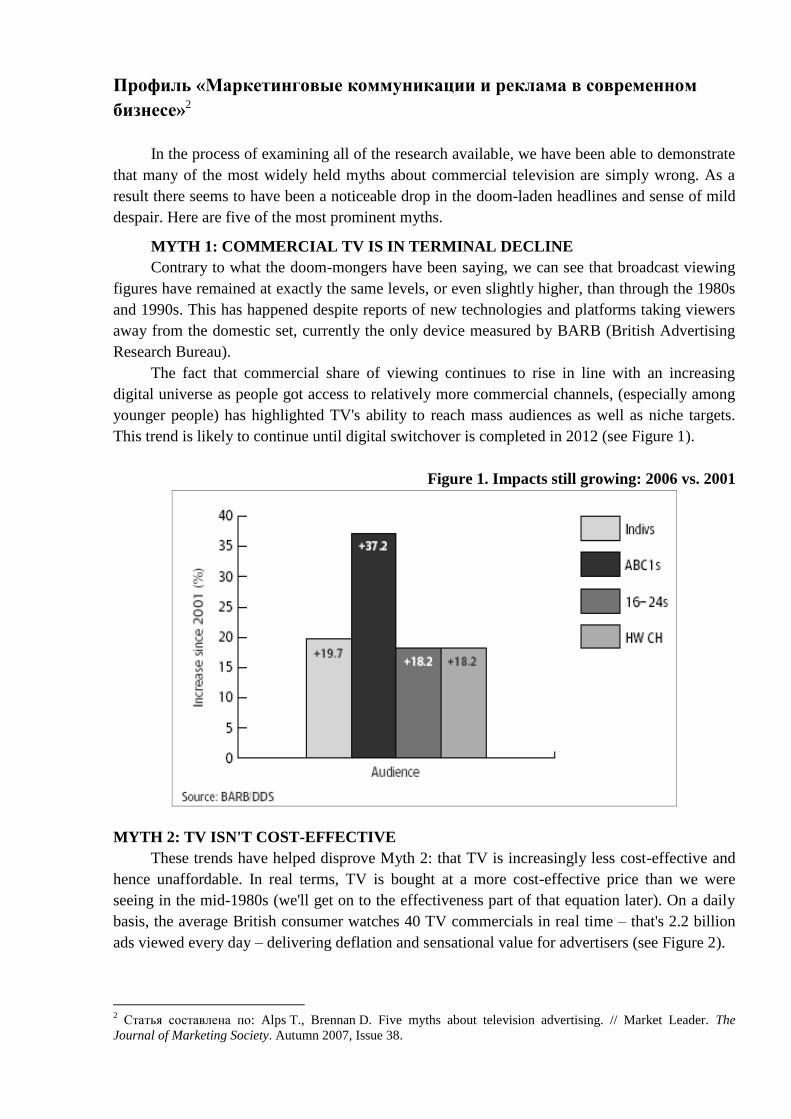
The fact that commercial share of viewing continues to rise in line with an increasing
digital universe as people got access to relatively more commercial channels, (especially among
younger people) has highlighted TV's ability to reach mass audiences as well as niche targets.
This trend is likely to continue until digital switchover is completed in 2012 (see Figure 1).
Figure 1. Impacts still growing: 2006 vs. 2001
MYTH 2: TV ISN'T COST-EFFECTIVE
These trends have helped disprove Myth 2: that TV is increasingly less cost-effective and
hence unaffordable. In real terms, TV is bought at a more cost-effective price than we were
seeing in the mid-1980s (we'll get on to the effectiveness part of that equation later). On a daily
basis, the average British consumer watches 40 TV commercials in real time – that's 2.2 billion
ads viewed every day – delivering deflation and sensational value for advertisers (see Figure 2).
2 Статья составлена по: Alps T., Brennan D. Five myths about television advertising. // Market Leader. The
Journal of Marketing Society. Autumn 2007, Issue 38.
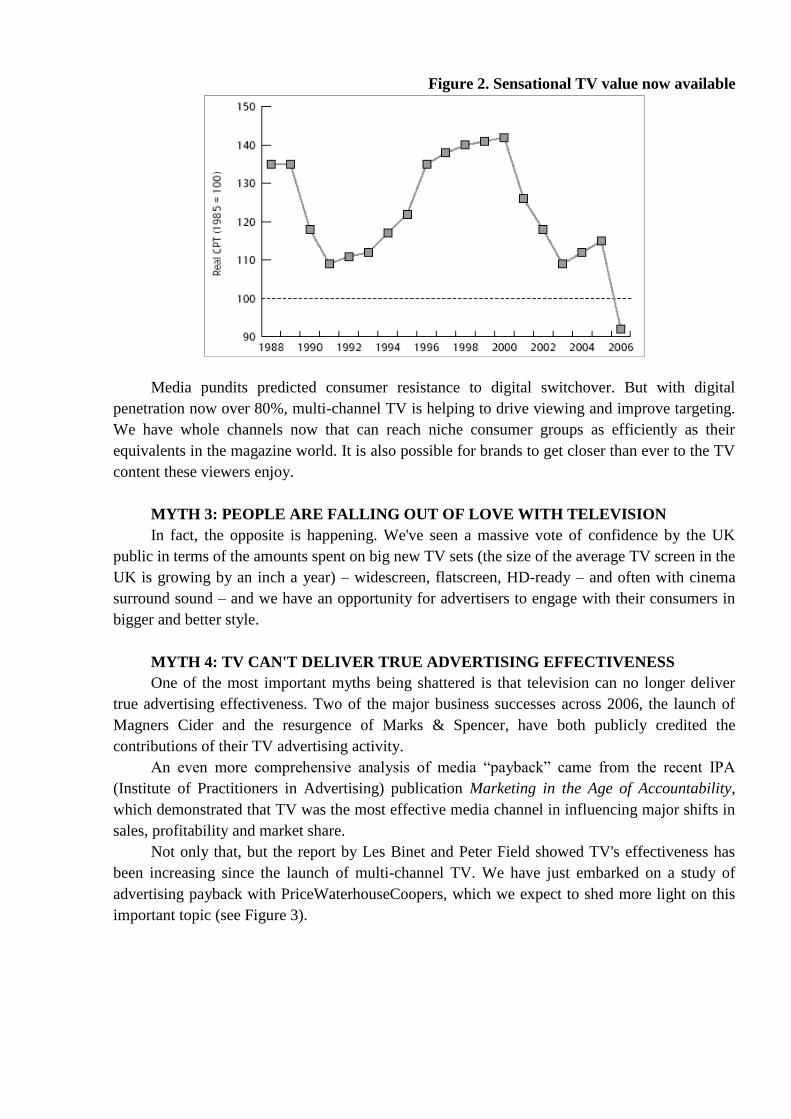
Figure 2. Sensational TV value now available
Media pundits predicted consumer resistance to digital switchover. But with digital
penetration now over 80%, multi-channel TV is helping to drive viewing and improve targeting.
We have whole channels now that can reach niche consumer groups as efficiently as their
equivalents in the magazine world. It is also possible for brands to get closer than ever to the TV
content these viewers enjoy.
MYTH 3: PEOPLE ARE FALLING OUT OF LOVE WITH TELEVISION
In fact, the opposite is happening. We've seen a massive vote of confidence by the UK
public in terms of the amounts spent on big new TV sets (the size of the average TV screen in the
UK is growing by an inch a year) – widescreen, flatscreen, HD-ready – and often with cinema
surround sound – and we have an opportunity for advertisers to engage with their consumers in
bigger and better style.
MYTH 4: TV CAN'T DELIVER TRUE ADVERTISING EFFECTIVENESS
One of the most important myths being shattered is that television can no longer deliver
true advertising effectiveness. Two of the major business successes across 2006, the launch of
Magners Cider and the resurgence of Marks & Spencer, have both publicly credited the
contributions of their TV advertising activity.
An even more comprehensive analysis of media ―payback‖ came from the recent IPA
(Institute of Practitioners in Advertising) publication Marketing in the Age of Accountability,
which demonstrated that TV was the most effective media channel in influencing major shifts in
sales, profitability and market share.
Not only that, but the report by Les Binet and Peter Field showed TV's effectiveness has
been increasing since the launch of multi-channel TV. We have just embarked on a study of
advertising payback with PriceWaterhouseCoopers, which we expect to shed more light on this
important topic (see Figure 3).
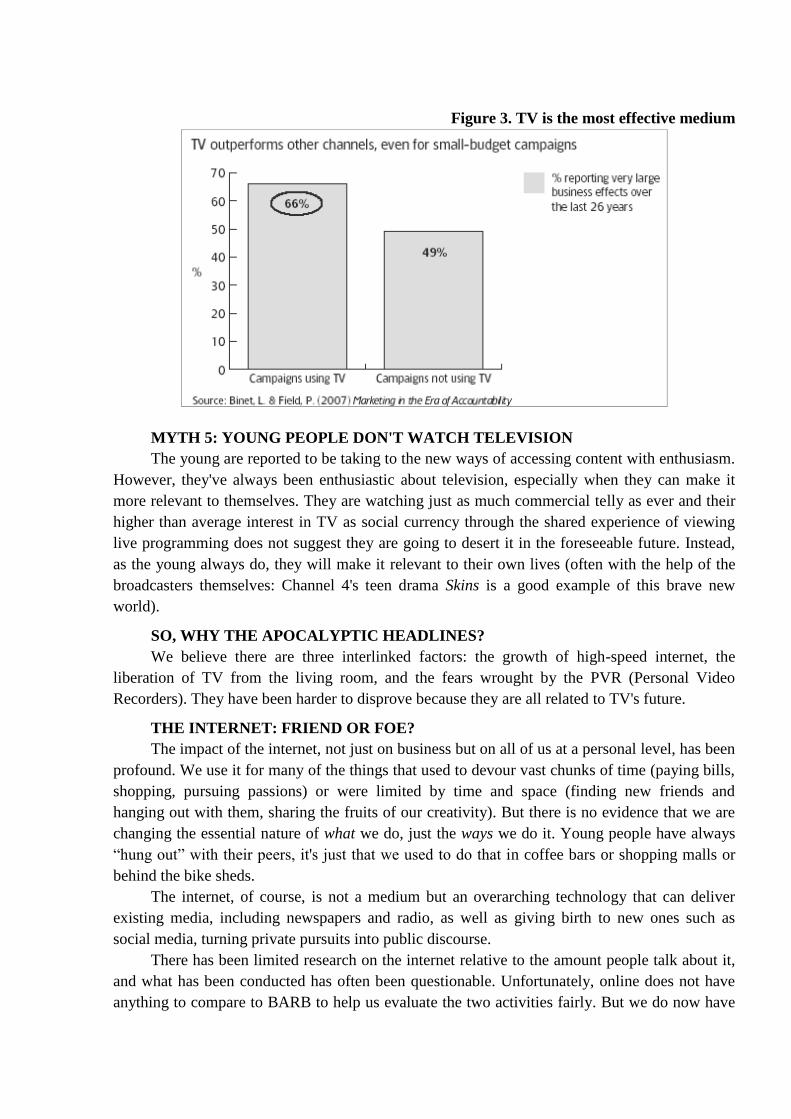
Figure 3. TV is the most effective medium
MYTH 5: YOUNG PEOPLE DON'T WATCH TELEVISION
The young are reported to be taking to the new ways of accessing content with enthusiasm.
However, they've always been enthusiastic about television, especially when they can make it
more relevant to themselves. They are watching just as much commercial telly as ever and their
higher than average interest in TV as social currency through the shared experience of viewing
live programming does not suggest they are going to desert it in the foreseeable future. Instead,
as the young always do, they will make it relevant to their own lives (often with the help of the
broadcasters themselves: Channel 4's teen drama Skins is a good example of this brave new
world).
SO, WHY THE APOCALYPTIC HEADLINES?
We believe there are three interlinked factors: the growth of high-speed internet, the
liberation of TV from the living room, and the fears wrought by the PVR (Personal Video
Recorders). They have been harder to disprove because they are all related to TV's future.
THE INTERNET: FRIEND OR FOE?
The impact of the internet, not just on business but on all of us at a personal level, has been
profound. We use it for many of the things that used to devour vast chunks of time (paying bills,
shopping, pursuing passions) or were limited by time and space (finding new friends and
hanging out with them, sharing the fruits of our creativity). But there is no evidence that we are
changing the essential nature of what we do, just the ways we do it. Young people have always
―hung out‖ with their peers, it's just that we used to do that in coffee bars or shopping malls or
behind the bike sheds.
The internet, of course, is not a medium but an overarching technology that can deliver
existing media, including newspapers and radio, as well as giving birth to new ones such as
social media, turning private pursuits into public discourse.
There has been limited research on the internet relative to the amount people talk about it,
and what has been conducted has often been questionable. Unfortunately, online does not have
anything to compare to BARB to help us evaluate the two activities fairly. But we do now have

the IPA's Touchpoints survey, as well as that hardy perennial the TGI (Target Group Index
Research), to see how much time is spent on the internet compared to TV (see Figure 4).
Figure 4. Broadcast TV dominates our media day
Contrary to the popular view, both of these sources show TV time outstripping online time
by a ratio of between two and three to one, across all demographic groups. There is increasing
evidence of media meshing – watching TV and being online at or around the same time – which
Touch points indicates peaks at a high of 12% of the TV audience during weekday peak time.
Meanwhile, internet time does not seem to consist of a great deal of watching TV online – as
Figure 5 shows. The main use of the internet is for work and email, and if even half of those
watching ―music/film/entertainment online‖ were watching TV content, that would still be less
than 5% of all online time.
Figure 5. INTERNET used mostly for email and work
Things may change when a critical mass of households have a direct link from their high-
speed broadband connection to their TV screen, but then that will still be ―TV viewing‖ and we
expect BARB to be able to measure that viewing by the next contract start. This will
undoubtedly result in more viewing away from the schedules, towards on-demand and a limited
amount of ―long tail‖ content. But this may be more of an opportunity to the advertiser than a
threat to the advertising model, because it is all part of the liberation of the TV set during the
third age of television.
THE THIRD AGE OF TELEVISION
The concept of the ―Third Age of Television‖ is one of liberation: complete freedom of
choice for the consumer in an on-demand environment and liberation of content from the
domestic household set. Content will be king, which explains why the major broadcasters are
pioneering services via IPTV, web TV and mobile TV, which are mainly being taken up by the
classic early adopters, the young.
Early data from the trials of both IPTV and mobile TV indicate a lot of additional viewing
among enthusiasts but relatively modest projections of penetration and share of all viewing by
the end of the decade. They will undoubtedly have an impact, but this is more likely to be at
opposite ends of the viewing spectrum. At one end will be ―convenience TV‖, which might mean
a five-minute catch-up of last night's soap on mobile or internet-delivered on-demand viewing of
a series that might otherwise be missed. And at the other end will be ―treat‖ TV that could
demand a premium, such as major sporting events or first-run movies (indeed the competition
from the latter may well affect DVD stores most of all).
Although the evidence suggests a great deal of viewing will continue to be to the live
schedules, on-demand also offers specific benefits for advertisers: a highly targeted audience, a
selective programme environment, and an uncluttered break environment. The even better news
is that, when offered a choice between paying a small fee to view or watching an ad ―pre-roll‖, a
significant majority of consumers choose the ads.
DOES THE PVR MEAN DEATH TO THE 30-SECOND SPOT
The PVR (or DTR, or Sky+ to most users) has been a revelation. It is highly valued by
those who have one and yet they use it relatively infrequently. PVRs are already installed in 11%
of all homes (28% of Sky homes), surpassing all predictions, and yet it has had nothing like the
effect on viewing that had been anticipated. It has been touted as the supreme ad avoidance
technology, producing the death of the 30-second spot, and yet the majority of PVR homes
watch more ads in real time than they did before they installed one.
Why were we worried? Probably because the links to the electronic programme guides
means it would be possible to set it to record a whole evening's viewing in a couple of minutes,
while any part of the recorded programme can be fast-forwarded, just like the old VHS
machines. So, who wouldn't want to ―download‖ an evening's viewing and then view in timeshift
mode, zipping through the ads in seconds? Well, so far, not too many of the early adopters, who
are usually more enthusiastic about their technology.
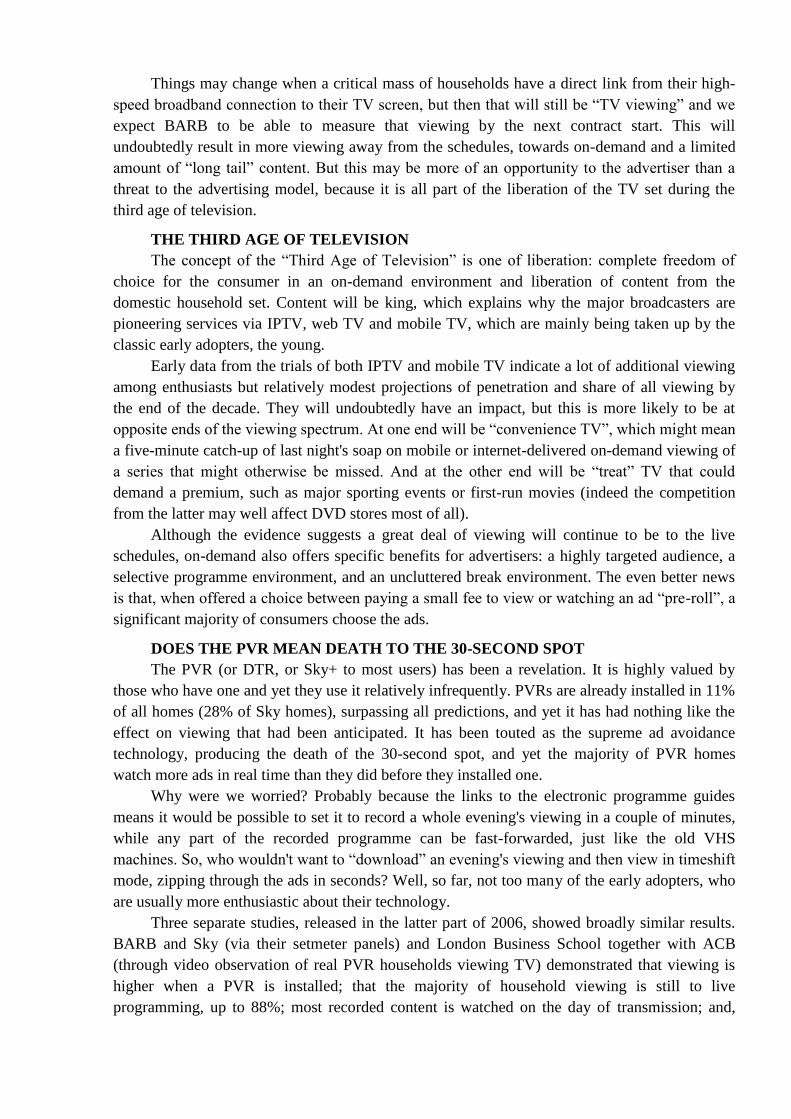
Three separate studies, released in the latter part of 2006, showed broadly similar results.
BARB and Sky (via their setmeter panels) and London Business School together with ACB
(through video observation of real PVR households viewing TV) demonstrated that viewing is
higher when a PVR is installed; that the majority of household viewing is still to live
programming, up to 88%; most recorded content is watched on the day of transmission; and,
even when they do watch in time-shift mode, between a third and half of the ads are still watched
in real time.
THE END OF ENDISM?
We have never doubted that television as a medium has a future. We are both old enough
to have witnessed the ―death of cinema‖ at least four times. In fact, as with cinema, the business
models that the new digital technologies are helping to create offer huge opportunities for
television, and for TV advertisers. Why?
There are many reasons for the positive potential of these new business models: increased
viewing opportunities; better targeting (including addressable advertising, already a reality in the
US); additional revenue streams or an efficient response mechanism via online (Google is
encouraging its clients to use TV as it boosts branded search efficiencies). We believe the future
of television couldn't be more exciting for viewers and brands. Its proven strengths aren't going
to go away but they will be enhanced by TV's controllability, interactivity, portability and
enhanced creativity. There are no ends in sight, just new beginnings.
It is especially so with a view of the current economic turmoil. In the latest economic
recession (2008-2009) a lot of advertisers cut their advertising investment in traditional media
(print, radio, TV, outdoor and transport), but TV budgets went through the biggest reduction.
THE REAL CONSUMER EXPERIENCE OF WATCHING TELEVISION
Many of the reasons for television's effectiveness could be seen in the footage from our
recent Engagement Study (see ―Details of Research‖). We saw just how TV viewers relate to the
ads, discuss them, sing along to them and share the experience with their housemates, friends and
family. It reinforced the importance of TV's role in creating brand emotions and associations in
the memory, both implicit and explicit. In short, it showed us why TV advertising works so
effectively.
Engagement can be Identified through a Wide Range of Behaviours
When we took on this project we worried at the prospect of lots of footage of people sitting
stock still, hopefully looking at the screen, but otherwise not doing much. How naïve we were!
When the respondents were sitting down watching the ads, around two-thirds (68%) recorded
some observable ad-related behaviour, according to ACB's team of professional ethnographers.
What's more, positive behaviours outnumbered negative by almost two to one (43% compared to
25%).
The range of behaviours was fascinating. Music is important – a cue for viewers to sing
along, whistle, clap and even dance – which they did on many occasions. People will stop the
PVR and play back an ad in real time. They laugh out loud, openly express wonder at the
creative execution, or refer the creative to things that are important in their daily lives (which we
call self-referencing). They mimic the voice-overs affectionately and regularly play ―guess the
ad‖ games. They can also shout at the telly, roll their eyes and disparage the ad to each other.
Just not nearly so often.
Engagement is not the Same as Attention
Although engagement is more likely to occur when attention is more focused on the TV,
there were numerous examples of high engagement springing from a very low-attention base.
People would interrupt deep conversation for a shared favourite and mimic an ad even when they
had their backs to the screen. We recorded many examples of strong engagement occurring even
when people were in a different room.
The main driver of attention is concurrent behaviours, so it is not surprising that
engagement is higher when there are few distracting activities. However, we need to look closer
at the types of activity being conducted; there are many common activities that are ―heads-in
TV‖ activities – where the activity is created around the TV set (eating and drinking, exercise,
some forms of housework) where engagement is often higher than it is when viewing is the sole
activity.
The Power of the Shared Experience
In this era of the importance of word of mouth and the power of the viral message, it is
reassuring to know that TV offers the most viral medium of them all – where ads are often
discussed and shared with each other in the same physical space. It is something unique to
television, and part of the power of the medium to get advertisers' messages out there.
We saw lots of examples of people discussing the ads, the brands, previous experience of
the products and the people in the ads. They love to share the humour, often taking ―ownership‖
of favourite ads and pointing them out whenever they watch with family or friends. It is a
powerful characteristic of the medium.
Perhaps that is why the optimum number of people in a room to create engagement is two.
It gives people the opportunity to share their experiences of the ads, but not so many as to be
distracting. The good news is that the majority of TV viewing (around 70%) in the UK is shared
viewing, and it appears to be growing as more viewing comes back to the main set (where most
of the new TV technology sits).
The Importance of Emotion in Advertising
When we classified the ads by their primary content factors (affective, cognitive or
sensory) it was the affective (i.e. emotional) ads that performed by far the best in terms of eyes
on screen or positive engagement behaviour. In particular, ads that elicited nostalgia, humour,
excitement or personal identification (via self-referencing) seemed to do well. Interestingly, the
second most positive response was seen for highly cognitive ads – the opposite end of the
spectrum – suggesting ads should not try to mix styles – it should either be highly emotive or
information-packed, but not both. Worryingly, more than 20% of ads could not be classified as
strongly cognitive, affective or sensory, which made us wonder why they had been made.
Needless to say, these ads performed particularly poorly in our analysis.
When we tested the 20 ads in the quantitative stages of this study, we found that the
strongly emotional or affective ads performed far better than the informational ones, and even
better against ads that attempted to mix emotion and information too much. These ads seemed to
work more intensely at an implicit level, which is not really covered by many research
methodologies. Emotional ads seemed to work particularly well against ad liking, which we
found to be the most important metric of them all. All of this supports the recent IPA findings,
following meta-analysis of more than 800 IPA Effectiveness Awards entries, that showed
campaigns that aim to strike an emotional connection with consumers performed much better
than those that attempt to impart information about the brand.
DETAILS OF RESEARCH
Our research partners (ACB) installed video cameras within the TV sets of 22 households,
totaling 74 individuals. They represented a range of demographics, household types and
technographics. The only way in which our sample differed significantly from the population at
large was that half of them owned a PVR, which meant a higher than average number of them
also had digital multi-channel TV services such as Sky, Virgin or Freeview. This was to ―future-
proof‖ the research against emerging trends in programme access as well as allowing us to
thoroughly test the probability that PVR ownership would dramatically impact on live TV spot
audiences.
We monitored their viewing for six weeks and took samples of viewing (to commercial
breaks only) after two weeks, once their viewing had settled. Altogether, we had four hours of
viewing to commercial breaks for each household, giving us a data set of almost 15,000
commercial exposures. Each of these exposures was coded for behaviours as well as commercial
content and viewing context factors – a total of 170 different codes for each commercial
exposure.
This was followed by a lab-based Memory Study, where we tested the impact of six test
ads in different attention contexts – full attention, no attention and two partial attention groups.
We attempted to measure implicit as well as explicit memory of ads, as well as test the approach
for the larger-scale quantitative survey.
Finally, we conducted a full quantitative survey among 3000 respondents, using an online
broadband sample (pre-recruited). This allowed us to measure viewing patterns and contexts, as
well as test the impact of a wider range (20) of different ad types to test some of our theories
from the earlier stages of the study.
Вопросы для размышления:
1. Which models of communications do you find relevant to describe marketing activities
using TV?
2. What kinds of products do you find best (and what less so) to be promoted via TV (including
digital TV)?
3. Which author statements of the article concerning TV as ad carrier do you agree (and
disagree) with?
4. What use in business practice do you see for the proposed arguments?
5. What are the means of conceptual integration of brand messages delivered via both traditional
and new media?
6. What opportunities for brand promotion are being opened for practitioners with the processes
of digitization, convergence of TV, Internet, other media?

Профиль «Стратегическое и корпоративное управление»3
1. Introduction
The board of directors is charged with protecting and promoting the interest of
shareholders who would find it costly to exercise control due to wide dispersion of stock
ownership. In the empirical literature, the monitoring effectiveness of the board is typically
viewed as a function of its independence, size, and leadership structure. While the first two
characteristics are relatively well developed in the theoretical literature, the debate within the
corporate governance framework as to whether the leadership structure, manifested through the
combination or the separation of the roles of the Chief Executive Officer (CEO) and the
Chairman of the Board (COB), leads to superior performance is based on contradictory
arguments presented in two different academic theories: the organizational theory and the agency
theory. Advocates of the organizational theory believe that the company can attain superior
performance only when the CEO exercises complete authority and his role is both unambiguous
and unchallenged. For example, Anderson and Anthony (1986), Donaldson (1985), and Barney
(1990) consider that it is better to have a combined role as this provides a ―single focal point for
company leadership‖, projecting a clear sense of direction. Cannella and Lubatkin (1993),
Donaldson and Davis (1991), Sridharan and Marcinko (1997), and Brickley et al. (1997) report a
positive link between a dual leadership structure and financial performance. Brickley et al.
(1997) also find a negative market reaction upon the announcement of splitting roles. In addition,
Simpson and Gleason (1999) show that the probability of financial distress for companies that
have combined roles is lower than for companies that have an independent COB.
On the other hand, proponents of the agency theory or the principal-agent theory developed
by Jensen and Meckling (1976) argue that the leadership structure of a company mitigates the
agency costs. For example, Fama and Jensen (1983) suggest that the separation of decision
management (CEO) and decision control (COB) facilitates the reduction of the agency costs and
leads to superior firm performance. Similar arguments are presented by Berle and Means (1933),
Berg and Smith (1978), Pratt and Zeckhauser (1985), Rechner and Dalton (1991), and Pi and
Timme (1993). Sridharan and St. John (1998) report an improvement in performance of
companies that changed their governance structure from duality to separation of roles, and Daily
and Dalton (1994) find that a combined role is associated with a higher probability of
bankruptcy. More recently, Malmendier and Tate (2004) report that the significant increase in
compensation observed after managers achieve superstar status via high profile awards from the
business press are due mainly to the CEOs who also hold the titles of President and Chairman of
the board, suggesting that CEOs opportunistically extract rents from companies. In a takeover
context, Bange and Mazzeo (2004) show that targets that combined the roles are more likely to
be taken over and the bidders are less likely to negotiate the publicly observed offers they make
with them. These results provide support to the proposition that the combination of the roles
exacerbates the agency conflicts. Other studies, however, show a weak relationship between firm
performance or managerial behavior and the board structure (e.g., Baliga et al., 1996; Brickley et
al., 1997). McWilliams and Sen (1997) and Coles and Hesterly (2000) suggest that other
governance mechanisms such as board independence counteract the negative aspect of the
combined roles.
3 Статья составлена по: Carapeto M., Lasfer M.A., Machera K. Does Duality Destroy Value? // Working Papers,
Cass Business School, City University, London, 2005.
In the US where most of this empirical work is undertaken, the structure of the board has
typically given the CEO a significant amount of power, thus favoring the organizational theory.
For example, Booth et al. (2002) and Core and Larcker (2002) find that about 76% of US
companies do not separate the roles of the CEO and the Chairman. When a US company
separates the two roles, this is usually perceived as a sign of weakness by investors. In contrast,
in the UK, following a series of corporate scandals in the beginning of the 90s, the Cadbury
Committee (1992) put forward a set of recommendations that include the separation of the roles
of the COB and the CEO and stated that there should be a clear division of responsibilities at the
head of the company which will ensure a balance of power and authority, such that no one
individual has unfettered powers of decision. Following these recommendations and those of
Greenbury (1995) and Hampel (1998), the London Stock Exchange (LSE) issued the Combined
Code (Committee on Corporate Governance, 1998) which states that there are two key tasks at
the top of every public company – the running of the board and the executive responsibility for
the running of the company‘s business. These recommendations are also endorsed by the largest
UK financial institutions such as the National Association of Pension Funds (NAPF), the
Pensions Investment Research Council (PIRC), and the Association of British Insurers (ABI),
who all put a lot of pressure on UK companies to split the roles or to explain in their annual
reports the reasons why they are not complying with the Combined Code.3 As a result, more
than 80% of UK firms had split the role in the late 1990s (e.g., Dahya et al., 2002; Lasfer, 2004).
The purpose of this paper is to assess whether the decision to split and to combine the roles
of CEO and COB creates value. We first document the market reaction upon this decision. We
then evaluate the performance of both types of firms in the pre- and post-event periods to
determine whether these decisions are driven by poor performance and whether they lead to a
mitigation of the agency conflicts. We use a sample of 119 firms that announced their intention
of splitting the roles of CEO and COB and a sample of 49 firms that announced their intention of
combining those roles over the period 1995 to 2003. Consistent with the agency theory, we find
positive (negative) and significant abnormal returns on the announcement of the decision to split
(combine) the roles. Our positive market reaction on the announcement of splitting roles is
consistent with Dahya et al. (1996) who find that splitting roles produces a major positive market
reaction but does not provide support to Dedman and Lin (2002), who report no significant
abnormal returns, probably due to the fact that they used a rather small number of firms where
the roles are split. The negative market reaction to the announcement of the decision to combine
the roles is not consistent with Dahya et al. (1996) who show that combining roles does not
generate a significant reaction. We also find that the announcement dates abnormal returns are
strongly related to various measures of agency costs.
However, despite this strong market reaction, we do not find strong evidence of
performance improvement in the post-event period. In particular, we show a significant increase
in the level of leverage for both types of firms (split, combine) and a decrease in the return on
equity and Q ratio two years after the split/duality decision. This evidence provides support to
Dahya et al. (1996), Florou (2001), Dedman (2000), Franks et al. (2001), and Weir et al. (2002)
who report weak evidence of performance improvement after the decision to split the roles. Weir
and Laing (2001) support that duality is actually associated with good performance.
Finally, we assess the extent to which this decision, particularly the split of the roles, is
driven by poor performance, and thus shareholder pressure. We find that firms that split the roles
are not necessarily poor performers in the pre-announcement period. These results are not
consistent with Franks et al. (2001) and Dedman (2003) who find a positive association between
poor performance and forced management turnover, with many cases of splitting the roles of the
Chairman and the CEO. There is also no significant change in the performance of companies that
combined the roles.
Overall, our results indicate that, in contrast to the market‘s expectations, the split of the
roles of the CEO and the COB is likely to lead to superior performance, suggesting that this
decision is likely to be marginal. It doesn‘t appear to create more conflicts of interests and delay
in decision-making rather than resolve the agency conflicts. The rest of the paper is organized as
follows. Section 2 presents the data and methodology. Section 3 discusses the results, and
Section 4 concludes.
2. Data and Methodology
We use the Lexis-Nexis database as our main datasource. We search the company news,
namely ―Company News Feed‖ (formerly ―Regulatory News Service‖) for any announcements
on board change. We then focus on companies that separated or combined the roles of CEO and
COB over the period 1995-2003.
The initial dataset consists of 250 corporate governance changes from April 1995 to
February 2003. The event is taken as the date when the company made the announcement in the
Company News Feed about the split or the combination of the two roles. We first identified 71
firms that combined the roles and 179 firms that separated the roles of the COB and the CEO.
However, for the stock prices analysis the actual dataset used was reduced to 168 because in
each of the remaining 82 cases several problems in their share prices were detected. Specifically,
55 of the stocks were fairly illiquid while in the case of the other 27 firms the relevant data was
not available or the share price appeared to be constant.
We use the standard event study methodology to assess the market reaction to the
announcement of a dual or split of the roles. We have two distinct periods, an 81-day event
period centered on the announcement day and a 200-day estimation period prior to the beginning
of the event period. We use the market model to obtain the abnormal returns, the difference
between the actual returns and the expected returns, with the benchmark given by the FTSE All
Share Index. Daily returns are computed as the percentage price (or index) changes in two
consecutive trading days. Closing share price and FTSE-All Share index level data for 282
trading days surrounding the announcement dates for the relevant companies (241 days before,
the announcement day, and 40 days after) were obtained from Datastream (Thomson Financial).
The main aim of an event study is to capture the effects of the announcement on the share
price around the days of the announcement. However, there is a problem when companies
announce their decision to split or combine the roles at the same time as other announcements,
such as final results or corporate restructuring. We refer to these confounding events as hybrid
announcements, i.e., cases where the effect of each separate announcement cannot be measured
in isolation in a precise way. We overcome this problem by examining companies with hybrid
announcements separately. We divide the sample into four portfolios. The first portfolio includes
74 companies that solely announced that they planned to separate the roles of the CEO and COB.
The second portfolio is composed of 45 observations where the companies made a split hybrid
announcement. The third portfolio consists of 28 companies that announced solely the
combination of the two roles. Finally, the fourth portfolio includes 21 companies that made a
hybrid announcement including their intention to combine the two positions. In addition, we split
the hybrid announcements into positive and negative tone by assessing whether the additional
news not related to the decision to split/combine the roles conveys positive or negative
information to the market. Table 14 show the classification used according to the nature and tone
of the additional news. Panel A (Panel B) presents the nature of the other announcement for the
good (bad) news sub-sample.
We then use ordinary least squares regressions to explain the cross-sectional variation in
abnormal returns. We test the hypothesis that the market reaction will be stronger for companies
with high potential agency conflicts. Finally, we compare the performance of our firms in the
pre- and post-announcement periods to assess whether the decision to split/combine the roles is
driven by poor performance and results in a change in performance in the post-event period.
3. Results
3.1. Event study
We start by reporting some descriptive statistics of the abnormal returns observed for the
two samples of companies with opposite announcements, i.e., combination of roles versus
separation of roles.
Table 2, Panel A, shows the mean and the median of the 3-day abnormal returns centered
on the announcement day for the firms where we observed a change in the top management. We
can see that when firms change from a dual role to a split role, the market reacts significantly
positively increasing by an average of 1.3%. However, when companies decide to choose duality
the abnormal returns are negative and significant (mean abnormal return of –2.6%). The
respective medians, not reported in the table, are 0.30% for split and -1.73% for combine. The
test statistics for the significance of means are statistically significant, suggesting that the market
prefers companies to split the roles of the CEO and COB on the expectations that such a decision
will lead to a mitigation of the agency conflicts. In contrast, the combination of the roles is
expected to result in an exacerbation of the agency conflicts.
Table 2, Panel B, presents the results of the constructed portfolios. The single
announcements result in positive abnormal returns of 1.09% for the split and -1.46% for
combine. Interestingly, the hybrid announcements are economically and statistically larger than
the single announcements. In particular, the decision to split is greeted with positive abnormal
returns of 1.71%, ranging between 1.95% if the confounding news has a positive tone and 1.12%
if it has a negative tone. In contrast, the hybrid decision to combine roles results in negative
abnormal returns of -4.18%, ranging between -0.16% if the other news is positive and -9.55%
when the confounding news is negative. These results indicate that the announcement of a split
or a combination of the roles of the CEO and COB provides more information to the market than
any other news.
3.2. Determinants of abnormal returns
Table 3 reports five ordinary least squares models that assess the determinants of the
announcement date abnormal returns computed over the 2-day period [0, +1]. Models (1) – (3)
are computed for all types of announcements and Models (4) and (5) refer to split and combine
announcements, respectively. In Models (2)-(5) only the regressions with significant coefficients
4 Здесь и далее по тексту предполагается, что авторы статьи не ошибаются в вычислениях и
первичной интерпретации произведенных вычислений (считывании информации из
таблиц). В этом смысле, их дополнительный анализ не требуется, поэтому сами таблицы с
результатами вычислений здесь (в тексте статьи) не приводятся. Остальное: логика
построения исследования и выводы, основанные на первичной интерпретации табличного
материала, могут обсуждаться.

are presented. We expect the market to react more positively (negatively) to companies with high
agency costs on the announcement of the decision to split (combine) the roles of the CEO and
COB. We, therefore, test the hypothesis that the announcement date abnormal returns are a
function of the following proxy variables for the agency conflicts, board characteristics, and
information contained in the announcement, and discuss the results reported in Table 3:
Size: Firm size has an ambiguous effect on the scope for managerial entrenchment. Jensen
(1986) argues that larger companies are more likely to suffer from agency costs, which in turn
increases the desire for larger managerial ownership. However, because of the wealth constraint
problem, managers cannot hold large stakes in large firms. In addition, large firms might enjoy
economies of scale in monitoring by top management and by rating agencies, leading to a lower
managerial ownership (Himmelberg et al., 1999). Lehn et al. (2003) argue that since large firms
engage in a higher volume and greater diversity of activities, they are more likely to have more
demand for information relating to product markets, foreign markets, mergers and acquisitions,
and labor relations, than small firms. Thus, for large companies, the split of the roles of the CEO
and COB is likely to reflect the need for information rather than the mitigation of the agency
conflicts. We use the 2-year average log of firm book value of assets to measure size. The
coefficient of this variable is positive and significant indicating that the market expects large
companies that split the roles to mitigate their agency conflicts.
Profitability: We test the hypothesis that the higher the firm‘s profitability, the lower the
agency conflicts, the lower the abnormal returns, since it might be felt that there is no need for a
change. We use return on equity to measure profitability. This variable is not significant. The
results provide support to a number of previous studies who show that duality does not affect
company performance in the UK (e.g., Dahya et al., 1996; Laing & Weir, 1999; Dedman, 2000;
Franks et al., 2001; Florou, 2001; Weir et al., 2002).
Growth opportunities: Board composition is likely to be affected by the firm‘s growth
opportunities. Smith and Watts (1992) report that the cost of monitoring managers is positively
related to a firm‘s growth opportunities, suggesting that high growth firms are more likely to
split the roles of the CEO and the COB and that the market reaction to the decision to split the
roles will be higher for high growth firms. In contrast, Lehn et al. (2003) argue that, since high
growth firms operate in volatile environments, they require board structures that facilitate rapid
decision-making and redeployment of assets, and that the high information asymmetry of high
growth firms will impair the ability of outside directors to fulfill their advisory role.
These arguments suggest that the market reaction to the announcement of the split of roles
will be lower for high growth firms. We test these two contradictory arguments using Q ratio,
computed as the enterprise value (sum of market capitalization plus long and short-term debt)
over the book value of total assets, as a measure of growth opportunities. The coefficient of this
variable is positive and significant in Model (1) but not significant in Model (2).
Leverage: The impact of leverage on the scope for moral hazard is also ambiguous. Harris
and Raviv (1988) and Stulz (1988) argue that managers may tend to increase leverage in order to
inflate the voting power of their shareholdings, and reduce the discipline of the market for
corporate control.
These arguments suggest that companies with high debt have high agency costs and, as a
result, the announcement date abnormal returns will be negatively related to the level of
leverage. In contrast, Fama (1980) and Jensen (1986) argue that, since managers may tend to
protect their under-diversified wealth, including human capital, and reduce the pressures to pay
out a large amount of cash, they may limit the use of debt. When debt is high the agency
conflicts are mitigated as debt holders are likely to monitor through their right to demand
information.
These arguments imply a negative association between leverage and the announcement
date abnormal returns. We define leverage as the 2-year average ratio of long-term debt over
book value of assets, to assess the monitoring role of debt holders.
The results indicate that the coefficient of leverage is positive and significant, suggesting
that the higher the leverage, the more likely it is that the market would like to see a change of
some kind, either moving into duality or from it. Our results are consistent with Franks et al.
(2001) who report a strong association between board turnover and poor performance in the UK,
particularly for companies with high leverage.
Executive directors: As implied in previous studies (e.g., Fama & Jensen, 1983; Jensen,
1993; Hermalin & Weisbach, 1991, 1998), managers are unlikely to prefer nonexecutive
directors on the board because their function is to exercise potential decision control. In addition,
Jensen (1993) and Hermalin and Weisbach (1991) argue that CEOs often end up controlling the
composition of the board and lessening its monitoring role, by, for example, being themselves
chairmen. Therefore, under the agency framework, the monitoring power of non-executive
directors is enhanced if the roles of the CEO and the COB are split.
We, thus, expect a negative relationship between the proportion of executive directors on
the board and the market reaction on the announcement date. The results provided in Table 3 are
consistent with these arguments as the coefficient of the executive directors variable is negative
and significant in models (3) and (4), but not in model (1) when all the explanatory variables are
taken into account.
Split announcement: Brickley et al. (1997) show a negative market reaction upon the
announcement of splitting roles. Dedman and Lin (2002) find no evidence of significant
abnormal returns upon the announcement of splitting roles in the post-Cadbury period. We use a
dummy variable equal to 1 if the announcement was a split and 0 otherwise. We expect this
dummy variable to be positively related to the announcement date abnormal returns to indicate a
negative reaction for combining roles and a positive reaction for splitting roles. As expected and
consistent with the results provided in Table 2, this variable is positive and significant.
Independence of COB: Splitting the roles of CEO and COB is likely to have a negative
impact when the COB remains executive. Conversely, combining the roles when the COB was
already an executive might produce a negative reaction. A dummy variable with a value of 1 if
the announcement was a split and the COB remained executive and 0 otherwise has a significant
negative impact in the abnormal returns, as expected. In addition, a second dummy variable with
a value of 1 if the announcement was a combination and the COB was an executive before and 0
otherwise is found to have a significant negative impact as well.
Hybrid announcements: Companies are more likely to make single announcements to
provide an unambiguous signal to the market about their strong determination to resolve their
agency conflicts. In contrast, hybrid announcements are more likely to have a negative impact, as
they are typically associated with either unforeseen events or an attempt to confuse investors. We
use a dummy variable equal to 1 if the announcement was hybrid and 0 otherwise. The
coefficient of this variable is negative and significant. Surprisingly, the tone of the other
announcement does not seem to affect the value of the abnormal returns.
Resignation, Retirement, and health problems: These cases are likely to trigger the need
for duality, at least temporarily, which has a negative impact on abnormal returns. This is
particularly true in the case of resignation, where most likely there might have been some
internal ‗bad blood‘ present. Dedman (2003) in fact find that non-routine departure of the CEO is
more likely when the CEO and the COB are two separate people. All coefficients associated with
dummy variables that take the value of 1 when one of these reasons is cited and 0 otherwise are
negative, as predicted, though only significant for split role announcements in the case of health
problems. Dahya et al. (1998) and Dedman (2000) argue that in the case of retirement there is a
move towards splitting the roles, and so a positive effect. Alternatively, retirement could hint
some new (good) blood coming into the firm, and so a dummy with a value of 1 in this case and
0 otherwise has a positive and significant coefficient as expected.
Temporary change: This statement is expected to have a negative impact, since temporary
changes are typically associated with cases of a move towards duality, normally as a result of
unforeseen circumstances. Statements that refer to a sooner or later change in the top
management are more likely to be associated with firms that have currently a combined role of
the CEO and COB, and so they should actually produce positive, though not necessarily
significant, abnormal returns. The coefficients of dummy variables with a value of 1 in these
latter cases and 0 otherwise are not significant (i.e., the statements have no credibility attached to
them), but significantly negative in the first case.
3.3. Performance
We test the hypothesis that the decision to split/combine the roles of the CEO and COB
alters the performance of the firm in the post-announcement period. Table 4 shows some
financial profiles for all our subsamples of firms. Panel A (Panel B) reports the results for
companies that split (combine) the roles. Panel A-1 shows a comparison of the profitability
measure, ROE. The results indicate that in general there is some statistical change in the median
level of performance in the pre- and post-announcement periods, with hybrid split
announcements with negative tone displaying the biggest decrease in ROE in the
postannouncement period. The analysis of the mean ROEs indicates that the profitability has
actually declined in the post-event period, suggesting that the split of the roles has not mitigated
the agency conflicts and may have created delays in decision-making. However, these results are
not significant at conventional levels. Our results are consistent with Laing and Weir (1999),
Dedman (2000), Franks et al. (2001), Florou (2001), and Weir et al. (2002), who find little
evidence that the board characteristics recommended by Cadbury (1992) have indeed lead to a
better performance.
It is interesting to note that the median ROEs are all positive in the pre-announcement
period, implying that the decision to split the roles of the CEO and COB is not driven by
underperformance. Our results do not reject the association between duality and good
performance put forward by Brickley et al. (1997) and Weir and Laing (2001). Panel A-2 reports
the results of the Q-ratio. The results show a clear indication that Q decreased significantly in the
post-announcement period, except in the case of hybrid split announcements with positive tone.
For example, for the sample as a whole, the median Q decreased from 112.1 in t-3 to 86.4 in t+3.
For companies that made hybrid announcements with negative tone, the median Q decreased
from 140.2 to 78.7 over the same period. To the extent to which Q is a proxy for growth
opportunities, the results indicate that the decision to split the roles signals the transition from
high growth into maturity. These results are not consistent with Lasfer (2004) who reports using
a large sample of UK companies that boards become more independent with the roles of the
CEO and COB split as the firm‘s growth opportunities increase.

Table 4, Panel A-3 reports that in general leverage increased in the post-event period. For
example, the median leverage increased from 15.5% in t-3 to 18.9% in t+3 for the sample as a
whole. Similarly, the median leverage of companies that made hybrid announcements with
negative tone increased from 14.9% to 18.4% over the same period, though not significant at
conventional levels. This evidence is consistent with Dahya et al. (1996), who find the same
pattern for events in the pre-Cadbury period.
The results for companies that combined the roles reported in Panel B are relatively similar
to Panel A. The level of underperformance is much clearer than Panel A-1. For example, in
Panel B-1, the mean ROE for the sample as a whole decreased from 28.4% in t-1 to -453.6% in
t+1. These results may however, suffer from small sample bias. An extended dataset will allow
us to make consistent comparisons.
4. Conclusion
In this paper we test two conflicting corporate governance theories, the agency theory and
the organizational theory relating to the decision to split the roles of the CEO and COB.
According to the agency theory, announcements of separation of the roles of the CEO and COB
should be seen as good news by the market participants, whereas duality should produce a
negative market reaction. Following the organizational theory, we should expect exactly the
opposite reaction, positive for duality and negative for separation. Our results provide strong
support for the agency theory, as the announcement date abnormal returns are positive (negative)
when companies decide to split (combine) the roles of the CEO and COB. This is valid for both
single and hybrid announcements. We also find that the announcement of the decision to
split/combine the roles displays more information content than the other hybrid announcements.
The implications of our study are two-fold. Firstly, investors perceive the implementation
of Cadbury (1992) as a positive event, given that their reactions to corporate governance
announcements follow the agency theory, whose rationale was borrowed by the Combined Code.
Secondly, despite the implementation of the code, the performance of the companies announcing
different governance changes in the post-Cadbury period is i) not different across the two types
of announcement, and ii) not different from the pre-Cadbury period, which was studied by Dahya
et al. (1996).
We also find that the announcement date abnormal returns are strongly related to various
measures of agency costs and to other reasons cited for the change to a dual role of the CEO and
COB, including issues such as resignation, health problems, and retirement of the person in one
of the top jobs. These are in most cases unforeseen circumstances that warrant fast action,
namely the temporary appointment of the person in the other top job to assume in addition the
responsibility of the vacant position. Given the pressure from the Combined Code to adopt
separate roles for the CEO and COB, many firms which are not in compliance with the rules tend
to announce that the separation will happen ‗in the near (or far) future‘, without a definite
calendar in place, thus trying to support their share price. The market appears to distinguish
between companies that are ―serious‖ about the split of the roles.
Вопросы для размышления:
1. Изучению какой основной проблемы посвящена статья, и какова роль настоящего
исследования?
2. Насколько корректна приведенная методология исследования, каковы границы ее
применимости в изучении данной проблемы?

3. Согласны ли вы с выводами и объяснением полученных результатов?
4. Как эта проблема выглядит в российской действительности?
5. Как бы вы построили исследование этой проблемы в России? Какие гипотезы можно
сформулировать в этой области?
Профиль «Управление проектами: проектный анализ, инвестиции,
технологии реализации»5
Project management has come to play a central role in the management of organizations in
almost all fields of human activity. Over the last decade, many organizations have implemented
one or more Project Management Offices (PMOs) as part of organizational project management
attributing a variety of both operational and strategic roles to their PMOs (Dai & Wells, 2004).
While PMOs are now a prominent feature of organizational project management, the underlying
logic that leads to their implementation or renewal is still not understood. The results of a survey
of 500 PMOs documented the great variety and lack of consensus on the value of PMOs, the
structure of PMOs and the functions included in their mandates (Hobbs & Aubry, 2007).
Many consultants and some researchers have written on PMOs in recent years. The focus
of the vast majority of this work has been on identifying the characteristics of PMOs and a
limited number of variables that would drive the choice of configurations of new or existing
PMOs. The implicit underlying assumptions in the current literature are that there are a limited
number of variations of PMOs and that PMOs are relatively stable structural entities.
At least three independent surveys have shown that the average age of PMOs is
approximately two years (Hobbs & Aubry, 2007; Interthink, 2002; Stanleigh, 2005). This has not
changed in recent years. The authors know of no research results that are inconsistent with these
observations. PMOs are, therefore, often not stable structures but temporary arrangements with a
rather short life expectancy.
The 17 case studies conducted in this research illustrate the temporary nature of PMOs.
This case study work also revealed that significant changes in PMOs can be associated with the
organization's internal or external environment. The case study results indicate that focusing on
the organizational change process surrounding the implementation or the transformation of a
PMO, rather than focusing on the characteristics of the PMO as a static organizational entity can
be a fruitful approach.
The pertinence of this process approach to better understand PMOs has been validated
recently during executive workshops that have been held in Europe, USA, Australia and Canada.
The present investigation employs a rather broad definition of the PMO in order to capture
the variety of form and function (Project Management Institute, 2008). It highlights that PMOs
are organizational entities and that their mandates vary significantly from one organization to the
next. However, the present study makes a distinction between the multi-project PMO and the
single-project PMO or ―project office‖, which has responsibility for the management of one large
project. The scope of the present investigation includes only PMOs with mandates that cover
many projects or ―multi-project PMOs‖.
For the purposes of this investigation, it is not necessary that the organizational unity be
called a PMO.
In the professional literature all texts deal principally with three themes: the justification of
the PMO's existence, its roles and functions, and steps for its implementation.
The descriptions of PMOs in the literature are often summarized in typologies comprised
of a small number of models. The most common types of PMOs described in the literature
proposed three or four models. The Gartner Research Group's 2000 study (Kendall & Rollins,
5 Статья составлена по: Aubury M., Muller R., Hobbs B., Blomquist T. Project management offices in transition.
International Journal of project management. 28 (2010). pp. 766-778.
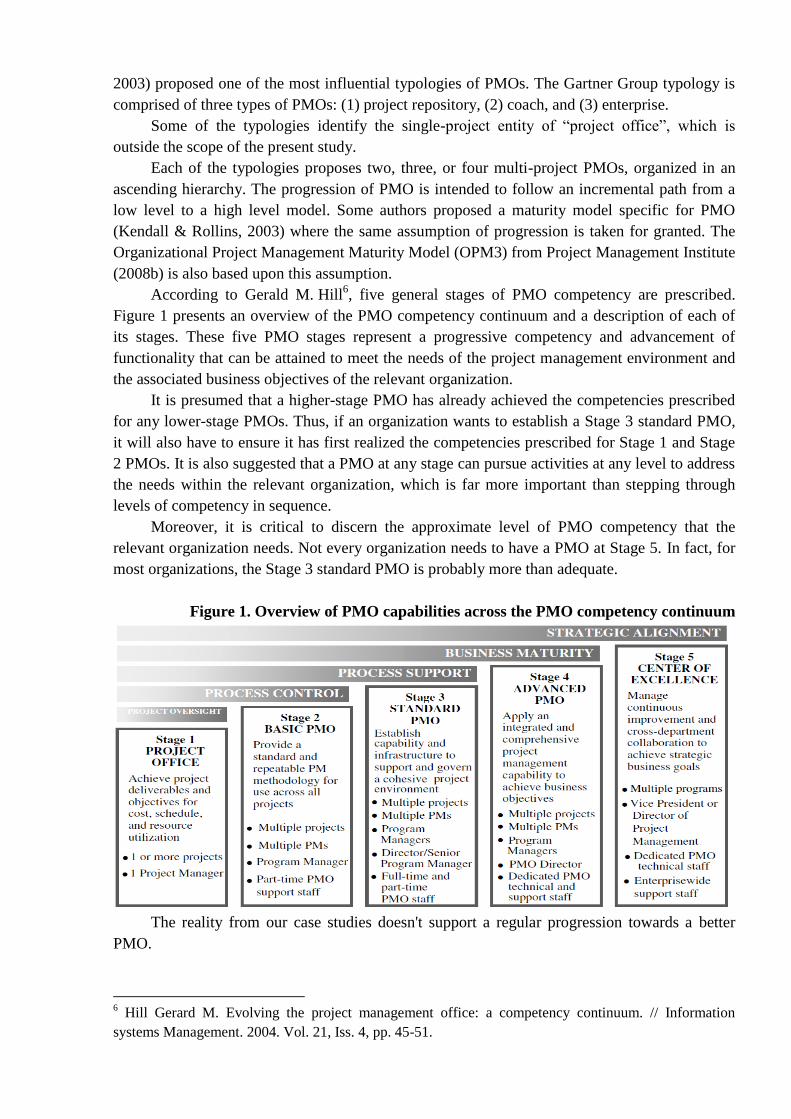
2003) proposed one of the most influential typologies of PMOs. The Gartner Group typology is
comprised of three types of PMOs: (1) project repository, (2) coach, and (3) enterprise.
Some of the typologies identify the single-project entity of ―project office‖, which is
outside the scope of the present study.
Each of the typologies proposes two, three, or four multi-project PMOs, organized in an
ascending hierarchy. The progression of PMO is intended to follow an incremental path from a
low level to a high level model. Some authors proposed a maturity model specific for PMO
(Kendall & Rollins, 2003) where the same assumption of progression is taken for granted. The
Organizational Project Management Maturity Model (OPM3) from Project Management Institute
(2008b) is also based upon this assumption.
According to Gerald M. Hill6, five general stages of PMO competency are prescribed.
Figure 1 presents an overview of the PMO competency continuum and a description of each of
its stages. These five PMO stages represent a progressive competency and advancement of
functionality that can be attained to meet the needs of the project management environment and
the associated business objectives of the relevant organization.
It is presumed that a higher-stage PMO has already achieved the competencies prescribed
for any lower-stage PMOs. Thus, if an organization wants to establish a Stage 3 standard PMO,
it will also have to ensure it has first realized the competencies prescribed for Stage 1 and Stage
2 PMOs. It is also suggested that a PMO at any stage can pursue activities at any level to address
the needs within the relevant organization, which is far more important than stepping through
levels of competency in sequence.
Moreover, it is critical to discern the approximate level of PMO competency that the
relevant organization needs. Not every organization needs to have a PMO at Stage 5. In fact, for
most organizations, the Stage 3 standard PMO is probably more than adequate.
Figure 1. Overview of PMO capabilities across the PMO competency continuum
The reality from our case studies doesn't support a regular progression towards a better
PMO.
6 Hill Gerard M. Evolving the project management office: a competency continuum. // Information
systems Management. 2004. Vol. 21, Iss. 4, pp. 45-51.
Many of the interviewees pointed out the danger that a PMO could end up being one more
bureaucratic element incurring more disadvantages than support for the projects and their
managers.
Developing a PMO that is truly needed counters this tendency, and this can be achieved by
performing a thorough stakeholder analysis before designing the office.
The aim of this research bears on organizational changes. In this section we present the
basic foundations used to conceptualize a PMO transformation followed by the conceptual
framework used in this research.
1. Open up the PMO's black box.
Organizational change mobilized great attention from scholars in economics since
Schumpeter recognized organizational innovations as part of the creative destruction process
(Schumpeter, 1950). Evolutionary theory has developed within the Schumpeterian tradition to
better understand technological change at the macro-level (long economic cycle), but attention
has also focused on the micro level, opening the black box of routines, learning and innovation
within organizations (Lévesque et al., 2001). A basic evolutionary model envisions the
organization as a collection of routines or stable bundles of activities. With time, variation occurs
within these routines with the result that any given set of routines evolves, whether intentionally
or not. A certain number of new routines are then adopted as temporarily permanent practices.
This simple variation–selection–retention repeats itself continuously (Miner, 1994).
The capacity of organizations to change their routines and structures has already been
identified as a source of competitiveness (Pettigrew, 2003). Conversely, within evolutionary
theory, inertia in large organizations has been identified as a constraint for organizations to
succeed in competitive environment.
The aim of this paper is to open up the PMO's black box when the change occurred. The
focus is therefore placed at the organization level exploring the process of PMO change.
Following Massini et al. (2002) ―the level of analysis in evolutionary economics is
normally the firm, within which tacit and explicit forms of knowledge interact and are selected
on the bases of choices made by individuals, according to some utility emerging from the
historical and economic context‖.
This gives the opportunity to observe routines that are changing in relation with their
context. PMO can be described as a structural entity embedding a bundle of routines using the
PMO descriptive model (see section below). Social dynamics within the PMO transformation
process complement the evolutionary framework as shown in the following section.
2. PMO transformation process.
Implementing a PMO or reconfiguring an existing PMO is an important organizational
change. This change is often part of a wider organizational reconfiguration. A methodology and
an interpretive framework are needed that can capture the dynamic complexity of organizational
change. The approach that has been adopted investigates the PMO embedded in its
organizational context. History and context are essential to the understanding of what is observed
at any one point in space and time in complex systems such as organizations (Engwall, 2003).
The theoretical foundations of the social innovation system framework take into account the
context in which such organizational innovations take place (Hughes, 1987). Social innovation
builds also on a bidirectional relation that conceives of organizational innovations as socially-
constructed and society-shaping (Bresnen et al., 2005). Organizational innovations are produced
by the interplay between actors in structures and the organization as a whole.
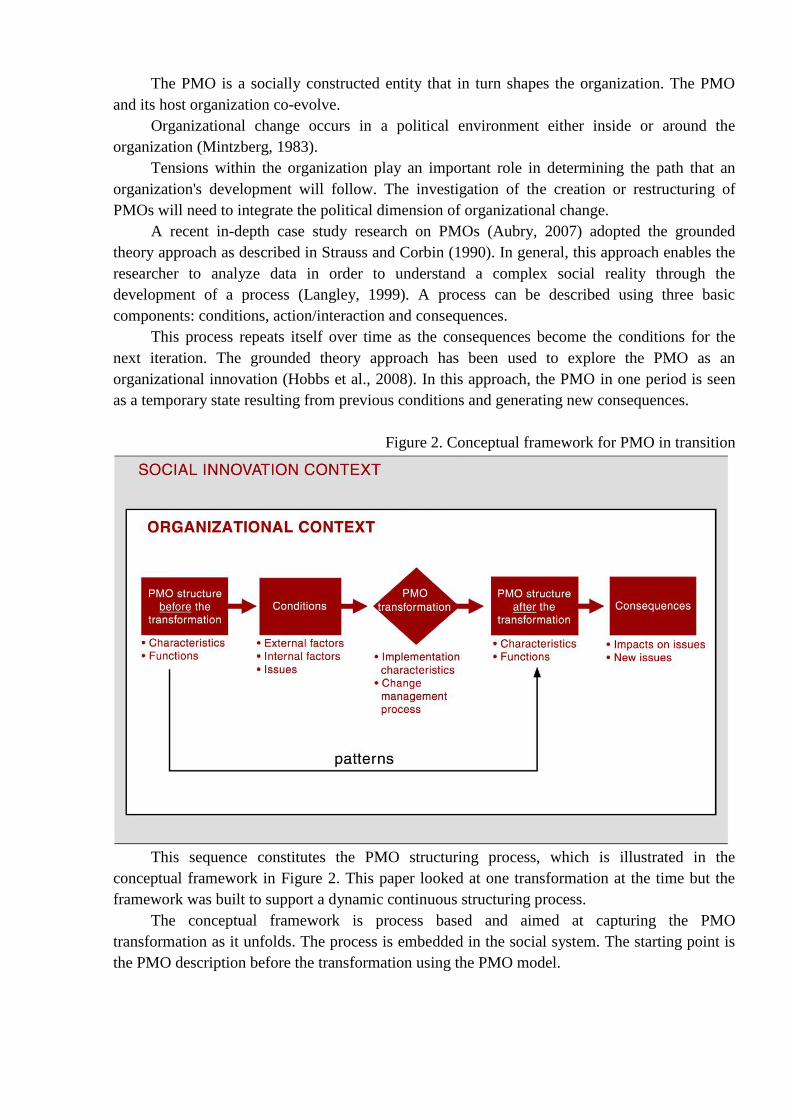
The PMO is a socially constructed entity that in turn shapes the organization. The PMO
and its host organization co-evolve.
Organizational change occurs in a political environment either inside or around the
organization (Mintzberg, 1983).
Tensions within the organization play an important role in determining the path that an
organization's development will follow. The investigation of the creation or restructuring of
PMOs will need to integrate the political dimension of organizational change.
A recent in-depth case study research on PMOs (Aubry, 2007) adopted the grounded
theory approach as described in Strauss and Corbin (1990). In general, this approach enables the
researcher to analyze data in order to understand a complex social reality through the
development of a process (Langley, 1999). A process can be described using three basic
components: conditions, action/interaction and consequences.
This process repeats itself over time as the consequences become the conditions for the
next iteration. The grounded theory approach has been used to explore the PMO as an
organizational innovation (Hobbs et al., 2008). In this approach, the PMO in one period is seen
as a temporary state resulting from previous conditions and generating new consequences.
Figure 2. Conceptual framework for PMO in transition
This sequence constitutes the PMO structuring process, which is illustrated in the
conceptual framework in Figure 2. This paper looked at one transformation at the time but the
framework was built to support a dynamic continuous structuring process.
The conceptual framework is process based and aimed at capturing the PMO
transformation as it unfolds. The process is embedded in the social system. The starting point is
the PMO description before the transformation using the PMO model.
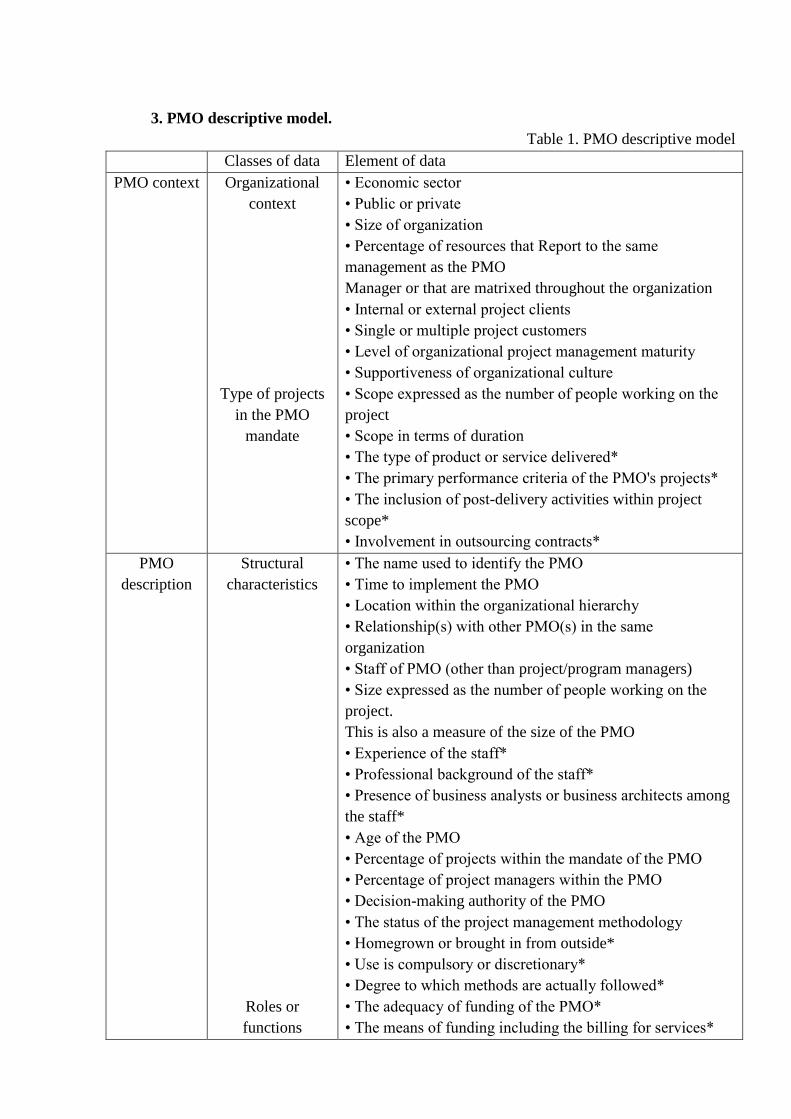
3. PMO descriptive model.
Table 1. PMO descriptive model
Classes of data Element of data
PMO context Organizational
context
Type of projects
in the PMO
mandate
• Economic sector
• Public or private
• Size of organization
• Percentage of resources that Report to the same
management as the PMO
Manager or that are matrixed throughout the organization
• Internal or external project clients
• Single or multiple project customers
• Level of organizational project management maturity
• Supportiveness of organizational culture
• Scope expressed as the number of people working on the
project
• Scope in terms of duration
• The type of product or service delivered*
• The primary performance criteria of the PMO's projects*
• The inclusion of post-delivery activities within project
scope*
• Involvement in outsourcing contracts*
PMO
description
Structural
characteristics
Roles or
functions
• The name used to identify the PMO
• Time to implement the PMO
• Location within the organizational hierarchy
• Relationship(s) with other PMO(s) in the same
organization
• Staff of PMO (other than project/program managers)
• Size expressed as the number of people working on the
project.
This is also a measure of the size of the PMO
• Experience of the staff*
• Professional background of the staff*
• Presence of business analysts or business architects among
the staff*
• Age of the PMO
• Percentage of projects within the mandate of the PMO
• Percentage of project managers within the PMO
• Decision-making authority of the PMO
• The status of the project management methodology
• Homegrown or brought in from outside*
• Use is compulsory or discretionary*
• Degree to which methods are actually followed*
• The adequacy of funding of the PMO*
• The means of funding including the billing for services*
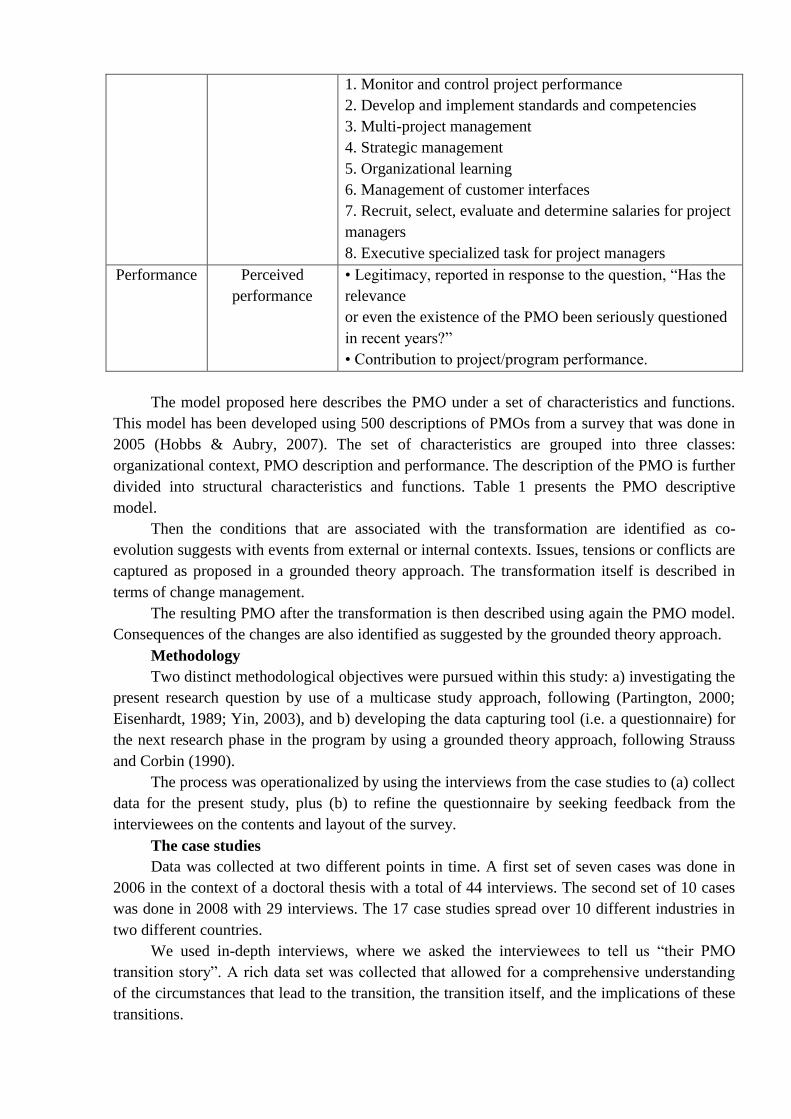
1. Monitor and control project performance
2. Develop and implement standards and competencies
3. Multi-project management
4. Strategic management
5. Organizational learning
6. Management of customer interfaces
7. Recruit, select, evaluate and determine salaries for project
managers
8. Executive specialized task for project managers
Performance Perceived
performance
• Legitimacy, reported in response to the question, ―Has the
relevance
or even the existence of the PMO been seriously questioned
in recent years?‖
• Contribution to project/program performance.
The model proposed here describes the PMO under a set of characteristics and functions.
This model has been developed using 500 descriptions of PMOs from a survey that was done in
2005 (Hobbs & Aubry, 2007). The set of characteristics are grouped into three classes:
organizational context, PMO description and performance. The description of the PMO is further
divided into structural characteristics and functions. Table 1 presents the PMO descriptive
model.
Then the conditions that are associated with the transformation are identified as co-
evolution suggests with events from external or internal contexts. Issues, tensions or conflicts are
captured as proposed in a grounded theory approach. The transformation itself is described in
terms of change management.
The resulting PMO after the transformation is then described using again the PMO model.
Consequences of the changes are also identified as suggested by the grounded theory approach.
Methodology
Two distinct methodological objectives were pursued within this study: a) investigating the
present research question by use of a multicase study approach, following (Partington, 2000;
Eisenhardt, 1989; Yin, 2003), and b) developing the data capturing tool (i.e. a questionnaire) for
the next research phase in the program by using a grounded theory approach, following Strauss
and Corbin (1990).
The process was operationalized by using the interviews from the case studies to (a) collect
data for the present study, plus (b) to refine the questionnaire by seeking feedback from the
interviewees on the contents and layout of the survey.
The case studies
Data was collected at two different points in time. A first set of seven cases was done in
2006 in the context of a doctoral thesis with a total of 44 interviews. The second set of 10 cases
was done in 2008 with 29 interviews. The 17 case studies spread over 10 different industries in
two different countries.
We used in-depth interviews, where we asked the interviewees to tell us ―their PMO
transition story‖. A rich data set was collected that allowed for a comprehensive understanding
of the circumstances that lead to the transition, the transition itself, and the implications of these
transitions.

We defined 35 factors as drivers of the transition. We used contents analysis in form of the
relative frequency of mentions of the different factors to identify their importance (Denzin &
Lincoln, 2000). Of the 35 factors, 15 were mentioned more frequently than the average of 6.9
mentions, 3 were at the level of average, and 16 were below the average.
In the final step the factors mentioned most often (that is, above average) were clustered by
their logical relationships, in order to identify the main clusters of factors in PMO transitions.
Empirical results
The empirical study aims at obtaining data that will then enable a process analysis. The
empirical study should provide data on PMOs transformations. When looking at the process side,
the focus is no longer on the description of each individual PMO, but rather on the
transformation from one PMO to the next. Therefore, the unit of analysis is the organizational
transformation around a reconfiguration of a PMO. The sample is made up of 17 ―organizational
transformations‖ of existing PMOs.
We offer the next typology of drivers. So far, we have presented the conceptual framework
for capturing the PMO transformation process based on a continuous cycle of conditions,
structure and consequences. Conditions act as drivers for a PMO transformation which in turn
contains within itself tensions that may be the ingredients for the next transformation. An
analysis of the 17 transformations revealed 35 different categories of drivers, which we clustered
under six groups of drivers. The six groups and the 35 drivers with their definitions are listed in
the Appendix. Figure 3 presents the typology of these drivers.
When looking in more detail at the conditions as drivers of change, not all of them have the
same degree of importance. In each case study, significant conditions for a PMO change have
been codified in a grounded theory approach, letting categories emerge from what people said.
Table 3 presents the most frequent drivers grouped in the six categories under two integrative
types: external and internal environments. Altogether, internal factors and issues are part of the
internal context specific at each organization.
Results show evidence of the prevalence of internal drivers.
Three factors may have led to an underestimation of the importance of external drivers.
First, we have selected events from the external environment that had an impact on the PMO.
The numbers reflect only a partial view of the global external environmental analysis.
Second, we observed that interviewees in higher management positions often linked external
events to a PMO transformation. For example, project managers generally focused on their
project and were unaware of the global external environment.
Third, an external event can have numerous impacts on the internal context of an
organization over a long period of time. Despite these qualifying remarks, it is clear that most
people interviewed attributed the changes in PMOs to conditions that are internal to the
organization.

Figure 3. A typology of drivers of PMO transformations
From Table 2 it can be seen that some drivers are more frequent than others. In the first
column, under the external context, only the industrial/market factor has been mentioned often.
In 13 cases out of 17, this factor played a role in the PMO transition. Most of the time, looking
internally to understand a PMO transition does not suffice. Some external change in the
industrial or market environment may have contributed to the PMO change decision. An
example of this is found in one of our cases from a telecommunication organization after the
dotcom bubble burst. The PMO was centralized with a strong control mandate over projects.
Table 2. Most frequent drivers from case studies
Drivers of change in PMO
External Internal
1 External
factors
2 Internal
Factors
3
Organizational
context issues
4 Project
management
process
issues
5 Human
relations
issues
6
Performance
Industrial/market
factors (13)
Reorganization
(11)
New CEO (11)
New PMO
Manager (10)
Client and
stakeholder
relations (11)
New strategy
(11)
Accountability
for
projects (10)
Control of
project
portfolios
(12)
Standardized
project
management
processes
(11)
PM Skills
development
(13)
Project
performance
(11)
In the second column, there are three factors under the internal factors. Global
reorganization, new CEO and new PMO manager altogether are the most important category of
internal drivers. They often happen together. When such events occur, there is no reason why the
PMO might be stable particularly when the rest of the organization is going through a global
reorganization. This is an important result from our case studies that calls into question the
stability paradigm for PMOs.

Looking at the third column, issues within the organizational context show that
relationships with clients and other stakeholders may lead to a PMO change. This factor refers to
the organizational politics in which the PMO is embedded. A PMO from one of our case studies
was almost completely forbidden to maintain relationship with the project clients. After a while,
this PMO was disconnected from the client reality and lost its legitimacy in the face of business
unit managers. A new business strategy could also be a factor contributing to a PMO change. As
projects are means to implement a business strategy (Morris & Jamieson, 2004), so are the
structure such as PMOs (Pettigrew, 2003). The last factor frequently mentioned is the
accountability for projects. PMOs might change to give more or less accountability to certain
stakeholders. One example is given in a banking organization when project managers where
moved from the central PMO to business unit PMOs in order to give the business unit managers
full accountability for project outcomes.
Looking now at issues related to project management process in the fourth column, we find
that the control over the project portfolio is the most frequently mentioned as an issue leading to
PMO change. The issues mentioned in our case studies refer specifically to the lack of legitimacy
for a PMO to make the selection of projects to be included in the portfolio.
Other factors could be identified as potential issues such as the allocation of resources
between projects. But they haven't been mentioned in our case studies. The second issue in this
category refers to the standardization or project management processes.
This issue could go in two directions: not enough standardization or too much. In either
case, it plays a role in PMO change.
In the fifth column, we can observe that the human side of the PMO is of great importance
in the transition when considering the category of human resources issues. Project manager skill
development is a frequent factor in our case studies. The lack of these skills could lead to a
change in the PMO. In our case studies, many interviewees highlight the major importance of
interrelationship management skills particularly when projects are done more and more in an
international context. Finally, in the last column, the project performance issue was mentioned
often as a factor for PMO change. Quite often, a PMO change is initiated after major project
failures or problems.
The feedback from participants confirmed not only the way the PMO transformation
process has been modeled but the relative importance of the drivers as well. Nevertheless, some
executives expressed some reserve regarding the word ―transformation‖.
They argue for an evolution instead of a transformation. The drivers may stay the same, but
it is acknowledged in the organization that the PMO will evolve and it is managed that way. In
such organizations, the change process is seen as an evolution. It is difficult to know whether the
organizational realities being described are different or whether the organization or national
culture may not accept that there are transformations in the same way that some cultures do not
recognize the existence of conflicts. The 17 qualitative case studies were all recognized as
transformations. However, there are certainly variations in the degree of change; they may vary
from evolutionary to radical and disruptive. The questionnaire currently in use captures
variations in the degree of change.
Conclusion
The analysis presented here makes several contributions to the study of organizations. It
confirms that the PMO is deeply embedded in its host organization, and that the two actively
take part in the transforming process. This result is in line with the research on the value of
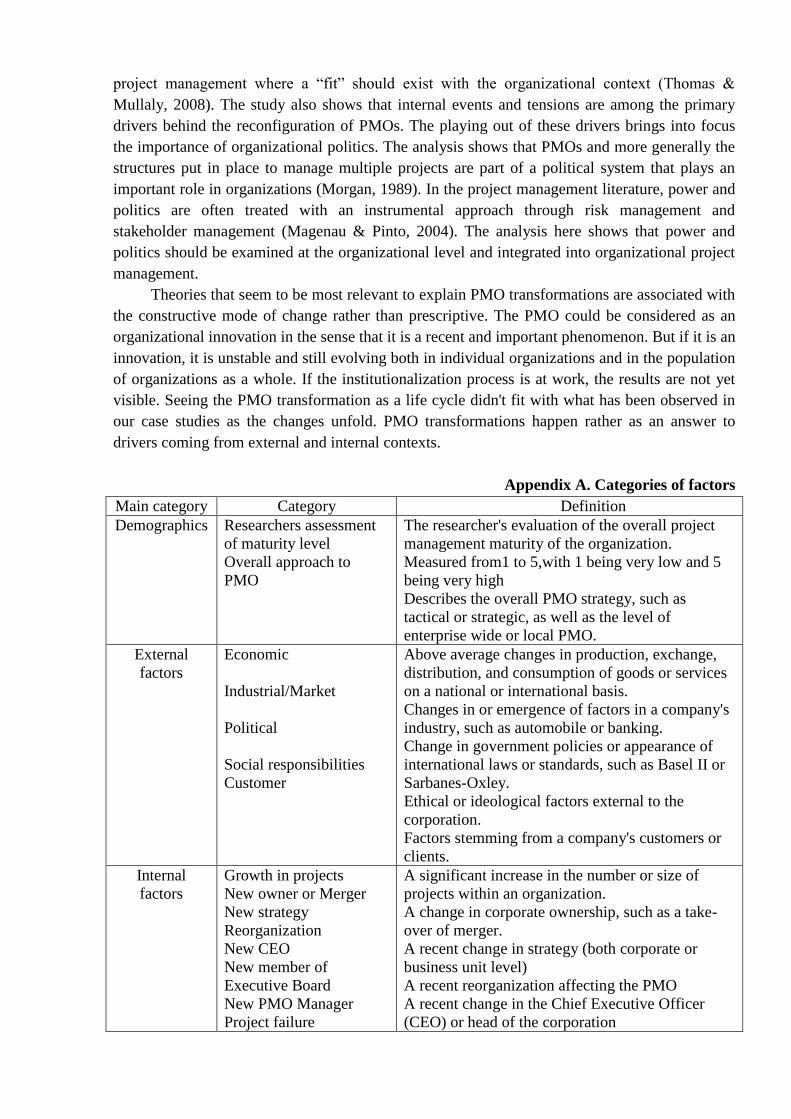
project management where a ―fit‖ should exist with the organizational context (Thomas &
Mullaly, 2008). The study also shows that internal events and tensions are among the primary
drivers behind the reconfiguration of PMOs. The playing out of these drivers brings into focus
the importance of organizational politics. The analysis shows that PMOs and more generally the
structures put in place to manage multiple projects are part of a political system that plays an
important role in organizations (Morgan, 1989). In the project management literature, power and
politics are often treated with an instrumental approach through risk management and
stakeholder management (Magenau & Pinto, 2004). The analysis here shows that power and
politics should be examined at the organizational level and integrated into organizational project
management.
Theories that seem to be most relevant to explain PMO transformations are associated with
the constructive mode of change rather than prescriptive. The PMO could be considered as an
organizational innovation in the sense that it is a recent and important phenomenon. But if it is an
innovation, it is unstable and still evolving both in individual organizations and in the population
of organizations as a whole. If the institutionalization process is at work, the results are not yet
visible. Seeing the PMO transformation as a life cycle didn't fit with what has been observed in
our case studies as the changes unfold. PMO transformations happen rather as an answer to
drivers coming from external and internal contexts.
Appendix A. Categories of factors
Main category Category Definition
Demographics Researchers assessment
of maturity level
Overall approach to
PMO
The researcher's evaluation of the overall project
management maturity of the organization.
Measured from1 to 5,with 1 being very low and 5
being very high
Describes the overall PMO strategy, such as
tactical or strategic, as well as the level of
enterprise wide or local PMO.
External
factors
Economic
Industrial/Market
Political
Social responsibilities
Customer
Above average changes in production, exchange,
distribution, and consumption of goods or services
on a national or international basis.
Changes in or emergence of factors in a company's
industry, such as automobile or banking.
Change in government policies or appearance of
international laws or standards, such as Basel II or
Sarbanes-Oxley.
Ethical or ideological factors external to the
corporation.
Factors stemming from a company's customers or
clients.
Internal
factors
Growth in projects
New owner or Merger
New strategy
Reorganization
New CEO
New member of
Executive Board
New PMO Manager
Project failure
A significant increase in the number or size of
projects within an organization.
A change in corporate ownership, such as a take-
over of merger.
A recent change in strategy (both corporate or
business unit level)
A recent reorganization affecting the PMO
A recent change in the Chief Executive Officer
(CEO) or head of the corporation

Complexity in projects
Internal competition
A change or joining of a new member of the board
of directors of the corporation
Changes or appointment of a new PMO manager
Change or constantly high failure rate in projects
Change in complexity levels of projects
Factors related to inter-organizational rivalry,
competition or other forms of out-performing other
parts of the organization
Context issues Political issues
Organizational
commitment for project
management
Client and stakeholder
relations
Project management
collaboration with line
organization
Accountability for
projects
Synergy among project
managers
Factors of organizational political nature
Factors of organizational commitment for project
management as a discipline
Factors related to the relationship with customers,
clients or other stakeholders of the firm
Factors related to the way line and matrix
management work together and interacts
Factors related to new accountabilities for projects
and their results
Factors related to changes in or intentions to
achieve synergies among and across PMOs
Process-issues Innovativeness
PMO costs
Agility
Standardized project
management process
Control of project
portfolio
Skill allocation
Maturity in project
management
Project alignment with
strategy
Factors related to changes in the way innovation is
used in the firm, or innovative ways of doing
business are pursued
Factors related to changes in real costs or
evaluation thereof
Factors related to the use of Agile/Scrum or other
new methodologies
Factors related to the application of standardized
processes and compliance with it
Factors related to the change in control of the
project portfolio
Factors related to the change in assigning skills to
projects
Factors related to the organizational maturity in
project management
Factors related to the alignment of projects with the
organization's strategy
Outcome
(performance)-
issues
Project performance
Business performance
HR perspective
PM skills development
Factors related to project deliveries and results
Factors related to the business performance of the
organization
Factors related to human resources and their
management
Factors related to the development of project
management skills within the organization.
Вопросы для размышления:
1. Опишите актуальные теоретико-методологические проблемы создания проектного
офиса (ПО) в компаниях?

2. В чем состоят ключевые отличия между подходами, влияющими на эволюцию (ПО) в
организации?
3. Какие существуют факторы эволюции ПО, и какие вы видите препятствия на пути
процесса его совершенствования? Проанализируйте результаты полученные автором.
4. Проанализируйте изменения зрелости организации по известным вам моделям зрелости
проектного менеджмента, в случае повышения уровня зрелости ПО, рассмотренного в
статье.

Профиль «Управление человеческими ресурсами»7
Characteristics of social networks are important to both men's and women's advancement
to higher hierarchical levels (Metz & Tharenou, 2001). However, specific elements of social
networks may relate differentially to career success of men and women. For instance, greater
success of men in gaining promotions has been attributed to their more effective use of networks
(Cannings & Montmarquette, 1991). Although Forrett and Dougherty (2001) found little
discrepancies in networking between men and women, other studies have suggested that there
are (still) important pitfalls that hinder women to use social networks effectively. These studies
pointed specifically at the exclusion of women from networks, especially when above the glass
ceiling (e.g. Davies Netzley, 1998; Lyness & Thompson, 2000). Within academia, the study of
Gersick et al. (2000) showed that when faculty members are interviewed about their networking,
the stories of women are about harm, whereas men tell about help. The results of these previous
studies emphasized the importance of examining gender differences in networking relationships,
because if women develop less effective network relationships, they may miss essential
ingredients important for career success (Baugh & Graen, 1997; Burke et al., 1995). Most
frequently, research into network activities focused on the use of informal networking. In the
present study, we will extend this focus by examining gender differences in:
(1) the engagement in formal networks;
(2) the use of informal network contacts to discuss work-related issues.
The distinction between formal and informal networks is relevant for this study because
engagement in formal networks may have different implications for organizational change than
the engagement in informal networks (McGuire, 2000). Since formal networks are public,
officially recognized within the organization and with identifiable memberships and explicit
structure, they will be more accessible for change policies to advance women's careers. For
instance, an employee who is excluded from a formal network can refer to company policy or
written job descriptions to argue that she or he has been treated unfairly. Employees who are
excluded from informal networks, in contrast, have little recourse because organizations do not
take responsibility for informal work ties (McGuire, 2000).
We will relate the engagement in both formal and informal networks of men and women to
career satisfaction. Generally, career success can be assumed to comprise objective or extrinsic
(e.g. pay) and subjective or intrinsic (e.g. career satisfaction) elements. The antecedents that lead
to objective career success are often quite different from those that lead to subjectively defined
success (Judge et al., 1995). In the present study, we will focus specifically on the subjective
elements of intrinsic career success and their relationship with formal and informal networking.
Career satisfaction refers to satisfaction with their present jobs and advancement potential and
effective networking is expected to be associated with positive career attitudes. We expect that
men engage more in networking and that men are able to use networking effectively, which will
show in the achievement of greater career satisfaction. In the next section, we will elaborate on
these expected gender differences and formulate some specific hypotheses.
The social network perspective
Central focus of the social networks perspective is the structure of social interactions and
how these structures enhance or constrain access to valued resources, e.g. career satisfaction
7 Статья составлена по: Van Emmerik I.J.H., Euwema M.С., Geschiere M., Schouten M.F.A.G. Networking your
way through the organization. Women in Management Review. 2006. 21, 1. pp. 54-66.
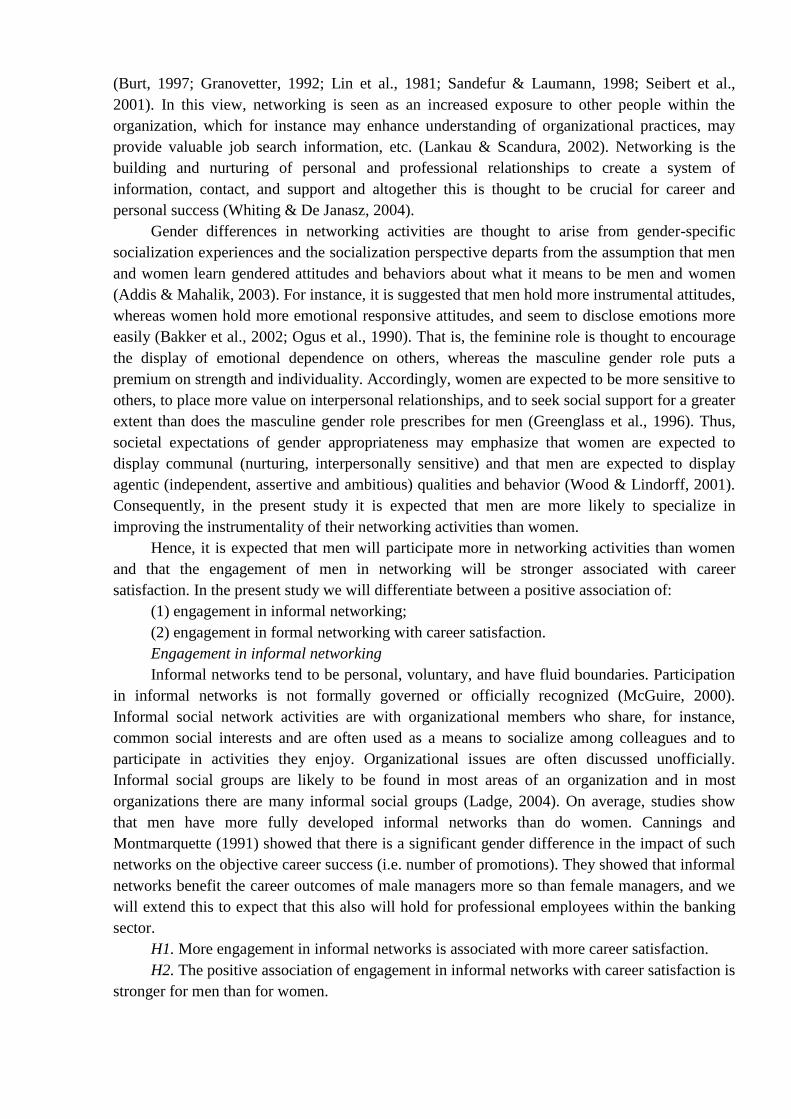
(Burt, 1997; Granovetter, 1992; Lin et al., 1981; Sandefur & Laumann, 1998; Seibert et al.,
2001). In this view, networking is seen as an increased exposure to other people within the
organization, which for instance may enhance understanding of organizational practices, may
provide valuable job search information, etc. (Lankau & Scandura, 2002). Networking is the
building and nurturing of personal and professional relationships to create a system of
information, contact, and support and altogether this is thought to be crucial for career and
personal success (Whiting & De Janasz, 2004).
Gender differences in networking activities are thought to arise from gender-specific
socialization experiences and the socialization perspective departs from the assumption that men
and women learn gendered attitudes and behaviors about what it means to be men and women
(Addis & Mahalik, 2003). For instance, it is suggested that men hold more instrumental attitudes,
whereas women hold more emotional responsive attitudes, and seem to disclose emotions more
easily (Bakker et al., 2002; Ogus et al., 1990). That is, the feminine role is thought to encourage
the display of emotional dependence on others, whereas the masculine gender role puts a
premium on strength and individuality. Accordingly, women are expected to be more sensitive to
others, to place more value on interpersonal relationships, and to seek social support for a greater
extent than does the masculine gender role prescribes for men (Greenglass et al., 1996). Thus,
societal expectations of gender appropriateness may emphasize that women are expected to
display communal (nurturing, interpersonally sensitive) and that men are expected to display
agentic (independent, assertive and ambitious) qualities and behavior (Wood & Lindorff, 2001).
Consequently, in the present study it is expected that men are more likely to specialize in
improving the instrumentality of their networking activities than women.
Hence, it is expected that men will participate more in networking activities than women
and that the engagement of men in networking will be stronger associated with career
satisfaction. In the present study we will differentiate between a positive association of:
(1) engagement in informal networking;
(2) engagement in formal networking with career satisfaction.
Engagement in informal networking
Informal networks tend to be personal, voluntary, and have fluid boundaries. Participation
in informal networks is not formally governed or officially recognized (McGuire, 2000).
Informal social network activities are with organizational members who share, for instance,
common social interests and are often used as a means to socialize among colleagues and to
participate in activities they enjoy. Organizational issues are often discussed unofficially.
Informal social groups are likely to be found in most areas of an organization and in most
organizations there are many informal social groups (Ladge, 2004). On average, studies show
that men have more fully developed informal networks than do women. Cannings and
Montmarquette (1991) showed that there is a significant gender difference in the impact of such
networks on the objective career success (i.e. number of promotions). They showed that informal
networks benefit the career outcomes of male managers more so than female managers, and we
will extend this to expect that this also will hold for professional employees within the banking
sector.
H1. More engagement in informal networks is associated with more career satisfaction.
H2. The positive association of engagement in informal networks with career satisfaction is
stronger for men than for women.
Engagement in formal networks
Formal networks or network groups are formally prescribed relationships among
functionally defined groups that exist for the purpose of accomplishing some organizational task
(Ibarra, 1993). Formal networks tend to be public, official, and have clear boundaries, they also
tend to have an identifiable membership, and explicit structure and are officially recognized by
employers (McGuire, 2000). In the banking organization that we studied, there are several
networks that assist employees in various ways, e.g. a network for young talent, or the diversity
network. They usually meet several times a year, and often include both times for socializing and
formal agendas and programs (e.g. providing career help or information about company
policies). The managerial women and men in the study of Burke et al. (1995) had interpersonal
networks of supportive individuals inside and outside of their organizations, with a considerable
range in the number of individuals in both networks, and there were more men than women on
both inside and outside networks, with a larger difference on the inside network.
Formal networks can be expected to be associated with increased career satisfaction because
they may increase the strength of relationship among their members. Network group members
will know more people, or know them better than before. Therefore, participation in formal
networks can be expected to provide its members with added information, mentoring, and
political support and this will be positively related to career satisfaction (Friedman et al., 1998).
H3. More engagement in formal networks is associated with more career satisfaction.
H4. The positive association of engagement in formal networks with career satisfaction is
stronger for men than for women.
Method
Population and sample
Data were collected within a Dutch bank, after a letter explaining the purpose of the study,
electronic questionnaires were sent to 691 employees (200 to men, women were oversampled by
sending them 491 questionnaires), from the middle and higher hierarchical levels. A total of 276
questionnaires were returned (response 40%). For the present study, after deleting respondents
with missing data on the network variables (because of the extensive questionnaire, the network
part was presented as optional), the information of a total of 260 employees (38%) was used: 180
female (69%) and 80 (31%) male employees.
Measures
Participation informal networks. The participation in formal networks was a count of the
participation in internal formal networks (i.e. the network of young employees, the diversity
network, and or specific networks within the bank), and participation in external formal
networks. Since we wanted to relate the participation in formal networks with career satisfaction
of both women and men, we excluded the participation in women's networks, because these
women-only networks are expected to be less powerful than mixed formal networks (Ehrich,
1994).
Participation in informal networking activities. The participation in informal networking
activities was asked with four items concerning discussing work-related issues with:
(1) colleagues,
(2) a supervisor,
(3) a coach,
(4) other people.
The items were rated on a five-point Likert-type scale with "1" (almost) never to "5"
(nearly) always. Alpha was 0.83.
Career satisfaction. Career satisfaction was measured with four items concerning:
(1) satisfaction with specific job,
(2) satisfaction with job contents,
(3) satisfaction with career development,
(4) satisfaction with career perspectives.
The items were rated on a five-point Likert-type scale with "1" (almost) never to "5"
(nearly) always. Alpha was 0.80.
Control variables. Both engagement in formal and informal networking activities and
career satisfaction can be expected to be dependent on the availability of time. Being scarce of
time may diminish the amount of time that employees interact with their coworkers and this can
be reflected in their network characteristics (McGuire, 2000). Further, it has been emphasized that
especially for women it is important to take both organizational and home aspects into account
when studying social network characteristics (Higgins & Duxbury, 1994). Generally, women's
work and family-role obligations are more demanding than men's and men are shown to have
more control over the distribution of their time (Higgins & Duxbury, 1994). Therefore, we
controlled for two time constraints that can be expected to be related to gender differences in
network characteristics.
First, we controlled for the presence of children younger than 13 years. When the number
of children living at home increases, so too will the number of hours devoted to such tasks as
transportation, school-related activities, cooking and shopping (Frone & Yardley, 1996). Moore
(1990) showed indeed the presence of children to influence the size and structure of networks.
Second, we controlled for home-work interference. Home-work interference was measured with
three items - referring to a negative impact of the home situation on one's job performance - from
the Survey Work-Home Interference Nijmegen (Wagena & Geurts, 2000):
(1) hardly enjoying your work because you worry about your home situation;
(2) having difficulties concentrating on your work because you are preoccupied with
domestic matters;
(3) domestic obligations negatively affecting your job performance.
The items were scored on a five-point scale from "1" completely disagree to "5"
completely agree. Alpha was 0.78. Another relevant variable to control for is ambition, because
those who are ambitious have been found to be less satisfied with their current situation (see Judge
et al., 1995), and thus we expect that ambition will be negatively associated with career
satisfaction. Ambition was measured with five items:
(1) I am prepared to change job functions within this company.
(2) With my knowledge and experience I can easily change over to a job outside of this
company.
(3) I am prepared to combine my work with other functions.
(4) I want to continue working in my current job function.
(5) I want to move higher in the company in the near future.
The items were scored on a five-point scale from "1" completely disagree to "5"
completely agree. Alpha was 0.72.
Results
Table 1 presents overall descriptives and correlations. Table 2 shows the means on the
research variable for men and women separately.
Overall, men and women do not differ in career satisfaction (mean = 4.16, SD = 71). Career
satisfaction appears to be negatively associated with educational level (r = -0.17, p < 0.01) and
ambition (r = -0.35, p < 0.01). The women in this bank engage more in both formal networking
(r = 0.36, p < 0.01) and informal networking (r = 0.156,/) < 0.05) than men. Further, formal and
informal networking are correlated (r = 0.45, p < 0.01).
Table 3 presents the results of regression analyses. Hierarchical regression analyses were
performed for career satisfaction for the total population and for men and women separately. To
test specifically for interaction effects, the variables in the analysis of the total population were
entered in two steps. In Step 1, gender, age, educational level, the presence of children less than
12 years in the household, home-work interference, ambition, and engagement in formal and
informal networks were entered. In Step 2, the product variables, computed by multiplying
working gender by engagement in formal networks and multiplying gender by the engagement in
informal network activities were entered.
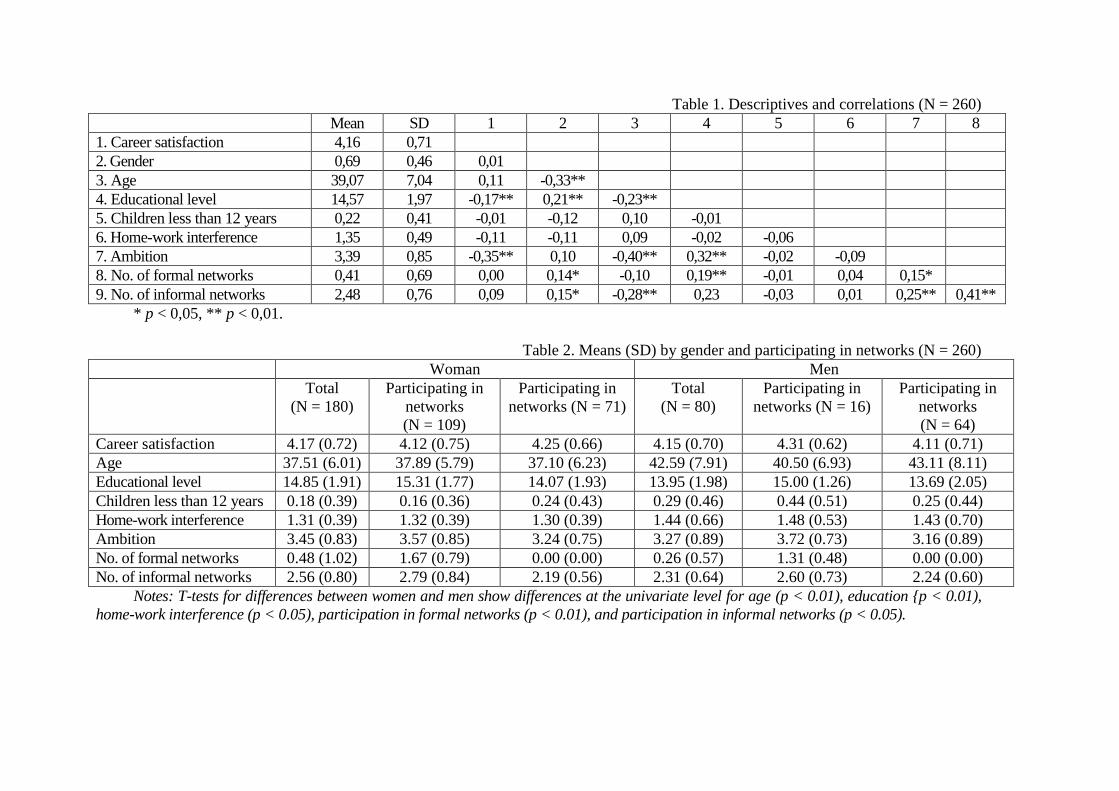
Table 1. Descriptives and correlations (N = 260)
Mean SD 1 2 3 4 5 6 7 8
1. Career satisfaction 4,16 0,71
2. Gender 0,69 0,46 0,01
3. Age 39,07 7,04 0,11 -0,33**
4. Educational level 14,57 1,97 -0,17** 0,21** -0,23**
5. Children less than 12 years 0,22 0,41 -0,01 -0,12 0,10 -0,01
6. Home-work interference 1,35 0,49 -0,11 -0,11 0,09 -0,02 -0,06
7. Ambition 3,39 0,85 -0,35** 0,10 -0,40** 0,32** -0,02 -0,09
8. No. of formal networks 0,41 0,69 0,00 0,14* -0,10 0,19** -0,01 0,04 0,15*
9. No. of informal networks 2,48 0,76 0,09 0,15* -0,28** 0,23 -0,03 0,01 0,25** 0,41**
* p < 0,05, ** p < 0,01.
Table 2. Means (SD) by gender and participating in networks (N = 260)
Woman Men
Total
(N = 180)
Participating in
networks
(N = 109)
Participating in
networks (N = 71)
Total
(N = 80)
Participating in
networks (N = 16)
Participating in
networks
(N = 64)
Career satisfaction 4.17 (0.72) 4.12 (0.75) 4.25 (0.66) 4.15 (0.70) 4.31 (0.62) 4.11 (0.71)
Age 37.51 (6.01) 37.89 (5.79) 37.10 (6.23) 42.59 (7.91) 40.50 (6.93) 43.11 (8.11)
Educational level 14.85 (1.91) 15.31 (1.77) 14.07 (1.93) 13.95 (1.98) 15.00 (1.26) 13.69 (2.05)
Children less than 12 years 0.18 (0.39) 0.16 (0.36) 0.24 (0.43) 0.29 (0.46) 0.44 (0.51) 0.25 (0.44)
Home-work interference 1.31 (0.39) 1.32 (0.39) 1.30 (0.39) 1.44 (0.66) 1.48 (0.53) 1.43 (0.70)
Ambition 3.45 (0.83) 3.57 (0.85) 3.24 (0.75) 3.27 (0.89) 3.72 (0.73) 3.16 (0.89)
No. of formal networks 0.48 (1.02) 1.67 (0.79) 0.00 (0.00) 0.26 (0.57) 1.31 (0.48) 0.00 (0.00)
No. of informal networks 2.56 (0.80) 2.79 (0.84) 2.19 (0.56) 2.31 (0.64) 2.60 (0.73) 2.24 (0.60)
Notes: T-tests for differences between women and men show differences at the univariate level for age (p < 0.01), education {p < 0.01),
home-work interference (p < 0.05), participation in formal networks (p < 0.01), and participation in informal networks (p < 0.05).
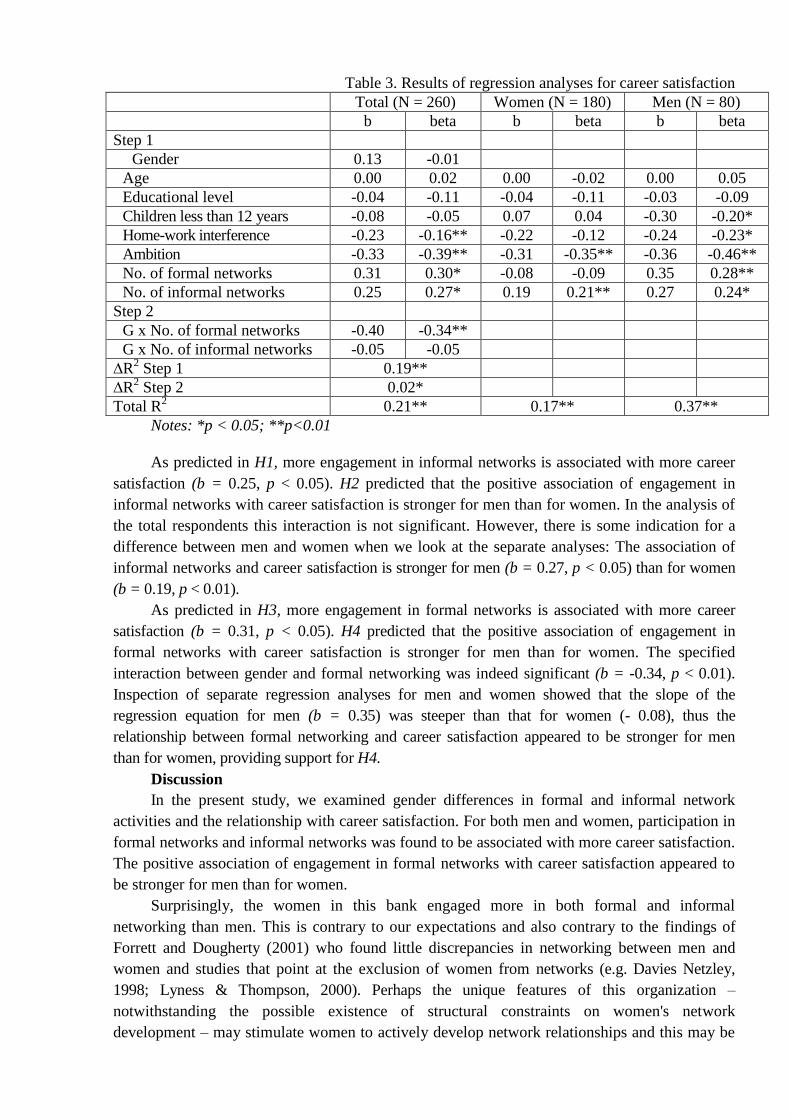
Table 3. Results of regression analyses for career satisfaction
Total (N = 260) Women (N = 180) Men (N = 80)
b beta b beta b beta
Step 1
Gender 0.13 -0.01
Age 0.00 0.02 0.00 -0.02 0.00 0.05
Educational level -0.04 -0.11 -0.04 -0.11 -0.03 -0.09
Children less than 12 years -0.08 -0.05 0.07 0.04 -0.30 -0.20*
Home-work interference -0.23 -0.16** -0.22 -0.12 -0.24 -0.23*
Ambition -0.33 -0.39** -0.31 -0.35** -0.36 -0.46**
No. of formal networks 0.31 0.30* -0.08 -0.09 0.35 0.28**
No. of informal networks 0.25 0.27* 0.19 0.21** 0.27 0.24*
Step 2
G x No. of formal networks -0.40 -0.34**
G x No. of informal networks -0.05 -0.05
∆R2 Step 1 0.19**
∆R2 Step 2 0.02*
Total R2 0.21** 0.17** 0.37**
Notes: *p < 0.05; **p<0.01
As predicted in H1, more engagement in informal networks is associated with more career
satisfaction (b = 0.25, p < 0.05). H2 predicted that the positive association of engagement in
informal networks with career satisfaction is stronger for men than for women. In the analysis of
the total respondents this interaction is not significant. However, there is some indication for a
difference between men and women when we look at the separate analyses: The association of
informal networks and career satisfaction is stronger for men (b = 0.27, p < 0.05) than for women
(b = 0.19, p < 0.01).
As predicted in H3, more engagement in formal networks is associated with more career
satisfaction (b = 0.31, p < 0.05). H4 predicted that the positive association of engagement in
formal networks with career satisfaction is stronger for men than for women. The specified
interaction between gender and formal networking was indeed significant (b = -0.34, p < 0.01).
Inspection of separate regression analyses for men and women showed that the slope of the
regression equation for men (b = 0.35) was steeper than that for women (- 0.08), thus the
relationship between formal networking and career satisfaction appeared to be stronger for men
than for women, providing support for H4.
Discussion
In the present study, we examined gender differences in formal and informal network
activities and the relationship with career satisfaction. For both men and women, participation in
formal networks and informal networks was found to be associated with more career satisfaction.
The positive association of engagement in formal networks with career satisfaction appeared to
be stronger for men than for women.
Surprisingly, the women in this bank engaged more in both formal and informal
networking than men. This is contrary to our expectations and also contrary to the findings of
Forrett and Dougherty (2001) who found little discrepancies in networking between men and
women and studies that point at the exclusion of women from networks (e.g. Davies Netzley,
1998; Lyness & Thompson, 2000). Perhaps the unique features of this organization –
notwithstanding the possible existence of structural constraints on women's network
development – may stimulate women to actively develop network relationships and this may be
reflected in different network characteristics than that of their male counterparts. However, it may
also be that in the past men engaged more frequently and more efficient in network relationships,
but that as women have become more aware of the importance of networking to their careers,
they have begun to engage in networking to a similar extent as their male counterparts (Forrett &
Dougherty, 2001).
Although the women in this study engage more in formal and informal networking, the
association with career satisfaction is smaller than holds for men. That is, men were able to use
their networking activities more effectively (i.e. showing more career satisfaction) than women.
Perhaps men are more motivated to use their networking instrumentally to achieve career goals.
For instance, Singh et al. (2002) found in their study men were more likely to seek out key people
to network with than women. Furthermore, in this line of explanation, Ehrich (1994) concluded
that males use their networks more successfully, as they promote their business and themselves to
a much greater extent than the extent to which females use their networks.
Some words of caution regarding the results of this study are necessary. The data were
collected via self-report measures and common method variance easily can become a problem.
These problems are partly remedied by the use of more distant measures of the social network
perspective, e.g. by using number of contacts instead of using attitudes. Future research efforts
certainly need also to consider using multi-actor data. For instance, gathering information from
employees but also from their network contacts. The results of this study also emphasize the
need to examine how network characteristics may change within career development trajectories
of men and women.
The cross-sectional design of the present study limits causal inferences. It is possible that
networking precedes career satisfaction as current theorizing suggests Qudge et al., 1995).
However, it is still also possible that employees satisfied with their careers are more inclined to
seek social contacts and engage in networking. There is certainly also a need for longitudinal
data to resolve issues concerning differential dropout of women and the development of effective
social networks.
The practical implications of this study are perhaps somewhat limited to professional
organizations, such as banks, because networking within this context may take specific forms
due to the task requirements and service orientation. Within professional organizations the
successful engagement in both formal and informal networking is of critical importance to
achieve valued career goals. However, and that does not hold exclusively for this specific setting,
the development of interpersonal skills may need to have more attention to increase career
satisfaction. Both men and women need to be able to communicate effectively and develop
relationships with others in the organization. Knowledge why some individuals are more likely
to engage in networking behaviors than others may represent valuable information for selection
processes and training programs (Forrett & Dougherty, 2001).
Although the female employees in this study engage more in networking, they profit less
from it in terms of career satisfaction. One possible solution may be to try to develop especially
the networking competences of women. To find their way within organizations, it has been
suggested that women need social networks that provide the kinds of resources that men
cultivate, even if that signifies that they must gain access to a different kind of resources than
traditionally are associated with women's roles (Stoloff et al., 1999). Human resource
management could consider providing training in learning personal skill development to create
better working relationships and to increase their exposure to other people, which may enhance
better understanding of their organization through networking (Lankau & Scandura, 2002).

Over the years, the benefits of having a mentor have received ample attention (e.g.
Fagenson, 1989; Godshalk & Sosik, 2003; Higgins, 2001; Hunt & Michael, 1983; Lankau &
Scandura, 2002; Scandura & Williams, 2001). However, it is increasingly acknowledged that not
only having a mentor, but especially a network of developmental relationships may be essential
to achieving intrinsic career success (e.g. Baugh & Scandura, 1999; De Janasz & Sullivan, 2004;
Higgins, 2000, 2001; Higgins & Thomas, 2001). The present study showed that more
engagement in formal and informal networking is for both men and women associated with
increased career satisfaction. Similarly, Van Emmerik (2004) found some moderating effects of
gender on the relationship between networking and intrinsic career success (e.g. for size of the
advice network, emotional intensity, and stability of the relationship). When more is indeed
better, as the results of this study stress, than it is important to ensure that employees are
provided with ample opportunities to develop mentoring and networking activities.
Вопросы для размышления:
1. Каковы основные проблемы, рассматриваемые в статье?
2. Какие из приведенных в статье исследовательских методов и выводов по результатам
исследования представляются вам спорными, недостаточно обоснованными? Почему?
3. Каковы ограничения проведенного исследования?
4. Каковы направления использования HR-менеджерами результатов этого исследования?
5. Являются ли рассмотренные в статье проблемы актуальными для российских
организаций?

Профиль «Экономика впечатлений: менеджмент в индустрии
гостеприимства и туризме» 8
Abstract
A tourism country‘s competitiveness is important especially when countries strive for
bigger market shares. Tourism managers have to identify and explore competitive advantages
and analyse the destination‘s competitive position. The degree to which a country can benefit
from its tourism sector depends largely on this sector‘s competitive position in the international
tourist market. This paper refers to the De Keyser–Vanhove model of a competitive destination,
which was applied to Slovenia in 1998. It also studies the Integrated model of destination
competitiveness developed in a collaborative effort of researchers dealing with the cases of
Korea and Australia and examines its determinants and individual competitive indicators as
perceived by Slovenian tourist stakeholders on the supply side. The result shows that Slovenia is
more competitive in its natural, cultural and created resources, but less competitive in the
management of tourism and, according to the Integrated model, demand conditions, with both
uncompetitive elements reducing the Slovenian tourism industry‘s ability to add value. The end
discussion points out weaknesses in the development of tourism competitiveness models and
calls for greater unity with the competitiveness factor theory and for more caution when creating
the main competitiveness factors and models.
1. Introduction
In an ever more saturated market, the fundamental task of destination management is to
understand how a tourism destination‘s competitiveness can be enhanced and sustained.
There is thus a strong need to identify and explore competitive (dis)advantages and to
analyse the actual competitive position.
The guiding principle of this study is that a destination‘s competitiveness can be improved
through appropriate matches between tourism resources and management strategies supported by
tourism stakeholders, especially government and tourism industry managers. Tourism will take a
successful position in the tourism market depending on which and how tourism attractions
develop value for tourists and how well destination resources are managed.
At present, this is a relevant question in Slovenia which is seeking to improve its
competitiveness position in international tourism markets. Based on research questions derived
from the results of previous studies on Slovenian competitiveness by Sirsˇe and Mihalicˇ (1999),
and Vanhove (1999), different hypotheses were created to determine in which areas Slovenia is
more competitive as a tourist destination and where it is less competitive. The main research
question was: what are the weakest points in Slovenian tourism‘s competitiveness? What is the
position of tourism management? Are the elements of competitiveness, such as the attractiveness
of natural or cultural resources, in line with the development of tourism management, supporting
factors and demand conditions? How can added value through the market valuation of Slovenian
tourism resources be increased?
The purpose of this article is three-fold. First, it compares the development of
competitiveness between the two studies on Slovenian tourism over time. Second, it compares
the two different competitiveness models used in the above-mentioned studies, e.g. the De
Keyser and Vanhove (applied in 1998) and Integrated models (applied in 2004). Third, it
discusses the use of different models and aggregation of indicators for evaluating the
competitiveness of tourism in general. The article is thus divided into five sections. The
introduction is followed by a short section on tourism competitiveness models. In the third
section an illustration of Slovenian tourism is given. The fourth section addresses the
competitiveness of Slovenian tourism and the De Keyser–Vanhove and Integrated tourism
competitiveness models. After a general description of the research methodology and data, an
8 Статья составлена по: Gomezelj D.O., Mihalic T. Destination competitiveness—Applying different models, the
case of Slovenia. // Tourism Management, 2008, N 29, pp. 294–307.

analysis of the individual determinants of competitiveness and its indicators is followed by the
testing of research hypotheses. The article ends with a discussion (Section 5) of some relevant
destination competitiveness modelling issues that arose during the research and the comparison
of existing competitiveness models and their applications.
2. The competitiveness of a tourism destination
A competitive advantage can be achieved if the overall appeal of any tourism destination is
superior to that of an alternative destination open to potential visitors (Dwyer & Kim, 2003,
369). A number of authors have provided some inputs into the understanding and practical
research of competitiveness in the area of tourism destinations (De Keyser & Vanhove, 1994;
Evans & Johnson, 1995; Hassan, 2000; Kozak, 2001; Mihalicˇ, 2000; Ritchie & Crouch, 1993;
Sirsˇe & Mihalicˇ, 1999; Thomas & Long, 2000).
For instance, Go and Govers (2000) defined the integrated quality management of a
tourism destination and price-based promotions as a value-increasing strategy. Pearce (1997)
pointed out destination evaluation techniques and methods that can systematically analyse and
compare the diverse attributes of competing destinations within a planning concept. Mihalicˇ
(2000) studied destination competitiveness from environmental perspective. The environmental
component was also taken into account in Hassan‘s model (2000). The model defined a
destination‘s commitment to the environment as one of the four determinants of tourism
competitiveness; and included also comparative advantage, industry structure and demand
factors. By demand factors he understood the ability to respond to the changing nature of new
tourism demand. How different the creation of a competitiveness model and even the
understanding of same-named factor can be is shown in a comparison with the De Keyser and
Vanhove model (1994). The authors argue that the analysis of a competitive position should take
five groups of competitiveness factors into account: tourism policy, macro economic, supply,
transport and demand factors. The model has been applied to the Caribbean area (De Keyser &
Vanhove, 1994) and used in a competitiveness study of Slovenian tourism in 1998 (Sirsˇe &
Mihalicˇ, 1999). In the case of Slovenia, and unlike with Hassan‘s ideas, demand factors
included the growth of tourism demand, income and expenditures for leisure activities, as well as
price/cost levels.
According to the well-known tourism competitiveness researchers Ritchie and Crouch
(2000), a destination‘s competitiveness is a country‘s ability to create added value and thus
increase the national wealth by managing assets and processes, attractiveness, aggressiveness
and proximity, and there by integrating these relationships within an economic and social model
that takes into account a destination‘s natural capital and its preservation for future generations
(Ritchie & Crouch, 2003). In 2003 they presented the most recently improved version of their
competitiveness model: a Conceptual Model of Destination Competitiveness. It has five key
determinants, namely destination policy, planning and development, destination management,
core resources and attractors, and supporting factors and resources. It also points out the
importance of the environment surrounding the destination: the global macro environment and
the competitive micro environment.
Some of the variables identified by Ritchie and Crouch have been included in the so-called
Integrated model by researchers in Korea and Australia (Dwyer, Livaic, & Mellor, 2003). The
model also seeks to capture the most important elements of competitiveness mentioned in the
general literature and the main destination competitiveness elements proposed by tourism
researchers. Its main, socalled competitiveness determinants are Inherited Resources, Created
Resources, Supporting Factors and Resources, Destination Management, Situational Conditions
and Demand Conditions. The model has been empirically tested on the cases of Korea and
Australia (in 2001) and in 2004 its methodology was applied to evaluate the tourism
competitiveness of Slovenia.

3. Slovenian tourism
Slovenia—with its capital Ljubljana—is a relatively small country, with a population of
2 million and covers an area of 20 273 km2. On one side, it is characterised by the elevations of
the Alps and, on the other, by the Mediterranean coast. Forests cover about 50% of the total
surface area. Concerning the climate, Slovenia falls within the Alpine, Continental and
Mediterranean climate zones.
The beginning of Slovenian tourism goes far back in history. The Lipica stud farm with its
famous white horses was founded in 1580. The Rogasˇka spa is more than 330 years old.
Postojna cave—one of the world‘s most famous natural phenomena—is open to tourists for
180 years. Tourism on the coast in Portorozˇ is organised for more than 120 years and the first
gambling licence was given to the Portorozˇ Casino in 1913 by the Austrian crown. In the old
Yugoslav times, Slovenia used to be a transit country for European tourist flows moving to and
from the Adriatic coast.
In 1991, Slovenia became an independent state and, due to the ‗Ten Day War‘ in the
country it faced a sharp decline in its tourism flows, registering only a quarter of the normal
number of international arrivals per year. After becoming independent, Slovenia intensified the
development of its spa tourism, coastal, Alpine, countryside and city tourism. Due to political
instability and the war in the Balkans, Slovenia has since registered a slow recovery and the
levels of domestic and foreign tourists are still below the best results seen in the period between
1982 and 1991.
Slovenian tourism can be defined as a very important economic and social activity, which
accounts for around 9% of Slovenian GDP (direct and indirect effects), 10% of Slovenian
exports, 10% of exchange inflows into the current account of the balance of payments and
employs about 52,500 people. In 2004 tourism foreign exchange earnings were EUR 1.3 billion,
around 5% of the country‘s total GDP. In 2004, Slovenia had 2.3 million visitors, with 64%
being foreigners. The number of overnight stays in 2004 was 7.6 million, of which foreign
tourists made 57.5%. In 2004 some of the most important target countries were Italy, Germany,
Austria, Croatia and Great Britain (SURS, 2005).
4. The competitiveness of Slovenian tourism
Some competitiveness and multiplier analyses of Slovenian tourism are already over
20 years old (Mihalicˇ, 1987; Sirsˇe, Planina, & Majcen, 1981). The next study on the
competitiveness of Slovenian tourism was carried out for the AIEST Congress in Slovenia in
1999 and was undertaken in 1998 by Sirsˇe and Mihalicˇ (1999) based on the De Keyser–
Vanhove model (De Keyser & Vanhove, 1994).
4.1. Application of the De Keyser–Vanhove tourism competitiveness model to Slovenia in
1998
As mentioned in the second section of this paper, the De Keyser–Vanhove model of
destination competitiveness defines five factors of tourism competitiveness. In research
conducted in 1998, Slovenian tourism experts agreed that some natural resources (mineral and
thermal springs, landscape and scenery) were the competitive advantages of Slovenian tourism;
their presence increased the country‘s competitiveness. Although such primary attractiveness can
itself be a source of higher added value, such value is only created through proper tourism
management and, conversely, without proper design and management valuable assets may be
eroded (Gunn, 2002). Thus it can happen that an advantage arising due to attractions is lost
through uncompetitive management and/or an uncompetitive tourism infra and superstructure
that, again, is a result of previous tourism management. Indeed, in the study all other supply
factors (except attractions) were given much lower competitiveness evaluations and defined as
weak points. In addition, the price/quality ratio was relatively unfavourable for Slovenian
tourism and the prices were considered to be too high compared to the quality of products and
services. Tourism experts also strongly agreed that Slovenian tourism is uncompetitive in human
resource management—that there was also a deficiency in education and training programmes.
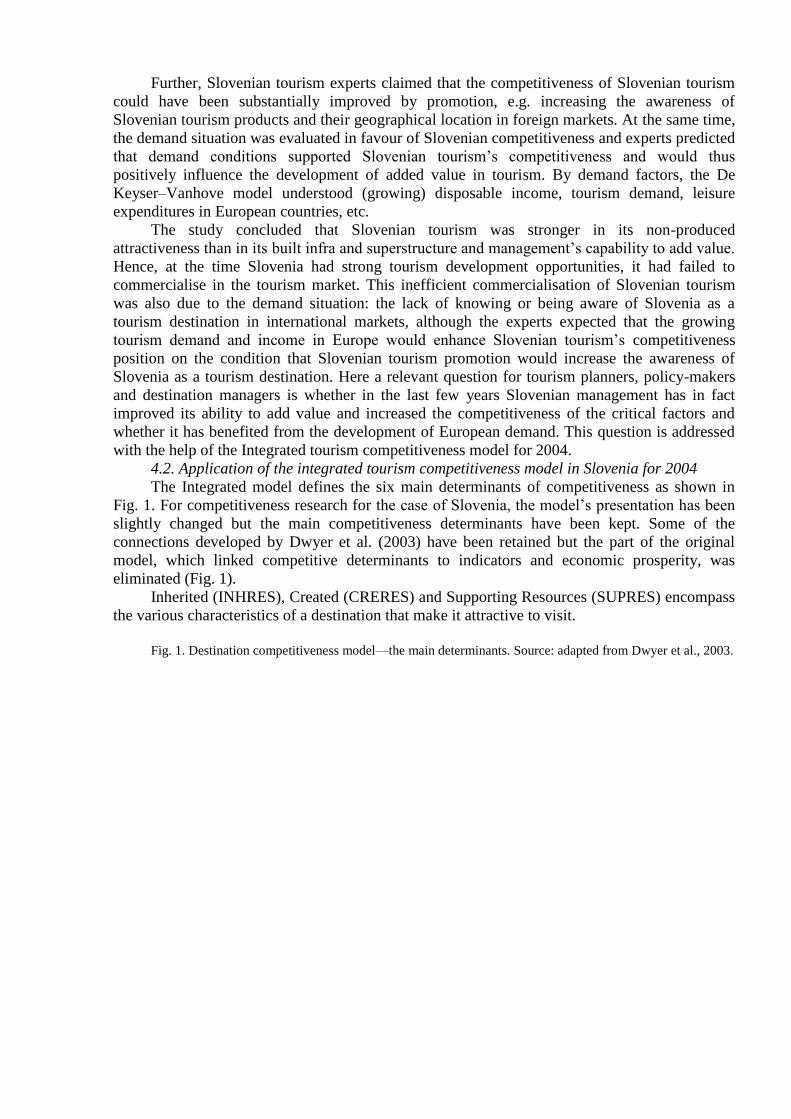
Further, Slovenian tourism experts claimed that the competitiveness of Slovenian tourism
could have been substantially improved by promotion, e.g. increasing the awareness of
Slovenian tourism products and their geographical location in foreign markets. At the same time,
the demand situation was evaluated in favour of Slovenian competitiveness and experts predicted
that demand conditions supported Slovenian tourism‘s competitiveness and would thus
positively influence the development of added value in tourism. By demand factors, the De
Keyser–Vanhove model understood (growing) disposable income, tourism demand, leisure
expenditures in European countries, etc.
The study concluded that Slovenian tourism was stronger in its non-produced
attractiveness than in its built infra and superstructure and management‘s capability to add value.
Hence, at the time Slovenia had strong tourism development opportunities, it had failed to
commercialise in the tourism market. This inefficient commercialisation of Slovenian tourism
was also due to the demand situation: the lack of knowing or being aware of Slovenia as a
tourism destination in international markets, although the experts expected that the growing
tourism demand and income in Europe would enhance Slovenian tourism‘s competitiveness
position on the condition that Slovenian tourism promotion would increase the awareness of
Slovenia as a tourism destination. Here a relevant question for tourism planners, policy-makers
and destination managers is whether in the last few years Slovenian management has in fact
improved its ability to add value and increased the competitiveness of the critical factors and
whether it has benefited from the development of European demand. This question is addressed
with the help of the Integrated tourism competitiveness model for 2004.
4.2. Application of the integrated tourism competitiveness model in Slovenia for 2004
The Integrated model defines the six main determinants of competitiveness as shown in
Fig. 1. For competitiveness research for the case of Slovenia, the model‘s presentation has been
slightly changed but the main competitiveness determinants have been kept. Some of the
connections developed by Dwyer et al. (2003) have been retained but the part of the original
model, which linked competitive determinants to indicators and economic prosperity, was
eliminated (Fig. 1).
Inherited (INHRES), Created (CRERES) and Supporting Resources (SUPRES) encompass
the various characteristics of a destination that make it attractive to visit.
Fig. 1. Destination competitiveness model—the main determinants. Source: adapted from Dwyer et al., 2003.
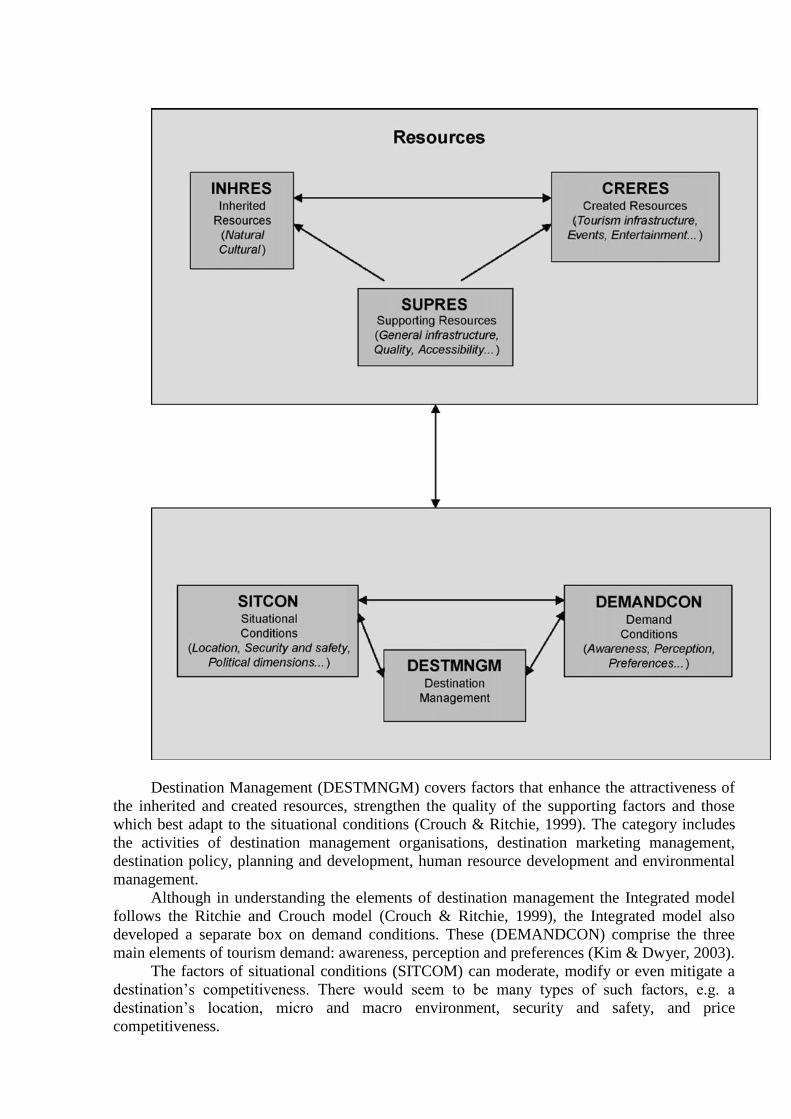
Destination Management (DESTMNGM) covers factors that enhance the attractiveness of
the inherited and created resources, strengthen the quality of the supporting factors and those
which best adapt to the situational conditions (Crouch & Ritchie, 1999). The category includes
the activities of destination management organisations, destination marketing management,
destination policy, planning and development, human resource development and environmental
management.
Although in understanding the elements of destination management the Integrated model
follows the Ritchie and Crouch model (Crouch & Ritchie, 1999), the Integrated model also
developed a separate box on demand conditions. These (DEMANDCON) comprise the three
main elements of tourism demand: awareness, perception and preferences (Kim & Dwyer, 2003).
The factors of situational conditions (SITCOM) can moderate, modify or even mitigate a
destination‘s competitiveness. There would seem to be many types of such factors, e.g. a
destination‘s location, micro and macro environment, security and safety, and price
competitiveness.

4.2.1. Research methodology
In 2004, data were gathered by a questionnaire. Based on the Integrated model (Dwyer et
al., 2003), 85 competitive indicators were created in the form of 85 statements. There is no single
set of competitiveness indicators that applies to all destinations at all times. For any element of
destination competitiveness various indicators may be employed (Dwyer, Mellor, Livaic,
Edwards, & Kim, 2004). In order to obtain a clearer picture, they were grouped into each of the
six categories of the Model of Destination Competitiveness (see Fig. 1). The SPSS standard
package for personal computers was used for data processing.
The survey required respondents to rate Slovenia‘s competitive performance on a five-
point Likert scale for each of the 85 competitiveness indicators compared to the average of the
group of competitive destinations. The aim of this study was not to rank Slovenia against other
competitive destinations but to indicate the weak points of Slovenia‘s tourism industry. That is
why the respondents were left to indicate their own group of the most competitive destinations.
The majority (80.5%) created their own competitiveness group of countries from the following:
the neighbouring Croatia, Austria and Italy as well as Switzerland, a non-neighbouring yet also
an Alpine country. The options ranged from 1 (the competitiveness level of the indicator in
Slovenia is well below the same level in competitive destinations) to 5 (the competitiveness level
of the indicator in Slovenia is well above the same level in competitive destinations).
The survey was performed in spring 2004. Respondents were selected from tourism
stakeholders on the supply side, namely the tourism industry, government, tourism school
academics, and postgraduate students on tourism management and business courses with work
experience. Although tourists are well placed to evaluate the normal components of a
destination‘s attractiveness, they are less able to evaluate those factors that influence competitive
production such as destination management factors, especially because of their status as visitors.
It was necessary to survey individuals who could respond to questions on management efficiency
and tourism attractors. It is not uncommon for destination factors to be evaluated by
practitioners. Some authors (Evans & Chon, 1989; Faulkner, Opperman, & Fredline, 1999) have
argued that stakeholders‘ views constitute accurate measures of attractions.
From the 291 questionnaires sent out, 127 were returned, of which 118 or 41% were
useable. The sample included 6.8% of government officials, 12.8% of tourist agency managers,
26.4% of hospitality sector managers, 6% of tourism school academics, 15% tourism service
managers, 12% postgraduate students taking tourism courses, 15% of employers in local tourist
organisations while 6% were represented by others. The sample consisted of 63.6% of tourism
stakeholders who had been linked with the tourism industry for less than 10 years, 18.5% of
them from 11 to 20 years, 10.2% from 21 to 30 years and 7.7% for more than 30 years. The
majority of participants were young, up to 40 years of age (61.9%). The respondents were 66.1%
female and 33.9% male. The majority (50.8%) of participants had completed college or
university levels of education.
4.2.2. Competitiveness by individual competitiveness indicators
Below, individual indicators of tourism competitiveness in Slovenia are grouped in the
main competitiveness determinants suggested by the integrated model and analysed. This is
followed by an attempt to evaluate the weakest points of Slovenian tourism‘s competitiveness.
4.2.2.1. Inherited resources. Compared to its competitive destinations, Slovenia is regarded
as being more competitive than its competitors in all attributes of the Inherited Resources
(Fig. 2).
The highest rating was assigned to the unspoiled nature, flora and fauna, attractiveness of
the climate and traditional arts. The relatively high rating given to Slovenia‘s natural resources
may be expected. It is well known that the country has areas of attractive natural resources, its
nature is still unspoiled and its climate is favourable. The smallest standard deviation in this
group for unspoiled nature with a value of 0.7 indicates quite a high level of agreement between
the respondents.
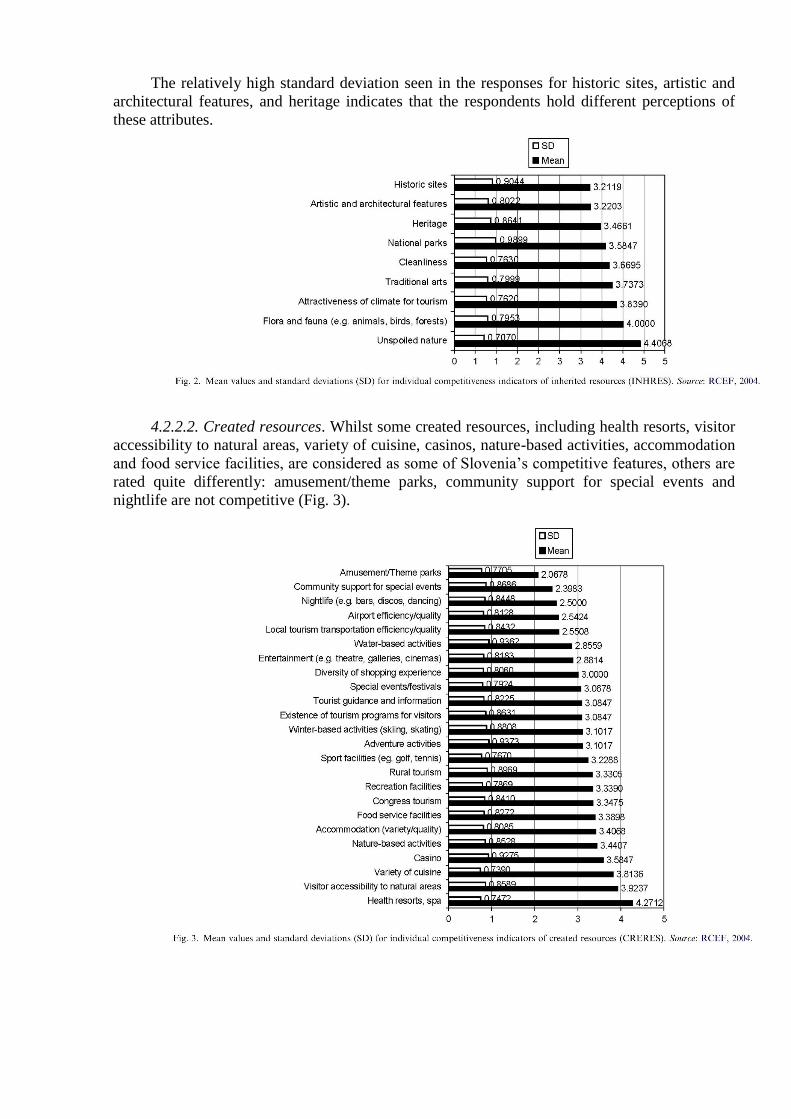
The relatively high standard deviation seen in the responses for historic sites, artistic and
architectural features, and heritage indicates that the respondents hold different perceptions of
these attributes.
4.2.2.2. Created resources. Whilst some created resources, including health resorts, visitor
accessibility to natural areas, variety of cuisine, casinos, nature-based activities, accommodation
and food service facilities, are considered as some of Slovenia‘s competitive features, others are
rated quite differently: amusement/theme parks, community support for special events and
nightlife are not competitive (Fig. 3).

4.2.2.3. Supporting factors. There is less variation in the perceived competitiveness of this
group of indicators than for most of the other competitiveness determinants. Only six out of the
12 supporting factors are rated as being more competitive in comparison to the chosen set of
competitive destinations: hospitality, communication and trust between tourists and residents,
accessibility of the destination, the telecommunication system for tourists, quality of tourism
services, and financial institutions and currency exchange facilities. Other competitive indicator
values are not competitive. Slovenia fails to meet visitor needs in terms of animation,
health/medical facilities for tourists, attitudes of custom/immigration officials, efficiency of
customs/immigration, visa requirements, and destination links with major origin markets
(Fig. 4).
Overall, the ratings for the indicators of determinant supporting factors were considerably
lower than for the Inherited Resources and Created Resources.
4.2.2.4. Destination management. Residents‘ support for tourism development,
appreciation of the importance of service quality, tourism/hospitality training responsive to
visitor needs and private sector recognition of the importance of sustainable tourism
development are all rated highly, whilst foreign investment, government cooperation in the
development of tourism policy, public sector recognition of the importance of sustainable
tourism development, the quality of research input into tourism policy, planning and
development are all rated relatively low (Fig. 5).

4.2.2.5. Situational conditions. The tourism industry‘s performance depends on the
industry‘s overall structure and the positive environment in which it is situated.
Slovenia is more competitive in terms of the security/safety of visitors, political stability,
value for money in destination tourism experiences, value for money in accommodation, the use
of IT by firms and value for money in shopping items, but less competitive in the areas of co-
operation between the public and private sector, access to venture capital, the investment
environment, the use of ecommerce and manager capabilities (Fig. 6). The low standard
deviation for political stability indicates a high level of agreement in ratings of this indicator. In
the event of the tourism industry‘s poor performance, Slovenian tourism managers can no longer
make excuses by referring to the bad political situation or political instability and the war in the
neighbouring Balkans, as was the case in the 1990s.
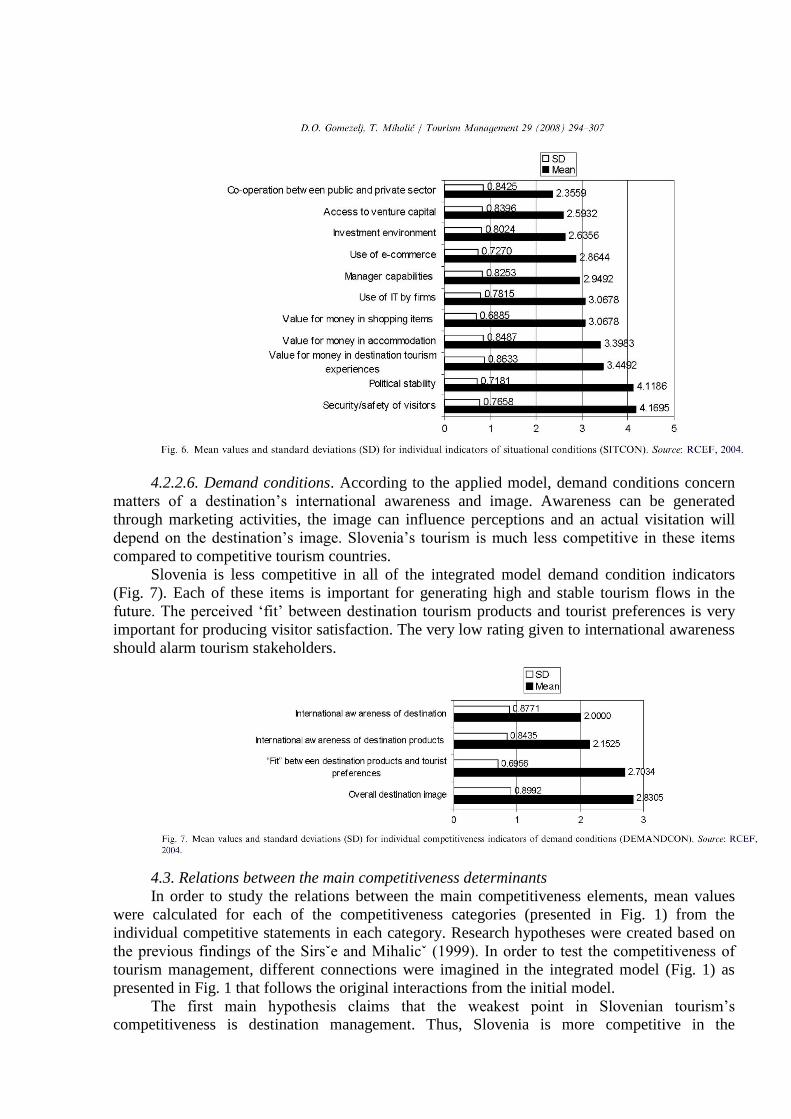
4.2.2.6. Demand conditions. According to the applied model, demand conditions concern
matters of a destination‘s international awareness and image. Awareness can be generated
through marketing activities, the image can influence perceptions and an actual visitation will
depend on the destination‘s image. Slovenia‘s tourism is much less competitive in these items
compared to competitive tourism countries.
Slovenia is less competitive in all of the integrated model demand condition indicators
(Fig. 7). Each of these items is important for generating high and stable tourism flows in the
future. The perceived ‗fit‘ between destination tourism products and tourist preferences is very
important for producing visitor satisfaction. The very low rating given to international awareness
should alarm tourism stakeholders.
4.3. Relations between the main competitiveness determinants
In order to study the relations between the main competitiveness elements, mean values
were calculated for each of the competitiveness categories (presented in Fig. 1) from the
individual competitive statements in each category. Research hypotheses were created based on
the previous findings of the Sirsˇe and Mihalicˇ (1999). In order to test the competitiveness of
tourism management, different connections were imagined in the integrated model (Fig. 1) as
presented in Fig. 1 that follows the original interactions from the initial model.
The first main hypothesis claims that the weakest point in Slovenian tourism‘s
competitiveness is destination management. Thus, Slovenia is more competitive in the
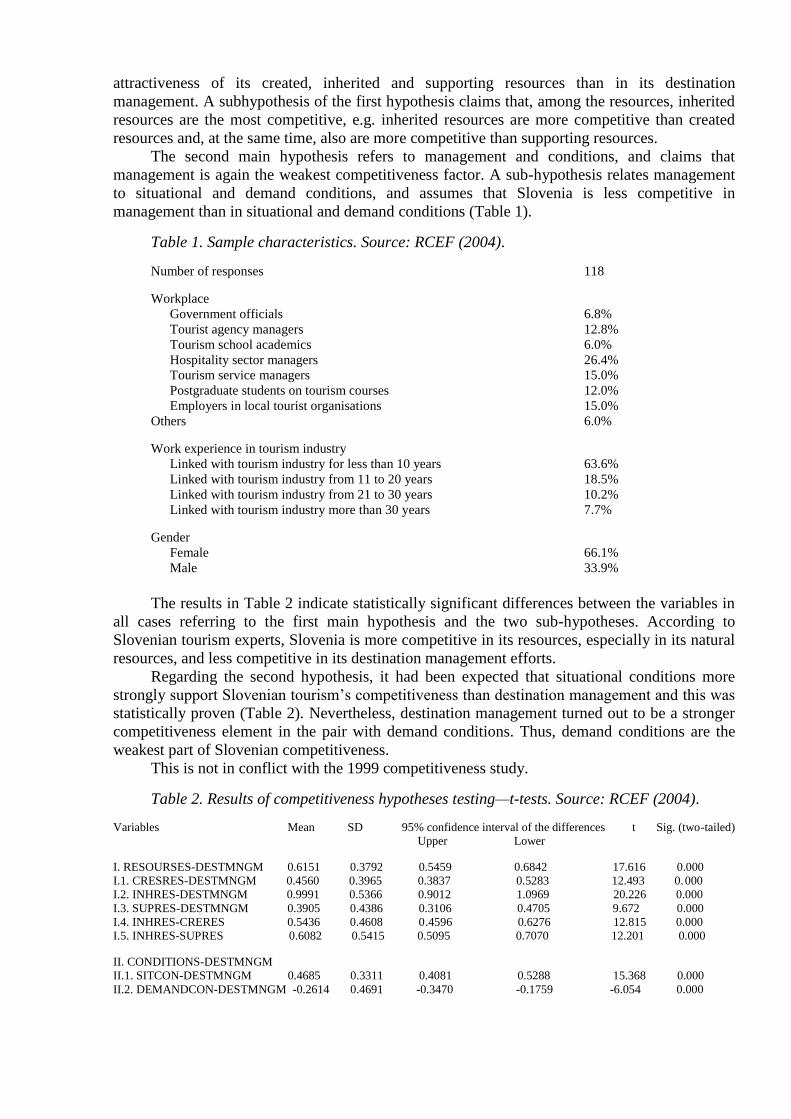
attractiveness of its created, inherited and supporting resources than in its destination
management. A subhypothesis of the first hypothesis claims that, among the resources, inherited
resources are the most competitive, e.g. inherited resources are more competitive than created
resources and, at the same time, also are more competitive than supporting resources.
The second main hypothesis refers to management and conditions, and claims that
management is again the weakest competitiveness factor. A sub-hypothesis relates management
to situational and demand conditions, and assumes that Slovenia is less competitive in
management than in situational and demand conditions (Table 1).
Table 1. Sample characteristics. Source: RCEF (2004).
Number of responses 118
Workplace
Government officials 6.8%
Tourist agency managers 12.8%
Tourism school academics 6.0%
Hospitality sector managers 26.4%
Tourism service managers 15.0%
Postgraduate students on tourism courses 12.0%
Employers in local tourist organisations 15.0%
Others 6.0%
Work experience in tourism industry
Linked with tourism industry for less than 10 years 63.6%
Linked with tourism industry from 11 to 20 years 18.5%
Linked with tourism industry from 21 to 30 years 10.2%
Linked with tourism industry more than 30 years 7.7%
Gender
Female 66.1%
Male 33.9%
The results in Table 2 indicate statistically significant differences between the variables in
all cases referring to the first main hypothesis and the two sub-hypotheses. According to
Slovenian tourism experts, Slovenia is more competitive in its resources, especially in its natural
resources, and less competitive in its destination management efforts.
Regarding the second hypothesis, it had been expected that situational conditions more
strongly support Slovenian tourism‘s competitiveness than destination management and this was
statistically proven (Table 2). Nevertheless, destination management turned out to be a stronger
competitiveness element in the pair with demand conditions. Thus, demand conditions are the
weakest part of Slovenian competitiveness.
This is not in conflict with the 1999 competitiveness study.
Table 2. Results of competitiveness hypotheses testing—t-tests. Source: RCEF (2004).
Variables Mean SD 95% confidence interval of the differences t Sig. (two-tailed)
Upper Lower
I. RESOURSES-DESTMNGM 0.6151 0.3792 0.5459 0.6842 17.616 0.000
I.1. CRESRES-DESTMNGM 0.4560 0.3965 0.3837 0.5283 12.493 0.000
I.2. INHRES-DESTMNGM 0.9991 0.5366 0.9012 1.0969 20.226 0.000
I.3. SUPRES-DESTMNGM 0.3905 0.4386 0.3106 0.4705 9.672 0.000
I.4. INHRES-CRERES 0.5436 0.4608 0.4596 0.6276 12.815 0.000
I.5. INHRES-SUPRES 0.6082 0.5415 0.5095 0.7070 12.201 0.000
II. CONDITIONS-DESTMNGM
II.1. SITCON-DESTMNGM 0.4685 0.3311 0.4081 0.5288 15.368 0.000
II.2. DEMANDCON-DESTMNGM -0.2614 0.4691 -0.3470 -0.1759 -6.054 0.000
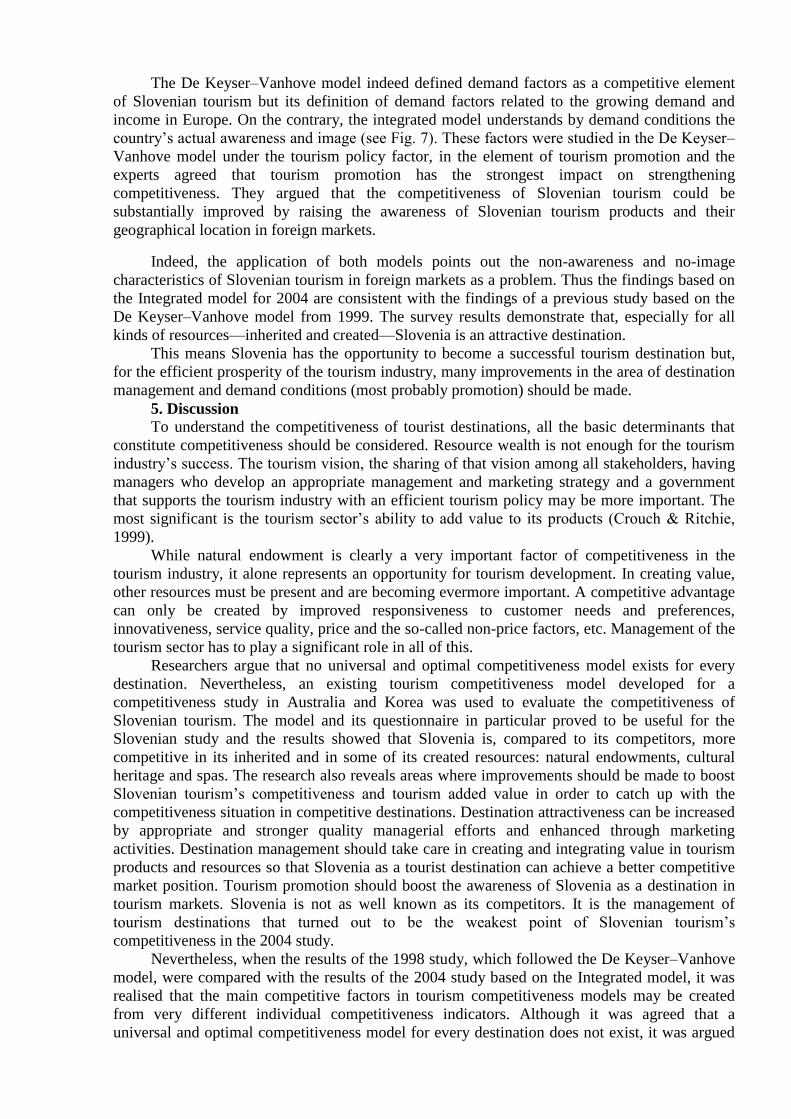
The De Keyser–Vanhove model indeed defined demand factors as a competitive element
of Slovenian tourism but its definition of demand factors related to the growing demand and
income in Europe. On the contrary, the integrated model understands by demand conditions the
country‘s actual awareness and image (see Fig. 7). These factors were studied in the De Keyser–
Vanhove model under the tourism policy factor, in the element of tourism promotion and the
experts agreed that tourism promotion has the strongest impact on strengthening
competitiveness. They argued that the competitiveness of Slovenian tourism could be
substantially improved by raising the awareness of Slovenian tourism products and their
geographical location in foreign markets.
Indeed, the application of both models points out the non-awareness and no-image
characteristics of Slovenian tourism in foreign markets as a problem. Thus the findings based on
the Integrated model for 2004 are consistent with the findings of a previous study based on the
De Keyser–Vanhove model from 1999. The survey results demonstrate that, especially for all
kinds of resources—inherited and created—Slovenia is an attractive destination.
This means Slovenia has the opportunity to become a successful tourism destination but,
for the efficient prosperity of the tourism industry, many improvements in the area of destination
management and demand conditions (most probably promotion) should be made.
5. Discussion
To understand the competitiveness of tourist destinations, all the basic determinants that
constitute competitiveness should be considered. Resource wealth is not enough for the tourism
industry‘s success. The tourism vision, the sharing of that vision among all stakeholders, having
managers who develop an appropriate management and marketing strategy and a government
that supports the tourism industry with an efficient tourism policy may be more important. The
most significant is the tourism sector‘s ability to add value to its products (Crouch & Ritchie,
1999).
While natural endowment is clearly a very important factor of competitiveness in the
tourism industry, it alone represents an opportunity for tourism development. In creating value,
other resources must be present and are becoming evermore important. A competitive advantage
can only be created by improved responsiveness to customer needs and preferences,
innovativeness, service quality, price and the so-called non-price factors, etc. Management of the
tourism sector has to play a significant role in all of this.
Researchers argue that no universal and optimal competitiveness model exists for every
destination. Nevertheless, an existing tourism competitiveness model developed for a
competitiveness study in Australia and Korea was used to evaluate the competitiveness of
Slovenian tourism. The model and its questionnaire in particular proved to be useful for the
Slovenian study and the results showed that Slovenia is, compared to its competitors, more
competitive in its inherited and in some of its created resources: natural endowments, cultural
heritage and spas. The research also reveals areas where improvements should be made to boost
Slovenian tourism‘s competitiveness and tourism added value in order to catch up with the
competitiveness situation in competitive destinations. Destination attractiveness can be increased
by appropriate and stronger quality managerial efforts and enhanced through marketing
activities. Destination management should take care in creating and integrating value in tourism
products and resources so that Slovenia as a tourist destination can achieve a better competitive
market position. Tourism promotion should boost the awareness of Slovenia as a destination in
tourism markets. Slovenia is not as well known as its competitors. It is the management of
tourism destinations that turned out to be the weakest point of Slovenian tourism‘s
competitiveness in the 2004 study.
Nevertheless, when the results of the 1998 study, which followed the De Keyser–Vanhove
model, were compared with the results of the 2004 study based on the Integrated model, it was
realised that the main competitive factors in tourism competitiveness models may be created
from very different individual competitiveness indicators. Although it was agreed that a
universal and optimal competitiveness model for every destination does not exist, it was argued
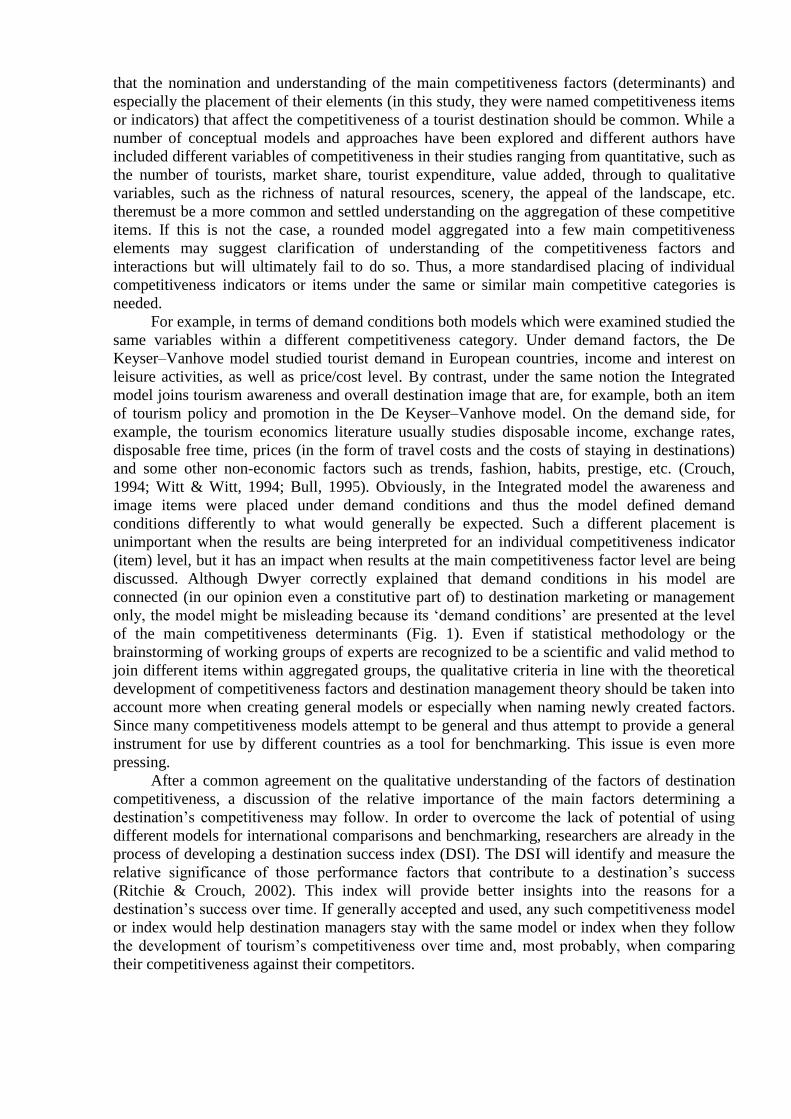
that the nomination and understanding of the main competitiveness factors (determinants) and
especially the placement of their elements (in this study, they were named competitiveness items
or indicators) that affect the competitiveness of a tourist destination should be common. While a
number of conceptual models and approaches have been explored and different authors have
included different variables of competitiveness in their studies ranging from quantitative, such as
the number of tourists, market share, tourist expenditure, value added, through to qualitative
variables, such as the richness of natural resources, scenery, the appeal of the landscape, etc.
theremust be a more common and settled understanding on the aggregation of these competitive
items. If this is not the case, a rounded model aggregated into a few main competitiveness
elements may suggest clarification of understanding of the competitiveness factors and
interactions but will ultimately fail to do so. Thus, a more standardised placing of individual
competitiveness indicators or items under the same or similar main competitive categories is
needed.
For example, in terms of demand conditions both models which were examined studied the
same variables within a different competitiveness category. Under demand factors, the De
Keyser–Vanhove model studied tourist demand in European countries, income and interest on
leisure activities, as well as price/cost level. By contrast, under the same notion the Integrated
model joins tourism awareness and overall destination image that are, for example, both an item
of tourism policy and promotion in the De Keyser–Vanhove model. On the demand side, for
example, the tourism economics literature usually studies disposable income, exchange rates,
disposable free time, prices (in the form of travel costs and the costs of staying in destinations)
and some other non-economic factors such as trends, fashion, habits, prestige, etc. (Crouch,
1994; Witt & Witt, 1994; Bull, 1995). Obviously, in the Integrated model the awareness and
image items were placed under demand conditions and thus the model defined demand
conditions differently to what would generally be expected. Such a different placement is
unimportant when the results are being interpreted for an individual competitiveness indicator
(item) level, but it has an impact when results at the main competitiveness factor level are being
discussed. Although Dwyer correctly explained that demand conditions in his model are
connected (in our opinion even a constitutive part of) to destination marketing or management
only, the model might be misleading because its ‗demand conditions‘ are presented at the level
of the main competitiveness determinants (Fig. 1). Even if statistical methodology or the
brainstorming of working groups of experts are recognized to be a scientific and valid method to
join different items within aggregated groups, the qualitative criteria in line with the theoretical
development of competitiveness factors and destination management theory should be taken into
account more when creating general models or especially when naming newly created factors.
Since many competitiveness models attempt to be general and thus attempt to provide a general
instrument for use by different countries as a tool for benchmarking. This issue is even more
pressing.
After a common agreement on the qualitative understanding of the factors of destination
competitiveness, a discussion of the relative importance of the main factors determining a
destination‘s competitiveness may follow. In order to overcome the lack of potential of using
different models for international comparisons and benchmarking, researchers are already in the
process of developing a destination success index (DSI). The DSI will identify and measure the
relative significance of those performance factors that contribute to a destination‘s success
(Ritchie & Crouch, 2002). This index will provide better insights into the reasons for a
destination‘s success over time. If generally accepted and used, any such competitiveness model
or index would help destination managers stay with the same model or index when they follow
the development of tourism‘s competitiveness over time and, most probably, when comparing
their competitiveness against their competitors.

Acknowledgement
The authors wish to acknowledge the constructively critical comments from the journal
referees, which helped improve the paper. Thanks also go to the editor for his support.
Appendix A
Questionnaire
The destination competitiveness in tourism depends on various dimensions of the visitor
tourism experience. As a stakeholder in Slovenia‘s tourism industry you will have valuable
insights which can assist us to achieve the study aims. We would greatly appreciate if you could
spend some time answering questions about Slovenia as a tourist destination.
Please, kindly answer the following questions.
A) Gender: Female Male
B) Age: __________________________
C) Level of education
a secondary
b college
c university
d Master, Phd. degree
D) Your working position
a government official
b tourist agency manager
c hospitality sector manager
d tourism school academics
e tourism service manager
f postgraduate students on tourism courses
g employer in local tourism organization
h other __________________________
E) How long has your work been linked to tourism industry? ________ years
F) Which tourist destinations, according to your option, represent the hardest competition
to Slovenia? Please name 5 destinations and list them from the most to the least
competitive.

Вопросы для размышления:
1. Какие основные проблемы рассматриваются в статье?
2. Какие из приведенных в статье исследовательских методов и выводов по результатам
исследования представляются Вам спорными, недостаточно обоснованными?
Аргументируйте свой ответ.
3. Для решения каких практических задач туристической отрасли могут быть
использованы результаты исследования?
4. Какие направления дальнейших исследований по данной проблематике Вы считаете
наиболее приоритетными?
5. Являются ли рассмотренные в статье проблемы актуальными для российской
туристической отрасли?

МЕТОДИЧЕСКИЕ РЕКОМЕНДАЦИИ
Олимпиада по направлению «Менеджмент» проводится в рамках отдельных
магистерских программ (профилей): «Маркетинг», «Маркетинговые коммуникации и
реклама в современном бизнесе», «Стратегическое и корпоративное управление»,
«Управление проектами: проектный анализ, инвестиции, технологии реализации»,
«Управление человеческими ресурсами», «Экономика впечатлений: менеджмент в
индустрии гостеприимства и туризме».
Участник олимпиады сообщает о своем намерении выполнять работу по профилю
конкретной магистерской программы в момент получения олимпиадного задания.
Участникам олимпиады предлагается для выполнения одно письменное творческое
задание. На выполнение творческого задания отводится 3 (три) астрономических часа
(180 минут). Творческое задание оценивается по 100-балльной шкале.
Творческое задание представляет собой научную статью на английском языке по
профилю конкретной магистерской программы с вопросами для размышления.
В ходе выполнения творческого задания участник олимпиады должен прочитать
предложенную научную статью (в том числе, намеренно содержащую спорные суждения,
точки зрения, неточные выводы и т.п.) и, на основании сформулированных к статье
вопросов для размышления, сделать ее критический анализ, дать свое обоснованное и
аргументированное оценочное суждение в письменном виде на русском языке.
Важно помнить, что сформулированные к статье вопросы для размышления не
являются вопросами-заданиями, на которые участнику олимпиады необходимо ответить.
Они именно определяют, но не ограничивают, направления для размышления в рамках
критического анализа материала и проблем статьи.
Выполнение творческого задания предполагает использование понятий, теорий и
концепций, входящих в Раздел 2 «ОБЩЕПРОФЕССИОНАЛЬНЫЕ И ТЕОРЕТИЧЕСКИЕ
ДИСЦИПЛИНЫ» Программы вступительного экзамена по менеджменту для
поступающих в магистратуру факультета менеджмента НИУ-ВШЭ (см.
http://ma.hse.ru/vstupi).
При подготовке к олимпиаде особое внимание следует уделить изучению дисциплин,
соответствующих профилю выбранной участником олимпиады магистерской программы
(см. таблицу).
Профиль магистерской
программы
Дисциплины,
соответствующие
профилю
магистерской
программы
Основная9 литература
Маркетинг Маркетинг 1. Котлер Ф., Армстронг Г. Основы
маркетинга: Профессиональное
издание. – М: ООО «ИД Вильямс»,
2009.
9 Список дополнительной литературы см. в разделах по соответствующим дисциплинам в Программе
вступительного экзамена по менеджменту для поступающих в магистратуру факультета менеджмента НИУ-
ВШЭ (http://ma.hse.ru/vstupi).

2. Ламбен Ж.Ж. Менеджмент,
ориентированный на рынок.
Стратегический и операционный
маркетинг. – СПб: Питер, 2004.
Маркетинговые
коммуникации и реклама в
современном бизнесе
Маркетинговые
коммуникации
1. Росситер Дж., Перси Л. Реклама и
продвижение товаров. – СПб: Питер,
2001.
2. Котлер Ф. Маркетинг-менеджмент.
Экспресс-курс. – СПб: Питер, 2001.
Стратегическое и
корпоративное управление
Стратегическое
управление
Основы
корпоративного
управления
1. Пособие по корпоративному
управлению: в 6 т. – М.: Альпина
Бизнес Букс, 2004.
2. Томпсон А.А.-мл., Стрикленд А.Дж.
III. Стратегический менеджмент.
Концепции и ситуации для анализа.
12-е издание. – М.: Вильямс, 2003.
3. Аакер Д.А. Стратегическое
рыночное управление. – СПб: Питер,
2002.
Управление проектами:
проектный анализ,
инвестиции, технологии
реализации
Управление проектами 1. Мазур И.И., Шапиро В.Д.,
Ольдерогге Н.Г., Полковников А.В.
Управление проектами. – М.: Омега-Л,
2009.
2. Милошевич Д. Набор инструментов
для управления проектами. – М.: ДМК
Пресс, 2006.
3. Управление проектами. Основы
профессиональных знаний.
Национальные требования к
компетентности специалистов
(National Competence Baseline, NCB
SOVNET 3.0). Ассоциация управления
проектами СОВНЕТ, 2010.
4. Полковников А.В., Дубовик М.Ф.
Управление проектами. Полный курс
MBA. – М.: Эксмо, 2010.
5. Справочник для профессионалов. /
Изд. 2-е доп., Шапиро А.В., Цветков
Н.Г., Ольдерогге Н.Г и др. – М.:
Омега-Л, 2010.
Управление человеческими
ресурсами
Теория организаций
Управление
персоналом
Организационное
поведение
1. Дафт Р. Теория организации. – М.:
Юнити, 2006.
2. Армстронг М. Практика управления
человеческими ресурсами. – СПб:
Питер, 2010.
3. Кибанов А.Я. Основы управления
персоналом: Учебник. – М.: ИНФРА-

М, 2011.
4. Роббинз С.П. Основы
организационного поведения. – М.:
Вильямс, 2006.
5. Лютенс Ф. Организационное
поведение. – М.: ИНФРА-М, 1999.
Экономика впечатлений:
менеджмент в индустрии
гостеприимства и туризме
Исторические основы
менеджмента, функции
менеджмента, подходы
в менеджменте
Маркетинг
1. Дафт Р. Менеджмент. – СПб: Питер,
2011.
2. Котлер Ф., Армстронг Г. Основы
маркетинга: Профессиональное
издание. – М: ООО «ИД Вильямс»,
2009.
Однако для получения высших оценок за олимпиадное задание рекомендуется не
ограничиваться изучением только профильных дисциплин.
Например, успешно справиться с олимпиадным заданием, в котором
рассматриваются проблемы маркетинговых коммуникаций (дисциплина профиля
магистерской программы «Маркетинговые коммуникации и реклама в современном
бизнесе»), будет невозможно без знания основ маркетинга (дисциплина профиля
магистерской программы «Маркетинг»), а с заданием, в котором рассматриваются
вопросы стратегии и политики управления человеческими ресурсами (дисциплина
профиля магистерской программы «Управление человеческими ресурсами»), – без знания
основ стратегического управления (дисциплина профиля магистерской программы
«Стратегическое и корпоративное управление») и т.д.
Ответ (критический анализ научной статьи) должен быть хорошо
структурированным, логически последовательным и аргументированным.
При выполнении творческого задания участники олимпиады должны
продемонстрировать не только понимание текста статьи, широту знаний
соответствующих понятий, теорий, концепций, практических подходов, методов и
технологий, но и глубину их понимания, умение грамотно оперировать ими,
анализировать их взаимосвязь, а также логически связанно и аргументировано излагать
свою точку зрения, делать выводы, давать критическую оценку. Важными
характеристиками «отличного» ответа на творческое задание должны являться умение
излагать свои мысли в тексте в стилистике научных работ, а также владение методами
научной аргументации. Приветствуются ссылки на монографии, профессиональные
источники и литературу, их цитирование, а также практические примеры.
Для освоения специальной англоязычной терминологии по менеджменту см.
Сычева Л.В. Словарь менеджера (Manager’s vocabulary): пособие для изучающих «деловой
английский». – М.: Издательство ГУ-ВШЭ, 2003.
Во время выполнения олимпиадного задания участникам разрешается пользоваться
англо-русским словарем (но только печатным изданием, а не электронным).