Embed Size (px)
Citation preview
6 綠 帶 介 紹Introduction to 6 Green Belt
• Content1. 6 Quality System ---Why need
2. 6 --- Overview
3. 6 --- Methodology
3.1. 6 --- Define
3.2. 6 --- Measure
3.3. 6 --- Analysis
3.4. 6 --- Improve
3.5. 6 --- Control
4. Conclusion
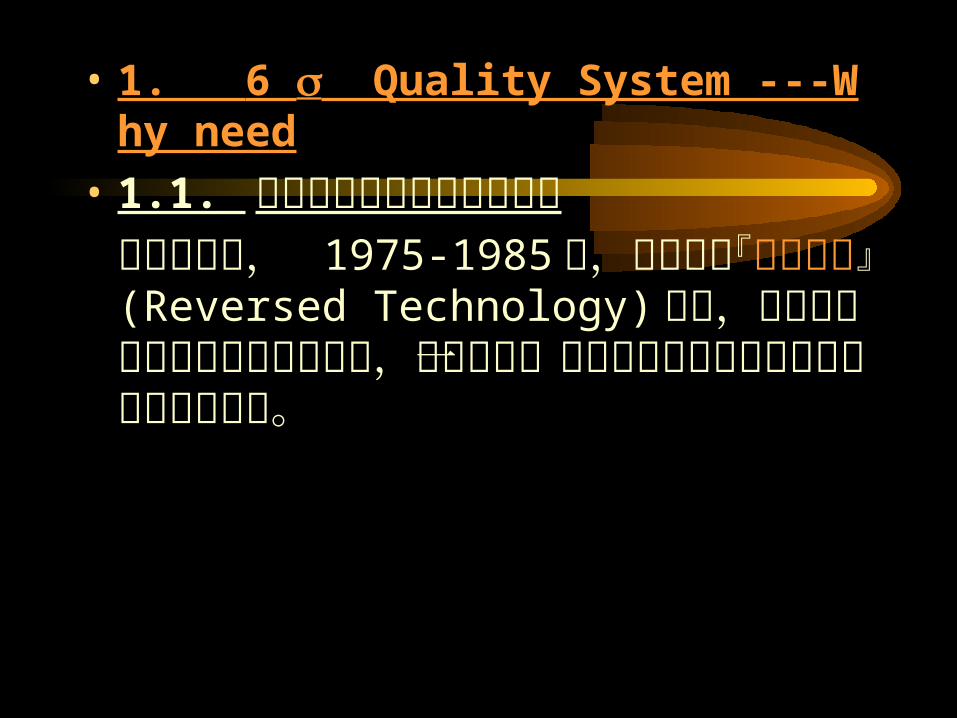
• 1. 6 Quality System ---Why need
• 1.1. 從產品飽受競爭威脅的觀點以美國為例, 1975-1985 年,日本挾其『反向技術』 (Reversed Technology) 優勢,將其高品質的產品推向美洲大陸,使得美國一向以經濟與技術領先的盟主地位發生動搖。
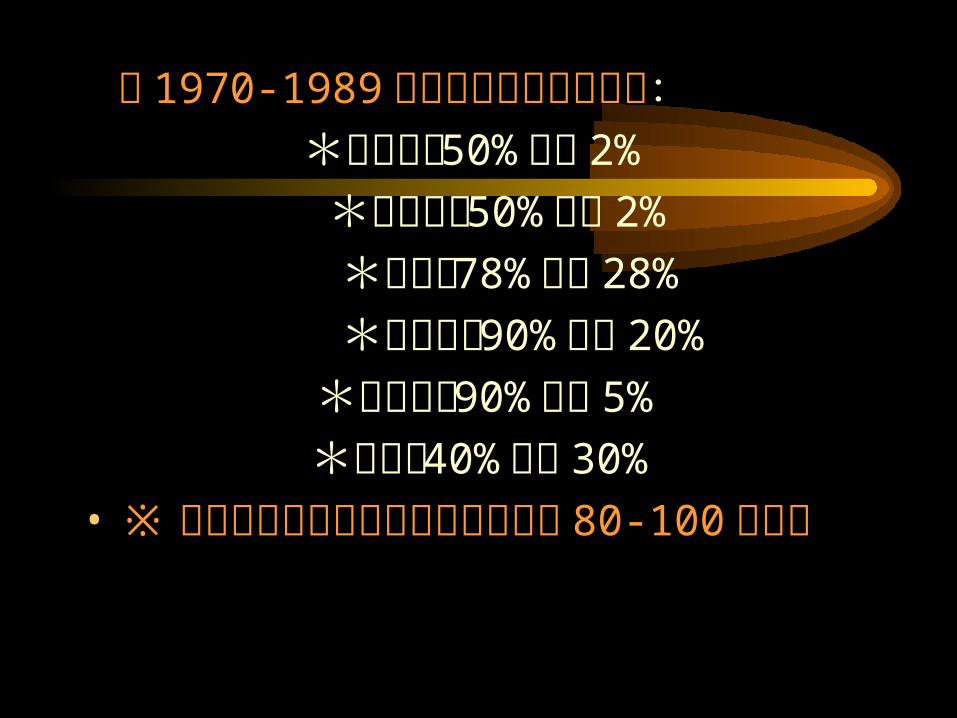
在 1970-1989 年間美國的市場佔有率: *電視機從 50% 降至 2%
*收音機從 50% 降至 2%
*汽車從 78% 降至 28%
*影印機從 90% 降至 20%
*照相機從 90% 降至 5%
*鋼鐵從 40% 降至 30%
• ※ 其結果造成美國貿易赤字每月高達 80-100 億美元
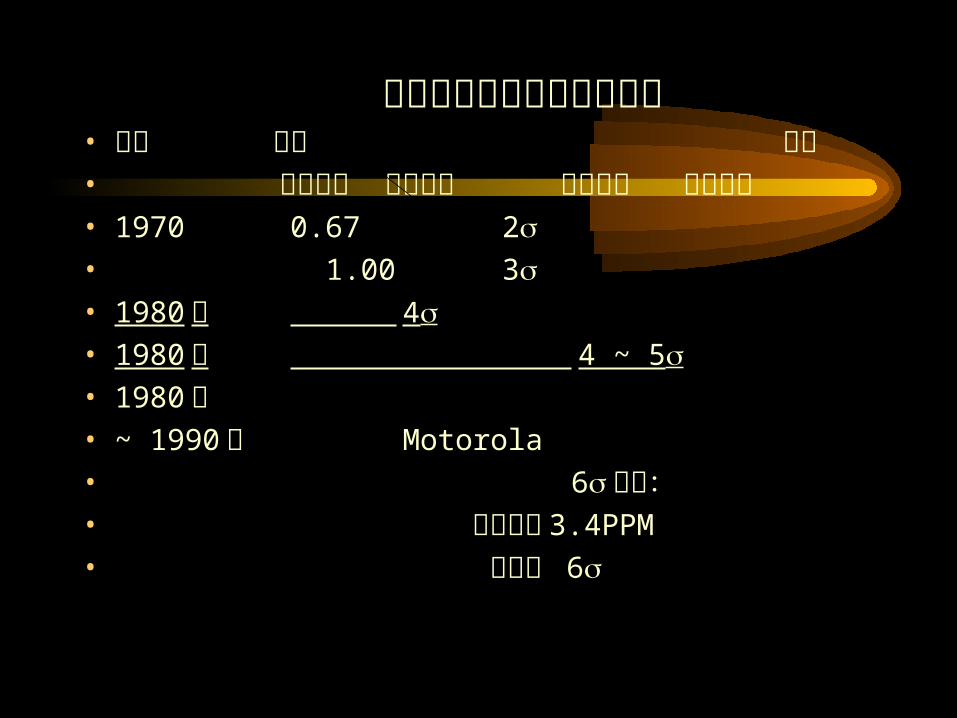
美國與日本製程能力之比較• 年代 美國 日本• 製程能力 品質水準 製程能力 品質水
準• 1970 0.67 2• 1.00 3• 1980 初 4• 1980 中 4 ~ 5
• 1980 末• ~ 1990 初 Motorola
• 6方法:• 不合格率 3.4PPM
• 相當於 6
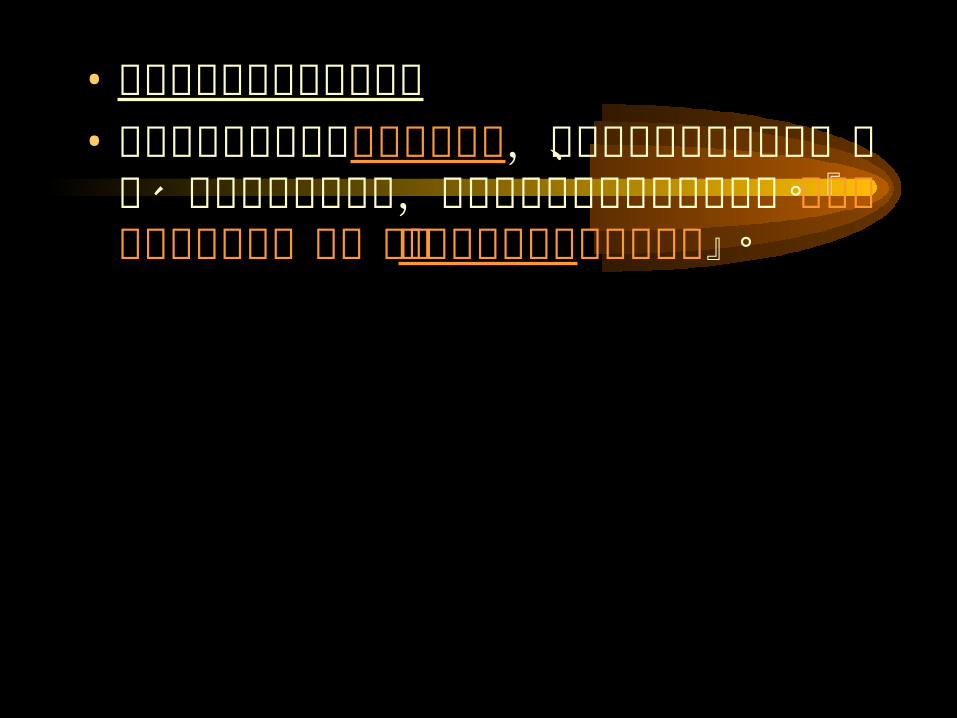
• 美國企業競爭力衰退的原因• 美國管理文化中含有不信任的氣氛,這種表現在嚴格的審核、管制、檢查的管理制度上,無形造成過度的管理成本上漲。『這種管理監督的作風,大體受到泰勒式科學管理影響的結果』。
• 日本經營之神松下幸之助在一次對美國企業界人士發表演說,提到:『你們的公司經營是以泰勒法則為基礎,更糟的是頭腦皆已泰勒化,因此堅信正確的管理,應是管理者在一邊,工人在另一邊,一邊的人只管思考,另一邊的只管工作。給你們一句忠告:「管理是執行者將觀念轉移到員工身上的一種藝術」』。
• 因此美國開始檢討其品質,各種品質系統亦相繼提出,其中包含 6 品質系統。
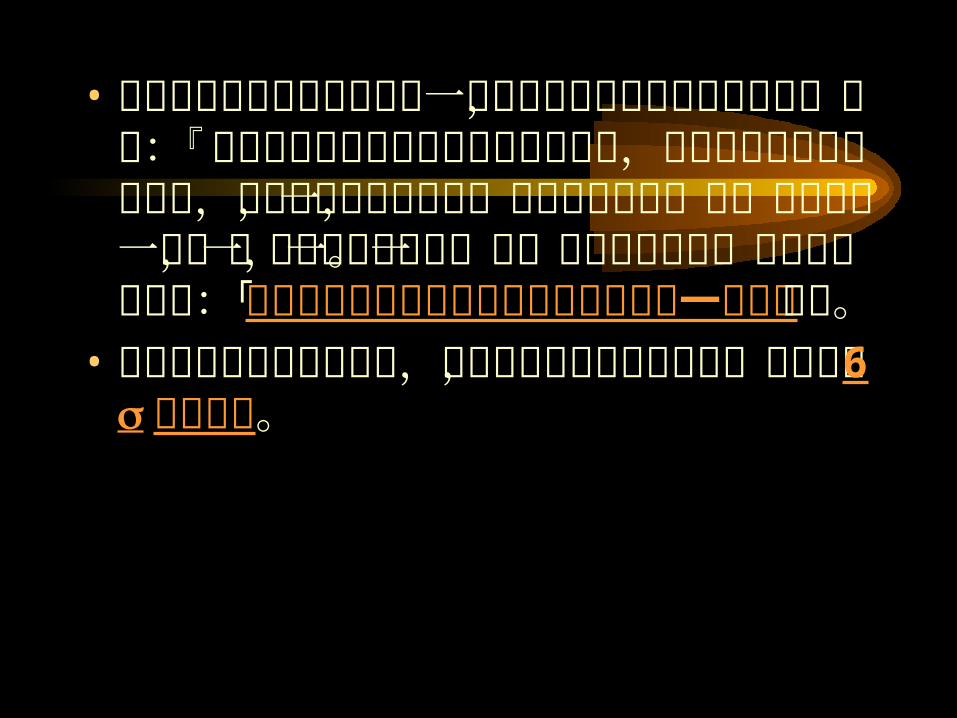
• 1.2. 由需求的觀點• 在 70 年代,產品達到 2 便達到標準。 在 80 年代,品質要求已提升至 3 ,但此標準美國會發生以下事件:
• ※每年有 20,000 次配錯藥事件• ※每年有超過 15,000 個嬰兒出生時會 被拋落地上
• ※每年平均有 9 小時沒有水、電、暖氣供應
• ※每星期有 500 宗做錯手術事件
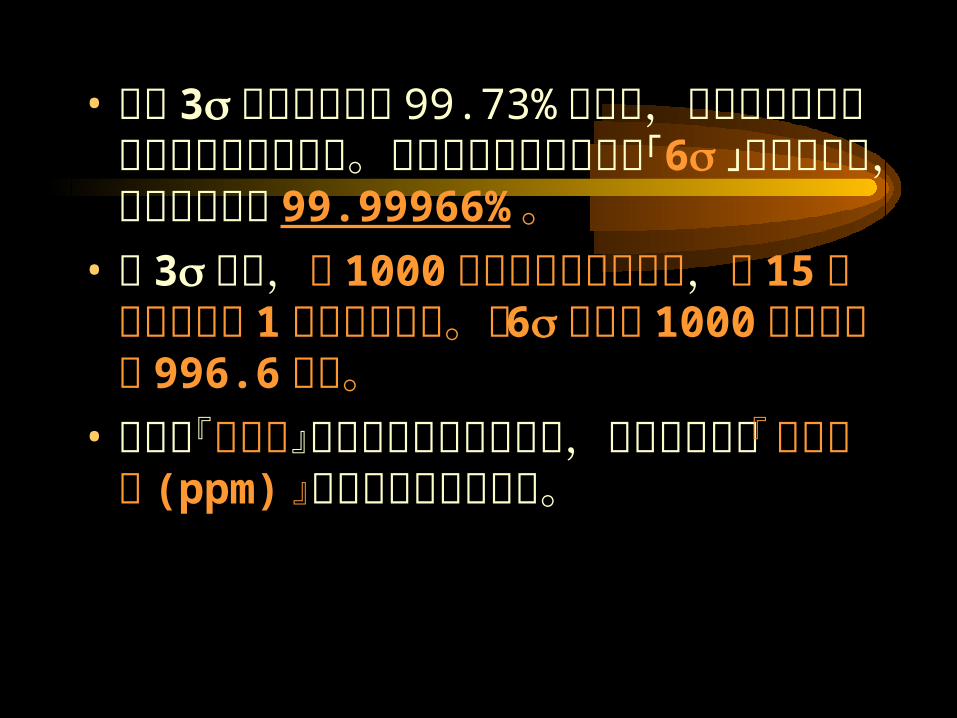
• 雖然 3 合格率已達到 99.73% 的水平,但相信各位對以上品質要求並不滿意。所以有很多公司已要求「 6 」的品質管理,其合格品率為 99.99966% 。
• 在 3 水準,由 1000 個零件組成的產品中,每 15 個產品中只有 1 個產品是好的。在 6 水準則 1000 個產品卻有 996.6 好的。
• 傳統以『百分率』水準作為設計品質水準,如今變更為以『百萬分率 (ppm) 』作為衡量品質的水準。
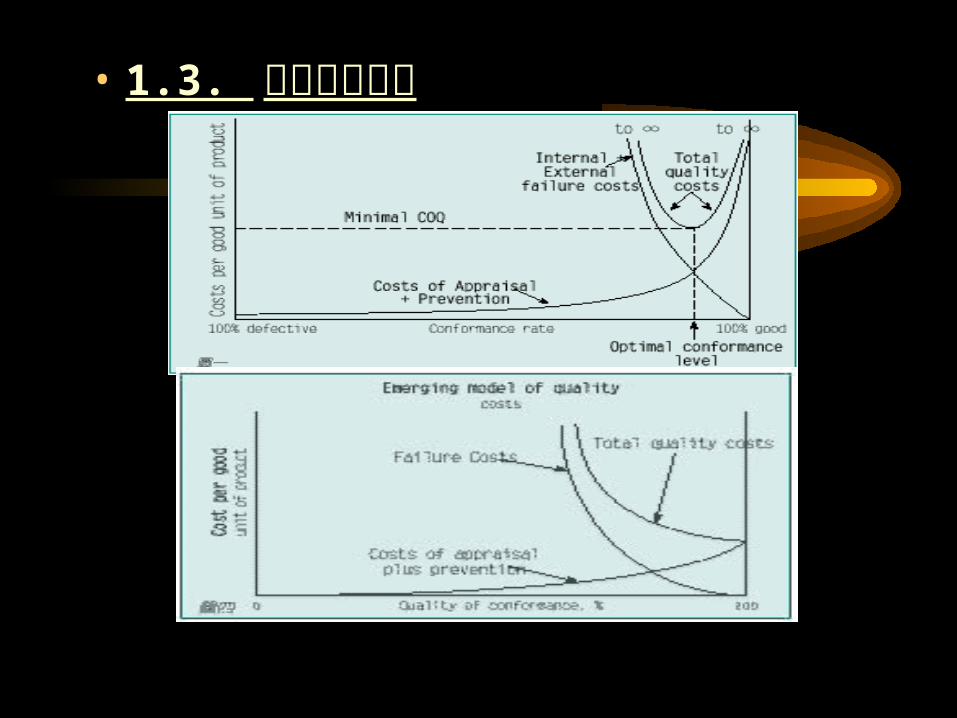
• 1.3. 從成本的觀點
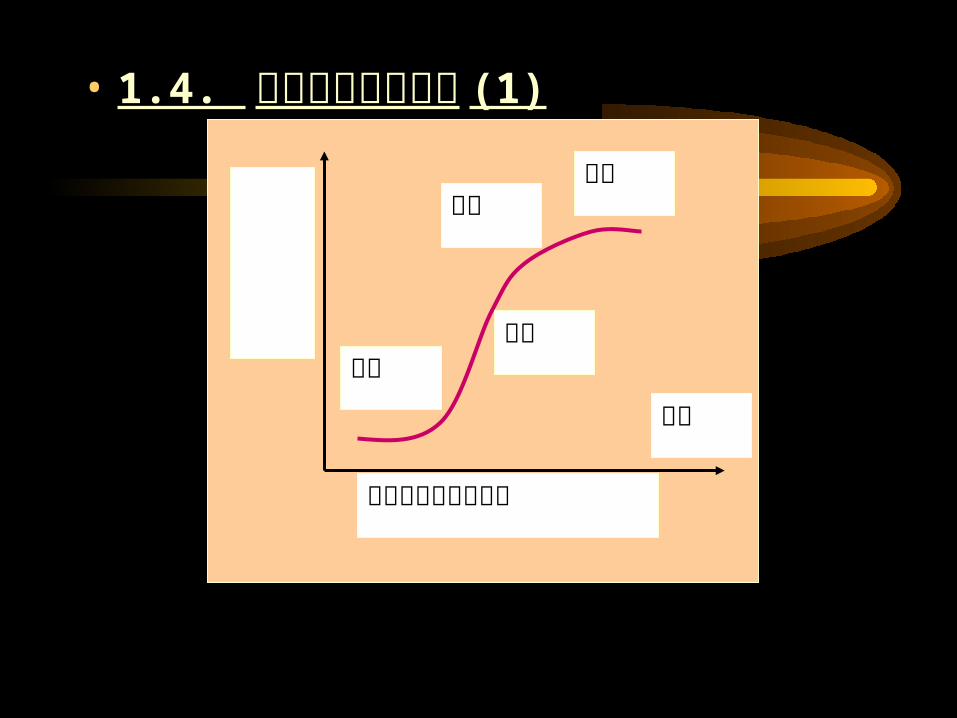
• 1.4. 從時代趨勢的觀點 (1)
時間
經濟附加價值
開端成長
成熟衰退
典型的產品生命週期
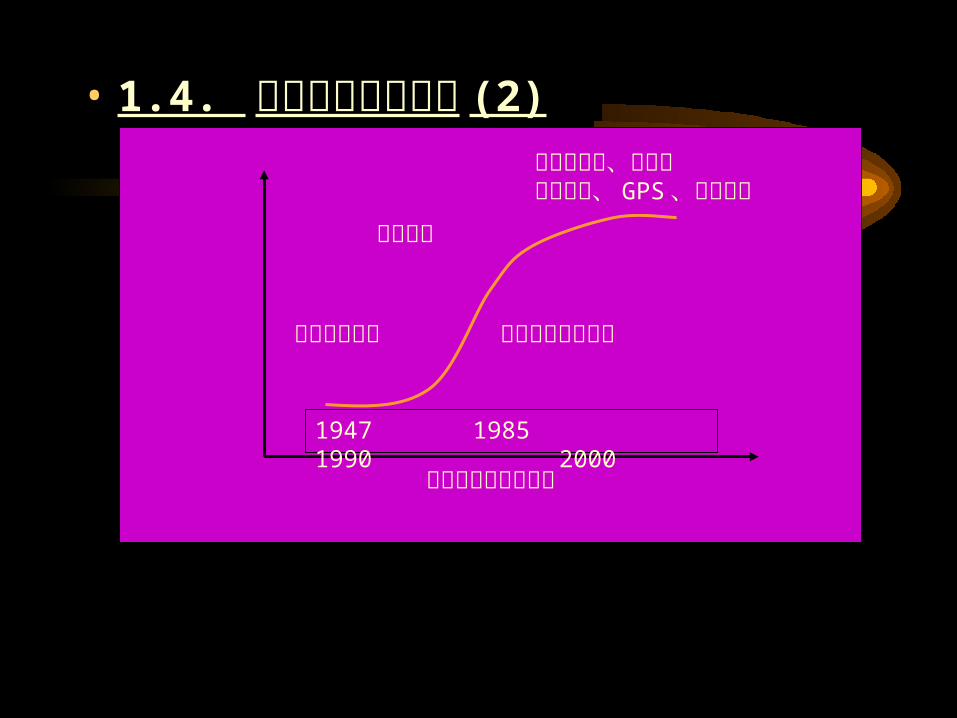
• 1.4. 從時代趨勢的觀點 (2)
經濟附加價值 大型電腦主
機迷你電腦與微電腦
個人電腦
掌上型電腦、電子書網路電視、 GPS 、行動電話
電腦晶片的生命週期
1947 1985 1990 2000
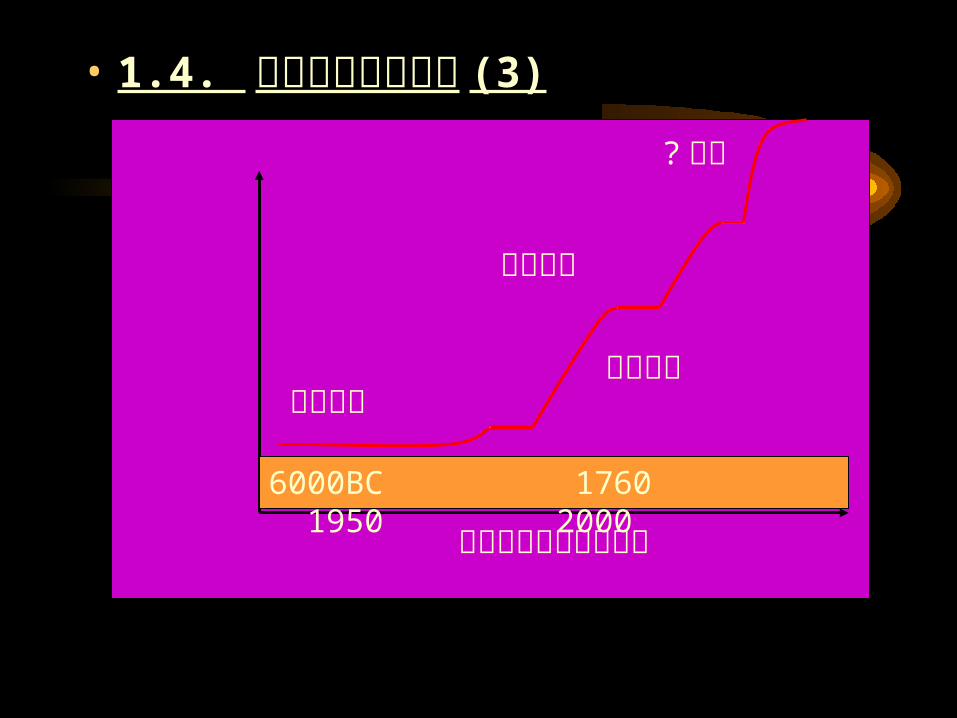
• 1.4. 從時代趨勢的觀點 (3)
全球化與經濟附加價
值
農業時代工業時代
資訊時代
? 時代
時間與主要的技術時代
6000BC 1760 1950 2000
• 1.5. 從品管大師的觀點• J. M. Juran, 1994 年在美國品質管理學會年會會上說 ,“20 世紀以生產力的世紀載入史冊 , 未來 21 世紀是品質的世紀”
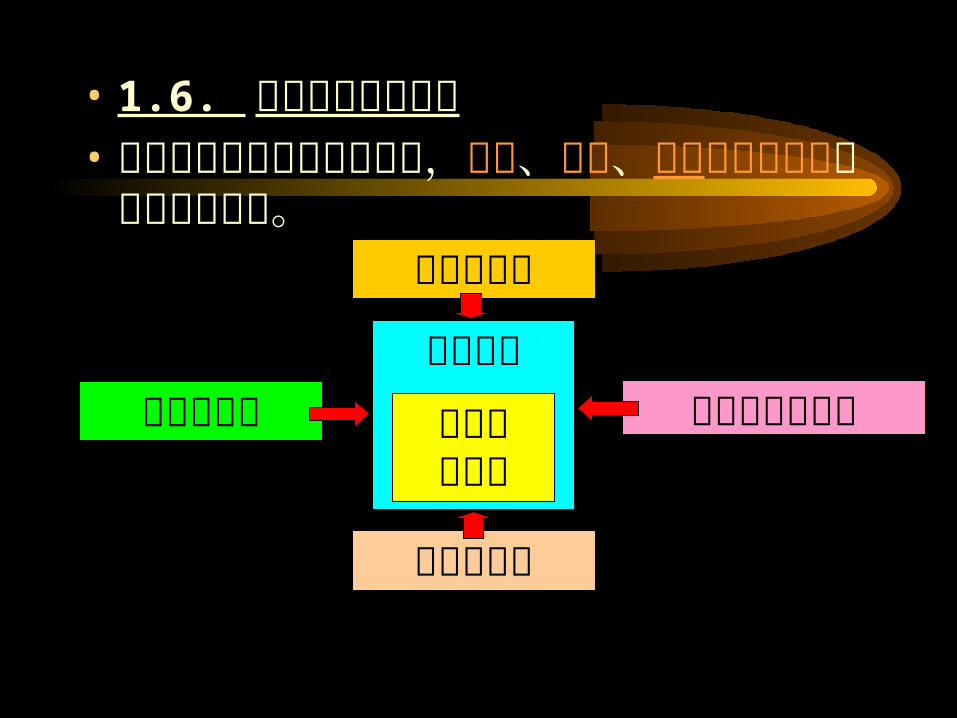
• 1.6. 從策點管理的觀點• 欲建立及維持組織競爭優勢,效率、創新、品質及顧客回應扮演著主要角色。
較佳的效率競爭優勢
低成本差異化
較佳的創新
較佳的品質
較佳的顧客回應
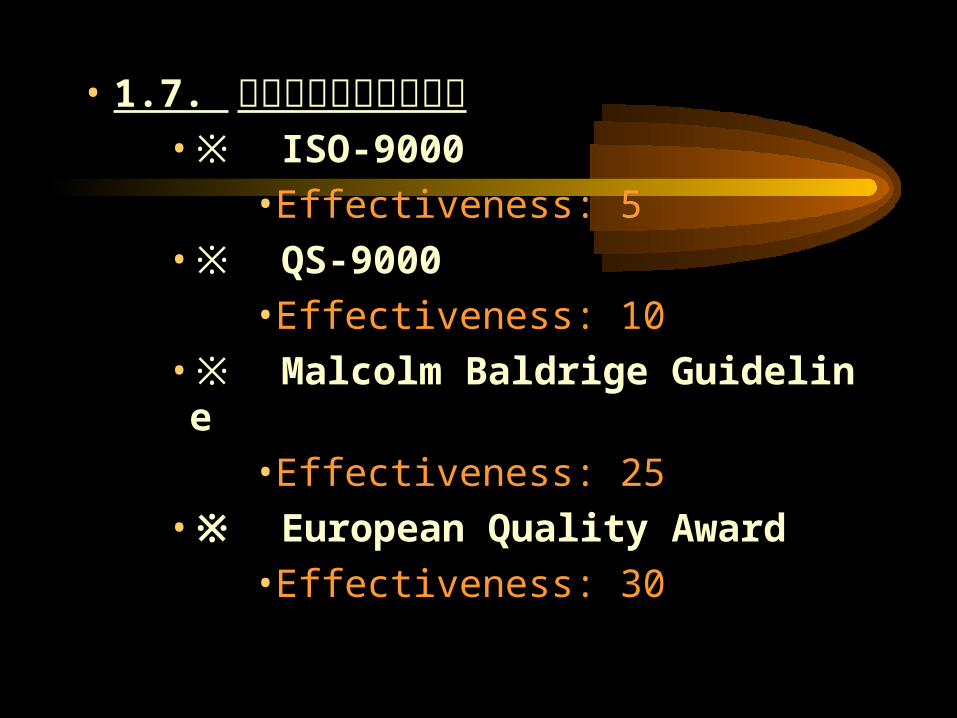
• 1.7. 從近代品質系統的觀點• ※ ISO-9000
• Effectiveness: 5
•※ QS-9000
• Effectiveness: 10
• ※ Malcolm Baldrige Guideline
• Effectiveness: 25
• ※ European Quality Award
• Effectiveness: 30
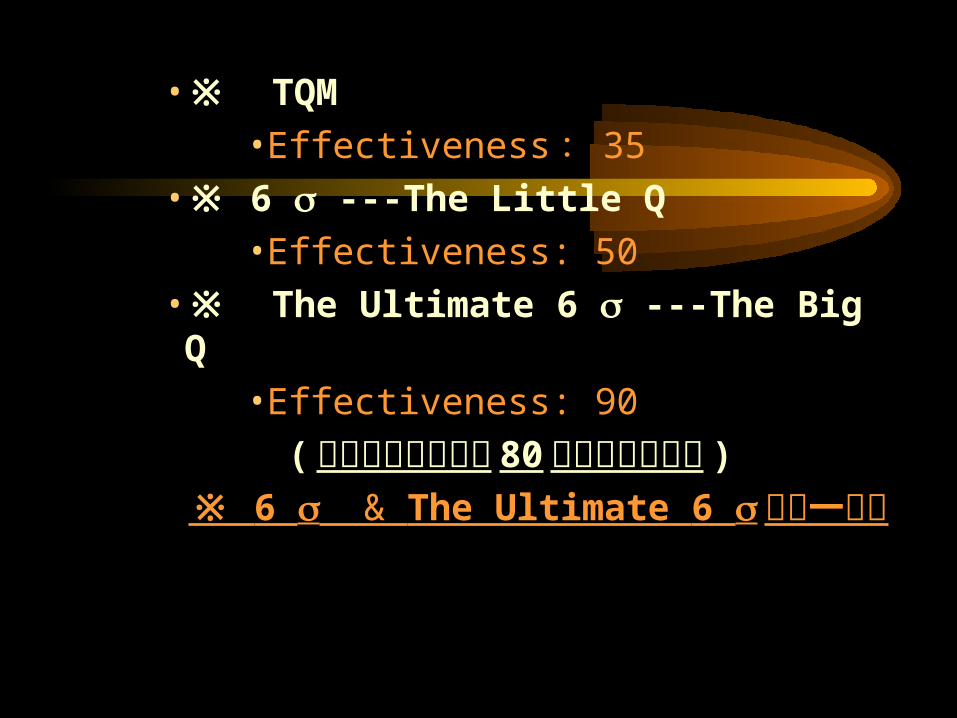
• ※ TQM• Effectiveness : 35
• ※ 6 ---The Little Q• Effectiveness: 50
• ※ The Ultimate 6 ---The Big Q• Effectiveness: 90
( 上述品質系統均於 80 年代末期開展出 )
※ 6 & The Ultimate 6 將是一趨勢
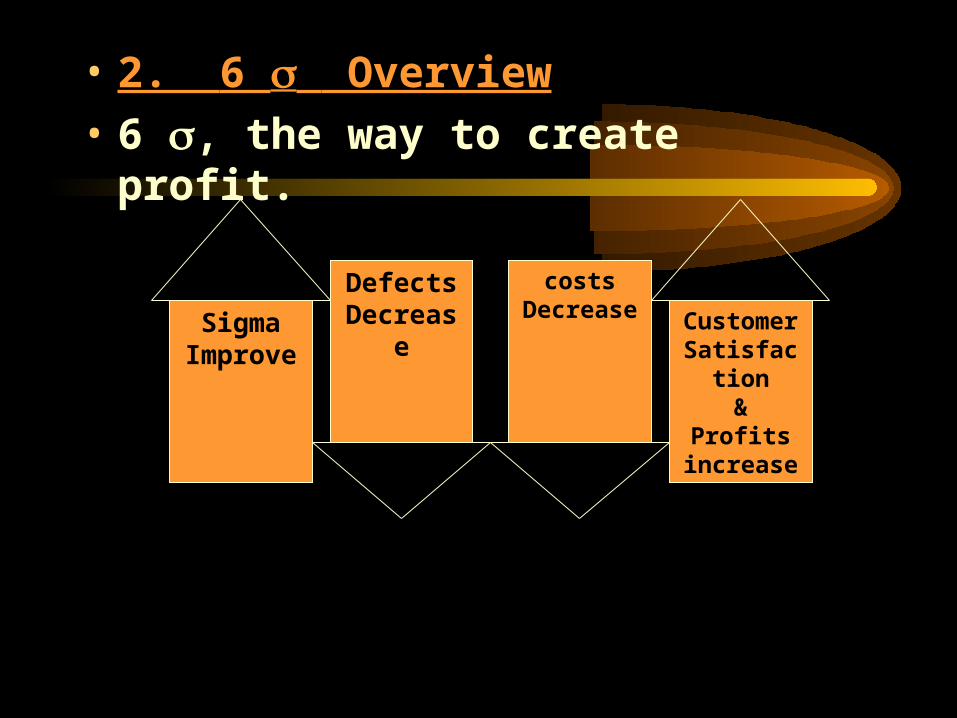
• 2. 6 Overview
• 6 , the way to create profit.
SigmaImprove
Customer Satisfaction
&Profits
increase
DefectsDecrease
costsDecrease
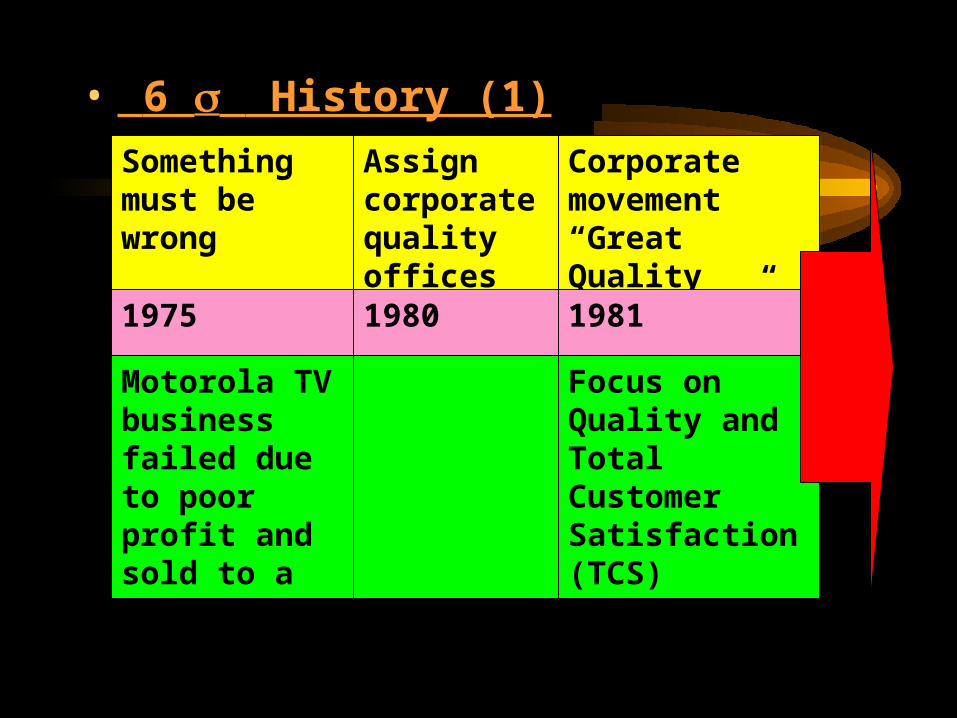
• 6 History (1)
Something must be wrong
1975
Motorola TV business failed due to poor profit and sold to a Japanese Company
Assign corporate quality offices1980
Corporate movement “Great Quality Awakening” program1981
Focus on Quality and Total Customer Satisfaction (TCS)
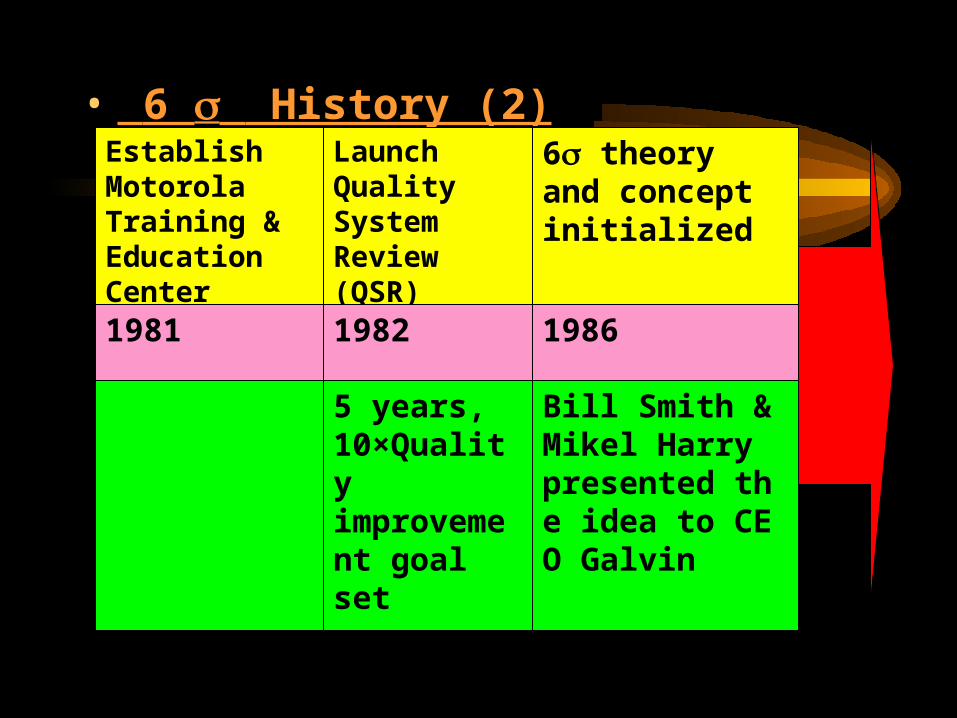
• 6 History (2)Establish Motorola Training & Education Center1981
Launch Quality System Review (QSR) program1982
5 years, 10×Quality improvement goal set
6 theory and concept initialized
1986
Bill Smith & Mikel Harry presented the idea to CEO Galvin
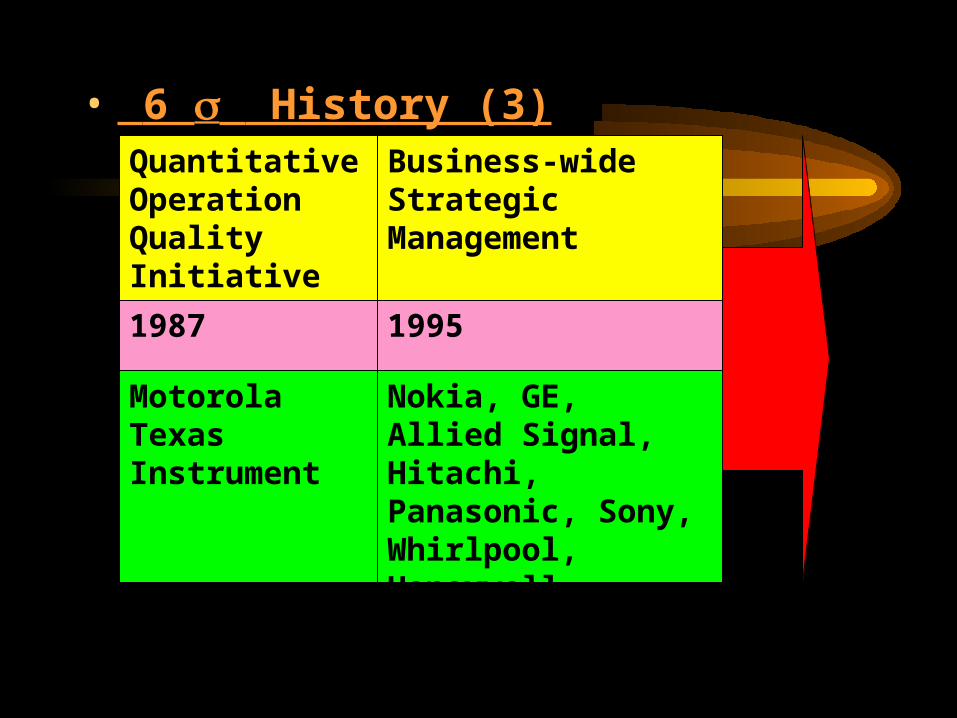
• 6 History (3)Quantitative Operation Quality Initiative
1987
Motorola Texas Instrument
Business-wide Strategic Management
1995
Nokia, GE, Allied Signal, Hitachi, Panasonic, Sony, Whirlpool, Honeywell, Boeing, Dupont
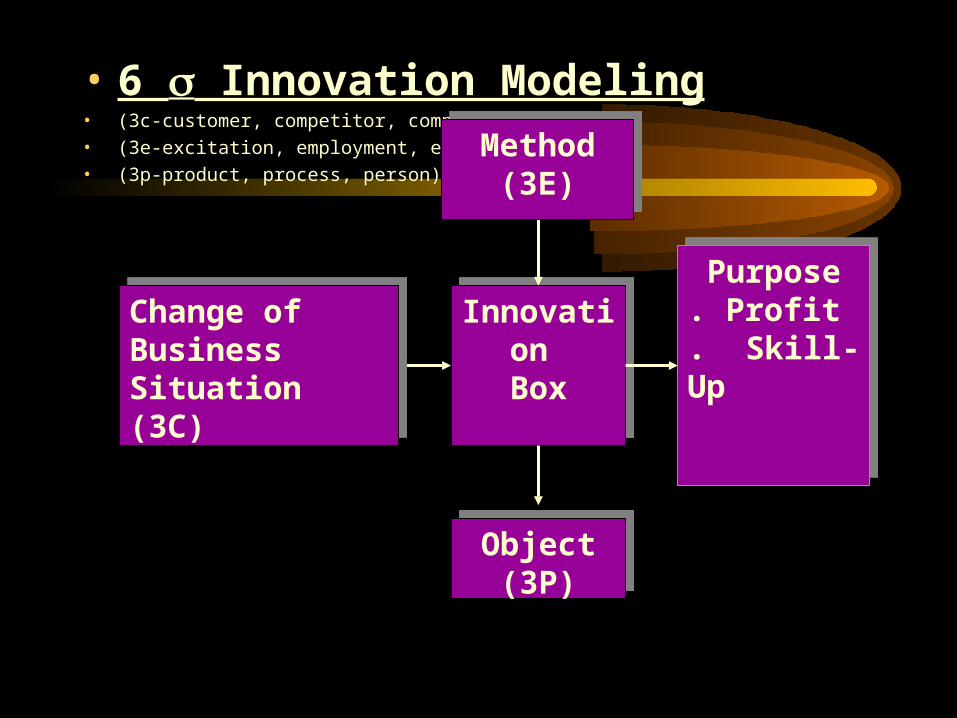
• 6 Innovation Modeling• (3c-customer, competitor, company)
• (3e-excitation, employment, entertainment)
• (3p-product, process, person)
Innovation Box
Innovation Box
Change of Business Situation (3C)
Change of Business Situation (3C)
Object (3P)
Object (3P)
Method (3E)Method (3E)
Purpose. Profit. Skill-Up
Purpose. Profit. Skill-Up
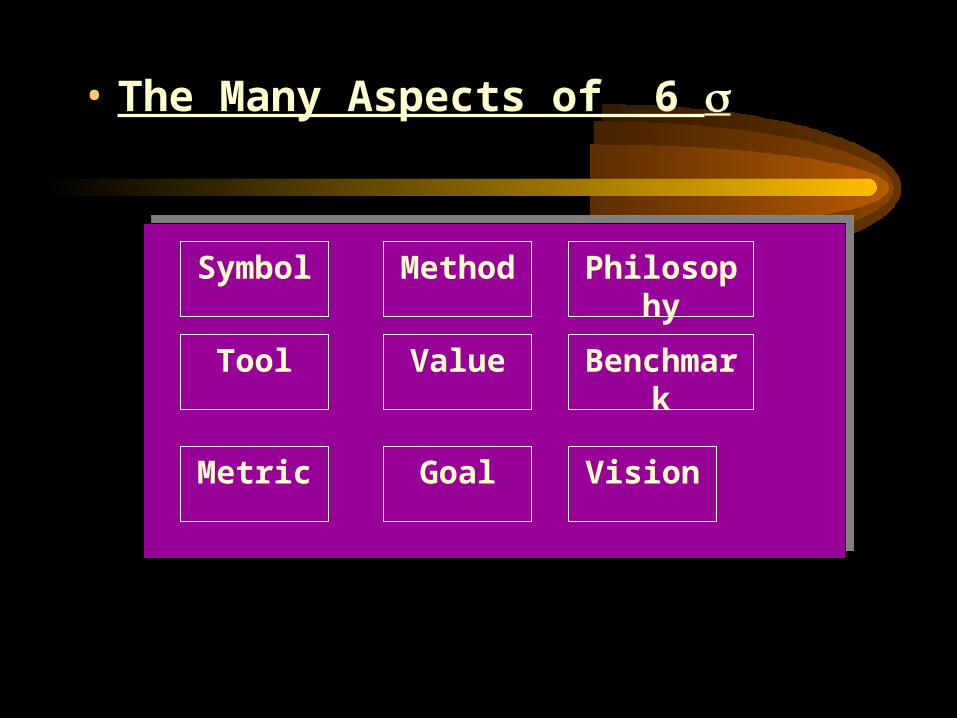
• The Many Aspects of 6
Tool
Symbol
Metric
Method
Value
Goal Vision
Benchmark
Philosophy
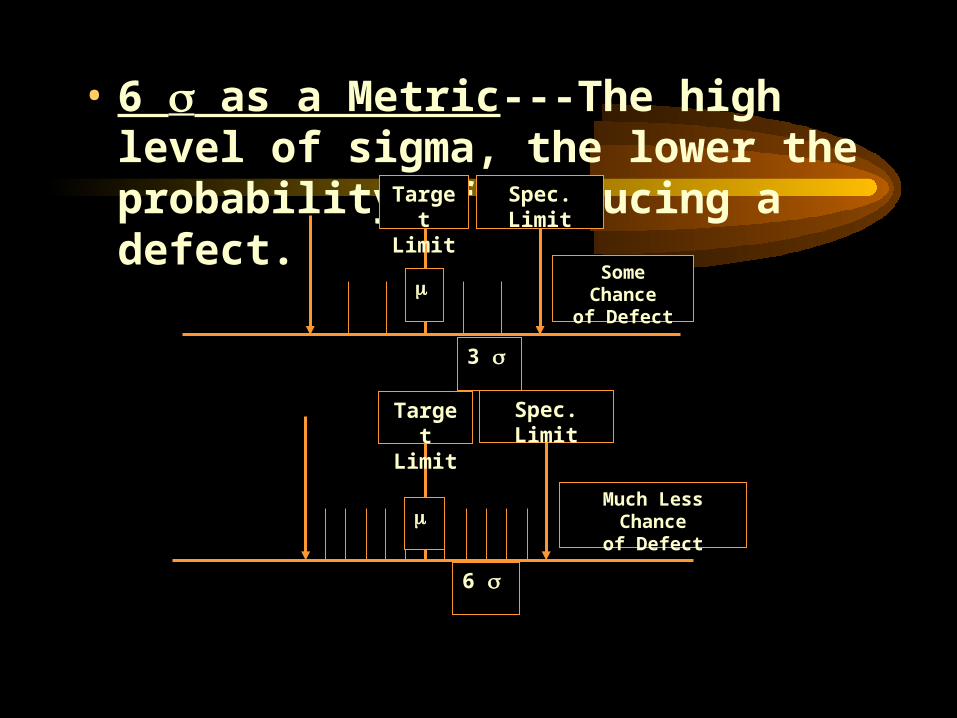
• 6 as a Metric---The high level of sigma, the lower the probability of producing a defect. Spec. LimitTarget
Limit
Some Chanceof Defect
3
Spec. LimitTarget Limit
Much Less Chanceof Defect
6
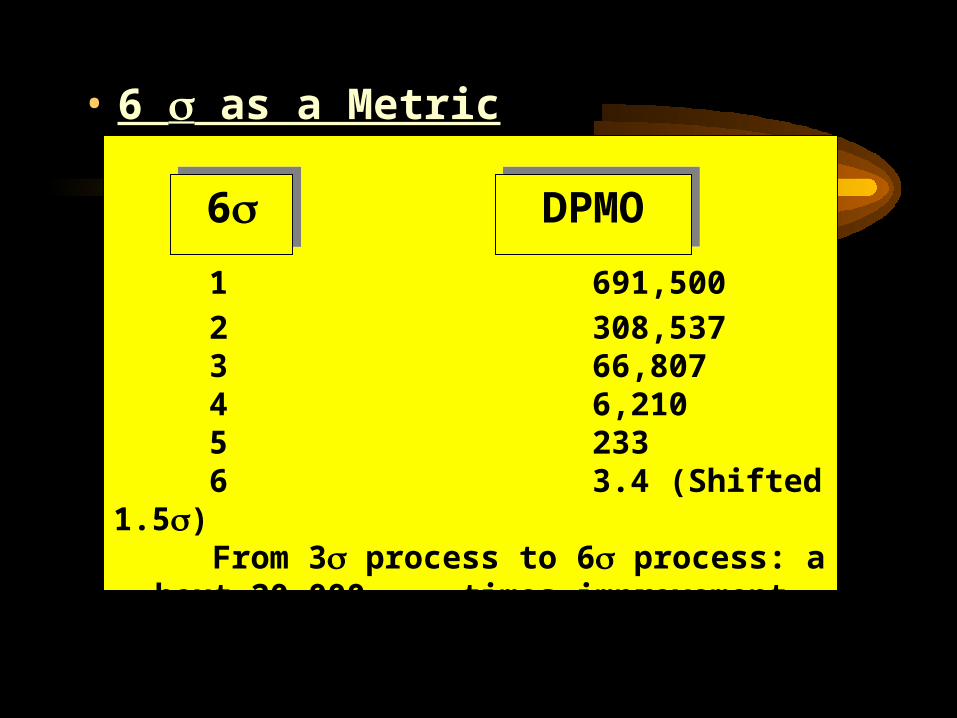
• 6 as a Metric
1 691,500
2 308,5373 66,8074 6,2105 2336 3.4 (Shifted 1.5)From 3 process to 6 process: about 20,000
times improvement
66 DPMODPMO
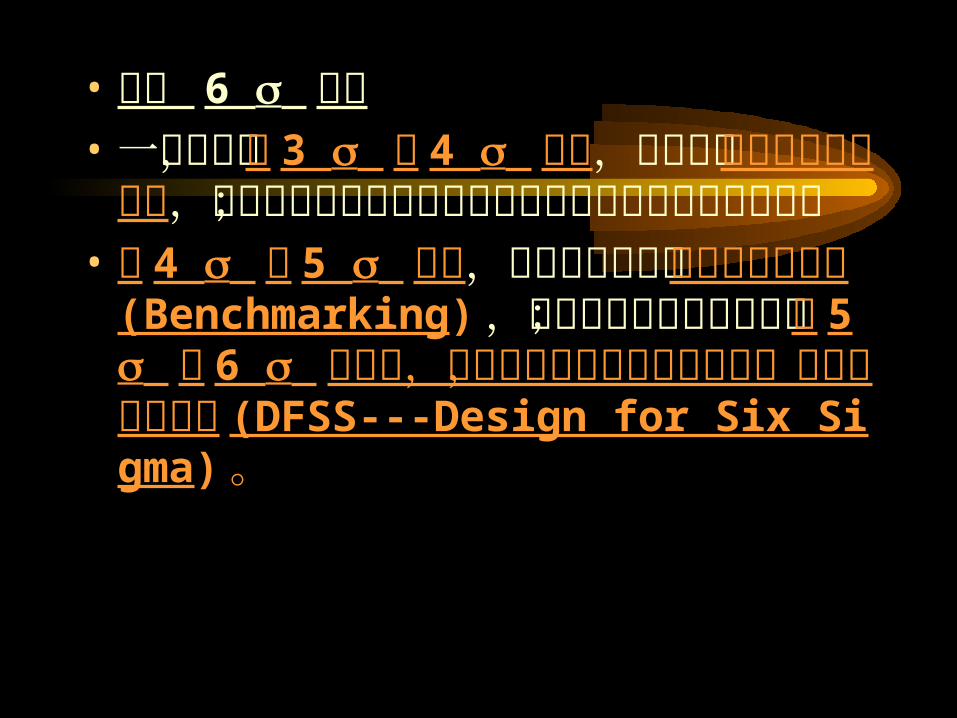
• 如何 6 導入• 一般來說,從 3 到 4 階段,是企業可以自行改善的範圍,但這樣的品質標準並沒有辦法讓企業變得很有競爭力;
• 從 4 到 5 階段,就必須找尋可以學習的標竿企業 (Benchmarking) ,當成比較與學習的對象;而 5 到 6 階段時,品質就已經不是製造出來的,而是設計出來的 (DFSS---Design for Six Sigma) 。
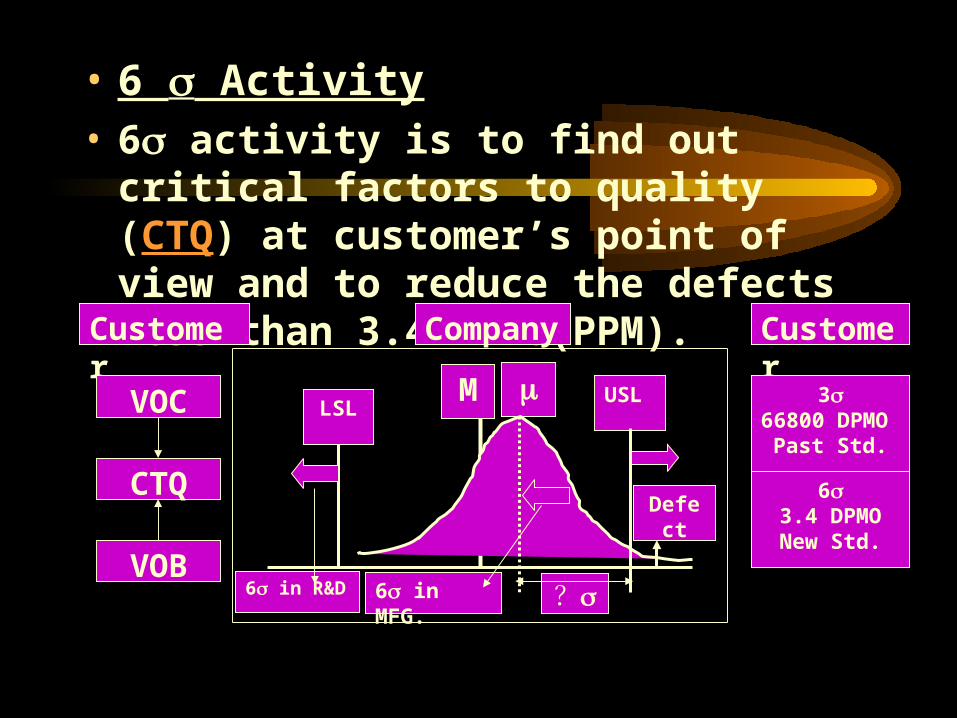
• 6 Activity• 6 activity is to find out critical factors to
quality (CTQ) at customer’s point of view and to reduce the defects less than 3.4 DPMO(PPM).
LSLUSL
?
Defect
M
6 in R&D 6 in MFG.
CompanyCustomer Customer
CTQ
VOC
VOB
63.4 DPMONew Std.
366800 DPMO
Past Std.
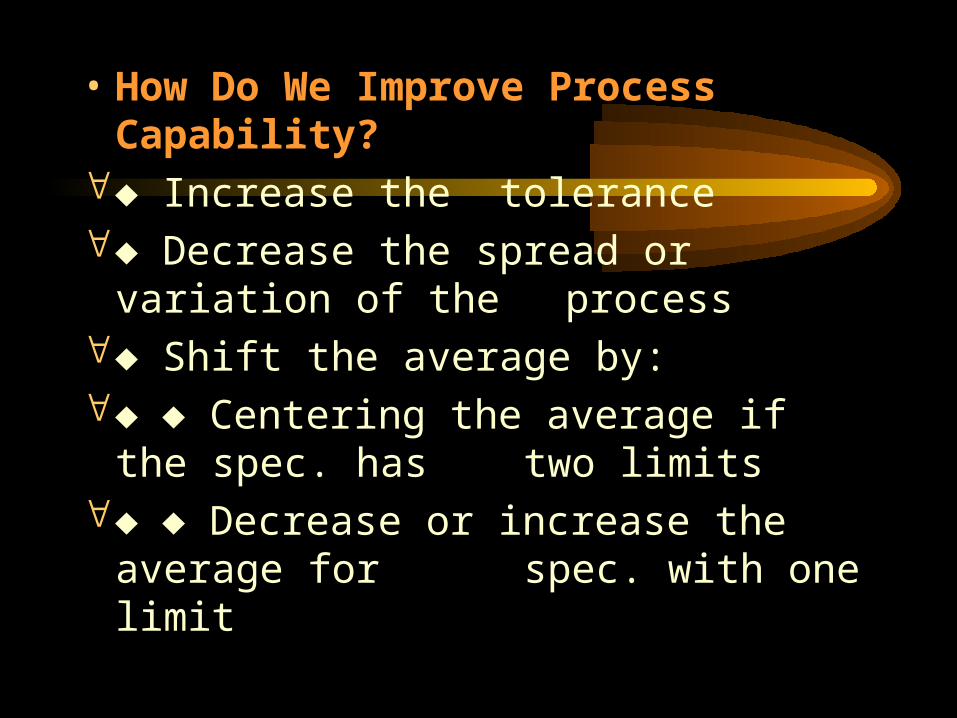
• How Do We Improve Process Capability?
Increase the tolerance Decrease the spread or variation of the
process Shift the average by: Centering the average if the spec. has
two limits Decrease or increase the average for
spec. with one limit
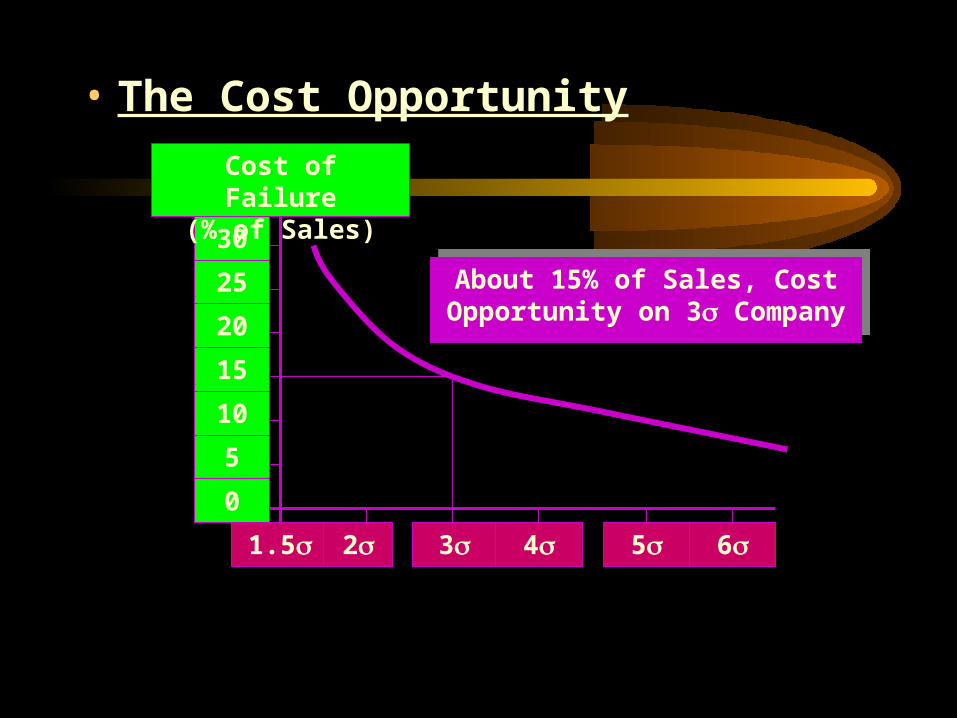
• The Cost Opportunity
1.5 2 3 4 5 6
0
5
10
15
20
25
30About 15% of Sales, Cost
Opportunity on 3 CompanyAbout 15% of Sales, Cost
Opportunity on 3 Company
Cost of Failure(% of Sales)
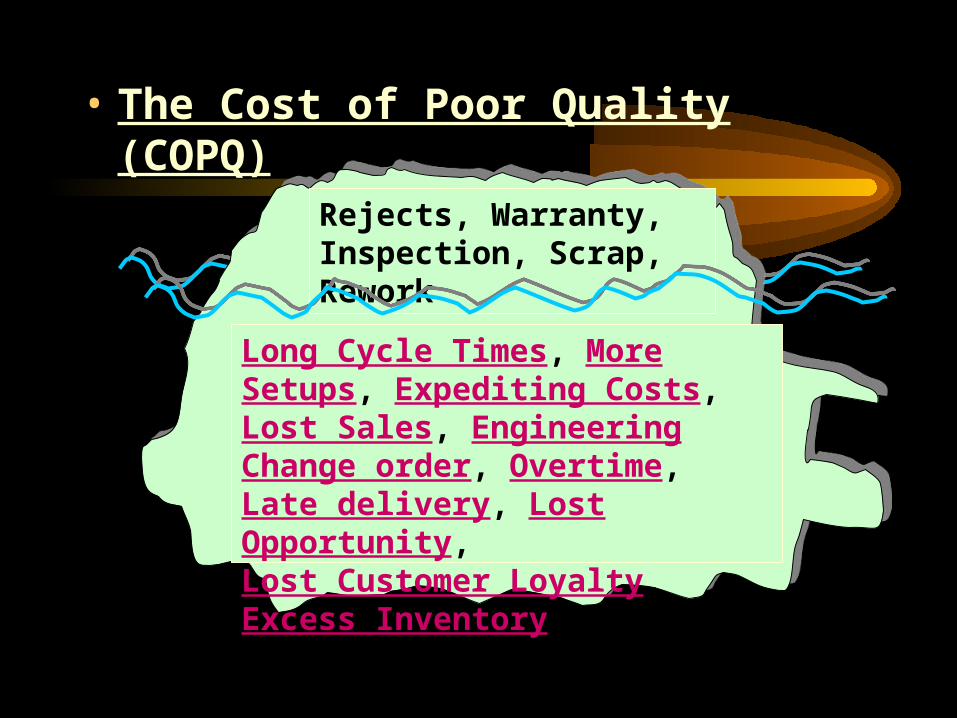
• The Cost of Poor Quality (COPQ)
Long Cycle Times, More Setups, Expediting Costs, Lost Sales, Engineering Change order, Overtime, Late delivery, Lost Opportunity,Lost Customer Loyalty, Excess Inventory
Rejects, Warranty, Inspection, Scrap, Rework
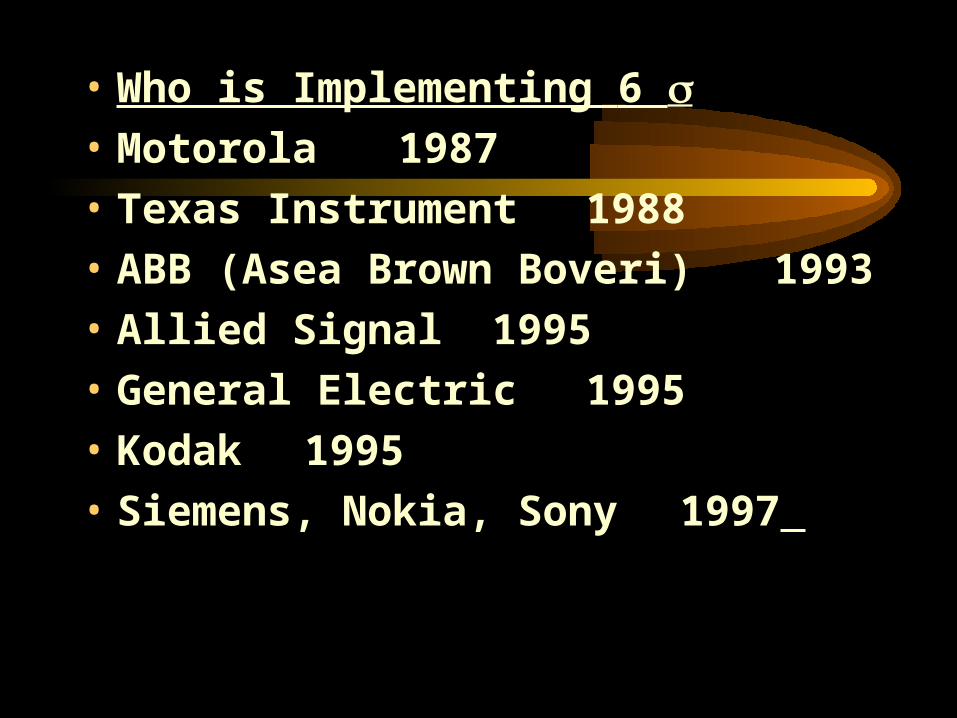
• Who is Implementing 6 • Motorola 1987
• Texas Instrument 1988
• ABB (Asea Brown Boveri) 1993
• Allied Signal 1995
• General Electric 1995
• Kodak 1995
• Siemens, Nokia, Sony 1997
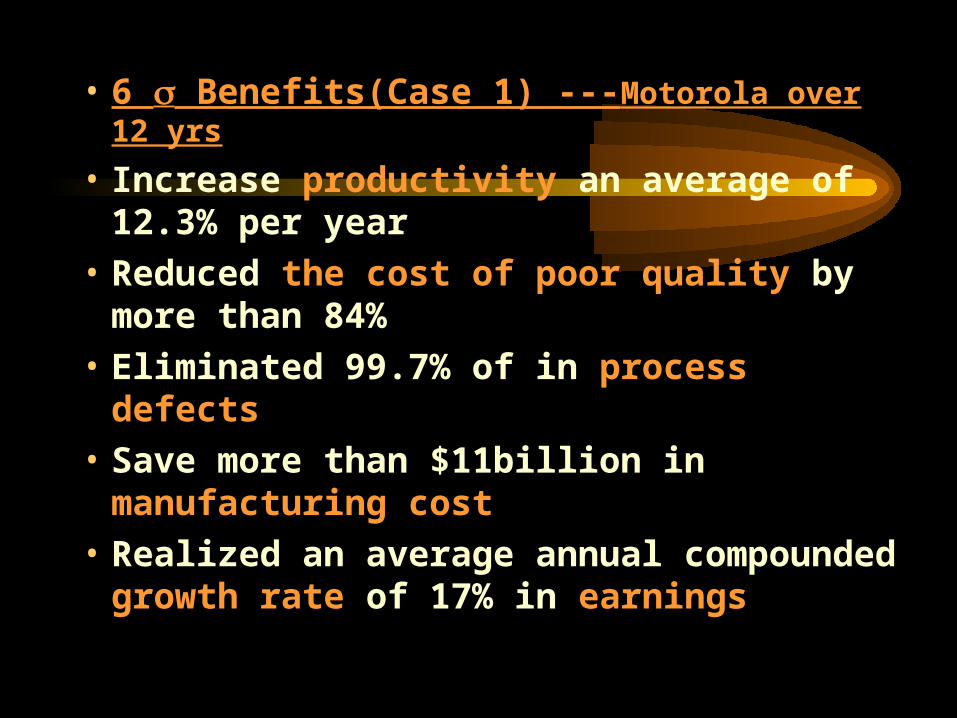
• 6 Benefits(Case 1) ---Motorola over 12 yrs
• Increase productivity an average of 12.3% per year
• Reduced the cost of poor quality by more than 84%
• Eliminated 99.7% of in process defects
• Save more than $11billion in manufacturing cost
• Realized an average annual compounded growth rate of 17% in earnings
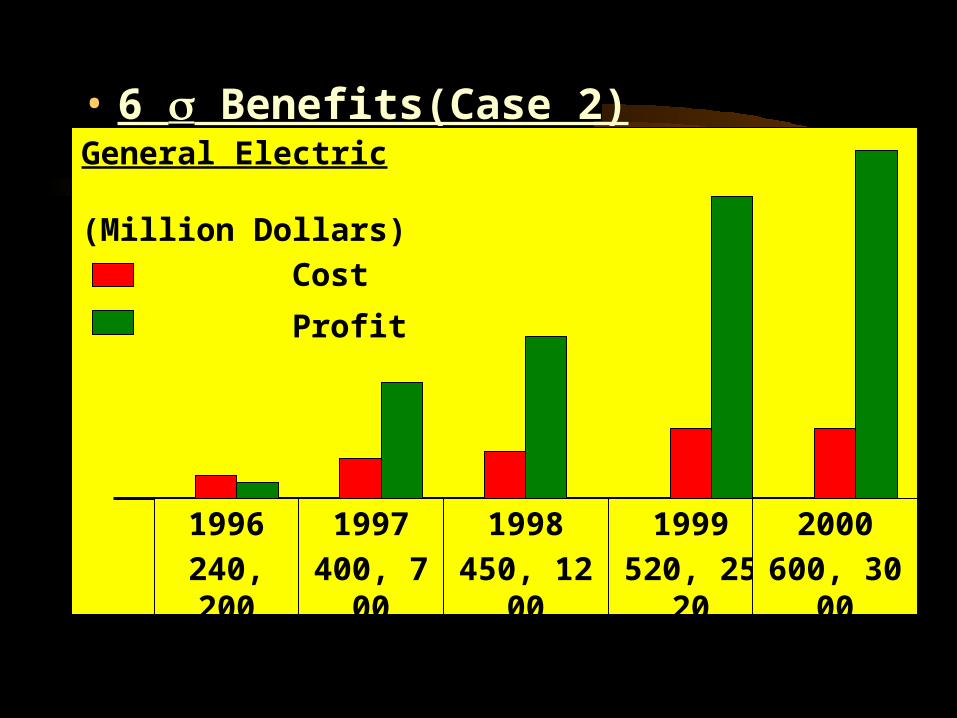
• 6 Benefits(Case 2)General Electric
(Million Dollars)
Cost
Profit
1996
240, 200
1997
400, 700
1998
450, 1200
1999
520, 2520
2000
600, 3000
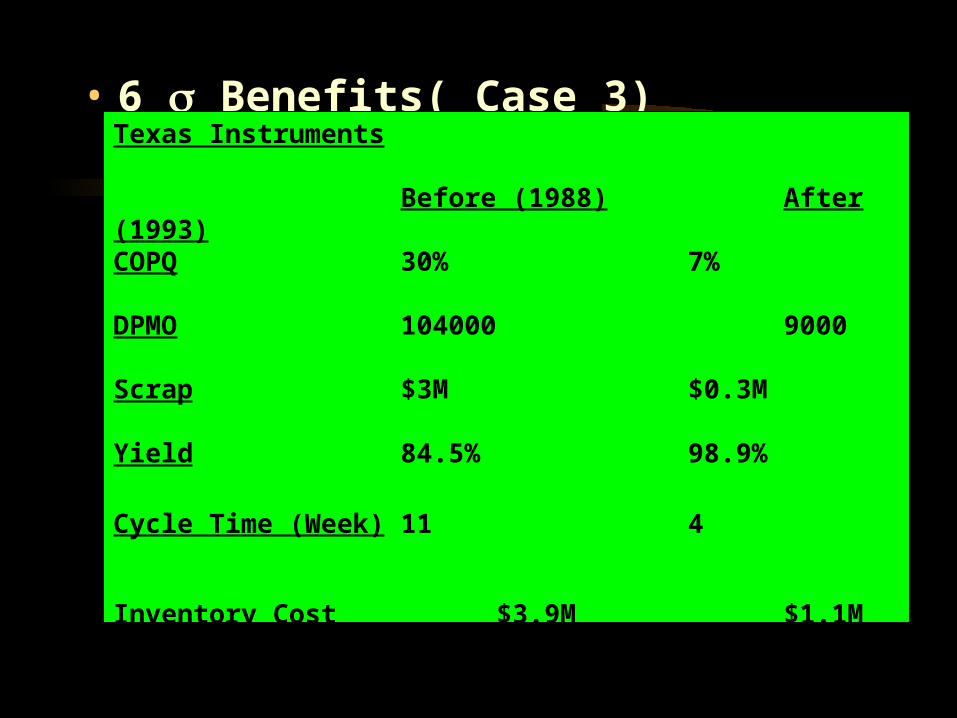
• 6 Benefits( Case 3)Texas Instruments
Before (1988) After (1993)COPQ 30% 7%
DPMO 104000 9000
Scrap $3M $0.3M
Yield 84.5% 98.9%
Cycle Time (Week) 11 4
Inventory Cost $3.9M $1.1M
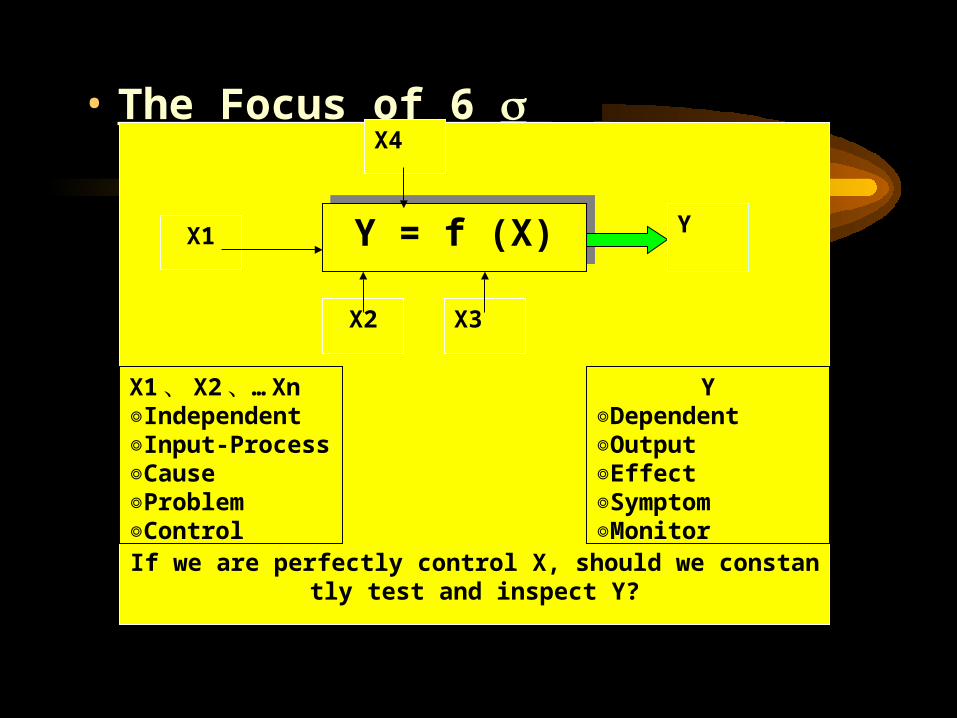
• The Focus of 6
If we are perfectly control X, should we constantly test and inspect Y?
Y = f (X)Y = f (X) YX1
X2 X3
X4
X1、 X2、… Xn◎Independent◎Input-Process◎Cause◎Problem◎Control
Y◎Dependent◎Output◎Effect◎Symptom◎Monitor
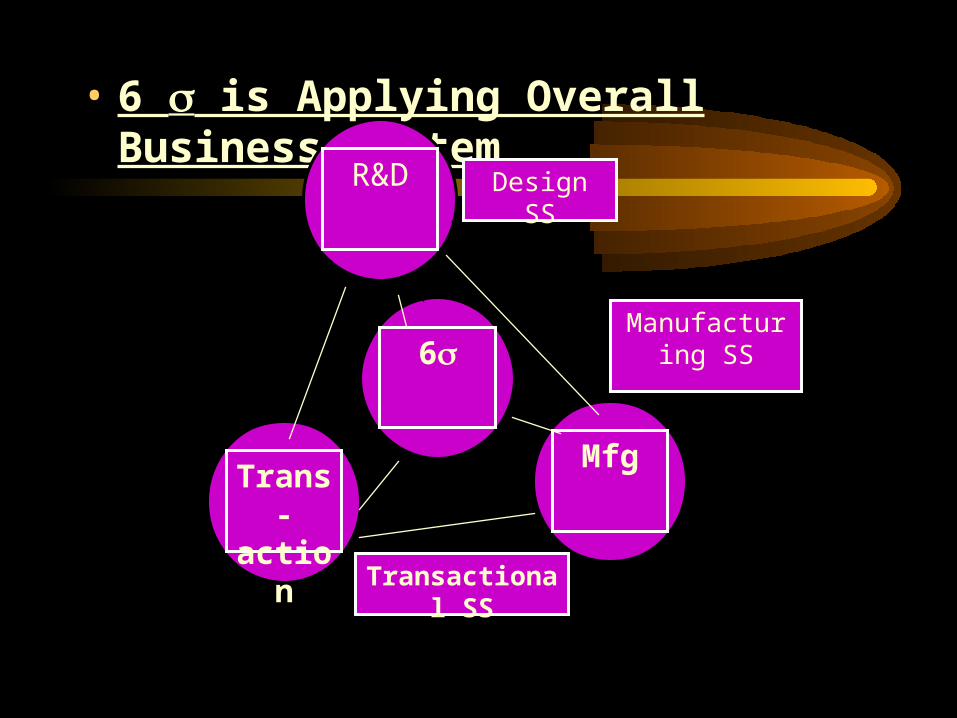
• 6 is Applying Overall Business System
R&D
6
Trans-action
Mfg
Design SS
Manufacturing SS
Transactional SS
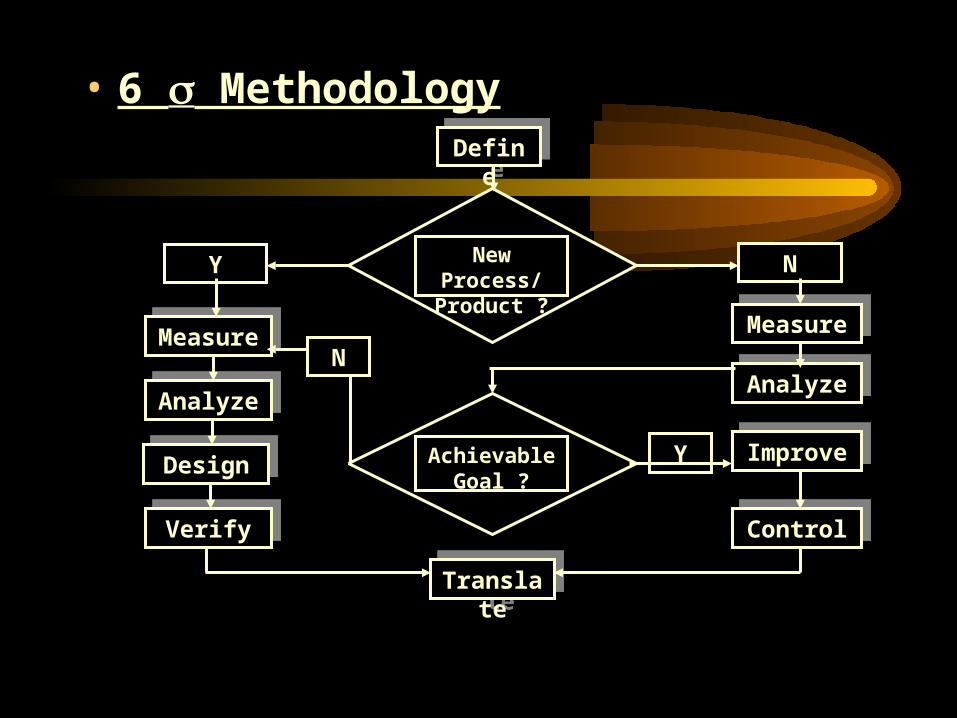
• 6 Methodology
MeasureMeasure
AnalyzeAnalyze
DesignDesign
VerifyVerify
MeasureMeasure
AnalyzeAnalyze
ImproveImprove
ControlControl
DefineDefine
TranslateTranslate
Y NNew Process/ Product ?
Achievable Goal ?
N
Y
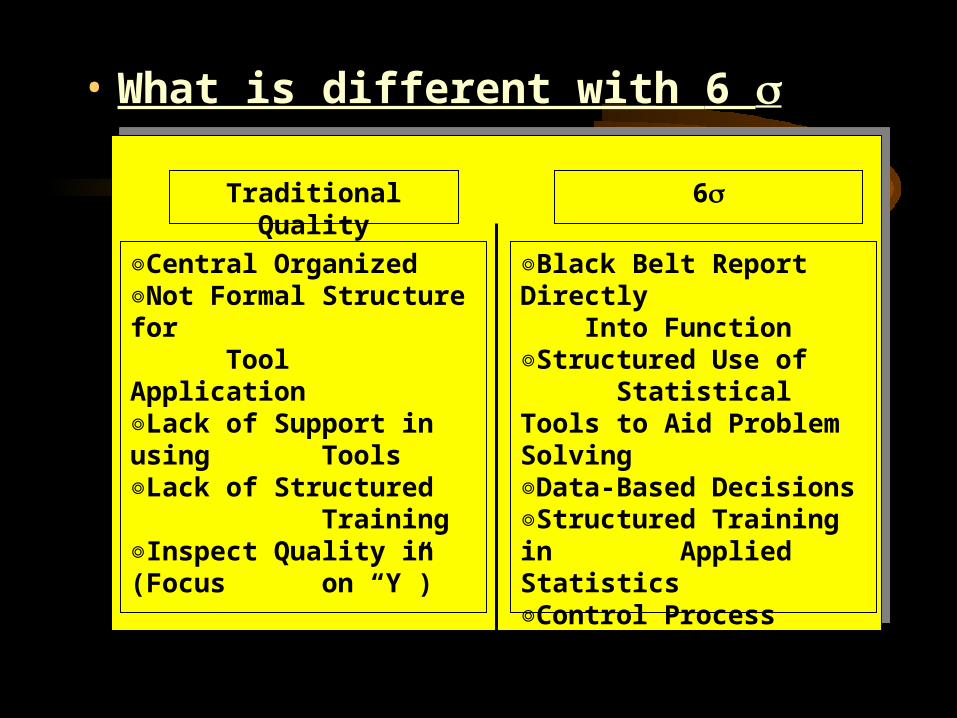
• What is different with 6
Traditional Quality 6
◎Central Organized◎Not Formal Structure for Tool Application◎Lack of Support in using
Tools◎Lack of Structured
Training◎Inspect Quality in (Focus
on “Y”)
◎Black Belt Report Directly Into Function◎Structured Use of Statistical Tools to Aid Problem Solving◎Data-Based Decisions◎Structured Training in Applied Statistics◎Control Process Input (X’s)
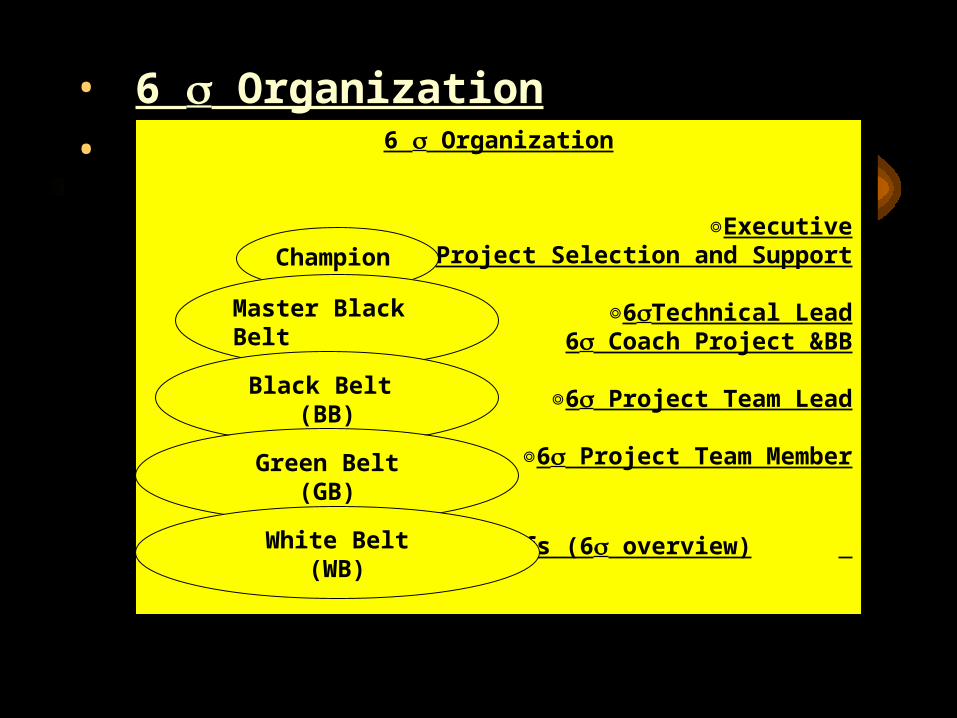
• 6 Organization
• 6 Organization
◎Executive Project Selection and Support
◎6Technical Lead6 Coach Project &BB
◎6 Project Team Lead
◎6 Project Team Member
◎All staffs (6 overview)
Champion
Master Black Belt(MBB)
Black Belt (BB)
Green Belt(GB)
White Belt(WB)
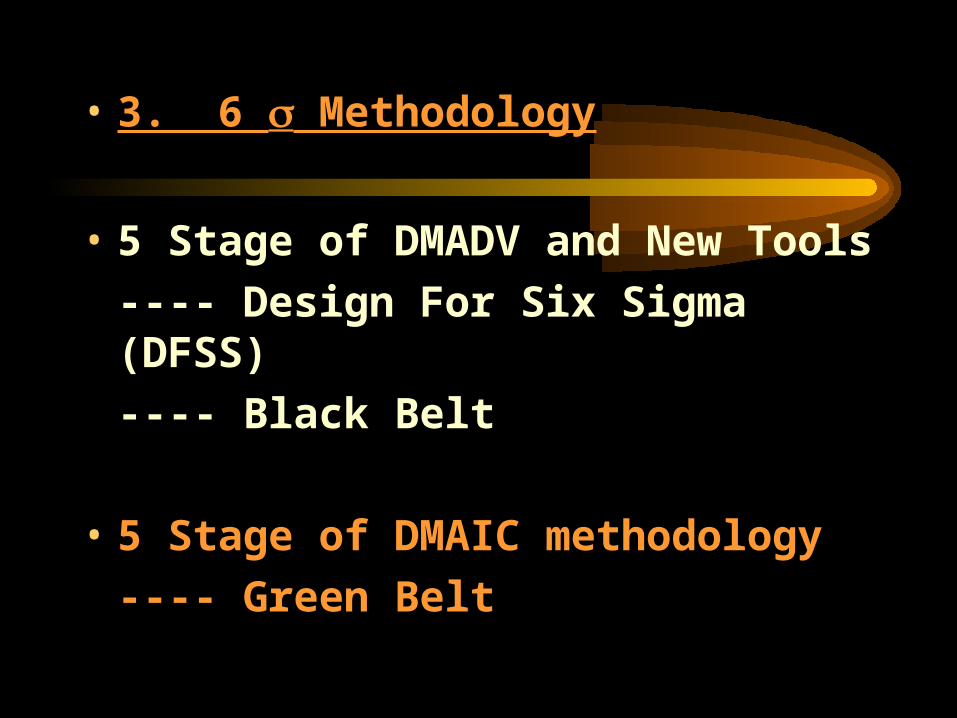
• 3. 6 Methodology
• 5 Stage of DMADV and New Tools
---- Design For Six Sigma (DFSS)
---- Black Belt
• 5 Stage of DMAIC methodology
---- Green Belt
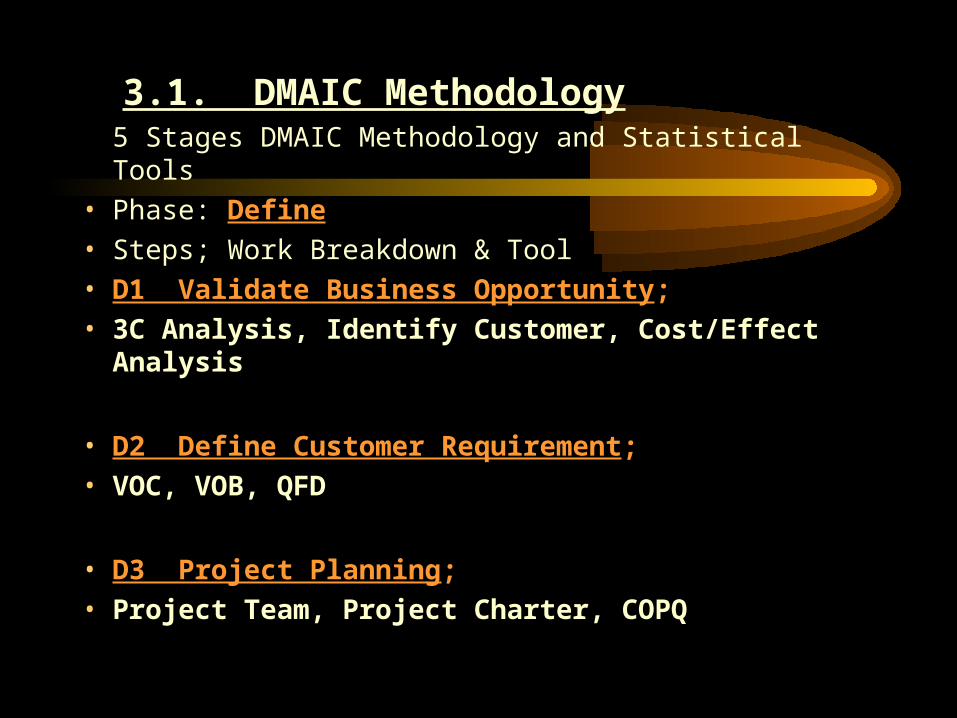
3.1. DMAIC Methodology5 Stages DMAIC Methodology and Statistical Tools
• Phase: Define
• Steps; Work Breakdown & Tool
• D1 Validate Business Opportunity;
• 3C Analysis, Identify Customer, Cost/Effect Analysis
• D2 Define Customer Requirement;
• VOC, VOB, QFD
• D3 Project Planning;
• Project Team, Project Charter, COPQ
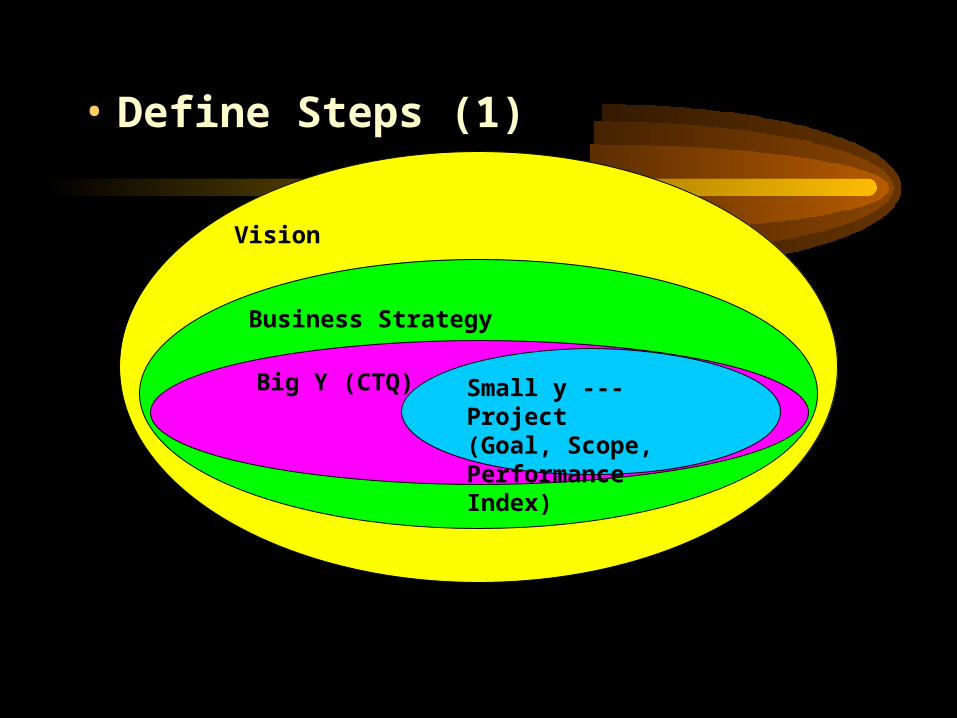
• Define Steps (1)
Vision
Business Strategy
Big Y (CTQ) Small y ---Project(Goal, Scope, Performance Index)
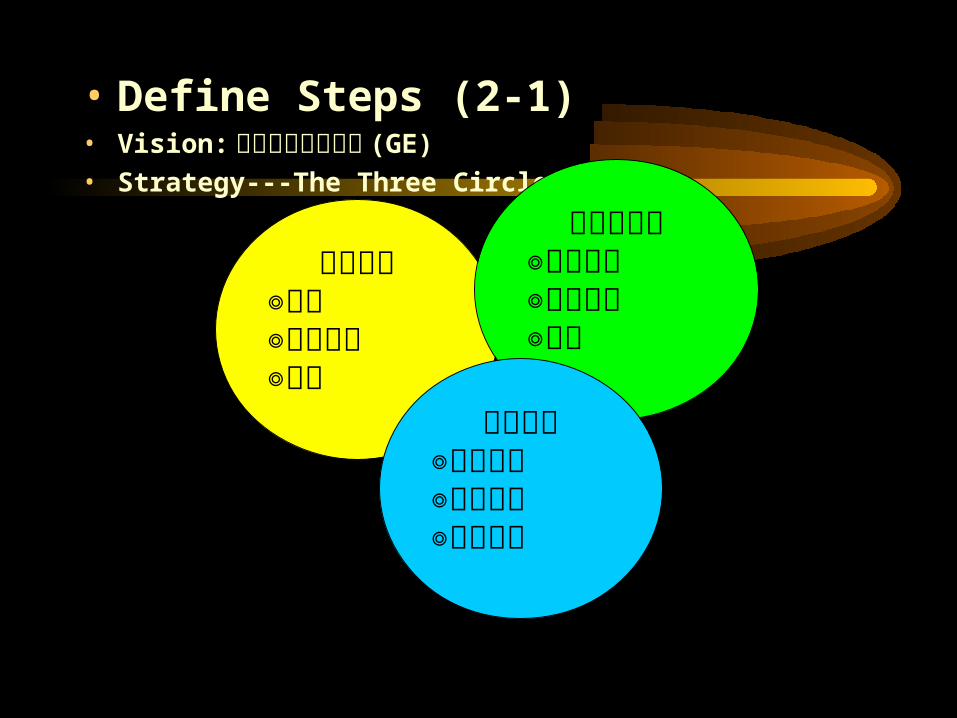
• Define Steps (2-1)• Vision: 最具競爭力的企業 (GE)
• Strategy---The Three Circle (GE)
核心事業◎照明◎大型家電◎馬達
高科技事業◎醫療系統◎工業電子◎航太
服務事業◎信用公司◎資訊服務◎核能服務
• Define Steps (2-2) ---The Three Circle (GE)
• Jack Welch (GE’S CEO) 畫三個圓圈:核心、高科技與服務。 GE 公司未來都要在其中一個圓圈內。公司任何人不再任一個圓圈內者,未來將會被解雇。圓圈外的的事業將被整頓、關閉或出售。三個圓圈的策略讓 GE 公司找到焦點,不再是集團 ( 似乎什麼都做 ) 。
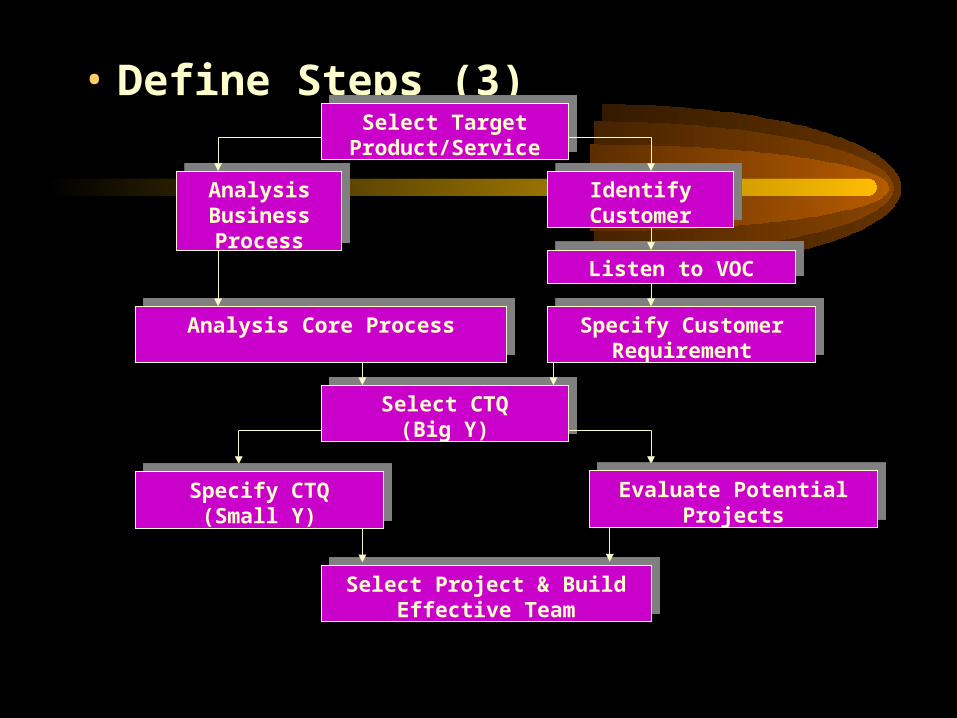
• Define Steps (3)Select Target
Product/ServiceSelect Target
Product/Service
Analysis BusinessProcess
Analysis BusinessProcess
Analysis Core ProcessAnalysis Core Process
IdentifyCustomerIdentify
Customer
Listen to VOCListen to VOC
Specify CustomerRequirement
Specify CustomerRequirement
Select CTQ(Big Y)
Select CTQ(Big Y)
Specify CTQ(Small Y)
Specify CTQ(Small Y)
Evaluate PotentialProjects
Evaluate PotentialProjects
Select Project & Build Effective Team
Select Project & Build Effective Team
• Define Steps (4)
• CTQ --- Critical to Quality
• 只要是顧客要求的,就是關鍵品質(CTQ) 。亦稱為『重要成果』、『特殊限制』或流程的『 Y 變數』。 CTQ 係任何會直接影響顧客對產品 / 服務品質觀感之因素。顧客『在乎』的事,就是企業或組織在乎的事。『新點子』要採納『外部觀點』 (Outside-in Perspective) ,即從顧客的眼光來看企業或組織的一切。
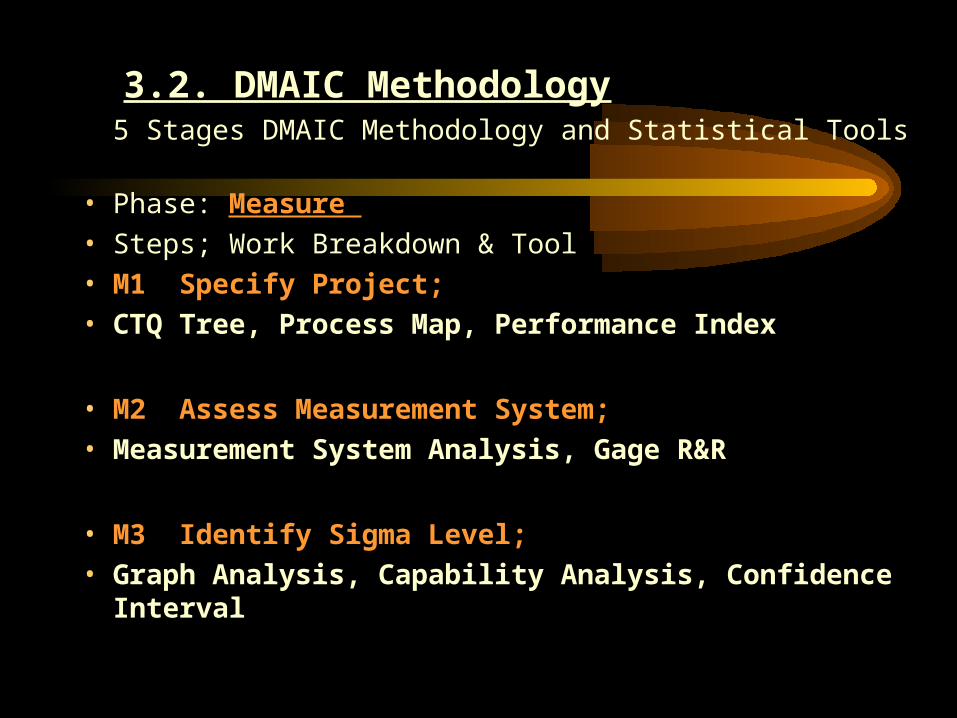
3.2. DMAIC Methodology5 Stages DMAIC Methodology and Statistical Tools
• Phase: Measure
• Steps; Work Breakdown & Tool
• M1 Specify Project;
• CTQ Tree, Process Map, Performance Index
• M2 Assess Measurement System;
• Measurement System Analysis, Gage R&R
• M3 Identify Sigma Level;
• Graph Analysis, Capability Analysis, Confidence Interval
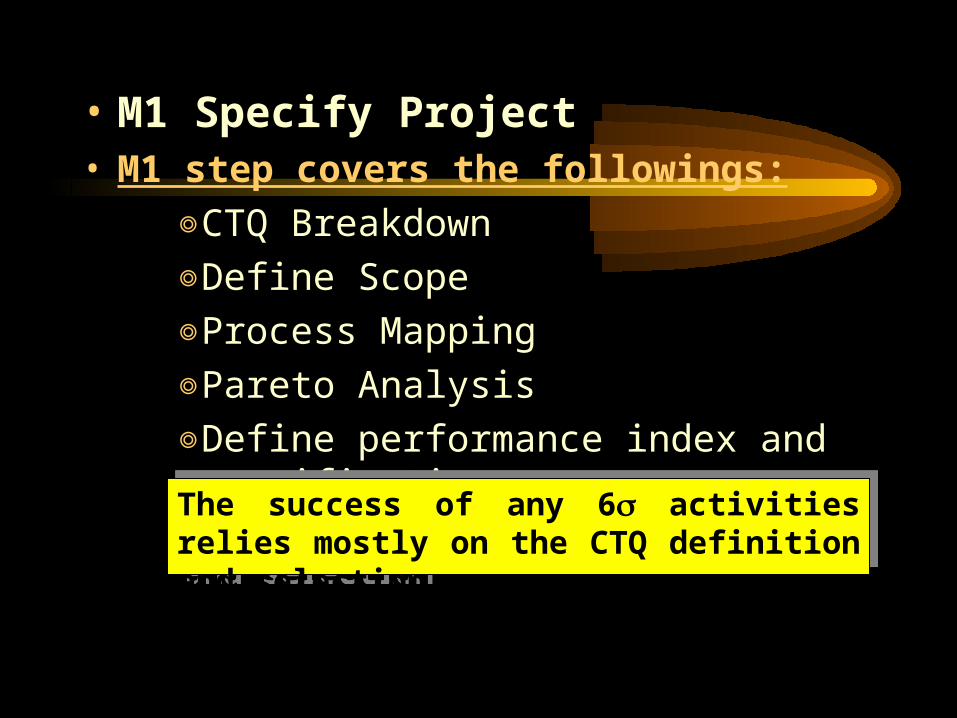
• M1 Specify Project• M1 step covers the followings:
◎CTQ Breakdown
◎Define Scope
◎Process Mapping
◎Pareto Analysis
◎Define performance index and specifications
The success of any 6 activities relies mostly on the CTQ definition and selection
The success of any 6 activities relies mostly on the CTQ definition and selection
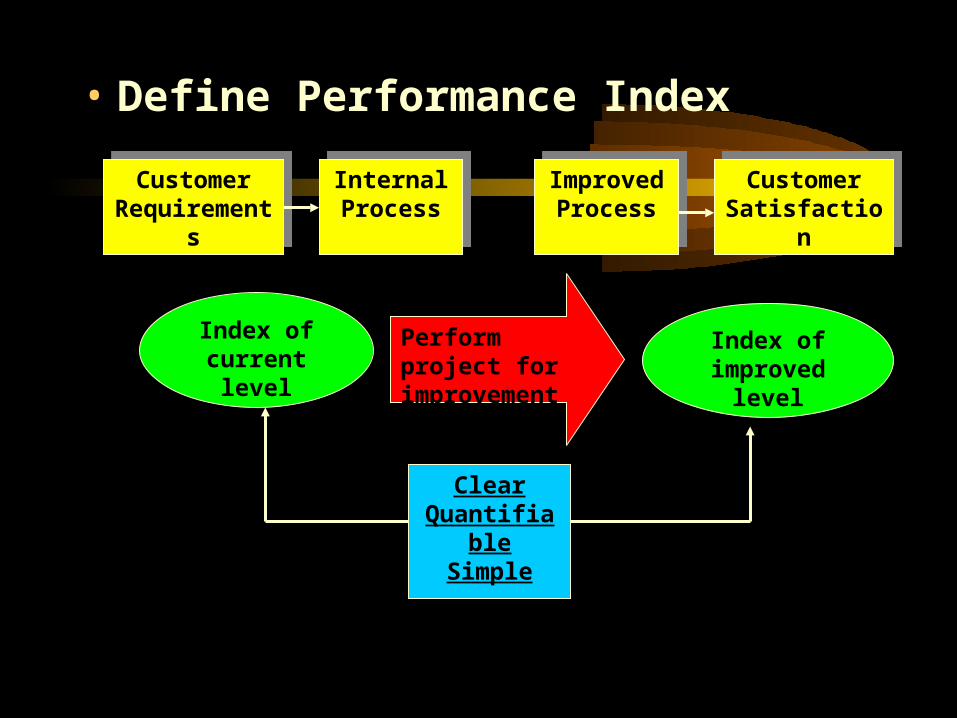
• Define Performance Index
Customer Requirements
Customer Requirements
Internal Process
Internal Process
ImprovedProcess
ImprovedProcess
Customer SatisfactionCustomer
Satisfaction
Index of current level
Index of improved level
Perform project for improvement
ClearQuantifiable
Simple
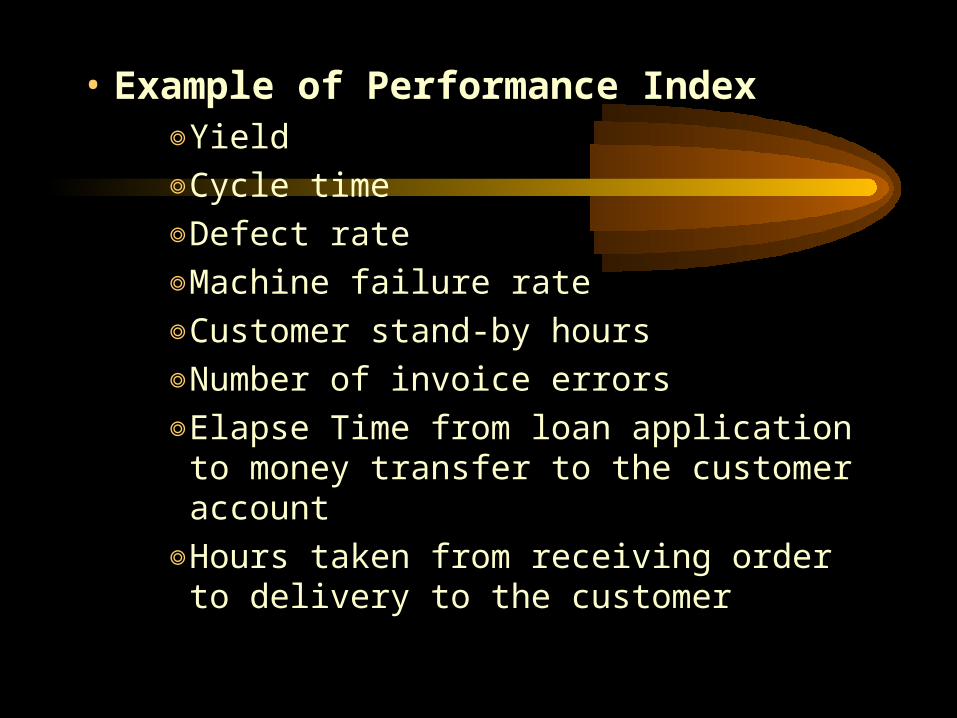
• Example of Performance Index◎Yield
◎Cycle time
◎Defect rate
◎Machine failure rate
◎Customer stand-by hours
◎Number of invoice errors
◎Elapse Time from loan application to money transfer to the customer account
◎Hours taken from receiving order to delivery to the customer
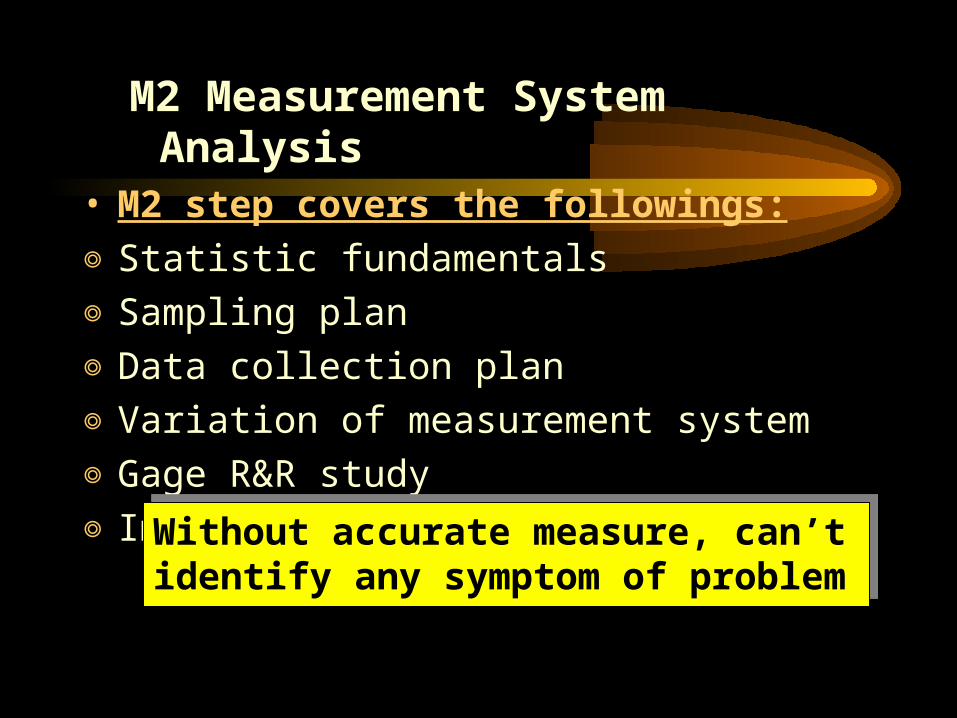
M2 Measurement System Analysis• M2 step covers the followings:
◎Statistic fundamentals
◎Sampling plan
◎Data collection plan
◎Variation of measurement system
◎Gage R&R study
◎Improvement of measurement systemWithout accurate measure, can’t identify any symptom of problemWithout accurate measure, can’t identify any symptom of problem
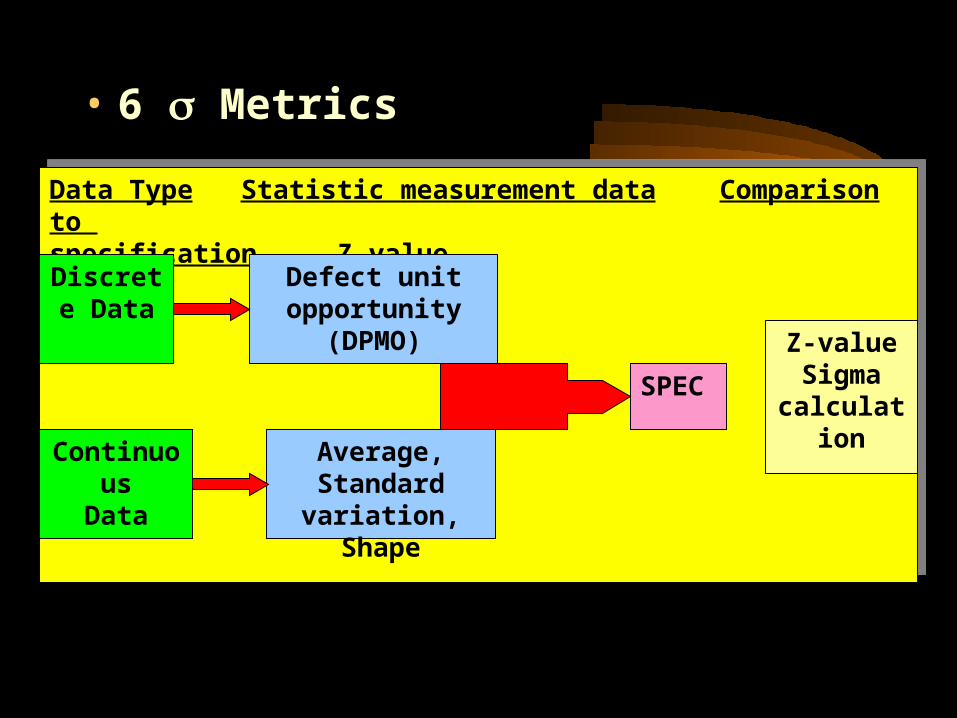
• 6 Metrics
Data Type Statistic measurement data Comparison to specification Z-value
Data Type Statistic measurement data Comparison to specification Z-value
Discrete Data
ContinuousData
Defect unit opportunity
(DPMO)
Average, Standard
variation, Shape
SPEC
Z-valueSigma
calculation
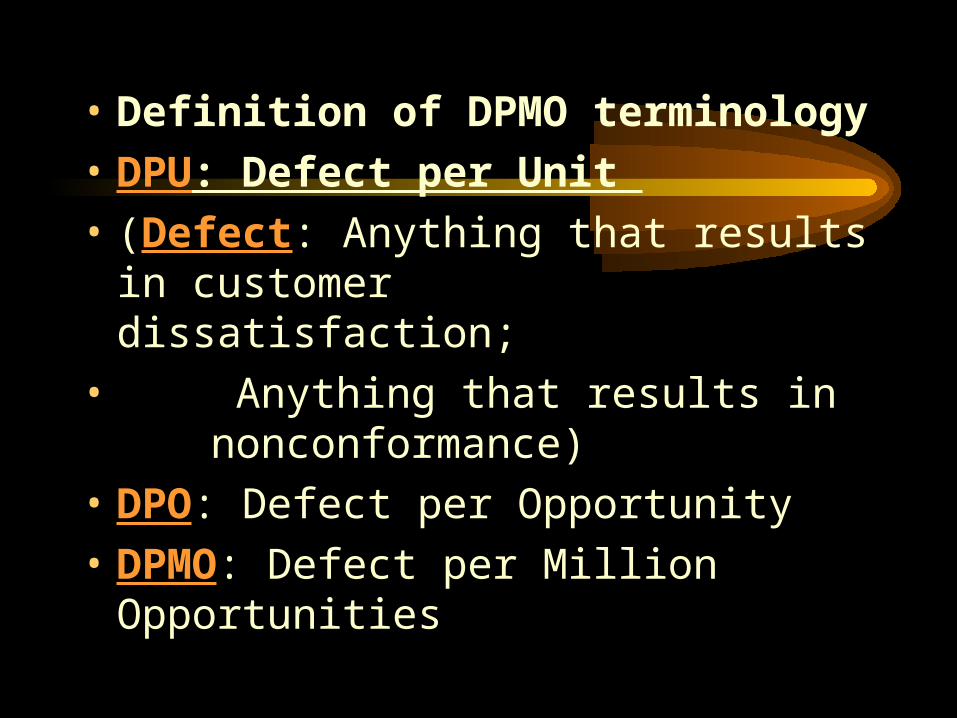
• Definition of DPMO terminology
• DPU: Defect per Unit
• (Defect: Anything that results in customer dissatisfaction;
• Anything that results in nonconformance)
• DPO: Defect per Opportunity
• DPMO: Defect per Million Opportunities
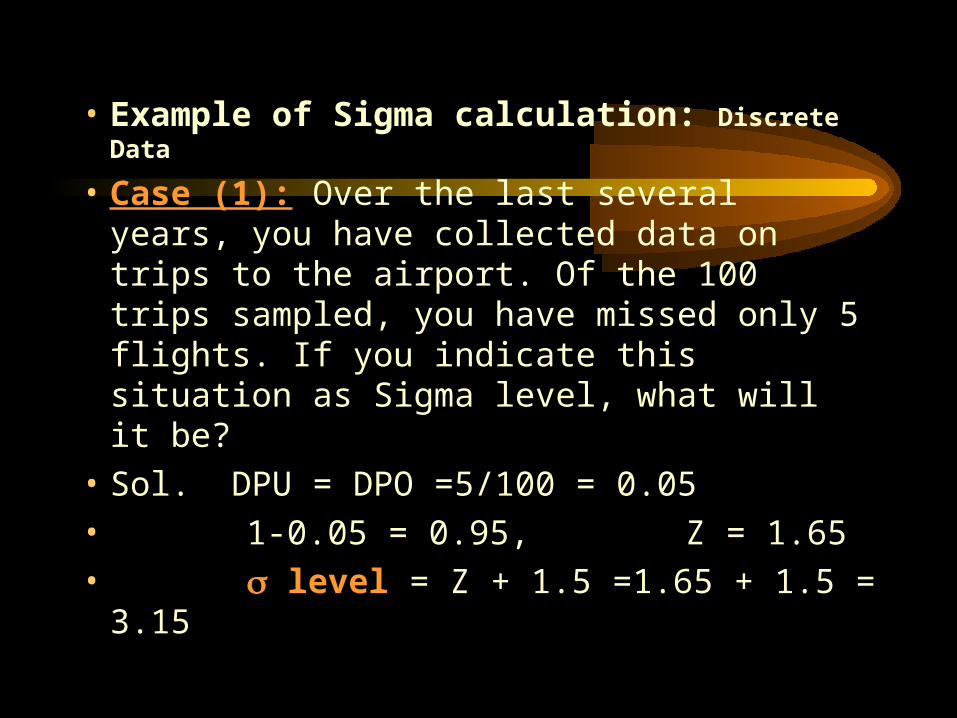
• Example of Sigma calculation: Discrete Data
• Case (1): Over the last several years, you have collected data on trips to the airport. Of the 100 trips sampled, you have missed only 5 flights. If you indicate this situation as Sigma level, what will it be?
• Sol. DPU = DPO =5/100 = 0.05
• 1-0.05 = 0.95, Z = 1.65
• level = Z + 1.5 =1.65 + 1.5 = 3.15
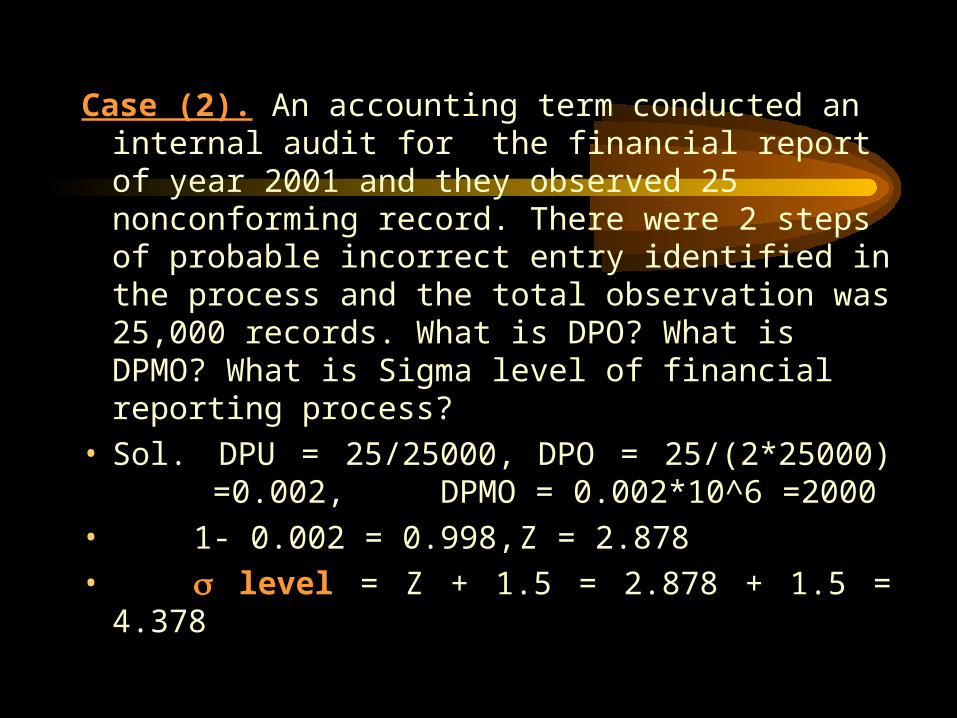
Case (2). An accounting term conducted an internal audit for the financial report of year 2001 and they observed 25 nonconforming record. There were 2 steps of probable incorrect entry identified in the process and the total observation was 25,000 records. What is DPO? What is DPMO? What is Sigma level of financial reporting process?
• Sol. DPU = 25/25000, DPO = 25/(2*25000) =0.002, DPMO = 0.002*10^6 =2000
• 1- 0.002 = 0.998, Z = 2.878• level = Z + 1.5 = 2.878 + 1.5 = 4.378
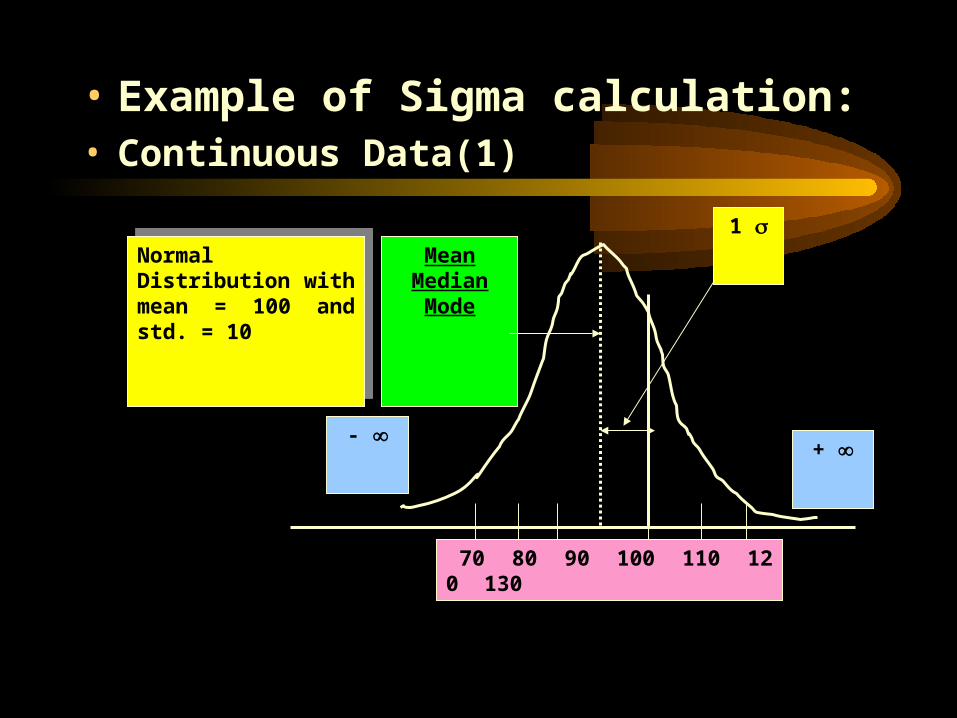
• Example of Sigma calculation: • Continuous Data(1)
1 Mean
MedianMode
70 80 90 100 110 120 130
+ -
Normal Distribution with mean = 100 and std. = 10
Normal Distribution with mean = 100 and std. = 10
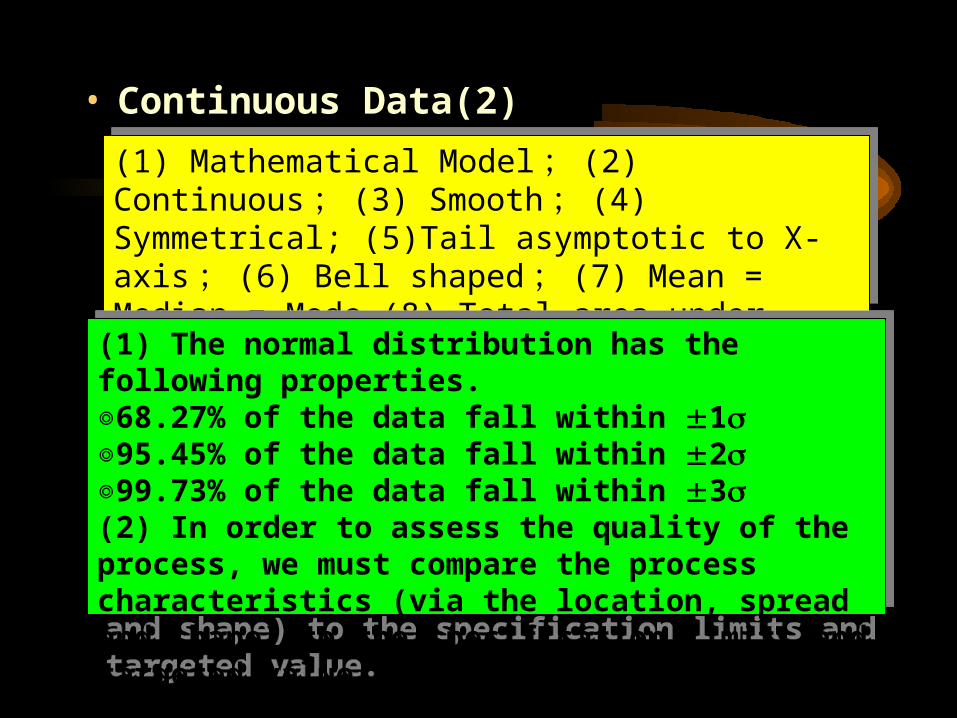
• Continuous Data(2)(1) Mathematical Model; (2) Continuous; (3) Smooth; (4) Symmetrical; (5)Tail asymptotic to X-axis; (6) Bell shaped; (7) Mean = Median = Mode (8) Total area under curve = 1
(1) Mathematical Model; (2) Continuous; (3) Smooth; (4) Symmetrical; (5)Tail asymptotic to X-axis; (6) Bell shaped; (7) Mean = Median = Mode (8) Total area under curve = 1
(1) The normal distribution has the following properties.◎68.27% of the data fall within 1◎95.45% of the data fall within 2◎99.73% of the data fall within 3(2) In order to assess the quality of the process, we must compare the process characteristics (via the location, spread and shape) to the specification limits and targeted value.
(1) The normal distribution has the following properties.◎68.27% of the data fall within 1◎95.45% of the data fall within 2◎99.73% of the data fall within 3(2) In order to assess the quality of the process, we must compare the process characteristics (via the location, spread and shape) to the specification limits and targeted value.
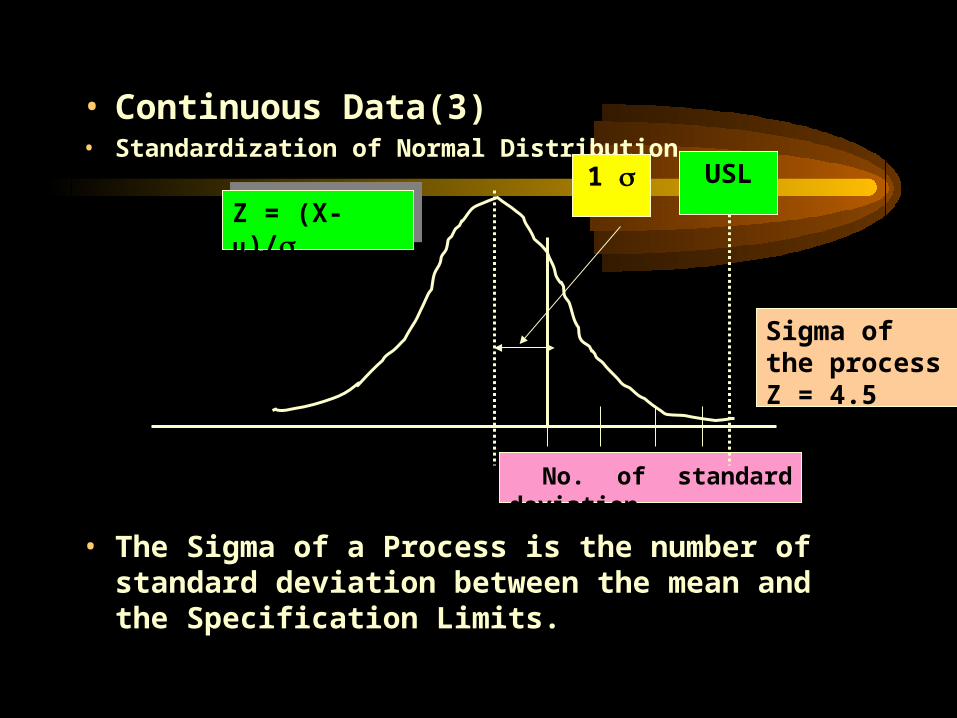
• Continuous Data(3)• Standardization of Normal Distribution
• The Sigma of a Process is the number of standard deviation between the mean and the Specification Limits.
1 Z = (X-)/Z = (X-)/
No. of standard deviation
USL
Sigma of the process Z = 4.5
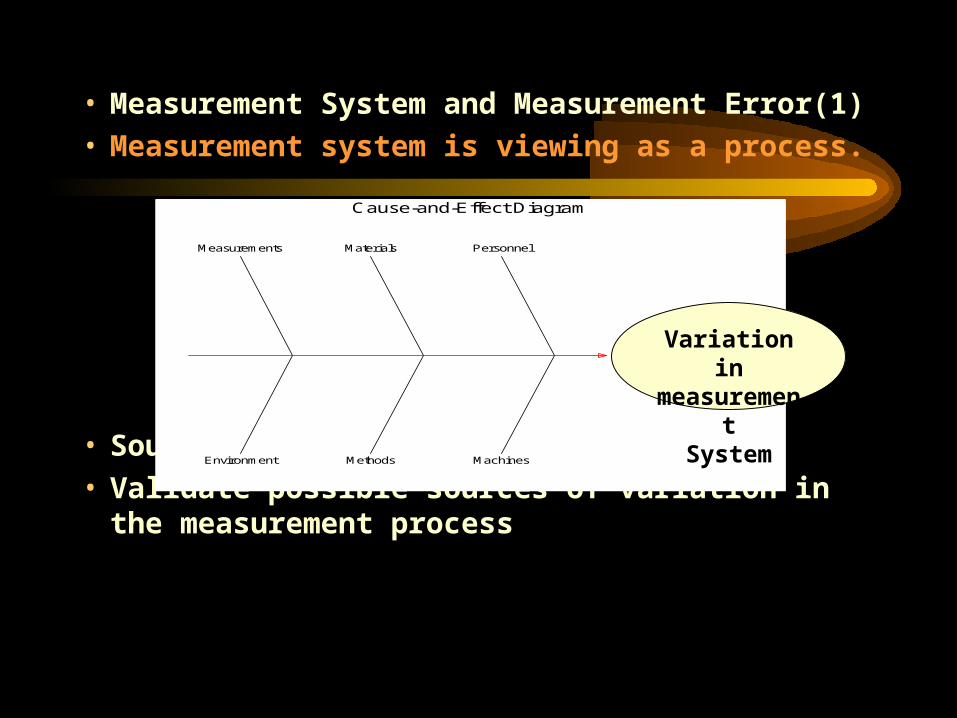
• Measurement System and Measurement Error(1)• Measurement system is viewing as a process.
• Sources of variation: 5M1E• Validate possible sources of variation in the
measurement process
Personnel
Machines
Materials
Methods
Measurements
Environment
Cause-and-Effect Diagram
Variation in measurement
System
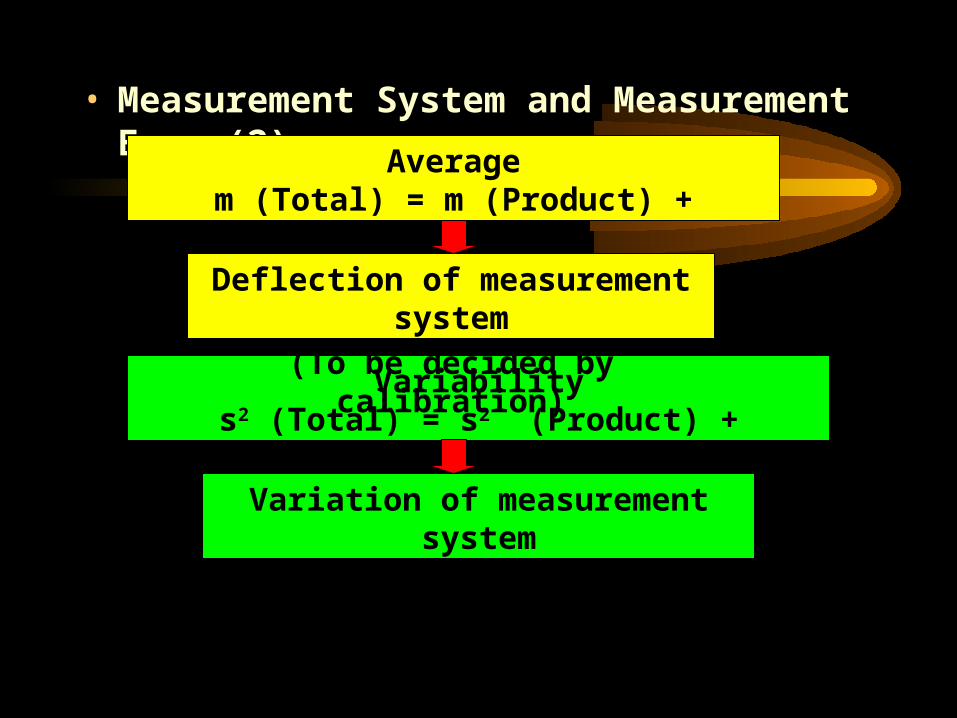
• Measurement System and Measurement Error(2)
Averagem (Total) = m (Product) + m(Measurement)
Variabilitys2 (Total) = s2 (Product) + s2(Measurement)
Deflection of measurement system
(To be decided by calibration)
Variation of measurement system
(To be decided by R&R assessment)
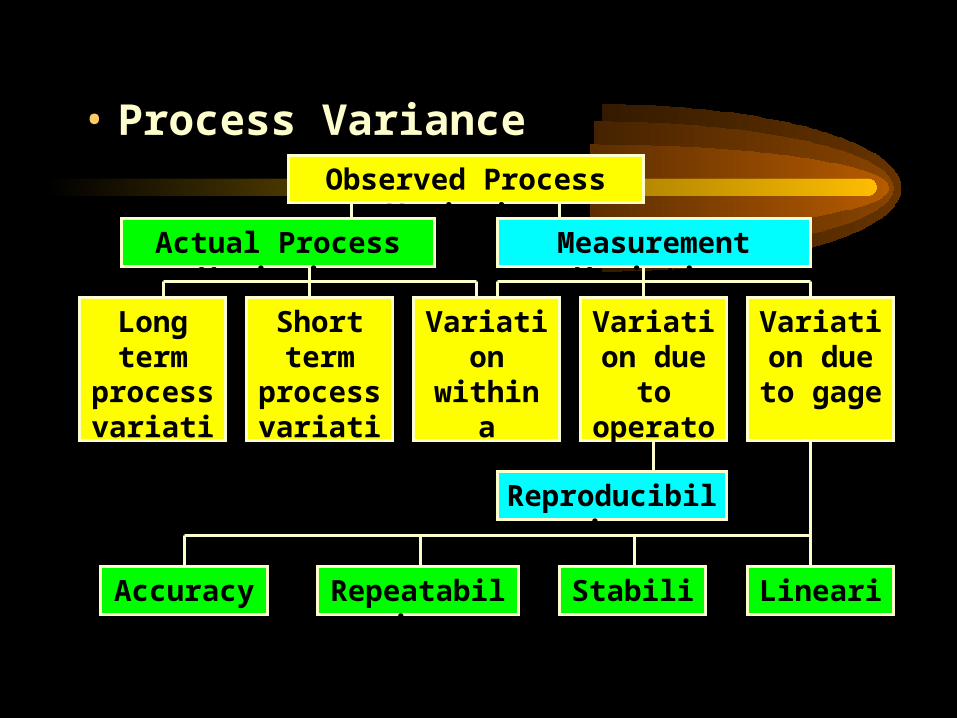
• Process VarianceObserved Process
VariationActual Process
VariationMeasurement
Variation
Long term
process variation
Short term
process variation
Variation within a sample
Variation due to
operators
Variation due to gage
Reproducibility
LinearityStabilityRepeatabilityAccuracy
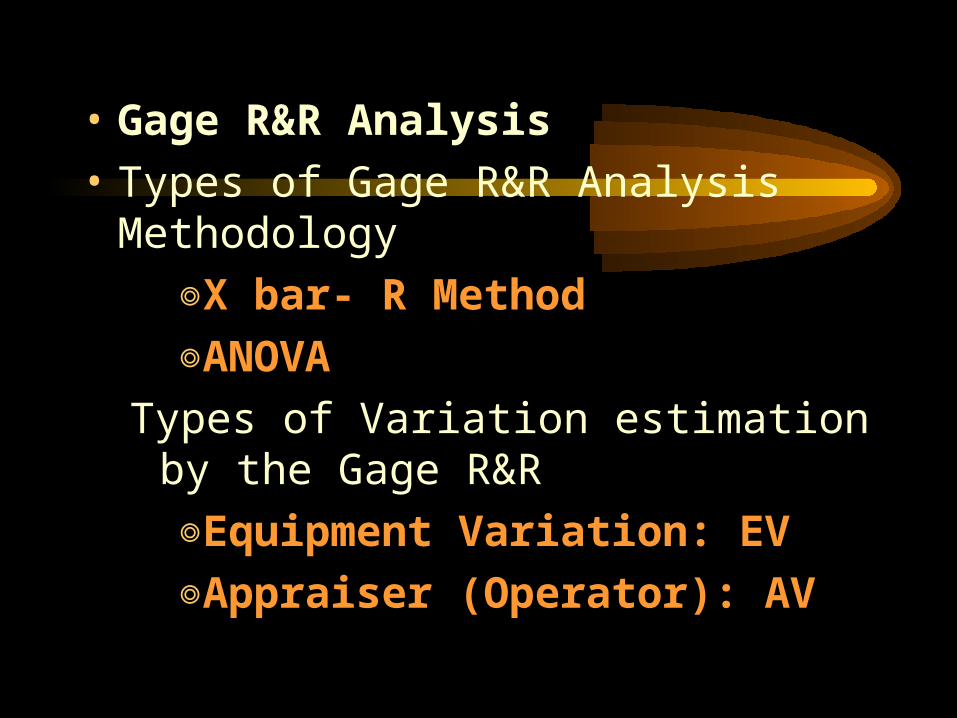
• Gage R&R Analysis
• Types of Gage R&R Analysis Methodology
◎X bar- R Method
◎ANOVA
Types of Variation estimation by the Gage R&R
◎Equipment Variation: EV
◎Appraiser (Operator): AV
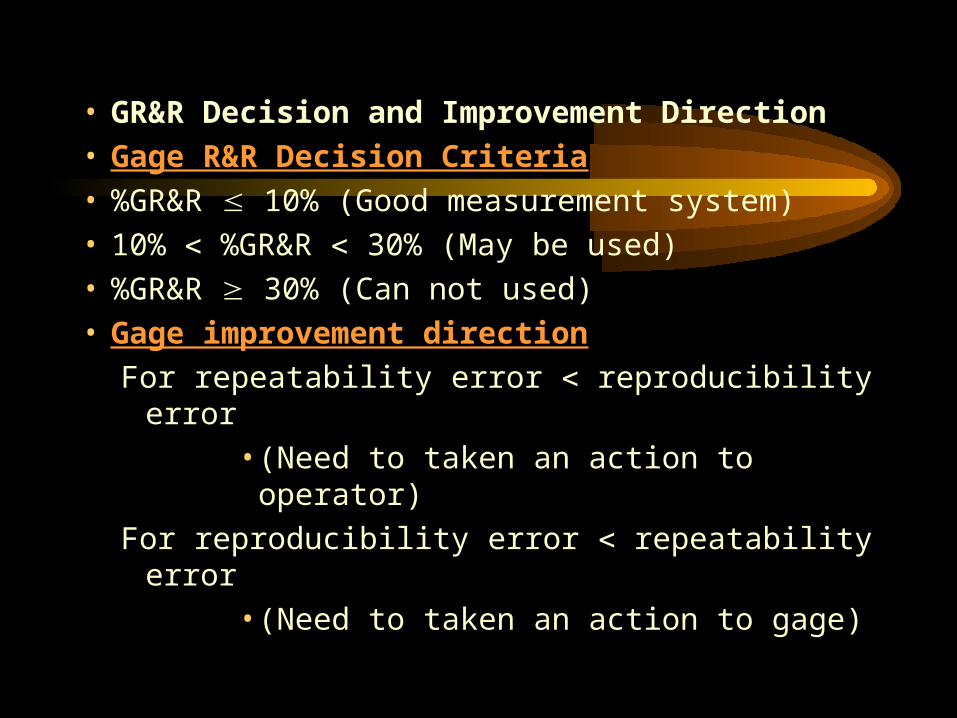
• GR&R Decision and Improvement Direction• Gage R&R Decision Criteria• %GR&R 10% (Good measurement system)• 10% %GR&R 30% (May be used)• %GR&R 30% (Can not used)• Gage improvement direction
For repeatability error reproducibility error• (Need to taken an action to operator)
For reproducibility error repeatability error• (Need to taken an action to gage)
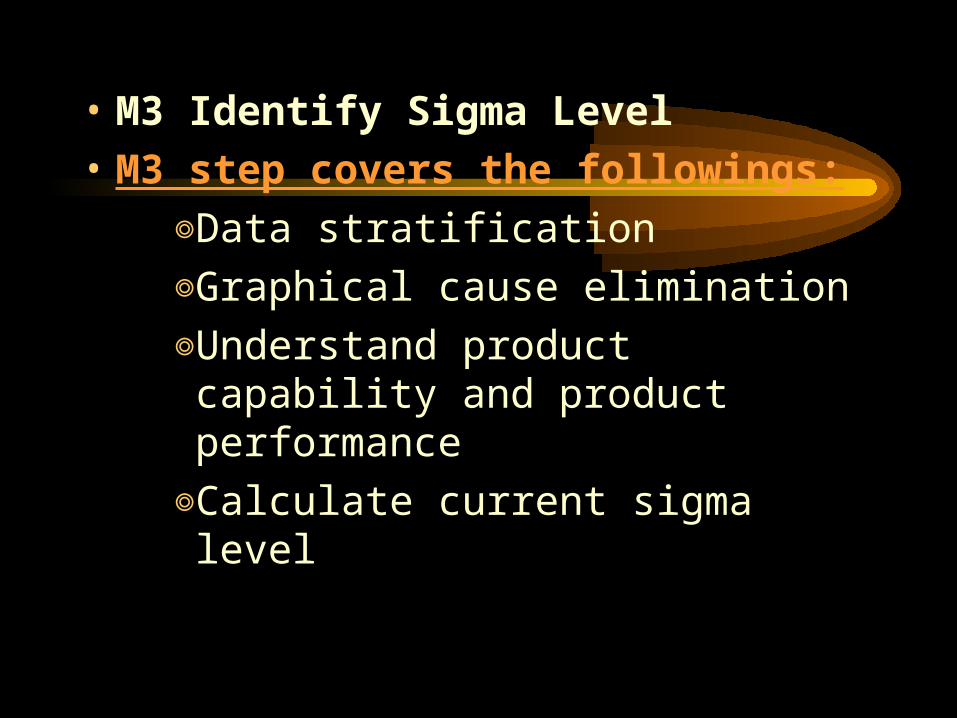
• M3 Identify Sigma Level
• M3 step covers the followings:
◎Data stratification
◎Graphical cause elimination
◎Understand product capability and product performance
◎Calculate current sigma level
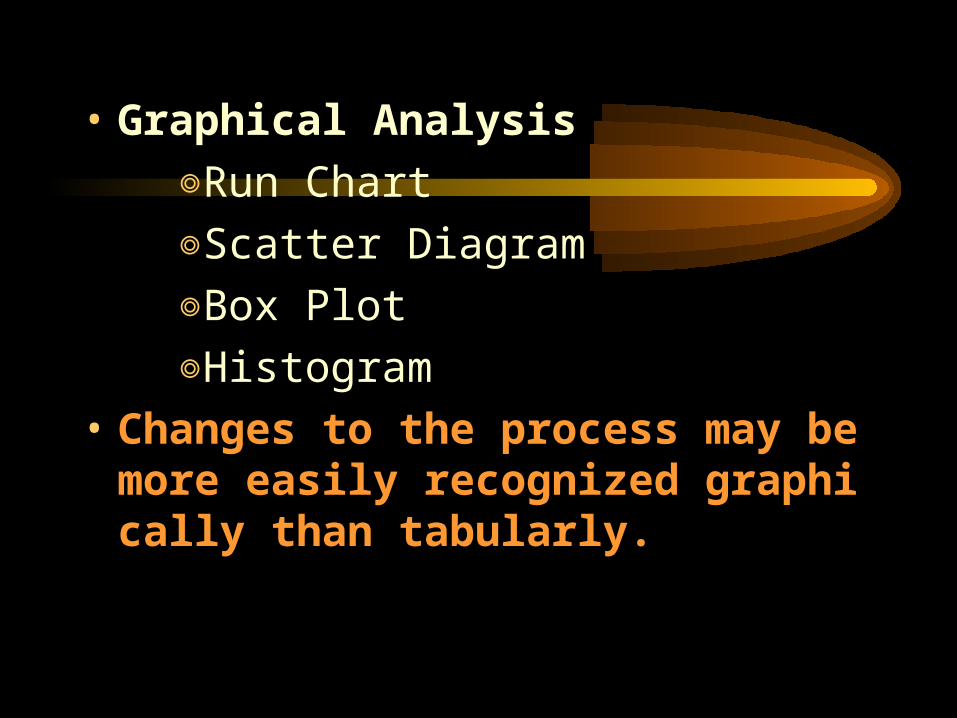
• Graphical Analysis
◎Run Chart
◎Scatter Diagram
◎Box Plot
◎Histogram
• Changes to the process may be more easily recognized graphically than tabularly.
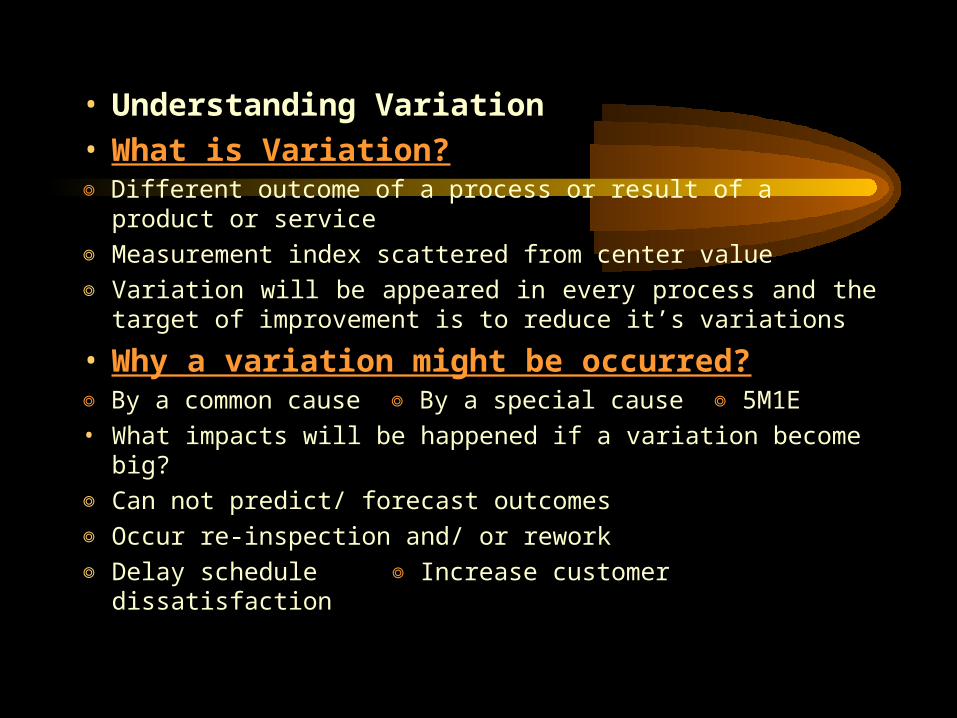
• Understanding Variation• What is Variation?◎ Different outcome of a process or result of a product or service
◎ Measurement index scattered from center value
◎ Variation will be appeared in every process and the target of improvement is to reduce it’s variations
• Why a variation might be occurred?◎ By a common cause ◎ By a special cause ◎ 5M1E
• What impacts will be happened if a variation become big?
◎ Can not predict/ forecast outcomes
◎ Occur re-inspection and/ or rework
◎ Delay schedule ◎ Increase customer dissatisfaction
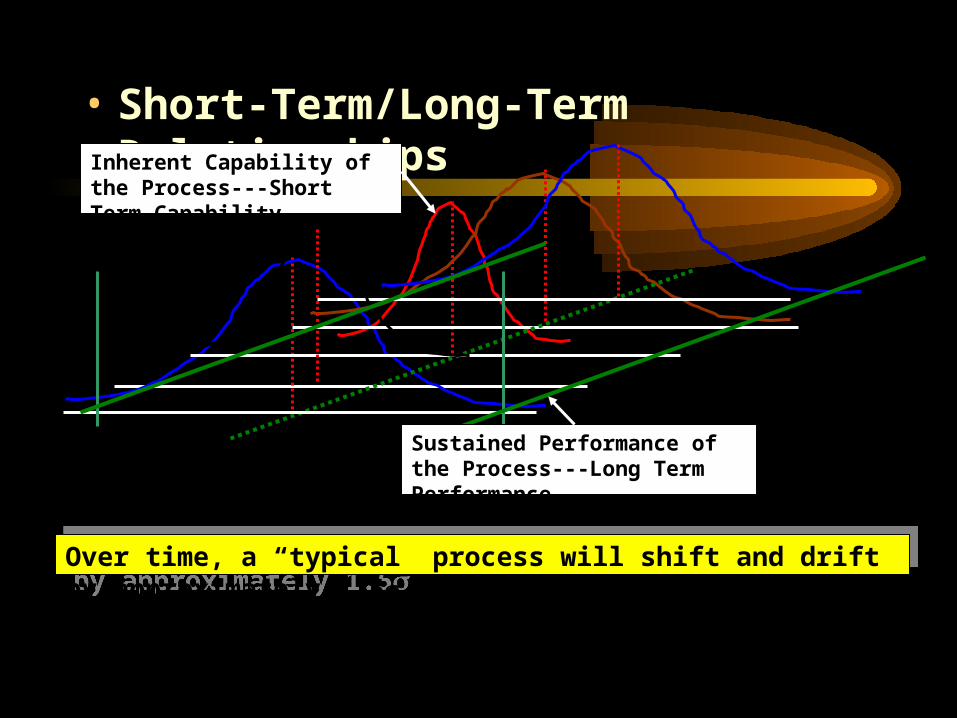
• Short-Term/Long-Term RelationshipsInherent Capability of the Process---Short Term Capability
Sustained Performance of the Process---Long Term Performance
Over time, a “typical” process will shift and drift by approximately 1.5Over time, a “typical” process will shift and drift by approximately 1.5
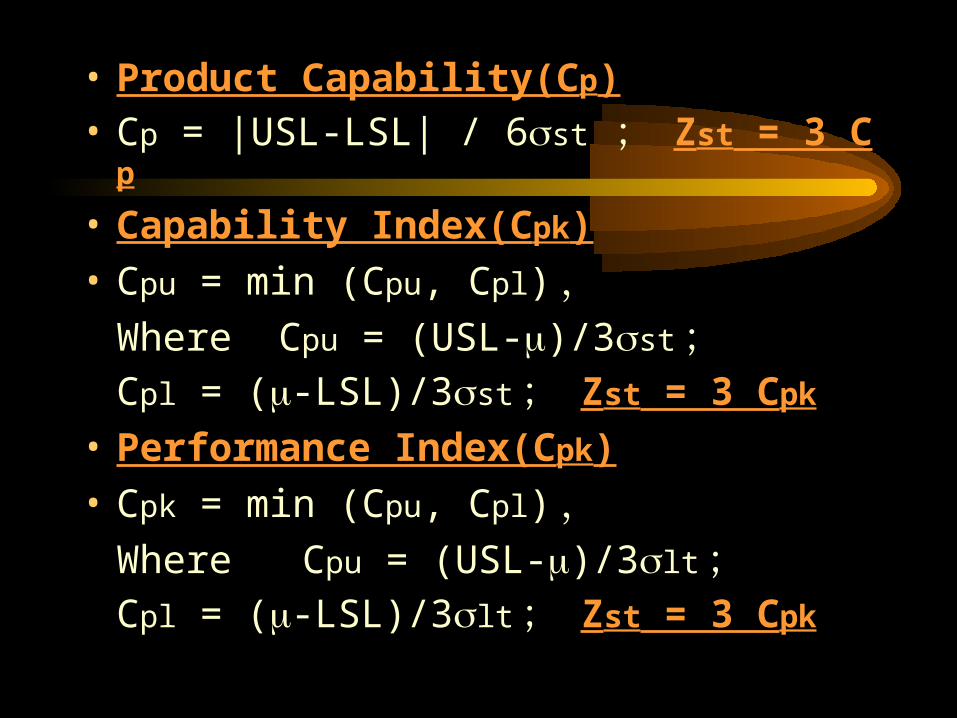
• Product Capability(Cp)• Cp = |USL-LSL| / 6st ; Zst = 3 Cp
• Capability Index(Cpk)• Cpu = min (Cpu, Cpl) ,
Where Cpu = (USL-)/3st ;Cpl = (-LSL)/3st ; Zst = 3 Cpk
• Performance Index(Cpk)• Cpk = min (Cpu, Cpl) ,
Where Cpu = (USL-)/3lt ;Cpl = (-LSL)/3lt ; Zst = 3 Cpk
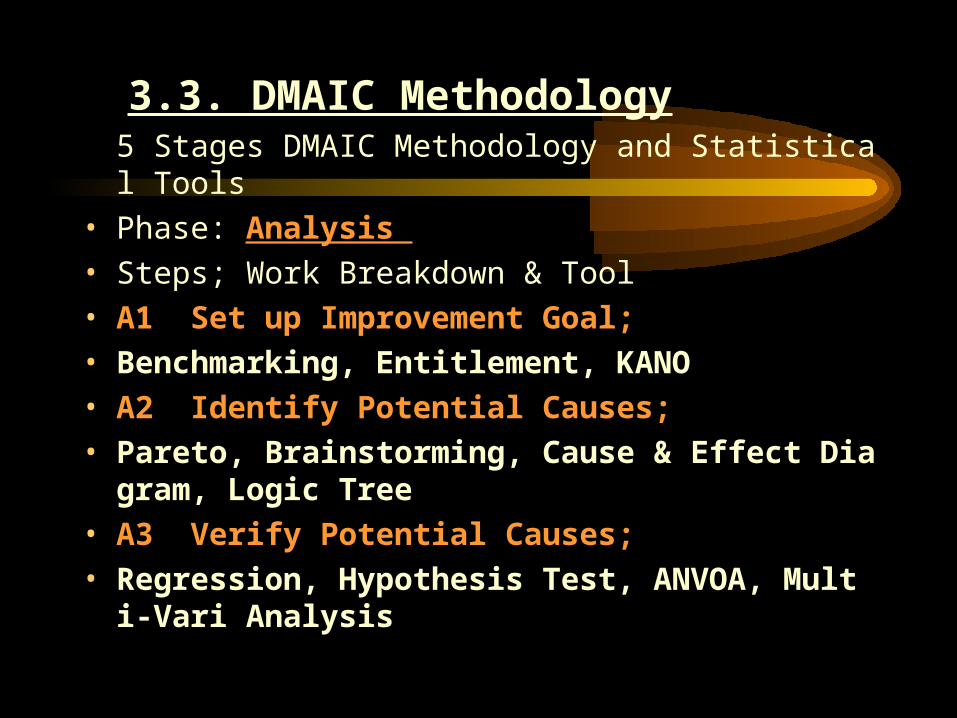
3.3. DMAIC Methodology5 Stages DMAIC Methodology and Statistical Tools
• Phase: Analysis
• Steps; Work Breakdown & Tool
• A1 Set up Improvement Goal;
• Benchmarking, Entitlement, KANO
• A2 Identify Potential Causes;
• Pareto, Brainstorming, Cause & Effect Diagram, Logic Tree
• A3 Verify Potential Causes;
• Regression, Hypothesis Test, ANVOA, Multi-Vari Analysis
• A1 Set Up Improvement Goal
◎In M3 the current product capabilities were defined.
◎Step A1 provides the tools to define performance objectives.
• The purpose is to set objective to establish a balance between improving customer satisfaction and available resources.
• A1 step covers following topics:
◎Establish performance goals
◎Assess short-term and long-term sigma in terms of measurement benefits (decrease in COPQ, increase in revenue)
◎Determine improvement direction by the gap analysis between goal and current level
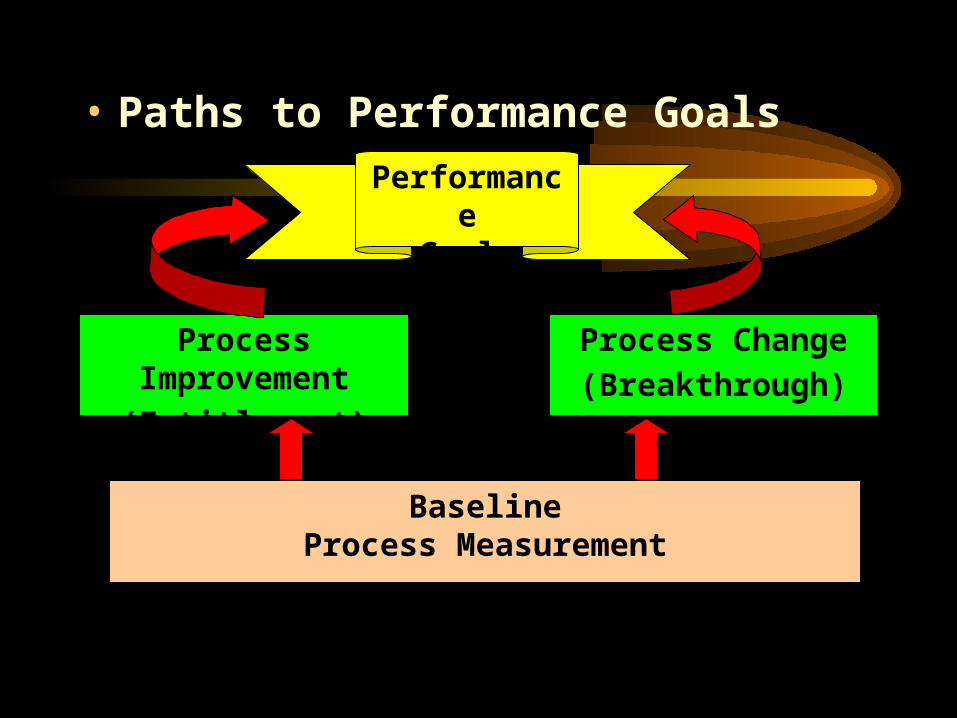
• Paths to Performance Goals
PerformanceGoals
Process Improvement
(Entitlement)
Process Change
(Breakthrough)
BaselineProcess Measurement
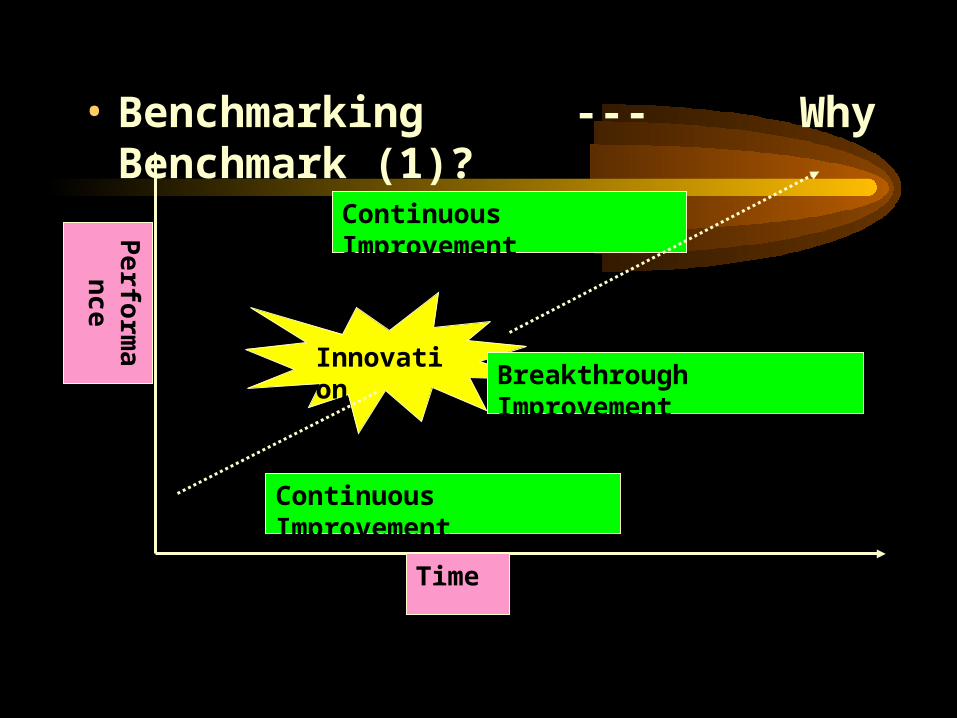
• Benchmarking --- Why Benchmark (1)?
Innovation
Continuous Improvement
Breakthrough Improvement
Continuous Improvement
Time
Perform
anc
e
• Benchmarking --- Why Benchmark (2)?
◎Develop and Improvement Strategic Goals
◎Establish actionable objectives
◎Provide sense of urgency
◎Encourage breakthrough thinking
◎Create a better understanding of your industry

• A2 Identify Potential Causes
• Finding main independent variables, and making the list Y = f (X)
• Object
Make list of potential independent variables for changing & improving Y value methods
◎ Brainstorming ◎ Cause & Effect Diagram
◎ Multi-voting ◎ Logic Tree
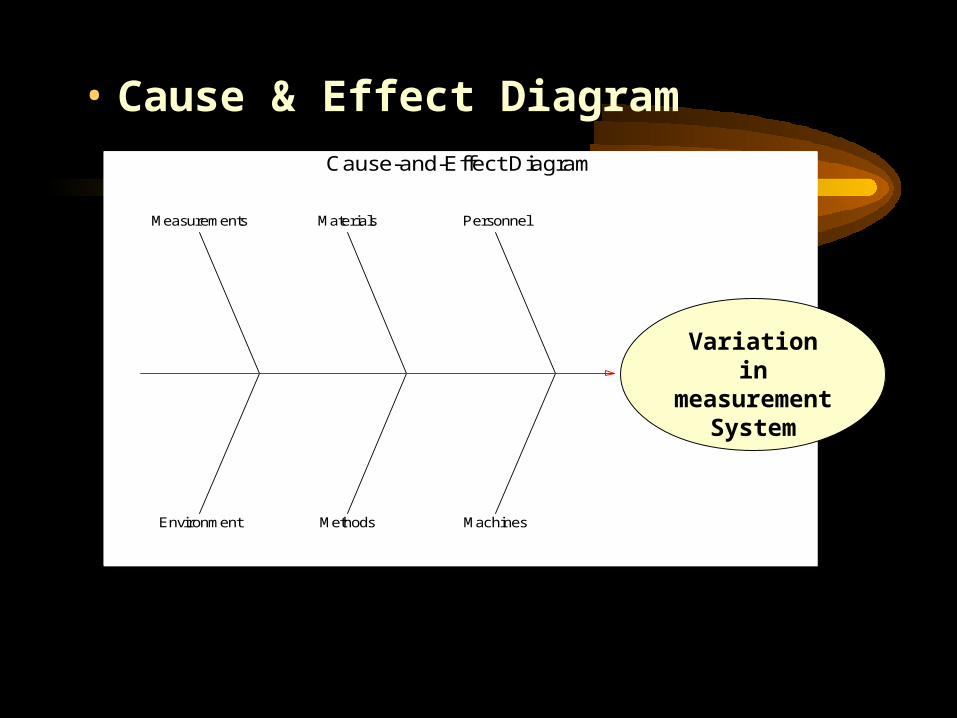
• Cause & Effect Diagram
Personnel
Machines
Materials
Methods
Measurements
Environment
Cause-and-Effect Diagram
Variation in measurement
System
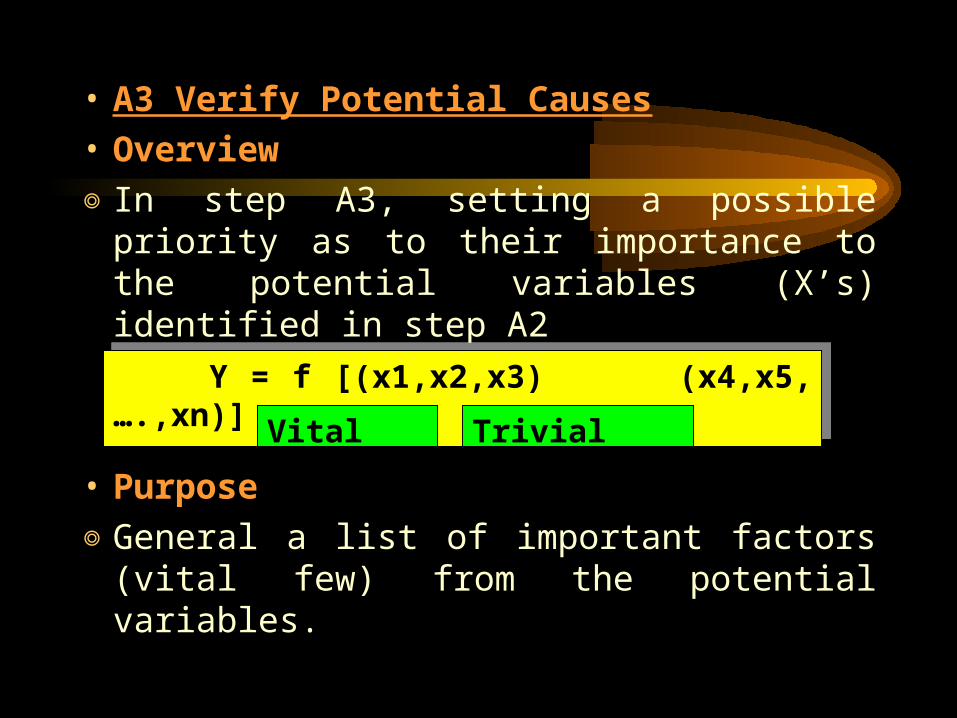
• A3 Verify Potential Causes
• Overview
◎In step A3, setting a possible priority as to their importance to the potential variables (X’s) identified in step A2
• Purpose
◎General a list of important factors (vital few) from the potential variables.
Y = f [(x1,x2,x3) (x4,x5,….,xn)]Y = f [(x1,x2,x3) (x4,x5,….,xn)]
Vital Few Trivial Many
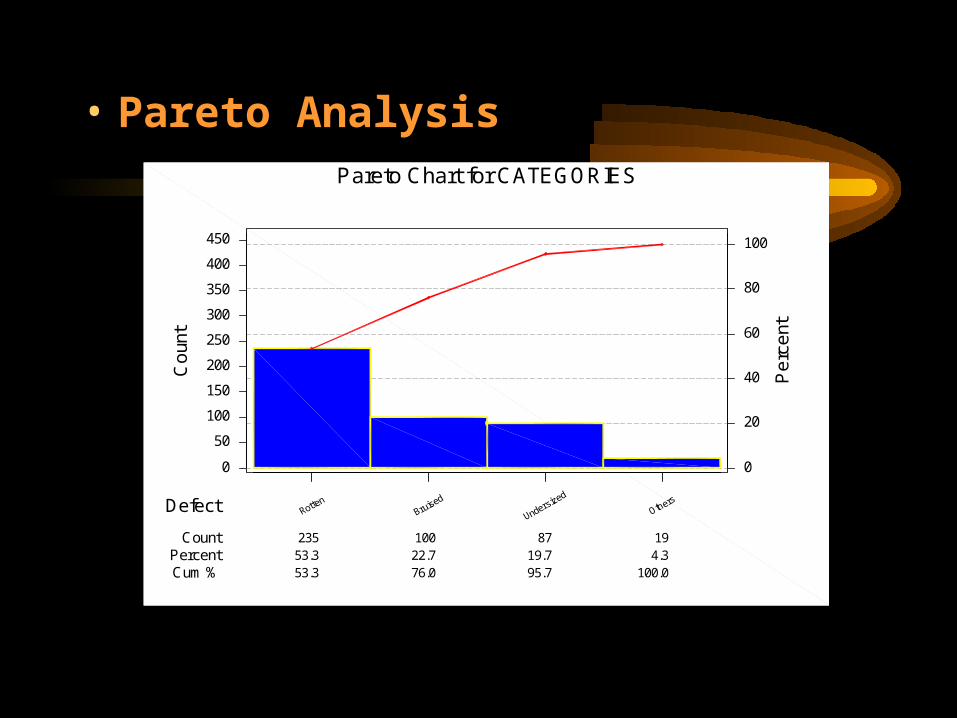
• Pareto Analysis
235 100 87 1953.3 22.7 19.7 4.3 53.3 76.0 95.7 100.0
0
50
100
150
200
250
300
350
400
450
0
20
40
60
80
100
Defect
CountPercentCum %
Pe
rce
nt
Co
unt
Pareto Chart for CATEGORIES
• Correlation Analysis
◎A statistical analysis to investigate / measurement of association between two variables (X, Y) is called analysis.
◎Correlation tells you the trend of Y when X value increase/decrease.
※Correlation Analysis using Scatter Diagram Analysis.
※Correlation coefficient indicates closeness of a relationship between X and Y.
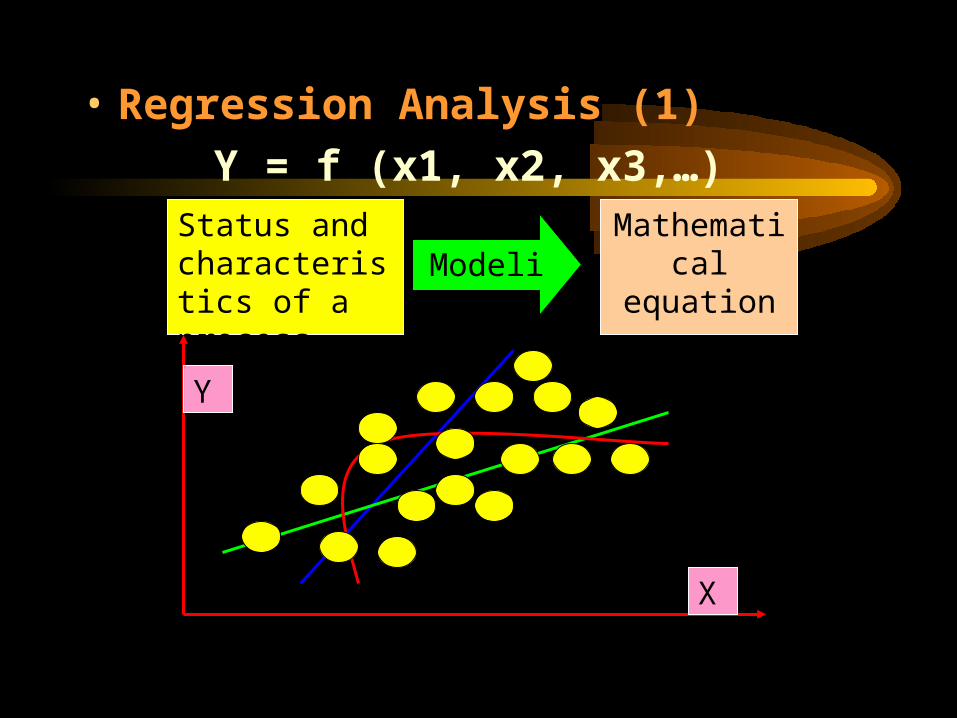
• Regression Analysis (1)
Y = f (x1, x2, x3,…)Status and characteristics of a process
ModelingMathematical
equation
X
Y
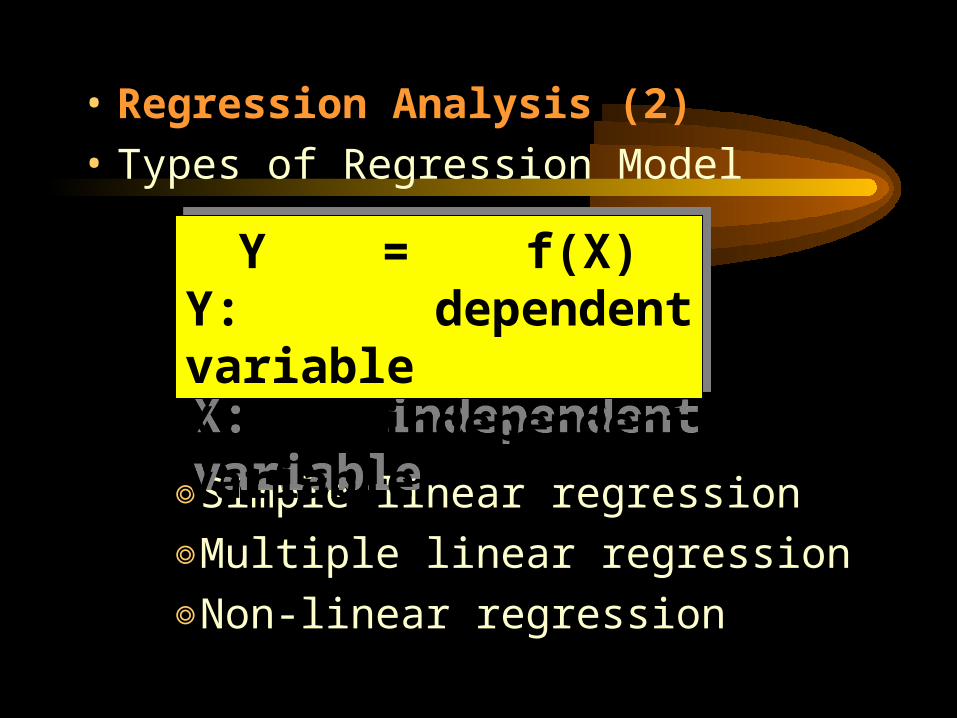
• Regression Analysis (2)
• Types of Regression Model
◎Simple linear regression
◎Multiple linear regression
◎Non-linear regression
Y = f(X)Y: dependent variableX: independent variable
Y = f(X)Y: dependent variableX: independent variable
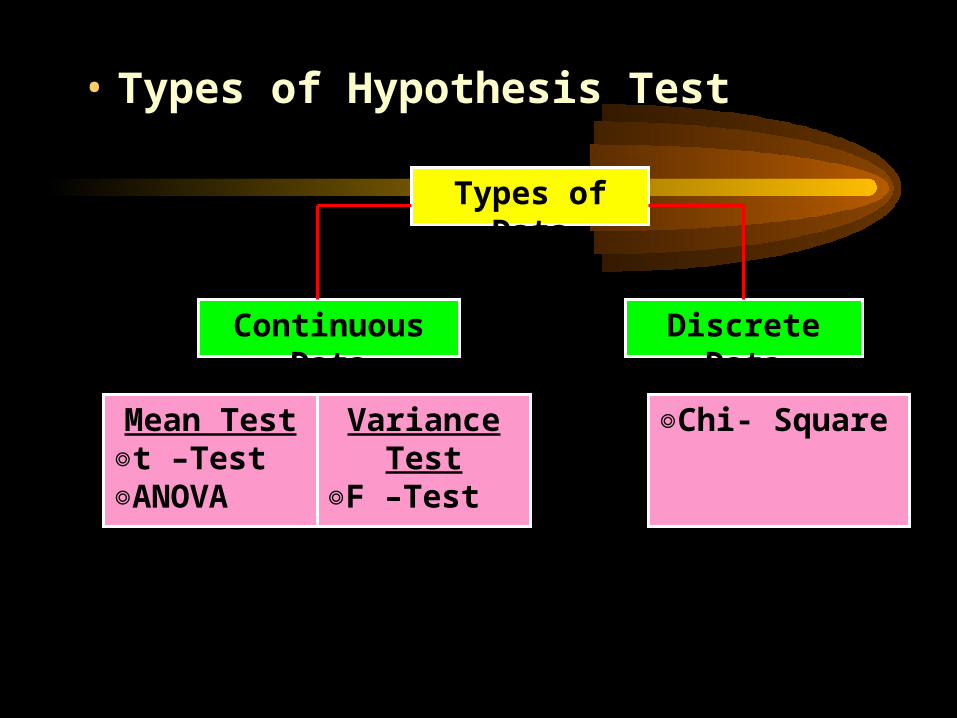
• Types of Hypothesis Test
Types of Data
Discrete DataContinuous Data
Mean Test◎t –Test◎ANOVA
Variance Test◎F –Test
◎Chi- Square
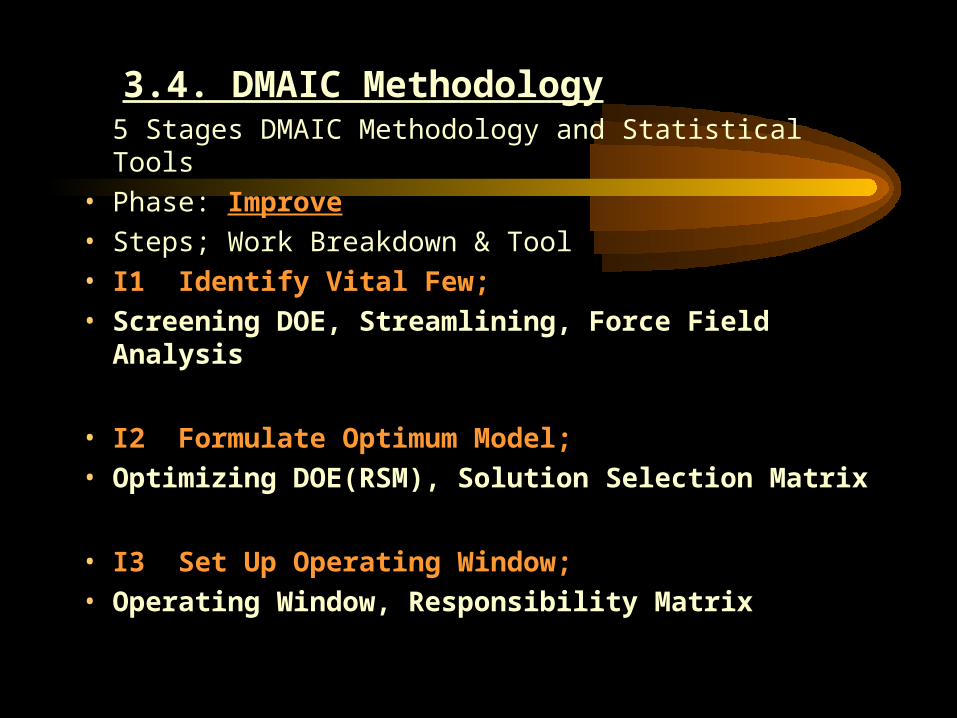
3.4. DMAIC Methodology5 Stages DMAIC Methodology and Statistical Tools
• Phase: Improve• Steps; Work Breakdown & Tool• I1 Identify Vital Few;• Screening DOE, Streamlining, Force Field Analysis
• I2 Formulate Optimum Model;• Optimizing DOE(RSM), Solution Selection Matrix
• I3 Set Up Operating Window;• Operating Window, Responsibility Matrix
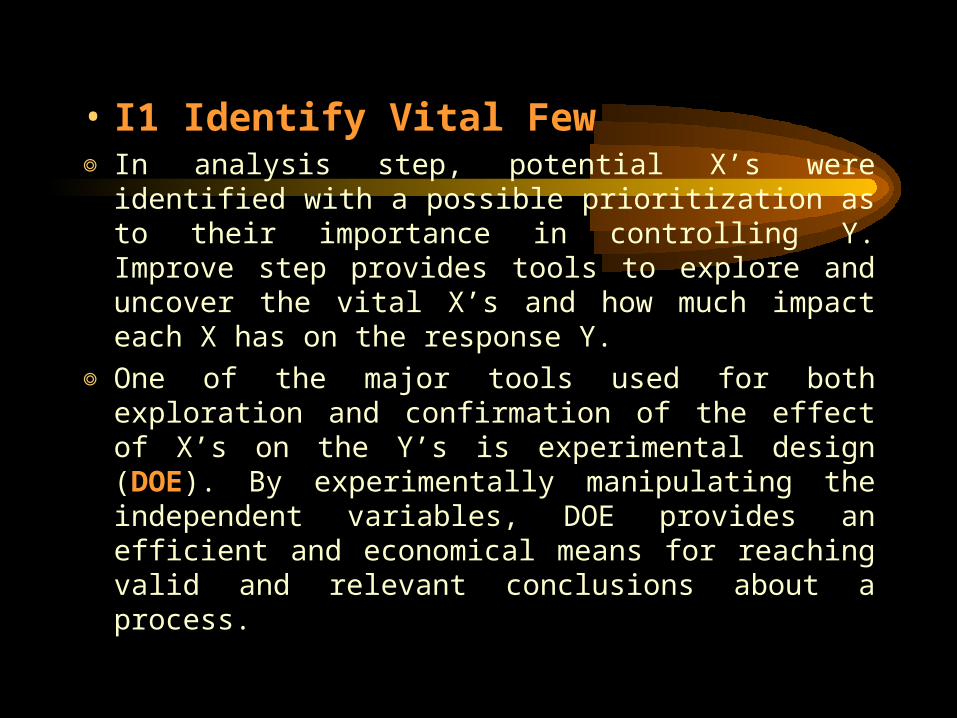
• I1 Identify Vital Few◎ In analysis step, potential X’s were identified with a
possible prioritization as to their importance in controlling Y. Improve step provides tools to explore and uncover the vital X’s and how much impact each X has on the response Y.
◎ One of the major tools used for both exploration and confirmation of the effect of X’s on the Y’s is experimental design (DOE). By experimentally manipulating the independent variables, DOE provides an efficient and economical means for reaching valid and relevant conclusions about a process.
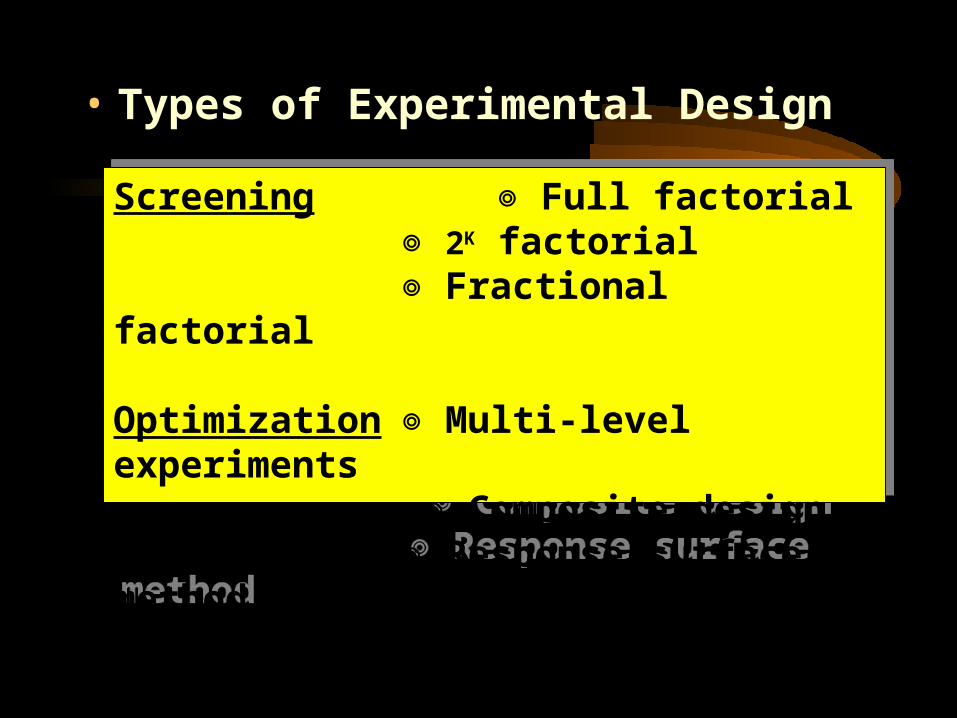
• Types of Experimental Design
Screening Full factorial◎ ◎ 2K factorial ◎ Fractional factorial
Optimization Multi-level experiments◎ ◎ Composite design
◎ Response surface method
Screening Full factorial◎ ◎ 2K factorial ◎ Fractional factorial
Optimization Multi-level experiments◎ ◎ Composite design
◎ Response surface method
• I2 Formulate Optimum Model
◎The vital few important X’s were identified and characterized in I1. The tools in I2 follow a methodology for establishing levels of these X’s that will provide improved performance for the Y.
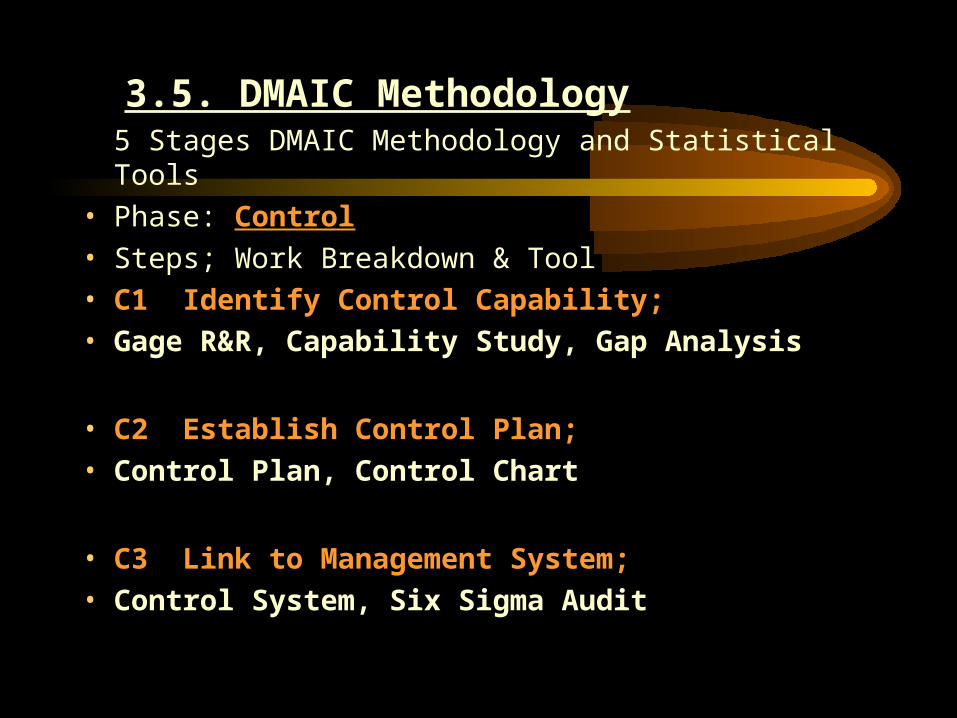
3.5. DMAIC Methodology5 Stages DMAIC Methodology and Statistical Tools
• Phase: Control
• Steps; Work Breakdown & Tool
• C1 Identify Control Capability;
• Gage R&R, Capability Study, Gap Analysis
• C2 Establish Control Plan;
• Control Plan, Control Chart
• C3 Link to Management System;
• Control System, Six Sigma Audit
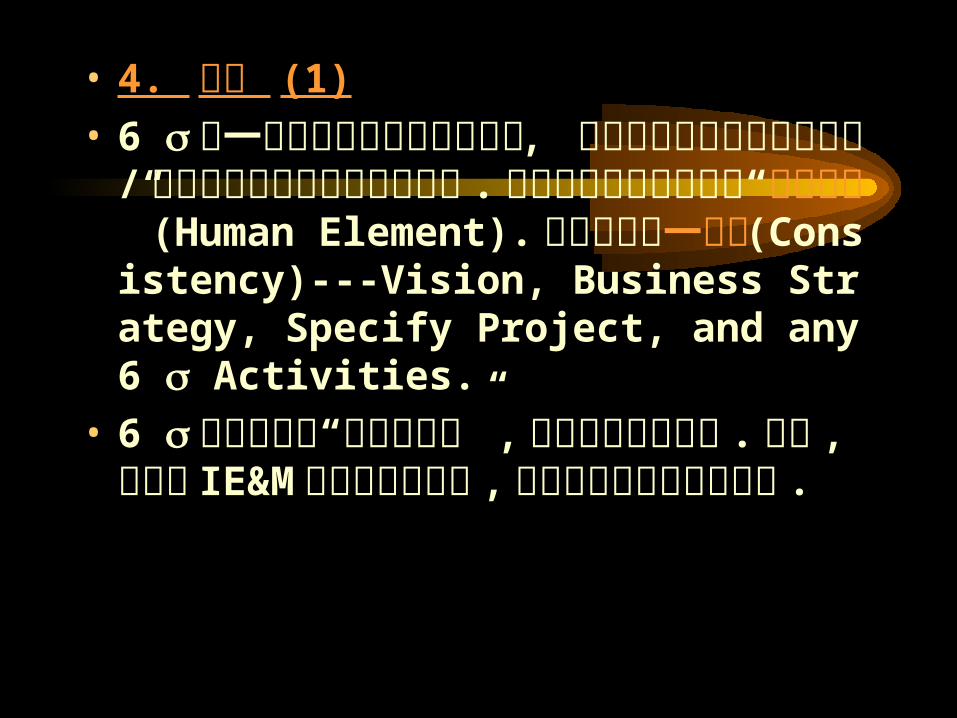
• 4. 結語 (1)
• 6 是一以統計為基礎之品質系統 , 目的在使企業或組織的產品 / 服務品質達到近於完美的境界 .盡量減少決策過程中的“人為因素” (Human Element). 成功取決於一致性(Consistency)---Vision, Business Strategy, Specify Project, and any 6 Activities.
• 6 品質系統猶“舊酒裝新瓶” ,但有較強的結構性 . 其中 ,更強化 IE&M 的角色與重要性 ,非其他品質系統所能比擬 .

• 4. 結語 (2)
• 學習 (Learning) 、價值觀 (Value) 與創新 (Innovation)為企業思想的核心 , 其凌駕階級與傳統之上 . 以學習建立自信 , 有勇氣嘗試 , 有勇氣追求與動手做以前認為不可能的事 . 一旦達成自我實現後 , 學習這個重要觀念就站上價值觀的中央舞台上 . 『持續學習 ,並將其轉化為行動的欲望與能力』 .
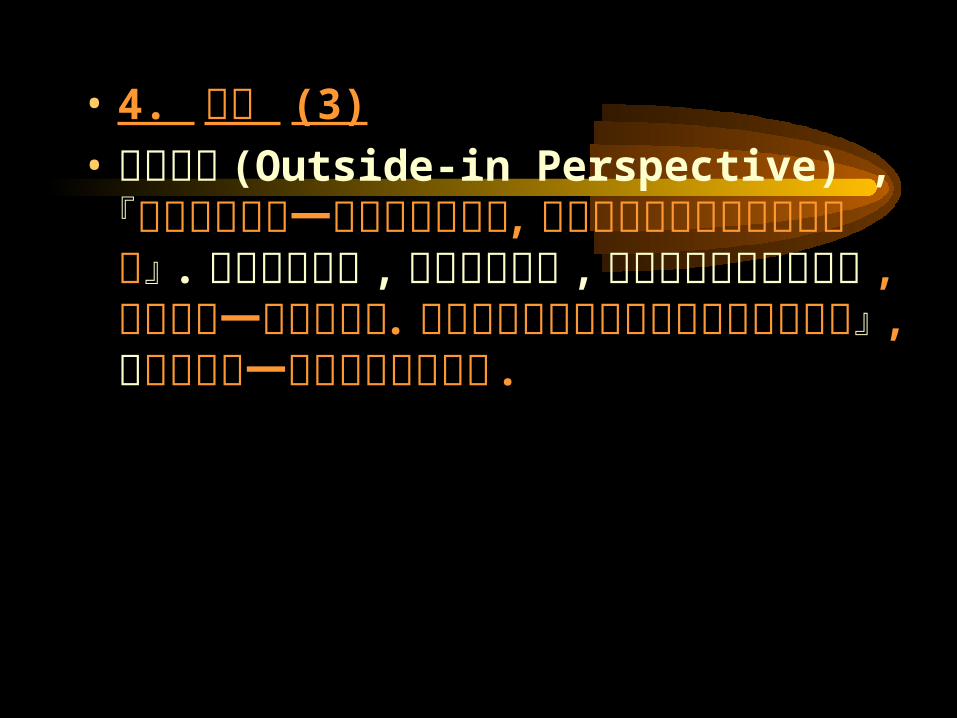
• 4. 結語 (3)
• 外部觀點 (Outside-in Perspective) , 『由外向內看是一個很重要的想法 ,強迫自己每件事都由外向內看』 . 以過程為導向 ,持續不斷改進 ,滿足顧客的需求與期望 ,『顧客把一切看在眼底 .我們無法將任何事隱藏著不讓顧客看到』 , 『必須讓每一員工都關心顧客』 .
•報 告 完 畢•敬 請 指 教•萬 分 謝 謝