Embed Size (px)
Citation preview

For a Unique CompanyFocusing on Asia
Share together to builda low-carbon society.
This document usesan easy-to-read
universal design font.
AN
NU
AL R
EP
OR
T 2014 MA
ND
OM
CO
RP
OR
ATIO
N
Annual Report 2014

Contents
Philosophy / Profile / Contents Business Review
Overview by Segment
Financial Data
Consolidated Financial Indicators
Management Information
Corporate Data
Executives, Audit & Supervisory Board Members
Company Outline / Stock and Shareholder Information
Analyses of Management and Finances
Consolidated Financial Statements
Special Feature
Mandom's Distinctive Presence in Asia
Profile, Contents
Mandom's Philosophy
Financial Highlights
Segment Information
Mandom Group Vision
Message from Top Management
This annual report contains forward-looking statements concerning Mandom's current plans, strategies, beliefs and performance.
These forward-looking statements include statements other than those based on historical fact and represent the assumptions and
beliefs of management based on information currently available. Mandom therefore wishes to caution readers that actual results may
differ materially from expectations, and that forward-looking statements are subject to a number of foreseen and unforeseen risks
and uncertainties. All amounts have been rounded to the nearest whole unit.
Regarding Forward-Looking Statements
Profile
Mandom provides comfortable lifestyles supported by health and beauty. Based on this philosophy we aim to carry out
business as an "Only One" company in Asia with global management expertise.
Mandom has focused on men's cosmetics since the company's founding in 1927. Starting with Gatsby, a top men's
cosmetic brand in Asia, our lineup includes Lúcido, Lúcido-L, Bifesta, Pixy, and Pucelle. We offer a wide range of
products that create lifestyle value for consumers based on consumer input in the categories of hair styling, face and
body care, skin care, and make-up. We ship over one billion products annually.
Making an early mark in the cosmetics industry, Mandom began expanding outside of Japan in 1958 to nine countries
and regions across Asia, particularly Indonesia, via 11 overseas group companies. Beyond Asia, our products have
become consumer favorites in regions worldwide, including Africa, Europe, and North America.
In the fiscal year ending March 31, 2015, the initial year of our MP-11 Middle-Range Plan, we will undertake measures
to accelerate growth in Asia and break new ground in additional fields of business.
Mandom's PhilosophyAiming to Provide a Comfortable Lifestyle Supported by Health and Beauty
Mandom's Philosophy/ Aiming to Provide a Comfortable Lifestyle Supported by Health and Beauty
●The Concept of Our Philosophy
Ou
r P
hilo
so
ph
y
Philosophy, DNA
"Only One" and the Spirit of "OYAKUDACHI"
Our Principles
Our Values
Our Mission
The Mission: Contribute
to a Comfortable Life
for Consumers
The Values to Be
Retained to Realize
Our Mission
The Principles to Make
Our Values Fully
Understood
The Operational
Foundation of the
Mandom Group
p1
p2
p3
p4
p5
p7
p13
Experiencing beauty and the feeling of excitement
and gratification beauty produces, has a positive
impact on the human body and mind, resulting in
a healthy condition. This is why we adhere to the
words, "health and beauty."
In our opinion, contributions to a comfortable
life can be achived by creating valuable and
attractive products or services that appeal to the
consumers' sense of beauty, and by acquiring as
many customers as possible. We aim, above all,
to maximize consumer satisfaction.
Notes to Consolidated Financial Statements
p17
p25
p27
p33
p38
p51
p52
mandom Annual Report 20141 mandom Annual Report 2014 2
Men'sGrooming Business
Women'sCosmetics Business
Women'sCosmetries Business
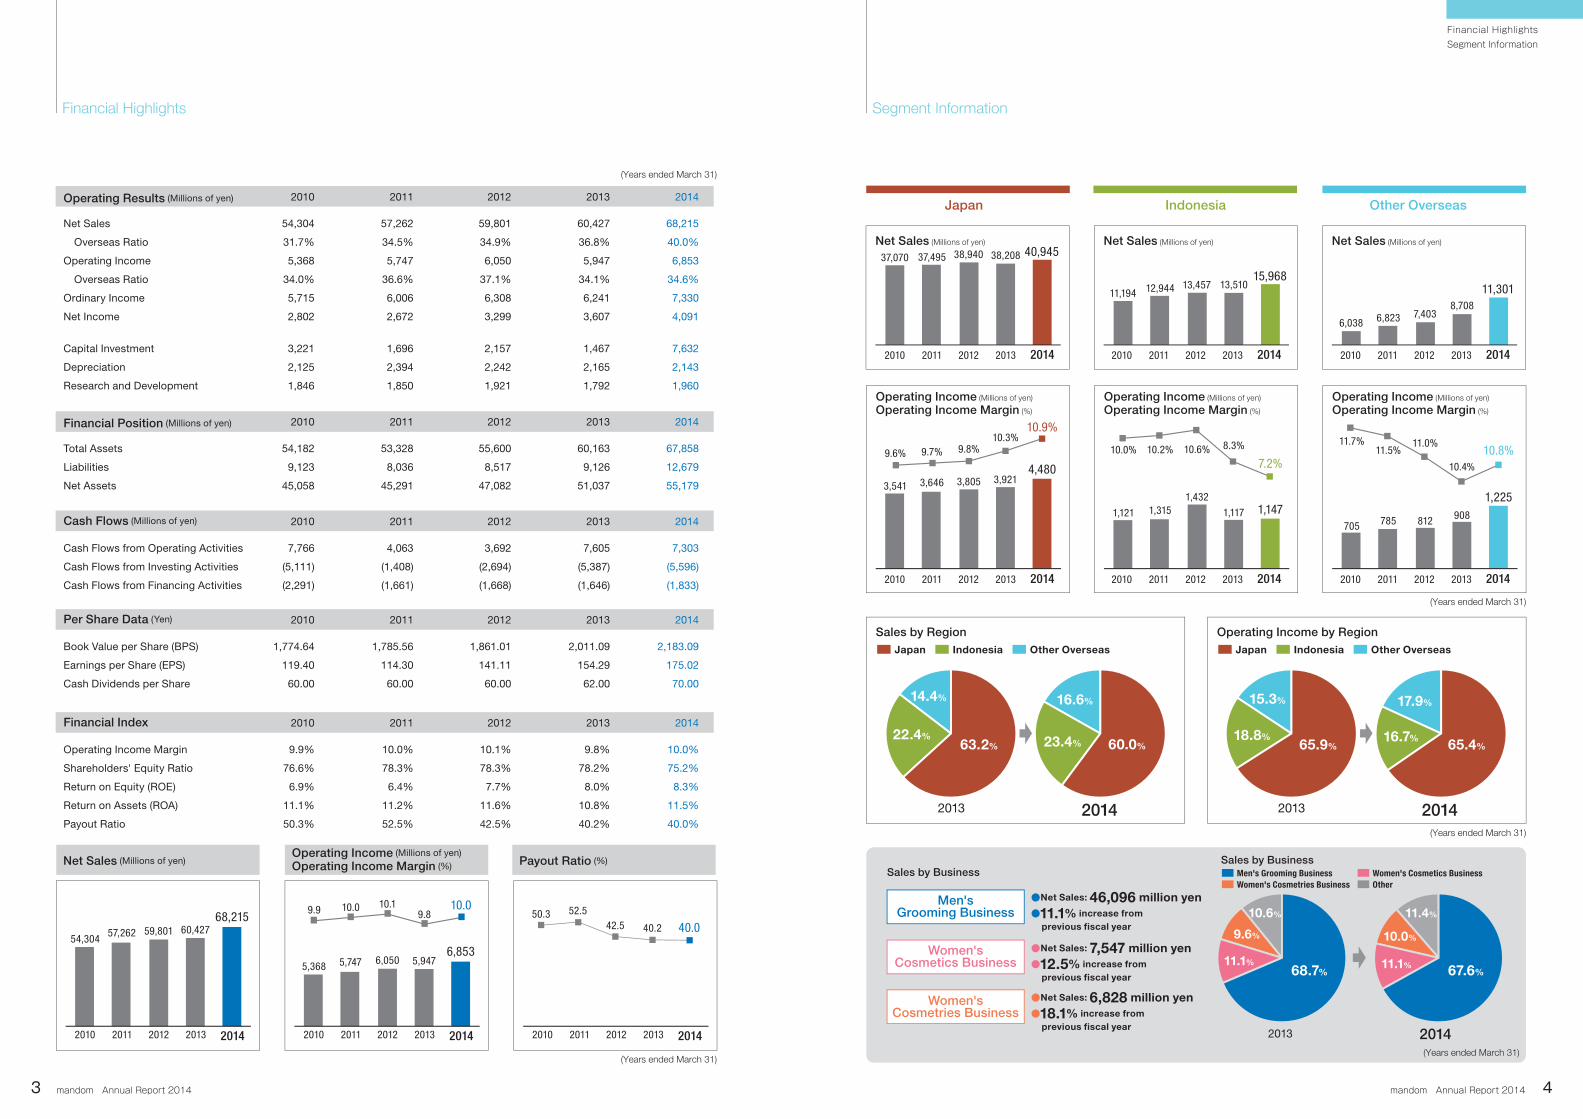
●Net Sales: 46,096 million yen
●11.1% increase from
previous fiscal year
●Net Sales: 7,547 million yen
●12.5% increase from
previous fiscal year
●Net Sales: 6,828 million yen
●18.1% increase from
previous fiscal year
■ Japan ■ Indonesia ■ Other Overseas
■ Men's Grooming Business ■ Women's Cosmetics Business
■ Women's Cosmetries Business ■ Other
■ Japan ■ Indonesia ■ Other Overseas
Japan Indonesia Other Overseas2010
54,304
31.7%
5,368
34.0%
5,715
2,802
3,221
2,125
1,846
2014
68,215
40.0%
6,853
34.6%
7,330
4,091
7,632
2,143
1,960
2011
57,262
34.5%
5,747
36.6%
6,006
2,672
1,696
2,394
1,850
2012
59,801
34.9%
6,050
37.1%
6,308
3,299
2,157
2,242
1,921
2013
60,427
36.8%
5,947
34.1%
6,241
3,607
1,467
2,165
1,792
Net Sales
Overseas Ratio
Operating Income
Overseas Ratio
Ordinary Income
Net Income
Capital Investment
Depreciation
Research and Development
2010
54,182
9,123
45,058
2014
67,858
12,679
55,179
2011
53,328
8,036
45,291
2012
55,600
8,517
47,082
2013
60,163
9,126
51,037
Total Assets
Liabilities
Net Assets
2010
7,766
(5,111)
(2,291)
2014
7,303
(5,596)
(1,833)
2011
4,063
(1,408)
(1,661)
2012
3,692
(2,694)
(1,668)
2013
7,605
(5,387)
(1,646)
Cash Flows (Millions of yen)
Cash Flows from Operating Activities
Cash Flows from Investing Activities
Cash Flows from Financing Activities
2010
1,774.64
119.40
60.00
2014
2,183.09
175.02
70.00
2011
1,785.56
114.30
60.00
2012
1,861.01
141.11
60.00
2013
2,011.09
154.29
62.00
Per Share Data (Yen)
Book Value per Share (BPS)
Earnings per Share (EPS)
Cash Dividends per Share
2010
9.9%
76.6%
6.9%
11.1%
50.3%
2014
10.0%
75.2%
8.3%
11.5%
40.0%
2011
10.0%
78.3%
6.4%
11.2%
52.5%
2012
10.1%
78.3%
7.7%
11.6%
42.5%
2013
9.8%
78.2%
8.0%
10.8%
40.2%
Financial Index
Operating Income Margin
Shareholders' Equity Ratio
Return on Equity (ROE)
Return on Assets (ROA)
Payout Ratio
Net Sales (Millions of yen)Operating Income (Millions of yen)
Operating Income Margin (%) Payout Ratio (%)
Net Sales (Millions of yen)40,945
37,070 37,495 38,940 38,208
20142010 2011 2012 2013 20142010 2011 2012 2013 20142010 2011 2012 2013
20142010 2011 2012 2013 20142010 2011 2012 2013 20142010 2011 2012 2013
Operating Income (Millions of yen)
Operating Income Margin (%)
Sales by Region
Sales by Business
Operating Income by Region
3,541
9.6%
3,646
9.7%
3,805
9.8%
3,921
10.3%10.9%
4,480
54,30457,262 59,801 60,427
68,215
20142010 2011 2012 2013
5,368 5,747 6,050 5,9476,853
20142010 2011 2012 2013 20142010 2011 2012 2013
9.9 10.0 10.19.8
10.050.3 52.5
42.5 40.2 40.0
Net Sales (Millions of yen)
11,301
6,0386,823 7,403
8,708
Operating Income (Millions of yen)
Operating Income Margin (%)
705
11.7%
785
11.5%
812
11.0%
908
10.4%
10.8%
1,225
Net Sales (Millions of yen)
15,968
11,194 12,944 13,457 13,510
Operating Income (Millions of yen)
Operating Income Margin (%)
1,121
10.0%
1,315
10.2%
1,432
10.6%
1,117
8.3%
7.2%
1,147
2013 2014 2013 2014
65.4%
17.9%
16.7%65.9%
15.3%
18.8%60.0%
16.6%
23.4%63.2%
14.4%
22.4%
Sales by Business
2013 2014
67.6%11.1%
11.4%
10.0%
68.7%11.1%
10.6%
9.6%
Financial Highlights Segment Information
Operating Results (Millions of yen)
Financial Position (Millions of yen)
(Years ended March 31)
(Years ended March 31)
(Years ended March 31)
(Years ended March 31)
(Years ended March 31)
Financial HighlightsSegment Information
mandom Annual Report 20143 mandom Annual Report 2014 4

196019581927 1962 1964 1966 1968 1970 1972 1974 1976 1978 1980 1982 1983 1984 1985 1986 1987 1988 1989 1990 1991 1992 1993 1994 1995 1996 1997 1998 1999 2000 2001 2002 2003 2004 2005 2006 2007 2008 2009 2010 2011 2012 2013 2014 2015
MP-2Apr. 1987-Mar. 1990
MP-1Apr. 1981-Mar. 1987
MP-3Apr. 1990-Mar. 1993
MP-4Apr. 1993-Mar. 1996
MP-5Apr. 1996-Mar. 1999
MP-6Apr. 1999-Mar. 2002
MP-7Apr. 2002-Mar. 2005
MP-8Apr. 2005-Mar. 2008
MP-9Apr. 2008-Mar. 2011
MP-10Apr. 2011-Mar. 2014
Improving safetyBoosting growth
potential andprofitability
Putting sustainablegrowth on track
Building a newrevenue base
Accelerating thegrowth potentialof the Group's
business
Restart of internationalization efforts
Set-up of companies in various countries in full progress: Implementation of Mandom's management philosophy and marketing
Boosting growthpotential andprofitability
Building a newrevenue base
Boosting growthpotential andprofitability
Promoting groupmanagement
For more details see the Special Feature on P13
For more details see the Special Feature on P13
Expansion and cultivation of new territory:
Strategic move to achieve further growth
For more details see the Special Feature on P13
Initial overseas development: Creating a business model
Middle-Range Plans
1982 1983 1984 1985 1986 1987 1988 1989 1990 1991 1992 1993 1994 1995 1996 1997 1998 1999 2000 2001 2002 2003 2004 2005 2006 2007 2008 2009 2010 2011 2012 2013 2014 2015
Mandom has established international operations in Asia
with a focus on products increasingly tailored for the
Asian market; now it aims to further diversify and
globalize its management.
To accomplish these objectives, we promote an
integrated global approach while accepting diverse world
views and providing attentive response on a local basis.
2016
2016
2017
2017
MP-11Apr. 2014-Mar. 2017
For more details,see the Message from
Top Management on P11
●19
58 ・
Tech
nical
tie-u
p with
a lo
cal c
ompan
y in
Man
ila, P
hilip
pines,
as fi
rst o
vers
eas e
ndea
vor,
Tanc
ho C
orpora
tion
begins
oper
ating
●19
27 ・
Estab
lishe
d
●19
69 ・
Loca
l joint
vent
ure s
tarte
d in In
donesia
●19
88 ・
Loca
l joint
vent
ure s
tarte
d in S
ingap
ore
●19
89 ・
Loca
l joint
vent
ure s
tarte
d in Ta
iwan
●19
90 ・
Loca
l joint
vent
ure s
tarte
d in T
haila
nd
●19
92 ・
Loca
l joint
vent
ure s
tarte
d in th
e Phil
ippine
s
●19
93 ・
Loca
l joint
vent
ure s
tarte
d in H
ong K
ong
・PT Ta
ncho
Indone
sia T
bk list
ed o
n th
e Jak
arta
Sto
ck
Excha
nge (
curre
ntly
the I
ndon
esia
Stock
Exc
hang
e)
●20
08 ・
Loca
l sub
sidiar
y est
ablis
hed in
Chin
a
●20
07 ・
PT M
andom
Indon
esia
Tbk a
chiev
es
annu
al sa
les o
f 1 tr
illion
rupiah
●20
02 ・
Began
pro
mot
ing g
roup
man
agem
ent a
s
part o
f 7th
thre
e-ye
ar M
iddle-
Range P
lan
・Sta
rted m
arke
ting
Gatsb
y and
Lúc
ido-L
simult
aneo
usly
in Asia
●20
11 ・
Efforts
star
t on
develo
ping in
to a
n "O
nly O
ne" c
ompan
y
in Asia
with
a st
reng
th in
glob
al m
anag
emen
t
Consolidated
Net Sales
Non-consolidated
Net Sales
●20
13 ・
Capita
l inve
stm
ent i
n Ja
pan a
nd In
donesia
to e
stab
lish
produc
tion
syst
em fo
r the
Asia
n m
arke
t
・PT M
andom
Indone
sia T
bk ach
ieves
ann
ual s
ales
of 2
trilli
on ru
piah
●20
12 ・
Excha
nge-
style
gro
up tr
aining
syst
em st
arte
d as p
art o
f
plan to
train
glo
bal per
sonn
el
・Loca
l sub
sidiar
y est
ablis
hed in
India
・Group
Mar
ketin
g Stra
tegy D
ivisio
n an
d Pro
ductio
n Stra
tegy
Divisio
n se
t up to
buil
d a su
pply sy
stem
to e
stab
lish
an
adva
ntag
e in
the A
sian
mar
ket
●19
99 ・
Loca
l joint
vent
ure s
tarte
d in K
orea
●19
97 ・
Loca
l joint
vent
ure s
tarte
d in M
alays
ia
●19
96 ・
Loca
l joint
vent
ure s
tarte
d in C
hina
Render of Completed Indonesia Head Office and Plant
Mandom Group VisionAiming to Be an "Only One" Company in Asia with Global Management Expertise
Accepting diverse world views and
providing attentive response while
promoting an integrated global approach Acceleratinggrowth and promoting
the development ofnew businesses in Asia
Mandom Group Vision / Aiming to Be an "Only One" Company in Asia with Global Management Expertise
mandom Annual Report 20145 mandom Annual Report 2014 6

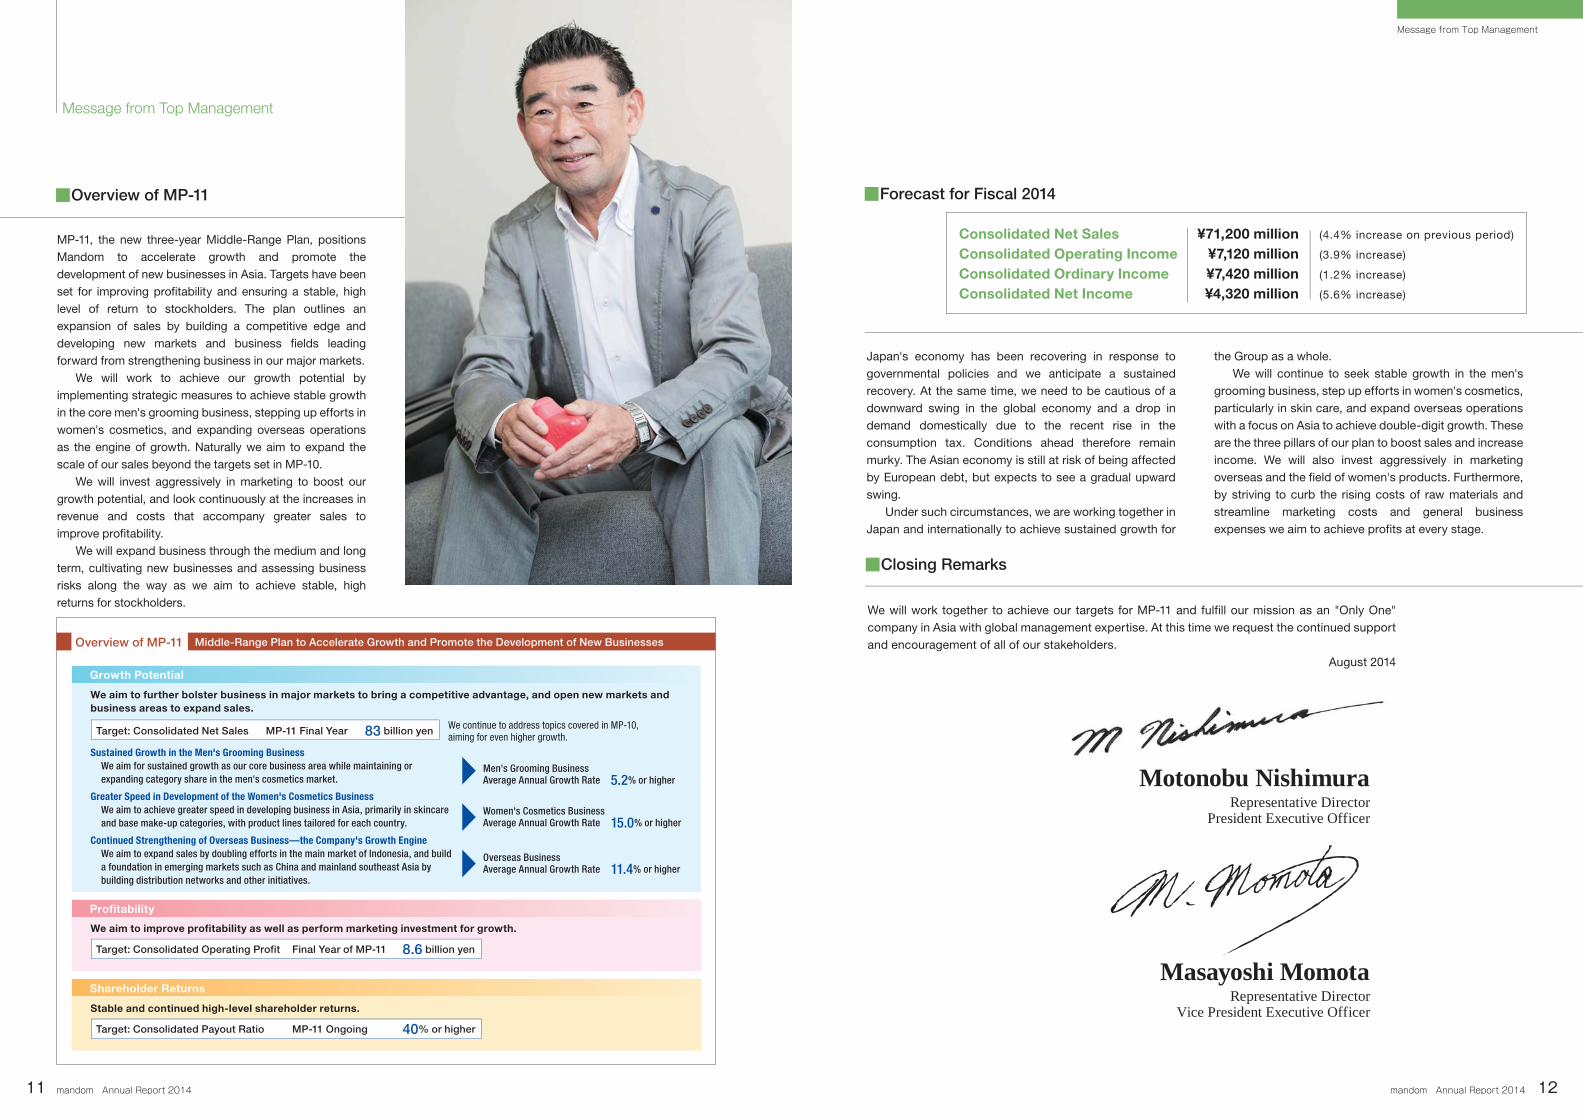
Representative Director
President Executive Officer
Motonobu Nishimura
Representative Director
Vice President Executive Officer
Masayoshi Momota
In fiscal 2013 the Group worked toward sustained growth by implementing strategic measures to achieve stable growth in the core men's grooming business, by stepping up efforts in women's cosmetics, and by continuing to expand overseas operations with Asia as the engine of growth. Summer season product rollouts and promotions were enhanced in Japan, with new products released and marketed for the men's hair styling market and middle-aged men's market. Overseas, we stepped up our efforts to expand Gatsby, reflecting the conditions of individual countries while growing the women's cosmetics business in Asia. We also aggressively invested in marketing, particularly in overseas markets and the field of women's products, worked to curb the rising costs of raw materials, and streamlined marketing costs and general business expenses.
As a result of these efforts, sales were strong in Japan
led by Gatsby hair styling products and the release of new Lúcido deodorant series products for middle-aged men. Overseas, thanks to strong sales primarily for Gatsby products and higher-than-usual figures due to the devaluation of the yen, net sales reached ¥68,215 million, a 12.9% increase over the previous fiscal year. In terms of income, even though we made aggressive marketing investments both in Japan and overseas, a decrease in the cost-to-sales ratio, mainly reflecting cost-cutting measures, led to an operating income increase of 15.2% to 6,853 million yen, a 17.4% increase in net ordinary income to 7,330 million yen, and a 13.4% year-on-year net income increase to 4,091 million yen.
All figures for sales and income at every stage were the highest on record for the company and exceeded targets set at the beginning of the fiscal year.
Strong sales both internationally and in Japan plus a favorable
exchange rate have contributed to record net sales and income.
Message from Top Management
Fiscal 2013 (year ended March 31, 2014) was the final year of our 10th three-year Middle-Range Plan ("MP-10," 2011–2013). We achieved record-breaking net sales and net income this year, exceeding even our MP-10 numerical targets.
The fiscal year starting April 1, 2014 is the initial year of MP-11, our 11th three-year plan that will last until March 31, 2017. The goal of the current business plan is to accelerate growth and promote the launch of new businesses in Asia. Our aim is to sustain revenue increases by systematically investing management resources in expanding the Group's business stage by stage.
We aim to work together at the Mandom Group to implement our philosophy of providing comfortable lifestyles supported by health and beauty while aiming to live up to our reputation as an "Only One" company based in Asia with global management expertise.
■Overview of Fiscal 2013
To be an "Only One" company in Asia with global
management expertise, we are accelerating
growth and promoting the development of new
businesses in Asia.
Consolidated Net Sales
Consolidated Operating Income
Consolidated Ordinary Income
Consolidated Net Income
¥68,215 million
¥6,853 million
¥7,330 million
¥4,091 million
(12.9% increase on previous period)
(15.2% increase)
(17.4% increase)
(13.4% increase)
Message from Top Management
mandom Annual Report 20147 mandom Annual Report 2014 8

capital, which is causing very rapid globalization. Moreover, the speed of growth is too fast for business growth in any single country to be handled with a uniform approach. To do business in Asia now requires the ability to adapt to such changes.
● An "Only One" Company in Asia with Global
Management Expertise
Mandom has set targets for the medium and long term in line with its ideal image as an "Only One" company in Asia
with global management expertise. In the changing Asian marketplace Mandom aims to provide attentive response based on local understanding and global integration. We have set high targets that will allow us to cope with the rapid growth of markets and become the type of company we aim to be from a medium-to-long-term perspective. On this basis, MP-11 sets a higher growth rate for the company than MP-10, anticipating the opening of new markets and business areas and responding to the accelerating growth in Asia.
● MP-10 Targets Attained
MP-10 was a three-year business plan aimed at accelerating growth for the Group. It allowed us to implement strategic measures to achieve stable growth in the core men's grooming business, step up efforts in the women's cosmetics business, and continue to expand overseas operations with Asia as the engine of growth. Our aim was to expand sales while working to improve profitability and ensure a stable, high level of return to stockholders.
Through these efforts, although we experienced sluggish sales in Japan in the women's cosmetics business and it became apparent that we were late to develop business overseas, notably in China and India where much growth is forecast, we achieved stable growth in men's grooming, mainly through Gatsby, and an aggressive marketing investment has helped us to cultivate the Asian market, enabling Mandom to achieve its growth targets. That has, in turn, led to the attainment of targets for profitability, stockholder return, and other numerical targets laid out in MP-10.
The numerical targets in MP-10 were specifically designed to accelerate growth, with actual growth rate targets set higher than in the previous Middle-Range Plan.
Even set so high, all sales targets were exceeded, which was a solid achievement.
● Starting to Take Action for MP-11 and Beyond
Mandom made capital investments in the Fukusaki Factory in Japan and in the new Head Office and Factory in Indonesia to build a production system that could meet the needs of the Asian market. We also set up a Group Marketing Strategy Office and Production Strategy Office to build a system that will drive production and marketing throughout Asia, and carried out personnel training initiatives to cultivate globally adept employees. We also began building a system with a view toward the future that extends even beyond the targets of MP-11.
● Major Changes in Asia
Asia, where Mandom does most of its business, is undergoing rapid change. Up to 2030, the countries of Asia will be entering a period in which the working population comprises a higher proportion of the total population, during which an increase in population is expected, along with economic development, leading to an expansion of the middle class and accelerating growth.
This growth is centered around an infusion of global
■Overview of MP-10 and the Drafting of MP-11
Middle-Range Plan to Accelerate Group GrowthOverview of MP-10
Numerical Targets and Results MP-10 Numerical Targets Reached
ResultsGrowth Potential
Profitability
Shareholder Returns
●Men's grooming business with
stable growth, primarily with
Gatsby
●Aggressive investment in marketing
cultivates Asian market
●Cost revision and increased
revenue result in sustained
operating margin
Issues
●Domestic stagnation in the
women's cosmetics business
●Late start developing business in
China and India
Consolidated Net Sales
Final Year Target 66 billion yen
Men's Grooming Business
Average Growth Rate Target
Gatsby
Average Growth Rate Target
Women's Cosmetics Business
Average Growth Rate Target
Overseas business
Average Growth Rate Target
▶ Result
▶ Result
▶ Result
▶ Result
Reached
Reached
Not reached
Reached
Operating Income MarginFinal Year Target
3.2%
3.6%
19.3%
9.4%
5.4%
5.9%
11.8%
11.3%
Initial year
Second year
Final year
42.5%
40.2%
40.0%
Reached
Consolidated Payout Ratio
Ongoing Target 40% or higher
Reached68.2billion yen▶ Result
▶ Result 10% Reached10.0%
▶
Message from Top Management
Message from Top Management
mandom Annual Report 20149 mandom Annual Report 2014 10
■Overview of MP-11
MP-11, the new three-year Middle-Range Plan, positions Mandom to accelerate growth and promote the development of new businesses in Asia. Targets have been set for improving profitability and ensuring a stable, high level of return to stockholders. The plan outlines an expansion of sales by building a competitive edge and developing new markets and business fields leading forward from strengthening business in our major markets.
We will work to achieve our growth potential by implementing strategic measures to achieve stable growth in the core men's grooming business, stepping up efforts in women's cosmetics, and expanding overseas operations as the engine of growth. Naturally we aim to expand the scale of our sales beyond the targets set in MP-10.
We will invest aggressively in marketing to boost our growth potential, and look continuously at the increases in revenue and costs that accompany greater sales to improve profitability.
We will expand business through the medium and long term, cultivating new businesses and assessing business risks along the way as we aim to achieve stable, high returns for stockholders.
Japan's economy has been recovering in response to governmental policies and we anticipate a sustained recovery. At the same time, we need to be cautious of a downward swing in the global economy and a drop in demand domestically due to the recent rise in the consumption tax. Conditions ahead therefore remain murky. The Asian economy is still at risk of being affected by European debt, but expects to see a gradual upward swing.
Under such circumstances, we are working together in Japan and internationally to achieve sustained growth for
the Group as a whole.We will continue to seek stable growth in the men's
grooming business, step up efforts in women's cosmetics, particularly in skin care, and expand overseas operations with a focus on Asia to achieve double-digit growth. These are the three pillars of our plan to boost sales and increase income. We will also invest aggressively in marketing overseas and the field of women's products. Furthermore, by striving to curb the rising costs of raw materials and streamline marketing costs and general business expenses we aim to achieve profits at every stage.
■Closing Remarks
Representative DirectorPresident Executive Officer
Motonobu Nishimura
Representative DirectorVice President Executive Officer
Masayoshi Momota
We will work together to achieve our targets for MP-11 and fulfill our mission as an "Only One" company in Asia with global management expertise. At this time we request the continued support and encouragement of all of our stakeholders.
August 2014
Middle-Range Plan to Accelerate Growth and Promote the Development of New Businesses Overview of MP-11
Growth Potential
Profitability
Shareholder Returns
We aim to improve profitability as well as perform marketing investment for growth.
Stable and continued high-level shareholder returns.
Men's Grooming BusinessAverage Annual Growth Rate 5.2% or higher
Women's Cosmetics BusinessAverage Annual Growth Rate 15.0% or higher
Overseas BusinessAverage Annual Growth Rate 11.4% or higher
We aim to further bolster business in major markets to bring a competitive advantage, and open new markets and
business areas to expand sales.
We continue to address topics covered in MP-10, aiming for even higher growth.
Target: Consolidated Net Sales MP-11 Final Year 83 billion yen
Sustained Growth in the Men's Grooming Business
We aim for sustained growth as our core business area while maintaining or
expanding category share in the men's cosmetics market.
Greater Speed in Development of the Women's Cosmetics Business
We aim to achieve greater speed in developing business in Asia, primarily in skincare
and base make-up categories, with product lines tailored for each country.
Continued Strengthening of Overseas Business—the Company's Growth Engine
We aim to expand sales by doubling efforts in the main market of Indonesia, and build
a foundation in emerging markets such as China and mainland southeast Asia by
building distribution networks and other initiatives.
Target: Consolidated Payout Ratio MP-11 Ongoing 40% or higher
Target: Consolidated Operating Profit Final Year of MP-11 8.6 billion yen
■Forecast for Fiscal 2014
Consolidated Net Sales
Consolidated Operating Income
Consolidated Ordinary Income
Consolidated Net Income
¥71,200 million
¥7,120 million
¥7,420 million
¥4,320 million
(4.4% increase on previous period)
(3.9% increase)
(1.2% increase)
(5.6% increase)
Message from Top Management
Message from Top Management
mandom Annual Report 201411 mandom Annual Report 2014 12

Mandom's overseas business focusing on Asia was started in the Philippines in 1958 and has since expanded by providing useful products to local consumers. The resultant steady growth has led to the company's overseas business constituting 40% of consolidated sales as of March 2014.This special feature introduces the story of how Mandom, aiming to be an "Only One" company in Asia with a strength in global management, came to establish the position it holds today in Asia and examines the outlook for the company's future.
1996
Local joint venture started in China
China
1999
Local joint venture started in Korea
Korea
1993
Local joint venture started in Hong Kong
Hong Kong
2012
Local subsidiary established in India
India
1992
Local joint venture started in the Philippines
Philippines1969
Local joint venture started in Indonesia
Indonesia
1989
Local joint venture started in Taiwan
Taiwan
1990
Local joint venture started in Thailand
Thailand
1988
Local joint venture started in Singapore
Singapore
1997
Local joint venture started in Malaysia
Malaysia
□Business Development
Centered on Asia
Asia is not only a vast region that encompasses numerous ethnicities and languages; it is also an area of the world in which economic disparities, exchange risks, and other factors are complexly interrelated. Mandom works to supply products to ordinary consumers in various countries and regions, having begun its focus on creating useful products for Asia decades ago. Today the company is highly capable of responding to Asian consumers, markets, and societal change.
■Features of Mandom's Overseas Business
□Core Business:
Men's Cosmetics
Men's cosmetics are the core of Mandom's overseas business. A wide range of men's cosmetics are being sold in Japan and the market is mature. Yet in Asia the market is not yet mature or it has yet to be developed, so Mandom has taken on the role of developing markets for men's cosmetics.
Mandom's History in Overseas Business
Upon discovering consumer "wants," even in a category in which no R&D in Japan had been done before, nor any such products sold, Mandom engaged in research, development, and marketing. The company developed women's make-up, hair dye, talc, perfumed tissues, and products in many other categories for the Indonesian market.
□Entering Categories That Match
the "Wants" of Local Consumers
Mandom has built wide distribution networks in each country to ensure its products can easily reach local consumers.
□Building a Wide
Distribution Network
Mandom downsizes products and adds variations to suit the lifestyle needs and incomes of consumers.
□Products Adapted for
Local Consumers
The Start of Mandom's Overseas Business and Building of Its Business Model (1958 on)Mandom began its overseas business endeavors in 1958 by establishing a technical tie-up in the Philippines. Mandom has since worked to develop products, distribution, and sales networks that allow the company to bring useful products to ordinary consumers in various countries and regions.
□Ordinary Consumers Are
Our Main Target
Mandom targets the general public in each country and region in which it is engaged. To reach so many different consumers requires marketing tailored to each country and the ability to manufacture many product variations, including size, price, category, and field.
The Mandom Group aims to provide for people a comfortable lifestyle supported by health and beauty. We create products tailored to the needs and wants of consumers in different countries to suit a wide range of lifestyles.
Mandom strives in its overseas business to understand its customers' world views and provide attentive response to needs based on ethnic, religious, and cultural differences, also taking into consideration the historical and economic differences of disparate regions.
Size variations
Perfumed tissuesHair dye Talc
Special FeatureMandom's Distinctive Presence in Asia
Before starting with a technical tie-up with a company in the Philippines in 1958, the pomade Tancho Tique had become a hit product in Japan. Overseas Chinese merchants visiting Japan became interested in the product, and bought it in large volumes to give as gifts in their home countries. The product gained a reputation in this way by word of mouth.
One such businessman expressed interest in producing Tancho Tique locally, which took the form of a technical tie-up in the Philippines. Rather than using overseas sites for inexpensive production for import to Japan, Mandom produced the pomade abroad for sale in local overseas markets—something the company had been previously keenly interested in. This is how Mandom took its first steps into overseas business, aiming to contribute through its products.
Special Feature / Mandom's Distinctive Presence in Asia
mandom Annual Report 201413 mandom Annual Report 2014 14

□In-Store Retailing
Establishment of Sales Subsidiaries and Strengthening of Group Management (1988 on) Mandom began to set up sales subsidiaries around Asia in the mid-1980s.
To strengthen the group's management, efforts were made to unify efforts under a single business
philosophy and carry out a style of marketing unique to Mandom. An emphasis was placed on
developing overseas business through group companies in the 8th three-year Middle-Range Plan
(2002–2004).
Mandom has production centers in Japan, Indonesia, and China. These three centers are being connected closely to standardize quality and production technologies, and improve competitiveness by reducing costs.
□Establishing a Three-Base System in Asia
Mandom has a system in place that makes adjustments in products and supply destinations in each country according to changes in consumer preferences, lifestyles, and purchasing power as the times change.
□Merchandising in Various Countries
□Expanding Throughout Asia
Mandom has set up a Group Marketing Strategy Office and Production Strategy Office to establish an advantage in the Asian market and build a supply system. The Group Marketing Strategy Office maintains traditional country-by-country marketing plans in addition to which it has drafted an overall medium-to-long-term marketing strategy for the group based on quick decision-making. The Production Strategy Office works to bring together marketing with the drafting of strategies for group production and procurement.
□Improving Our Marketing and Production Strategies
Mandom is putting energy into education and training with overseas employee training and an exchange-style group training system that aims to cultivate personnel capable of working effectively in any country, enabling active transfers of personnel throughout the group.
□Building Human Resources
Toward Further Growth (2011 on)Mandom began aiming to develop into an "Only One" company in Asia with a strength in global
management starting with its 10th three-year Middle-Range Plan (2011–2013). To be able to cope
with rapidly changing markets in Asia that are growing at different rates, Mandom aims to diversify
its management and make it more international, assuring compliance with the corporate philosophy.
Mandom works to integrate globally while responding locally as it has in the past, paying close
attention to always making a positive contribution.
We plan to build upon decades of efforts overseas, establish a formidable global system, and
work toward even further growth.
Indonesia
Philippines
Singapore
Emerging markets with prospects for medium-term growth
China
India
Thailand / Philippines /Malaysia
Singapore / TaiwanHong Kong / Korea
Japan
Indonesia
UAE /Other
countries
ProductionBase
ProductDistribution
China
India
Mainland Southeast Asia
□Strengthening the System of Production
Looking ahead to future growth in Asia, we have made capital investments in Japan and Indonesia aimed not only at reinforcing and expanding production capacity but also at building a supply system that will have a positive and synergistic effect throughout the group. The Fukusaki Factory in Japan functions as a mother factory capable of producing high-quality products and developing innovations in production technology. Meanwhile, the new Cibitung Factory in Indonesia has its sights set on supplying products to all of Asia, and aims to manufacture products of high quality at low cost.
Mandom is expanding into new territory across Asia, aiming to grow even further. The markets of China, India, and mainland southeast Asia are being fostered for growth in the medium and long term as we build distribution networks and continue to improve our product lines.
Aiming to be helpful to consumers in multiple countries, an in-store strategy is needed to increase visibility in retail stores. Mandom is taking an aggressive retail approach to increase points of contact with consumers.
Special Feature / Mandom's Distinctive Presence in Asia
mandom Annual Report 201415 mandom Annual Report 2014 16

JAPAN
●Lúcido Deodorant series
●Gatsby Facial Paper
●Gatsby Rich Whip Facial Wash
market holds high potential for growth. The scalp care market is also growing significantly due to the energizing effect of surging competition; various manufacturers have been releasing a range of new scalp shampoos and scalp care products.
Initiatives in Fiscal 2013
In fiscal 2013 we strengthened the lineup of summer season products in the Gatsby brand and bolstered store promotions to prepare for the high-selling season. These initiatives, in combination with the effects of a very hot summer, helped Mandom achieve very strong sales in the face and body care market. A large number of new products brought to market by other firms intensified the competition, yet in body paper our actual market share was notably over 80%.
We released new Gatsby brand Hair Jam hair styling products that target teens, a segment of entry users whose usage rate has been contracting yearly. We aired television commercials that impressed on consumers that this was a totally new type of hair styling product; we also ran aggressive store promotions, succeeding in quickly winning product recognition. A post-release survey revealed that usage rates had turned around and were rising for high school and university students, leading to strong performance. Together with strong sales of Moving Rubber hair wax, our top product, the market share of the Gatsby brand in the hair styling category increased 2.6%.
Regarding Lúcido, we are continuing our efforts to nurture the aging care market by targeting middle-to-mature age males in their 40s, a segment with high growth potential. Regular in-store marketing, coupled with ongoing sampling and advertising aimed at promoting aging care products, began to show results, with expanded sales in the face care series with a focus on skin lotion.
Mandom also released a deodorant series for men around their 40s in February 2014 aimed at combating the body odors that develop in one's middle years. A
heightened awareness among consumers toward body odor care matched up with a trend in retail to target the middle-age segment, enabling good movement of product into stores. Publicity was conducted ahead of release, including magazine and Web tie-ins that raised the topic of "middle-age body odor." For the product release, TV commercials were aired featuring the famous couple of actor Seiichi Tanabe and actress Nene Otsuka. Mandom's efforts are drawing wide attention to middle-age body odor and to the necessity of taking action against it.
Market Environment
The domestic men's cosmetics market is worth approximately ¥120 billion, according to Mandom's calculations, and the market is continuing to expand gradually.
The hair styling market has been shrinking yearly as entry users decrease in line with falling birthrates. In
contrast, the face and body care market is expanding steadily. A shift in men's awareness has also been taking place. At one time hair styling products were the first thing that came to mind for men's cosmetics, but recently more consumers think of face care products. The last several years have also seen remarkable growth in body care. With this awakened consumer interest in face and body care, the
Men's Grooming Business
Japan
Economic Climate
Business confidence in Japan is improving overall against a backdrop of economic and financial measures taken by the national government, generating signs of a gradual recovery. Still, the higher consumption tax rate that took effect in April will color the path ahead, contributing to future uncertainty.
Cosmetics Market Environment
The scale of the cosmetics market environment in Japan is approximately ¥1.4 trillion according to METI's current production statistics for the cosmetics industry. The recent pickup in business confidence seems to have put an end to a period of long-declining sales attributable to recession and deflation. Still, in light of Japan's low birthrate and aging population the cosmetics market is considered mature and no significant growth is expected.
Mandom's Strengths in the Market
The Mandom Group's main channel is self-service sales, which includes drugstores, convenience stores, and other mass-market retailers. We also continue to develop new market categories and reinvigorate the market as the industry's top men's cosmetics manufacturer.
Mandom has also been taking measures to strengthen women's cosmetics in recent years. We have done this by leveraging existing marketing channels, by expanding our lines of high-performance, low-priced skin care products sold via self-service retailers, and by developing new body
care products for women that utilize the know-how gained from the men's cosmetics market. We aim to tap into this new market by developing unique products.
Performance for Fiscal 2013
Net sales in Japan amounted to ¥40,945 million, a 7.2% increase year on year. Sales of summer season products in our core Gatsby brand were strong, including women's body sheets. Other sales increases came from the successful launch of new Gatsby products aimed at male teens, a segment that had a low rate of hair styling product use, and the Lúcido brand launch of a new series of products aimed at combating the body odor unique to middle-aged men.
Operating income totaled ¥4,480 million, a 14.3% increase over the previous fiscal year, despite a big investment in marketing, primarily for new products.
Net Sales by Business
■Men's Grooming Business ■Women's Cosmetics Business■Women's Cosmetries Business ■Other
20142013
30,000
Net Sales / Operating Income (Millions of yen)
■Net Sales ■Operating Income
40,000
20142013
(Net Sales)
5,000
00
10,000
(Operating Income)
38,208
3,921
40,945
4,480
Share of the Men's Hair Styling Market by Sales*
20142013
0.6% market decline
45.3% 42.1%
Mandom
5.2% rise54.7% 57.9%
■Mandom ■Other
*Mandom survey (April 2012 to March 2013, monetary basis)
Business ReviewOverview by Segment
Our core sales region, constituting over
60% of the Mandom Group's sales
Future Initiatives
Under the Gatsby brand we further expanded the line-up of summer sea-son items after strong sales the previous year. We are offering a new body lotion to meet rising needs for a cool sensation, fa-cial paper for young men with skin con-cerns, and have been working in other ways to at-tract new users. In the peak demand periods for our key
(Years ended March 31)
(Years ended March 31)(Years ended March 31)
Business Review/Overview by Segment
mandom Annual Report 201417 mandom Annual Report 2014 18

Market Environment
Amid sluggish sales in recent years, the women's skin care market in Japan has seen changes in consumer purchasing behavior tending toward a bifurcation into high-priced and low-priced cosmetic items. With business confidence showing signs of picking up since last year, we have been experiencing a recovery in high-priced items and continued strength in the sale of low-priced items as before, primarily through drugstores. Players across the market have released numerous low-cost, high-performance cosmetics and the competitive climate continues to be intense.
The cleansing market, which is the core of our women's cosmetics business, remains flat, yet large in scale. By offering new concepts and value we expect to be able to increase sales in this market.
Initiatives in Fiscal 2013
Despite signs of a slight recovery in the market, in fiscal 2013 competition from various companies grew more formidable.
Under these circumstances, we worked to expand recognition of our core Bifesta brand and Water Cleansing series. In addition, we continued working to raise aware-ness of the new value of water cleansing-type cleansers' and promote their use. We regularly ran television commer-cials featuring Japanese actress and model Anna Tsuchiya and held publicity campaigns such as product samplings that focused on busy women, often charac-terized as "overtime office women." Thanks to these initiatives, sales rose steadily and the total number of bottles shipped since the initial release of the series exceeded 10 million, achieving the third highest market share in the cleansing category (as of April 2014 for self-care products, excluding system products).
Uru-Ochi Water Cleansing lotion has a dominant 70% share in lotion-type products; Uru-Ochi Water Cleansing eye make-up remover has a respectable 30% share in the point make-up remover category. Both are the top-selling items in their respective categories.
Market Environment
The women's hair styling and hair care market in Japan has been contracting in recent years in almost all product categories. Products such as hair cream and hair milk, however, along with hair oil as a non-bath treatment, are enjoying strong sales as they treat dry, brittle hair often caused by the use of hair irons and hot rollers for hair styling, items that are being used by a growing number of women.
The body care market has also been contracting from year to year. Despite this, Mandom has seen a growth trend in sticks and creams in the body sheet and perspiration control category, a changing product trend bolstered by hot weather in recent years and greater attention to energy conservation.
Initiatives in Fiscal 2013
In fiscal 2013, the women's styling market remained largely in a holding pattern.
Under these market conditions, sales were strong for the Lúcido-L Hair Wax series, core items of the brand that maintained the top share in their category while the brand's sales overall were flat. The Mandom body care series featuring Disney
body paper products we run TV commercials. All of these efforts are aimed at maintaining Mandom's top position in the product category.
We have also released new facial cleanser products amidst intense competition in face care, a category in which Mandom holds the second highest market share. To acquire
new users we have pro-duced an aerosol facial cleanser that creates a creamy, fine foam for young men who seek a facial cleanser that is al-so gentle on the skin.
For the Lúcido brand, we will continue
to run TV commercials and carry out other advertising for our deodorant series, as well as host samplings to offer
consumers new opportunities to try the product, aimed at expanding the user base. We have renewed the package design and have expanded the lineup of our strong-selling skin care series.
Lastly, we have entered hair coloring with a new product for dyeing gray hair, the One Push Care Color series. The brand is for middle-aged men and offers a wide range of products.
Women's Cosmetics Business
Women's Cosmetries Business●Lúcido Skin Care series
●Lúcido-L Argan Rich Oil series
●Lúcido One Push Care Color series
●Mandom Body Sheet
●Mandom Body Milk●Bifesta Water Cleansing series
●Bifesta renewal
●Lúcido-L Hair Wax series
Business ReviewOverview by Segment
Future Initiatives
In addition to the initiatives undertaken to date to expand sales of Bifesta products, we will undertake a brand renewal in the autumn. We are aiming to expand further by proposing new value. We hope to attract new product users
characters enjoyed very strong performance due to the effects of a very hot summer. The Disney Body Sheet in particular captured the fourth largest share in its category during the first fiscal year of its release, contributing significantly to double-digit growth in the domestic women's cosmetries business.
Future Initiatives
To build sales, the new "Powder in Milk" series is being re-leased in the hair cream and hair milk category, the only strong-selling category in the women's hair styling market
for the Lúcido-L brand. In the autumn we will release the Argan Rich Oil series for effectively treating damaged hair, as part of an effort to expand our product lines to meet a growing diversity of needs for keeping hair beautiful. In the body care category, we will renew our Body Sheet and Splash Deo Water body care series products featuring vari-ous Disney characters, introduce additional deodorant sprays, and strengthen in-store promotions to expand sales. We will also re-lease a new Body Milk product in the autumn and expand our product lines to meet autumn/ winter needs for moistur-izing.
by implementing a package design facelift combined with a boost in content quality for the cleansing series that aims to alleviate darkening of the skin and make skin more clear. We will run new TV commercials to continue building brand recognition and developing the brand.
Business Review/Overview by Segment
mandom Annual Report 201419 mandom Annual Report 2014 20

INDONESIA
Economic Climate
Indonesia has been experiencing rapid economic growth in recent years. Income levels have risen and living conditions have been improving drastically. Year by year, with rising income levels, the middle class has been expanding and the number of people with low incomes has been decreasing, leading to growing domestic demand. Although the accelerating inflation over the last several years must also be watched carefully, the base of the consumer market is broadening. The population of Indonesia is the fourth largest in the world at 240 million, and this large market represents a promising market and has been attracting new market entrants from abroad.
Cosmetics Market Environment
In the cosmetics market, consumer confidence is growing along with rising incomes, and consumer behavior is changing rapidly. We are seeing interest in value-added products and indications of a rise in the unit price of purchases, which bode well for high growth in the future. Significant changes are starting to take place in distribution as well. The traditional market of privately run shops is shifting to a modern market that is dominated by major retailers from overseas. In this modern market, European cosmetics manufacturers are intensifying efforts to expand their presence in both men's and women's markets and a climate has emerged that sees both global and local firms in fierce competition.
Mandom's Strength in the Market
Mandom has been doing business in Indonesia since 1969. In an age when the concept of men's cosmetics had yet to be established in consumers' minds, we developed products that reflected the desires of local consumers and expanded the business while opening up and cultivating the men's cosmetics market ourselves. We built a distribution network that now supplies products to nearly all of the over 18,000 islands in the archipelago, working in cooperation with local distributors. Mandom has a share of over 70% in the hair styling products market and is the country's top manufacturer of men's cosmetics. We also continue to see growth in women's cosmetics, primarily make-up and fragrances, with sales in Indonesia split roughly evenly between men's and women's products. Mandom has become the cosmetics maker most familiar to consumers in Indonesia today.
Performance for Fiscal 2013
Sales for the last fiscal year in Indonesia were strong in women's cosmetics, focused on the Pixy brand. Foreign trade, primarily selling products to Dubai, expanded steadily. In combination with the lower value of the yen, a yen equivalent increase in net sales was recorded: 18.2% year-on-year to 159.68 million yen.
Resources were aggressively funneled into marketing for a high-growth modern market, and even though there was a rise in labor costs, operating income rose 2.6% year-on-year to 11.47 million yen.
increase sales commensurately.In hair styling products, our flagship Water Gloss series has
been selling well, and we continue to market hair wax products. In-store promotions and wider store distribution efforts are being made to expand recognition and cultivate the market.
Future Initiatives
In the flagship hair styling category for Gatsby products, we introduced the new Styling Mist series. TV commercials were aired to quickly expand consumer recognition and capture the market. We produced numerous variations, helping to maintain a high share of the hair styling market in an environment of strong competition. In the growing face and body market, to increase our share we are responding flexibly and speedily to a rapidly changing market environment and consumer wishes.
Market Environment
Rising income levels and an accompanying increase in consumer confidence, together with a growing fashion consciousness, have led to steady continued growth in the
Men's Grooming Business
Market Environment
As with men's cosmetics, the rise in disposable income and increasing awareness of cosmetics among women continue to spur growth in the women's cosmetics market. Under these circumstances, Western cosmetics brands are entering a modern market while sales of Halal-certified brands are also selling well. The latter are important in Indonesia, a country where the population is predominantly Muslim. The market is expected to continue growing, in combination with increased competition due to further market entries and more products being developed to meet diversifying consumer needs.
Initiatives in Fiscal 2013
In the last fiscal year, even though competition grew more intense, the market scale grew steadily.
In this environment, we completely renewed the series for the previous year's flagship product, Two Way Cake foundation, under our Pixy make-up brand, and in the first half of this fiscal year put energy into continuing to introduce products into stores. We then did a thorough renewal of our high-end series Ultimate line and other make-up lines. Together with these efforts we aired TV commercials, and held promotional events
to keep the brand fresh and stimulate consumer demand. All of these efforts are showing good results.
In our skin care series we released White-Aqua Gel Cream, a new whitener to meet local consumer needs for skin whitening, improving our lineup. Existing items also performed well, leading to strong growth.
Future Initiatives
In the future we will continue to strengthen the Pixy brand with its core products in the make-up category and develop make-up products aside from Two Way Cake, and also venture further into the skin care category, which has a large-scale market.
Women's Cosmetics Business
●Gatsby Styling Wax
●Gatsby Eau de Parfum
●Pixy White-Aqua Gel Cream
20142013
Net Sales by Business
■Men's Grooming Business ■Women's Cosmetics Business■Women's Cosmetries Business ■Other
10,000
15,000
20142013
(Net Sales)
1,000
00
2,000
(Operating Income)15,968
13,510
1,147
Net Sales / Operating Income (Millions of yen)
■Net Sales ■Operating Income
1,117
Indonesia
Business ReviewOverview by Segment
The largest business area and growth
leader in the overseas group
men's cosmetics market, which is expected to remain strong. Notably, the rise of major chain retailers is leading to healthy conditions in a modern market. In particular, rising consumer awareness toward face and body care, plus the fact that the face and body category is a specialty area for Western cosmetics companies, makes the market highly prominent and the competitive climate is expected to intensify.
Initiatives in Fiscal 2013
In the last fiscal year, Mandom focused on reinforcing efforts in men's grooming, especially the face and body category with the Gatsby brand.
Mandom began selling facial cleansing paper as a new genre in the facial products category. Efforts were redoubled in in-store promotions to show consumers how to use products and to capture the market early. In body care products, to meet needs from rising fashion consciousness among consumers,
the new fragrance series Urban Cologne was released and has been selling extremely well. This was followed by Gatsby Eau de Parfum. We aim to expand our lines and
(Years ended March 31)
(Years ended March 31)
Business Review/Overview by Segment
mandom Annual Report 201421 mandom Annual Report 2014 22
Market Environment
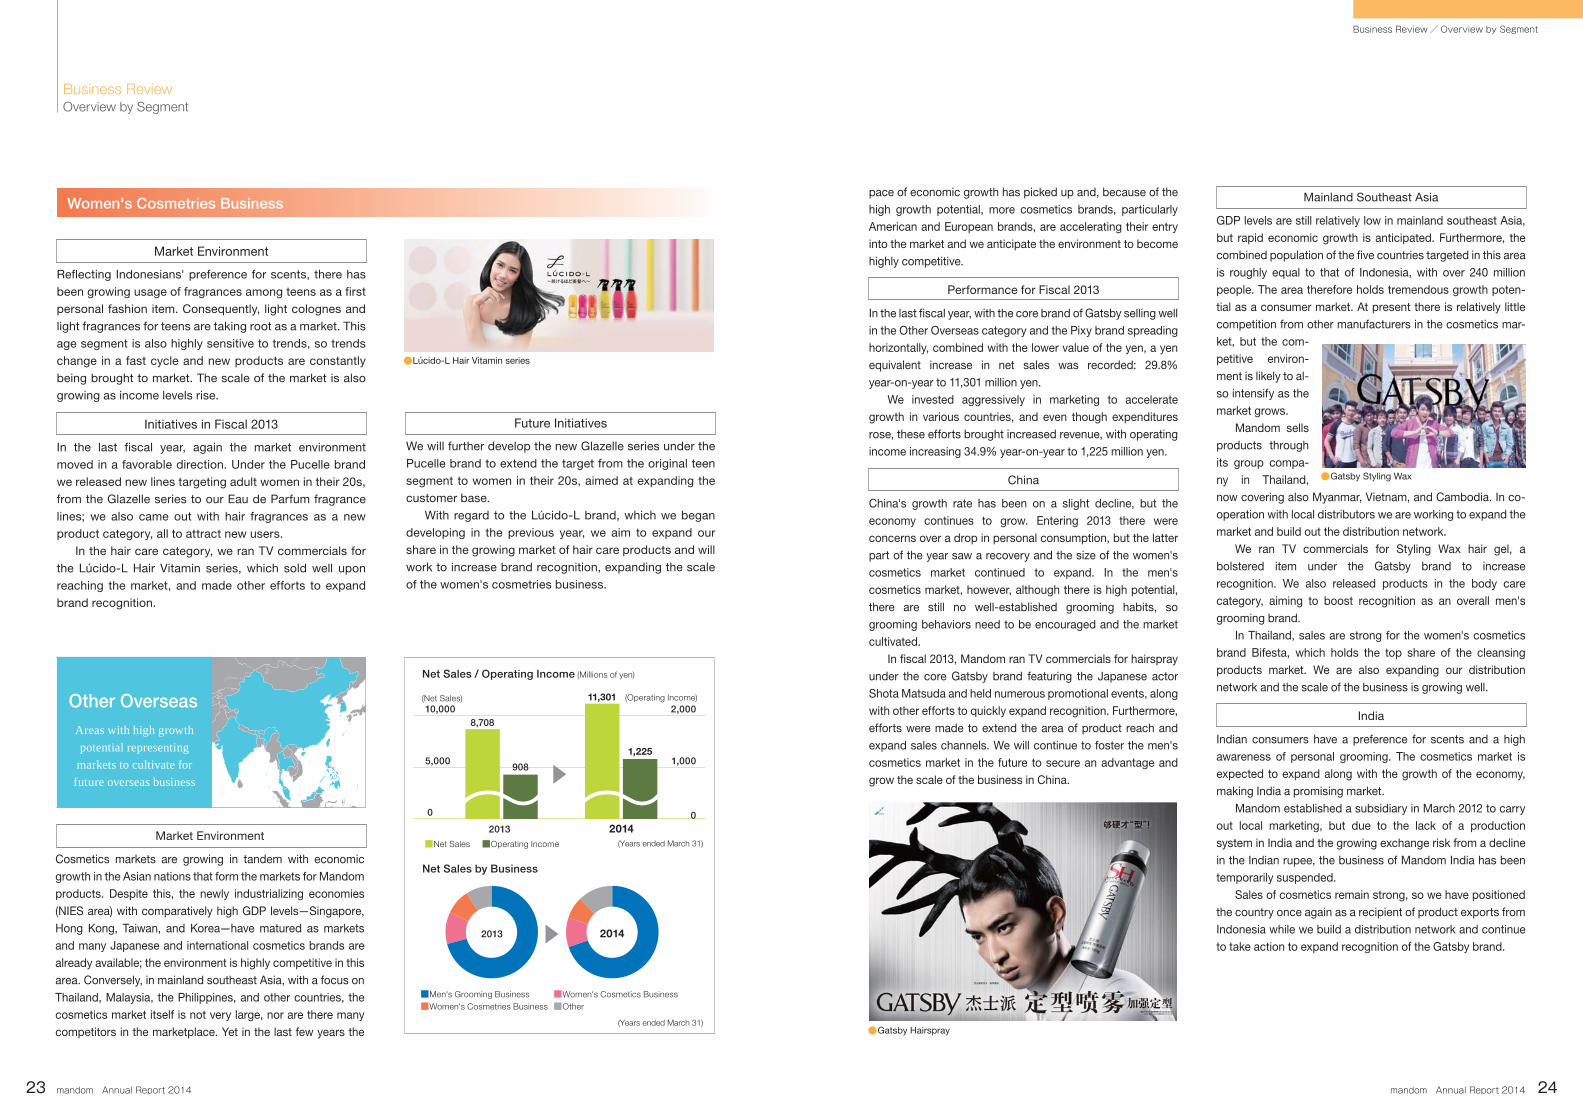
Reflecting Indonesians' preference for scents, there has been growing usage of fragrances among teens as a first personal fashion item. Consequently, light colognes and light fragrances for teens are taking root as a market. This age segment is also highly sensitive to trends, so trends change in a fast cycle and new products are constantly being brought to market. The scale of the market is also growing as income levels rise.
Initiatives in Fiscal 2013
In the last fiscal year, again the market environment moved in a favorable direction. Under the Pucelle brand we released new lines targeting adult women in their 20s, from the Glazelle series to our Eau de Parfum fragrance lines; we also came out with hair fragrances as a new product category, all to attract new users.
In the hair care category, we ran TV commercials for the Lúcido-L Hair Vitamin series, which sold well upon reaching the market, and made other efforts to expand brand recognition.
Future Initiatives
We will further develop the new Glazelle series under the Pucelle brand to extend the target from the original teen segment to women in their 20s, aimed at expanding the customer base.
With regard to the Lúcido-L brand, which we began developing in the previous year, we aim to expand our share in the growing market of hair care products and will work to increase brand recognition, expanding the scale of the women's cosmetries business.
Other Overseas
Market Environment
Cosmetics markets are growing in tandem with economic growth in the Asian nations that form the markets for Mandom products. Despite this, the newly industrializing economies (NIES area) with comparatively high GDP levels—Singapore, Hong Kong, Taiwan, and Korea—have matured as markets and many Japanese and international cosmetics brands are already available; the environment is highly competitive in this area. Conversely, in mainland southeast Asia, with a focus on Thailand, Malaysia, the Philippines, and other countries, the cosmetics market itself is not very large, nor are there many competitors in the marketplace. Yet in the last few years the
pace of economic growth has picked up and, because of the high growth potential, more cosmetics brands, particularly American and European brands, are accelerating their entry into the market and we anticipate the environment to become highly competitive.
Performance for Fiscal 2013
In the last fiscal year, with the core brand of Gatsby selling well in the Other Overseas category and the Pixy brand spreading horizontally, combined with the lower value of the yen, a yen equivalent increase in net sales was recorded: 29.8% year-on-year to 11,301 million yen.
We invested aggressively in marketing to accelerate growth in various countries, and even though expenditures rose, these efforts brought increased revenue, with operating income increasing 34.9% year-on-year to 1,225 million yen.
China
China's growth rate has been on a slight decline, but the economy continues to grow. Entering 2013 there were concerns over a drop in personal consumption, but the latter part of the year saw a recovery and the size of the women's cosmetics market continued to expand. In the men's cosmetics market, however, although there is high potential, there are still no well-established grooming habits, so grooming behaviors need to be encouraged and the market cultivated.
In fiscal 2013, Mandom ran TV commercials for hairspray under the core Gatsby brand featuring the Japanese actor Shota Matsuda and held numerous promotional events, along with other efforts to quickly expand recognition. Furthermore, efforts were made to extend the area of product reach and expand sales channels. We will continue to foster the men's cosmetics market in the future to secure an advantage and grow the scale of the business in China.
Mainland Southeast Asia
GDP levels are still relatively low in mainland southeast Asia, but rapid economic growth is anticipated. Furthermore, the combined population of the five countries targeted in this area is roughly equal to that of Indonesia, with over 240 million people. The area therefore holds tremendous growth poten-tial as a consumer market. At present there is relatively little competition from other manufacturers in the cosmetics mar-ket, but the com-petitive environ-ment is likely to al-so intensify as the market grows.
Mandom sells products through its group compa-ny in Thailand, now covering also Myanmar, Vietnam, and Cambodia. In co-operation with local distributors we are working to expand the market and build out the distribution network.
We ran TV commercials for Styling Wax hair gel, a bolstered item under the Gatsby brand to increase recognition. We also released products in the body care category, aiming to boost recognition as an overall men's grooming brand.
In Thailand, sales are strong for the women's cosmetics brand Bifesta, which holds the top share of the cleansing products market. We are also expanding our distribution network and the scale of the business is growing well.
India
Indian consumers have a preference for scents and a high awareness of personal grooming. The cosmetics market is expected to expand along with the growth of the economy, making India a promising market.
Mandom established a subsidiary in March 2012 to carry out local marketing, but due to the lack of a production system in India and the growing exchange risk from a decline in the Indian rupee, the business of Mandom India has been temporarily suspended.
Sales of cosmetics remain strong, so we have positioned the country once again as a recipient of product exports from Indonesia while we build a distribution network and continue to take action to expand recognition of the Gatsby brand.
Women's Cosmetries Business
●Lúcido-L Hair Vitamin series
●Gatsby Hairspray
●Gatsby Styling Wax
20142013
Net Sales by Business
■Men's Grooming Business ■Women's Cosmetics Business■Women's Cosmetries Business ■Other
Net Sales / Operating Income (Millions of yen)
5,000
■Net Sales ■Operating Income
10,000
20142013
(Net Sales)
1,000
00
2,000
(Operating Income)11,301
1,225
8,708
908
Business ReviewOverview by Segment
Areas with high growth potential representing
markets to cultivate for future overseas business
(Years ended March 31)
(Years ended March 31)
Business Review/Overview by Segment
mandom Annual Report 201423 mandom Annual Report 2014 24
Financial Data Consolidated Financial Indicators●
mandom Annual Report 201425 mandom Annual Report 2014 26
Financial Data/Consolidated Financial Indicators
9.9% 10.0% 10.1% 9.8% 10.0%
76.6% 78.3% 78.3% 78.2% 75.2%
6.9% 6.4% 7.7% 8.0% 8.3%
11.1% 11.2% 11.6% 10.8% 11.5%
50.3% 52.5% 42.5% 40.2% 40.0%
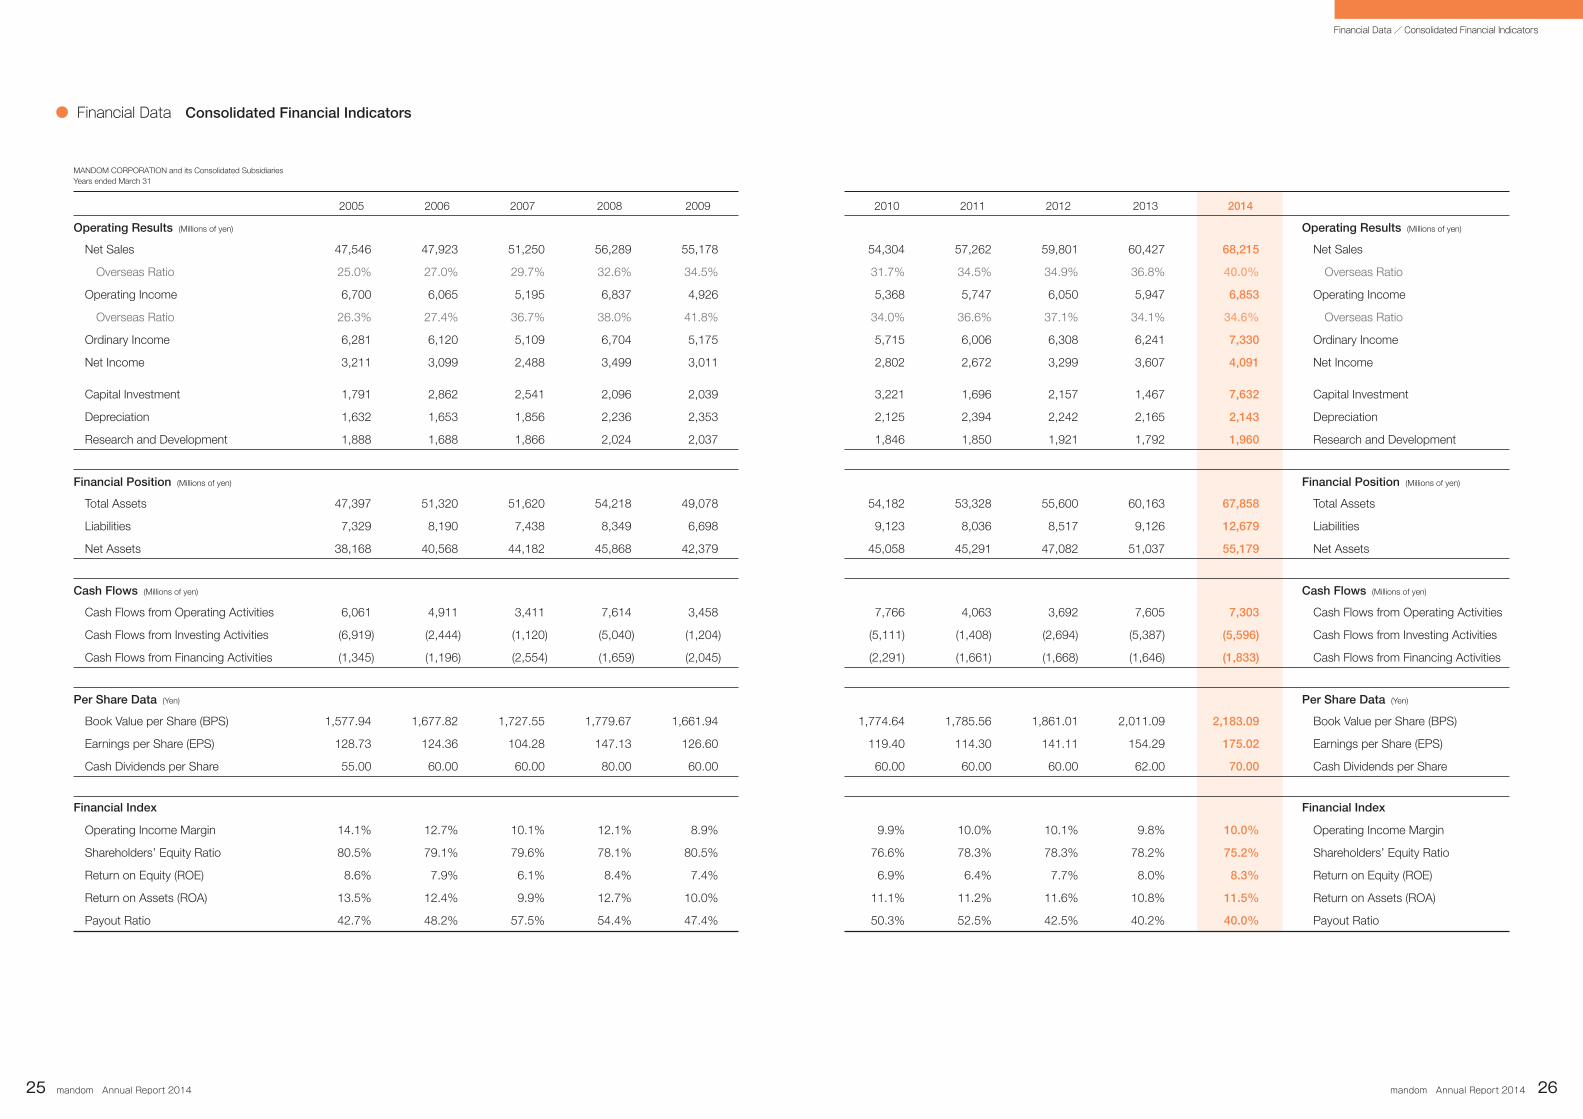
Operating Results (Millions of yen)
Net Sales 47,546 47,923 51,250 56,289 55,178
Overseas Ratio 25.0% 27.0% 29.7% 32.6% 34.5%
Operating Income 6,700 6,065 5,195 6,837 4,926
Overseas Ratio 26.3% 27.4% 36.7% 38.0% 41.8%
Ordinary Income 6,281 6,120 5,109 6,704 5,175
Net Income 3,211 3,099 2,488 3,499 3,011
Capital Investment 1,791 2,862 2,541 2,096 2,039
Depreciation 1,632 1,653 1,856 2,236 2,353
Research and Development 1,888 1,688 1,866 2,024 2,037
54,304 57,262 59,801 60,427 68,215
31.7% 34.5% 34.9% 36.8% 40.0%
5,368 5,747 6,050 5,947 6,853
34.0% 36.6% 37.1% 34.1% 34.6%
5,715 6,006 6,308 6,241 7,330
2,802 2,672 3,299 3,607 4,091
3,221 1,696 2,157 1,467 7,632
2,125 2,394 2,242 2,165 2,143
1,846 1,850 1,921 1,792 1,960
Financial Position (Millions of yen)
Total Assets 47,397 51,320 51,620 54,218 49,078
Liabilities 7,329 8,190 7,438 8,349 6,698
Net Assets 38,168 40,568 44,182 45,868 42,379
54,182 53,328 55,600 60,163 67,858
9,123 8,036 8,517 9,126 12,679
45,058 45,291 47,082 51,037 55,179
Cash Flows (Millions of yen)
Cash Flows from Operating Activities 6,061 4,911 3,411 7,614 3,458
Cash Flows from Investing Activities (6,919) (2,444) (1,120) (5,040) (1,204)
Cash Flows from Financing Activities (1,345) (1,196) (2,554) (1,659) (2,045)
7,766 4,063 3,692 7,605 7,303
(5,111) (1,408) (2,694) (5,387) (5,596)
(2,291) (1,661) (1,668) (1,646) (1,833)
Per Share Data (Yen)
Book Value per Share (BPS) 1,577.94 1,677.82 1,727.55 1,779.67 1,661.94
Earnings per Share (EPS) 128.73 124.36 104.28 147.13 126.60
Cash Dividends per Share 55.00 60.00 60.00 80.00 60.00
1,774.64 1,785.56 1,861.01 2,011.09 2,183.09
119.40 114.30 141.11 154.29 175.02
60.00 60.00 60.00 62.00 70.00
Financial Index
Operating Income Margin 14.1% 12.7% 10.1% 12.1% 8.9%
Shareholders’ Equity Ratio 80.5% 79.1% 79.6% 78.1% 80.5%
Return on Equity (ROE) 8.6% 7.9% 6.1% 8.4% 7.4%
Return on Assets (ROA) 13.5% 12.4% 9.9% 12.7% 10.0%
Payout Ratio 42.7% 48.2% 57.5% 54.4% 47.4%
2014201320122011201020092008200720062005
MANDOM CORPORATION and its Consolidated Subsidiaries
Years ended March 31
Financial Index
Operating Income Margin
Shareholders’ Equity Ratio
Return on Equity (ROE)
Return on Assets (ROA)
Payout Ratio
Operating Results (Millions of yen)
Net Sales
Overseas Ratio
Operating Income
Overseas Ratio
Ordinary Income
Net Income
Capital Investment
Depreciation
Research and Development
Financial Position (Millions of yen)
Total Assets
Liabilities
Net Assets
Cash Flows (Millions of yen)
Cash Flows from Operating Activities
Cash Flows from Investing Activities
Cash Flows from Financing Activities
Per Share Data (Yen)
Book Value per Share (BPS)
Earnings per Share (EPS)
Cash Dividends per Share

Financial Data Analyses of Management and Finances●
mandom Annual Report 201427 mandom Annual Report 2014 28
Financial Data/Analyses of Management and Finances
Analysis of Operating Results
1. Summary
During the fiscal year just ended, Japan’s economy
experienced overall improvement and a gentle expansionary
trend against a background of government economic and
fiscal stimulus. Economic conditions in Asia, the center of
gravity for the Group’s overseas business, also benefitted
from the influence of moderate global growth, with
recovering consumption and steady overall expansion.
In this environment, consolidated net sales rose 12.9%, to
68,215 million yen. Consolidated net income increased
13.4%, to 4,091 million yen. (Hereinafter, all figures are
stated in Japanese yen, consolidated as of March 31, 2014,
and all percentage changes are relative to the previous
consolidated fiscal year.)
2. Net Sales and Cost of Sales
Net sales totaled 68,215 million yen, up 7,788 million
(12.9%). This marks the fourth consecutive year of record
sales. This favorable result was driven principally by
increased domestic sales, centered on our core Gatsby
brand, and overall firm overseas sales. Favorable foreign
exchange conditions compared to the previous term also
drove overseas sales results higher in yen terms.
Cost of sales was 30,890 million yen, up 3,321 million
(12.0%). The principal factor behind this increase was the
increase in domestic and overseas sales. However, due to
efforts to lower costs both domestically and overseas, gross
margin expanded to 37,325 million yen, up 4,466 million
(13.6%).
3. Selling, General and Administrative (SG&A) Expenses
and Operating Income
SG&A expenses amounted to 30,471 million yen, up 3,560
million (13.2%). This increase was driven principally by
property, plant, and equipment, total assets amounted to
67,858 million yen, up 7,694 million. Total liabilities totaled
12,679 million yen, up 3,552 million, due to an increase in
accounts payable among other factors. Thanks to increased
retained earnings, among other factors, net assets totaled
55,179 million yen, up 4,141 million, and the shareholders’
equity ratio was 75.2%.
2. Status of Cash Flows
Cash and cash equivalents (cash) totaled 10,890 million
yen, up 408 million.
Principal factors influencing cash flows during the term
are as follows.
(Cash Flows from Operating Activities)
Cash flows from operating activities amounted to 7,303
million yen, down 301 million. While operating income rose,
other factors, including an increase in inventories as well as
corporate and other taxes, exerted an opposite influence.
(Cash Flows from Investing Activities)
Cash flows from investing activities totaled 5,596 million
yen, up 209 million. While income from sales and
redemptions of marketable securities and from refunds of
time deposits increased, the use of cash also increased,
principally for the acquisition of property, plant and
equipment as well as marketable securities.
(Cash Flows from Financing Activities)
Cash flows from financing activities amounted to 1,833
million yen, up 186 million. This was mainly due to an
increase in the payment of shareholder dividends, including
minority shareholders.
Important Factors Influencing Consolidated Operating Results
1. Factors Influencing Profitability
aggressive investment for marketing (sales promotion and
advertising expenses) both in Japan and overseas. As a
result, operating income rose to 6,853 million yen, up 906
million (15.2%).
4. Non-Operating Profit, Extraordinary Profit, Ordinary
Income and Income before Income Taxes and
Minority Interests
Non-operating income has been increasing steadily since
the previous term, while non-operating expense has been
falling. As a result, non-operating profit was up 182 million
yen during the term. In addition, although extraordinary
income increased, extraordinary expense also increased
significantly, resulting in a decline of 82 million yen in
extraordinary profit.
As a result, ordinary income totaled 7,330 million yen, up
1,088 million (17.4%). Income before income taxes and
minority interests also increased to 7,279 million yen, up
1,006 million (16.0%).
5. Corporate and Other Taxes, Minority Interests and
Net Income
Corporate and other taxes totaled 2,608 million yen, up
433 million (19.9%), principally due to increases in corporate
tax payable by the parent company. Minority interests rose
to 579 million yen, up 89 million, due mainly to the increase
in net income of the Group’s Indonesian subsidiary.
As a result, net income amounted to 4,091 million yen, up
484 million (13.4%), a new record high.
Analysis of Financial Position and Cash Flows
1. Assets, Liabilities and Net Assets
Due to a variety of factors, including an increase in
The Group operates in a highly competitive business
environment. Particularly in Japan, we are competing in a
mature market. Such competition exerts downward
pressure on retail prices while placing upward pressure on
sales expenses, with inevitably lower profit margins.
Furthermore, since our key product lines have a relatively
short lifecycle, the success or failure of new products is a
principal factor influencing our results. We always carry out
brand renewal before the end of the product life cycle, and
develop and market new products based on underlying
consumer preferences. As such, merchandise returns from
retailers also impact our profitability.
In addition, since the inventory on which the Group’s
continued operations depend is produced mainly on the
basis of projected future demand and market trends, this
strategy may, depending on actual demand or unanticipated
trends, require inventory disposal. This disposal is recorded
as a loss under cost of sales and adversely affects the
Group’s performance. It is the Group’s policy to dispose of
inventory immediately after market value impairment is
confirmed, rather than postponing such disposal.
In Japan and Indonesia, our dependence on specific
partners is high, formally exposing us to credit risk.
However, we believe that for both countries, the increasingly
dominant market presence of a few players actually tends to
reduce this risk, and as such it effectively has no influence
on our current business results.
2. Foreign Exchange and Resource Price Fluctuations
In overseas operations, foreign exchange fluctuations or
increased petroleum prices may affect Group
competitiveness by increasing the costs of raw materials
required at production sites in Indonesia and China. The
Group’s overseas manufacturing is carried out in Asia, and
some regions are subject to event risk from possible legal or
economic changes that may accompany sudden political
10.0%
21.2%
23.5%
45.3%
68,215
9.9%
24.0%
20.9%
45.2%
10.0%
23.3%
21.5%
45.2%
10.1%
22.5%
21.6%
45.8%
(Millions of yen)
9.8%
22.4%
22.1%
45.6%
54,30457,262
59,80160,427
201220112010 2013 2014
Operating Income General and Administrative Expenses
Selling Expen Cost of Sales
(Years ended March 31)
Breakdown of Ratio of Operating Expenses/
Operating Income to Net Sales
10,890
(Millions of yen)
10,4829,742
10,5509,792
201220112010 2013 2014(Years ended March 31)
Balance of Cash and Cash Equivalents
at End of Period
12,679
55,179
67,858
9,123 8,036 8,5179,126
45,058 45,291 47,08251,037
54,182 53,32855,600
60,163
Total Assets Net Assets Liabilities
201220112010 2013 2014(Years ended March 31)
(Millions of yen)Total Assets, Liabilities and Net Assets (Millions of yen)
201220112010 2013 2013
Financing ActivitiesInvesting ActivitiesOperating Activities
(Years ended March 31)
Cash Flows
7,766 7,605 7,303
–1,661
–2,291–1,668 –1,646
–5,111
–2,694
–1,408
–5,387
–1,833
–5,596
4,063 3,692

Financial Data Analyses of Management and Finances●
mandom Annual Report 201429 mandom Annual Report 2014 30
Financial Data/Analyses of Management and Finances
events. Such developments could impact the Group’s management and financial performance.
Business and Others Risks
1. Consumer Alignment Risk
Competition in the cosmetics market in Asia, including Japan, is becoming increasingly intense due to the activities of peer companies as well as new competitor entry. In addition, the market is experiencing ongoing changes in consumer needs and wants, and consumer contact is taking place through increasingly diverse distribution channels. In this competitive environment, the Group is working to sustain and enhance its brand value and to develop, introduce, promote, and reinforce new products; withdraw from, reposition, or revamp existing products; and achieve innovation in its marketing activities, including its sales methods. Notwithstanding these efforts, various uncertainties may cause the Group to experience delays in responding to factors in its environment. Particularly in Japan, these factors include the impact of retailers reducing inventories of standard products by rebalancing inventories, and the return of surplus inventory from sales agents, the value of which may impact the Group’s performance.
2. Partner Dependence Risk
※ Insert chart, annual securities report, P12 As shown in the chart above, during the 2013 and 2014 terms ended March 31, the Group was dependent on certain wholesalers for more than 10.0% of its consolidated sales. The Corporation and PT Mandom Indonesia Tbk have long-term, stable, ongoing business relationships with these wholesalers. In the future distribution of cosmetics and other products, there will be an increasing tendency toward market dominance by a limited number of large-scale wholesalers. This may lead to further dependence on specific distributors who account for a significant percentage of Group sales.
3. Regulatory Risk
The Group manufactures (and in some cases imports) and sells quasi-drugs and cosmetics in accordance with various regulatory statutes, including the Pharmaceutical Affairs Law, as well as in compliance with quality and environmental statutes. In the event, however, of a major breach of statutory or regulatory requirements, production activities may be affected, with a resulting impact on the continuing viability of the business involved. Moreover, restrictions may be placed on the Group’s business due to revisions to existing legislation or the enactment of new laws. In the event that the Group incurs higher costs in its efforts to comply with statutory and regulatory requirements, its operating performance may be affected.
enhance the capacity of our employees to communicate and acquire a deep understanding of the customs and values of each culture where we market our products, to strengthen the Group’s overseas foundation.
3. Bolstering Corporate Social Responsibility Activities
Social responsibility and sustainability is a Group value, and management regards corporate social responsibility activities as a key objective. In addition to ongoing reinforcement of quality assurance and environmental measures, the Group as a whole strives to promote corporate social responsibility activities as a good corporate citizen.
Management’s View of Challenges and Policy Going Forward
Management strives to formulate optimal policies in light of the current business environment and available data and information. Management’s key concern is to sustain business expansion. Recognizing that the engine for this expansion lies in overseas markets, management will strive to achieve further growth by developing the Southeast Asian market—where there is likely to be increasing demand for our products—as well as new markets in other Asian regions. We will also position our women’s cosmetics business for further growth. Management prioritizes efficient use of capital and regards the return of profits to shareholders in the form of dividends as a key capital policy. Consequently, management will undertake to return more profit to shareholders and rein in increases in equity (retained earnings).
1. Current Management Strategies and Outlook
Sustained growth is the core element of the Group’s medium- to long-term business strategy. To achieve phased expansion of Group business, we will deploy a carefully planned input of business resources to achieve sustainable growth in income and profits. In the current three-year Medium-Term Plan (fiscal year 2015 through fiscal year 2017), we will continue to focus on three strategic themes: 1) promoting continued growth for our core men’s grooming business; 2) accelerating the start of our women’s cosmetics business through global marketing in Asia ; and 3) promoting the continued expansion of our overseas business. Furthermore, when implementing our strategic objectives, we will be expeditious in making use of external capital through M&A activities and business alliances.
1) Sustained growth of our core men’s grooming
business
We will work to reinforce our core Gatsby brand as a
4. Foreign Exchange Risk
The Group’s overseas business focuses on Asia, where solid market growth is expected. Overseas net sales accounted for 37.8% and 41.0% of consolidated net sales in the fiscal years ended March 31, 2013 and 2014, respectively, and the weight of overseas business is expected to increase. Accordingly, short-term, as well as medium-to-long-term fluctuations in foreign exchange rates have the potential to impact the Group’s performance and prevent the operating results of overseas Group companies from being accurately represented our business performance when translated into yen.
5. Overseas Business Development Risk
The Group continues to focus on expanding its business in the Asia region, which is positioned as a growth engine under its business strategy. In the event of a natural disaster or significant breach of applicable laws, trading policies, or customs and taxation regulations in the area, or a drop in consumer demand, the Group’s business activities may be constrained, impacting its overall business performance.
Challenges to be Addressed
1. Maintaining and Expanding the Men’s Grooming
Business, Reinforcing Female-Oriented Business
Grooming products for men represent the Group’s core business. In this and other categories in which we operate, we are experiencing increasing competition by established as well as new market participants, both in Japan and overseas, and we believe that the business environment will become even more challenging. Within this environment, the Group places utmost importance on its men’s grooming products business, which accounts for more than half of consolidated sales and more than sixty percent of sales in Japan. Since this business is a mainstay of our profitability, we will continue striving to uncover new needs and wants through research from the consumer’s point of view. We will also hone our capability to introduce new products, and undertake to maintain business expansion. At the same time, we will reinforce our women’s products business, including the skin care and base makeup categories, and strive to expand into new business areas.
2. Bolstering Personnel Development as the Foundation
of Group Business
The Group seeks continuing global growth with a focus on Asia. Management considers global personnel development to be one of the foundations supporting its business, and believes that equipping personnel for success in any country will become increasingly important. Consequently, we will bolster personnel development to
global brand in Asia to better serve male consumers in all our markets. In Japan, we will work to expand sales centering on the styling as well as the face and body categories, targeting younger consumers. We will also place the styling category at the center of our overseas business while undertaking to reinforce and expand the face and body categories. Under our Lúcido brand, we will continue to offer aging-care concept products for middle-aged consumers, including body odor care.
2) Accelerating our women’s cosmetries and cosmetics
businesses through global marketing in Asia
The Group will expand our women’s cosmetries and cosmetics businesses centering on the skin care and base makeup products. In Japan, we will work to grow this business with a focus on expanding our share in the cleansing products market. Overseas, we will seek to expand sales in existing markets through greater lateral deployment of products developed for Japan, and grow our cosmetics business through expansion and reinforcement of the sales area for base makeup products.
3) Continued expansion of overseas business
Our overseas business maintains its positioning as our engine of growth, with Indonesia as our principal international market and China, India, and Southeast Asia as our developing markets. We will reinforce our investment in targeted marketing and undertake to develop an even deeper understanding of the consumer point of view in markets where we operate, to further expand the scale of our overseas business.
2. Financial Policies
The Group’s financial policies include maintaining a sound balance sheet and the liquidity necessary to pursue its objectives. Capital is used primarily to fund operations and for capital investments, and is derived from internal reserves. If a domestic subsidiary lacks necessary funds, the shortfall is covered by a loan from the parent company, while demand for short-term funds by overseas subsidiaries is met by local-currency-based short-term loans taken out by the Group’s main representative office in the region. The Group regards any additional funds in hand as cash reserves for business investment, and places the utmost priority on ensuring their liquidity and security. Management further believes that even if the need should arise for investment funds exceeding current liquidity, it can procure the funds necessary to ensure dramatic growth based on sound finances and the capacity to generate cash flows through operating activities.
3. Earnings Distribution Policy
Returning profit to shareholders through dividends is a

Financial Data Analyses of Management and Finances●
mandom Annual Report 201431 mandom Annual Report 2014 32
Financial Data/Analyses of Management and Finances
core management policy, subject to internal reserve requirements for medium- to long-term operational development and new business development, and for addressing corporate risks. Under this strong commitment to dividend policy, the Group will endeavor to deliver shareholder return through dividend payouts. The numerical target for the year ended March 31, 2014 and ending March 31, 2015 is a payout ratio of not less than 40.0% of net income on a consolidated basis. The Group’s fundamental policy is to distribute surplus funds via two annual dividends, a mid-term and a year-end dividend. The entity for approving the distribution of these funds is the Board of Directors for the mid-term dividend, and the General Meeting of Shareholders for the year-end dividend. Total dividends for the term were set at 70 yen per share. As a result, the dividend payout ratio amounted to 40.0% on a consolidated basis. Internal reserves will be allocated to strategic investments, including investment in facilities to expand existing business operations, and to strategic R&D and other corporate value enhancement investment. The reserves also serve as a safety net to help deal with diverse corporate risks arising out of the difficult business conditions to which we are subject. As a means of delivering shareholder return and improving capital efficiency, the purchase of treasury stock will be considered as an option.
Corporate Governance
Corporate Governance Structure
1) Summary of corporate governance structure
The activities of the Group are overseen by the Audit & Supervisory Board. With legal oversight from our auditors as the basis for corporate governance, we invite outside executive officers to sit on our board, and maintain an executive officer and a business function unit system. Through the organic integration of these structures, we promote the separation of decision-making and audit functions from execution functions, and strengthen mutual checks and oversight by the Board of Directors and the Executive Board. We also ensure that director oversight functions organically on the business front line. Furthermore, the Group has voluntarily established a Compensation Committee, more than half of whose members are outside executive officers, as well as advisory panels to the Board of Directors. Executive officer compensation and appointments are reviewed by these entities, and determined with close reference to the results of such reviews. The Group’s corporate governance structure is shown below. ※ Insert chart, annual securities report, P26
management related to these important issues by promoting the creation of risk management manuals to avoid and minimize risk.
5) Limitation of liability for damages
a. The Corporation has concluded agreements with outside executive officers Satoshi Nakajima and Satoshi Nagao, based on Article 427.1 of the Companies Act and Article 24.2 of the Corporation’s Articles of Incorporation, for limitation of liability for damages as defined in Article 423.1 of the Companies Act. The amount of limitation of liability for damages pursuant to these agreements is 10 million yen or the minimum amount for outside executive officers as specified in Article 425.1 of the Companies Act, whichever is higher.b. The Corporation has concluded agreements with outside auditors Masatoshi Tsuda and Yukihiro Tsujimura based on Article 427.1 of the Companies Act and Article 32.2 of the Corporation’s Articles of Incorporation, for limitation of liability for damages as defined in Article 423.1 of the Companies Act. The amount of limitation of liability for damages pursuant to these agreements is 10 million yen or the minimum amount for auditors as specified in Article 425.1 of the Companies Act, whichever is higher.
2) Reasons for adopting this governance structure
To ensure management compliance and efficiency, the Group employs an extensive range of management monitoring functions. Moreover, based on our understanding of the importance of reflecting front line management views in decision making, the Board of Directors includes not only senior management but certain executive officers with special titles who oversee business function units, as well as outside executive officers. In addition to establishing an Audit & Supervisory Board, we have also voluntarily established advisory panels to the Board of Directors, and apply mutual checks and oversight between executive officers on the Board as well as oversight and supervision from outside executive officers. This structure is rigorously monitored by the Audit & Supervisory Board, and we believe this approach will contribute to strengthening corporate governance.
3) Internal control system
Under the governance structure outlined above, the Board of Directors has established basic policies to ensure appropriate operations, including the establishment and revision of internal regulations, their promulgation and thorough implementation, and the establishment of special advisory panels. Executive officers and employees strive to implement these regulations, with the Internal Control Division and the Audit & Supervisory Board exercising rigorous oversight and supervision. In particular, the Group’s Code of Conduct Promotion Committee helps ensure management compliance by promulgating awareness of, and adherence to, our compliance standards. Our Helpline System for whistleblowers also helps avoid and minimize risk. In addition, our Internal Audit Division, which reports directly to the President Executive Officer, ensures the trustworthiness and accuracy of our financial reporting. The Division is responsible for establishing and monitoring the management of internal control systems relating to financial reporting and for carrying out internal audits. The Division also submits reports as appropriate to the Board of Directors and the Audit & Supervisory Board, which review the reports on an ongoing basis and work to devise structures to implement recommendations for improvement.
4) Risk management structure
The Total Risk Management Committee, chaired by the President Executive Officer,is the principal vehicle for the Group’s total risk management system. The Committee’s mission is to supervise and manage the operation and development of the Group’s risk management systems. The Committee regards the management of risks with the potential to materially impact business continuity, and risks that hinder the reliability and appropriateness of financial reporting, as important issues. It therefore prioritizes risk
General Meeting of Shareholders
Business Execution
Directors + External Directors
Board of Directors
President Executive OfficerVice President Executive OfficerSupervising Executive Officers
Mutual supervision, auditing, and information sharing
Management MeetingExecutive Officers
Direction/Management
Decision-Making/Oversight FunctionAdvisory Panels to the Board of Directors
Compensation Committee
(Observer:External Audit & Supervisory Board Members)
Legal Audits
Audit & Supervisory Board
Internal Audits
Internal Audit Office that reportsdirectly to the president
Independent Audits
Independent auditor
Provides Risk Information
System Construction/Overall Management/Raising Employee Awareness/Dealing with Contingencies
MarketingUnit
Technology/Production Unit
SalesUnit
Business SupportOrganization
Executive Board
Appointment/Dismissal
Supervision
Auditing
Report
Mutual supervision of business executionand management
Reports/Proposes
Report
StatutoryAuditing
StatutoryAuditing
Ap
po
intm
ent/
Dis
mis
sal
Company-Wide Organization
Risk Management
Code of ConductPromotion Committee
Total Risk ManagementCommittee
Compliance
Delegation ofAuthority/Monitoring
Advisory Panels to the Board of Directors
Nominating Committee
(Observer:External Audit & Supervisory Board Members)

Financial Data Consolidated Financial Statements●
mandom Annual Report 201433 mandom Annual Report 2014 34
Financial Data/Consolidated Financial Statements
ASSETS
CURRENT ASSETS:
Cash and cash equivalents (Note 13) ¥10,891 ¥10,482
Short-term investments (Notes 3 and 13) 14,302 13,962
Receivables (Note 13):
Trade notes and accounts 8,252 7,654
Unconsolidated subsidiary and associated company 110 92
Other 98 80
Allowance for doubtful accounts (17) (19)
Inventories (Note 4) 8,122 7,641
Deferred tax assets (Note 9) 780 822
Prepaid expenses and other current assets 1,128 595
Total current assets 43,666 41,309
PROPERTY, PLANT AND EQUIPMENT:
Land 511 511
Buildings and structures 19,567 17,302
Machinery and equipment 14,582 13,165
Furniture and fixtures 4,577 4,259
Lease assets (Note 12) 56 45
Construction in progress 2,447 163
Total 41,740 35,445
Accumulated depreciation (24,927) (23,902)
Net property, plant and equipment 16,813 11,543
INVESTMENTS AND OTHER ASSETS:
Investment securities (Notes 3 and 13) 4,842 5,034
Investments in unconsolidated subsidiary and associated company 299 210
Deferred tax assets (Note 9) 249 245
Other assets (Note 5) 1,990 1,823
Total investments and other assets 7,380 7,312
TOTAL ¥67,859 ¥60,164See notes to consolidated financial statements.
MANDOM CORPORATION and its Consolidated SubsidiariesAs of March 31, 2014
Consolidated Balance Sheets
2014 2013
Millions of Yen
MANDOM CORPORATION and its Consolidated SubsidiariesAs of March 31, 2014
LIABILITIES AND EQUITY
CURRENT LIABILITIES:
Payables (Note 13):
Trade notes and accounts ¥ 6,692 ¥ 3,852
Unconsolidated subsidiary and associated company 5 8
Other 29 239
Accrued income taxes (Note 13) 1,237 995
Accrued expenses 1,718 1,531
Other current liabilities 563 570
Total current liabilities 10,244 7,195
LONG-TERM LIABILITIES:
Liability for retirement benefits (Note 6) 1,188 1,073
Deferred tax liabilities (Note 9) 303 4
Other long-term liabilities (Note 7) 945 855
Total long-term liabilities 2,436 1,932
COMMITMENTS (Note 12)
EQUITY (Notes 8 and 15):
Common stock
authorized, 81,969,700 shares
issued, 24,134,606 shares in 2014 and 2013 11,395 11,395
Capital surplus 11,235 11,235
Retained earnings 33,406 30,834
Treasury stock - at cost 755,434 shares and 754,463 shares in 2014 and 2013, respectively (1,854) (1,850)
Accumulated other comprehensive income:
Unrealized gain on available-for-sale securities 865 335
Foreign currency translation adjustments (4,043) (4,929)
Defined retirement benefit plans 34
Total 51,038 47,020
Minority interests 4,141 4,017
Total equity 55,179 51,037
TOTAL ¥67,859 ¥60,164
Consolidated Balance Sheets
2014 2013
Millions of Yen
See notes to consolidated financial statements.
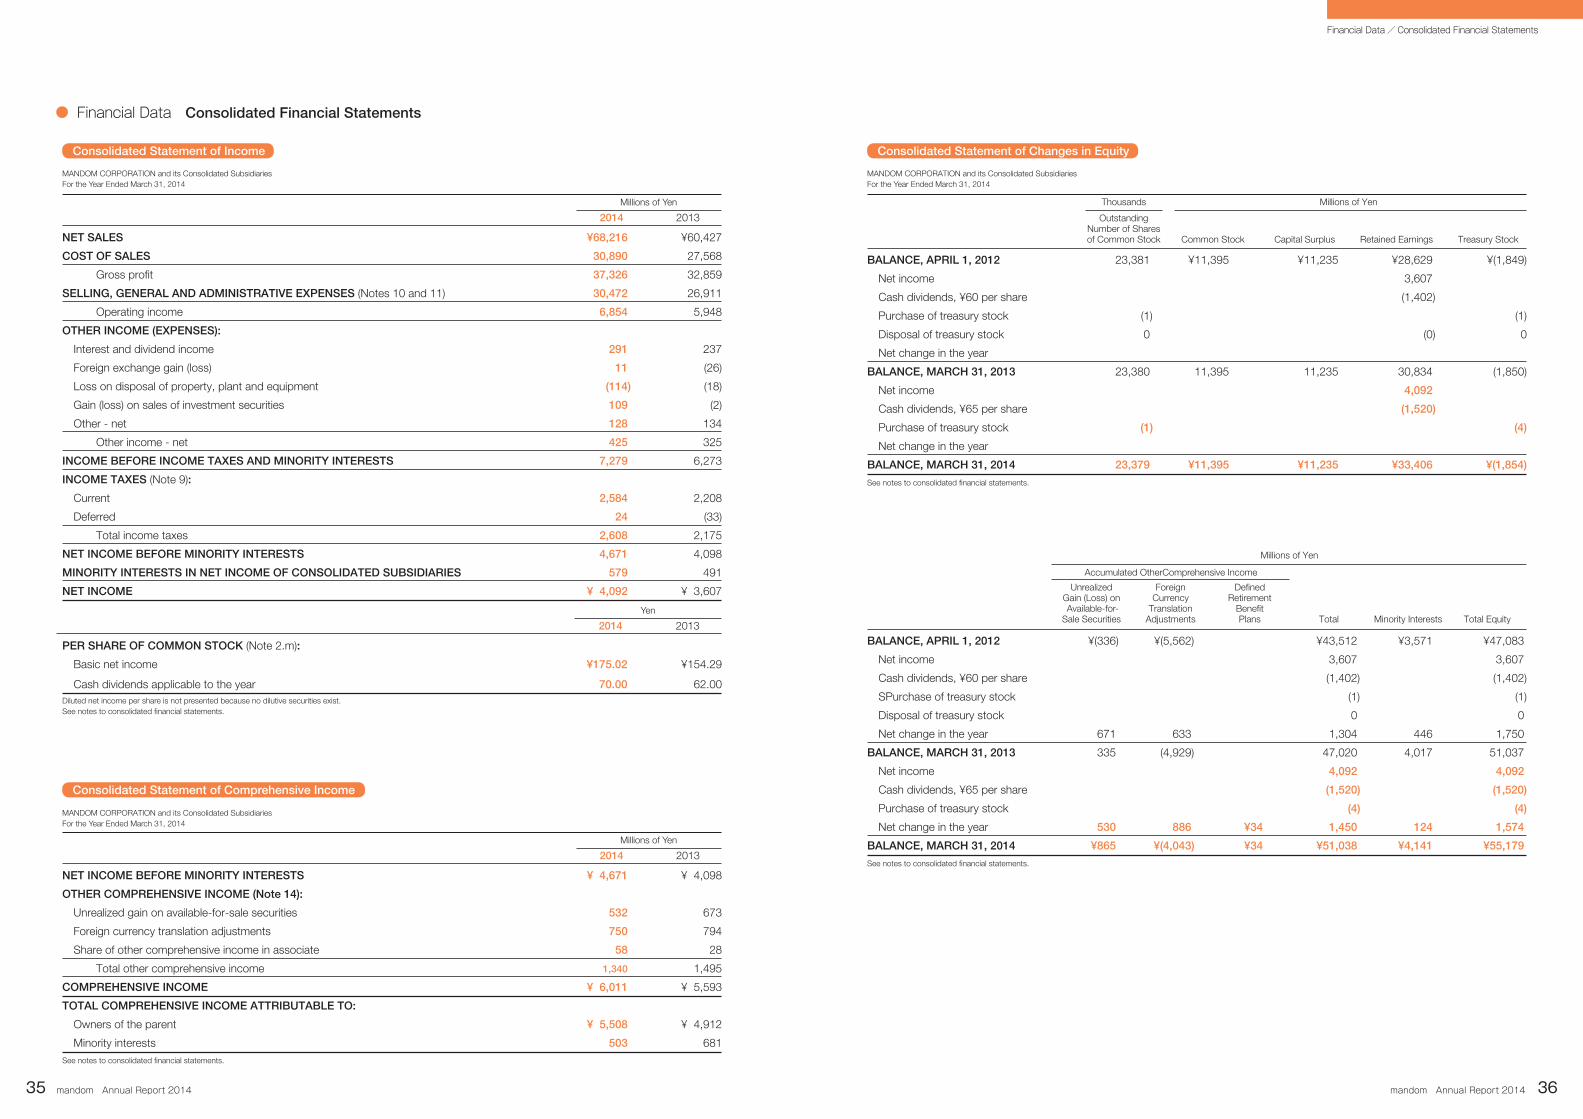
Financial Data Consolidated Financial Statements●
mandom Annual Report 201435 mandom Annual Report 2014 36
Financial Data/Consolidated Financial Statements
MANDOM CORPORATION and its Consolidated SubsidiariesFor the Year Ended March 31, 2014
NET SALES ¥68,216 ¥60,427
COST OF SALES 30,890 27,568
Gross profit 37,326 32,859
SELLING, GENERAL AND ADMINISTRATIVE EXPENSES (Notes 10 and 11) 30,472 26,911
Operating income 6,854 5,948
OTHER INCOME (EXPENSES):
Interest and dividend income 291 237
Foreign exchange gain (loss) 11 (26)
Loss on disposal of property, plant and equipment (114) (18)
Gain (loss) on sales of investment securities 109 (2)
Other - net 128 134
Other income - net 425 325
INCOME BEFORE INCOME TAXES AND MINORITY INTERESTS 7,279 6,273
INCOME TAXES (Note 9):
Current 2,584 2,208
Deferred 24 (33)
Total income taxes 2,608 2,175
NET INCOME BEFORE MINORITY INTERESTS 4,671 4,098
MINORITY INTERESTS IN NET INCOME OF CONSOLIDATED SUBSIDIARIES 579 491
NET INCOME ¥ 4,092 ¥ 3,607
NET INCOME BEFORE MINORITY INTERESTS ¥ 4,671 ¥ 4,098
OTHER COMPREHENSIVE INCOME (Note 14):
Unrealized gain on available-for-sale securities 532 673
Foreign currency translation adjustments 750 794
Share of other comprehensive income in associate 58 28
Total other comprehensive income 1,340 1,495
COMPREHENSIVE INCOME ¥ 6,011 ¥ 5,593
TOTAL COMPREHENSIVE INCOME ATTRIBUTABLE TO:
Owners of the parent ¥ 5,508 ¥ 4,912
Minority interests 503 681
PER SHARE OF COMMON STOCK (Note 2.m):
Basic net income ¥175.02 ¥154.29
Cash dividends applicable to the year 70.00 62.00
See notes to consolidated financial statements.
Diluted net income per share is not presented because no dilutive securities exist.See notes to consolidated financial statements.
Consolidated Statement of Income
Consolidated Statement of Comprehensive Income
MANDOM CORPORATION and its Consolidated SubsidiariesFor the Year Ended March 31, 2014
2014 2013
Millions of Yen
2014 2013
Yen
2014 2013
Millions of Yen
MANDOM CORPORATION and its Consolidated SubsidiariesFor the Year Ended March 31, 2014
BALANCE, APRIL 1, 2012 23,381 ¥11,395 ¥11,235 ¥28,629 ¥(1,849)
Net income 3,607
Cash dividends, ¥60 per share (1,402)
Purchase of treasury stock (1) (1)
Disposal of treasury stock 0 (0) 0
Net change in the year
BALANCE, MARCH 31, 2013 23,380 11,395 11,235 30,834 (1,850)
Net income 4,092
Cash dividends, ¥65 per share (1,520)
Purchase of treasury stock (1) (4)
Net change in the year
BALANCE, MARCH 31, 2014 23,379 ¥11,395 ¥11,235 ¥33,406 ¥(1,854)
BALANCE, APRIL 1, 2012 ¥(336) ¥(5,562) ¥43,512 ¥3,571 ¥47,083
Net income 3,607 3,607
Cash dividends, ¥60 per share (1,402) (1,402)
SPurchase of treasury stock (1) (1)
Disposal of treasury stock 0 0
Net change in the year 671 633 1,304 446 1,750
BALANCE, MARCH 31, 2013 335 (4,929) 47,020 4,017 51,037
Net income 4,092 4,092
Cash dividends, ¥65 per share (1,520) (1,520)
Purchase of treasury stock (4) (4)
Net change in the year 530 886 ¥34 1,450 124 1,574
BALANCE, MARCH 31, 2014 ¥865 ¥(4,043) ¥34 ¥51,038 ¥4,141 ¥55,179
See notes to consolidated financial statements.
See notes to consolidated financial statements.
Consolidated Statement of Changes in Equity
UnrealizedGain (Loss) on Available-for-Sale Securities
ForeignCurrency
TranslationAdjustments
Defi nedRetirement
Benefi tPlans Total Minority Interests Total Equity
Accumulated OtherComprehensive Income
Millions of Yen
Outstanding Number of Shares of Common Stock Common Stock Capital Surplus Retained Earnings Treasury Stock
Millions of YenThousands
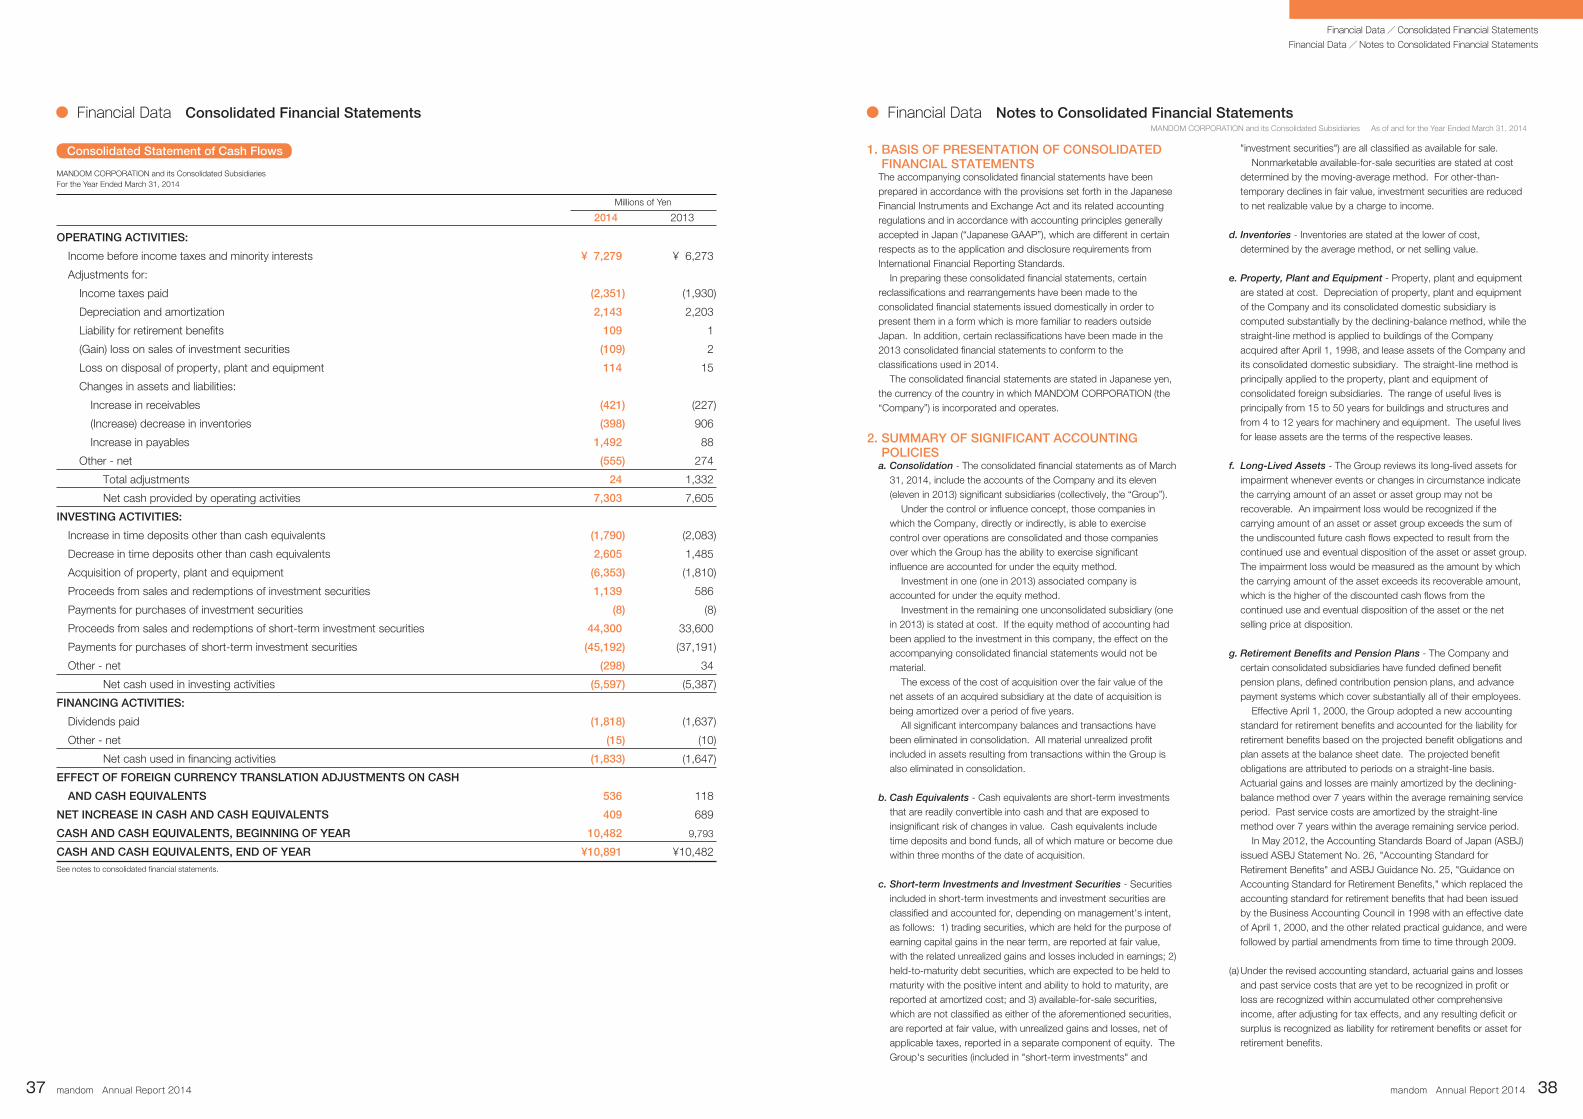
Financial Data Consolidated Financial Statements●
mandom Annual Report 201437 mandom Annual Report 2014 38
Financial Data/Consolidated Financial StatementsFinancial Data/Notes to Consolidated Financial Statements
MANDOM CORPORATION and its Consolidated SubsidiariesFor the Year Ended March 31, 2014
OPERATING ACTIVITIES:
Income before income taxes and minority interests ¥ 7,279 ¥ 6,273
Adjustments for:
Income taxes paid (2,351) (1,930)
Depreciation and amortization 2,143 2,203
Liability for retirement benefits 109 1
(Gain) loss on sales of investment securities (109) 2
Loss on disposal of property, plant and equipment 114 15
Changes in assets and liabilities:
Increase in receivables (421) (227)
(Increase) decrease in inventories (398) 906
Increase in payables 1,492 88
Other - net (555) 274
Total adjustments 24 1,332
Net cash provided by operating activities 7,303 7,605
INVESTING ACTIVITIES:
Increase in time deposits other than cash equivalents (1,790) (2,083)
Decrease in time deposits other than cash equivalents 2,605 1,485
Acquisition of property, plant and equipment (6,353) (1,810)
Proceeds from sales and redemptions of investment securities 1,139 586
Payments for purchases of investment securities (8) (8)
Proceeds from sales and redemptions of short-term investment securities 44,300 33,600
Payments for purchases of short-term investment securities (45,192) (37,191)
Other - net (298) 34
Net cash used in investing activities (5,597) (5,387)
FINANCING ACTIVITIES:
Dividends paid (1,818) (1,637)
Other - net (15) (10)
Net cash used in financing activities (1,833) (1,647)
EFFECT OF FOREIGN CURRENCY TRANSLATION ADJUSTMENTS ON CASH
AND CASH EQUIVALENTS 536 118
NET INCREASE IN CASH AND CASH EQUIVALENTS 409 689
CASH AND CASH EQUIVALENTS, BEGINNING OF YEAR 10,482 9,793
CASH AND CASH EQUIVALENTS, END OF YEAR ¥10,891 ¥10,482See notes to consolidated financial statements.
Consolidated Statement of Cash Flows
2014 2013
Millions of Yen
"investment securities") are all classified as available for sale. Nonmarketable available-for-sale securities are stated at cost
determined by the moving-average method. For other-than-temporary declines in fair value, investment securities are reduced to net realizable value by a charge to income.
d. Inventories - Inventories are stated at the lower of cost, determined by the average method, or net selling value.
e. Property, Plant and Equipment - Property, plant and equipment are stated at cost. Depreciation of property, plant and equipment of the Company and its consolidated domestic subsidiary is computed substantially by the declining-balance method, while the straight-line method is applied to buildings of the Company acquired after April 1, 1998, and lease assets of the Company and its consolidated domestic subsidiary. The straight-line method is principally applied to the property, plant and equipment of consolidated foreign subsidiaries. The range of useful lives is principally from 15 to 50 years for buildings and structures and from 4 to 12 years for machinery and equipment. The useful lives for lease assets are the terms of the respective leases.
f. Long-Lived Assets - The Group reviews its long-lived assets for impairment whenever events or changes in circumstance indicate the carrying amount of an asset or asset group may not be recoverable. An impairment loss would be recognized if the carrying amount of an asset or asset group exceeds the sum of the undiscounted future cash flows expected to result from the continued use and eventual disposition of the asset or asset group. The impairment loss would be measured as the amount by which the carrying amount of the asset exceeds its recoverable amount, which is the higher of the discounted cash flows from the continued use and eventual disposition of the asset or the net selling price at disposition.
g. Retirement Benefits and Pension Plans - The Company and certain consolidated subsidiaries have funded defined benefit pension plans, defined contribution pension plans, and advance payment systems which cover substantially all of their employees.
Effective April 1, 2000, the Group adopted a new accounting standard for retirement benefits and accounted for the liability for retirement benefits based on the projected benefit obligations and plan assets at the balance sheet date. The projected benefit obligations are attributed to periods on a straight-line basis. Actuarial gains and losses are mainly amortized by the declining-balance method over 7 years within the average remaining service period. Past service costs are amortized by the straight-line method over 7 years within the average remaining service period.
In May 2012, the Accounting Standards Board of Japan (ASBJ) issued ASBJ Statement No. 26, "Accounting Standard for Retirement Benefits" and ASBJ Guidance No. 25, "Guidance on Accounting Standard for Retirement Benefits," which replaced the accounting standard for retirement benefits that had been issued by the Business Accounting Council in 1998 with an effective date of April 1, 2000, and the other related practical guidance, and were followed by partial amendments from time to time through 2009.
(a) Under the revised accounting standard, actuarial gains and losses and past service costs that are yet to be recognized in profit or loss are recognized within accumulated other comprehensive income, after adjusting for tax effects, and any resulting deficit or surplus is recognized as liability for retirement benefits or asset for retirement benefits.
1. BASIS OF PRESENTATION OF CONSOLIDATED FINANCIAL STATEMENTS
The accompanying consolidated financial statements have been prepared in accordance with the provisions set forth in the Japanese Financial Instruments and Exchange Act and its related accounting regulations and in accordance with accounting principles generally accepted in Japan (“Japanese GAAP”), which are different in certain respects as to the application and disclosure requirements from International Financial Reporting Standards. In preparing these consolidated financial statements, certain reclassifications and rearrangements have been made to the consolidated financial statements issued domestically in order to present them in a form which is more familiar to readers outside Japan. In addition, certain reclassifications have been made in the 2013 consolidated financial statements to conform to the classifications used in 2014. The consolidated financial statements are stated in Japanese yen, the currency of the country in which MANDOM CORPORATION (the “Company”) is incorporated and operates.
2. SUMMARY OF SIGNIFICANT ACCOUNTING POLICIES
a. Consolidation - The consolidated financial statements as of March 31, 2014, include the accounts of the Company and its eleven (eleven in 2013) significant subsidiaries (collectively, the “Group”).
Under the control or influence concept, those companies in which the Company, directly or indirectly, is able to exercise control over operations are consolidated and those companies over which the Group has the ability to exercise significant influence are accounted for under the equity method.
Investment in one (one in 2013) associated company is accounted for under the equity method.
Investment in the remaining one unconsolidated subsidiary (one in 2013) is stated at cost. If the equity method of accounting had been applied to the investment in this company, the effect on the accompanying consolidated financial statements would not be material.
The excess of the cost of acquisition over the fair value of the net assets of an acquired subsidiary at the date of acquisition is being amortized over a period of five years.
All significant intercompany balances and transactions have been eliminated in consolidation. All material unrealized profit included in assets resulting from transactions within the Group is also eliminated in consolidation.
b. Cash Equivalents - Cash equivalents are short-term investments that are readily convertible into cash and that are exposed to insignificant risk of changes in value. Cash equivalents include time deposits and bond funds, all of which mature or become due within three months of the date of acquisition.
c. Short-term Investments and Investment Securities - Securities included in short-term investments and investment securities are classified and accounted for, depending on management's intent, as follows: 1) trading securities, which are held for the purpose of earning capital gains in the near term, are reported at fair value, with the related unrealized gains and losses included in earnings; 2) held-to-maturity debt securities, which are expected to be held to maturity with the positive intent and ability to hold to maturity, are reported at amortized cost; and 3) available-for-sale securities, which are not classified as either of the aforementioned securities, are reported at fair value, with unrealized gains and losses, net of applicable taxes, reported in a separate component of equity. The Group's securities (included in "short-term investments" and
MANDOM CORPORATION and its Consolidated Subsidiaries As of and for the Year Ended March 31, 2014
Financial Data Notes to Consolidated Financial Statements●

Financial Data Notes to Consolidated Financial Statements●
mandom Annual Report 201439 mandom Annual Report 2014 40
Financial Data/Notes to Consolidated Financial Statements
(b) The revised accounting standard does not change how to recognize actuarial gains and losses and past service costs in profit or loss. Those amounts are recognized in profit or loss over a certain period no longer than the expected average remaining service period of the employees. However, actuarial gains and losses and past service costs that arose in the current period and have not yet been recognized in profit or loss are included in other comprehensive income and actuarial gains and losses and past service costs that were recognized in other comprehensive income in prior periods and then recognized in profit or loss in the current period shall be treated as reclassification adjustments.
(c) The revised accounting standard also made certain amendments relating to the method of attributing expected benefit to periods and relating to the discount rate and expected future salary increases.
This accounting standard and the guidance for (a) and (b) above are effective for the end of annual periods beginning on or after April 1, 2013, and for (c) above are effective for the beginning of annual periods beginning on or after April 1, 2014, or for the beginning of annual periods beginning on or after April 1, 2015, subject to certain disclosure in March 2015, both with earlier application being permitted from the beginning of annual periods beginning on or after April 1, 2013. However, no retrospective application of this accounting standard to consolidated financial statements in prior periods is required.
The Group applied the revised accounting standard and guidance for retirement benefits for (a) and (b) above, effective March 31, 2014. As a result, liability for retirement benefits of ¥1,188 million was recorded as of March 31, 2014, accumulated other comprehensive income for the year ended March 31, 2014, increased by ¥34 million, and minority interests for the year ended March 31, 2014, decreased by ¥82 million.
h. Research and Development Costs - Research and development costs are charged to income as incurred.
i. Leases - In March 2007, the ASBJ issued ASBJ Statement No. 13, "Accounting Standard for Lease Transactions," which revised the previous accounting standard for lease transactions. The revised accounting standard for lease transactions was effective for fiscal years beginning April 1, 2008.
Under the previous accounting standard, finance leases that were deemed to transfer ownership of the leased property to the lessee were capitalized. However, other finance leases were permitted to be accounted for as operating lease transactions if certain "as if capitalized" information was disclosed in the notes to the lessee's financial statements. The revised accounting standard requires that all finance lease transactions be capitalized by recognizing lease assets and lease obligations in the balance sheet.
j. Income Taxes - The provision for income taxes is computed based on the pretax income included in the consolidated statement of income. The asset and liability approach is used to recognize deferred tax assets and liabilities for the expected future tax consequences of temporary differences between the carrying amounts and the tax bases of assets and liabilities. Deferred taxes are measured by applying currently enacted tax laws to the temporary differences.
k. Foreign Currency Transactions - All short-term and long-term monetary receivables and payables denominated in foreign currencies are translated into Japanese yen at the exchange rates
as of the balance sheet date. The foreign exchange gains and losses from translation are recognized in the consolidated statement of income.
l. Foreign Currency Financial Statements - The balance sheet accounts of the consolidated foreign subsidiaries are translated into Japanese yen at the current exchange rate as of the balance sheet date, except for equity which is translated at the historical rate. Differences arising from such translation are shown as "Foreign currency translation adjustments" under accumulated other comprehensive income in a separate component of equity. Revenue and expense accounts of consolidated foreign subsidiaries are translated into yen at the average exchange rate.
m. Per Share Information - Basic net income per share is computed by dividing net income available to common shareholders by the weighted-average number of common shares outstanding for the period.
Diluted net income per share is not disclosed because no dilutive securities exist.
Cash dividends per share presented in the accompanying consolidated statement of income are dividends applicable to the respective years, including dividends to be paid after the end of the year.
n. New Accounting Pronouncements
Accounting Standard for Retirement Benefits - On May 17, 2012, the ASBJ issued ASBJ Statement No. 26, "Accounting Standard for Retirement Benefits" and ASBJ Guidance No. 25, "Guidance on Accounting Standard for Retirement Benefits," which replaced the Accounting Standard for Retirement Benefits that had been issued by the Business Accounting Council in 1998 with an effective date of April 1, 2000, and the other related practical guidance, and were followed by partial amendments from time to time through 2009.
Major changes are as follows:
(a) Treatment in the balance sheet
Under the current requirements, actuarial gains and losses and past service costs that are yet to be recognized in profit or loss are not recognized in the balance sheet, and the difference between retirement benefit obligations and plan assets (hereinafter, "deficit or surplus"), adjusted by such unrecognized amounts, is recognized as a liability or asset.
Under the revised accounting standard, actuarial gains and losses and past service costs that are yet to be recognized in profit or loss shall be recognized within accumulated other comprehensive income, after adjusting for tax effects, and any resulting deficit or surplus shall be recognized as liability for retirement benefits or asset for retirement benefits.
(b) Treatment in the statement of income and the statement of
comprehensive income
The revised accounting standard does not change how to recognize actuarial gains and losses and past service costs in profit or loss. Those amounts would be recognized in profit or loss over a certain period no longer than the expected average remaining service period of the employees. However, actuarial gains and losses and past service costs that arose in the current period and have not yet been recognized in profit or loss shall be included in other comprehensive income and actuarial gains and losses and past service costs that were recognized in other comprehensive income in prior periods and then recognized in profit or loss in the current period shall be treated as reclassification adjustments.
(c) Amendments relating to the method of attributing expected benefit
to periods and relating to the discount rate and expected future
salary increases
The revised accounting standard also made certain amendments relating to the method of attributing expected benefit to periods and relating to the discount rate and expected future salary increases.
This accounting standard and the guidance for (a) and (b) above are effective for the end of annual periods beginning on or after April 1, 2013, and for (c) above are effective for the beginning of annual periods beginning on or after April 1, 2014, or for the
beginning of annual periods beginning on or after April 1, 2015, subject to certain disclosure in March 2015, both with earlier application being permitted from the beginning of annual periods beginning on or after April 1, 2013. However, no retrospective application of this accounting standard to consolidated financial statements in prior periods is required.
The Company applied the revised accounting standard for (a) and (b) above effective April 1, 2013, and expects to apply (c) above from April 1, 2014. The Company assumes that the effects of applying the revised accounting standard for (c) above are minor.
Short-term investments: Time deposits other than cash equivalents ¥1,206 ¥1,762 Short-term treasury securities 9,599 9,199 Commercial paper other than cash equivalents 1,997 1,497 Certificates of deposits 1,500 1,500 Trust fund investment 4 Total ¥14,302 ¥13,962 Investment securities: Marketable equity securities ¥4,829 ¥5,021 Nonmarketable equity securities 13 13 Total ¥4,842 ¥5,034
Equity securities ¥3,475 ¥1,378 ¥(24) ¥4,829
Debt securities 11,599 (3) 11,596
Other 1,500 1,500
Equity securities ¥4,493 ¥643 ¥(115) ¥5,021 Debt securities 10,698 0 (2) 10,696 Other 1,505 (1) 1,504
3. SHORT-TERM INVESTMENTS AND INVESTMENT SECURITIES Short-term investments and investment securities as of March 31, 2014 and 2013, consisted of the following:
Information regarding the securities classified as available-for-sale as of March 31, 2014 and 2013, was as follows:
FairValue
UnrealizedLoss
UnrealizedGainCostMarch 31, 2013
Millions of Yen
2014 2013
Millions of Yen
Equity securities ¥13 ¥13
Available-for-sale securities whose fair value could not be reliably determined as of March 31, 2014 and 2013, were as follows:
Proceeds from sales of available-for-sale securities for the years ended March 31, 2014 and 2013, were ¥1,134 million and ¥280 million, respectively. Gross realized gain and loss on these sales, computed on the moving-average cost basis, were ¥148 million and ¥39 million for the year ended March 31, 2014, respectively.
2014 2013
Millions of Yen
FairValue
UnrealizedLoss
UnrealizedGainCostMarch 31, 2014
Millions of Yen
Merchandise ¥1,830 ¥1,959 Finished products 3,584 3,010 Work in process 440 407 Raw materials and supplies 2,268 2,265 Total ¥8,122 ¥7,641
4. INVENTORIES Inventories as of March 31, 2014 and 2013, consisted of the following:
2014 2013
Millions of Yen
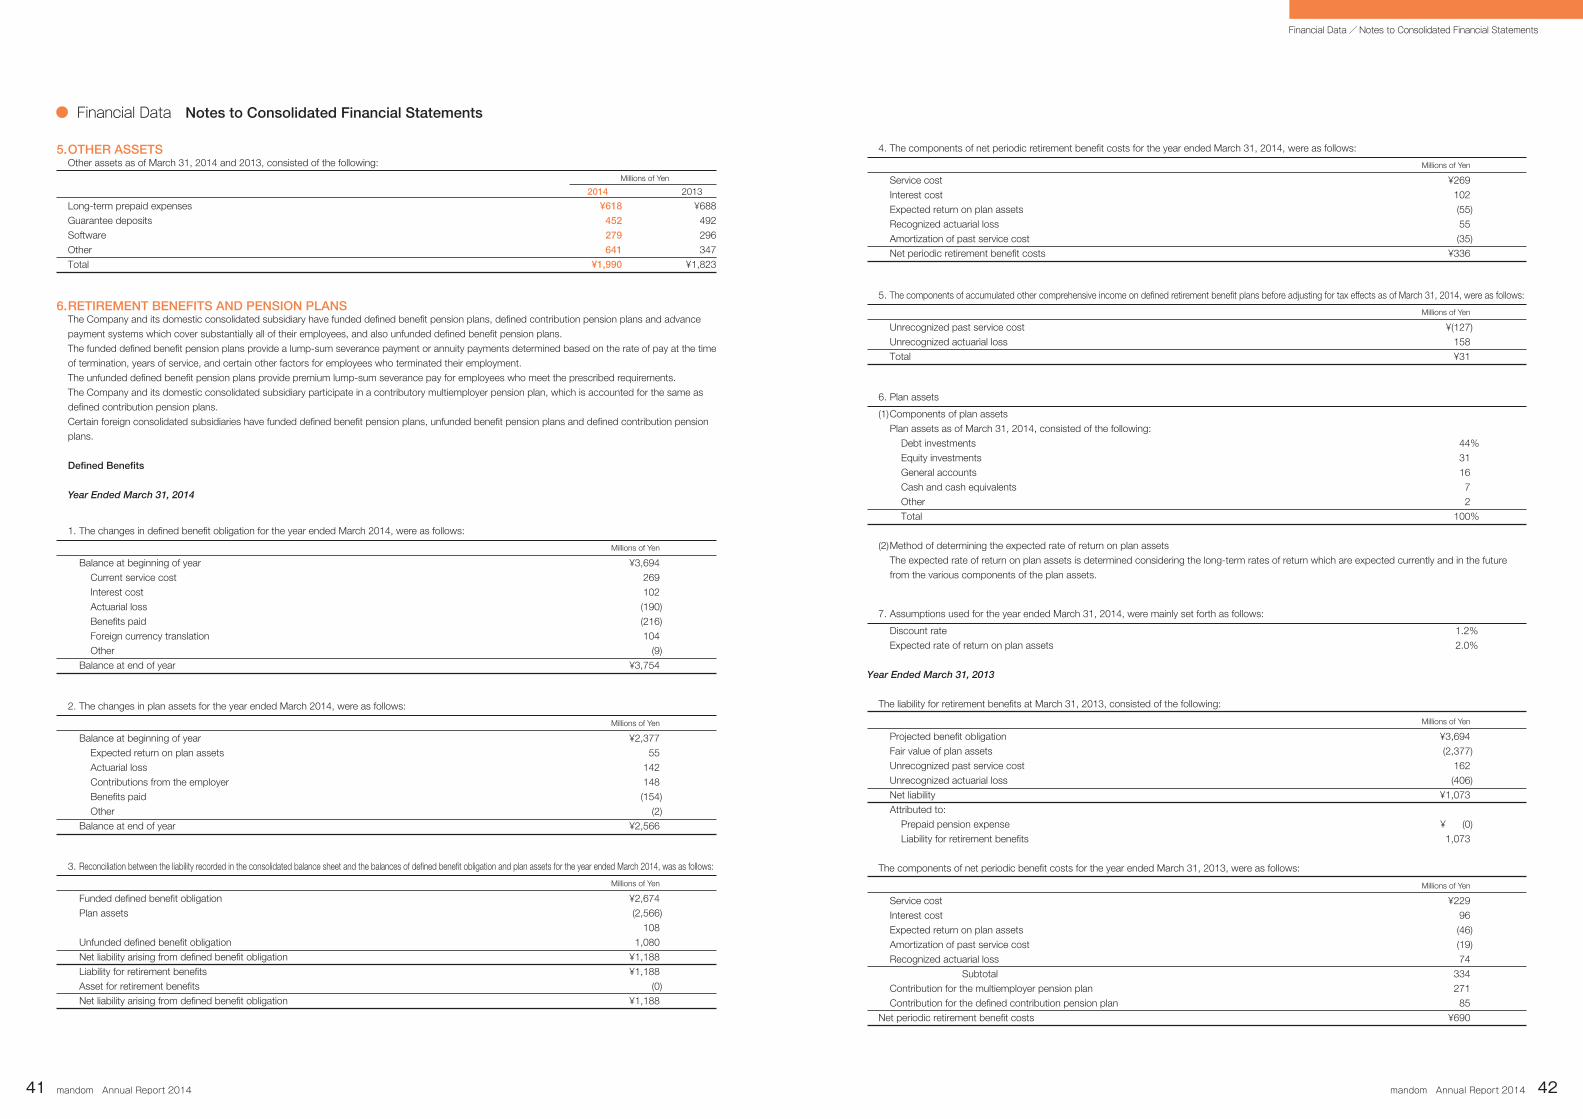
Financial Data Notes to Consolidated Financial Statements●
mandom Annual Report 201441 mandom Annual Report 2014 42
Financial Data/Notes to Consolidated Financial Statements
Long-term prepaid expenses ¥618 ¥688 Guarantee deposits 452 492 Software 279 296 Other 641 347 Total ¥1,990 ¥1,823
5. OTHER ASSETSOther assets as of March 31, 2014 and 2013, consisted of the following:
2014 2013
Millions of Yen
6. RETIREMENT BENEFITS AND PENSION PLANSThe Company and its domestic consolidated subsidiary have funded defined benefit pension plans, defined contribution pension plans and advance payment systems which cover substantially all of their employees, and also unfunded defined benefit pension plans.The funded defined benefit pension plans provide a lump-sum severance payment or annuity payments determined based on the rate of pay at the time of termination, years of service, and certain other factors for employees who terminated their employment.The unfunded defined benefit pension plans provide premium lump-sum severance pay for employees who meet the prescribed requirements. The Company and its domestic consolidated subsidiary participate in a contributory multiemployer pension plan, which is accounted for the same as defined contribution pension plans.Certain foreign consolidated subsidiaries have funded defined benefit pension plans, unfunded benefit pension plans and defined contribution pension plans.
Defined Benefits
Year Ended March 31, 2014
Millions of Yen
Balance at beginning of year ¥3,694 Current service cost 269 Interest cost 102 Actuarial loss (190) Benefits paid (216) Foreign currency translation 104 Other (9) Balance at end of year ¥3,754
1. The changes in defined benefit obligation for the year ended March 2014, were as follows:
Millions of Yen
Balance at beginning of year ¥2,377 Expected return on plan assets 55 Actuarial loss 142 Contributions from the employer 148 Benefits paid (154) Other (2) Balance at end of year ¥2,566
2. The changes in plan assets for the year ended March 2014, were as follows:
Millions of Yen
Funded defined benefit obligation ¥2,674 Plan assets (2,566) 108 Unfunded defined benefit obligation 1,080 Net liability arising from defined benefit obligation ¥1,188 Liability for retirement benefits ¥1,188 Asset for retirement benefits (0) Net liability arising from defined benefit obligation ¥1,188
3. Reconciliation between the liability recorded in the consolidated balance sheet and the balances of defined benefit obligation and plan assets for the year ended March 2014, was as follows:
Millions of Yen
Service cost ¥269 Interest cost 102 Expected return on plan assets (55) Recognized actuarial loss 55 Amortization of past service cost (35) Net periodic retirement benefit costs ¥336
4. The components of net periodic retirement benefit costs for the year ended March 31, 2014, were as follows:
Millions of Yen
Unrecognized past service cost ¥(127) Unrecognized actuarial loss 158 Total ¥31
5. The components of accumulated other comprehensive income on defined retirement benefit plans before adjusting for tax effects as of March 31, 2014, were as follows:
(1) Components of plan assets Plan assets as of March 31, 2014, consisted of the following: Debt investments 44% Equity investments 31 General accounts 16 Cash and cash equivalents 7 Other 2 Total 100%
(2) Method of determining the expected rate of return on plan assetsThe expected rate of return on plan assets is determined considering the long-term rates of return which are expected currently and in the future from the various components of the plan assets.
6. Plan assets
Discount rate 1.2% Expected rate of return on plan assets 2.0%
Year Ended March 31, 2013
The liability for retirement benefits at March 31, 2013, consisted of the following:
Millions of Yen
Projected benefit obligation ¥3,694 Fair value of plan assets (2,377) Unrecognized past service cost 162 Unrecognized actuarial loss (406) Net liability ¥1,073 Attributed to: Prepaid pension expense ¥ (0) Liability for retirement benefits 1,073
The components of net periodic benefit costs for the year ended March 31, 2013, were as follows:
Millions of Yen
Service cost ¥229 Interest cost 96 Expected return on plan assets (46) Amortization of past service cost (19) Recognized actuarial loss 74 Subtotal 334 Contribution for the multiemployer pension plan 271 Contribution for the defined contribution pension plan 85 Net periodic retirement benefit costs ¥690
7. Assumptions used for the year ended March 31, 2014, were mainly set forth as follows:

Financial Data Notes to Consolidated Financial Statements●
mandom Annual Report 201443 mandom Annual Report 2014 44
Financial Data/Notes to Consolidated Financial Statements
Discount rate 1.2% Expected rate of return on plan assets 2.0% Amortization period of past service cost 7 years Recognition period of actuarial gain/loss 7 years
Defined Contribution
The Company and its consolidated subsidiaries recognized the defined contribution cost of ¥85 million for the year ended March 31, 2014.Multiemployer Plan
The Company and certain consolidated subsidiaries participate in a contributory multiemployer pension plan (the “Plan”) covering substantially all of their employees. The Group recognized the contribution cost to the Plan of ¥264 million for the year ended March 31, 2014, which is accounted for same as defined contribution pension plans. Based on the Group’s salary expense in comparison to the total salary expense of all employees who participate in the Plan, the Group’s share of the Plan was 12.3% at March 31, 2014. However, the share was not equal to the actual contribution percentage of the Group.
The financial statement of the Plan as of March 31, 2013, was as follows:
Millions of Yen
Fair value of plan assets ¥35,909 Projected benefit obligation 46,060 Net ¥(10,151)
<Note>
The main reason for the difference between the fair value of plan assets and the projected benefit obligation represented the past service obligation of ¥12,623 million. The past service obligation is evenly amortized over 16 years. The Company and certain consolidated subsidiaries recognized ¥122 million of special contribution expense for the year ended March 31, 2014.
Assumptions used for the year ended March 31, 2013, were mainly set forth as follows:
Deposits received ¥398 ¥376 Liabilities for retirement benefits to directors and Audit & Supervisory Board members 378 351 Other 169 128 Total ¥945 ¥855
7. OTHER LONG-TERM LIABILITIES Other long-term liabilities as of March 31, 2014 and 2013, consisted of the following:
2014 2013
Millions of Yen
8. EQUITYJapanese companies are subject to the Companies Act of Japan (the “Companies Act”). The significant provisions in the Companies Act that affect financial and accounting matters are summarized below:
(a) DividendsUnder the Companies Act, companies can pay dividends at any time during the fiscal year in addition to the year-end dividend upon resolution at the shareholders meeting. For companies that meet certain criteria, such as (1) having a board of directors, (2) having independent auditors, (3) having an Audit & Supervisory Board, and (4) the term of service of the directors is prescribed as one year rather than two years of normal term by its articles of incorporation, the board of directors may declare dividends (except for dividends in kind) at any time during the fiscal year if companies have prescribed so in its articles of incorporation. The Company meets all the above criteria. The Companies Act permits companies to distribute dividends in kind (noncash assets) to shareholders subject to a certain limitation and additional requirements. Semiannual interim dividends may also be paid once a year upon resolution by the board of directors if the articles of incorporation of companies so stipulate. The Companies Act provides certain limitations on the amounts available for dividends or the purchase of treasury stock. The limitation is defined as the amount available for distribution to the shareholders, but the amount of net assets after dividends must be maintained at no less than ¥3 million.
(b) Increases/decreases and transfer of common stock, reserve and surplusThe Companies Act requires that an amount equal to 10% of dividends be appropriated as a legal reserve (a component of retained earnings) or as additional paid-in capital (a component of capital surplus) depending on the equity account charged upon the payment of such dividends until the aggregate amount of legal reserve and additional paid-in capital equals 25% of the amount of common stock. Under the Companies Act, the total amount of additional paid-in capital and legal reserve may be reversed without limitation. The Companies Act also provides that common stock, legal reserve, additional paid-in capital, other capital surplus and retained earnings can be transferred among the accounts under certain conditions upon resolution of the shareholders.
9. INCOME TAXESThe Company and its domestic subsidiary are subject to Japanese national and local income taxes which, in the aggregate, resulted in a normal effective statutory tax rate of approximately 37.96% for the years ended March 31, 2014 and 2013. Foreign subsidiaries are subject to income taxes of the countries in which they operate.
The tax effects of significant temporary differences which resulted in deferred tax assets and liabilities at March 31, 2014 and 2013, were as follows:
A reconciliation between the normal effective statutory tax rate and the actual effective tax rate reflected in the accompanying consolidated statement of income for the year ended March 31, 2014, with the corresponding figures for the year ended March 31, 2013, was as follows:
10. RESEARCH AND DEVELOPMENT COSTSResearch and development costs charged to income for the years ended March 31, 2014 and 2013, were ¥1,960 million and ¥1,793 million, respectively.
11. ADVERTISING COSTSAdvertising costs charged to income for the years ended March 31, 2014 and 2013, were ¥4,121 million and ¥3,105 million, respectively.
(c) Treasury stock and treasury stock acquisition rightsThe Companies Act also provides for companies to purchase treasury stock and dispose of such treasury stock by resolution of the board of directors. The amount of treasury stock purchased cannot exceed the amount available for distribution to the shareholders, which is determined by specific formula.Under the Companies Act, stock acquisition rights are presented as a separate component of equity. The Companies Act also provides that companies can purchase both treasury stock acquisition rights and treasury stock. Such treasury stock acquisition rights are presented as a separate component of equity or deducted directly from stock acquisition rights.
Deferred tax assets:
Accrued bonuses ¥256 ¥275 Enterprise tax 92 84 Inventories 165 163 Liability for retirement benefits 366 345 Long-term liabilities 105 107 Property, plant and equipment 34 34 Other 613 518 Less valuation allowance (201) (102) Total 1,430 1,424 Deferred tax liabilities:
Unrealized gain on available-for-sale securities 479 185 Other 225 176 Total 704 361 Net deferred tax assets ¥726 ¥1,063
2014 2013
Millions of Yen
Normal effective statutory tax rate 37.96% 37.96% Expenses not deductible for income tax purposes 1.77 1.63 Difference in subsidiaries’ tax rates (4.70) (4.67) Tax credit for research and development costs and others (2.23) (1.49) Change in valuation allowance 1.33 (0.08) Capital levy on inhabitant tax 0.31 0.36 Decrease adjustment of deferred tax assets for changing the tax rate 0.63
Other - net 0.76 0.97 Actual effective tax rate 35.83% 34.68%
New tax reform laws enacted in 2014 in Japan changed the normal effective statutory tax rate for the fiscal year beginning on or after April 1, 2014 from approximately 37.96% to 35.59%. The effect of this change was to decrease deferred tax assets in the consolidated balance sheet as of March 31, 2014 by ¥41 million and to increase income taxes - deferred in the consolidated statement of income for the year then ended by ¥41 million.
2014 2013

Financial Data Notes to Consolidated Financial Statements●
mandom Annual Report 201445 mandom Annual Report 2014 46
Financial Data/Notes to Consolidated Financial Statements
13. FINANCIAL INSTRUMENTS AND RELATED DISCLOSURES(1) Group policy for financial instruments
The Group uses financial instruments to invest cash surplus amounts in low-risk and highly liquid financial instruments. Derivatives are used, not for speculative purposes, but to achieve higher yields within specified limits on the amounts.
(2) Nature and extent of risks arising from financial instruments
Receivables, such as trade notes and trade accounts, are exposed to customer credit risk. Short-term investments and investment securities, mainly debt securities with maturities and equity instruments of customers and suppliers of the Group, are exposed to the risk of market price fluctuations. Payment terms of payables, such as trade notes and trade accounts, are mainly less than three months. Receivables and payables in foreign currencies are exposed to the market risk of fluctuation in foreign currency exchange rates.
(3) Risk management for financial instruments
Credit risk management
The Group manages its credit risk from receivables on the basis of internal guidelines, which include monitoring on a regular basis of payment terms and balances of major customers by the sales planning division to identify the default risk of customers in the early stages. With respect to financial investments with maturities, since the Group manages its exposure to credit risk by limiting its funding to high credit rating bonds in accordance with its internal guidelines, the credit risk associated with this investment is not considered to be significant.
Due within one year ¥10 ¥146 ¥6 ¥150 Due after one year 26 576 11 722 Total ¥36 ¥722 ¥17 ¥872
Operating Leases
Operating Leases
FinanceLeases
FinanceLeases
Millions of Yen
2014 2013
12. LEASESThe Group leases office space, office equipment and certain other assets. Total rental expenses for the years ended March 31, 2014 and 2013, were ¥1,413 million and ¥1,349 million, respectively.
Obligations under finance leases and future minimum payments under noncancelable operating leases were as follows:
Market risk management
With respect to foreign currency trade receivables and payables, the Group monitors on a regular basis foreign exchange risk recognized monthly in each currency. Short-term investments and investment securities are managed by monitoring market values and the financial position of issuers on a regular basis, and the securities, except for government bonds, are managed by reviewing the condition continuously in view of the market trend and relationship of the business partners. Derivatives have been utilized in accordance with internal policies which regulate the authorization and credit limit amount. The conditions and results of such transactions are regularly communicated to the Management Committee.
Liquidity risk management
The Group manages its liquidity risk by holding adequate volumes of liquid assets, along with adequate financial planning prepared by the financial management division based on each department’s report.
(4) Concentration of credit risk
As of March 31, 2014, approximately 53.6% of total receivables were from specific major customers of the Group.
(5) Fair values of financial instruments
(a) Fair value of financial instrumentsThe carrying amount and fair value as of March 31, 2014 and 2013, were as follows:
Cash and cash equivalents
The carrying amounts of cash and cash equivalents approximate fair value because of their short maturities.Short-term investments and investment securities
The fair values of short-term investments and investment securities are measured at the quoted market price of the stock exchange for the equity instruments and at the quoted price obtained from the financial institutions for certain debt instruments. The carrying amounts of short-term investments and investment securities are equal to the fair values. The information of the fair value for short-term investments and investment securities by classification is included in Note 3.Receivables, payables, and accrued income taxes
The carrying amounts of receivables, payables, and accrued income taxes approximate fair value because of their short maturities.
(b) Financial instruments whose fair value cannot be reliably determined
Cash and cash equivalents ¥10,891 ¥10,891
Short-term investments and investment securities 19,131 19,131
Receivables 8,443 8,443
Total ¥38,465 ¥38,465
Payables ¥ 6,726 ¥ 6,726
Accrued income taxes 1,237 1,237
Total ¥ 7,963 ¥ 7,963
Cash and cash equivalents ¥10,482 ¥10,482Short-term investments and investment securities 18,983 18,983Receivables 7,807 7,807Total ¥37,272 ¥37,272Payables ¥ 4,099 ¥ 4,099Accrued income taxes 995 995Total ¥ 5,094 ¥ 5,094
FairValue
CarryingAmountMarch 31, 2014
Millions of Yen
FairValue
CarryingAmountMarch 31, 2013
Millions of Yen
Investments in equity instruments that do not have a quoted market price in an active market ¥13 ¥13
2014 2013Millions of Yen
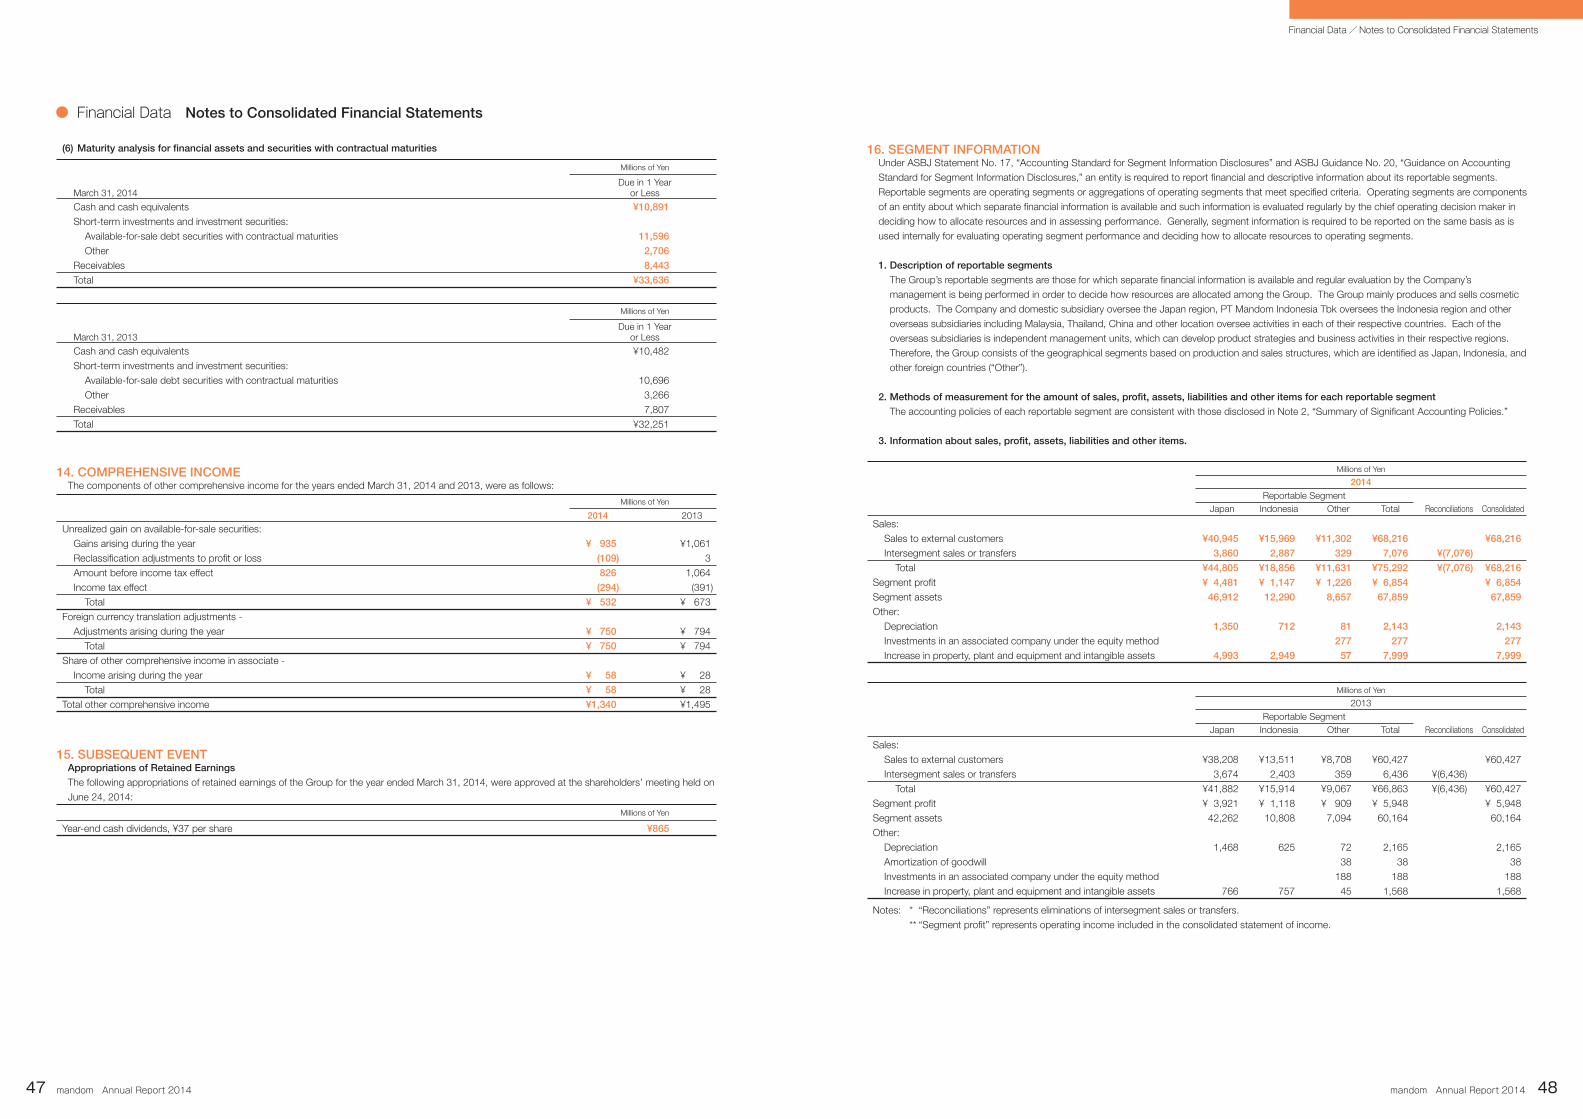
Financial Data Notes to Consolidated Financial Statements●
mandom Annual Report 201447 mandom Annual Report 2014 48
Financial Data/Notes to Consolidated Financial Statements
16. SEGMENT INFORMATIONUnder ASBJ Statement No. 17, “Accounting Standard for Segment Information Disclosures” and ASBJ Guidance No. 20, “Guidance on Accounting Standard for Segment Information Disclosures,” an entity is required to report financial and descriptive information about its reportable segments. Reportable segments are operating segments or aggregations of operating segments that meet specified criteria. Operating segments are components of an entity about which separate financial information is available and such information is evaluated regularly by the chief operating decision maker in deciding how to allocate resources and in assessing performance. Generally, segment information is required to be reported on the same basis as is used internally for evaluating operating segment performance and deciding how to allocate resources to operating segments.
1. Description of reportable segments
The Group’s reportable segments are those for which separate financial information is available and regular evaluation by the Company’s management is being performed in order to decide how resources are allocated among the Group. The Group mainly produces and sells cosmetic products. The Company and domestic subsidiary oversee the Japan region, PT Mandom Indonesia Tbk oversees the Indonesia region and other overseas subsidiaries including Malaysia, Thailand, China and other location oversee activities in each of their respective countries. Each of the overseas subsidiaries is independent management units, which can develop product strategies and business activities in their respective regions. Therefore, the Group consists of the geographical segments based on production and sales structures, which are identified as Japan, Indonesia, and other foreign countries (“Other”).
2. Methods of measurement for the amount of sales, profit, assets, liabilities and other items for each reportable segment
The accounting policies of each reportable segment are consistent with those disclosed in Note 2, “Summary of Significant Accounting Policies.”
3. Information about sales, profit, assets, liabilities and other items.
Sales:Sales to external customers ¥40,945 ¥15,969 ¥11,302 ¥68,216 ¥68,216
Intersegment sales or transfers 3,860 2,887 329 7,076 ¥(7,076)
Total ¥44,805 ¥18,856 ¥11,631 ¥75,292 ¥(7,076) ¥68,216
Segment profit ¥ 4,481 ¥ 1,147 ¥ 1,226 ¥ 6,854 ¥ 6,854
Segment assets 46,912 12,290 8,657 67,859 67,859
Other:Depreciation 1,350 712 81 2,143 2,143
Investments in an associated company under the equity method 277 277 277
Increase in property, plant and equipment and intangible assets 4,993 2,949 57 7,999 7,999
Sales:Sales to external customers ¥38,208 ¥13,511 ¥8,708 ¥60,427 ¥60,427Intersegment sales or transfers 3,674 2,403 359 6,436 ¥(6,436)
Total ¥41,882 ¥15,914 ¥9,067 ¥66,863 ¥(6,436) ¥60,427Segment profit ¥ 3,921 ¥ 1,118 ¥ 909 ¥ 5,948 ¥ 5,948Segment assets 42,262 10,808 7,094 60,164 60,164Other:
Depreciation 1,468 625 72 2,165 2,165Amortization of goodwill 38 38 38Investments in an associated company under the equity method 188 188 188Increase in property, plant and equipment and intangible assets 766 757 45 1,568 1,568
ReconciliationsTotalOtherIndonesiaReportable Segment
Japan Consolidated
Millions of Yen
2014
ReconciliationsTotalOtherIndonesiaReportable Segment
Japan Consolidated
Millions of Yen
2013
Notes: * “Reconciliations” represents eliminations of intersegment sales or transfers. ** “Segment profit” represents operating income included in the consolidated statement of income.
2014 2013
Millions of Yen
(6) Maturity analysis for financial assets and securities with contractual maturities
14. COMPREHENSIVE INCOMEThe components of other comprehensive income for the years ended March 31, 2014 and 2013, were as follows:
15. SUBSEQUENT EVENTAppropriations of Retained Earnings
The following appropriations of retained earnings of the Group for the year ended March 31, 2014, were approved at the shareholders’ meeting held on June 24, 2014:
Cash and cash equivalents ¥10,891
Short-term investments and investment securities:Available-for-sale debt securities with contractual maturities 11,596
Other 2,706
Receivables 8,443
Total ¥33,636
Unrealized gain on available-for-sale securities:Gains arising during the year ¥ 935 ¥1,061Reclassification adjustments to profit or loss (109) 3Amount before income tax effect 826 1,064Income tax effect (294) (391)
Total ¥ 532 ¥ 673Foreign currency translation adjustments -
Adjustments arising during the year ¥ 750 ¥ 794Total ¥ 750 ¥ 794
Share of other comprehensive income in associate -Income arising during the year ¥ 58 ¥ 28
Total ¥ 58 ¥ 28Total other comprehensive income ¥1,340 ¥1,495
Year-end cash dividends, ¥37 per share ¥865
Cash and cash equivalents ¥10,482Short-term investments and investment securities:
Available-for-sale debt securities with contractual maturities 10,696Other 3,266
Receivables 7,807Total ¥32,251
Millions of Yen
Due in 1 Yearor LessMarch 31, 2014
Millions of Yen
Millions of Yen
Due in 1 Yearor LessMarch 31, 2013
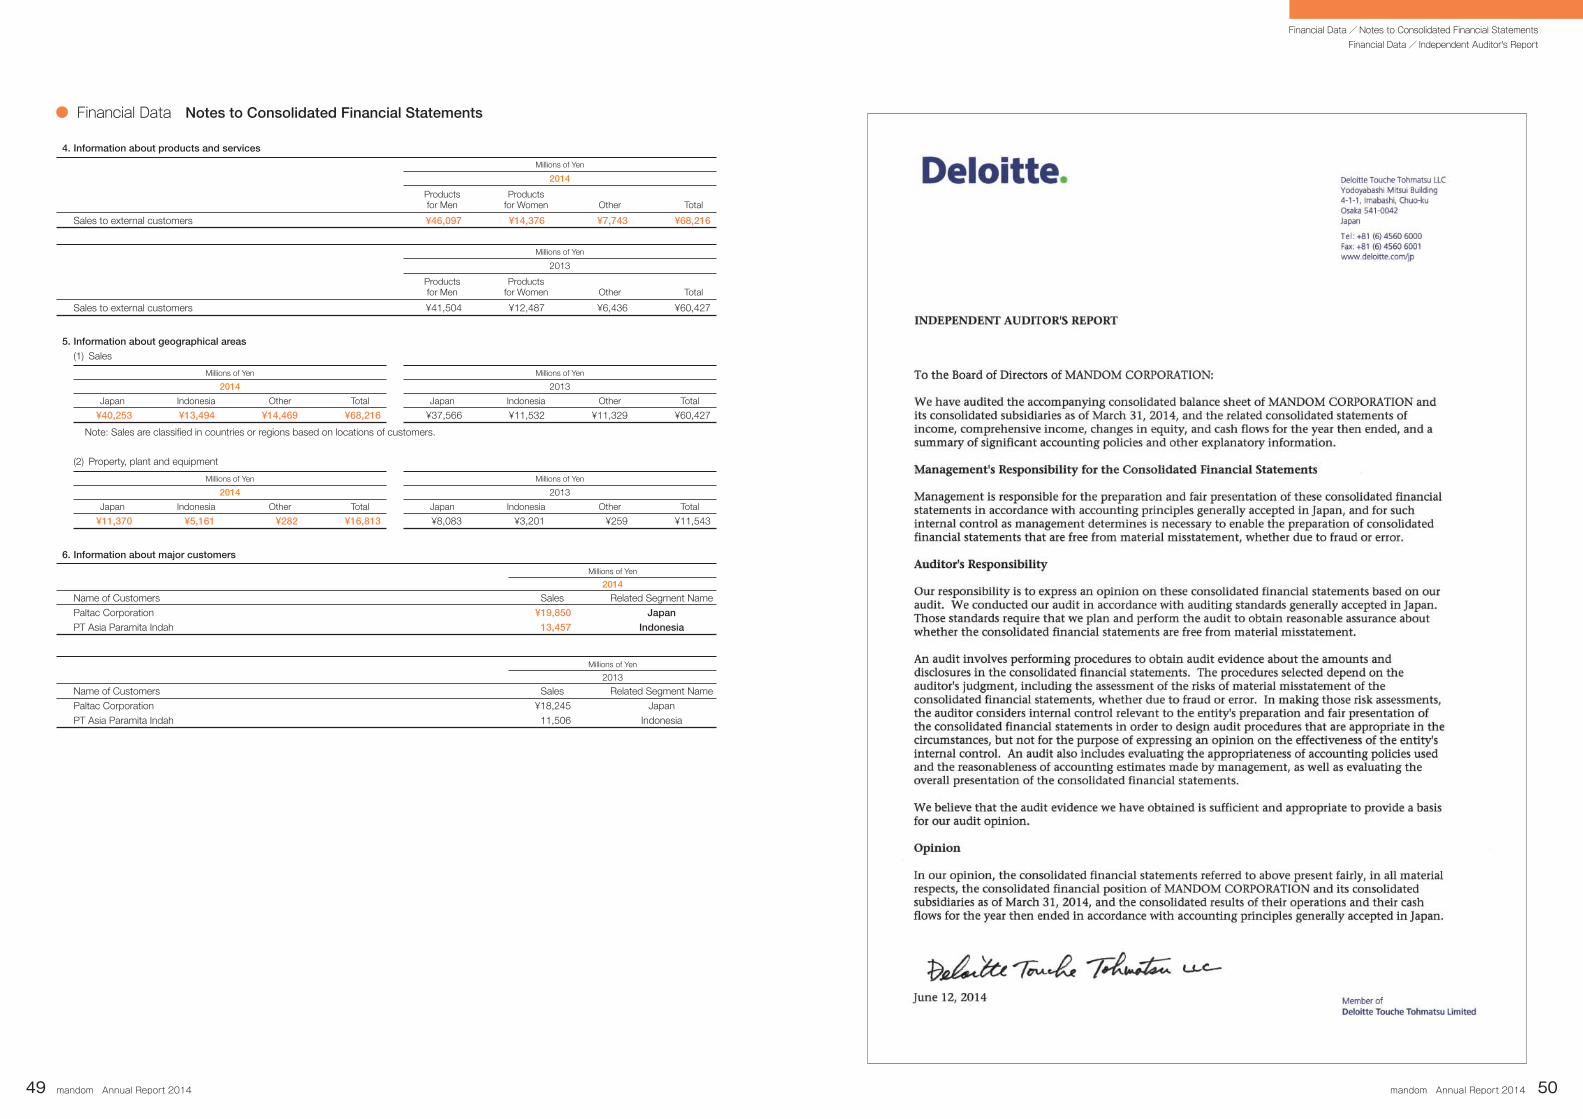
Financial Data Notes to Consolidated Financial Statements●
mandom Annual Report 201449 mandom Annual Report 2014 50
Financial Data/Notes to Consolidated Financial StatementsFinancial Data/ Independent Auditor's Report
Sales to external customers ¥46,097 ¥14,376 ¥7,743 ¥68,216
Sales to external customers ¥41,504 ¥12,487 ¥6,436 ¥60,427
¥40,253 ¥13,494 ¥14,469 ¥68,216
¥11,370 ¥5,161 ¥282 ¥16,813
¥37,566 ¥11,532 ¥11,329 ¥60,427
¥8,083 ¥3,201 ¥259 ¥11,543
4. Information about products and services
5. Information about geographical areas
(1) Sales
6. Information about major customers
Note: Sales are classified in countries or regions based on locations of customers.
(2) Property, plant and equipment
TotalOtherProducts
for WomenProducts for Men
Millions of Yen
2014
TotalOtherProducts
for WomenProducts for Men
Millions of Yen
2013
TotalOtherIndonesiaJapan
Millions of Yen
2014
TotalOtherIndonesiaJapan
Millions of Yen
2014
TotalOtherIndonesiaJapan
Millions of Yen
2013
TotalOtherIndonesiaJapan
Millions of Yen
2013
Name of Customers Sales Related Segment NamePaltac Corporation ¥19,850 Japan
PT Asia Paramita Indah 13,457 Indonesia
Name of Customers Sales Related Segment NamePaltac Corporation ¥18,245 JapanPT Asia Paramita Indah 11,506 Indonesia
2014
Millions of Yen
2013Millions of Yen

mandom Annual Report 201451 mandom Annual Report 2014 52
Management Information/Executives, Audit & Supervisory Board MembersCorporate Data/Company Outline, Stock and Shareholder Information
Company Name .... MANDOM CORPORATIONHead Offi ce ........... 5-12, Juniken-cho, Chuo-ku,
Osaka, 540-8530, JapanEstablished ........... December 23, 1927Paid-in Capital ...... ¥11,394,817,459
Number of Employees ....2,316 (Consolidated)524 (Non-consolidated)
Businesses ......................Manufacture and sale of cosmetics and perfumes, manufacture and sales of quasi-drugs
Fiscal Year-end ...............March 31
Group Companies
Major Shareholders
Stock Price and Transaction Volume
Common Stock Holdings
Contact: Corporate Communications & Investor Relations Division Address: 5-12, Juniken-cho, Chuo-ku, Osaka 540-8530, JapanE-mail: [email protected] URL: http://www.mandom.co.jp/
Based on the Japanese disclosure system, we disclose our corporate information in a timely and proper manner and achieve our accountability goals.1. As a company listed on the Tokyo Stock Exchange (TSE), we will comply with Japan’s Financial Instruments and Exchange Law, TSE’s rules of timely disclosure of
corporate information and other relevant laws, and regulations and rules.2. The Japanese disclosure system will be duly observed. In addition, we will disclose our corporate information in a fair, timely, and proper manner at our own discretion,
which will promote understanding of the Mandom Group.3. Sound relationships with a variety of stakeholders will be maintained and further enhanced. We will achieve full accountability for disclosed information.
Shareholders by Type (%)
Treasury Stock0.01
Financial Institutions0.24
Securities Companies0.15
Domestic Corporations0.81
Foreign Companies0.97
Individuals and Other97.82
Treasury Stock3.13
Financial Institutions13.18
Securities Companies0.64
Domestic Corporations17.90
Foreign Companies37.78
Individuals and Other27.37
Shareholders by Holding (%)
Number of Shares Authorized for Issue ............81,969,700Shares of Common Stock Issued and Outstanding .....24,134,606Number of Shareholders ....16,343Stock Listing ........................First Section, Tokyo Stock ExchangeSecurities Code ...................4917Transfer Agent .....................The Mitsui Sumitomo
Trust and Banking Co., Ltd.
Mandom Group Corporate IR Activities
(As of March 31, 2014)
(As of March 31, 2014)
Company Outline
Stock and Shareholder Information
General Meeting of
Shareholders ...............Ordinary general meeting of shareholders every June
Independent Auditor ...Deloitte Touche Tohmatsu LLC
Apr. 2009 Mar. 2010 Apr. 2010 Mar. 2011 Apr. 2011 Mar. 2012 Apr. 2012 Mar. 2013 Apr. 2013 Mar. 2014
4,000
3,500
3,000
2,500
2,000
1,500
1,000
3,000,000
1,500,000
0
Stock Price (Yen)
Trading Volume (Shares)2010 2011 2012 2013 2014
High ¥2,840 High ¥3,360
High ¥3,770
High ¥2,664 High ¥2,403
Low ¥1,632 Low ¥1,877
Low ¥2,879
Low ¥1,701Low ¥1,888
Corporate DataCompany Outline, Stock and Shareholder Information
Representative DirectorPresident Executive Officer
Motonobu Nishimura
Representative DirectorVice President Executive Officer
Masayoshi Momota
DirectorSenior Managing Executive Officer
Ryuichi Terabayashi
DirectorManaging Executive Officer
Tatsuyoshi Kitamura
External Director
Satoshi Nakajima
External Director
Satoshi Nagao
Managing Executive Officer
Hironao Suzuki
Managing Executive Officer
Shinichiro Koshiba
Managing Executive Officer
Tatsuya Arichi
Executive Officer
Yasuaki Kameda
Executive Officer
Kazunori Koshikawa
Executive Officer
Norikazu Furubayashi
Executive Officer
Takeshi Hibi
Executive Officer
Noboru Nonaka
Executive Officer
Koichi Watanabe
Executive Officer
Shinya Nagai
Audit & Supervisory Board Member
Yoshiaki Saito
External Audit & Supervisory Board Member
Masatoshi Tsuda
External Audit & Supervisory Board Member
Yukihiro Tsujimura
From left: Tatsuyoshi Kitamura, Ryuichi Terabayashi, Motonobu Nishimura, Masayoshi Momota, Satoshi Nakajima, Satoshi Nagao
From left: Masatoshi Tsuda, Yoshiaki Saito, Yukihiro Tsujimura
Directors
Audit & Supervisory Board Members
Executive Officers (Excluding company directors holding two posts concurrently)
(As of June 24, 2014)
(As of June 24, 2014)
(As of June 24, 2014)
Management InformationExecutives, Audit & Supervisory Board Members
Company Name Location Main Businesses Voting Rights
Piacelabo Corporation Japan Sale of cosmetics and other products 100.0% consolidated subsidiary
mbs Corporation Japan Life and non-life insurance agency services, general services and quality control of domestic Group company products
100.0% non-consolidated subsidiary
PT Mandom Indonesia Tbk Indonesia Manufacture and sale of cosmetics and other products 60.8% consolidated subsidiary
Mandom Corporation (Thailand) Ltd. Thailand Sale of cosmetics and other products 100.0% consolidated subsidiary
Mandom Philippines Corporation Philippines Sale of cosmetics and other products 100.0% consolidated subsidiary
Mandom (Malaysia) Sdn. Bhd. Malaysia Sale of cosmetics and other products 99.0% consolidated subsidiary
Mandom Corporation (Singapore) Pte. Ltd. Singapore Sale of cosmetics and other products 100.0% consolidated subsidiary
Mandom Taiwan Corporation Taiwan Sale of cosmetics and other products 100.0% consolidated subsidiary
Sunwa Marketing Co., Ltd. China (Hong Kong) Sale of cosmetics and other products 44.0% equity-method affi liate
Mandom Korea Corporation Korea Sale of cosmetics and other products 100.0% consolidated subsidiary
Zhongshan City Rida Cosmetics Co., Ltd. China (Zhongshan) Manufacture and sale of cosmetics and other products 66.7% consolidated subsidiary
Mandom China Corporation China (Shanghai) Sale of cosmetics and other products 100.0% consolidated subsidiary
Mandom Corporation (India) Pvt. Ltd. India Sale of cosmetics and other products 100.0% consolidated subsidiary
Shareholder Name or Title No. of SharesOwned (Thousands)
Ratio of ShareOwnership (%)
BNP PARIBAS SEC SERVICES LUXEMBOURG / JASDEC / ABERDEEN GLOBAL CLIENT ASSETS 2,274 9.43
Nishimura International Scholarship Foundation 1,800 7.46
STATE STREET BANK AND TRUST COMPANY 839 3.48
Mandom Corporation 755 3.13
Motonobu Nishimura 720 2.98
Mandom Employee Shareholding Association 692 2.87
Japan Trustee Services Bank, Ltd. (trust account) 668 2.77
The Master Trust Bank of Japan, Ltd. (trust account) 542 2.25
BNP PARIBAS SEC SVC LONDON / JAS / ABERDEEN INVESTMENT FUNDS ICVC / AGENCY LENDING 516 2.14
BNYM SA / NV FOR BNYM CLIENT ACCOUNT MPCS JAPAN 367 1.52Note: Figures less than 1,000 shares have been rounded down.
(Years ended March 31)