Embed Size (px)
Citation preview

Lampiran 1
KUESIONER PENELITIAN
Bapak/ibu guru SMA Negeri 3 Ponorogo yang terhormat.
Saya,
Nama : Azka Ruwaidafi Hayatna
Nim : 12412920
Mahasiswa semester akhir Universitas Muhammadiyah Ponorogo
Fakultas : Ekonomi
Program Studi : Manajemen
Sedang menyelesaikan skripsi dengan judul :
“Pengaruh Kompensasi, Motivasi dan Kedisiplinan Terhadap Prestasi Kerja
Pada Guru SMA Negeri 3 Ponorogo”
Untuk itu mohon kesediaan bapak/ibuk guru membantu saya dengan mengisi
kuesioner yang saya sediakan terlampir, jawaban kuesioner bapak/ibu guru
semata-mata untuk kepentingan ilmiah dan bersifat rahasia. Atas bantuan
bapak/ibu semua disampaikan terimakasih, selanjutnya mohon bapak/ibu
memberikan jawaban kuesioner dengan member tanda (√ ) pada kolom jawaban
yang tersedia.

A. IDENTITAS RESPONDEN:
a. Janis Kelamin
Laki-laki Perempuan
b. Usia
Dibawah 20 th 36 – 45 th
20 – 25 th di atas 45 th
26 – 35 th
c. Pendidikan Terakhir
D III S 2 (Strata 2)
S 1 (Strata 1)
d. Lama Bekerja
1 – 5 th 16 – 20 th
6 – 10 th di atas 20 th
11 – 10 th
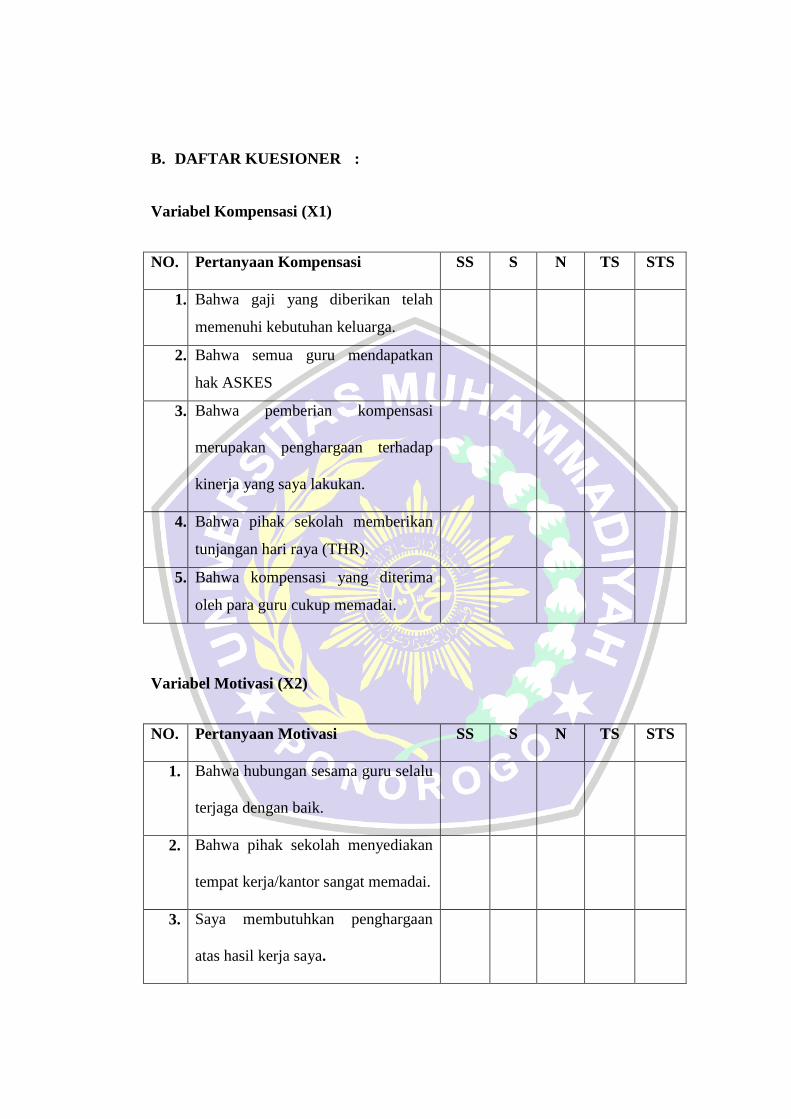
B. DAFTAR KUESIONER :
Variabel Kompensasi (X1)
NO. Pertanyaan Kompensasi SS S N TS STS
1. Bahwa gaji yang diberikan telah
memenuhi kebutuhan keluarga.
2. Bahwa semua guru mendapatkan
hak ASKES
3. Bahwa pemberian kompensasi
merupakan penghargaan terhadap
kinerja yang saya lakukan.
4. Bahwa pihak sekolah memberikan
tunjangan hari raya (THR).
5. Bahwa kompensasi yang diterima
oleh para guru cukup memadai.
Variabel Motivasi (X2)
NO. Pertanyaan Motivasi SS S N TS STS
1. Bahwa hubungan sesama guru selalu
terjaga dengan baik.
2. Bahwa pihak sekolah menyediakan
tempat kerja/kantor sangat memadai.
3. Saya membutuhkan penghargaan
atas hasil kerja saya.

4. Bahwa saya selalu meningkatkan
mutu dalam mengajar di sekolah.
5. Perhatian dari pimpinan membuat
saya lebih termotivasi dalam bekerja.
Variabel Kedisiplinan (X3)
NO. Pertanyaan Kedisiplinan SS S N TS STS
1. Saya datang/hadir tepat waktu sesuai
jam masuk.
2. Saya taat terhadap peraturan yang
ada/telah ditetapkan.
3. Saya pulang sesuai dengan jam
pulang kerja.
4. Saya menyelesaikan tugas/pekerjaan
sesuai waktu yang telah ditetapkan.
5. Dalam mendisiplinkan para siswa
dimulai disiplin saya sendiri.

PRESTASI KERJA (Y)
NO. Pertanyaan Prestasi
Kerja
SS S N TS STS
1. Saya selalu melaksanakan
pekerjaan dengan baik.
2. Prestasi siswa-siswi saya
selalu baik.
3. Saya mampu melaksanakan
tugas tambahan dengan
baik.
4. Secara periodik diadakan
seleksi guru berprestasi.
5. Saya membuat rencana
mengajar dan
melaksanakannya tepat
waktu.
Terimakasih atas waktu yang bapak/ibu berikan. Semoga dapat bermanfaat.
Aminn…

Lampiran 2
a. Responden Berdasarkan Status Guru
Responden Berdasarkan Status Guru
Satus Jumlah (guru) Presentase (%)
PNS 58 96,7
NON PNS 2 3,3
Jumlah 60 100
b. Responden Berdasarkan Jenis Kelamin
Responden Berdasarkan Jenis Kelamin
Jenis Kelamin Jumlah (guru) Presentase (%)
Laki – laki 33 56,9
Perempuan 25 43,1
Jumlah 58 100
c. Responden Berdasarkan Usia
Responden Berdasarkan Usia
Usia (Tahun) Jumlah (guru) Presentase (%)
25 – 30 5 8,6
31– 35 6 10,3
36 – 40 9 15,6
41 – 45 15 25,8
>45 23 39,7
Jumlah 58 100

d. Responden Berdasarkan Tingkat Pendidikan
Responden Berdasarkan Tingkat Pendidikan
Tingkat
Pendidikan
Jumlah
responden
Persentase (%)
Strata 1 51 87,8
Strata 2 7 12,2
Jumlah 58 100
e. Responden Berdasarkan Lama Bekerja
Responden berdasarkan Lama Bekerja
Lama Bekerja Jumlah Dalam %
1-10 tahun 9 15,5
11-20 tahun 11 18,9
21-30 tahun 13 22,5
31 tahun 25 43,1
Jumlah 58 100

Lampiran 3
Tabulasi Data Responden
Variabel Responden Kompensasi (X1)
Respond. X1.1 X1.2 X1.3 X1.4 X1.5 X1
1 4 4 5 4 4 21
2 4 5 4 5 5 23
3 4 5 5 5 4 23
4 5 5 4 4 4 22
5 5 5 4 4 5 23
6 5 5 5 5 5 25
7 5 4 4 4 5 22
8 4 5 5 5 5 24
9 4 5 4 4 3 20
10 3 4 4 5 5 21
11 4 4 4 4 5 21
12 5 5 5 4 5 24
13 5 4 4 5 4 22
14 5 5 5 4 5 24
15 5 5 4 4 5 23
16 5 5 4 5 5 24
17 5 4 3 4 4 20
18 5 4 4 4 5 22
19 5 5 5 5 4 24
20 4 5 5 3 4 21
21 5 5 5 5 4 24
22 5 5 5 4 5 24
23 5 5 5 4 5 24
24 5 5 5 4 5 24
25 5 5 3 4 5 22
26 5 5 4 4 5 23
27 4 5 5 4 5 23
28 5 5 5 4 5 24
29 4 5 5 5 3 22
30 5 5 5 5 5 25
31 5 4 5 3 5 22
32 5 4 5 3 5 22

33 4 5 5 4 5 23
34 4 5 5 5 5 24
35 5 5 4 3 5 22
36 4 5 4 3 4 20
37 5 4 4 5 5 23
38 4 5 5 4 5 23
39 3 4 4 3 4 18
40 4 5 5 5 5 24
41 5 5 5 3 5 23
42 4 5 5 4 4 22
43 4 5 4 5 4 22
44 4 5 5 4 4 22
45 5 5 5 4 3 22
46 4 5 4 5 4 22
47 4 5 5 5 4 23
48 5 5 5 5 5 25
49 5 4 5 5 5 24
50 5 5 4 5 5 24
51 4 4 4 5 5 22
52 5 5 5 5 5 25
53 5 5 5 4 4 23
54 4 5 5 5 5 24
55 5 4 5 4 4 22
56 5 5 5 5 4 24
57 4 5 4 4 4 21
58 5 5 5 5 5 25

Variabel Responden Motivasi (X2)
Respond. X2.1 X2.2 X2.3 X2.4 X2.5 X2
1 4 5 4 4 5 22
2 5 5 5 4 4 23
3 4 4 4 3 4 19
4 5 4 5 5 5 24
5 5 5 5 4 5 24
6 5 4 5 5 5 24
7 4 4 4 3 5 20
8 5 5 5 5 5 25
9 4 4 4 4 4 20
10 5 5 5 5 5 25
11 5 5 4 5 5 24
12 4 4 4 4 4 20
13 4 5 5 4 4 22
14 5 4 4 4 4 21
15 5 5 5 5 4 24
16 5 5 5 5 5 25
17 4 3 4 4 3 18
18 4 3 5 4 3 19
19 5 5 5 5 5 25
20 5 5 5 5 4 24
21 5 5 4 5 4 23
22 5 5 5 5 4 24
23 5 5 4 5 5 24
24 5 5 5 4 5 24
25 4 4 4 3 4 19
26 4 4 4 3 4 19
27 4 4 4 3 4 19
28 5 5 5 4 4 23
29 5 3 5 4 4 21
30 5 4 5 4 4 22
31 4 3 4 4 5 20
32 4 5 4 4 5 22
33 5 5 5 5 5 25
34 5 5 5 5 5 25
35 5 5 5 5 5 25
36 5 5 5 5 5 25

37 4 4 4 3 4 19
38 5 5 5 4 4 23
39 5 5 5 5 5 25
40 5 5 5 4 4 23
41 4 5 4 4 5 22
42 5 5 4 4 4 22
43 4 5 4 4 5 22
44 5 5 5 5 5 25
45 4 4 4 4 4 20
46 5 5 4 5 5 24
47 4 4 4 4 4 20
48 5 4 4 4 4 21
49 4 4 4 4 4 20
50 5 4 4 4 4 21
51 4 4 4 4 5 21
52 4 5 4 5 5 23
53 4 4 5 4 4 21
54 5 5 4 4 5 23
55 5 5 4 4 4 22
56 5 3 4 4 4 20
57 4 4 4 4 4 20
58 5 5 5 4 5 24

Variabel Responden Kedisiplinan (X3)
Respond. X3.1 X3.2 X3.3 X3.4 X3.5 X3
1 4 5 5 4 5 23
2 5 4 4 4 4 21
3 5 5 5 5 5 25
4 5 5 5 4 5 24
5 5 5 5 5 5 25
6 5 5 5 5 5 25
7 4 5 4 3 5 21
8 5 5 5 5 5 25
9 4 5 5 5 5 24
10 5 5 5 5 5 25
11 5 5 5 5 5 25
12 4 5 5 5 5 24
13 5 5 5 3 5 23
14 4 5 5 4 5 23
15 5 5 4 5 5 24
16 5 5 5 4 5 24
17 5 5 5 5 5 25
18 5 5 5 5 5 25
19 5 5 5 5 5 25
20 5 5 5 5 5 25
21 5 5 5 5 5 25
22 5 5 5 5 5 25
23 5 4 4 4 5 22
24 5 4 4 4 5 22
25 4 5 5 5 5 24
26 4 3 4 4 4 19
27 4 5 5 5 5 24
28 5 4 5 5 4 23
29 5 4 5 5 5 24
30 5 4 5 5 5 24
31 4 5 5 5 5 24
32 4 5 5 5 5 24
33 5 5 5 5 5 25
34 5 5 5 5 5 25
35 5 4 5 4 5 23
36 5 4 5 5 5 24

37 4 5 5 5 5 24
38 5 4 4 4 5 22
39 5 5 5 5 5 25
40 4 4 4 5 5 22
41 4 5 5 4 5 23
42 5 4 4 5 5 23
43 4 5 5 4 5 23
44 5 4 4 5 5 23
45 4 4 4 4 4 20
46 5 5 5 5 5 25
47 4 5 5 5 5 24
48 5 5 5 5 5 25
49 4 4 4 5 4 21
50 5 5 5 5 4 24
51 4 4 4 3 4 19
52 5 5 5 4 4 23
53 5 4 4 4 4 21
54 5 4 5 5 5 24
55 5 4 4 4 4 21
56 5 4 5 5 5 24
57 4 4 4 4 4 20
58 5 4 4 4 5 22

Variabel Responden Prestasi kerja (Y)
Respond. Y1.1 Y1.2 Y1.3 Y1.4 Y1.5 Y
1 4 5 4 4 5 22
2 5 5 5 4 4 23
3 5 5 5 5 5 25
4 5 4 5 5 5 24
5 5 5 5 5 5 25
6 5 5 5 5 5 25
7 4 4 4 3 5 20
8 5 5 5 5 5 25
9 4 4 4 4 4 20
10 5 5 5 5 5 25
11 5 5 5 5 5 25
12 4 4 4 4 4 20
13 4 5 5 5 4 23
14 5 4 4 4 4 21
15 5 5 5 5 5 25
16 5 5 3 5 5 23
17 4 5 4 4 3 20
18 4 4 5 4 3 20
19 5 5 4 5 5 24
20 5 5 5 5 5 25
21 5 5 5 5 5 25
22 5 5 5 5 5 25
23 5 5 5 5 5 25
24 5 5 5 5 5 25
25 5 5 5 5 5 25
26 4 4 4 3 4 19
27 5 5 5 5 5 25
28 5 5 5 4 4 23
29 5 5 5 4 4 23
30 5 5 5 4 4 23
31 4 5 4 4 5 22
32 4 5 4 4 5 22
33 5 5 5 5 5 25
34 5 5 5 5 5 25
35 5 5 5 5 5 25
36 4 5 5 5 3 22

37 5 5 5 3 5 23
38 4 5 5 4 4 22
39 4 5 4 5 4 22
40 4 5 5 4 4 22
41 5 5 5 4 3 22
42 4 5 4 5 4 22
43 4 5 5 5 4 23
44 5 5 5 5 5 25
45 4 4 4 4 4 20
46 5 5 4 4 4 22
47 4 4 4 4 4 20
48 5 5 5 5 5 25
49 4 4 4 3 5 20
50 5 5 5 5 5 25
51 4 4 4 4 4 20
52 4 4 4 4 4 20
53 5 5 5 4 4 23
54 4 5 3 4 5 21
55 5 5 5 4 4 23
56 3 5 4 5 5 22
57 4 4 4 4 4 20
58 5 5 5 5 5 25

lampiran 4
Output Spss Uji Validitas
Variabel Responden Kompensasi (X1)
Correlations
x1.1 x1.2 x1.3 x1.4 x1.5 kompensasi
x1.1 Pearson Correlation 1 .052 .043 -.042 .249 .504**
Sig. (2-tailed) .699 .746 .753 .060 .000
N 58 58 58 58 58 58
x1.2 Pearson Correlation .052 1 .285* .140 -.071 .464
**
Sig. (2-tailed) .699 .030 .295 .599 .000
N 58 58 58 58 58 58
x1.3 Pearson Correlation .043 .285* 1 .080 .012 .532
**
Sig. (2-tailed) .746 .030 .550 .931 .000
N 58 58 58 58 58 58
x1.4 Pearson Correlation -.042 .140 .080 1 .033 .538**
Sig. (2-tailed) .753 .295 .550 .807 .000
N 58 58 58 58 58 58
x1.5 Pearson Correlation .249 -.071 .012 .033 1 .505**
Sig. (2-tailed) .060 .599 .931 .807 .000
N 58 58 58 58 58 58
kompensasi Pearson Correlation .504** .464
** .532
** .538
** .505
** 1
Sig. (2-tailed) .000 .000 .000 .000 .000
N 58 58 58 58 58 58
**. Correlation is significant at the 0.01 level (2-tailed).
*. Correlation is significant at the 0.05 level (2-tailed).
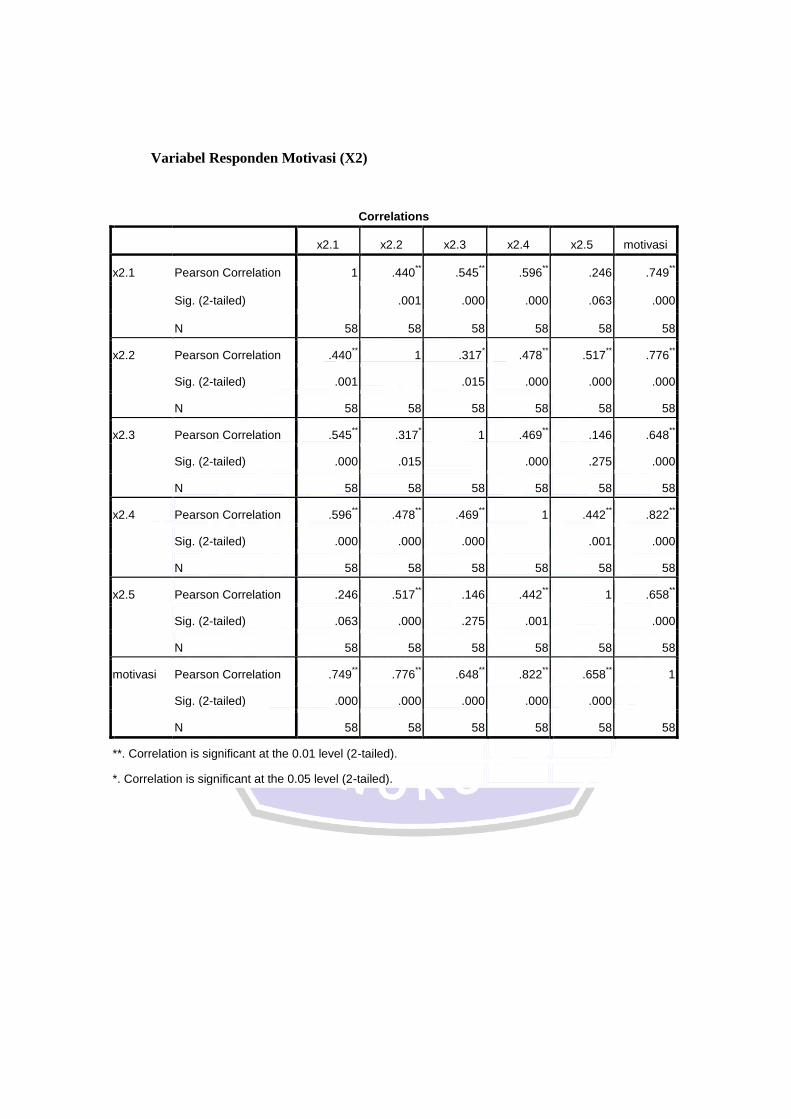
Variabel Responden Motivasi (X2)
Correlations
x2.1 x2.2 x2.3 x2.4 x2.5 motivasi
x2.1 Pearson Correlation 1 .440** .545
** .596
** .246 .749
**
Sig. (2-tailed) .001 .000 .000 .063 .000
N 58 58 58 58 58 58
x2.2 Pearson Correlation .440** 1 .317
* .478
** .517
** .776
**
Sig. (2-tailed) .001 .015 .000 .000 .000
N 58 58 58 58 58 58
x2.3 Pearson Correlation .545** .317
* 1 .469
** .146 .648
**
Sig. (2-tailed) .000 .015 .000 .275 .000
N 58 58 58 58 58 58
x2.4 Pearson Correlation .596** .478
** .469
** 1 .442
** .822
**
Sig. (2-tailed) .000 .000 .000 .001 .000
N 58 58 58 58 58 58
x2.5 Pearson Correlation .246 .517** .146 .442
** 1 .658
**
Sig. (2-tailed) .063 .000 .275 .001 .000
N 58 58 58 58 58 58
motivasi Pearson Correlation .749** .776
** .648
** .822
** .658
** 1
Sig. (2-tailed) .000 .000 .000 .000 .000
N 58 58 58 58 58 58
**. Correlation is significant at the 0.01 level (2-tailed).
*. Correlation is significant at the 0.05 level (2-tailed).

Variabel Responden Kedisiplinan (X3)
Correlations
x3.1 x3.2 x3.3 x3.4 x3.5 kedisiplinan
x3.1 Pearson Correlation 1 -.038 .115 .196 .131 .414**
Sig. (2-tailed) .780 .388 .140 .327 .001
N 58 58 58 58 58 58
x3.2 Pearson Correlation -.038 1 .670** .251 .474
** .708
**
Sig. (2-tailed) .780 .000 .057 .000 .000
N 58 58 58 58 58 58
x3.3 Pearson Correlation .115 .670** 1 .449
** .461
** .807
**
Sig. (2-tailed) .388 .000 .000 .000 .000
N 58 58 58 58 58 58
x3.4 Pearson Correlation .196 .251 .449** 1 .333
* .709
**
Sig. (2-tailed) .140 .057 .000 .011 .000
N 58 58 58 58 58 58
x3.5 Pearson Correlation .131 .474** .461
** .333
* 1 .685
**
Sig. (2-tailed) .327 .000 .000 .011 .000
N 58 58 58 58 58 58
kedisiplinan Pearson Correlation .414** .708
** .807
** .709
** .685
** 1
Sig. (2-tailed) .001 .000 .000 .000 .000
N 58 58 58 58 58 58
**. Correlation is significant at the 0.01 level (2-tailed).
*. Correlation is significant at the 0.05 level (2-tailed).

Variabel Responden Prestasi kerja (Y)
Correlations
y1 y2 y3 y4 y5 prestasi kerja
y1 Pearson Correlation 1 .422** .564
** .379
** .370
** .764
**
Sig. (2-tailed) .001 .000 .003 .004 .000
N 58 58 58 58 58 58
y2 Pearson Correlation .422** 1 .416
** .521
** .284
* .707
**
Sig. (2-tailed) .001 .001 .000 .031 .000
N 58 58 58 58 58 58
y3 Pearson Correlation .564** .416
** 1 .386
** .079 .679
**
Sig. (2-tailed) .000 .001 .003 .557 .000
N 58 58 58 58 58 58
y4 Pearson Correlation .379** .521
** .386
** 1 .377
** .766
**
Sig. (2-tailed) .003 .000 .003 .004 .000
N 58 58 58 58 58 58
y5 Pearson Correlation .370** .284
* .079 .377
** 1 .625
**
Sig. (2-tailed) .004 .031 .557 .004 .000
N 58 58 58 58 58 58
prestasi kerja Pearson Correlation .764** .707
** .679
** .766
** .625
** 1
Sig. (2-tailed) .000 .000 .000 .000 .000
N 58 58 58 58 58 58
**. Correlation is significant at the 0.01 level (2-tailed).
*. Correlation is significant at the 0.05 level (2-tailed).

Output Spss Uji Reliabilitas
Variabel Responden Kompensasi (X1)
Case Processing Summary
N %
Cases Valid 58 100.0
Excludeda 0 .0
Total 58 100.0
a. Listwise deletion based on all variables in the
procedure.
Reliability Statistics
Cronbach's
Alpha N of Items
.667 6
Item-Total Statistics
Scale Mean if
Item Deleted
Scale Variance if
Item Deleted
Corrected Item-
Total Correlation
Cronbach's
Alpha if Item
Deleted
x1.1 40.97 7.122 .337 .646
x1.2 40.76 7.485 .336 .653
x1.3 40.95 7.032 .371 .638
x1.4 41.21 6.799 .339 .643
x1.5 40.95 7.067 .329 .647
kompensasi 22.76 2.116 1.000 .278

Variabel Responden Motivasi (X2)
Case Processing Summary
N %
Cases Valid 58 100.0
Excludeda 0 .0
Total 58 100.0
a. Listwise deletion based on all variables in the
procedure.
Reliability Statistics
Cronbach's
Alpha N of Items
.788 6
Item-Total Statistics
Scale Mean if
Item Deleted
Scale Variance if
Item Deleted
Corrected Item-
Total Correlation
Cronbach's
Alpha if Item
Deleted
x2.1 39.84 14.695 .690 .758
X2.2 39.97 13.718 .701 .740
x2.3 39.98 15.070 .570 .771
x2.4 40.21 13.606 .763 .732
x2.5 40.02 14.754 .570 .766
Motivasi 22.22 4.387 1.000 .782

Variabel Responden Kedisiplinan (X3)
Case Processing Summary
N %
Cases Valid 58 100.0
Excludeda 0 .0
Total 58 100.0
a. Listwise deletion based on all variables in the
procedure.
Reliability Statistics
Cronbach's
Alpha N of Items
.762 6
Item-Total Statistics
Scale Mean if
Item Deleted
Scale Variance if
Item Deleted
Corrected Item-
Total Correlation
Cronbach's
Alpha if Item
Deleted
x3.1 42.09 9.589 .283 .773
x3.2 42.16 8.484 .611 .719
x3.3 42.05 8.436 .748 .706
x3.4 42.17 8.250 .598 .715
x3.5 41.95 9.032 .612 .734
kedisiplinan 23.38 2.661 1.000 .676

Variabel Responden Prestasi kerja (Y)
Case Processing Summary
N %
Cases Valid 58 100.0
Excludeda 0 .0
Total 58 100.0
a. Listwise deletion based on all variables in the
procedure.
Reliability Statistics
Cronbach's
Alpha N of Items
.778 6
Item-Total Statistics
Scale Mean if
Item Deleted
Scale Variance if
Item Deleted
Corrected Item-
Total Correlation
Cronbach's
Alpha if Item
Deleted
y1 41.16 12.449 .698 .736
y2 40.95 13.208 .646 .755
y3 41.14 12.682 .589 .748
y4 41.28 11.993 .686 .727
y5 41.24 12.678 .512 .756
prestasi kerja 22.86 3.840 1.000 .741

Output Spss Uji Determinasi (R2)
Variables Entered/Removedb
Model
Variables
Entered
Variables
Removed Method
1 kedisiplinan,
kompensasi,
motivasia
. Enter
a. All requested variables entered.
b. Dependent Variable: prestasi kerja
Model Summary
Model R R Square
Adjusted R
Square
Std. Error of the
Estimate
1 .671a .451 .420 1.492
a. Predictors: (Constant), kedisiplinan, kompensasi, motivasi
Output Spss Uji f (Uji Serempak)
ANOVAb
Model Sum of Squares df Mean Square F Sig.
1 Regression 98.633 3 32.878 14.762 .000a
Residual 120.264 54 2.227
Total 218.897 57
a. Predictors: (Constant), kedisiplinan, kompensasi, motivasi
b. Dependent Variable: prestasi kerja

Output Spss Uji t (Uji Parsial)
Coefficientsa
Model
Unstandardized Coefficients
Standardized
Coefficients
t Sig. B Std. Error Beta
1 (Constant) -2.461 4.385 -.561 .577
kompensasi .281 .136 .208 2.059 .044
motivasi .406 .098 .434 4.129 .000
kedisiplinan .423 .126 .352 3.359 .001
a. Dependent Variable: prestasi kerja

Lampiran 5

Lampiran 6
Tabel Angka Nilai Kritik r
Tabel nilai kritis untuk r Pearson Product Moment
dk=n-2
Probabilitas 1 arah
0,10 0,05 0,025 0,01 0,005 0,0025 0,001 0,0005
Probabilitas 2 arah
0,20 0,10 0,05 0,02 0,01 0,01 0,002 0,001
1 0,951 0,988 0,997 1,000 1,000 1,000 1,000 1,000
2 0,800 0,900 0,950 0,980 0,990 0,995 0,998 0,999
3 0,687 0,805 0,878 0,934 0,959 0,974 0,986 0,991
4 0,608 0,729 0,811 0,882 0,917 0,942 0,963 0,974
5 0,551 0,669 0,754 0,833 0,875 0,906 0,935 0,951
6 0,507 0,621 0,707 0,789 0,834 0,870 0,905 0,925
7 0,472 0,582 0,666 0,750 0,798 0,836 0,875 0,898
8 0,443 0,549 0,632 0,715 0,765 0,805 0,847 0,872
9 0,419 0,521 0,602 0,685 0,735 0,776 0,820 0,847
10 0,398 0,497 0,576 0,658 0,708 0,750 0,795 0,823
11 0,380 0,476 0,553 0,634 0,684 0,726 0,772 0,801
12 0,365 0,458 0,532 0,612 0,661 0,703 0,750 0,780
13 0,351 0,441 0,514 0,592 0,641 0,683 0,730 0,760
14 0,338 0,426 0,497 0,574 0,623 0,664 0,711 0,742
15 0,327 0,412 0,482 0,558 0,606 0,647 0,694 0,725
16 0,317 0,400 0,468 0,543 0,590 0,631 0,678 0,708
17 0,308 0,389 0,456 0,529 0,575 0,616 0,662 0,693
18 0,299 0,378 0,444 0,516 0,561 0,602 0,648 0,679
19 0,291 0,369 0,433 0,503 0,549 0,589 0,635 0,665

20 0,284 0,360 0,423 0,492 0,537 0,576 0,622 0,652
21 0,277 0,352 0,413 0,482 0,526 0,565 0,610 0,640
22 0,271 0,344 0,404 0,472 0,515 0,554 0,599 0,629
23 0,265 0,337 0,396 0,462 0,505 0,543 0,588 0,618
24 0,260 0,330 0,388 0,453 0,496 0,534 0,578 0,607
25 0,255 0,323 0,381 0,445 0,487 0,524 0,568 0,597
26 0,250 0,317 0,374 0,437 0,479 0,515 0,559 0,588
27 0,245 0,311 0,367 0,430 0,471 0,507 0,550 0,579
28 0,241 0,306 0,361 0,423 0,463 0,499 0,541 0,570
29 0,237 0,301 0,355 0,416 0,456 0,491 0,533 0,562
30 0,233 0,296 0,349 0,409 0,449 0,484 0,526 0,554
35 0,216 0,275 0,325 0,381 0,418 0,452 0,492 0,519
40 0,202 0,257 0,304 0,358 0,393 0,425 0,463 0,490
45 0,190 0,243 0,288 0,338 0,372 0,403 0,439 0,465
50 0,181 0,231 0,273 0,322 0,354 0,384 0,419 0,443
60 0,165 0,211 0,250 0,295 0,325 0,352 0,385 0,408
70 0,153 0,195 0,232 0,274 0,302 0,327 0,358 0,380
80 0,143 0,183 0,217 0,257 0,283 0,307 0,336 0,357
90 0,135 0,173 0,205 0,242 0,267 0,290 0,318 0,338
100 0,128 0,164 0,195 0,230 0,254 0,276 0,303 0,321
150 0,105 0,134 0,159 0,189 0,208 0,227 0,249 0,264
200 0,091 0,116 0,138 0,164 0,181 0,197 0,216 0,230
300 0,074 0,095 0,113 0,134 0,148 0,161 0,177 0,188
400 0,064 0,082 0,098 0,116 0,128 0,140 0,154 0,164
500 0,057 0,073 0,088 0,104 0,115 0,125 0,138 0,146
1000 0,041 0,052 0,062 0,073 0,081 0,089 0,098 0,104

Lampiran 7
Tabel Nilai Distibusi t
T Distribution Critical Values
df .25 .20 .15 .10 .05 .025 .02 .01 .005 .0025 .001 .0005
1 1.000 1.376 1.963 3.078 6.314 12.71 15.89 31.82 63.66 127.3 318.3 636.6
2 .816 1.061 1.386 1.886 2.920 4.303 4.849 6.965 9.925 14.09 22.33 31.60
3 .765 .978 1.250 1.638 2.353 3.182 3.482 4.541 5.841 7.453 10.21 12.92
4 .741 .941 1.190 1.533 2.132 2.776 2.999 3.747 4.604 5.598 7.173 8.610
5 .727 .920 1.156 1.476 2.015 2.571 2.757 3.365 4.032 4.773 5.893 6.869
6 .718 .906 1.134 1.440 1.943 2.447 2.612 3.143 3.707 4.317 5.208 5.959
7 .711 .896 1.119 1.415 1.895 2.365 2.517 2.998 3.499 4.029 4.785 5.408
8 .706 .889 1.108 1.397 1.860 2.306 2.449 2.896 3.355 3.833 4.501 5.041
9 .703 .883 1.100 1.383 1.833 2.262 2.398 2.821 3.250 3.690 4.297 4.781
10 .700 .879 1.093 1.372 1.812 2.228 2.359 2.764 3.169 3.581 4.144 4.587
11 .697 .876 1.088 1.363 1.796 2.201 2.328 2.718 3.106 3.497 4.025 4.437
12 .695 .873 1.083 1.356 1.782 2.179 2.303 2.681 3.055 3.428 3.930 4.318
13 .694 .870 1.079 1.350 1.771 2.160 2.282 2.650 3.012 3.372 3.852 4.221
14 .692 .868 1.076 1.345 1.761 2.145 2.264 2.624 2.977 3.326 3.787 4.140
15 .691 .866 1.074 1.341 1.753 2.131 2.249 2.602 2.947 3.286 3.733 4.073
16 .690 .865 1.071 1.337 1.746 2.120 2.235 2.583 2.921 3.252 3.686 4.015
17 .689 .863 1.069 1.333 1.740 2.110 2.224 2.567 2.898 3.222 3.646 3.965
18 .688 .862 1.067 1.330 1.734 2.101 2.214 2.552 2.878 3.197 3.611 3.922
19 .688 .861 1.066 1.328 1.729 2.093 2.205 2.539 2.861 3.174 3.579 3.883
20 .687 .860 1.064 1.325 1.725 2.086 2.197 2.528 2.845 3.153 3.552 3.850
21 .663. .859 1.063 1.323 1.721 2.080 2.189 2.518 2.831 3.135 3.527 3.819
22 .686 .858 1.061 1.321 1.717 2.074 2.183 2.508 2.819 3.119 3.505 3.792
23 .685 .858 1.060 1.319 1.714 2.069 2.177 2.500 2.807 3.104 3.485 3.768
24 .685 .857 1.059 1.318 1.711 2.064 2.172 2.492 2.797 3.091 3.467 3.745
25 .684 .856 1.058 1.316 1.708 2.060 2.167 2.485 2.787 3.078 3.450 3.725

26 .684 .856 1.058 1.315 1.706 2.056 2.162 2.479 2.779 3.067 3.435 3.707
27 .684 .855 1.057 1.314 1.703 2.052 2.15 2.473 2.771 3.057 3.421 3.690
28 .683 .855 1.056 1.313 1.701 2.048 2.154 2.467 2.763 3.047 3.408 3.674
29 .683 .854 1.055 1.311 1.699 2.045 2.150 2.462 2.756 3.038 3.396 3.659
30 .683 .854 1.055 1.310 1.697 2.042 2.147 2.457 2.750 3.030 3.385 3.646
Df .25 .20 .15 .10 .05 .025 .02 .01 .005 .0025 .001 .0005
40 .681 .851 1.050 1.303 1.684 2.021 2.123 2.423 2.704 2.971 3.307 3.551
50 .679 .849 1.047 1.295 1.676 2.009 2.109 2.403 2.678 2.937 3.261 3.496
60 .679 .848 1.045 1.296 1.671 2.000 2.099 2.390 2.660 2.915 3.232 3.460
80 .678 .846 1.043 1.292 1.664 1.990 2.088 2.374 2.639 2.887 3.195 3.416
100 .677 .845 1.042 1.290 1.660 1.984 2.081 2.364 2.626 2.871 3.174 3.390
inf. .674 .841 1.036 1.282 1.64 1.960 2.054 2.326 2.576 2.807 3.091 3.291

Lampiran 8
Tabel Nilai Kritik Distribusi f 0,05