Embed Size (px)
Citation preview
1
Bachelor’s Thesis
Multimodal Literacy as a form of Communication
What is the state of the students at Dalarna University multimodal literacy?
Author: Ralph Black Ferguson Supervisor: Sten Sundin Examiner: Thomas Axelsson Topic/subject: Media/multimodality Course code: LP2006 Points: 15 hp Date of examination: 15 January 2015
Dalarna University 791 88 Falun Sweden Tel 023-‐77 80 00
i
Abstract
Literacy is an invaluable asset to have, and has allowed for communication,
documentation and the spreading of ideas since the beginning of the written language.
With technological advancements, and new possibilities to communicate, it is important
to question the degree to which people’s abilities to utilise these new methods have
developed in relation to these emerging technologies. The purpose of this bachelor’s
thesis is to analyse the state of students’ at Dalarna University mulitimodal literacy, as
well as their experience of multimodality in their education. This has led to the two
main research questions: What is the state of the students at Dalarna University
multimodal literacy? And: How have the students at Dalarna University
experienced multimodality in education?
The paper is based on a mixed-method study that incorporates both a quantitative and
qualitative aspect to it. The main thrust of the research paper is, however, based on a
quantitative study that was conducted online and emailed to students via their program
coordinators. The scope of the research is in audio-visual modes, i.e. audio, video and
images, while textual literacy is presumed and serves as an inspiration to the study. The
purpose of the study is to analyse the state of the students’ multimodal literacy and their
experience of multimodality in education.
The study revealed that the students at Dalarna University have most skill in image
editing, while not being very literate in audio or video editing. The students seem to
have had mediocre experience creating meaning through multimodality both in private
use and in their respective educational institutions. The study also reveals that students
prefer learning by means of video (rather than text or audio), yet are not able to create
meaning (communicate) through it.
Keywords
Multimodal literacy, audio-visual, video, audio, images, text, multimodal, Dalarna
University
ii
Acknowledgements
I would like to thank those students who partook in the online questionnaire, as well as
Sari Hamsho, Rafael Pineda and Erik Rehn for agreeing to be interviewed. I would also
like to thank Sten Sundin, my supervisor, as well as Berk Sirman for the advice along
the way. And finally, my family who support me through endeavours that far exceed
academia.
Table of Contents Abstract ................................................................................................................................... i Keywords ................................................................................................................................ i Acknowledgements ............................................................................................................... ii
1. Introduction ..................................................................................................... 1 1.1 General Introduction ........................................................................................................ 1 1.2 Terms and Definitions ...................................................................................................... 2 1.3 Problem Statement ........................................................................................................... 3 1.4 Delimitations and Scope .................................................................................................. 3
Mode and Media ................................................................................................................ 4
2. Method ............................................................................................................ 5 2.1 Design .............................................................................................................................. 5 2.2 Participants and Sampling ................................................................................................ 6 2.3 Procedure .......................................................................................................................... 8 2.4 Data Processing and Analysis .......................................................................................... 9 2.5 Theoretical Framework .................................................................................................. 10
Video, Audio and Images as Multimodal Resources ....................................................... 11 Practical Relevance .......................................................................................................... 12
3. Results and Analysis ..................................................................................... 13 3.1 The State of Multimodal Literacy .................................................................................. 13 3.2 The state of the students’ multimodal literacy ............................................................... 14
Audio editing ability ........................................................................................................ 14 Video editing ability ........................................................................................................ 15 Image editing ability ........................................................................................................ 16 Summary of editing abilities ............................................................................................ 16
3.3 Multimodality in education ............................................................................................ 16 3.4 Analysis .......................................................................................................................... 23
The students’ understanding of multimodality ................................................................ 23 The students’ ability to create meaning with multimodality ........................................... 23
3.5 Reflection and Discussion .............................................................................................. 24
4. Conclusion .................................................................................................... 26 Next Generation Learning ............................................................................................... 27 Language ........................................................................................................................ 28
References ......................................................................................................... 29 Literature .......................................................................................................................... 29 Online .............................................................................................................................. 30
Appendix A: Questions and Answers–Qualitative Interview ........................... 32
Appendix B: Questions and Answers–Quantitative Interview ......................... 41
1
1. Introduction
1.1 General Introduction
In the context of globalisation and the spreading of ideas and information
internationally (and nationally), communication becomes an increasingly important
issue. Whether on a global or local scale, communicating information clearly and
succinctly is of the utmost importance and can lead to cooperation and assist in
conflict resolution and avoiding conflict altogether–as it can increase our “shared
knowledge”.1 As the past decades have seen “the most significant period of
technological innovation and global restructuring”, the state of people’s
communication skills is important to assess in order to develop them.2
As it is to universities many look to for answers in solving global and local problems,
it is important that the students at these universities are afforded the best possible
education and resources. Therefore it is worth analysing the modes that are at the
students’ disposal, and whether communication resources other than text and
language are being developed. As it is from universities that many people acquire
skills to eventually move into the working sector, whether private, public or other
organisations, it is therefore important to understand the state of their communicating
abilities in modes afforded by resources other than text and language. As Dr Allan
Goodman–the president of the Institute of International Education–says, “[the
fundamental role of universities] may be a willingness to embrace taking a global
perspective” whose interconnectedness could “facilitate preparing truly global
citizens”.3
New technologies have caused a change in the way that we as humans communicate,
and it is important to ask to what extent our skills regarding these new forms of
communication develop alongside these new technologies.4 The term “multiple
1 Rosengren. Communication: an Introduction – 2000 (page 1) 2 Burbules & Torres. Globalization and Education: Critical Perspectives – 2000 (page 300) 3 Goodman, Allan E., Dr. "The Role of the University in World Society", http://www.iie.org/Blog/2012/October/University-Roles, 2012, (accessed 21 Dec. 2014) 4 Kellner. Multiple Literacies and Critical Pedagogy in a Multicultural Society – 1998 (page 1)
2
literacies” has been used to explain the ability to read and write in modes other than
“traditional modes of print literacy”, such as through video, audio and images.5
This bachelor’s thesis is a study of the multimodal literacy of the students at Dalarna
University. The paper is based mainly on a cross-sectional quantitative study that was
sent to students via email, and carried out online. The purpose of the study is to
understand how students use multimodality both in their education and privately, and
how literate they are in modes other than text–namely video, audio and images.
1.2 Terms and Definitions
Semiotic resources are signs, symbols, or other forms of representation that can be
used to create meaning.
Affordances are what a mode can communicate, and an example of this would be that
Radio is able to afford “speech, music and other sounds”.6 Affordance is “what a
mode can do”.7
“Modes are resources whereby we can make meaning material…[They] are
[resources] which a culture has as a means of making meaning, and it allows us to get
away from making language too general and maybe therefore too vague a term to be
useful”.8
Multimodality refers to the combination of modes in order to communicate meaning.
As different modes have different affordances, combining modes can be done in order
to more effectively communicate meaning.9 A video, for example, has multiple modes
at its disposal such as music, speech, colour, text etc.
The term literacy is also recurrent throughout this paper, and is a term whose meaning
merits an explanation. Literacy is a term that is usually associated with the ability to
5 Kellner. Multiple Literacies and Critical Pedagogy in a Multicultural Society – 1998 (page 8) 6 Kress & Van Leeuwen. Multimodal Discourse – 2001 (page 67) 7 "What is a mode?", [online video], 2012, https://www.youtube.com/watch?v=kJ2gz_OQHhI, (accessed 20 Dec. 2014) 8 "What is a mode?", [online video], 2012, https://www.youtube.com/watch?v=kJ2gz_OQHhI, (accessed 20 Dec. 2014) 9 "What is multimodality?", [online video], 2012, https://www.youtube.com/watch?v=nt5wPIhhDDU, (accessed 20 Dec. 2014)
3
read and write text. In this context, however, the term literacy delineates the ability to
understand (read) and create (write) in different modes. In essence, literacy can be
understood to be the ability to document and interpret audio, video and images in the
same way one reads and writes text, which Kellner has described as multiple
literacies. According to Kellener, multiple literacies deals with (in addition to
“traditional print literacies”) “media literacy, computer literacy, and multimedia
literacies”.10 In essence, multiple literacies relates to being literate in more than one
mode.
1.3 Problem Statement
The purpose of the essay is to assess the state of the students at Dalarna University’s
multimodal literacy through a mixed-method study. This has led to the research
question: What is the state of the students at Dalarna University multimodal literacy?
The essay also assesses what ways the students have acquired their level of
multimodal literacy, and what they use it for. This has led to the follow up questions:
How have the students at Dalarna University experienced multimodality in education? As multimodality is an extremely broad topic, the main focus of the paper
will be on audio-visual modes–namely audio, video and images. Text is an underlying
mode in the study, but it is not one that is being assessed. Rather, one could say that it
is against textual literacy that the other modes are compared.
1.4 Delimitations and Scope
The study and questionnaire has video, audio and images as the main focus. In order
to better understand the scope of the study it is important to understand how video,
audio, (text) and images relate to modes and media and how the terms mode and
media differ. Within the study, text and language are resources that are alluded to, but
are not the main focus of the study as reading and writing are already a very well
established form of communication within the university. A prerequisite for
acceptance to Dalarna University is also that the students are able to read and write,
so text and language fell outside of the scope of the study. 10 Kellner. Technological Transformation, Multiple Literacies, and the Re-Visioning of Education – 2006 (page 12)
4
Mode and Media
The difference between media and mode is important to understand, as these terms are
closely related but differ in meaning. As Kress and Van Leeuwen explain, modes are
semiotic resources that we use to communicate meaning. Modes make meaning using
“multiple articulations”, which Kress and Van Leeuwen define as strata.11 These
strata are discourse, design, production and distribution. This basically means that all
of these four aspects are incorporated into the term mode, whereas media is mainly
concerned with the production (and distribution) aspect of the four strata, and the
medium by which information is communicated.
Multimedial (and monomedial) and multimodal (and monomodal) are also terms that
merit explanation, and differentiation. As media refers to the means of
communication, and mode refers to the resources that create meaning, multimedia and
multimodal also differ in much the same way. The example that Kress and Van
Leeuwen give is that of Radio. Radio is monomedial, as it is only audial (can only be
heard), but multimodal as it can consist of more than a single mode, namely “speech,
music and other sounds”.12 Another example of multimodality is of a website which
consists of images, texts, videos and colours–which are combined in a way that
communicates a specific meaning. Monomodality (a term that is not used extensively
in this text but may help in the holistic understanding of the concept of modes) is a
single mode; Kress and Van Leeuwen give the example of writing (e.g. literary novels
and official documents) “without illustration[s]”.13 However, one could argue that
even text could be multimodal if it were to consist of fonts with different boldness,
colours or typography–and if these modes were to communicate different meanings
such as a different font-size could represent a header, or the beginning of a new
chapter.
11 Kress & Van Leeuwen. Multimodal Discourse – 2001 (page 4) 12 Kress & Van Leeuwen. Multimodal Discourse – 2001 (page 67) 13 Kress & Van Leeuwen. Multimodal Discourse – 2001 (page 1)
5
2. Method
This is a mixed-method study, but the main thrust of the method is quantitative. The
qualitative aspect to the method is mainly used to complement the quantitative study,
rather than it being a reliable method on its own. The paper is a case study that is
based on students currently studying at Dalarna University, and the bulk of the
primary research was attained through an online survey, while audio recordings were
used for documenting the qualitative interviews. As the qualitative aspect to the study
is not fundamental to the paper, only relevant questions and responses are transcribed
along with necessary context (see Appendix 2). The study is cross-sectional and
examines the current situation at a single point in time, rather than examining
development(s) over a span of time.14
2.1 Design
The online survey was created using Google Forms, and computed and compiled
using the software that accompanies the questionnaire design software (i.e. the
computing software that was inbuilt in the web-application). The initial idea was to
conduct a study that was task-based, and constructed based on Rasmusson &
Eklund’s study on reading on the Internet, which had been further based on Rugoff’s
‘guided participation’ study;15 however, this method appeared to be out of the scope
of research and required too many resources and was therefore quickly abandoned. A
quantitative study seemed to be the best fit when considering the scope of the
research. It was the most practical approach due to the fact that it could be sent to
large groups and could acquire and compile large amount of data quickly and easily.
The questionnaire was constructed out of three forms of questions, with some
questions having an optional text field where the respondent could provide an answer
in text. There were two types of multiple-choice questions: one where only one
answer could be chosen, and another where more than one could be chosen. The other
type of question was where the respondent could chose a value on a scale of 1-10, but
in essence this is the same format as the former multiple-choice question, only with a
different layout. Using 1 as the starting point, as opposed to 0, eradicates the option of
there being a state of “no knowledge” which was a choice I made in the design of the
questionnaire. This means that the scale is from a low to high skill level, as opposed 14 Bryman. Social Research Methods – 2008 (page 141) 15 Rasmusson & Eklund. Abilities and Skills Needed for Reading on the Internet – 2013 (page 404)
6
to a “no skill” to low to high skill level. The single-answer multiple-choice questions
were radio buttons rather than a drop-down menu, as “respondents seem to prefer
radio buttons to drop-boxes”.16 There was also a field where the respondent was asked
for their date of birth, and a text field at the end of the questionnaire where the
respondent could comment on any questions that they felt were unclear, or where they
could give an answer that they felt the multiple choice alternatives did not account
for. The questionnaire was designed to be simple and straightforward so as not to
confuse or deter the respondent, while also being thorough with well articulated
questions so as to be clear and provide clear alternatives. As the survey was one that
was to be completed online, presumably without any assistance, the most important
aspect (and one that kept repeating in my mind while constructing the survey) was
clarity.
In the qualitative study, the same questions that were in the quantitative study were
asked, but in a more open-ended way that allowed the respondent to answer the
questions in their own words. The qualitative study was not as strictly constructed as
the quantitative study, in the sense that my aim was not to minimize my effect on the
interview, but rather to understand what the respondent meant. In this way the
qualitative study had stronger elements of a dialogue form than a strict question-
answer form.
2.2 Participants and Sampling
As the paper is a case study the selection was confined to students currently studying
at Dalarna University. The questionnaire was designed to be as clear and accessible as
possible, so there were no other prerequisites other than the respondent being a
student at the University. The questionnaire was in English, so the respondent would
have to be literate in the language in order to partake, but I did not believe this to be a
problem as 86% of Swedes are literate in English, and presumably the percentage is
higher of those studying at University level.17
16 Couper et al. What They See Is What We Get: Response Options for Web Surveys – 2004 (page 114) 17 "European Commission - Europeans and Their Languages", http://ec.europa.eu/public_opinion/archives/ebs/ebs_386_en.pdf, 2012, (accessed 29 Dec. 2014)
7
Dalarna University had 8,676 students Autumn 2012, has three different campuses
and has a large number of students studying distance courses/programs. As this is the
most recent data that I could find, this will be an approximation of the population size
of the study. The three campuses and the distance students account for all of the
students studying at the University, of which a relatively small number are Erasmus
students.18 The campuses offer different programs, and therefore the (general)
academic profile of students differs depending on which campus they study. Campus
Borlänge is located in the city Borlänge (in the province of Dalarna) and offers
programs such as Economics, Tourism, Computer Systems Development and
Engineering. Campus Falun is located in the city Falun (in the province of Dalarna)
and offers programs such as Teacher Training Programs, African Studies and
Languages. The Media Center is also located in Falun, but is separate from the main
campus and is treated as a third campus in this study. Some of the main programs that
are taught in the Media Center are Audiovisual Production, Film & TV Production,
Manuscript writing and Sound and Music Production. The reason for separating the
Media Center and Campus Falun for this study (even though they are located in the
same city, and could technically both constitute Campus Falun) is that the students at
the Media Center study media, and grouping them with Campus Falun could
potentially distort the results of the study.
The most practical method of sampling was group sampling, as the population was of
a relatively large scale and the research method was quantitative this seemed to be the
best approach.19 When I considered the sampling process there were some ethical
considerations that arose and needed to be taken into account. The questionnaire was
to be administered via email to students, yet the student’s emails were not public and I
did not have access to them. The solution to this dilemma was to email the
questionnaire (with an introduction and relevant information) to the program
coordinators, whose emails were public (on the University’s website), and ask them if
they would assist me in sending out a mass email to the students taking their
programs. This allowed them to make the final decision on whether or not to send the
emails to their students, and decreased the probability that the students would view
18 Erasmus is an exchange program for students throughout Europe. 19 Creswell. Research Design: Qualitative, Quantitative and Mixed Methods Approaches – 2014 (page 158)
8
the questionnaire as spam mail.20 As the population was of a relatively large size, I
was prepared for a relatively low response rate from the students’ side. I was also
aware of the fact that not all of the programs coordinators would respond, or be
willing to send out the email, therefore decreasing the overall response rate of the
questionnaire. There were a total of 63 program coordinators that I sent the
questionnaire to, all of whom had their emails on the University website. Of the 63
program coordinators, 17 (≈27%) responded that they would forward the
questionnaire to their students, 3 (≈4%) responded that they would not send the
questionnaire due to various reasons, and 12 (≈19%) of the responses were rendered
irrelevant due to a number of reasons, such as late replies, holidays and some of the
courses had stopped running altogether. In total there were 32 replies (≈51%), and it
is fair to assume that some of the program coordinators that did not reply still
forwarded the questionnaire to their students. Introducing the program coordinators as
‘middle-men’ meant that the questionnaire would not reach as many students as it
would have, if I were to have emailed it directly to them. But for the purpose of the
study, and with all ethical considerations, the method of sampling was adequate.
For the qualitative interviews I chose three students, one from each campus (i.e.
Falun, Borlänge and the Media campus). The interview with the student from
Borlänge did not happen as there was a scheduling clash, and a new meeting was
unable to happen due to time constraints. As the qualitative aspect of the study was
simply to augment the research and to see whether the questionnaire was clear, I did
not think that not having a qualitative interview from a student at campus Borlänge
would impact the study in a significant way.
2.3 Procedure
As I explained in the chapter Participants and Sampling, the questionnaire was not
directly sent to a selection of students, but was sent to all program coordinators and
then forwarded by them to their students. This process meant that I lost a bit of
control of the selection as a whole, and left the questionnaire in the hands of the
program coordinators, hoping that I would ultimately get a representative group of
respondents. Due to this fact, I thought it necessary to include a few questions about
the students such as age, sex, and what campus they studied at in order to make sure 20 Spam mail is unwanted mail, i.e. junk mail.
9
that the respondents were not just e.g. from a single program, gender or campus.
These questions were not essential to the research topic, but were necessary to the
reliability of the study. This was a safety measure, and care is a vital aspect to
conducting a reliable study.21
2.4 Data Processing and Analysis
The fact that the research paper is quantitative and based on data does not necessarily
make it more objective than a qualitative study, as results from both forms of research
need to be interpreted and analysed. The questions in the questionnaire were designed
to give insight into the level of multimodal literacy of the students at Dalarna
University. As there needed to be a large pool of respondents (for the study to be
representative), the questionnaire could not contain niched or complicated questions.
The questions asked were about the level of skill that the students believed themselves
to have in producing/creating audio, visual (images) and video material, and their
audio, visual (images) and video literacy and understanding. These are the questions
that the analysis focuses on, rather than the correlation between multimodal literacy
and e.g. age, sex or campus. The correlation between any of these factors and
multimodal literacy are only analysed when relevant to the study, but will not have a
central role. It is, however, important to take into account the different campuses that
the respondents study at in order to assess the generalisability and reliability of the
study. The external validity “deals with the problem of knowing whether a study’s
findings are generalizable beyond the immediate case study”; it focuses on analytic
generalisation that is different to statistic generalisation in the sense that it is less
concerned with specific numbers and stats being generalisable rather than what the
stats show being generalisable.22 The reliability of the study concerns itself with the
ability to arrive at the same results and conclusion if the study were to repeated, and
the same procedure were to be followed (that is to say the exact same case, rather than
only the procedure).23 In order for this to be possible, the procedures and methods
need to be well documented in order to be replicable.24 The questions regarding age,
sex, and country of residence and of birth were mainly included to augment the
reliability of the study, and allow for the ability to further critically analyse the study.
21 Ekengren & Hinnfors. Uppsatshandbok: Hur du lyckas med din uppsats – 2006 (page 80) 22 Yin. Case Study Research – 2009 (page 43) 23 Yin. Case Study Research – 2009 (page 45) 24 Yin. Case Study Research – 2009 (page 45)
10
27% of the students study at the media campus and study courses that are directly
related to audio, video and images, and this is noteworthy to the study. This, however,
is not a definitive aspect, as there seems to be a wide spread with 42% of students
studying at the Borlänge campus, and 26% studying distance courses. The Erasmus
students seem to be almost negligible in the study as they only constitute 1%, and are
usually only at the university for 1 or 2 terms (as per the Erasmus agreement), so
might not be very reliable sources for gathering data–as they only study very briefly
at the university.25 Another limitation to note is that the students answered questions
about themselves, which meant that the answers were subjective. That is to say that
when stating the students’ level of audio, video or image editing abilities, the data is
not based on an objective study of their abilities, rather on what they themselves
believe their abilities to be.
2.5 Theoretical Framework
As has been explained, modes are semiotic resources that can communicate meaning.
Different modes can communicate different meanings, and certain meanings can even
be unique to certain modes.26 The classic example is of trying to explain what colour
looks like to someone who has never seen colour before, or who is blind.27 Although
this may perhaps be a question of a deeper philosophical nature, this example
highlights a very important point concerning the affordances and restrictions of
certain modes. In this example, the mode of language tries to take the place of a visual
mode which, when given some thought, seems to be quite far-fetched. When
communicating with multiple modes, “all of the modes [that are used] combine to
represent a message’s meaning”, and “the meaning of [the] message is … distributed
across all of these modes and not necessarily evenly”.28
As different modes communicate meaning differently, and in multimodality meaning
is spread across multiple modes, then perhaps people respond and/or learn differently
with different modes. The idea of different modes communicating meaning differently
is the basis for the theoretical framework that can be used in the analysis. Using this
25 "Erasmus Grant – Frequently Asked Questions”, http://www.ucl.ac.uk/studyabroad/forms/Erasmus-Grant-FAQ.pdf, n.d., (5 Jan. 2014) 26 Jewitt. The Routledge Handbook of Multimodal Analysis – 2014 (page 27) 27 Smart. Philosophy and Scientific Realism – 1963 (page 75) 28 Jewitt. The Routledge Handbook of Multimodal Analysis – 2014 (page 27)
11
framework, it should be possible to assess patterns regarding which mode(s) the
students find they learn ‘best’ from, and better understand why it may be so.29
Video, Audio and Images as Multimodal Resources
As it is video, audio, text and images that are featured in this essay it is beneficial to
understand how each one relates to media and modes.
Video is both multimedial and multimodal. The means by which video is
communicated (media) is audial and visual, meaning that video can be both seen and
heard, making it multimedial. It is multimodal in its affordances as it can use speech,
text, images, music etc. in order to communicate meaning.
Audio is monomedial as it only audial i.e. it is not seen, smelled or touched, only
heard. However, audio can be multimodal as it can include music, speech, and other
sounds.
Images are also monomedial as they only relate to the visual, and are not heard or
smelled, yet are multimodal as they afford text, colour and other modes that relate to
the visual.
Text is monomedial, in the same way that images are monomedial, as it is only seen.
Text can also be multimodal as it can include colour, different fonts and other visual
aspects.
Due to the fact that video, audio, (text) and images are all classified as multimodal, it
is multimodality that this research paper has its focus on. The modes that video,
audio, (text) and images are comprised of are all resources that relate to audio (can be
heard) and visual (can be seen). Therefore the term audio-visual modes will also be
used in this paper. However, the different individual modes that comprise the audio-
visual modes will not be addressed (such as colour, fonts, music etc.), and it will
simply be assumed that their relationship to the study is self-evident.
29 Jewitt. The Routledge Handbook of Multimodal Analysis – 2014 (page 26)
12
Practical Relevance
As each mode has strengths and weaknesses (or rather affordances), the logical
conclusion would lead us to reason that the strength of one mode may perhaps be able
to compensate for the weakness of another.30 The possibility to digitalise modes has
allowed for a multi-skilled person (by means of a computer–a single interface) to
utilise these modes in order to create meaning.31 The Universal Declaration of Human
Rights states that “everyone has the right to education”, and “education shall be free,
at least in the elementary and fundamental stages”.32 This statement is a broad vision
that needs certain prerequisites to be fulfilled in order for the vision to be achievable.
One of these prerequisites is communication, as effective communication is a
cornerstone in education. The question of encouraging literacy in modes of
communication that may be more relatable to a larger groups of people (given the
limitation of language and textual literacy) is much less a question of reassessing a
curriculum than it is a question of upholding and encouraging the human right to
education, and the spreading of knowledge, skills and ideas.
30 Kress & Van Leeuwen. Multimodal Discourse – 2001 (page 67) 31 Kress & Van Leeuwen. Multimodal Discourse – 2001 (page 2) 32 "The Universal Declaration of Human Rights”, http://www.un.org/en/documents/udhr/, n.d., (22 Dec. 2014)
13
3. Results and Analysis
3.1 The State of Multimodal Literacy
As the term literacy means both the ability to read and write it will be from this angle
that the analysis is conducted.33 The responses to the questionnaires are analysed
question-by-question, and the graphs either follow or precede the text that it is linked
with. A comprehensive analysis will be done on each aspect of the responses to the
questionnaire methodically. At the end of the individual analyses (including the
qualitative analysis), there will be a holistic examination of the responses to the
questionnaire. Different graphs are examined in a way that tries to try give an as
representative analysis of the data as possible. There are three different types of
graphs that are used, and the reasons for this are worth mentioning. The pie chart
represents questions that only had one alternative, and whose total number of answers
adds up to 100% of the students. The bar graph that has the standing bars (vertical
bars as opposed to horizontal bars) represent questions that also only had one
alternative, but on a scale from 1-10. And finally, the bar graph that has the horizontal
bars (as opposed to vertical bars) represent questions that have more than one
alternative, meaning that the number of answers are able to exceed 100% of the
students. Even though tables of data are usually more objective in presenting data,
using visual graphs seemed only to augment the research paper and show the data in
more visually appealing way–keeping with the ethos of this paper and its subject.34
This seemed like the most logical way to present the data, and was the default form of
data-presentation that was used by the Google forms application–the application that
was used to create the questionnaire.
The data processing is kept within the realm of the study, and therefore does not delve
deep into the field of mathematics or statistics analysis. That is to say that standard
deviation will not be used in analysing the spread of results shown on the graphs, but
the spread of the graphs will nonetheless still be analysed verbally.
The first part of the analysis assesses the state of multimodal-literacy, while the
second part assesses how integrated the students feel that it has been in education, and
how much they feel it should be integrated.
33 Oxford Dictionaries. “Literacy”, http://www.oxforddictionaries.com/definition/english/literacy, n.d., (accessed 29 Dec. 2014) 34 Booth et al. The Craft of Research – 1995 (page 178)
14
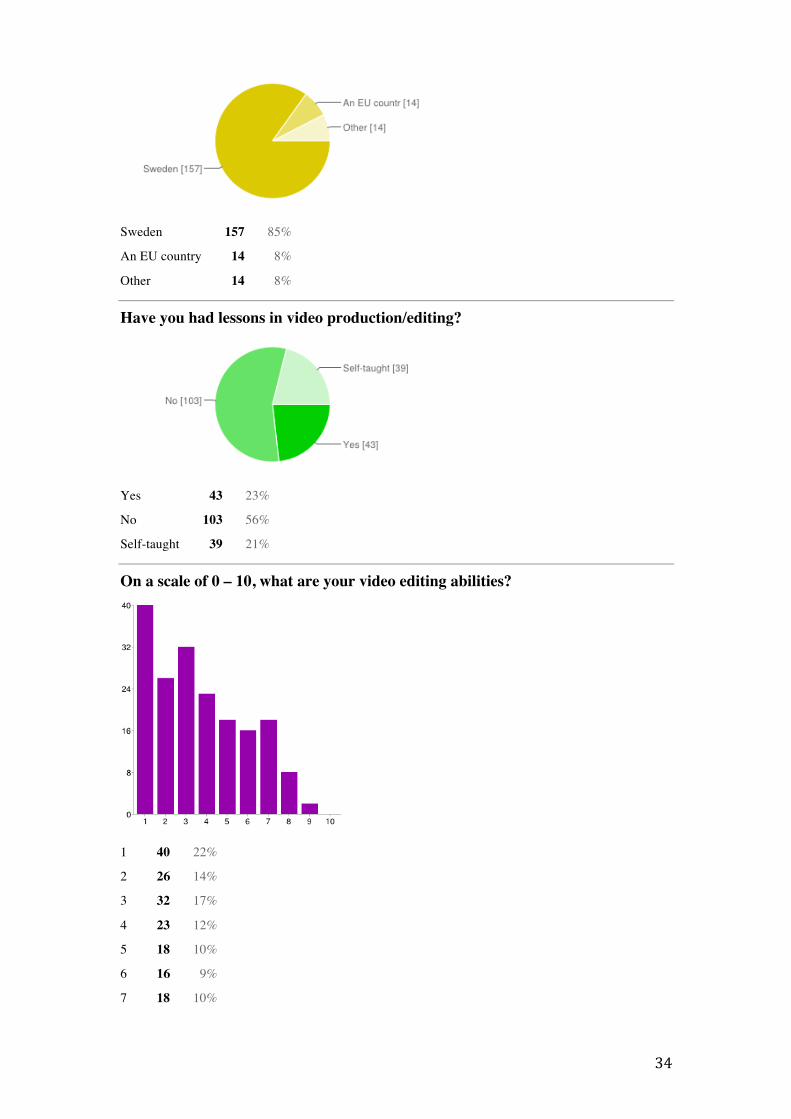
3.2 The state of the students’ multimodal literacy
Audio editing ability
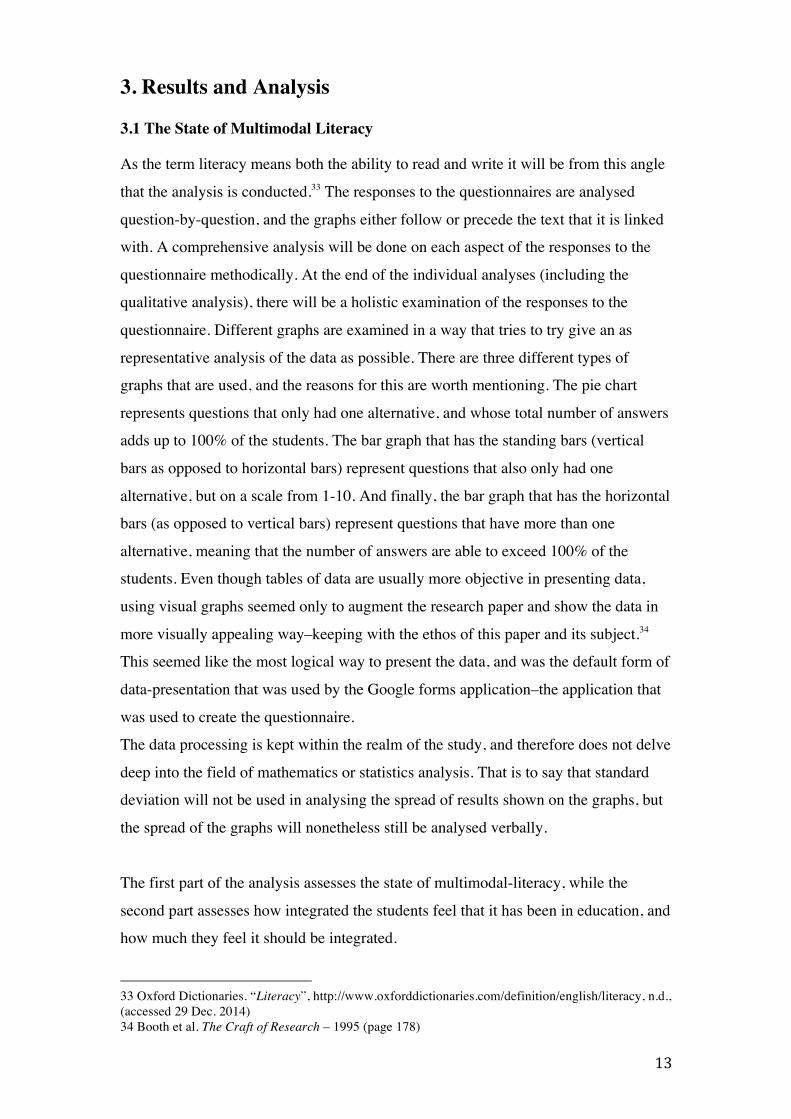
Figure 1: Audio Editing Abilities
The first mode that is assessed is audio. Figure 1 shows that most students (55)
believe their audio editing abilities [skill level] to be ‘1’, the lowest possible
alternative. There is a sharp drop to ‘2’, where only 27 students believe their audio
editing abilities to be. From there, there is a gradual decrease all the way to ‘10’,
where only 5 students believe their skill level to be. The graph is skewed right.35
According to this graph, there is a low skill level regarding the students audio editing
abilities as 74% of the answers rate their audio editing abilities to be below ‘5’.
35 "How to Describe Data Patterns in Statistics", http://stattrek.com/statistics/charts/data-patterns.aspx, n.d., (accessed 29 Dec. 2014)
15
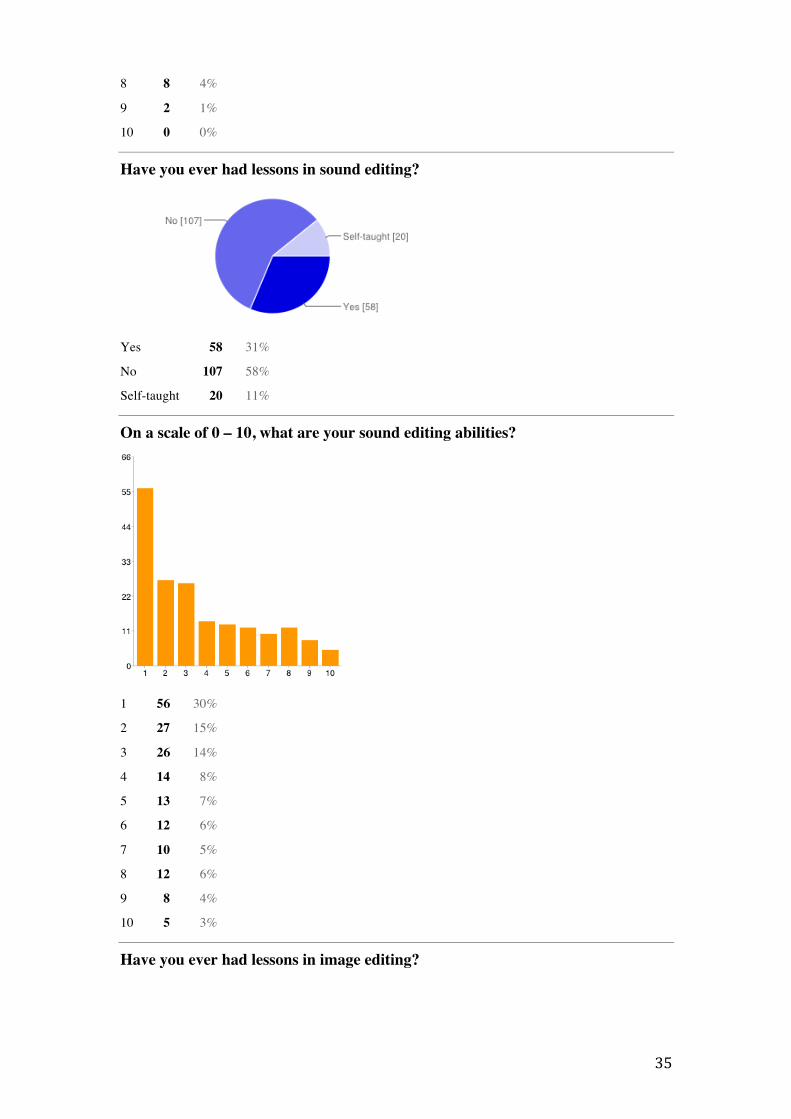
Video editing ability
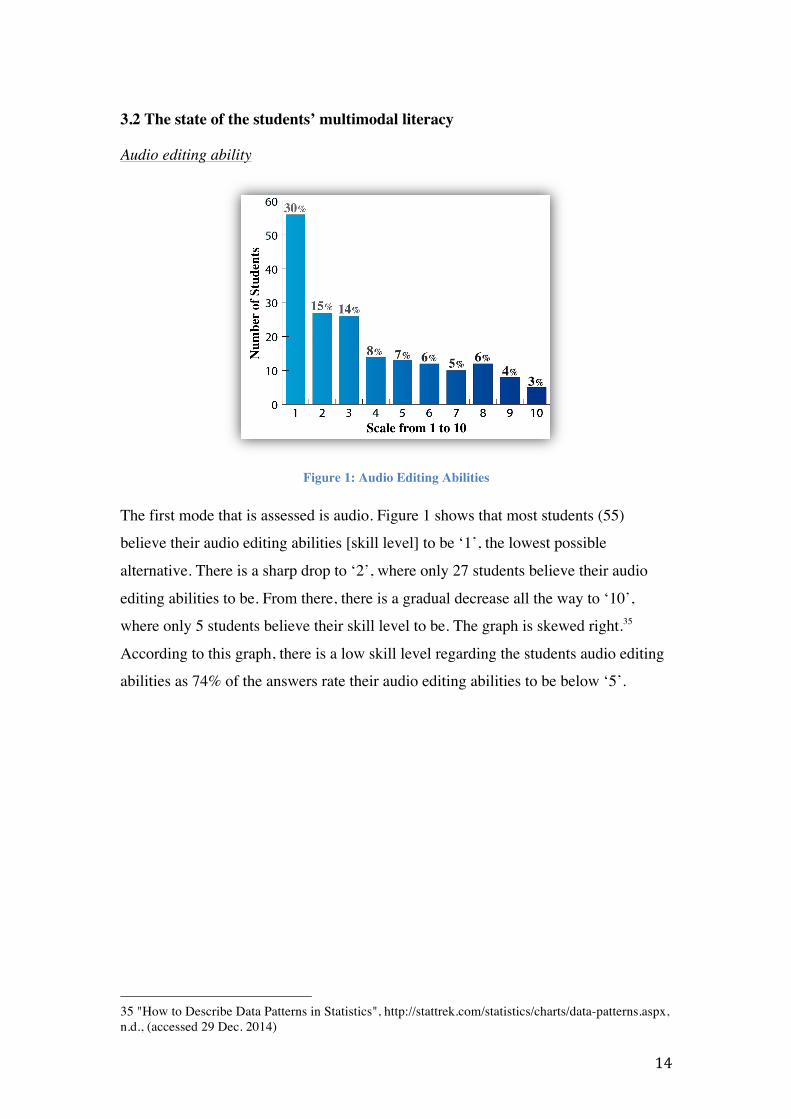
Figure 2: Video Editing/Production Abilities
When the same question is asked but about their video editing abilities (rather than
audio), the graph (Figure 2) shows a similar–mostly decreasing–pattern. However,
this graph has 40 students who chose the lowest alternative, alluding to a general
higher skill level of video-editing ability among the students. The shape of the graph
confirms the higher level of competence in video editing, as the graph shows quite a
gradual decrease in student numbers as the skill level goes up. The value ‘3’ even has
a higher number of students than ‘2’, 32 and 26 respectively. This graph, however,
does not have any students who rate themselves at the highest value ‘10’ and the
majority of students (69%) are still at or lower than the mid-point ‘5’. So, like the
graph in Figure 1, the graph in Figure 2 is skewed right.
16
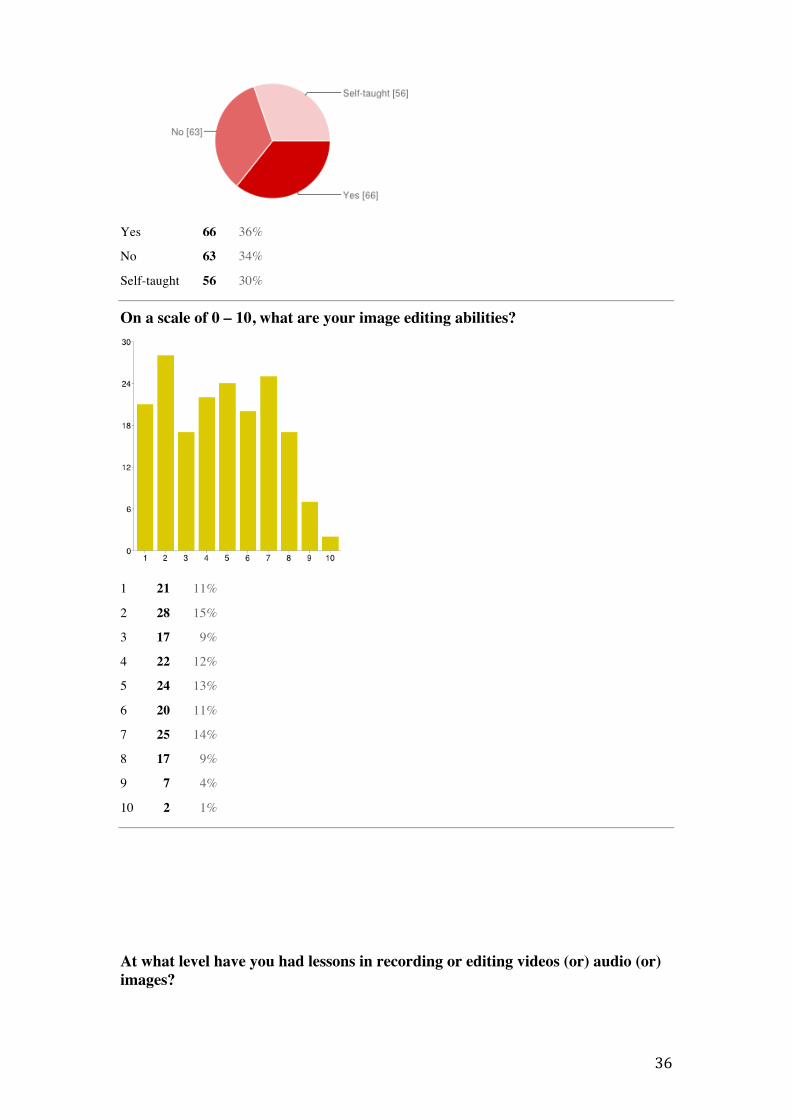
Image editing ability
Figure 3: Image Editing Abilities
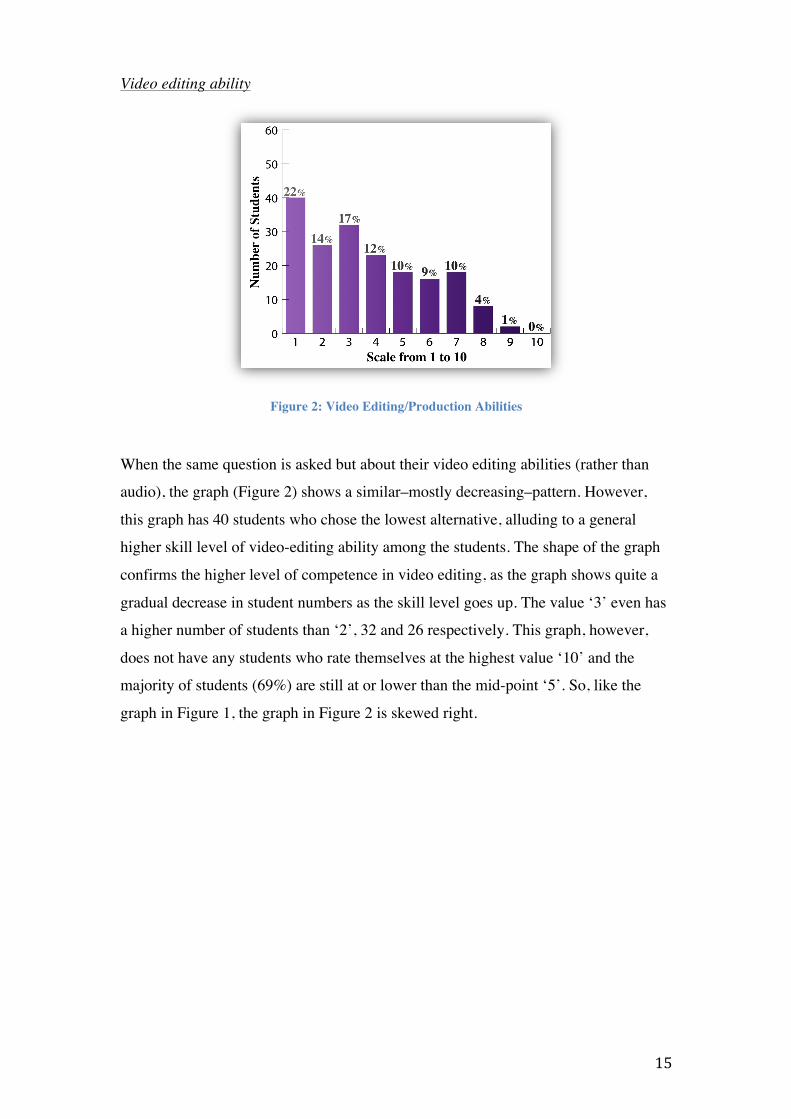
The graph in Figure 3, which displays the results of students image editing abilities,
shows a visibly higher competency level than both the audio and video graph, with
only ‘21’ students rating themselves as the lowest alternative, ‘1’, while 28 students
rate themselves ‘2’. The third highest value is ‘7’, which is relatively very high. The
shape of this graph is quite uniform, with a steep fall around the values ‘9’ and ‘10’.
61% of students still believe themselves to be at or under the mid value ‘5’, but as the
graph indicates, the spread is a lot more uniform and balanced.
Summary of editing abilities
The difference between the three graphs is best illustrated by the spread of the
students, rather than the mean value. The skew of the graph in Figure 1 and the graph
in Figure 2 are similar, but the graph in Figure 3 has a more evenly distributed spread
of values. The shapes of these graphs show that students are not very skilled in editing
audio and video, while–relatively–a lot more skilled in editing images.
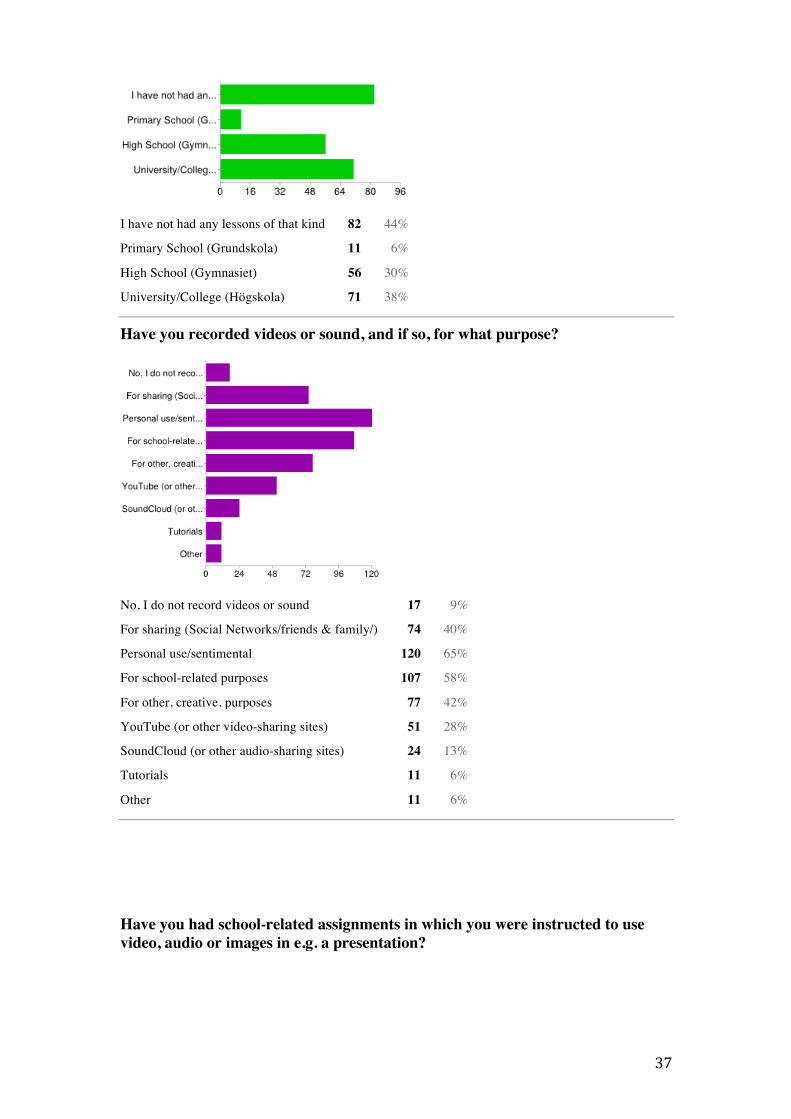
3.3 Multimodality in education
Following three pie charts (Figure 4, Figure 5 and Figure 6) show the number of
students who have been educated in audio, video and image editing respectively.
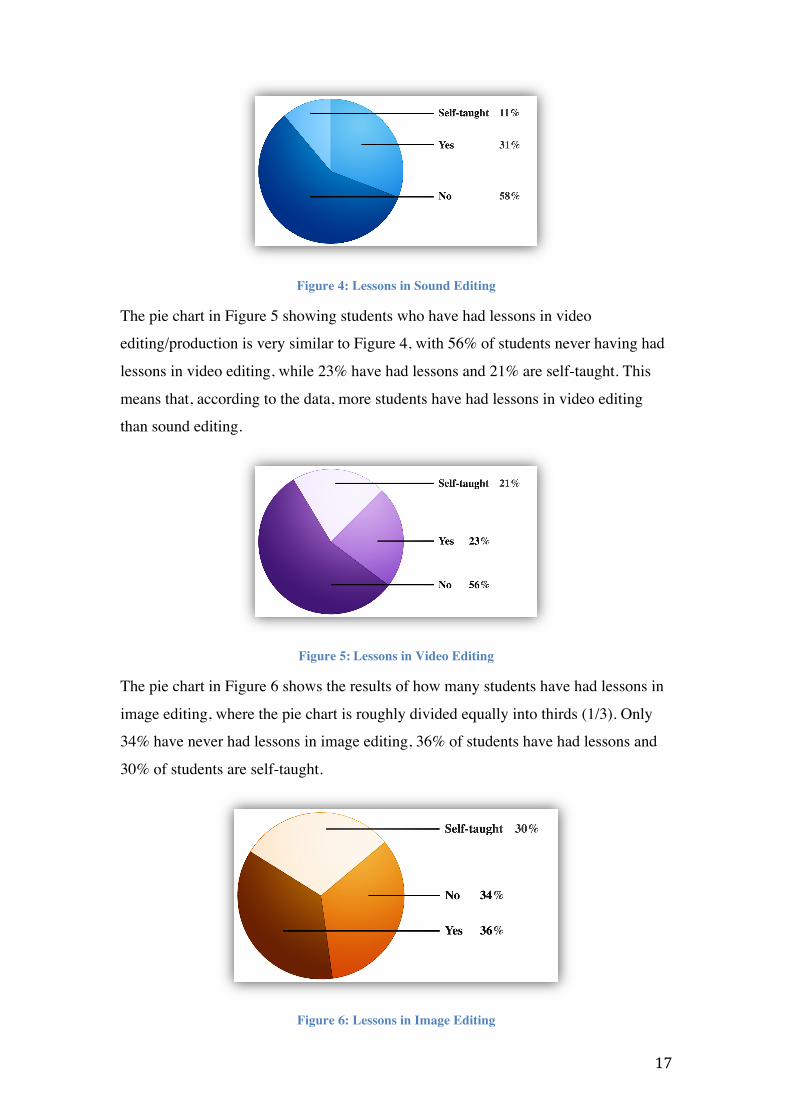
Figure 4 shows that 107 students have not ever had lessons in sound editing, which is
58% of the total number of students, and 31% have had lessons in sound editing and
11% are self-taught.
17
Figure 4: Lessons in Sound Editing
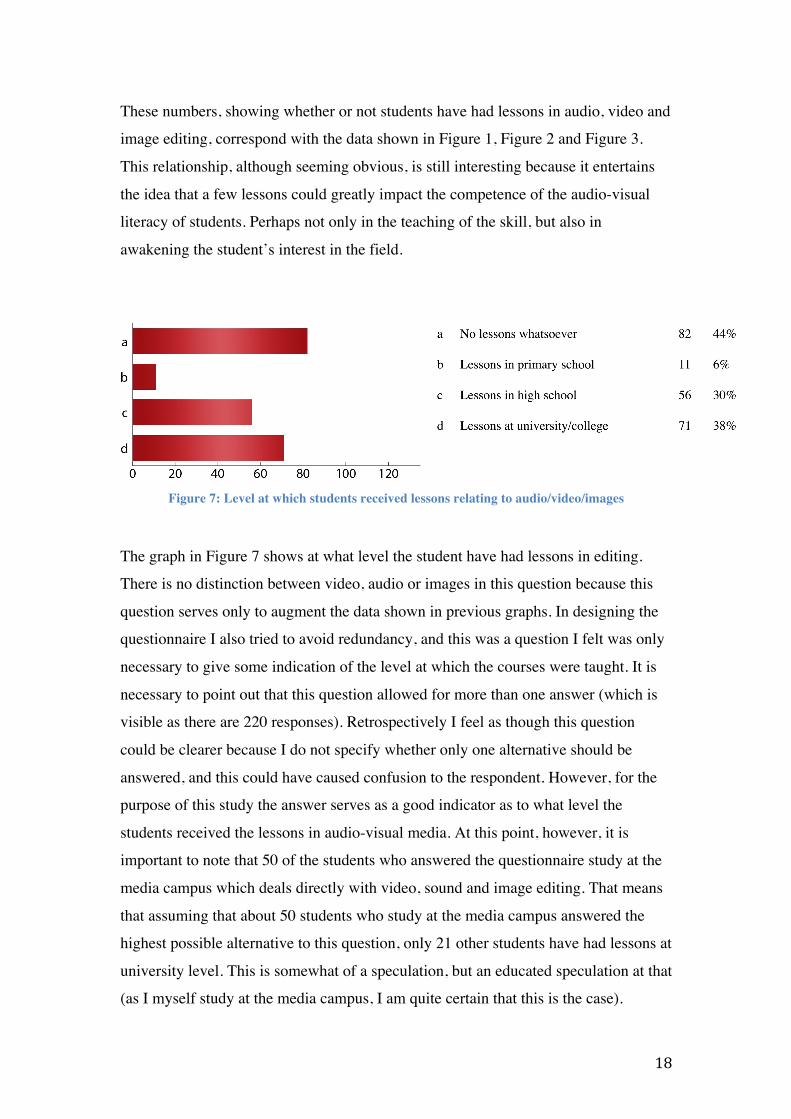
The pie chart in Figure 5 showing students who have had lessons in video
editing/production is very similar to Figure 4, with 56% of students never having had
lessons in video editing, while 23% have had lessons and 21% are self-taught. This
means that, according to the data, more students have had lessons in video editing
than sound editing.
Figure 5: Lessons in Video Editing
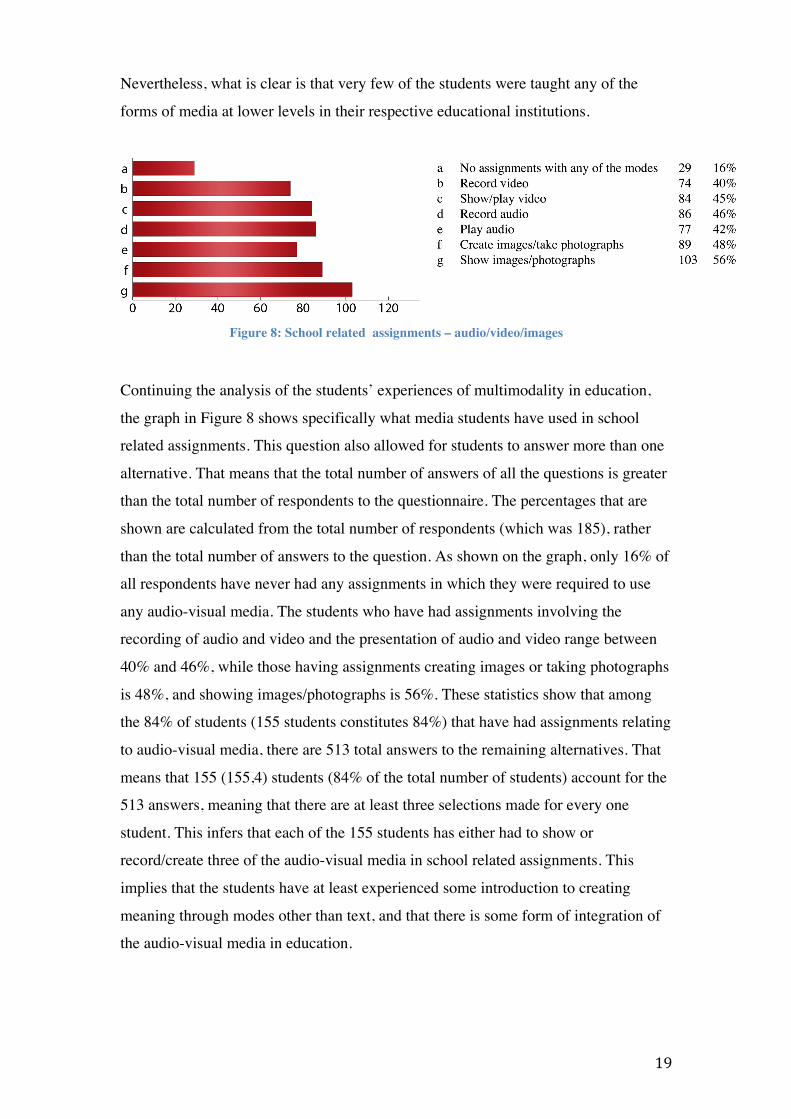
The pie chart in Figure 6 shows the results of how many students have had lessons in
image editing, where the pie chart is roughly divided equally into thirds (1/3). Only
34% have never had lessons in image editing, 36% of students have had lessons and
30% of students are self-taught.
Figure 6: Lessons in Image Editing
18
These numbers, showing whether or not students have had lessons in audio, video and
image editing, correspond with the data shown in Figure 1, Figure 2 and Figure 3.
This relationship, although seeming obvious, is still interesting because it entertains
the idea that a few lessons could greatly impact the competence of the audio-visual
literacy of students. Perhaps not only in the teaching of the skill, but also in
awakening the student’s interest in the field.
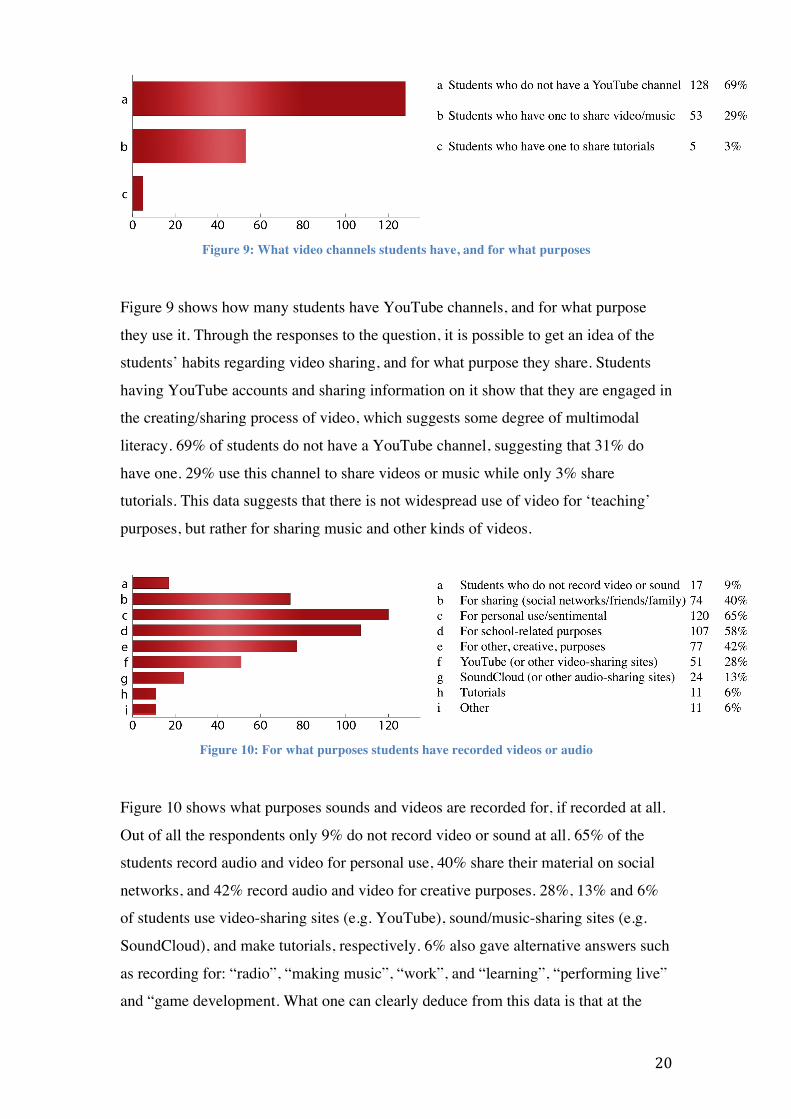
Figure 7: Level at which students received lessons relating to audio/video/images
The graph in Figure 7 shows at what level the student have had lessons in editing.
There is no distinction between video, audio or images in this question because this
question serves only to augment the data shown in previous graphs. In designing the
questionnaire I also tried to avoid redundancy, and this was a question I felt was only
necessary to give some indication of the level at which the courses were taught. It is
necessary to point out that this question allowed for more than one answer (which is
visible as there are 220 responses). Retrospectively I feel as though this question
could be clearer because I do not specify whether only one alternative should be
answered, and this could have caused confusion to the respondent. However, for the
purpose of this study the answer serves as a good indicator as to what level the
students received the lessons in audio-visual media. At this point, however, it is
important to note that 50 of the students who answered the questionnaire study at the
media campus which deals directly with video, sound and image editing. That means
that assuming that about 50 students who study at the media campus answered the
highest possible alternative to this question, only 21 other students have had lessons at
university level. This is somewhat of a speculation, but an educated speculation at that
(as I myself study at the media campus, I am quite certain that this is the case).
19
Nevertheless, what is clear is that very few of the students were taught any of the
forms of media at lower levels in their respective educational institutions.
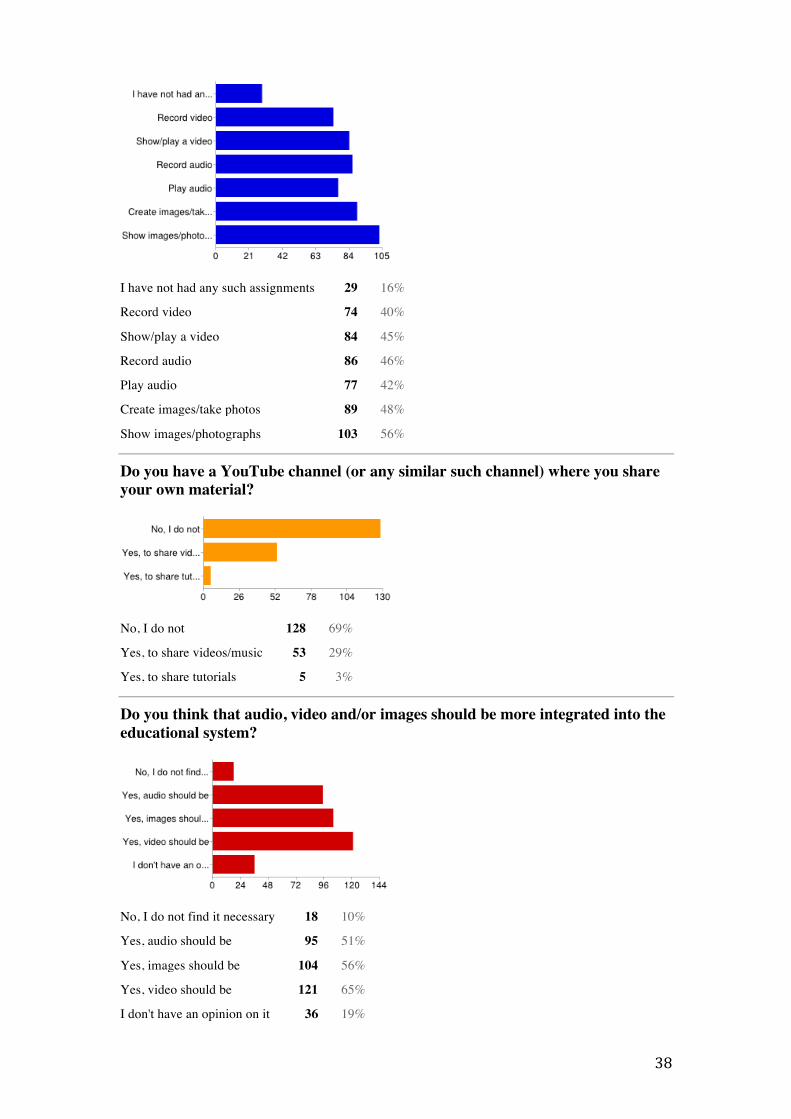
Figure 8: School related assignments – audio/video/images
Continuing the analysis of the students’ experiences of multimodality in education,
the graph in Figure 8 shows specifically what media students have used in school
related assignments. This question also allowed for students to answer more than one
alternative. That means that the total number of answers of all the questions is greater
than the total number of respondents to the questionnaire. The percentages that are
shown are calculated from the total number of respondents (which was 185), rather
than the total number of answers to the question. As shown on the graph, only 16% of
all respondents have never had any assignments in which they were required to use
any audio-visual media. The students who have had assignments involving the
recording of audio and video and the presentation of audio and video range between
40% and 46%, while those having assignments creating images or taking photographs
is 48%, and showing images/photographs is 56%. These statistics show that among
the 84% of students (155 students constitutes 84%) that have had assignments relating
to audio-visual media, there are 513 total answers to the remaining alternatives. That
means that 155 (155,4) students (84% of the total number of students) account for the
513 answers, meaning that there are at least three selections made for every one
student. This infers that each of the 155 students has either had to show or
record/create three of the audio-visual media in school related assignments. This
implies that the students have at least experienced some introduction to creating
meaning through modes other than text, and that there is some form of integration of
the audio-visual media in education.
20
Figure 9: What video channels students have, and for what purposes
Figure 9 shows how many students have YouTube channels, and for what purpose
they use it. Through the responses to the question, it is possible to get an idea of the
students’ habits regarding video sharing, and for what purpose they share. Students
having YouTube accounts and sharing information on it show that they are engaged in
the creating/sharing process of video, which suggests some degree of multimodal
literacy. 69% of students do not have a YouTube channel, suggesting that 31% do
have one. 29% use this channel to share videos or music while only 3% share
tutorials. This data suggests that there is not widespread use of video for ‘teaching’
purposes, but rather for sharing music and other kinds of videos.
Figure 10: For what purposes students have recorded videos or audio
Figure 10 shows what purposes sounds and videos are recorded for, if recorded at all.
Out of all the respondents only 9% do not record video or sound at all. 65% of the
students record audio and video for personal use, 40% share their material on social
networks, and 42% record audio and video for creative purposes. 28%, 13% and 6%
of students use video-sharing sites (e.g. YouTube), sound/music-sharing sites (e.g.
SoundCloud), and make tutorials, respectively. 6% also gave alternative answers such
as recording for: “radio”, “making music”, “work”, and “learning”, “performing live”
and “game development. What one can clearly deduce from this data is that at the
21
very least 65% of the respondents have access to video or audio recording equipment,
and use it whether frequently or infrequently. 58% of students record sound or video
for “school related purposes”, which is the second highest value shown on the graph
in Figure 10.
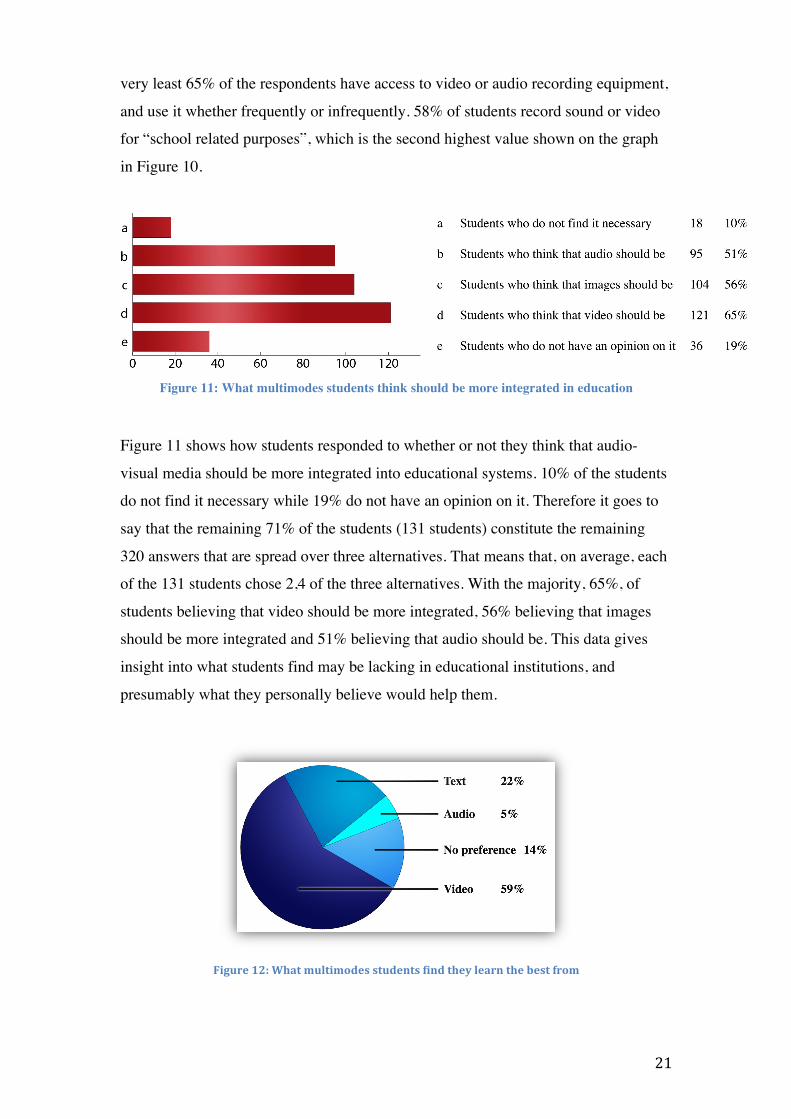
Figure 11: What multimodes students think should be more integrated in education
Figure 11 shows how students responded to whether or not they think that audio-
visual media should be more integrated into educational systems. 10% of the students
do not find it necessary while 19% do not have an opinion on it. Therefore it goes to
say that the remaining 71% of the students (131 students) constitute the remaining
320 answers that are spread over three alternatives. That means that, on average, each
of the 131 students chose 2,4 of the three alternatives. With the majority, 65%, of
students believing that video should be more integrated, 56% believing that images
should be more integrated and 51% believing that audio should be. This data gives
insight into what students find may be lacking in educational institutions, and
presumably what they personally believe would help them.
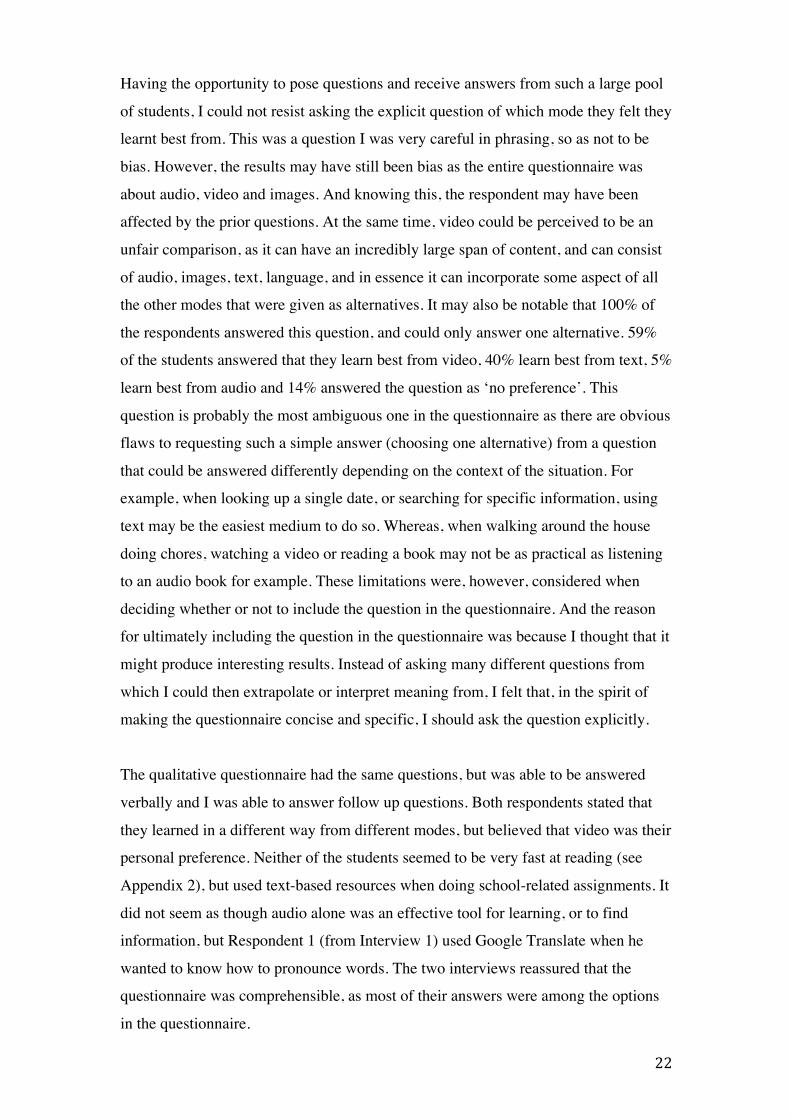
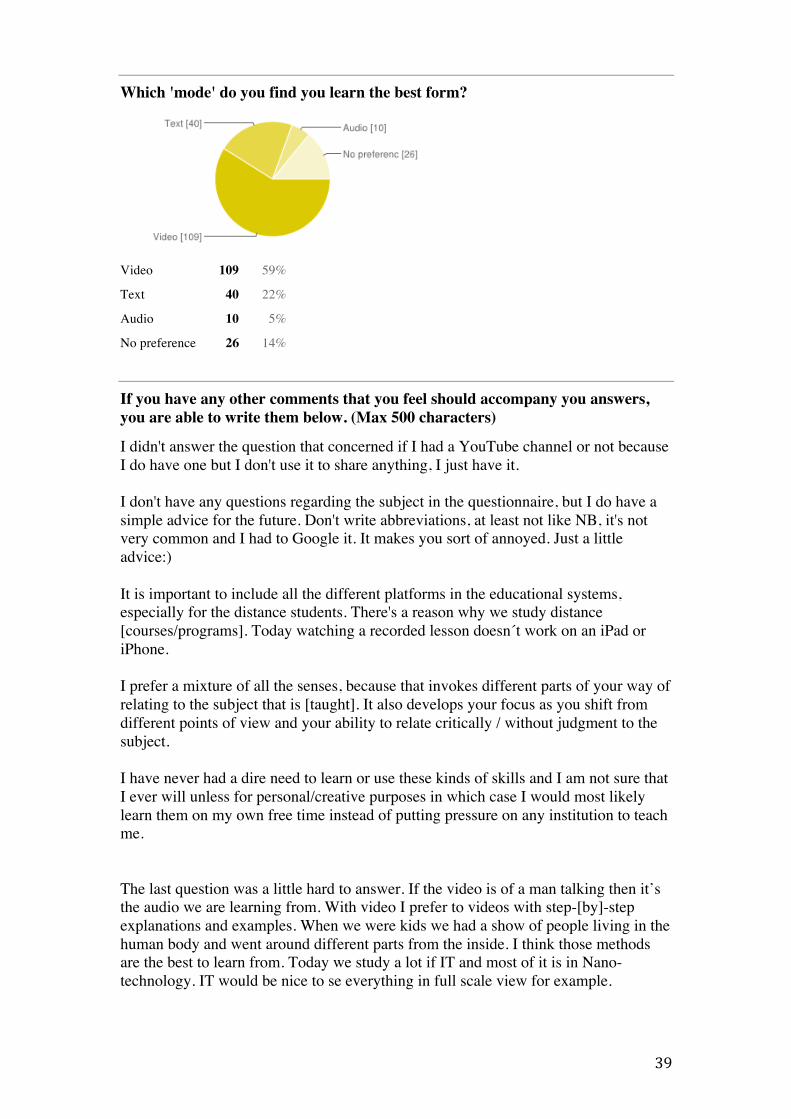
Figure 12: What multimodes students find they learn the best from
22
Having the opportunity to pose questions and receive answers from such a large pool
of students, I could not resist asking the explicit question of which mode they felt they
learnt best from. This was a question I was very careful in phrasing, so as not to be
bias. However, the results may have still been bias as the entire questionnaire was
about audio, video and images. And knowing this, the respondent may have been
affected by the prior questions. At the same time, video could be perceived to be an
unfair comparison, as it can have an incredibly large span of content, and can consist
of audio, images, text, language, and in essence it can incorporate some aspect of all
the other modes that were given as alternatives. It may also be notable that 100% of
the respondents answered this question, and could only answer one alternative. 59%
of the students answered that they learn best from video, 40% learn best from text, 5%
learn best from audio and 14% answered the question as ‘no preference’. This
question is probably the most ambiguous one in the questionnaire as there are obvious
flaws to requesting such a simple answer (choosing one alternative) from a question
that could be answered differently depending on the context of the situation. For
example, when looking up a single date, or searching for specific information, using
text may be the easiest medium to do so. Whereas, when walking around the house
doing chores, watching a video or reading a book may not be as practical as listening
to an audio book for example. These limitations were, however, considered when
deciding whether or not to include the question in the questionnaire. And the reason
for ultimately including the question in the questionnaire was because I thought that it
might produce interesting results. Instead of asking many different questions from
which I could then extrapolate or interpret meaning from, I felt that, in the spirit of
making the questionnaire concise and specific, I should ask the question explicitly.
The qualitative questionnaire had the same questions, but was able to be answered
verbally and I was able to answer follow up questions. Both respondents stated that
they learned in a different way from different modes, but believed that video was their
personal preference. Neither of the students seemed to be very fast at reading (see
Appendix 2), but used text-based resources when doing school-related assignments. It
did not seem as though audio alone was an effective tool for learning, or to find
information, but Respondent 1 (from Interview 1) used Google Translate when he
wanted to know how to pronounce words. The two interviews reassured that the
questionnaire was comprehensible, as most of their answers were among the options
in the questionnaire.
23
3.4 Analysis
While taking heed to the margin of error inherent with the question-response form in
a questionnaire, the data shows that there is a very large interest for video for
educational purposes. The educational aspect is made explicit by the word ‘learn’ in
the question. The results of the questionnaire as a whole reveal some interesting
information about how students perceive different modes, as well as whether or not
they create meaning using them. The results do not show any exceptional data, and
there seems to be relatively balanced responses to most of the questions, with no
explicitly shocking results.
The students’ understanding of multimodality
The ability of the students to understand multimodality was to a large extent
presumed, as it would have been difficult to measure their understanding of modes in
a quantitative study based on a questionnaire. As mentioned before, the students’
ability to read text is not in question in this study, as it is a prerequisite to apply to the
university. As this aspect is presumed, I believe it fair to presume that the students can
also understand information that is shown in video, on images and in audio. That is to
say that the students can understand explicit information, and not necessarily
symbolism or deeper meaning in the different modes. This was clear through the–
relatively–evenly distributed answers to the question of their preferred mode to learn
from.
The students’ ability to create meaning with multimodality
This is the aspect of the study that proved to have some of the most interesting results,
as it examines the students’ ability to use audio-visual modes to create meaning. As
the responses show, 68% of the respondents rate their total audio, video and image
editing skill level to be less than or equal to 5 out of 10; while 64% of all respondents
answered either video or audio as the mode they learn best from. It should surely
follow that if it is video that people can process information the ‘best’ from, then the
mode used to transmit information should, perhaps, also follow suit. That is to say
that if a student is able to best process information that is video format, then it should
follow that it is in this format that they should also share information, so as to make it
equally processable to others.
24
3.5 Reflection and Discussion
The research paper, as a whole, I believe to be successful. There are, however, certain
aspects that could have gone better, and could have made the research paper of a
higher quality. The method used–mixed method–was a good fit, regarding the purpose
of the paper. Having said that, there were a few aspects that could have been
improved upon.
The mailing list of the program coordinators on the website seemed to be quite out of
date, as many of the program coordinators responded by saying that their
program/course had ended a long time ago. This could also mean that there were
programs/courses that were not included on the website, as it seemed to be out of
date. Going to a more reliable source to get their emails–such as the university’s
reception, or someone who deals more directly with such information–could have
improved the overall response rate. Another aspect that was not addressed in the
research paper was sample size, and the possibility of bias data. There was no
calculation done prior to the sending out of emails regarding the population size.
However, the process of sending emails and collecting data was done to get a large
sample size, so as to not have to worry about the sample size. As the sample size was
185 students (2% of the entire student body), I believed this to be a representative
group of respondents. 2% seems to be a small sample size, yet there is a large
confidence interval, which decreases the need for a large sample size.36 Having more
than 2% of 8,676 seems also unreasonable. Retrospectively, however, having a
smaller population (such as only students on campus Borlänge or campus Falun)
could also have increased the reliability of the study. The different respondents can be
seen in Appendix 1, and there were respondents from all three campuses and distance
students. The exception was Erasmus students, and perhaps I should not have
included them altogether, as they usually only study at the university for one
semester, or at most, one year.
The results of the study were interesting to say the least, and served its purpose in
studying the current state of students’ multimodal literacy at Dalarna University. It is
difficult, however, when analysing data in a field that aspires to be ground-breaking, 36 Babbie. The Basics of Social Research – 2008 (page 219)

25
as the concepts had been relatively unknown to me before, and there was a large
possibility that the respondents would not understand the purpose of the
questionnaire, or even the questionnaire itself.
In the end, the results were reliable and showed that there are people who have
different preferences regarding what mode(s) they learn the best from. Multimodality
seems to communicate to a larger audience, and can make information more
processable. Although the students’ skills regarding creating meaning through modes
other than text seems to be limited, the research makes a strong statement by showing
that there is a need for development in modes other than (but including) language and
text.
26
4. Conclusion
The results of the study show that although there is a degree of literacy in semiotic
resources other than text and language, there is still ample room (or rather need) for
development of multiple literacies.
So, as to answer the main research questions: What is the state of the students at
Dalarna University’s multimodal literacy? The study revealed that students have
had mediocre use of multimodality both in their private use and in their respective
educational institutions. The graphs that showed their level of literacy in using
multimodality all seemed to skew mostly to the right, implying a lower level rather
than a higher level of multimodal literacy. In the context of the state of global
education, where even basic (textual) literacy rates are 80% for women and 89% for
men, the states of the students’ multimodal literacy may be impressive.37 However, if
one were to think of audio-visual and multimodal literacy being as potentially being
as fluent as textual literacy to university students, the results do not indicate a very
audio-visually literate student body. Out of the three modes (i.e. video, audio and
images), the students were overwhelmingly more skilled in image editing than in
audio or video editing.
How have the students at Dalarna University experienced multimodality in education? The educational institutions–from University level downwards–have not
seemed to accommodate the changing learning environment, as the overwhelming
majority of students believe that audio, video and/or images should be a more integral
part of education. As 59% of students believe that they learn the best from video, it
goes to reason that educating students how to communicate effectively through video
could potentially engage a larger audience.
The idea of spreading meaning across multiple modes in order to facilitate better
communication was brought up in the chapter Theoretical Framework. The results of
the study reinforce this idea. The results reinforce this idea because, as seen in Figure
12, the results showing which modes students find that they learn the best from is
spread out between audio, text and video (as well as ‘no preference’). This shows that
37 "International Literacy Data 2014", http://www.uis.unesco.org/literacy/Pages/literacy-data-release-2014.aspx, 2014, (accessed 30 Dec. 2014)
27
there is not a single mode that students believe that they learn the best from, but rather
that that they learn differently well from different modes. And the fact that most
students believed that they learnt best through video augments these results–as video
itself is somewhat an amalgamation of different modes.38 Encouraging multimodal
literacy may result in students increasing their ability to formulate themselves both
through representation (which focuses on one’s own interests) and communication
(which focuses on the receiver of the information).39 As the different modes have
different affordances, multimodal literacy could also allow for a clearer meaning to be
made by using modes that complement each other.40 In suggesting increasing focus on
multimodal literacy–as I hope is clear–I am not suggesting decreasing focus on
textual or linguistic literacy, but rather increasing all forms of literacy so as to allow
for the materialisation of meaning and an overall increase in the ability to
communicate clearly and succinctly.
As the major modes that can be digitalised are textual, audial and visual, one might
wonder whether–if the technological advancements are made–modes that stimulate
our other senses (such as touch, taste and smell) will be able to be digitalised and
become as easily available to us as text, images, audio and video.
Next Generation Learning
Dalarna University is part of a movement called Next Generation Learning, which
focuses on learning and teaching that makes use of the technical resources that exist.
It is “the intelligent use of technology to develop innovative learning models and
personalized educational pathways.” 41 Dalarna University also has the most viewed
YouTube channel of all the Universities in Sweden, with over a million views in total,
and over 3000 subscribers.42 Keeping in mind that Dalarna University aspires to be a
part of the “Next Generation Learning” movement, the university could justify
encouraging multimodal literacy in educational programs that are not necessarily
media-related in order to further its educational and innovative reach.
38 Jewitt. The Routledge Handbook of Multimodal Analysis – 2014 (page 27) 39 Kress. Multimodality: a social semiotic approach to contemporary communication – 2010 (page 49) 40 Kress & Van Leeuwen. Multimodal Discourse – 2001 (page 20) 41 "Om NGL", http://www.du.se/sv/NGL/Om-NGL/, 2014, (accessed 30 Dec. 2014) 42 "I Topp På YouTube", http://www.du.se/sv/Om-Hogskolan/Aktuellt/Nyheter/Hogskolan-Dalarna-i-topp-pa-Youtube/, 2014, (accessed 30 Dec. 2014)
28
Even though the method carried out in the study had room for improvement, it did
reveal some interesting information about the state of multimodal literacy of the
students. A gaping contradiction was also revealed in that the mode that the
overwhelming majority of the students believed they learned best from (video) had a
very low skill rate. Surely the mode that the students believe they learn best from
should also be a mode that they are literate in–both in understanding and creating in
that mode. In the light of this research paper, it seems that the creation and sharing of
tutorials should be more practiced and encouraged.
Language
One might say that the history of the written language served as an inspiration for this
study.
Knowledge brings power. Hence writing brings power to modern
societies, by making it possible to transmit knowledge with far greater
accuracy and in far greater quantity and detail, from more distant
lands and more remote times. – Jared Diamond43
This research paper can be better understood against the backdrop of Jared Diamond’s
quote. Writing has served as an invaluable tool in contributing to modern society and
the spread of ideas, information and ultimately knowledge. In fact, writing has served
as such an integral part of modern society that it is nearly impossible to imagine how
a globalised society could exist without it. When analysing what writing, in essence
is, it is simply a form of communication–a semiotic resource. In the same way that the
written language has been invaluable to society, perhaps other semiotic resources can
be of equal importance in shaping society. And universities should be seen as a
stepping-stone to achieving a more multimodal literate society.
43 Diamond. Guns, Germs and Steel – 2005 (page 215)
29
References
Literature
Babbie, Earl R. The Basics of Social Research. Belmont: Thomson/Wadsworth, 2008.
Print.
Booth, Wayne C., Gregory G. Colomb, and Joseph M. Williams. The Craft of
Research. Chicago: University of Chicago, 1995. Print.
Bryman, Alan. Social Research Methods. Oxford: Oxford UP, 2008. Print.
Burbules, Nicholas C., and Carlos A. Torres. "Globalization and New Social
Movements: Lessons for Critical Theory and Pedagogy." Globalization and
Education: Critical Perspectives. New York: Routledge, 20rint.
Couper, Mick P., Roger Tourangeau, Frederick G. Conrad, and Scott D. Crawford.
"What They See Is What We Get: Response Options for Web Surveys." Social
Science Computer Review 22.1 (2004): 111-27. Web. 10 Dec. 2014.
Creswell, John W. Research Design: Qualitative, Quantitative and Mixed Methods
Approaches. London: SAGE Publications, 2014. Print.
Diamond, Jared. Guns, Germs and Steel: A Short History of Everybody for the Last
13,000 Years. London: Vintage, 2005. Print.
Ekengren, Ann-Marie, and Jonas Hinnfors. Uppsatshandbok: Hur Du Lyckas Med
Din Uppsats. Denmark: Studentlitteratur, 2006. Print.
Jewitt, Carey. The Routledge Handbook of Multimodal Analysis. London: Routledge,
2014. Print.
Kress, Gunther R., and Theo Van Leeuwen. Multimodal Discourse: The Modes and
Media of Contemporary Communication. London: Arnold, 2001. Print.
30
Kress, Gunther R. Multimodality: A Social Semiotic Approach to Contemporary
Communication. London: Routledge, 2010. Print.
Rasmusson, Maria, and Monica Eklund. "It’s Easier to Read on the Internet—you Just
Click on What You Want to Read…." Abilities and Skills Needed for Reading on the
Internet 18.3 (2013): 401-19. Education and Information Technologies. Web. 24 Oct.
2014.
Rosengren, Karl Erik. Communication: An Introduction. London: Sage Publications,
2000. Print.
Smart, J. J. C. Philosophy and Scientific Realism. Oxon: Routledge, 1963. Print.
Yin, Robert K. Case Study Research: Design and Methods. Los Angeles: SAGE
Publications, 2009. Print.
Online
"Erasmus Grant – Frequently Asked Questions." ERASMUS GRANT –
FREQUENTLY ASKED QUESTIONS (n.d.): 2. Erasmus Grant – Frequently Asked
Questions. UCL Registry, 1 June 2013. Web. 5 Jan. 2014.
<http://www.ucl.ac.uk/studyabroad/forms/Erasmus-Grant-FAQ.pdf>.
"European Commission - Europeans and Their Languages." EUROPA - European
Commission. European Commission, June 2012. Web. 29 Dec. 2014.
<http://ec.europa.eu/public_opinion/archives/ebs/ebs_386_en.pdf>.
Goodman, Allan E., Dr. "The Role of the University in World Society.” Institute of
International Education, 16 Oct. 2012. Web. 21 Dec. 2014.
<http://www.iie.org/Blog/2012/October/University-Roles>.
"How to Describe Data Patterns in Statistics." Patterns of Data in Statistics. Stat
Trek, n.d. Web. 29 Dec. 2014. <http://stattrek.com/statistics/charts/data-
patterns.aspx>.
31
"I Topp På YouTube." Högskolan Dalarna – I Topp På Youtube. Högskolan Dalarna,
14 Oct. 2014. Web. 30 Dec. 2014. <http://www.du.se/sv/Om-
Hogskolan/Aktuellt/Nyheter/Hogskolan-Dalarna-i-topp-pa-Youtube/>.
"International Literacy Data 2014." International Literacy Data 2014. UNESCO
Institute for Statistics, 17 July 2014. Web. 30 Dec. 2014.
<http://www.uis.unesco.org/literacy/Pages/literacy-data-release-2014.aspx>.
Kellner, Douglas. “Multiple Literacies and Critical Pedagogy in a Multicultural
Society.” 1998. Web. 20 Dec. 2014.
<http://pages.gseis.ucla.edu/faculty/kellner/essays/multipleliteraciescriticalpedagogy.
pdf >.
Kellner, Douglas. "Technological Transformation, Multiple Literacies, and the Re-
Visioning of Education." 2006. Web. 22 Dec. 2014.
<http://pages.gseis.ucla.edu/faculty/kellner/essays/technologicaltransformation.pdf>.
"Om NGL." Om NGL - Högskolan Dalarna. Högskolan Dalarna, 04 Feb. 2014. Web.
30 Dec. 2014. <http://www.du.se/sv/NGL/Om-NGL/>.
Oxford Dictionaries. "Literacy." Oxford Dictionaries, the World's Most Trusted
Dictionaries. N.p., n.d. Web. 29 Dec. 2014.
<http://oxforddictionaries.com/definition/literacy>.
"The Universal Declaration of Human Rights." Welcome to the United Nations: It's
Your World. United Nations, n.d. Web. 22 Dec. 2014.
<http://www.un.org/en/documents/udhr/>.
"What is a mode?", [online video], 2012,
https://www.youtube.com/watch?v=kJ2gz_OQHhI, (accessed 20 Dec. 2014)
"What is multimodality?", [online video], 2012,
https://www.youtube.com/watch?v=nt5wPIhhDDU, (accessed 20 Dec. 2014)
32
Appendix A: Questions and Answers–Qualitative Interview
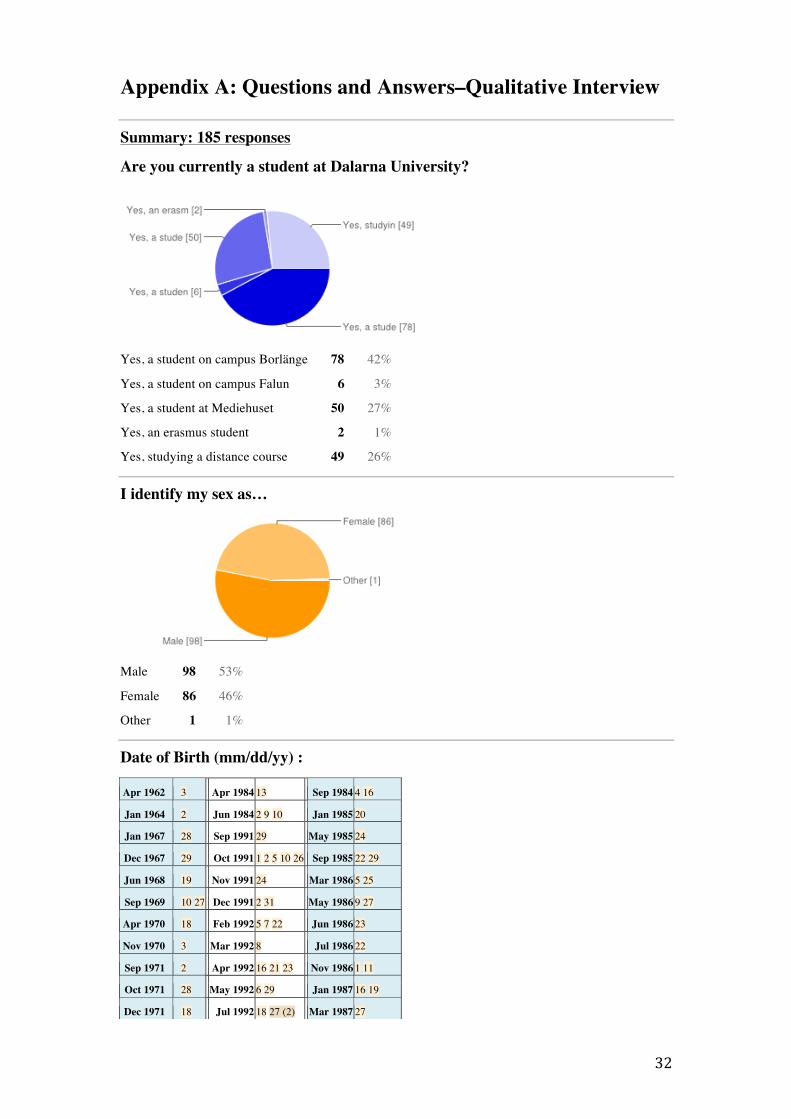
Summary: 185 responses
Are you currently a student at Dalarna University?
Yes, a student on campus Borlänge 78 42%
Yes, a student on campus Falun 6 3%
Yes, a student at Mediehuset 50 27%
Yes, an erasmus student 2 1%
Yes, studying a distance course 49 26%
I identify my sex as…
Male 98 53%
Female 86 46%
Other 1 1%
Date of Birth (mm/dd/yy) :
Apr 1962 3 Apr 1984 13 Sep 1984 4 16
Jan 1964 2 Jun 1984 2 9 10 Jan 1985 20
Jan 1967 28 Sep 1991 29 May 1985 24
Dec 1967 29 Oct 1991 1 2 5 10 26 Sep 1985 22 29
Jun 1968 19 Nov 1991 24 Mar 1986 5 25
Sep 1969 10 27 Dec 1991 2 31 May 1986 9 27
Apr 1970 18 Feb 1992 5 7 22 Jun 1986 23
Nov 1970 3 Mar 1992 8 Jul 1986 22
Sep 1971 2 Apr 1992 16 21 23 Nov 1986 1 11
Oct 1971 28 May 1992 6 29 Jan 1987 16 19
Dec 1971 18 Jul 1992 18 27 (2) Mar 1987 27
33
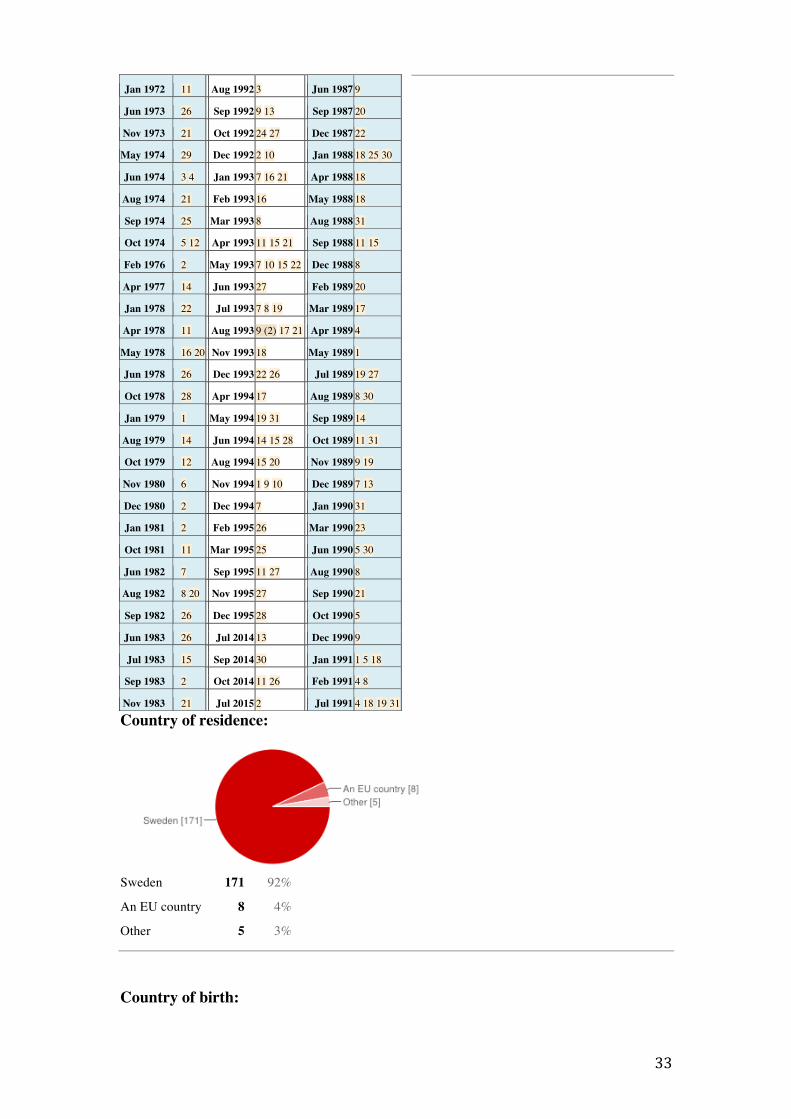
Country of residence:
Sweden 171 92%
An EU country 8 4%
Other 5 3%
Country of birth:
Jan 1972 11 Aug 1992 3 Jun 1987 9
Jun 1973 26 Sep 1992 9 13 Sep 1987 20
Nov 1973 21 Oct 1992 24 27 Dec 1987 22
May 1974 29 Dec 1992 2 10 Jan 1988 18 25 30
Jun 1974 3 4 Jan 1993 7 16 21 Apr 1988 18
Aug 1974 21 Feb 1993 16 May 1988 18
Sep 1974 25 Mar 1993 8 Aug 1988 31
Oct 1974 5 12 Apr 1993 11 15 21 Sep 1988 11 15
Feb 1976 2 May 1993 7 10 15 22 Dec 1988 8
Apr 1977 14 Jun 1993 27 Feb 1989 20
Jan 1978 22 Jul 1993 7 8 19 Mar 1989 17
Apr 1978 11 Aug 1993 9 (2) 17 21 Apr 1989 4
May 1978 16 20 Nov 1993 18 May 1989 1
Jun 1978 26 Dec 1993 22 26 Jul 1989 19 27
Oct 1978 28 Apr 1994 17 Aug 1989 8 30
Jan 1979 1 May 1994 19 31 Sep 1989 14
Aug 1979 14 Jun 1994 14 15 28 Oct 1989 11 31
Oct 1979 12 Aug 1994 15 20 Nov 1989 9 19
Nov 1980 6 Nov 1994 1 9 10 Dec 1989 7 13
Dec 1980 2 Dec 1994 7 Jan 1990 31
Jan 1981 2 Feb 1995 26 Mar 1990 23
Oct 1981 11 Mar 1995 25 Jun 1990 5 30
Jun 1982 7 Sep 1995 11 27 Aug 1990 8
Aug 1982 8 20 Nov 1995 27 Sep 1990 21
Sep 1982 26 Dec 1995 28 Oct 1990 5
Jun 1983 26 Jul 2014 13 Dec 1990 9
Jul 1983 15 Sep 2014 30 Jan 1991 1 5 18
Sep 1983 2 Oct 2014 11 26 Feb 1991 4 8
Nov 1983 21 Jul 2015 2 Jul 1991 4 18 19 31
34
Sweden 157 85%
An EU country 14 8%
Other 14 8%
Have you had lessons in video production/editing?
Yes 43 23%
No 103 56%
Self-taught 39 21%
On a scale of 0 – 10, what are your video editing abilities?
1 40 22%
2 26 14%
3 32 17%
4 23 12%
5 18 10%
6 16 9%
7 18 10%
35
8 8 4%
9 2 1%
10 0 0%
Have you ever had lessons in sound editing?
Yes 58 31%
No 107 58%
Self-taught 20 11%
On a scale of 0 – 10, what are your sound editing abilities?
1 56 30%
2 27 15%
3 26 14%
4 14 8%
5 13 7%
6 12 6%
7 10 5%
8 12 6%
9 8 4%
10 5 3%
Have you ever had lessons in image editing?
36
Yes 66 36%
No 63 34%
Self-taught 56 30%
On a scale of 0 – 10, what are your image editing abilities?
1 21 11%
2 28 15%
3 17 9%
4 22 12%
5 24 13%
6 20 11%
7 25 14%
8 17 9%
9 7 4%
10 2 1%
At what level have you had lessons in recording or editing videos (or) audio (or) images?
37
I have not had any lessons of that kind 82 44%
Primary School (Grundskola) 11 6%
High School (Gymnasiet) 56 30%
University/College (Högskola) 71 38%
Have you recorded videos or sound, and if so, for what purpose?
No, I do not record videos or sound 17 9%
For sharing (Social Networks/friends & family/) 74 40%
Personal use/sentimental 120 65%
For school-related purposes 107 58%
For other, creative, purposes 77 42%
YouTube (or other video-sharing sites) 51 28%
SoundCloud (or other audio-sharing sites) 24 13%
Tutorials 11 6%
Other 11 6%
Have you had school-related assignments in which you were instructed to use video, audio or images in e.g. a presentation?
38
I have not had any such assignments 29 16%
Record video 74 40%
Show/play a video 84 45%
Record audio 86 46%
Play audio 77 42%
Create images/take photos 89 48%
Show images/photographs 103 56%
Do you have a YouTube channel (or any similar such channel) where you share your own material?
No, I do not 128 69%
Yes, to share videos/music 53 29%
Yes, to share tutorials 5 3%
Do you think that audio, video and/or images should be more integrated into the educational system?
No, I do not find it necessary 18 10%
Yes, audio should be 95 51%
Yes, images should be 104 56%
Yes, video should be 121 65%
I don't have an opinion on it 36 19%
39
Which 'mode' do you find you learn the best form?
Video 109 59%
Text 40 22%
Audio 10 5%
No preference 26 14%
If you have any other comments that you feel should accompany you answers, you are able to write them below. (Max 500 characters)
I didn't answer the question that concerned if I had a YouTube channel or not because I do have one but I don't use it to share anything, I just have it. I don't have any questions regarding the subject in the questionnaire, but I do have a simple advice for the future. Don't write abbreviations, at least not like NB, it's not very common and I had to Google it. It makes you sort of annoyed. Just a little advice:) It is important to include all the different platforms in the educational systems, especially for the distance students. There's a reason why we study distance [courses/programs]. Today watching a recorded lesson doesn´t work on an iPad or iPhone. I prefer a mixture of all the senses, because that invokes different parts of your way of relating to the subject that is [taught]. It also develops your focus as you shift from different points of view and your ability to relate critically / without judgment to the subject. I have never had a dire need to learn or use these kinds of skills and I am not sure that I ever will unless for personal/creative purposes in which case I would most likely learn them on my own free time instead of putting pressure on any institution to teach me. The last question was a little hard to answer. If the video is of a man talking then it’s the audio we are learning from. With video I prefer to videos with step-[by]-step explanations and examples. When we were kids we had a show of people living in the human body and went around different parts from the inside. I think those methods are the best to learn from. Today we study a lot if IT and most of it is in Nano-technology. IT would be nice to se everything in full scale view for example.
40
Video is my best mode for learning practical skills. Regarding the educational system, which includes lots of non-practical teaching, I'm not sure if video should be more integrated. On the last question; watching /having a normal lesson should also be an alternative. And what is the "best", I think my learning process is different when watching video/reading, it's not better the other, just different.
41
Appendix B: Questions and Answers–Quantitative Interview
Interview 1 – Student form Media Campus, Falun (Film and TV Production)
Q: Which ‘mode’ do you find you learn the best from?
A: Video, because it combines image and sound. I usually watch videos for school-
related things, mostly tutorials. I sometimes use it for words and definitions.
Q: When do you find that text-based resources are the most effective?
A: I mostly use text to find words, definitions and synonyms. I use text-based
resources when writing a report or essay.
Q: When do you use audio-based resources?
A: I use audio when I want to learn how to pronounce words. That is the only time I
use audio. I use Google translate.
Q: How well would you say that you read?
A: I read fast, but when I need to understand something I usually read the text twice. I
am good at skimming [skuggläsa] text.
Q: What do you think that video can communicate that text cannot, and vice-versa?
A: I do not think that text can do much more than video can, rather that video can do
more than text can.
Interview 2 – Student form Falun Campus (Teacher Training Program – focus on
music)
Q: Which ‘mode’ do you find you learn the best from?
A: It depends what I am looking for. When in the process of editing music, I usually
listen to music. I like audio books too, but I have not worked that much with that.
I sometimes watch lectures, so videos are better for school-related work. [I
understand] better when I read, but it takes a very long time. It’s easier to learn, in my
subject of study, from video.
Q: When you look up information, when do you use video and when do you use text?
42
A: When I’m looking for information, I prefer to use video. I prefer not to read. I
don’t feel that I am very good at it. I read very slowly.
Q: Is there anything that you would like to add about your experience of the different
modes?
A: I am busy writing my thesis, and was looking around [online] for information, and
there was not that much literature. I got really happy when I found a lecture on “UR”
(presumably a video-sharing site) about the topic that what I was looking for. It was
an introduction, and I felt relief because then I could understand it in the way I feel is
the easiest way for me to learn. And then I could read the books afterwards, when I
already had better understanding [of the subject]. [Video] allows for a feeling of the
subject.