Embed Size (px)
Citation preview
Business Statistics, A First Course (4e) © 2006 Prentice-Hall, Inc. Chap 14-1
Chapter 14
Statistical Applications in Quality and Productivity Management
Business Statistics, A First Course4th Edition
Business Statistics, A First Course (4e) © 2006 Prentice-Hall, Inc. Chap 14-2
Learning Objectives
In this chapter, you learn:
The basic themes of quality management and Deming’s 14 points
The basic aspects of Six Sigma Management
How to construct various control charts
Which control charts to use for a particular type of data
Business Statistics, A First Course (4e) © 2006 Prentice-Hall, Inc. Chap 14-3
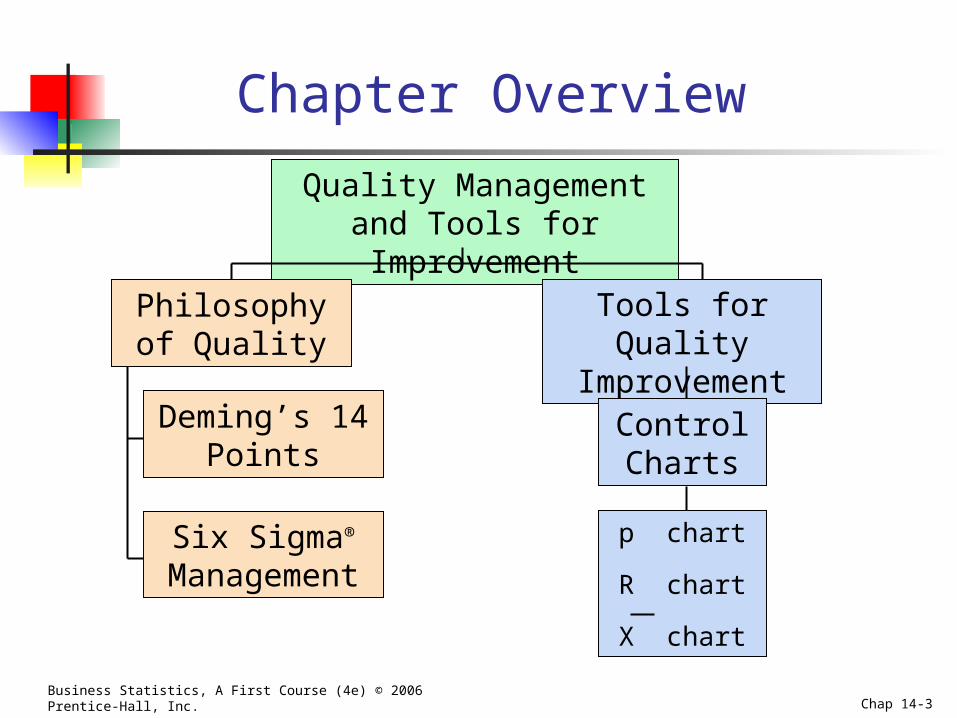
Chapter Overview
Quality Management and Tools for Improvement
Deming’s 14 Points
Six Sigma® Management
Philosophy of Quality
Tools for Quality Improvement
Control Charts
p chart
R chart
X chart
Business Statistics, A First Course (4e) © 2006 Prentice-Hall, Inc. Chap 14-4
Total Quality Management
Primary focus is on process improvement Most variation in a process is due to the
system, not the individual Teamwork is integral to quality management Customer satisfaction is a primary goal Organization transformation is necessary Fear must be removed from organizations Higher quality costs less, not more
Business Statistics, A First Course (4e) © 2006 Prentice-Hall, Inc. Chap 14-5
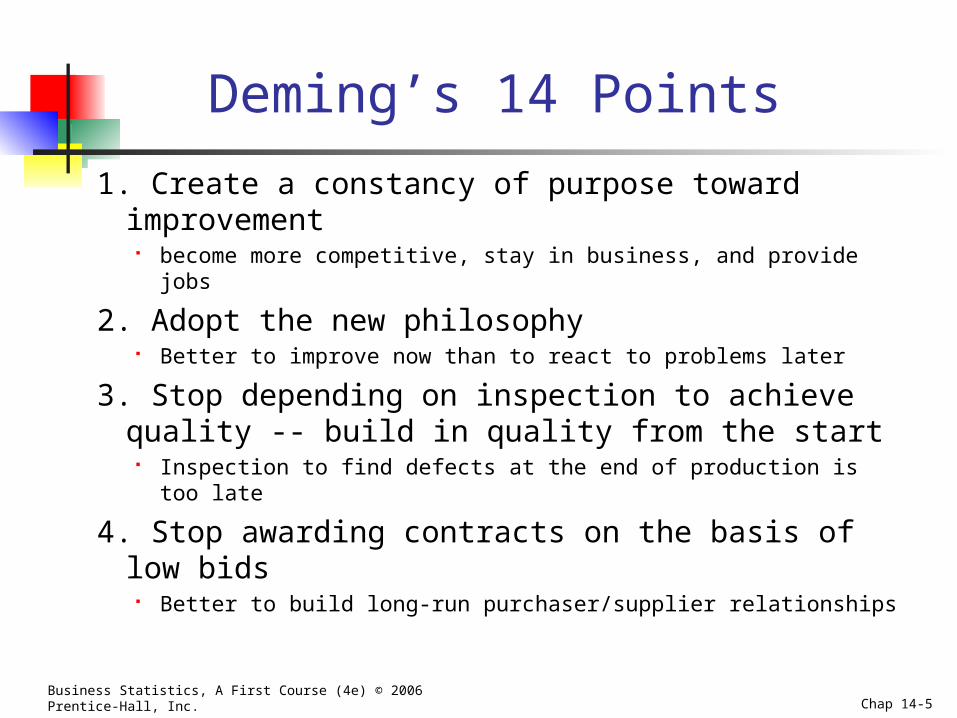
1. Create a constancy of purpose toward improvement
become more competitive, stay in business, and provide jobs
2. Adopt the new philosophy Better to improve now than to react to problems later
3. Stop depending on inspection to achieve quality -- build in quality from the start
Inspection to find defects at the end of production is too late
4. Stop awarding contracts on the basis of low bids
Better to build long-run purchaser/supplier relationships
Deming’s 14 Points
Business Statistics, A First Course (4e) © 2006 Prentice-Hall, Inc. Chap 14-6
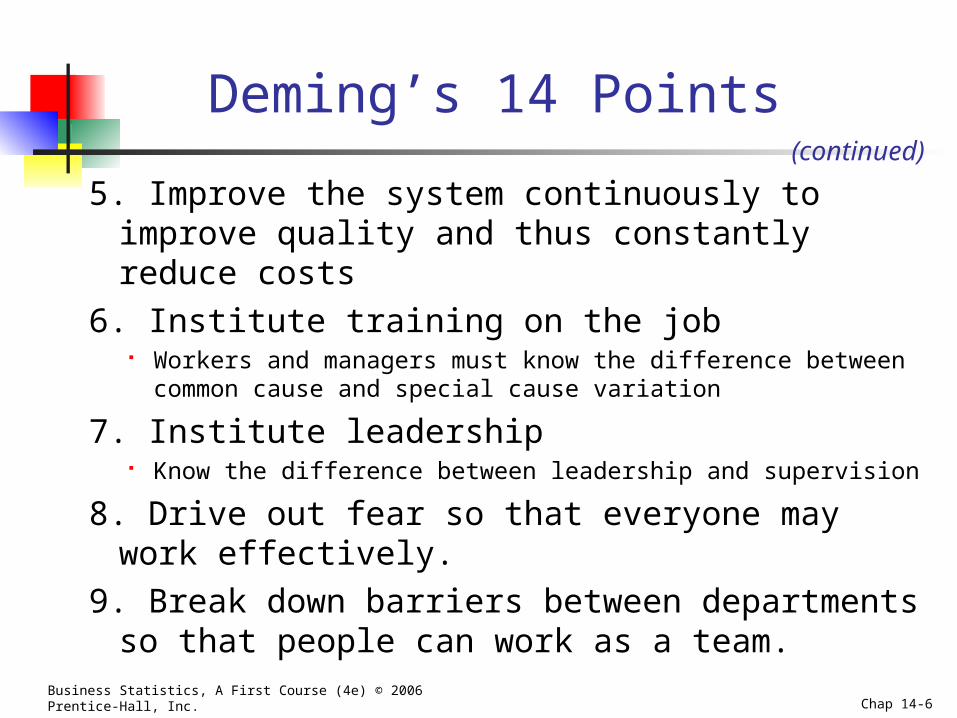
5. Improve the system continuously to improve quality and thus constantly reduce costs
6. Institute training on the job Workers and managers must know the difference between
common cause and special cause variation
7. Institute leadership Know the difference between leadership and supervision
8. Drive out fear so that everyone may work effectively.
9. Break down barriers between departments so that people can work as a team.
(continued)
Deming’s 14 Points
Business Statistics, A First Course (4e) © 2006 Prentice-Hall, Inc. Chap 14-7
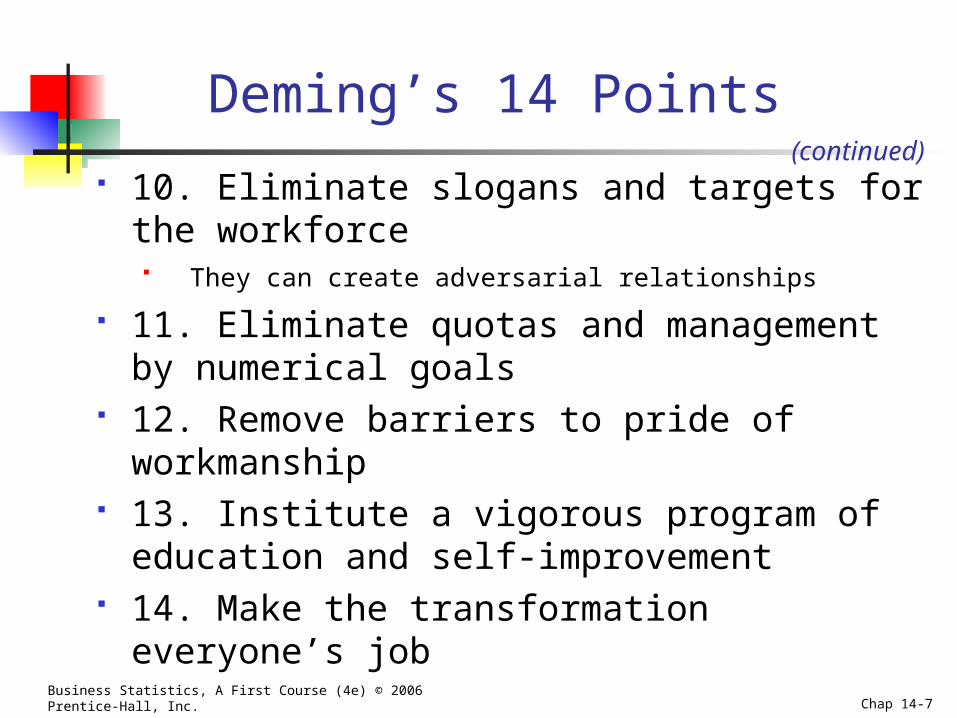
10. Eliminate slogans and targets for the workforce They can create adversarial relationships
11. Eliminate quotas and management by numerical goals
12. Remove barriers to pride of workmanship 13. Institute a vigorous program of education
and self-improvement 14. Make the transformation everyone’s job
(continued)
Deming’s 14 Points
Business Statistics, A First Course (4e) © 2006 Prentice-Hall, Inc. Chap 14-8
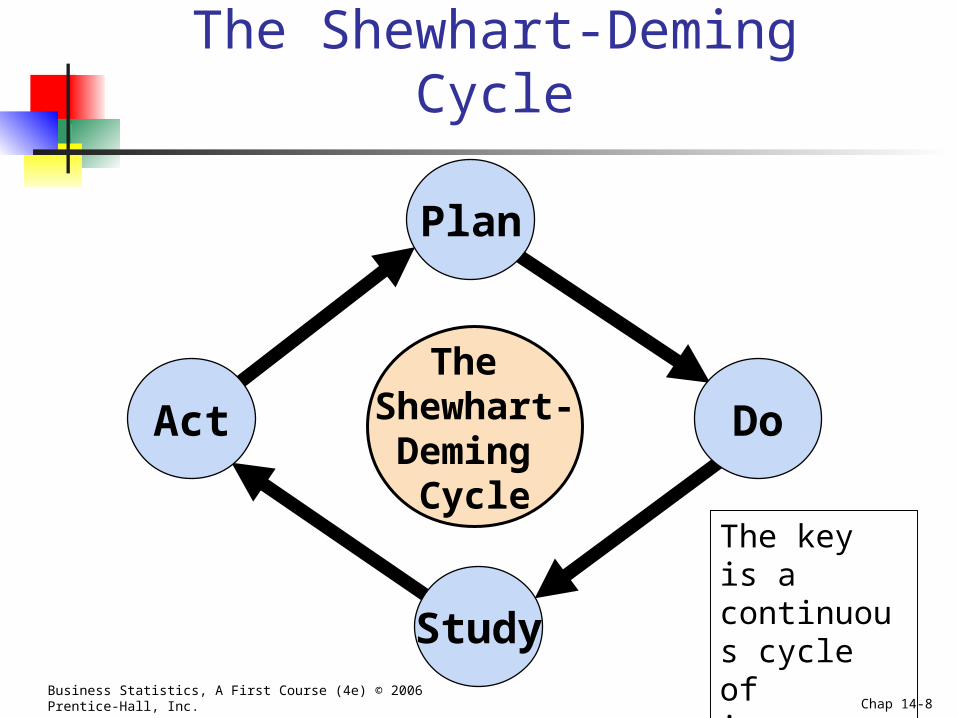
The Shewhart-Deming Cycle
The Shewhart-Deming
CycleThe key is a continuous cycle of improvement
Act
Plan
Do
Study
Business Statistics, A First Course (4e) © 2006 Prentice-Hall, Inc. Chap 14-9
Six Sigma Management
A method for breaking a process into a series of steps:
The goal is to reduce defects and produce near perfect results
The Six Sigma approach allows for a shift of as much as 1.5 standard deviations, so is essentially a ±4.5 standard deviation goal
The mean of a normal distribution ±4.5 standard deviations includes all but 3.4 out of a million
Business Statistics, A First Course (4e) © 2006 Prentice-Hall, Inc. Chap 14-10
The Six Sigma DMAIC Model
DMAIC represents Define -- define the problem to be solved; list
costs, benefits, and impact to customer Measure – need consistent measurements for
each Critical-to-Quality characteristic Analyze – find the root causes of defects Improve – use experiments to determine
importance of each Critical-to-Quality variable Control – maintain gains that have been made
Business Statistics, A First Course (4e) © 2006 Prentice-Hall, Inc. Chap 14-11
Theory of Control Charts
A process is a repeatable series of steps leading to a specific goal
Control Charts are used to monitor variation in a measured value from a process
Inherent variation refers to process variation that exists naturally. This variation can be reduced but not eliminated
Business Statistics, A First Course (4e) © 2006 Prentice-Hall, Inc. Chap 14-12
Theory of Control Charts
Control charts indicate when changes in data are due to: Special or assignable causes
Fluctuations not inherent to a process Represents problems to be corrected Data outside control limits or trend
Chance or common causes Inherent random variations Consist of numerous small causes of random
variability
(continued)
Business Statistics, A First Course (4e) © 2006 Prentice-Hall, Inc. Chap 14-13
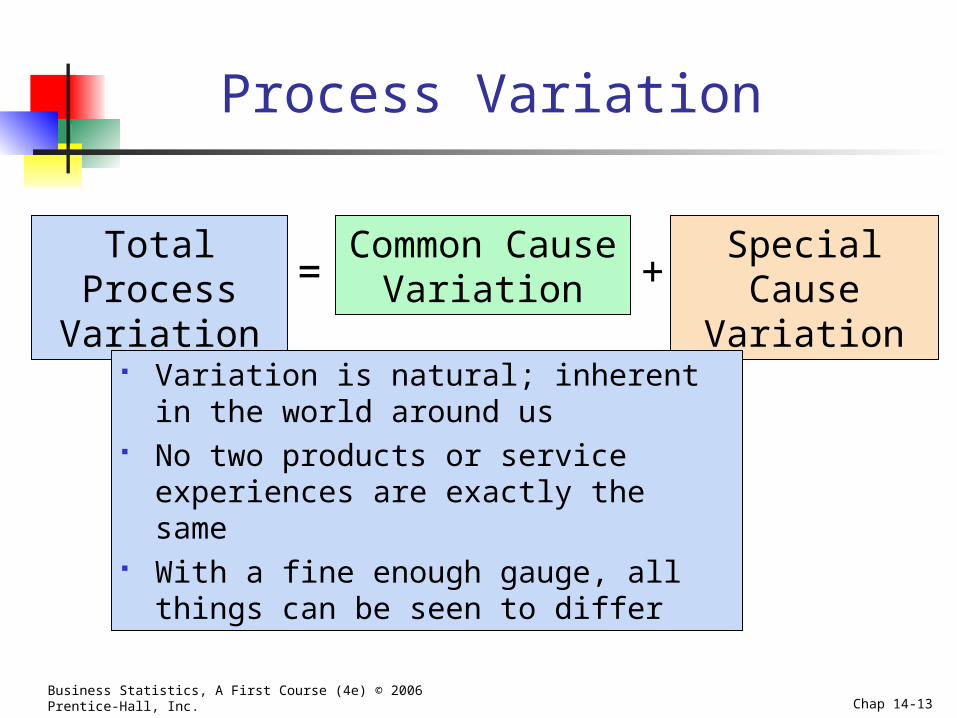
Process Variation
Total Process Variation
Common Cause Variation
Special Cause Variation= +
Variation is natural; inherent in the world around us
No two products or service experiences are exactly the same
With a fine enough gauge, all things can be seen to differ
Business Statistics, A First Course (4e) © 2006 Prentice-Hall, Inc. Chap 14-14
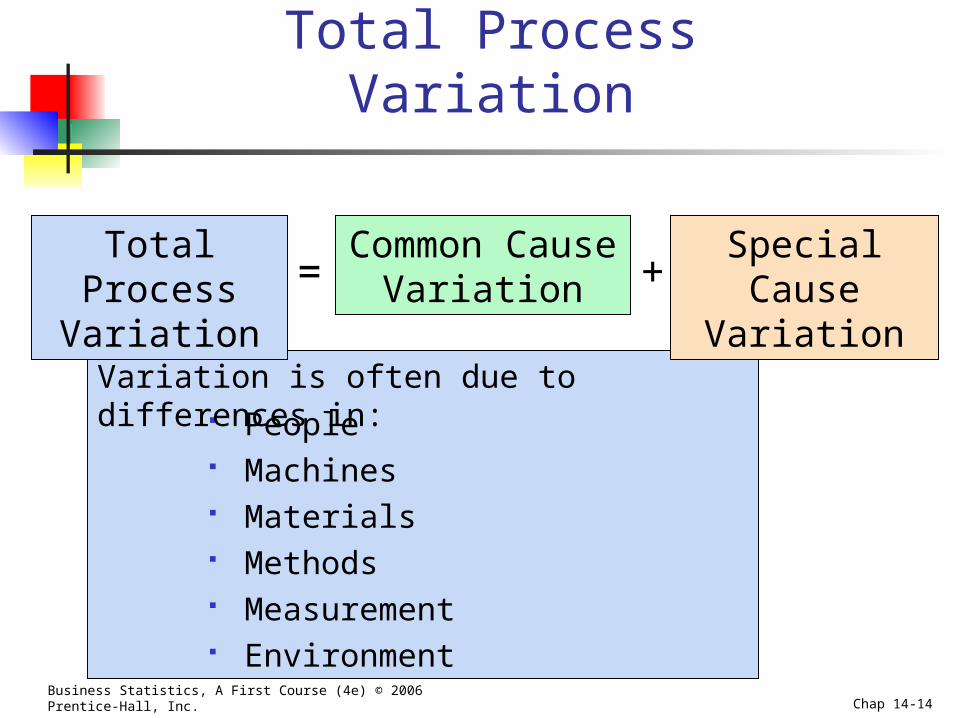
Total Process Variation
Total Process Variation
Common Cause Variation
Special Cause Variation= +
People Machines Materials Methods Measurement Environment
Variation is often due to differences in:
Business Statistics, A First Course (4e) © 2006 Prentice-Hall, Inc. Chap 14-15
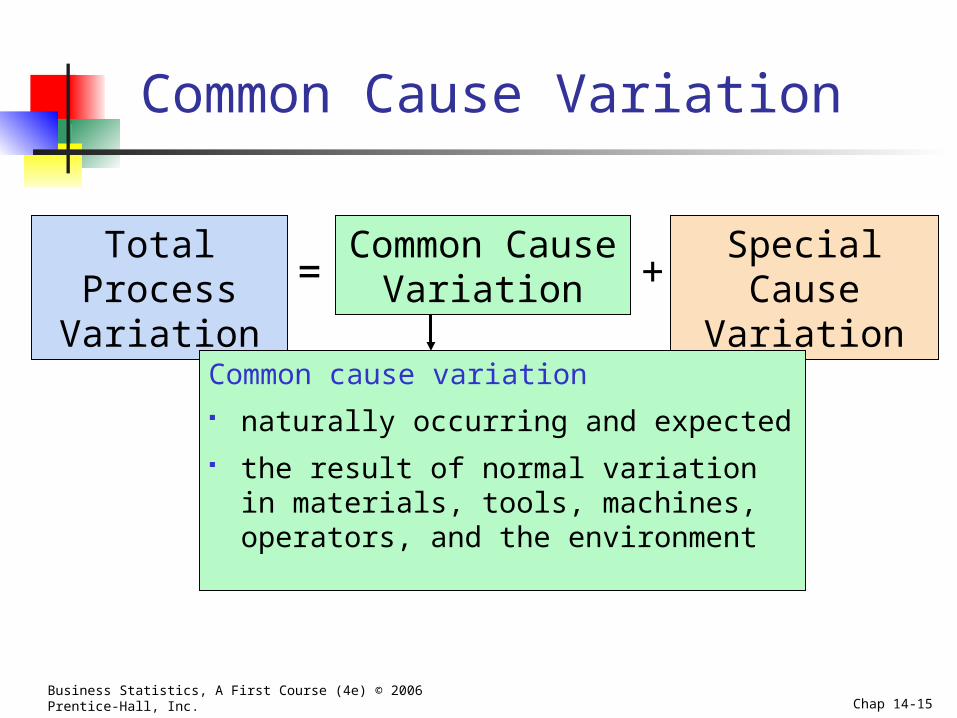
Common Cause Variation
Total Process Variation
Common Cause Variation
Special Cause Variation= +
Common cause variation naturally occurring and expected the result of normal variation in
materials, tools, machines, operators, and the environment
Business Statistics, A First Course (4e) © 2006 Prentice-Hall, Inc. Chap 14-16
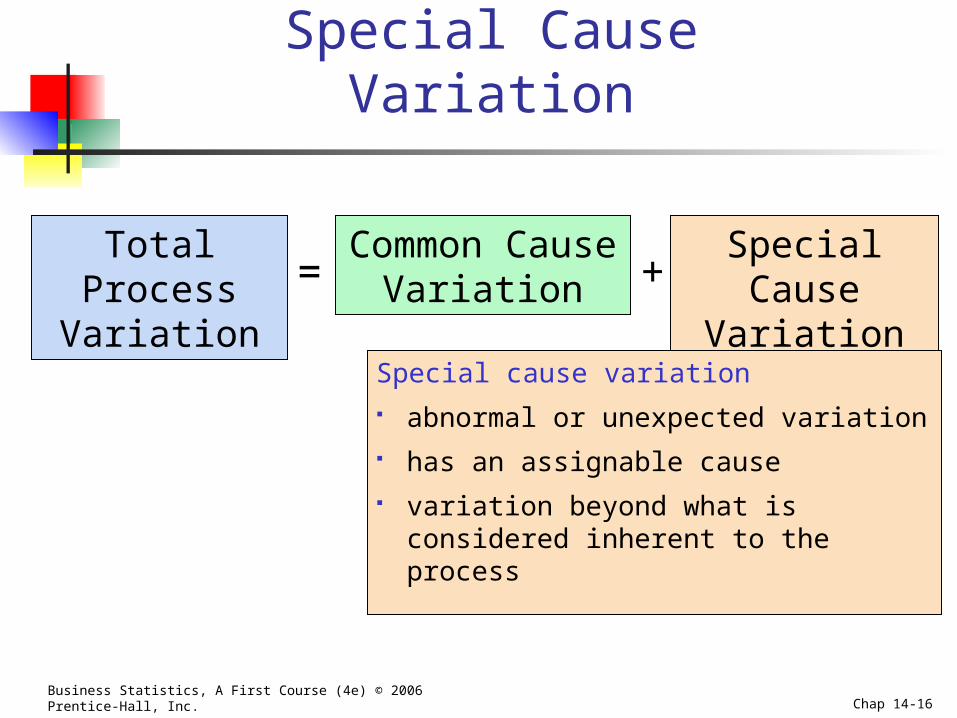
Special Cause Variation
Total Process Variation
Common Cause Variation
Special Cause Variation= +
Special cause variation abnormal or unexpected variation has an assignable cause variation beyond what is considered
inherent to the process
Business Statistics, A First Course (4e) © 2006 Prentice-Hall, Inc. Chap 14-17
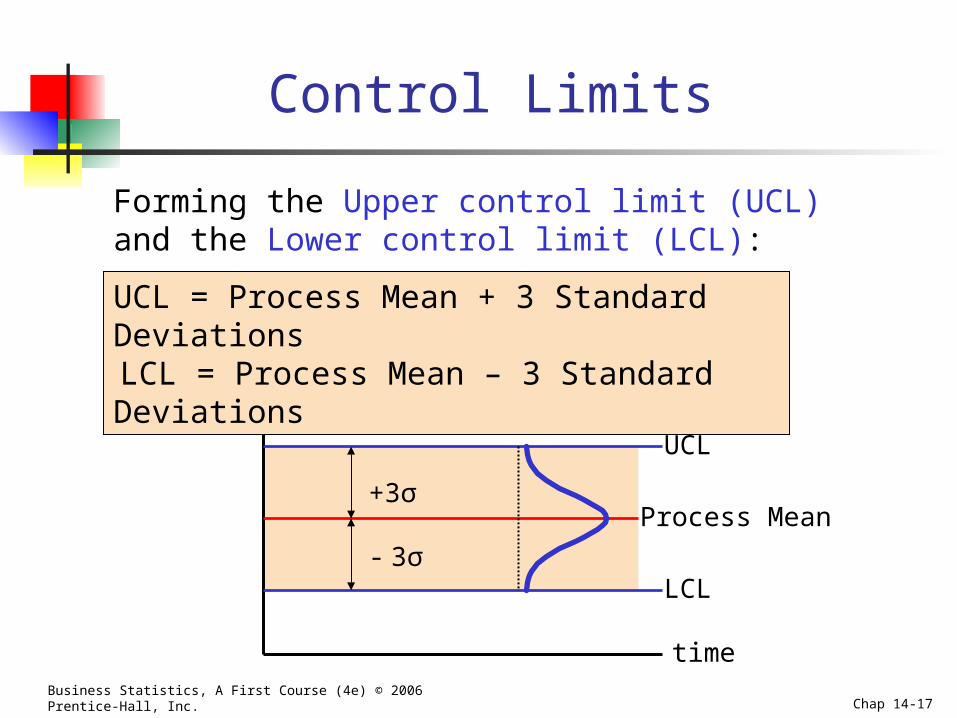
Process Mean
Control Limits
UCL = Process Mean + 3 Standard Deviations LCL = Process Mean – 3 Standard Deviations
UCL
LCL
+3σ
- 3σ
time
Forming the Upper control limit (UCL) and the Lower control limit (LCL):
Business Statistics, A First Course (4e) © 2006 Prentice-Hall, Inc. Chap 14-18
Process Mean
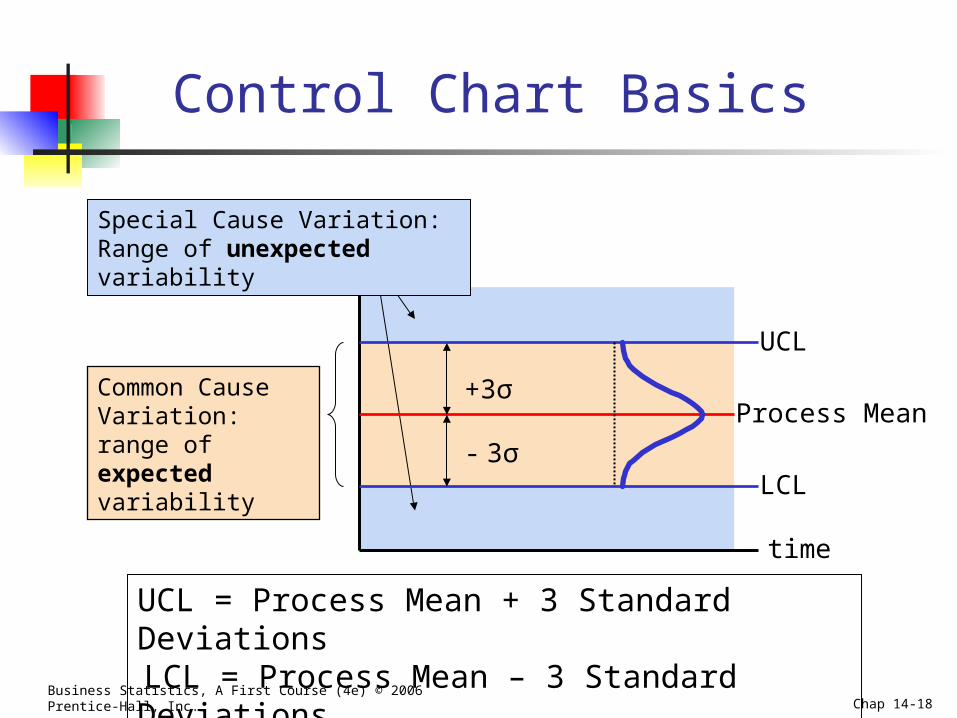
Control Chart Basics
UCL = Process Mean + 3 Standard Deviations LCL = Process Mean – 3 Standard Deviations
UCL
LCL
+3σ
- 3σ
Common Cause Variation: range of expected variability
Special Cause Variation: Range of unexpected variability
time
Business Statistics, A First Course (4e) © 2006 Prentice-Hall, Inc. Chap 14-19
Process Mean
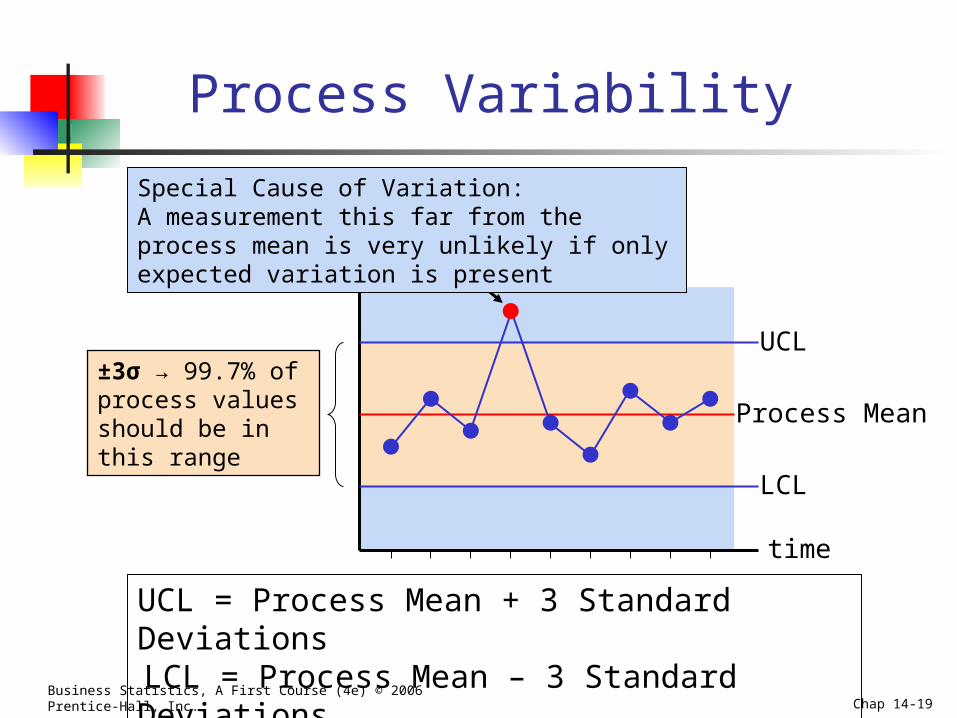
Process Variability
UCL = Process Mean + 3 Standard Deviations LCL = Process Mean – 3 Standard Deviations
UCL
LCL
±3σ → 99.7% of process values should be in this range
time
Special Cause of Variation: A measurement this far from the process mean is very unlikely if only expected variation is present
Business Statistics, A First Course (4e) © 2006 Prentice-Hall, Inc. Chap 14-20
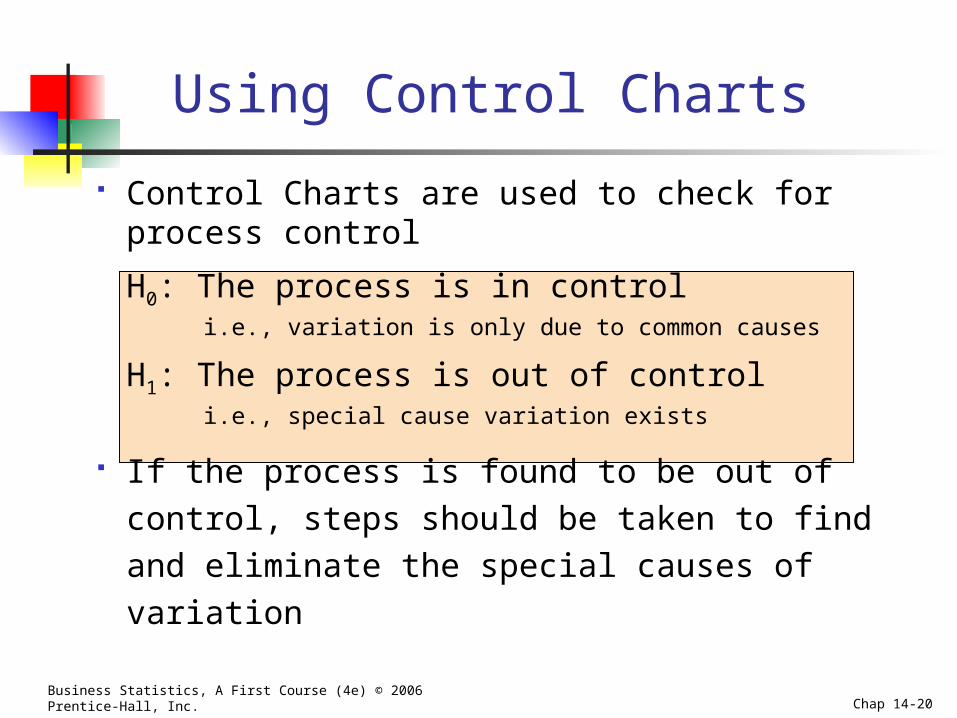
Using Control Charts
Control Charts are used to check for process control
H0: The process is in control i.e., variation is only due to common causes
H1: The process is out of control i.e., special cause variation exists
If the process is found to be out of control,
steps should be taken to find and eliminate the
special causes of variation
Business Statistics, A First Course (4e) © 2006 Prentice-Hall, Inc. Chap 14-21
In-control Process
A process is said to be in control when the control chart does not indicate any out-of-control condition Contains only common causes of variation
If the common causes of variation is small, then control chart can be used to monitor the process
If the common causes of variation is too large, you need to alter the process
Business Statistics, A First Course (4e) © 2006 Prentice-Hall, Inc. Chap 14-22
Process In Control
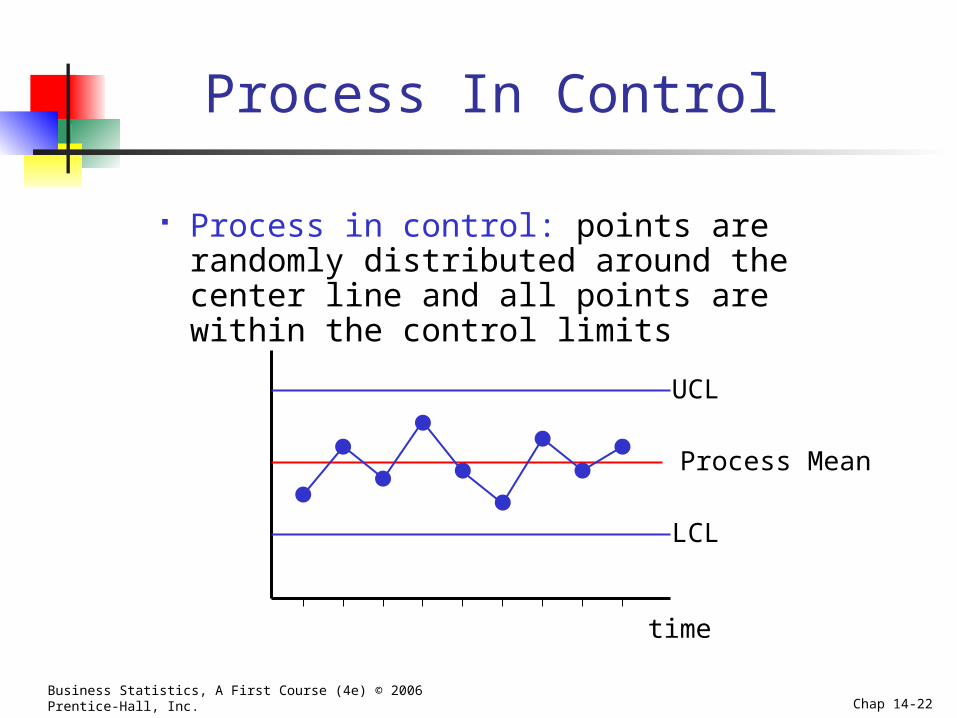
Process in control: points are randomly distributed around the center line and all points are within the control limits
UCL
LCL
time
Process Mean
Business Statistics, A First Course (4e) © 2006 Prentice-Hall, Inc. Chap 14-23
Process Not in Control
Out-of-control conditions:
One or more points outside control limits
8 or more points in a row on one side of the center line
8 or more points moving in the same direction
Business Statistics, A First Course (4e) © 2006 Prentice-Hall, Inc. Chap 14-24
Process Not in Control
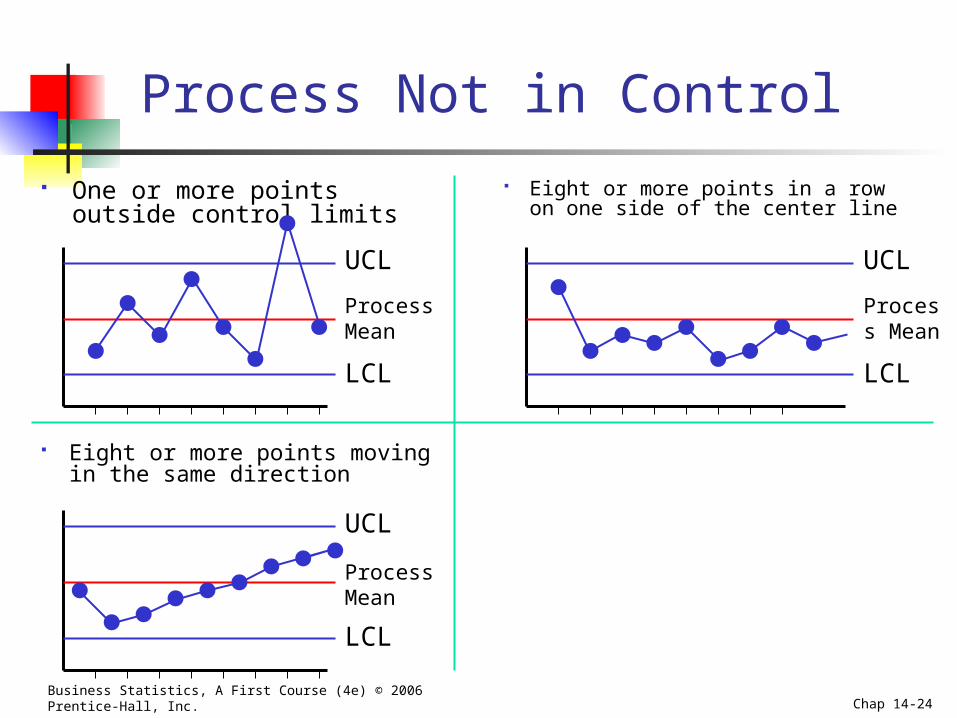
One or more points outside control limits
UCL
LCL
Eight or more points in a row on one side of the center line
UCL
LCL
Eight or more points moving in the same direction
UCL
LCL
Process Mean
Process Mean
Process Mean
Business Statistics, A First Course (4e) © 2006 Prentice-Hall, Inc. Chap 14-25
Out-of-control Processes
When the control chart indicates an out-of-control condition (a point outside the control limits or exhibiting trend, for example) Contains both common causes of variation and
special causes of variation The special causes of variation must be identified
If detrimental to the quality, special causes of variation must be removed
If increases quality, special causes must be incorporated into the process design
Business Statistics, A First Course (4e) © 2006 Prentice-Hall, Inc. Chap 14-26
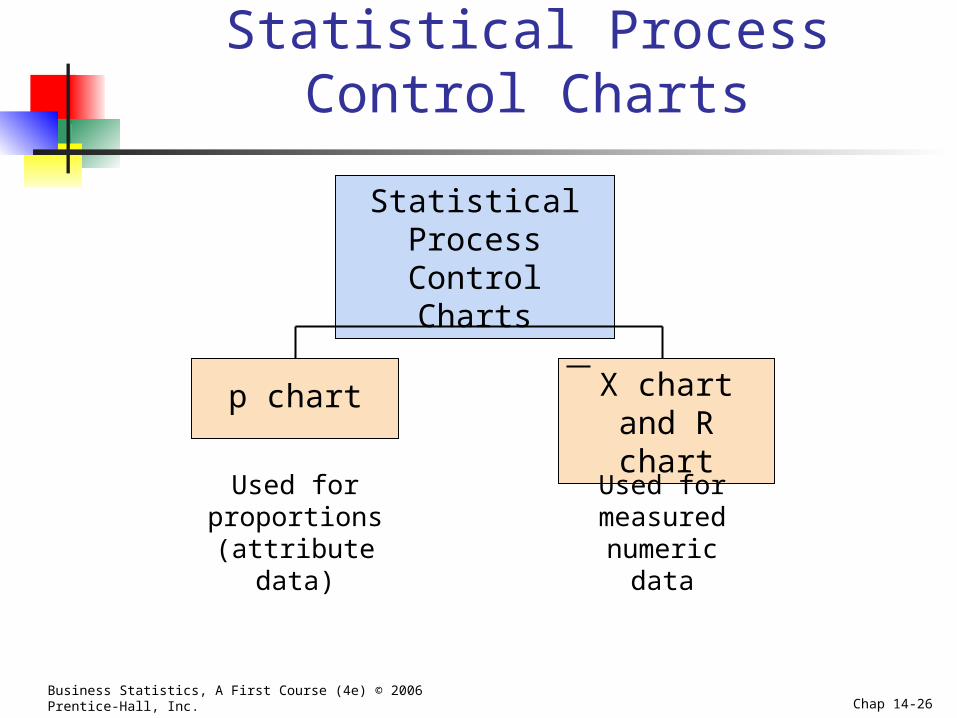
Statistical Process Control Charts
Statistical Process Control
Charts
X chart and R chart
Used for measured
numeric data
Used for proportions
(attribute data)
p chart
Business Statistics, A First Course (4e) © 2006 Prentice-Hall, Inc. Chap 14-27
p Chart
Control chart for proportions Is an attribute chart
Shows proportion of nonconforming items Example -- Computer chips: Count the number of
defective chips and divide by total chips inspected Chip is either defective or not defective Finding a defective chip can be classified a
“success”
Business Statistics, A First Course (4e) © 2006 Prentice-Hall, Inc. Chap 14-28
p Chart
Used with equal or unequal sample sizes (subgroups) over time Unequal sizes should not differ by more than ±25%
from average sample sizes Easier to develop with equal sample sizes
Should have np > 5 and n(1 - p) > 5
(continued)
Business Statistics, A First Course (4e) © 2006 Prentice-Hall, Inc. Chap 14-29
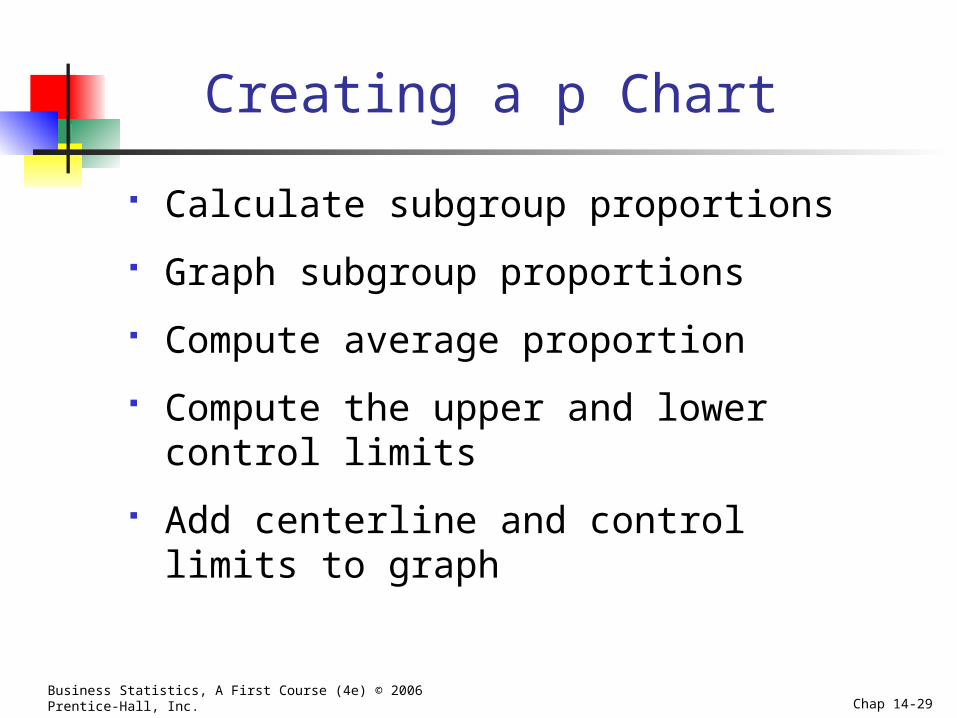
Creating a p Chart
Calculate subgroup proportions
Graph subgroup proportions
Compute average proportion
Compute the upper and lower control limits
Add centerline and control limits to graph
Business Statistics, A First Course (4e) © 2006 Prentice-Hall, Inc. Chap 14-30
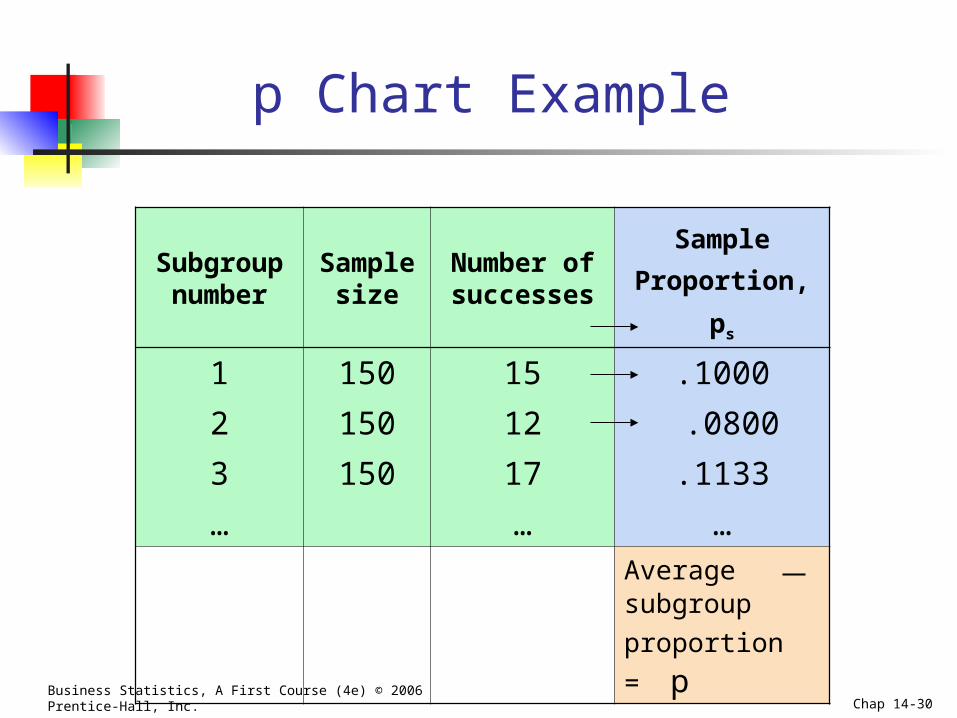
p Chart Example
Subgroup number
Sample size
Number of successes
Sample
Proportion, ps
1
2
3
…
150
150
150
15
12
17
…
.1000
.0800
.1133
…Average subgroup
proportion = p
Business Statistics, A First Course (4e) © 2006 Prentice-Hall, Inc. Chap 14-31
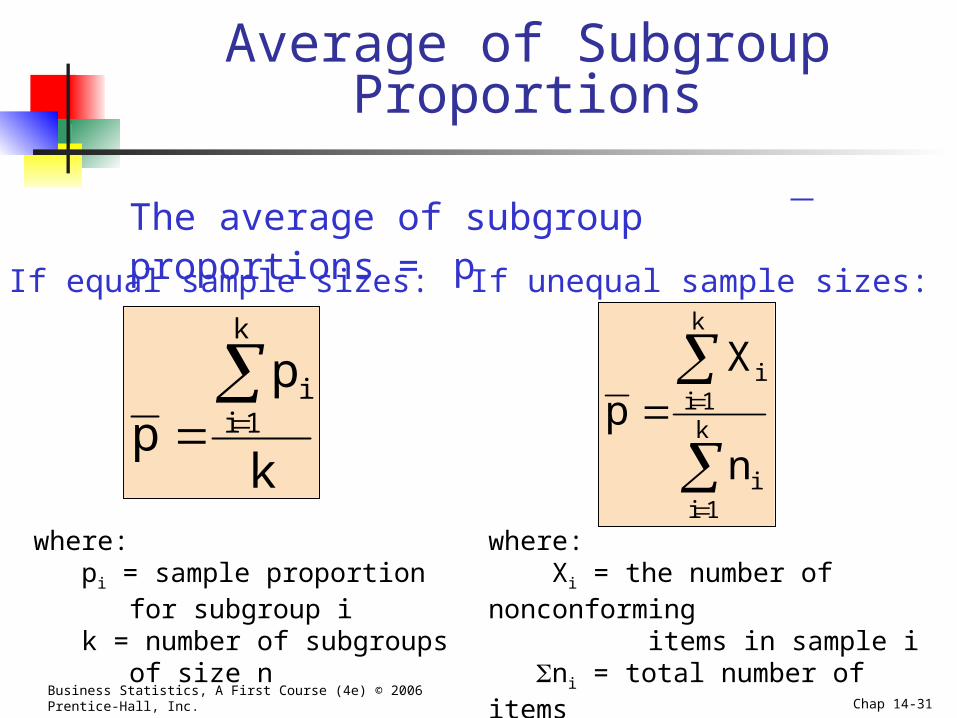
Average of Subgroup Proportions
The average of subgroup proportions = p
where: pi = sample proportion
for subgroup i k = number of subgroups
of size n
where: Xi = the number of nonconforming
items in sample i ni = total number of items
sampled in k samples
If equal sample sizes: If unequal sample sizes:
k
pp
k
1ii
k
1ii
k
1ii
n
Xp
Business Statistics, A First Course (4e) © 2006 Prentice-Hall, Inc. Chap 14-32
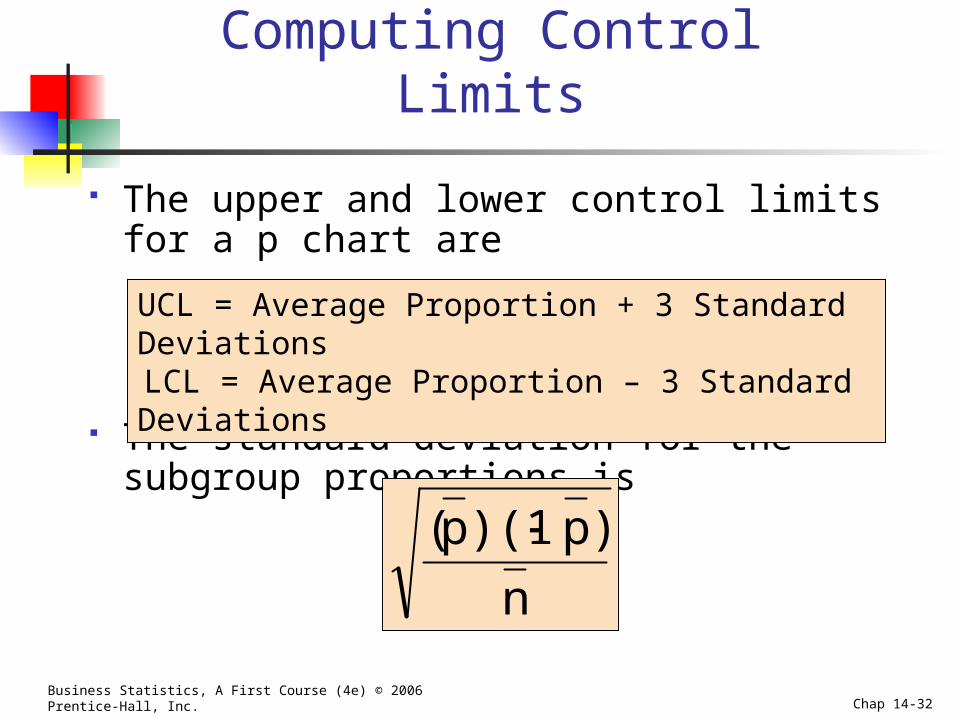
Computing Control Limits
The upper and lower control limits for a p chart are
The standard deviation for the subgroup proportions is
UCL = Average Proportion + 3 Standard Deviations LCL = Average Proportion – 3 Standard Deviations
n
)p)(1p(
Business Statistics, A First Course (4e) © 2006 Prentice-Hall, Inc. Chap 14-33
Computing Control Limits
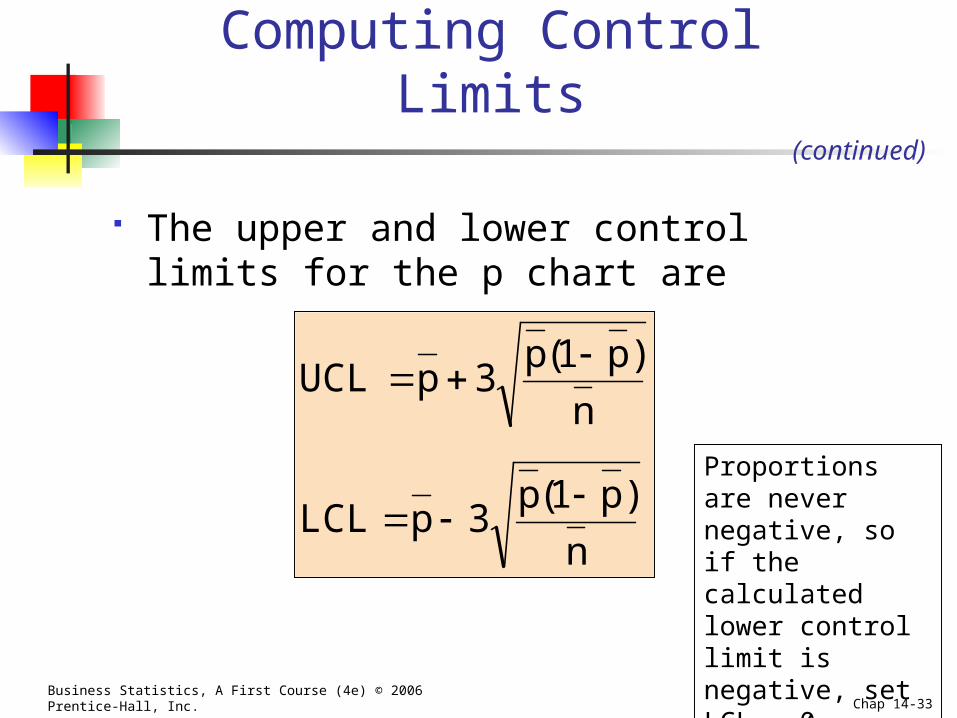
The upper and lower control limits for the p chart are
(continued)
n
)p1(p3pLCL
n
)p1(p3pUCL
Proportions are never negative, so if the calculated lower control limit is negative, set LCL = 0
Business Statistics, A First Course (4e) © 2006 Prentice-Hall, Inc. Chap 14-34
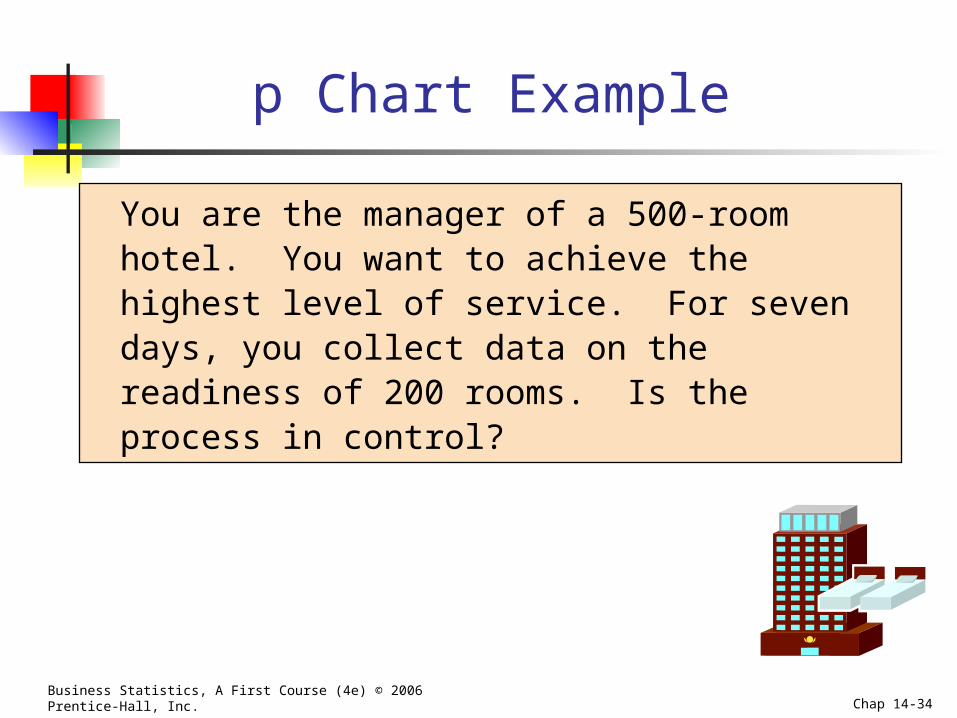
p Chart Example
You are the manager of a 500-room hotel. You want to achieve the highest level of service. For seven days, you collect data on the readiness of 200 rooms. Is the process in control?
Business Statistics, A First Course (4e) © 2006 Prentice-Hall, Inc. Chap 14-35
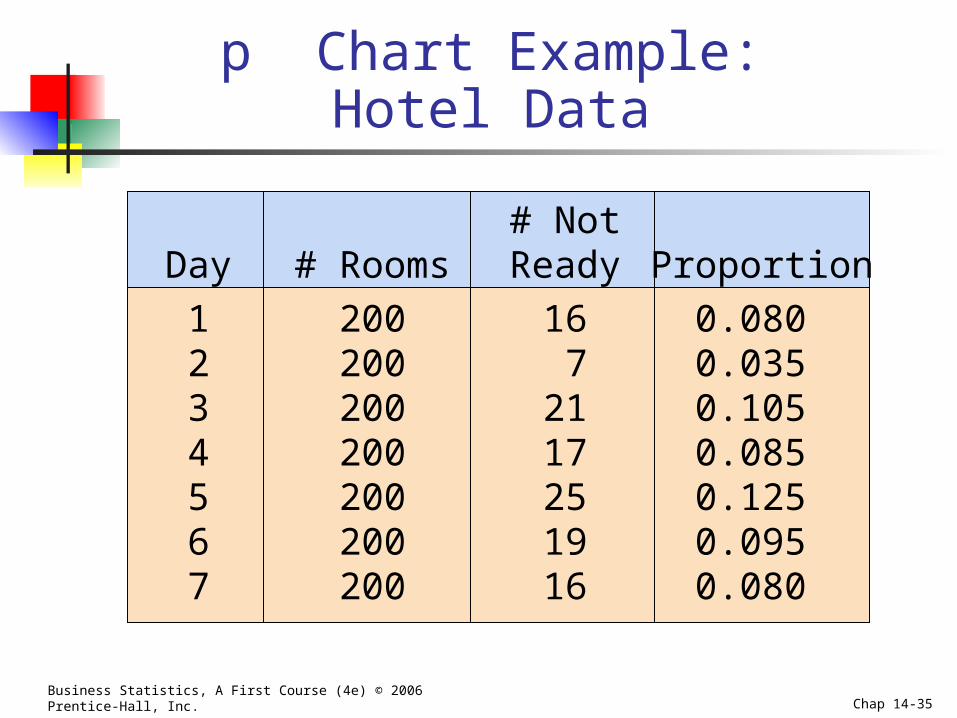
p Chart Example:Hotel Data
# NotDay # Rooms Ready Proportion
1 200 16 0.0802 200 7 0.0353 200 21 0.1054 200 17 0.0855 200 25 0.1256 200 19 0.0957 200 16 0.080
Business Statistics, A First Course (4e) © 2006 Prentice-Hall, Inc. Chap 14-36
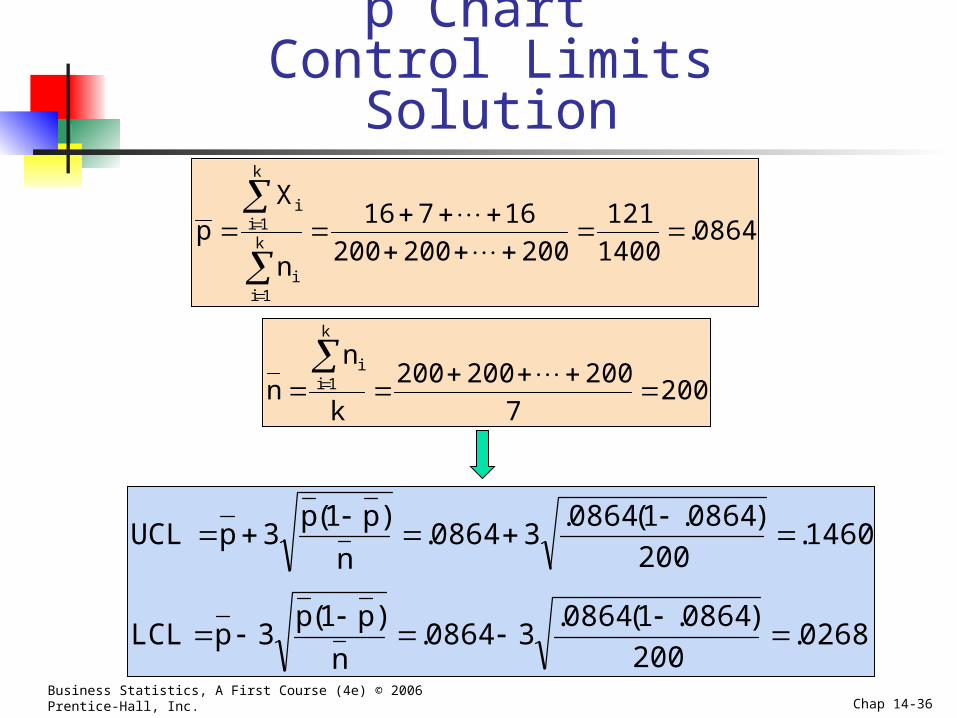
p Chart Control Limits Solution
0864.1400
121
200200200
16716
n
Xp
k
1ii
k
1ii
2007
200200200
k
nn
k
1ii
0268.200
)0864.1(0864.30864.
n
)p1(p3pLCL
1460.200
)0864.1(0864.30864.
n
)p1(p3pUCL
Business Statistics, A First Course (4e) © 2006 Prentice-Hall, Inc. Chap 14-37
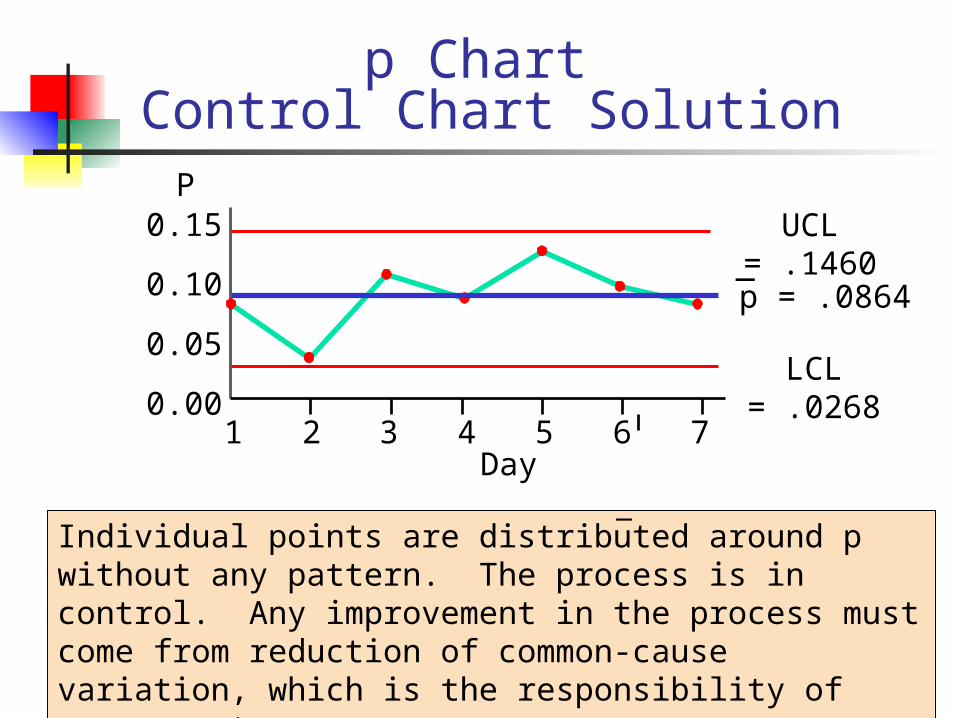
p = .0864
p Chart Control Chart Solution
UCL = .1460
LCL = .02680.00
0.05
0.10
0.15
1 2 3 4 5 6 7
P
Day
Individual points are distributed around p without any pattern. The process is in control. Any improvement in the process must come from reduction of common-cause variation, which is the responsibility of management.
_
_
Business Statistics, A First Course (4e) © 2006 Prentice-Hall, Inc. Chap 14-38
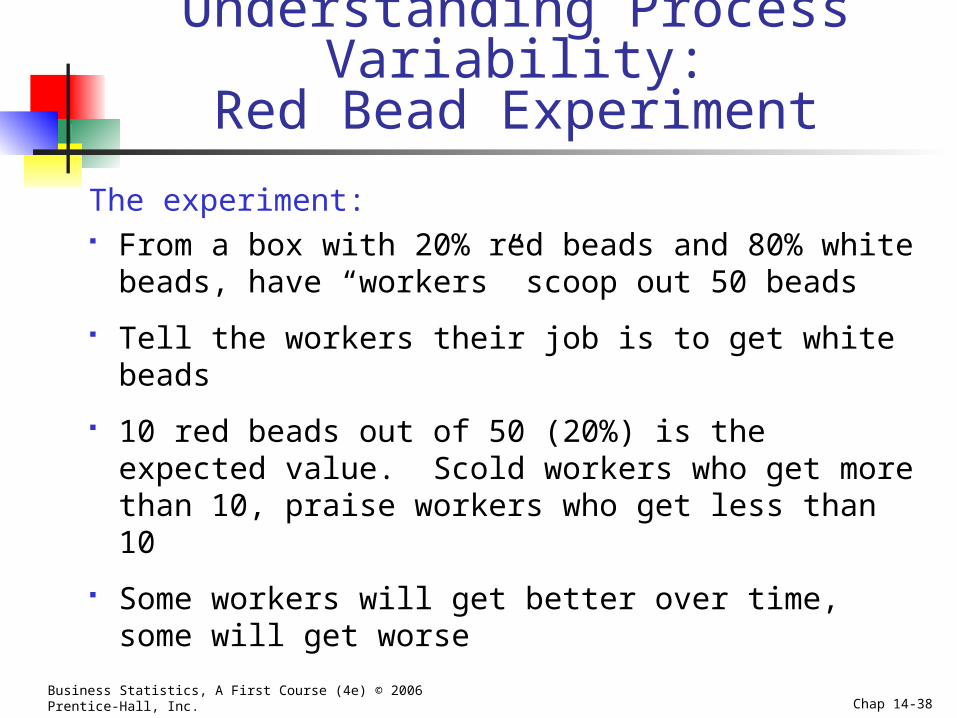
Understanding Process Variability:Red Bead Experiment
The experiment: From a box with 20% red beads and 80% white
beads, have “workers” scoop out 50 beads
Tell the workers their job is to get white beads
10 red beads out of 50 (20%) is the expected value. Scold workers who get more than 10, praise workers who get less than 10
Some workers will get better over time, some will get worse
Business Statistics, A First Course (4e) © 2006 Prentice-Hall, Inc. Chap 14-39
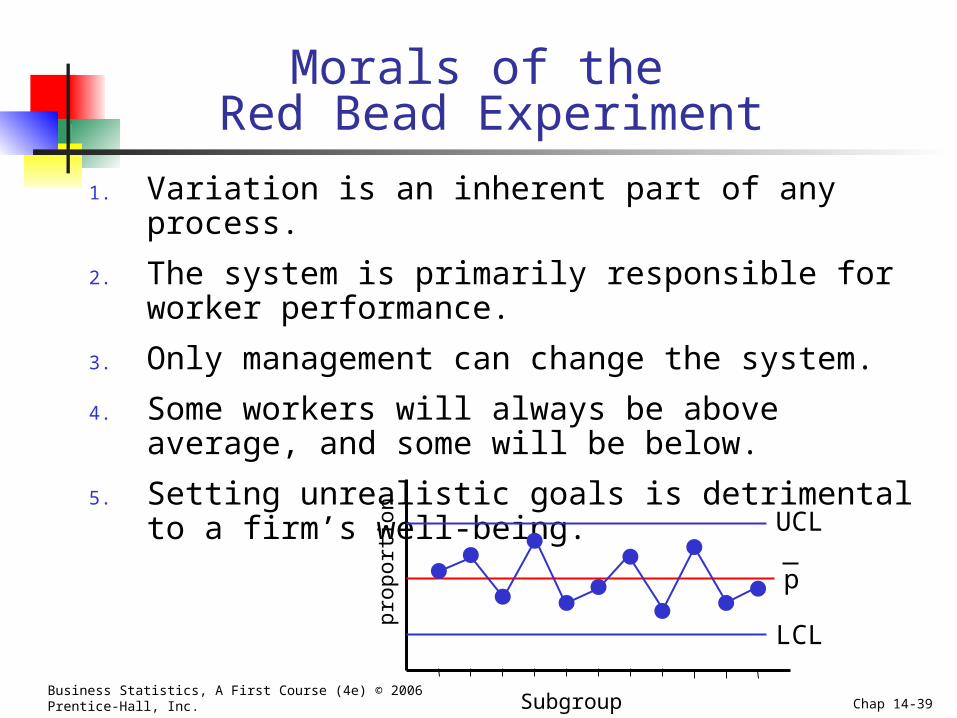
Morals of the Red Bead Experiment
1. Variation is an inherent part of any process.
2. The system is primarily responsible for worker performance.
3. Only management can change the system.
4. Some workers will always be above average, and some will be below.
5. Setting unrealistic goals is detrimental to a firm’s well-being.
UCL
LCL
p
prop
ortio
n
Subgroup number
Business Statistics, A First Course (4e) © 2006 Prentice-Hall, Inc. Chap 14-40
R chart and X chart
Used for measured numeric data from a process
Start with at least 20 subgroups of observed values
Subgroups usually contain 3 to 6 observations each
For the process to be in control, both the R chart and the X-bar chart must be in control
Business Statistics, A First Course (4e) © 2006 Prentice-Hall, Inc. Chap 14-41
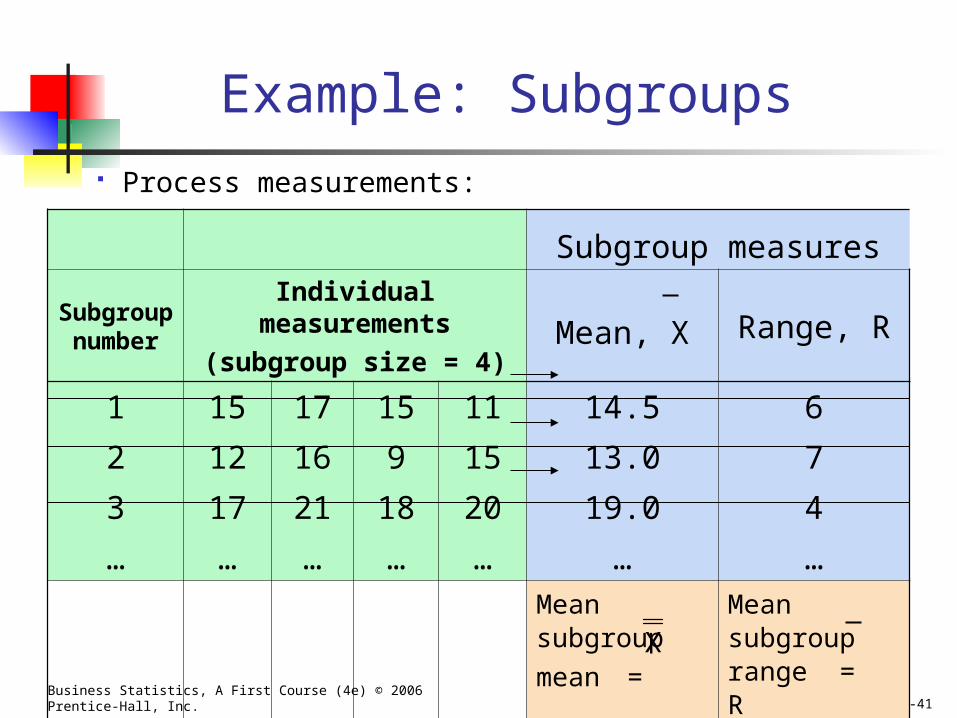
Example: Subgroups
Process measurements:
Subgroup measures
Subgroup number
Individual measurements
(subgroup size = 4) Mean, X Range, R
1
2
3
…
15
12
17
…
17
16
21
…
15
9
18
…
11
15
20
…
14.5
13.0
19.0
…
6
7
4
…Mean subgroup
mean =
Mean subgroup range = RX
Business Statistics, A First Course (4e) © 2006 Prentice-Hall, Inc. Chap 14-42
The R Chart
Monitors dispersion (variability) in a process
The characteristic of interest is measured on a numerical scale
Is a variables control chart
Shows the sample range over time
Range = difference between smallest and largest values in the subgroup
Business Statistics, A First Course (4e) © 2006 Prentice-Hall, Inc. Chap 14-43
Find the mean of the subgroup ranges (the center line of the R chart)
Compute the upper and lower control limits for the R chart
Use lines to show the center and control limits on the R chart
Plot the successive subgroup ranges as a line chart
Steps to create an R chart
Business Statistics, A First Course (4e) © 2006 Prentice-Hall, Inc. Chap 14-44
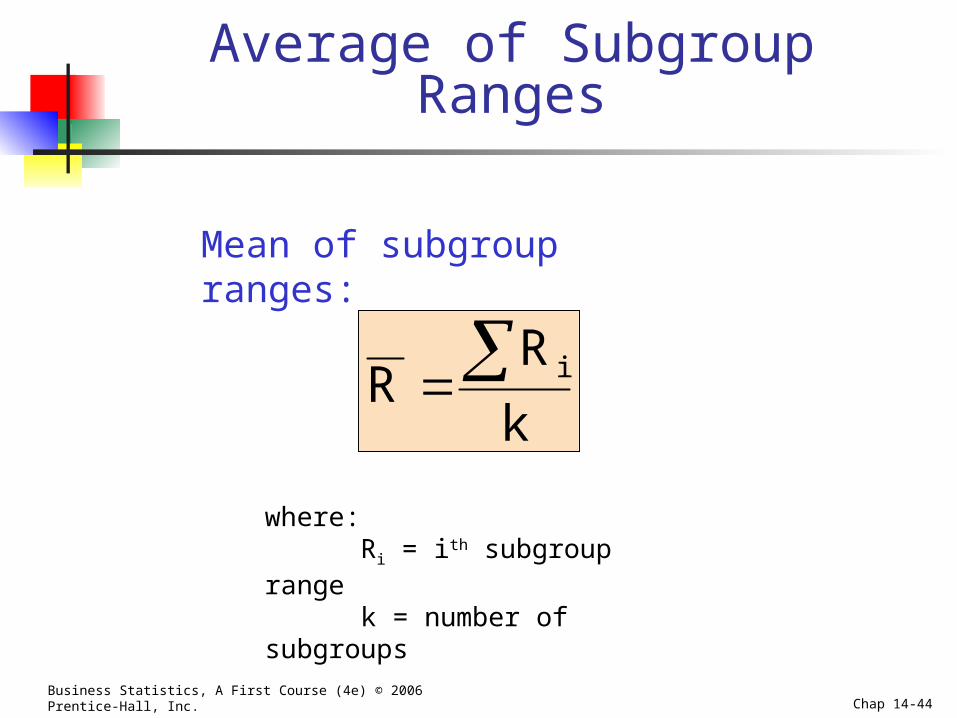
Average of Subgroup Ranges
k
RR i
Mean of subgroup ranges:
where:Ri = ith subgroup range
k = number of subgroups
Business Statistics, A First Course (4e) © 2006 Prentice-Hall, Inc. Chap 14-45
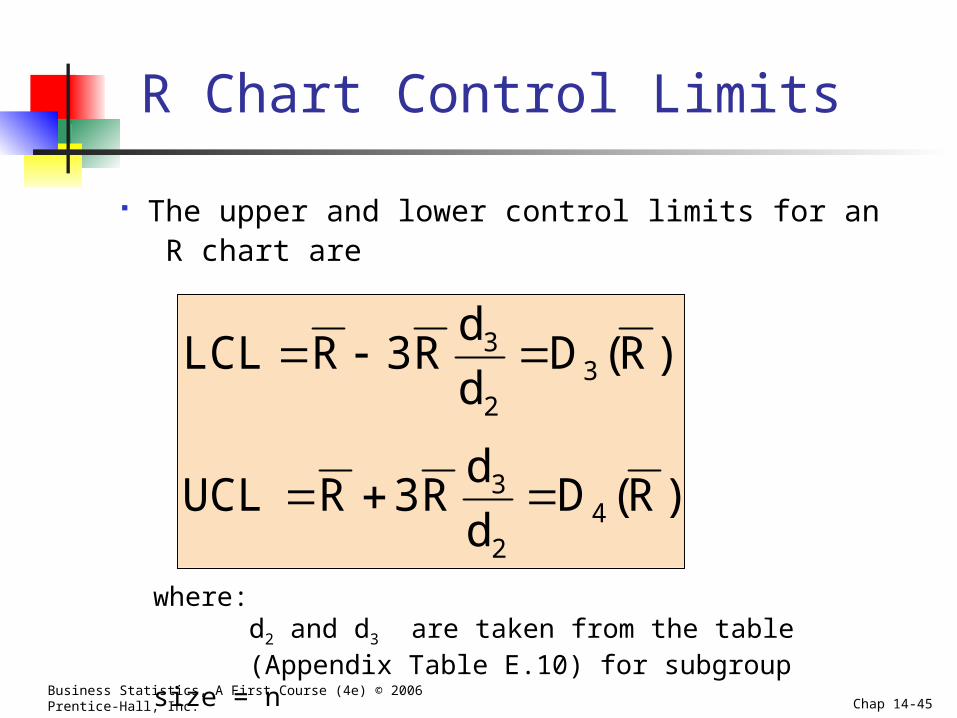
R Chart Control Limits
The upper and lower control limits for an R chart are
)R(Dd
dR3RUCL
)R(Dd
dR3RLCL
42
3
32
3
where:d2 and d3 are taken from the table(Appendix Table E.10) for subgroup size = n
Business Statistics, A First Course (4e) © 2006 Prentice-Hall, Inc. Chap 14-46
R Chart Example
You are the manager of a 500-room hotel. You want to analyze the time it takes to deliver luggage to the room. For 7 days, you collect data on 5 deliveries per day. Is the variation in the process in control?
Business Statistics, A First Course (4e) © 2006 Prentice-Hall, Inc. Chap 14-47
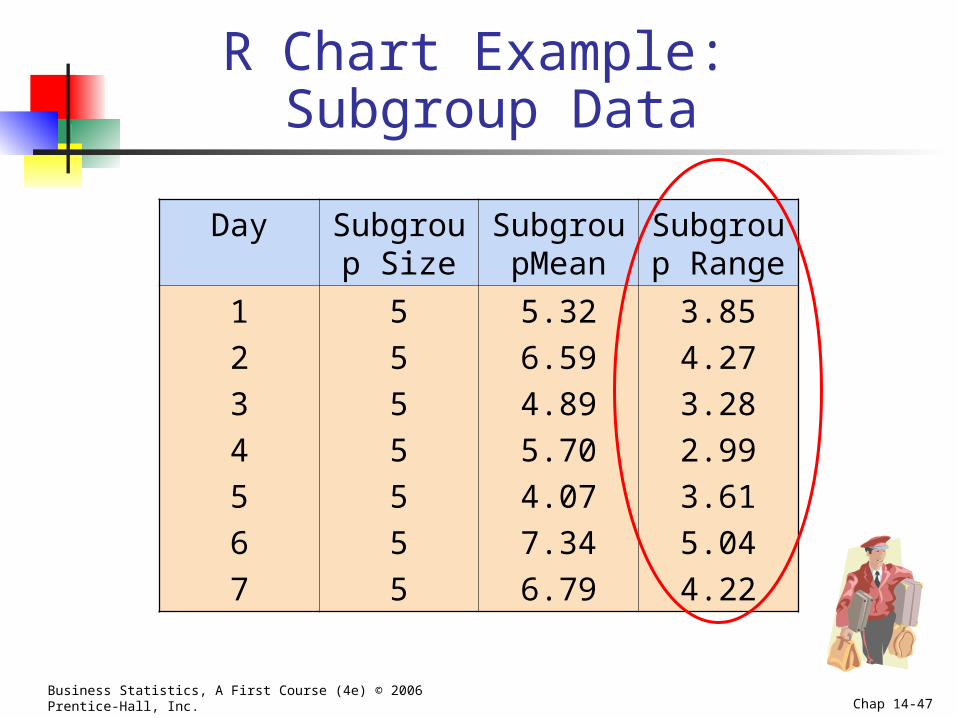
R Chart Example: Subgroup Data
Day Subgroup Size
SubgroupMean
Subgroup Range
1
2
3
4
5
6
7
5
5
5
5
5
5
5
5.32
6.59
4.89
5.70
4.07
7.34
6.79
3.85
4.27
3.28
2.99
3.61
5.04
4.22
Business Statistics, A First Course (4e) © 2006 Prentice-Hall, Inc. Chap 14-48
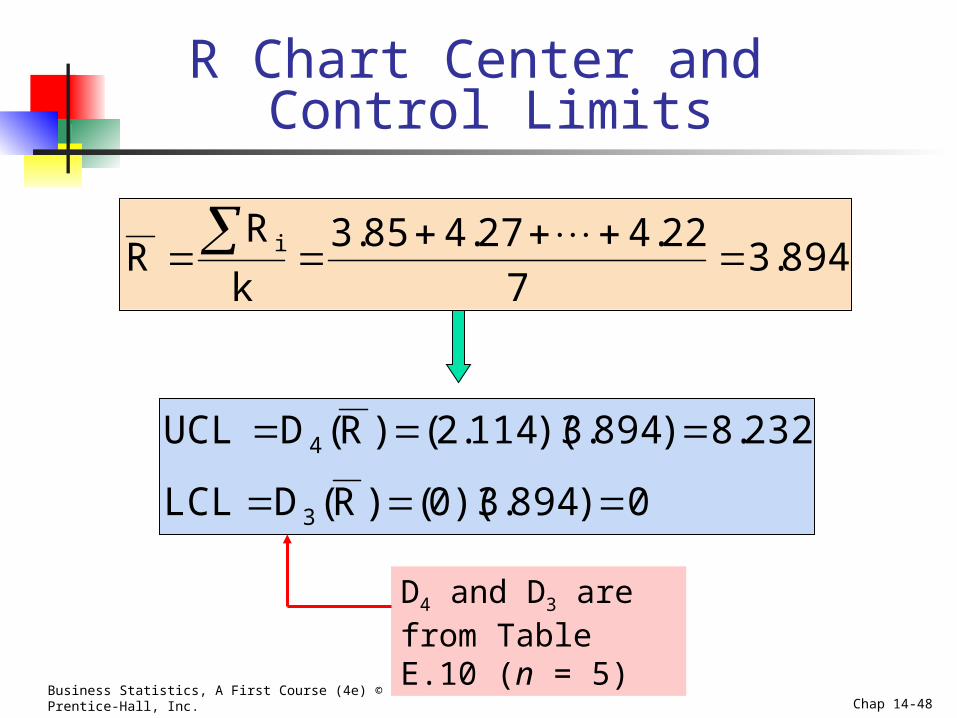
R Chart Center and Control Limits
D4 and D3 are from Table E.10 (n = 5)
894.37
22.427.485.3
k
RR i
0)894.3)(0()R(DLCL
232.8)894.3)(114.2()R(DUCL
3
4
Business Statistics, A First Course (4e) © 2006 Prentice-Hall, Inc. Chap 14-49
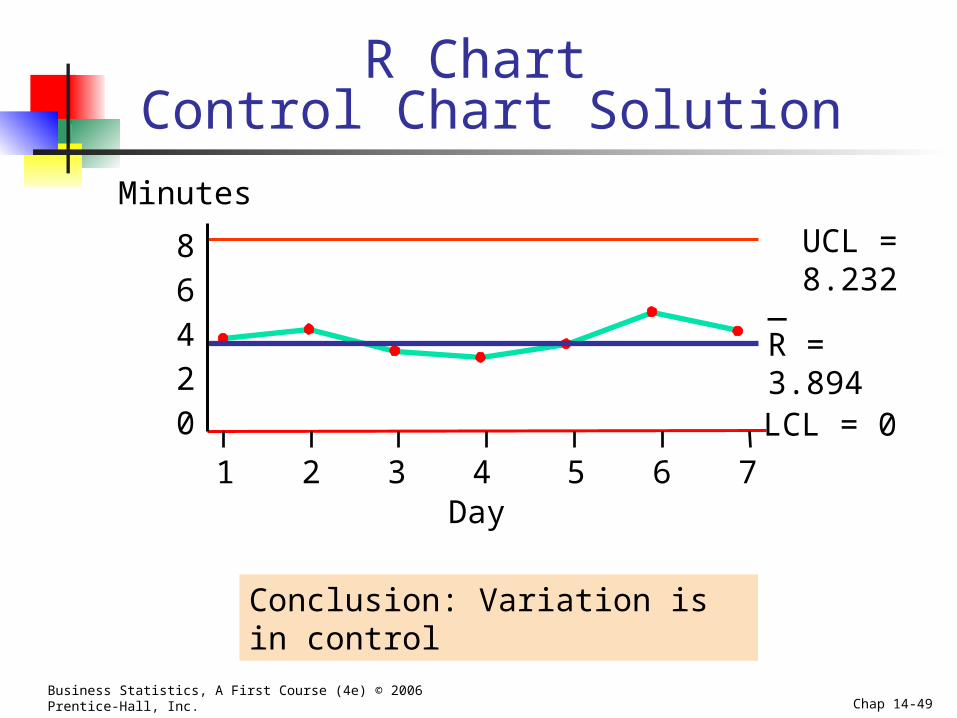
R Chart Control Chart Solution
UCL = 8.232
02468
1 2 3 4 5 6 7
Minutes
Day
LCL = 0
R = 3.894_
Conclusion: Variation is in control
Business Statistics, A First Course (4e) © 2006 Prentice-Hall, Inc. Chap 14-50
The X Chart
Shows the means of successive subgroups over time
Monitors process mean
Must be preceded by examination of the R chart to make sure that the variation in the process is in control
Business Statistics, A First Course (4e) © 2006 Prentice-Hall, Inc. Chap 14-51
Compute the mean of the subgroup means (the center line of the chart)
Compute the upper and lower control limits for the chart
Graph the subgroup means
Add the center line and control limits to the graph
Steps to create an X chart
X
X
Business Statistics, A First Course (4e) © 2006 Prentice-Hall, Inc. Chap 14-52
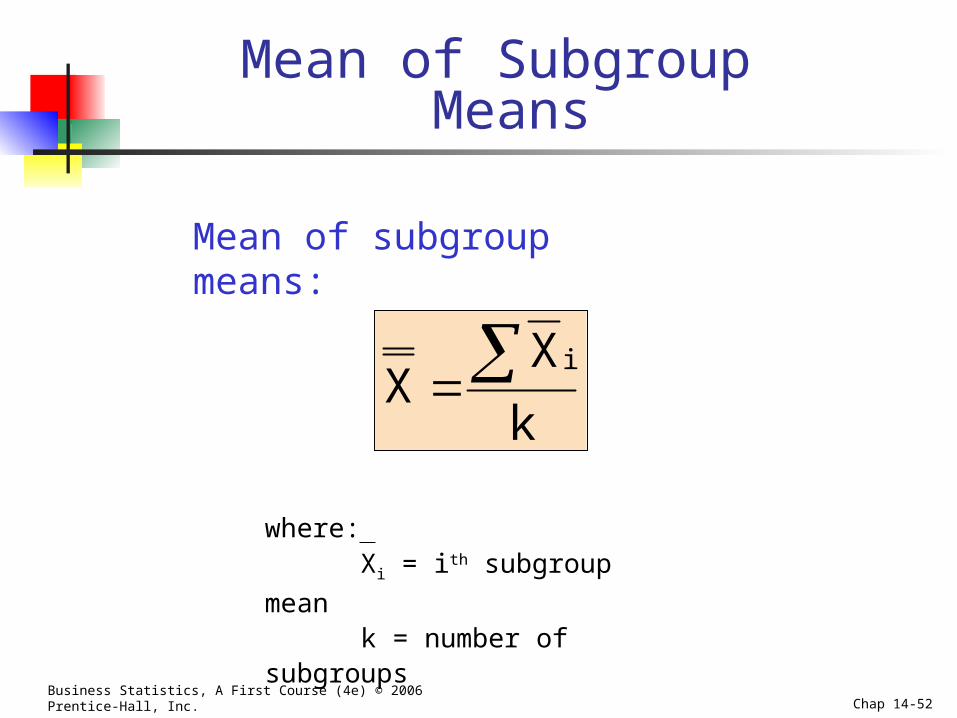
Mean of Subgroup Means
k
XX
i
Mean of subgroup means:
where:Xi = ith subgroup mean
k = number of subgroups
Business Statistics, A First Course (4e) © 2006 Prentice-Hall, Inc. Chap 14-53
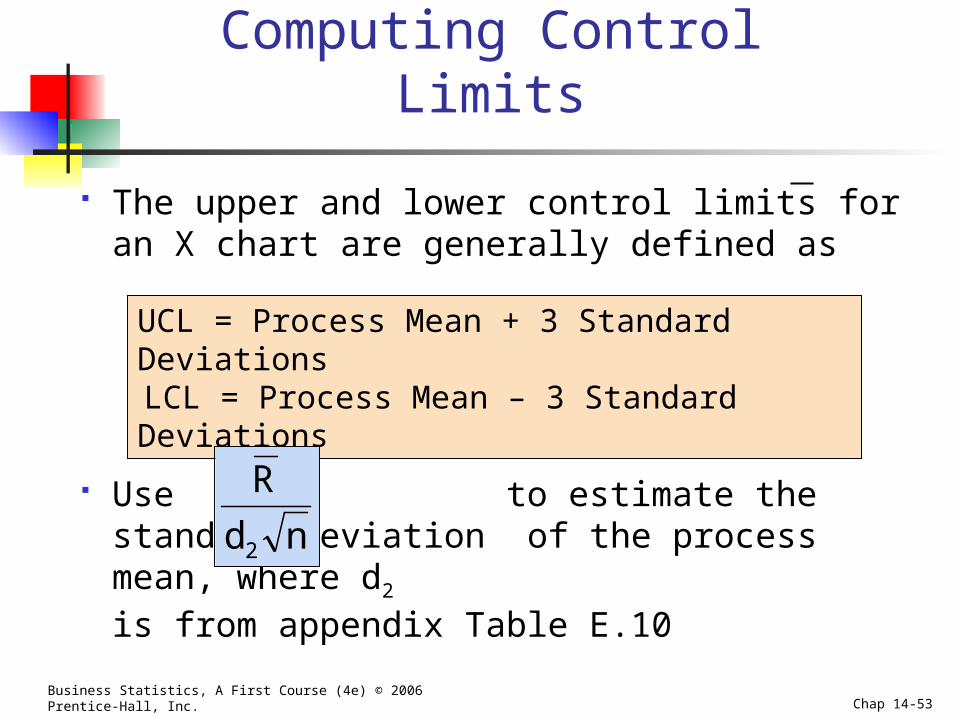
Computing Control Limits
The upper and lower control limits for an X chart are generally defined as
Use to estimate the standard deviation of the process mean, where d2
is from appendix Table E.10
UCL = Process Mean + 3 Standard Deviations LCL = Process Mean – 3 Standard Deviations
nd
R
2
Business Statistics, A First Course (4e) © 2006 Prentice-Hall, Inc. Chap 14-54
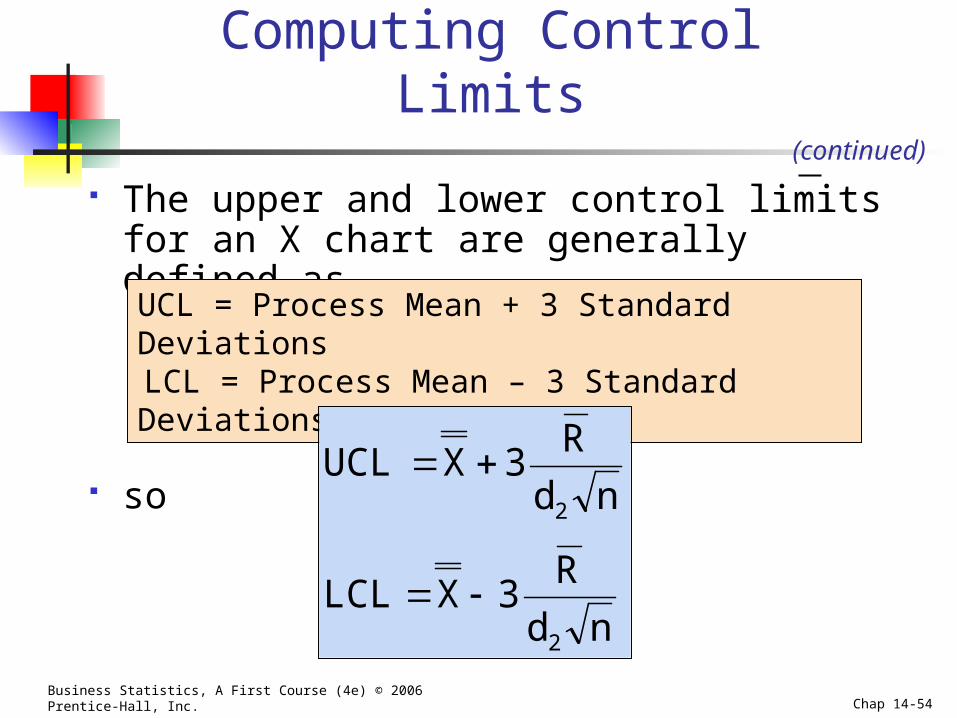
Computing Control Limits
The upper and lower control limits for an X chart are generally defined as
so
UCL = Process Mean + 3 Standard Deviations LCL = Process Mean – 3 Standard Deviations
nd
R3XLCL
nd
R3XUCL
2
2
(continued)
Business Statistics, A First Course (4e) © 2006 Prentice-Hall, Inc. Chap 14-55
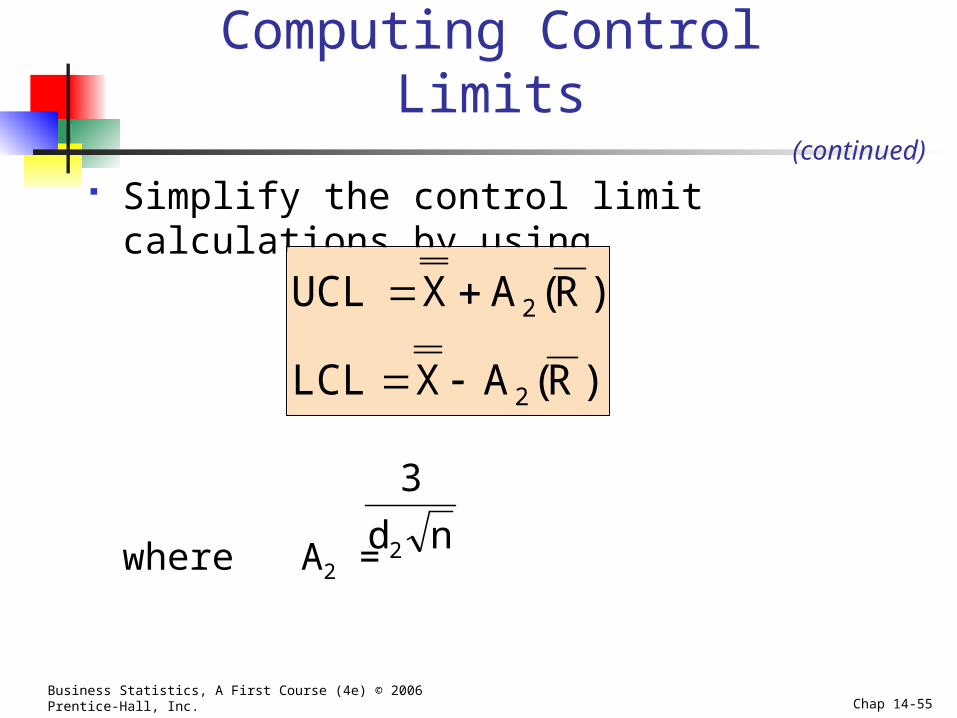
Computing Control Limits
Simplify the control limit calculations by using
where A2 =
)R(AXLCL
)R(AXUCL
2
2
(continued)
nd
3
2
Business Statistics, A First Course (4e) © 2006 Prentice-Hall, Inc. Chap 14-56
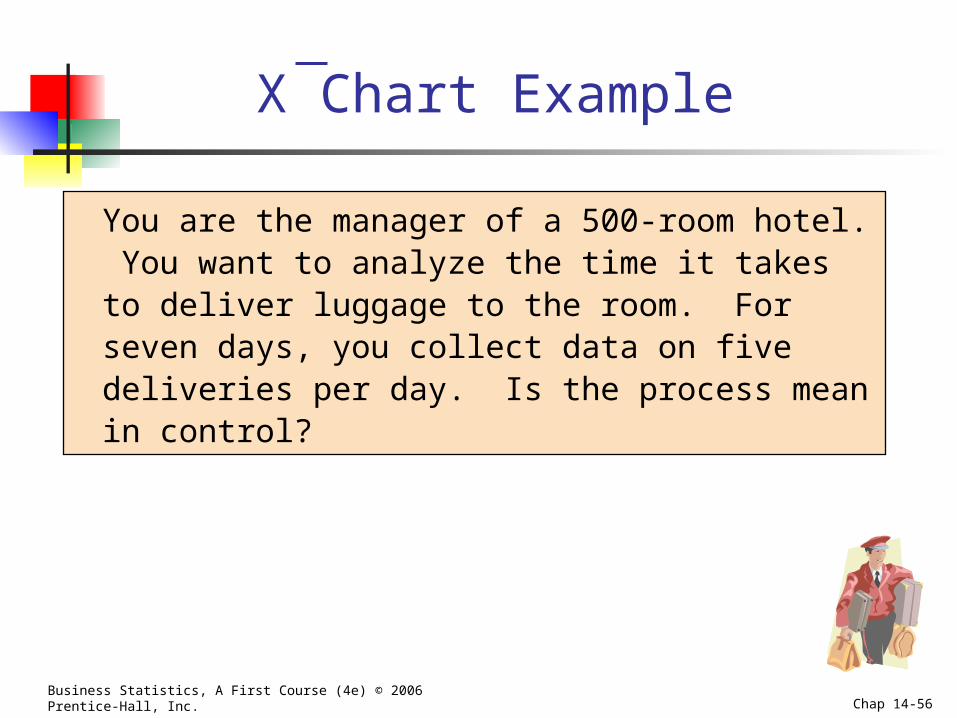
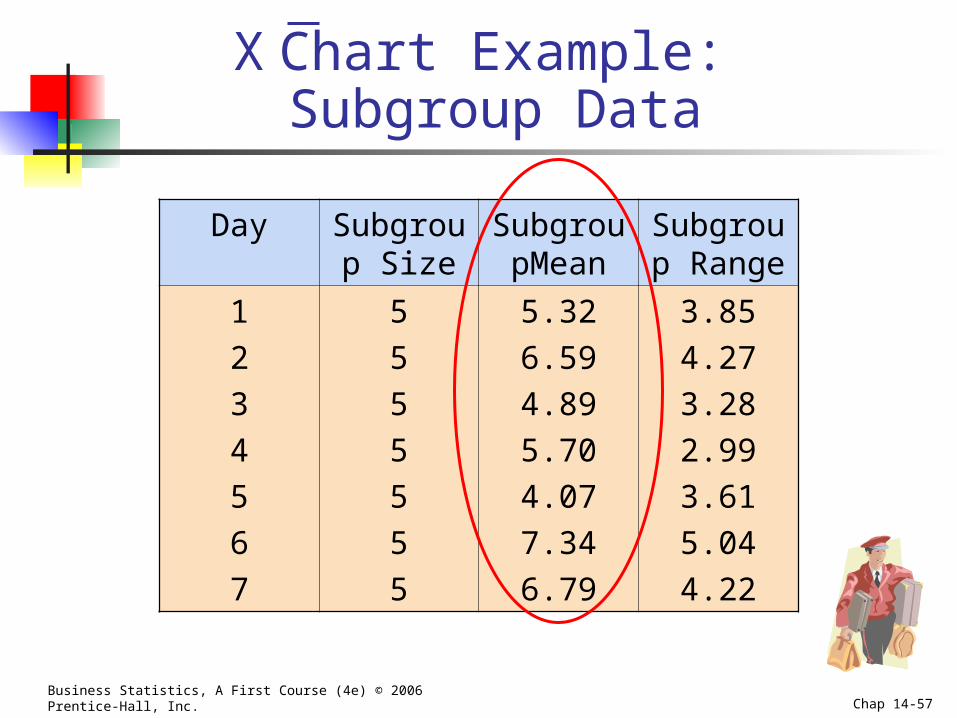
X Chart Example
You are the manager of a 500-room hotel. You want to analyze the time it takes to deliver luggage to the room. For seven days, you collect data on five deliveries per day. Is the process mean in control?
Business Statistics, A First Course (4e) © 2006 Prentice-Hall, Inc. Chap 14-57
X Chart Example: Subgroup Data
Day Subgroup Size
SubgroupMean
Subgroup Range
1
2
3
4
5
6
7
5
5
5
5
5
5
5
5.32
6.59
4.89
5.70
4.07
7.34
6.79
3.85
4.27
3.28
2.99
3.61
5.04
4.22
Business Statistics, A First Course (4e) © 2006 Prentice-Hall, Inc. Chap 14-58
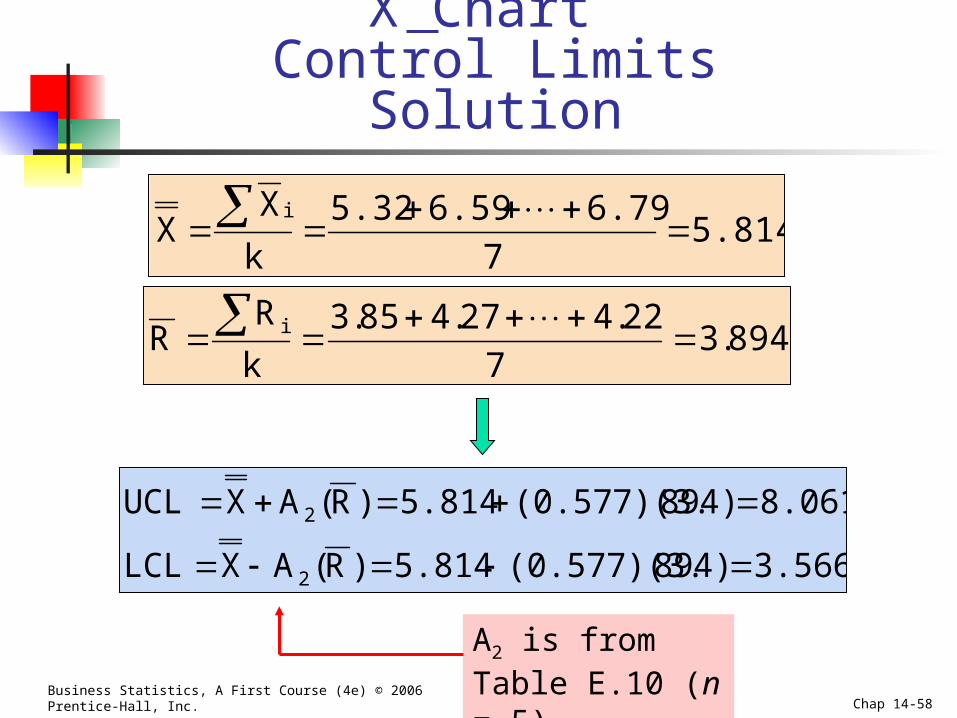
X Chart Control Limits Solution
5.8147
6.796.595.32
k
XX
i
894.37
22.427.485.3
k
RR i
3.566894)(0.577)(3.5.814)R(AXLCL
8.061894)(0.577)(3.5.814)R(AXUCL
2
2
A2 is from Table E.10 (n = 5)
Business Statistics, A First Course (4e) © 2006 Prentice-Hall, Inc. Chap 14-59
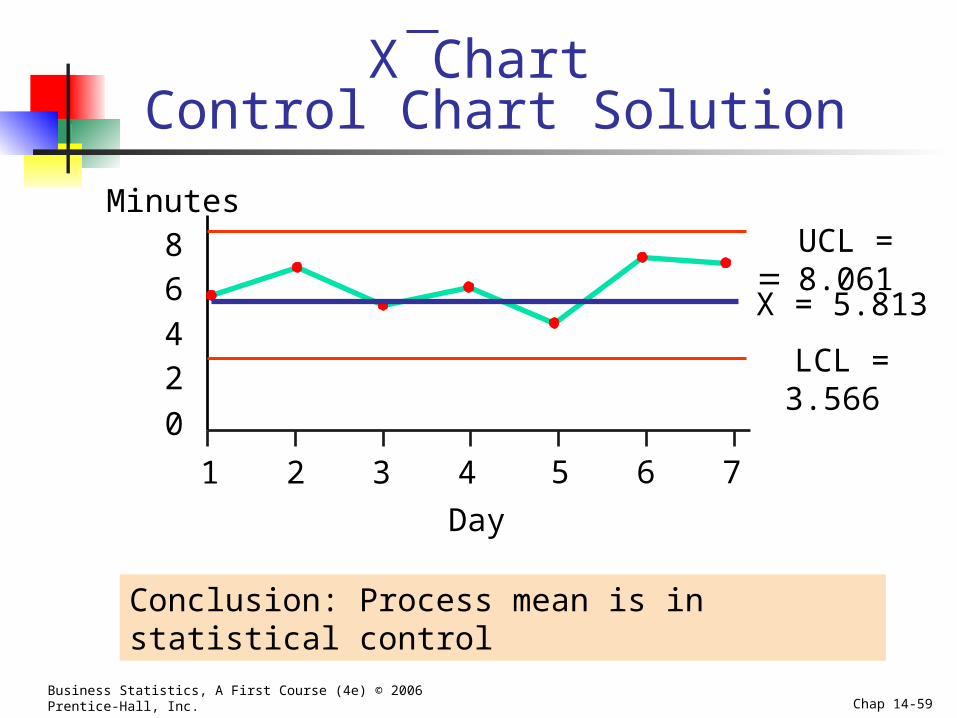
X Chart Control Chart Solution
UCL = 8.061
LCL = 3.566
0
24
68
1 2 3 4 5 6 7
Minutes
Day
X = 5.813__
Conclusion: Process mean is in statistical control
Business Statistics, A First Course (4e) © 2006 Prentice-Hall, Inc. Chap 14-60
Chapter Summary
Reviewed the philosophy of quality management Deming’s 14 points
Discussed Six Sigma Management Reduce defects to no more than 3.4 per million Uses DMAIC model for process improvement
Discussed the theory of control charts Common cause variation vs. special cause variation
Constructed and interpreted p charts Constructed and interpreted X and R charts