Embed Size (px)
Citation preview
7/25/2019 Dickey Fuller
http://slidepdf.com/reader/full/dickey-fuller 1/12
Dickey-Fuller Unit Root Test
(Stationary Test)
First, download the excel formatted data file named "US_cpi_data" from the
"Sample Data" of Econ3600 homepage.
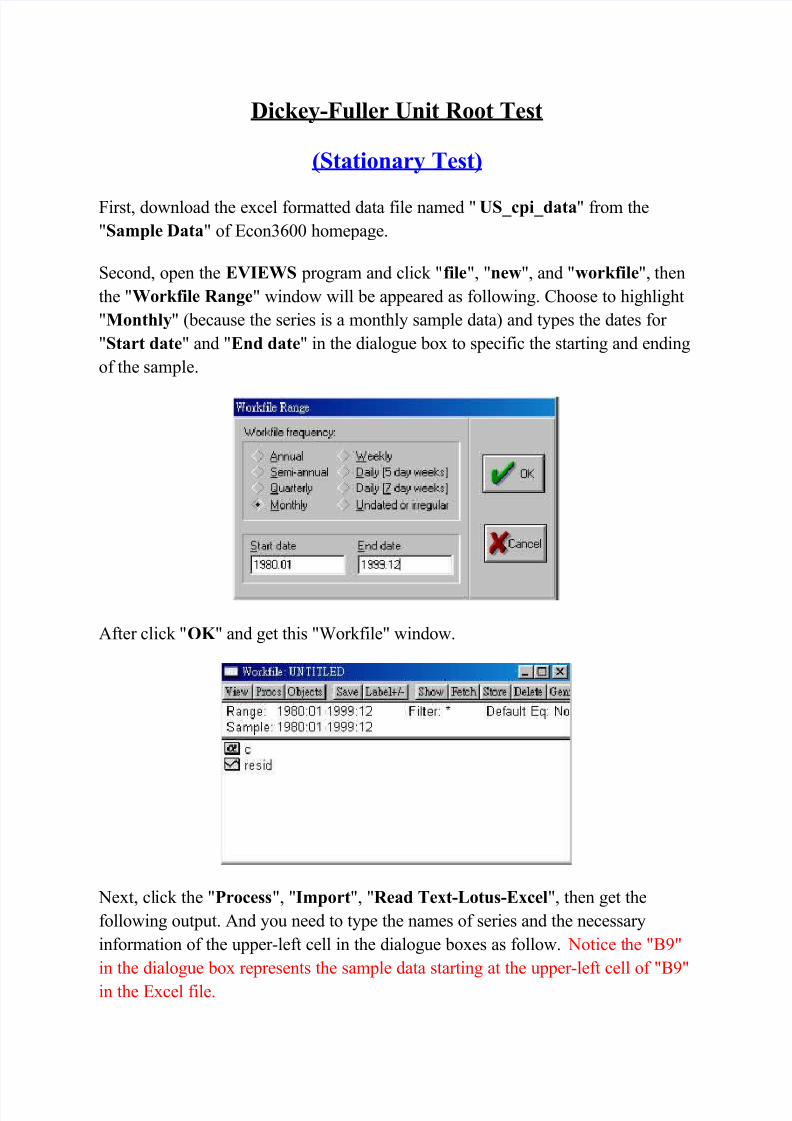
Second, open the EVIEWS program and click "ile", "ne!", and "!orkile", then
the "Workile Ran"e" window will be appeared as following. Choose to highlight
"#ont$ly" beca!se the series is a monthl sample data# and tpes the dates for
"Start date" and "End date" in the dialog!e box to specific the starting and ending
of the sample.
$fter click "%& " and get this "%orkfile" window.
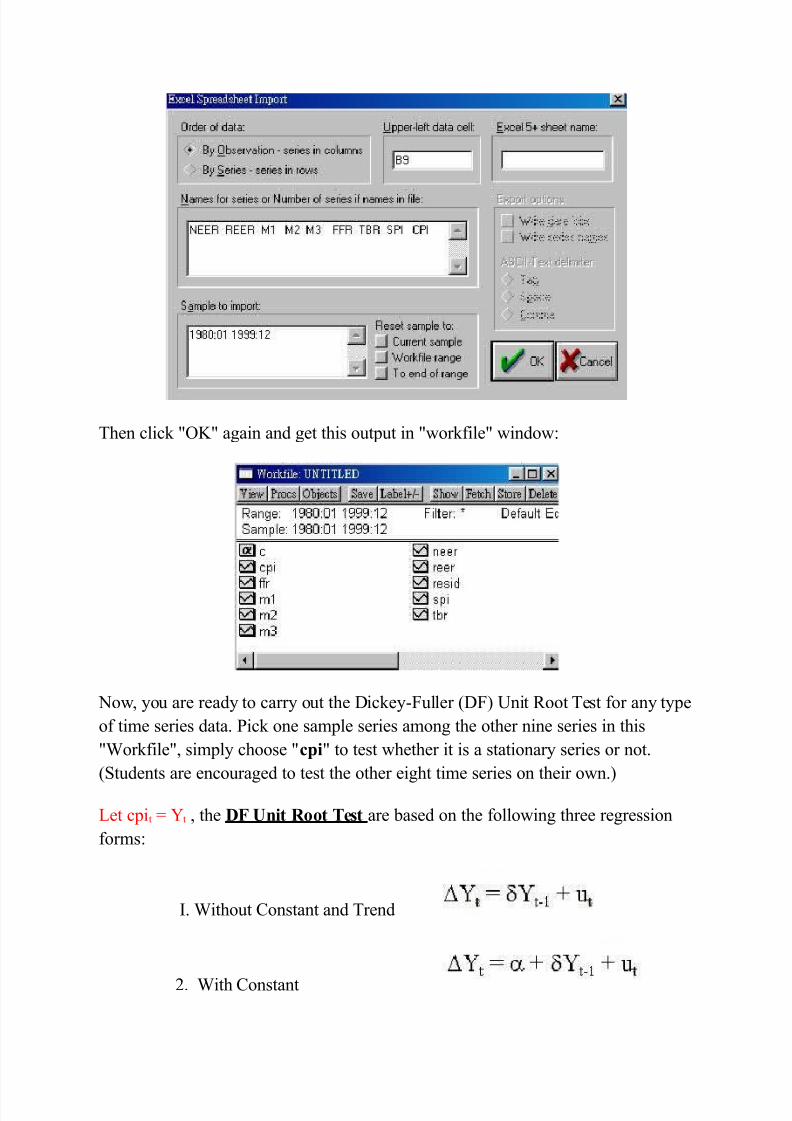
&ext, click the "'rocess", "Import", "Read Tet-otus-Ecel", then get the
following o!tp!t. $nd o! need to tpe the names of series and the necessar
information of the !pper'left cell in the dialog!e boxes as follow. &otice the "()"
in the dialog!e box represents the sample data starting at the !pper'left cell of "()"
in the Excel file.
7/25/2019 Dickey Fuller
http://slidepdf.com/reader/full/dickey-fuller 2/12
*hen click "+" again and get this o!tp!t in "workfile" window-
&ow, o! are read to carr o!t the icke'F!ller F# /nit oot *est for an tpe
of time series data. 1ick one sample series among the other nine series in this
"%orkfile", simpl choose "cpi" to test whether it is a stationar series or not.
St!dents are enco!raged to test the other eight time series on their own.#
2et cpit 4t , the DF Unit Root Test are based on the following three regression
forms-
5. %itho!t Constant and *rend
. %ith Constant
7/25/2019 Dickey Fuller
http://slidepdf.com/reader/full/dickey-fuller 3/12
3. %ith Constant and
*rend
*he hpothesis is-
ecision r!le-
5f t7 8 $F crtitical 9al!e, 8 not re:ect n!ll hpothesis, i.e., !nit root exists.
5f t7 ; $F critical 9al!e, 8 re:ect n!ll hpothesis, i.e., !nit root does not
exist.
!n each regression e<!ation separatel-
I* For testing the first regression e<!ation , the steps are
as follows-
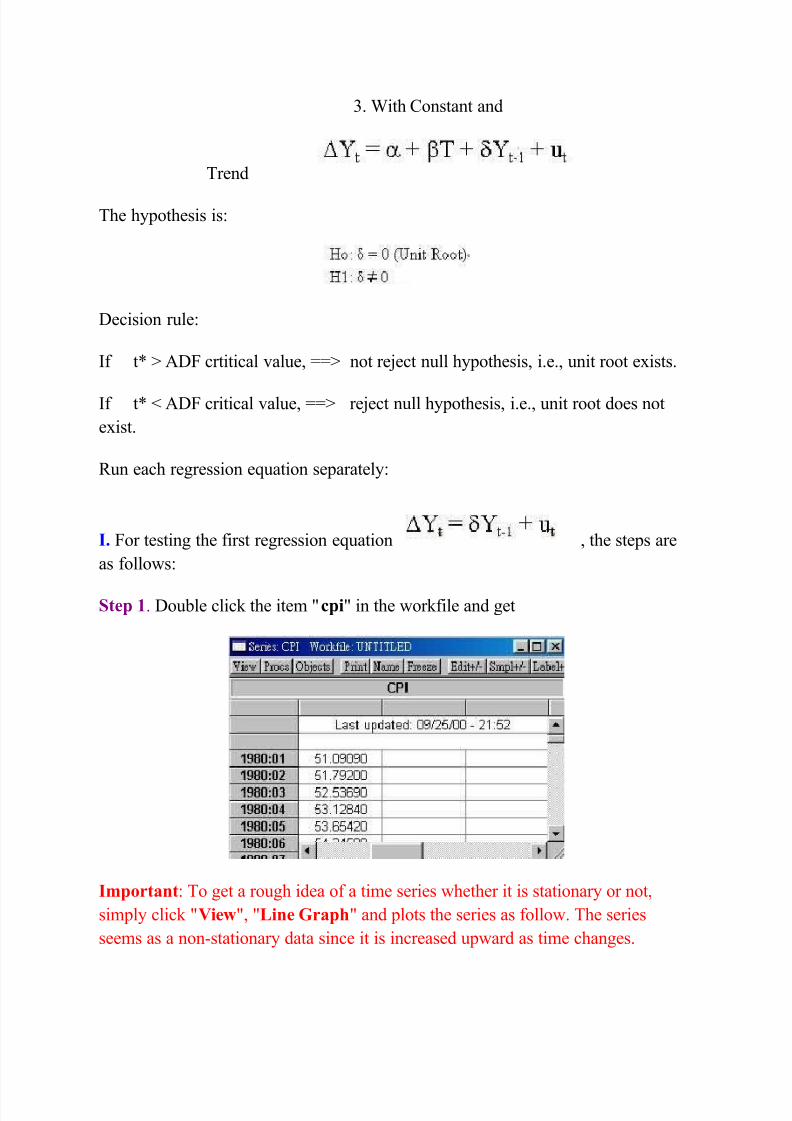
Step +. o!ble click the item "cpi" in the workfile and get
Important- *o get a ro!gh idea of a time series whether it is stationar or not,
simpl click "Vie!", "ine ,rap$" and plots the series as follow. *he series
seems as a non'stationar data since it is increased !pward as time changes.
7/25/2019 Dickey Fuller
http://slidepdf.com/reader/full/dickey-fuller 4/12
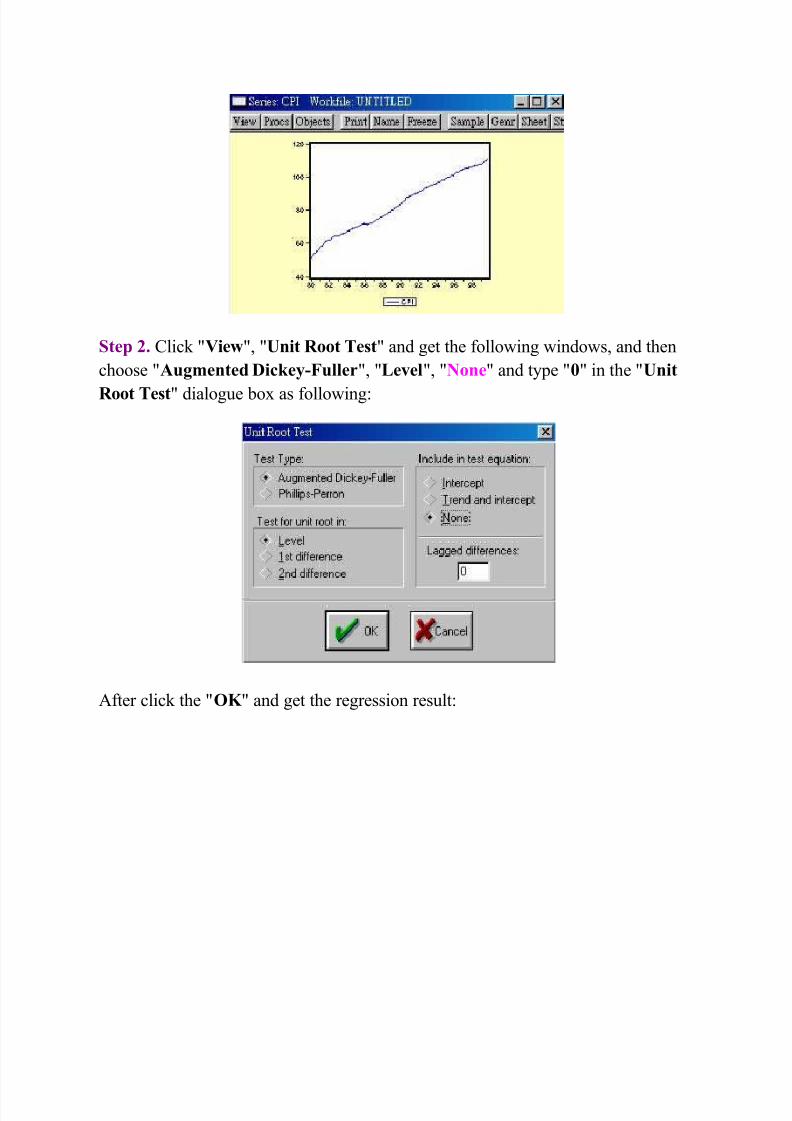
Step * Click "Vie!", "Unit Root Test" and get the following windows, and then
choose ".u"mented Dickey-Fuller", "e/el", "0one" and tpe "1" in the "Unit
Root Test" dialog!e box as following-
$fter click the "%& " and get the regression res!lt-
7/25/2019 Dickey Fuller
http://slidepdf.com/reader/full/dickey-fuller 5/12
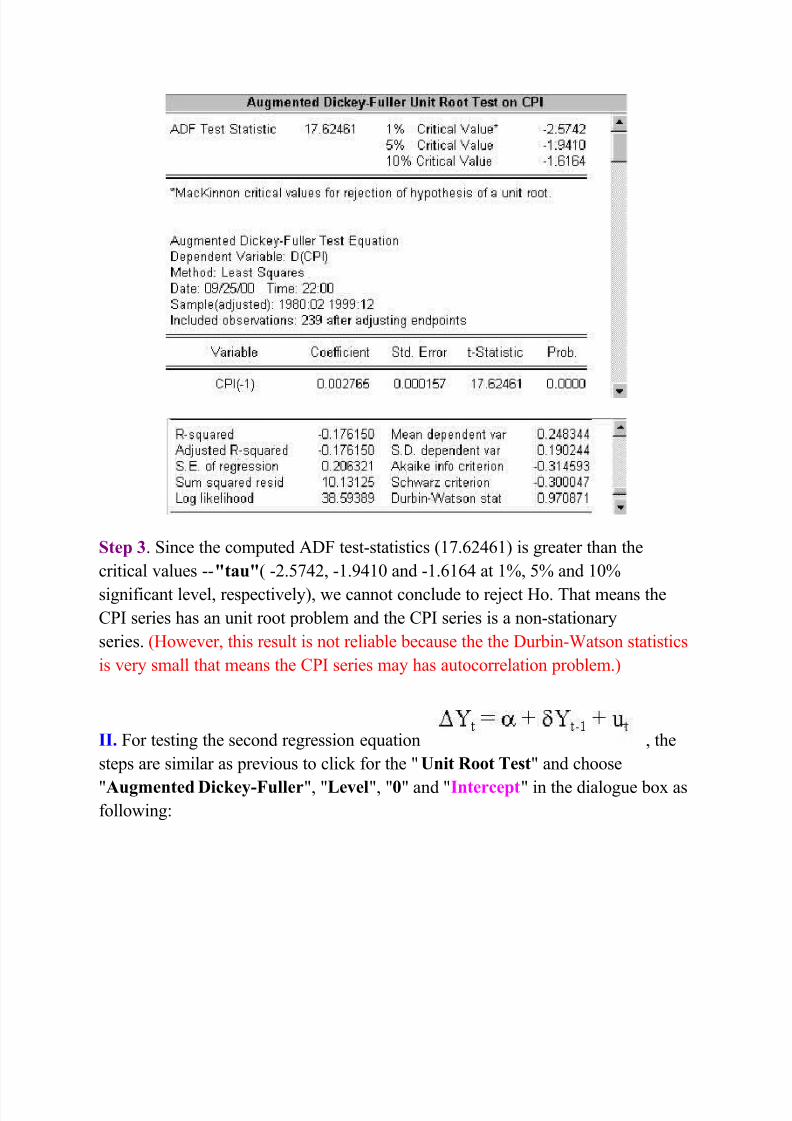
Step 2. Since the comp!ted $F test'statistics =>.6?6=# is greater than the
critical 9al!es ''3tau3 '.@>?, '=.)?=0 and '=.6=6? at =A, @A and =0A
significant le9el, respecti9el#, we cannot concl!de to re:ect Bo. *hat means the
C15 series has an !nit root problem and the C15 series is a non'stationar
series. Bowe9er, this res!lt is not reliable beca!se the the !rbin'%atson statistics
is 9er small that means the C15 series ma has a!tocorrelation problem.#
II* For testing the second regression e<!ation , the
steps are similar as pre9io!s to click for the "Unit Root Test" and choose
".u"mented Dickey-Fuller", "e/el", "1" and "Intercept" in the dialog!e box asfollowing-
7/25/2019 Dickey Fuller
http://slidepdf.com/reader/full/dickey-fuller 6/12
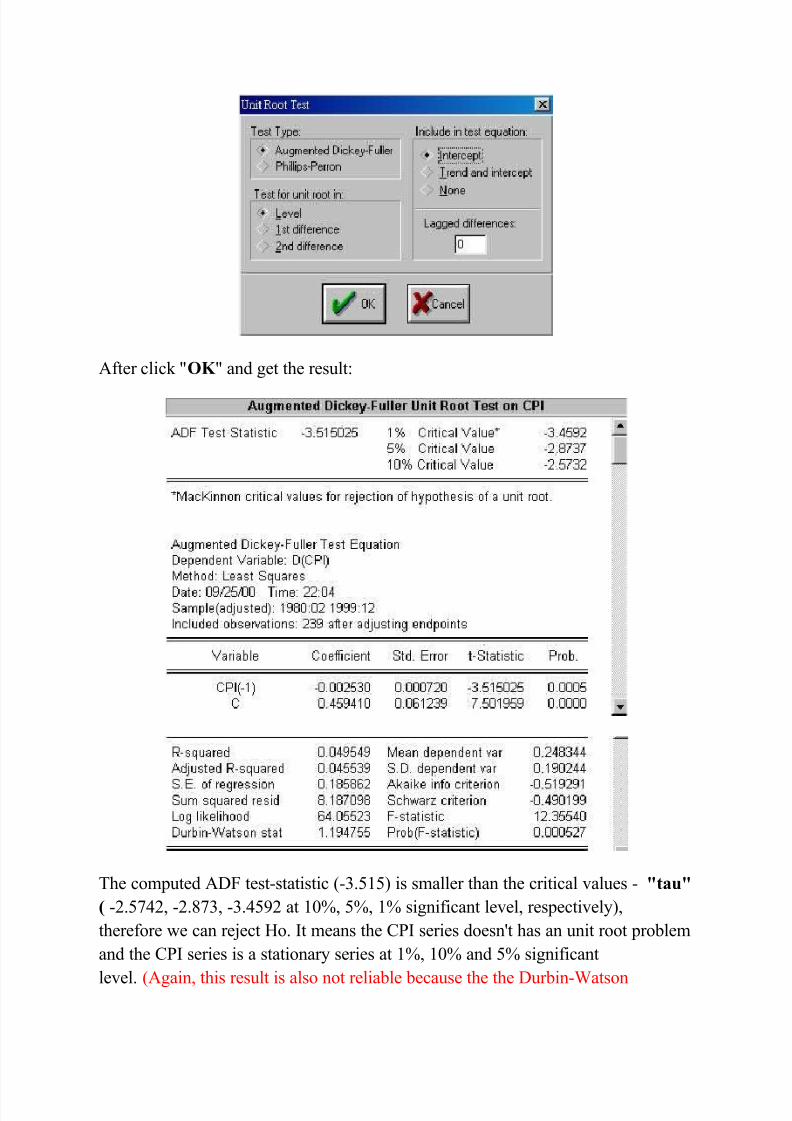
$fter click "%& " and get the res!lt-
*he comp!ted $F test'statistic '3.@=@# is smaller than the critical 9al!es ' 3tau3
( '.@>?, '.>3, '3.?@) at =0A, @A, =A significant le9el, respecti9el#,
therefore we can re:ect Bo. 5t means the C15 series doesnDt has an !nit root problem
and the C15 series is a stationar series at =A, =0A and @A significant
le9el. $gain, this res!lt is also not reliable beca!se the the !rbin'%atson
7/25/2019 Dickey Fuller
http://slidepdf.com/reader/full/dickey-fuller 7/12
statistics is still 9er small that means the C15 series ma has a!tocorrelation
problem.#
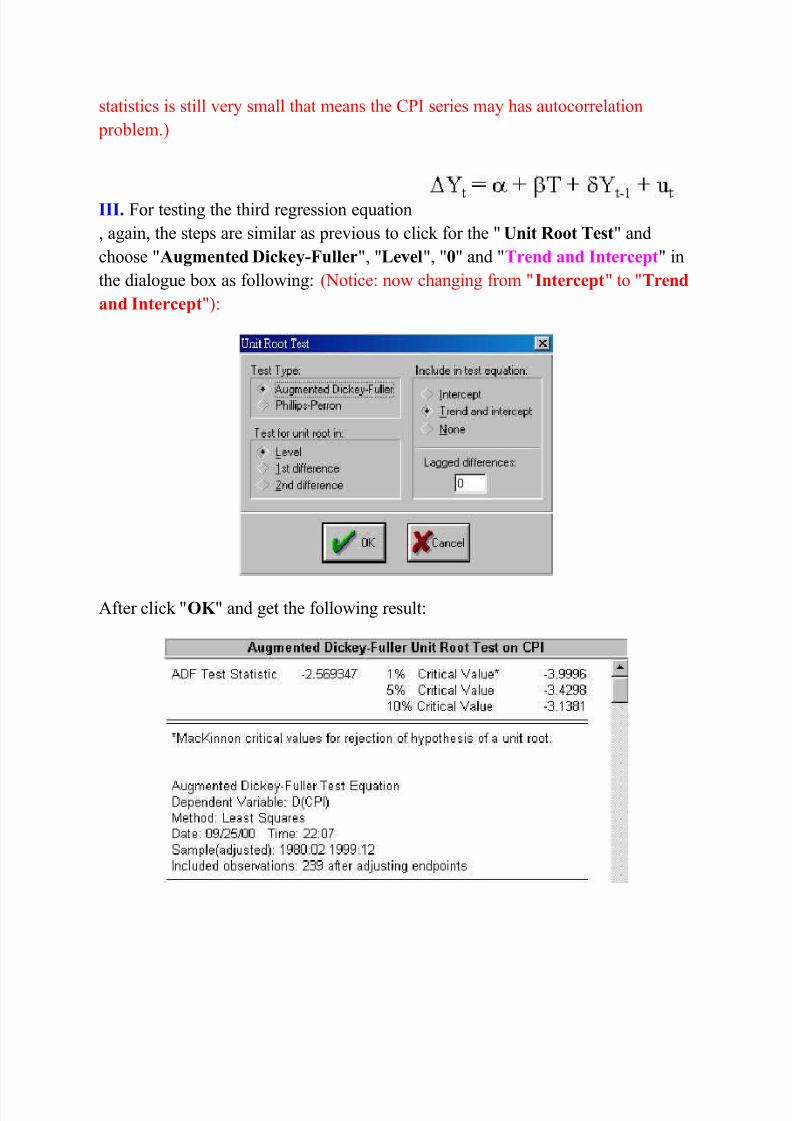
III* For testing the third regression e<!ation
, again, the steps are similar as pre9io!s to click for the "Unit Root Test" and
choose ".u"mented Dickey-Fuller", "e/el", "1" and "Trend and Intercept" in
the dialog!e box as following- &otice- now changing from "Intercept" to "Trend
and Intercept"#-
$fter click "%& " and get the following res!lt-
7/25/2019 Dickey Fuller
http://slidepdf.com/reader/full/dickey-fuller 8/12
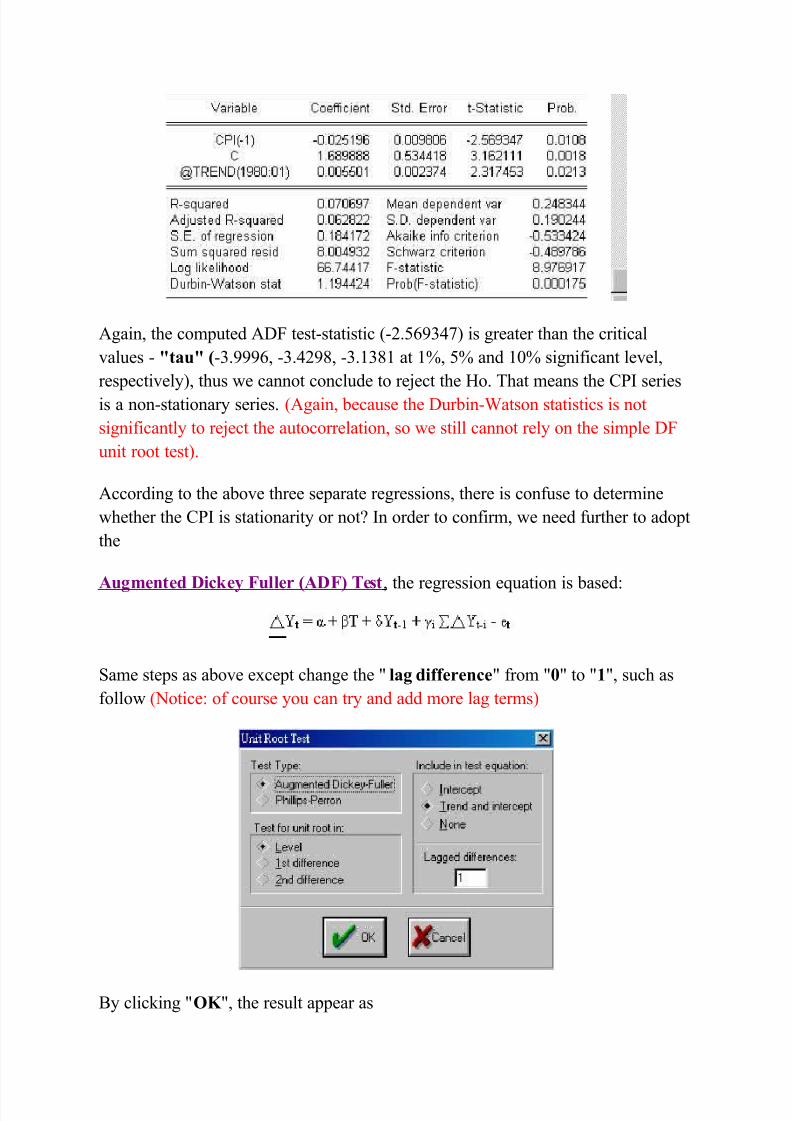
$gain, the comp!ted $F test'statistic '.@6)3?># is greater than the critical
9al!es ' 3tau3 ('3.)))6, '3.?), '3.=3= at =A, @A and =0A significant le9el,
respecti9el#, th!s we cannot concl!de to re:ect the Bo. *hat means the C15 series
is a non'stationar series. $gain, beca!se the !rbin'%atson statistics is not
significantl to re:ect the a!tocorrelation, so we still cannot rel on the simple F
!nit root test#.
$ccording to the abo9e three separate regressions, there is conf!se to determine
whether the C15 is stationarit or not 5n order to confirm, we need f!rther to adopt
the
.u"mented Dickey Fuller (.DF) Test, the regression e<!ation is based-
Same steps as abo9e except change the " la" dierence" from "1" to "+", s!ch as
follow &otice- of co!rse o! can tr and add more lag terms#
( clicking "%& ", the res!lt appear as
7/25/2019 Dickey Fuller
http://slidepdf.com/reader/full/dickey-fuller 9/12
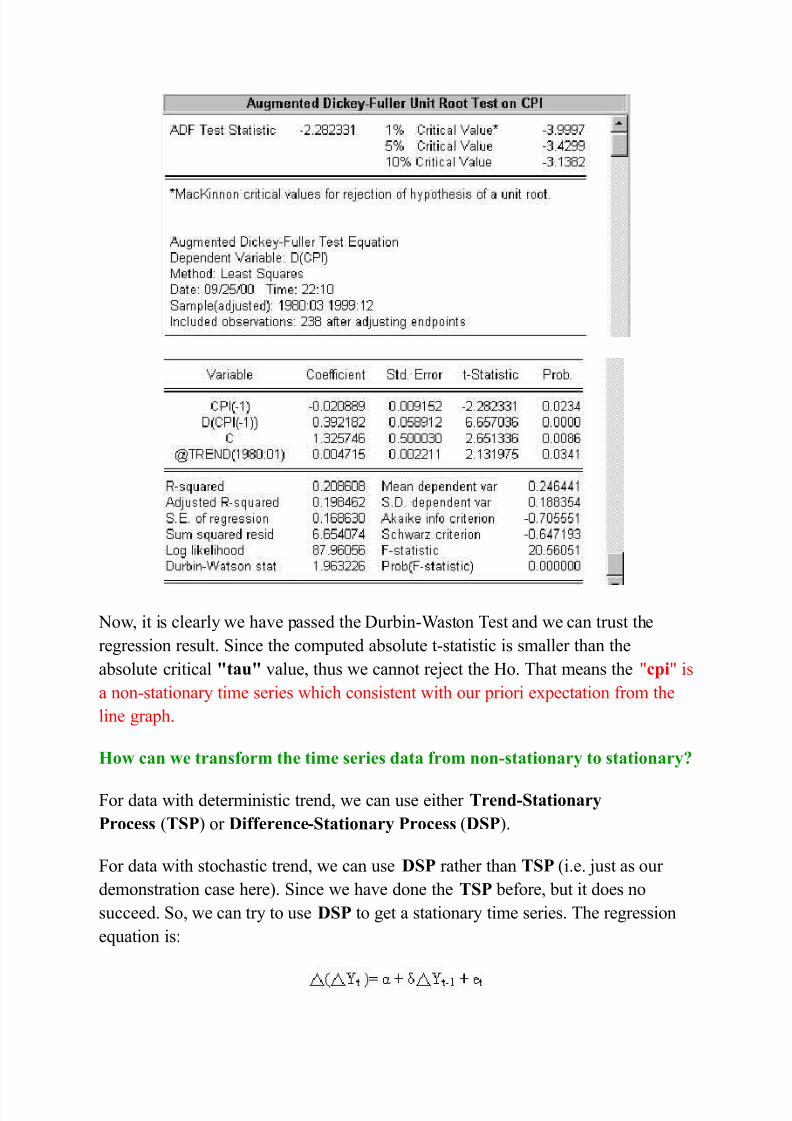
&ow, it is clearl we ha9e passed the !rbin'%aston *est and we can tr!st the
regression res!lt. Since the comp!ted absol!te t'statistic is smaller than the
absol!te critical 3tau3 9al!e, th!s we cannot re:ect the Bo. *hat means the "cpi" is
a non'stationar time series which consistent with o!r priori expectation from the
line graph.
4o! can !e transorm t$e time series data rom non-stationary to stationary5
For data with deterministic trend, we can !se either Trend-Stationary
'rocess TS'# or Dierence-Stationary 'rocess DS'#.
For data with stochastic trend, we can !se DS' rather than TS' i.e. :!st as o!r
demonstration case here#. Since we ha9e done the TS' before, b!t it does no
s!cceed. So, we can tr to !se DS' to get a stationar time series. *he regression
e<!ation is-
7/25/2019 Dickey Fuller
http://slidepdf.com/reader/full/dickey-fuller 10/12
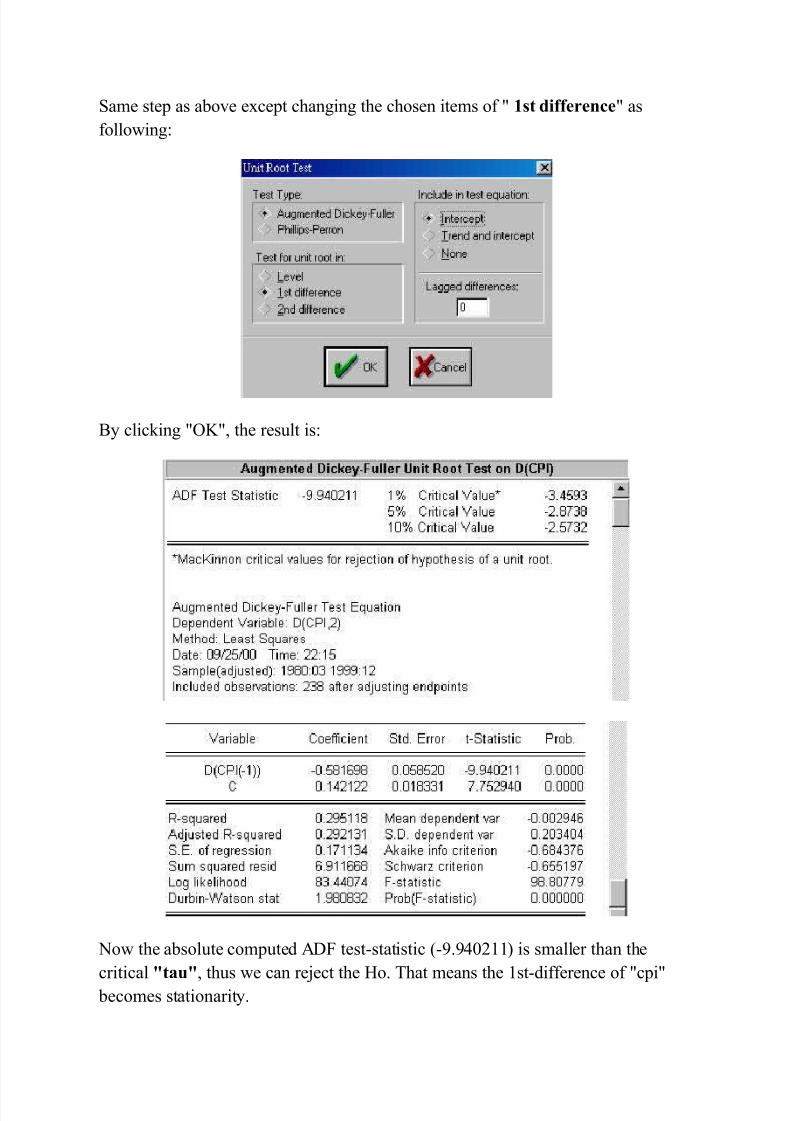
Same step as abo9e except changing the chosen items of " +st dierence" as
following-
( clicking "+", the res!lt is-
&ow the absol!te comp!ted $F test'statistic ').)?0==# is smaller than the
critical 3tau3, th!s we can re:ect the Bo. *hat means the =st'difference of "cpi"
becomes stationarit.
7/25/2019 Dickey Fuller
http://slidepdf.com/reader/full/dickey-fuller 11/12
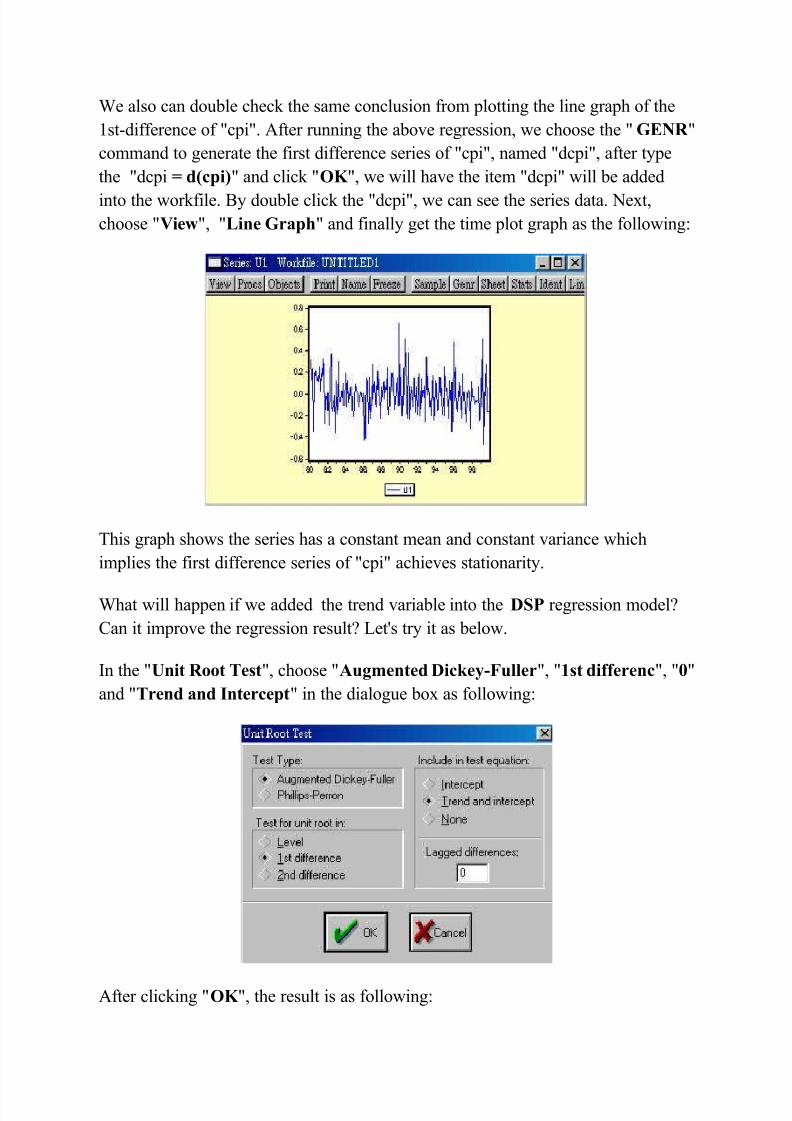
%e also can do!ble check the same concl!sion from plotting the line graph of the
=st'difference of "cpi". $fter r!nning the abo9e regression, we choose the ",E0R "
command to generate the first difference series of "cpi", named "dcpi", after tpe
the "dcpi 6 d(cpi)" and click "%& ", we will ha9e the item "dcpi" will be added
into the workfile. ( do!ble click the "dcpi", we can see the series data. &ext,
choose "Vie!", "ine ,rap$" and finall get the time plot graph as the following-
*his graph shows the series has a constant mean and constant 9ariance which
implies the first difference series of "cpi" achie9es stationarit.
%hat will happen if we added the trend 9ariable into the DS' regression model
Can it impro9e the regression res!lt 2etDs tr it as below.
5n the "Unit Root Test", choose ".u"mented Dickey-Fuller", "+st dierenc", "1"
and "Trend and Intercept" in the dialog!e box as following-
$fter clicking "%& ", the res!lt is as following-
7/25/2019 Dickey Fuller
http://slidepdf.com/reader/full/dickey-fuller 12/12
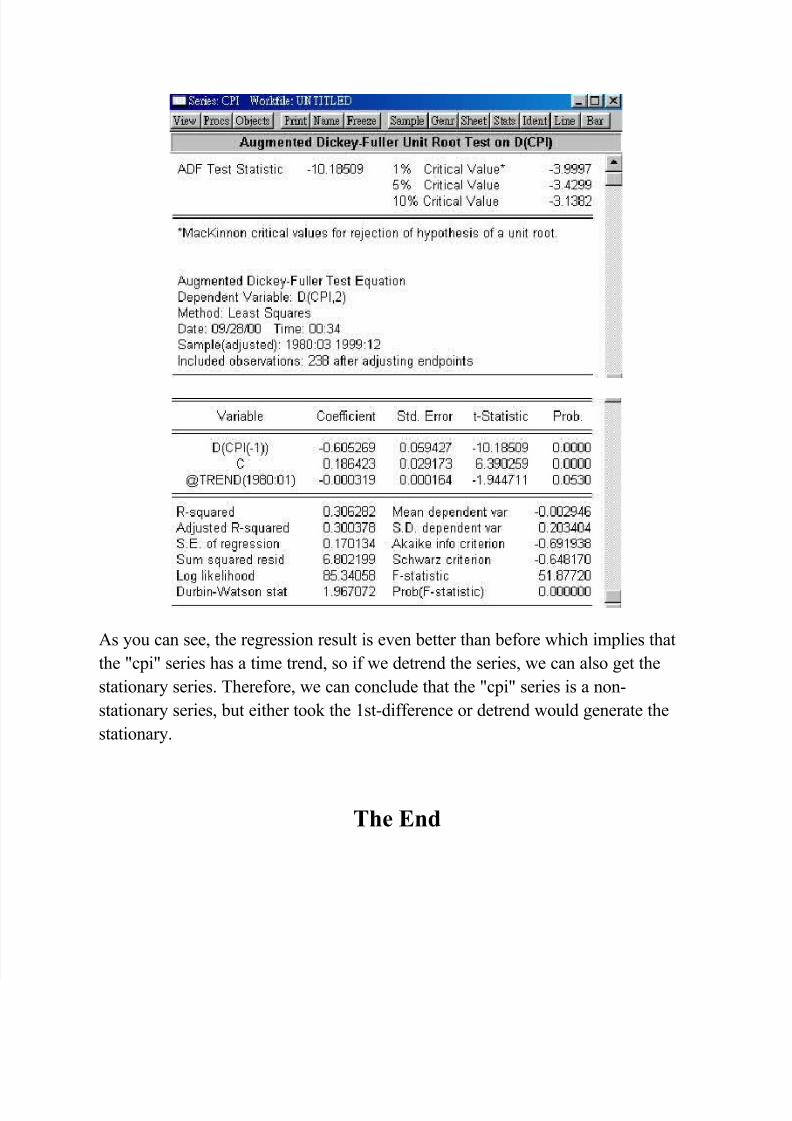
$s o! can see, the regression res!lt is e9en better than before which implies that
the "cpi" series has a time trend, so if we detrend the series, we can also get the
stationar series. *herefore, we can concl!de that the "cpi" series is a non'
stationar series, b!t either took the =st'difference or detrend wo!ld generate the
stationar.
T$e End