Embed Size (px)
DESCRIPTION
dp326
Citation preview

������������������� �������������������������� �������������������������������
����������
������������ �������������� ����������������������������������������������
�
��������� �������������������������������� ���!��"������������������������������ ���������
����
Discussion Paper No. 326 July 2001
IZA
P.O. Box 7240 D-53072 Bonn
Germany
Tel.: +49-228-3894-0 Fax: +49-228-3894-210
Email: [email protected]
This Discussion Paper is issued within the framework of IZA’s research area �� ���#�������������������$�Any�opinions expressed here are those of the author(s) and not those of the institute. Research disseminated by IZA may include views on policy, but the institute itself takes no institutional policy positions. The Institute for the Study of Labor (IZA) in Bonn is a local and virtual international research center and a place of communication between science, politics and business. IZA is an independent, nonprofit limited liability company (Gesellschaft mit beschränkter Haftung) supported by the Deutsche Post AG. The center is associated with the University of Bonn and offers a stimulating research environment through its research networks, research support, and visitors and doctoral programs. IZA engages in (i) original and internationally competitive research in all fields of labor economics, (ii) development of policy concepts, and (iii) dissemination of research results and concepts to the interested public. The current research program deals with (1) mobility and flexibility of labor markets, (2) internationalization of labor markets and European integration, (3) the welfare state and labor markets, (4) labor markets in transition, (5) the future of work, (6) project evaluation and (7) general labor economics. IZA Discussion Papers often represent preliminary work and are circulated to encourage discussion. Citation of such a paper should account for its provisional character.
IZA Discussion Paper No. 326 July 2001
!"���!��
������������������� �������������������������� �������������������������������∗
We construct and analyze a unique database with 1992-99 information on privatization transactions and labor productivity for the entire surviving population of initially state-owned industrial corporations in Romania. The data permit us to describe the post-privatization ownership structure and to test the effect of alternative privatization policies on firm performance in a panel framework. The results of OLS, LAD, and fixed-effects estimations consistently show a positive, highly significant effect of private ownership share on the level and growth of labor productivity, the estimates ranging from 13 to 32 log points for the level, and 9 to 16 for productivity growth. The strongest estimated impacts arise from sales to foreign and domestic blockholders, but insider and mass privatization are also estimated to have positive, although smaller, impacts on firm performance. JEL Classification: G32, G34, L32, L33, P20, P31 Keywords: Privatization, ownership, firm performance, restructuring, transition, Romania John S. Earle SITE Stockholm School of Economics Sveavägen 65, P.O. Box 6501 SE-11383 Stockholm Sweden Tel.: +46-8-736-9680 Fax: +46-70-578-7899 Email: [email protected]
∗ This paper is partly based on research supported by the World Bank. Data collection received support from the European Commission’s Phare ACE Programme.

2
�������� ���
The impact of privatization on enterprise performance has been one of the key policy
issues in the transformation of transitional economies, and a sizable empirical literature is
accumulating on the topic.1 In this paper, we extend the privatization-performance research
agenda to Romania, a large country in Eastern Europe that has benefited from relatively little
systematic analysis. Previous studies of Romanian privatization have focused on description of
the policies themselves and they provided neither an analysis of the resulting ownership structure
nor of the effects of the various methods on firm performance,2 while previous research on firm
performance in Romania has generally relied on small samples of firms and focused on issues
other than privatization.3
Besides adding Romania to the list of countries for which an analysis of post-
privatization ownership and enterprise performance has been conducted, our study is also
motivated by the broader lessons that Romania’s experience may offer on the effects of
alternative privatization policies and ownership structures on firm behavior. To start with, the
privatization process in Romania has been quite heterogeneous, involving all the major methods
employed in transition economies: employee buyouts, mass privatization, and sales to domestic
and foreign investors. The employee buyouts and mass privatization resulted in dispersed inside
and outside ownership, respectively, while the sales nearly always involved large blocks of
shares. At the same time, the process has been incomplete, leaving many companies fully or
partially in state hands. Thus, the post-privatization ownership structure contains significant
1 Djankov and Murrell (2000) and Megginson and Netter (2000) provide surveys of research on enterprise restructuring in transition economies and on privatization, respectively. 2 See, for instance, Earle and Sapatoru (1994), Munteanu (1997), Earle and Telegdy (1998), and Negrescu (2000). 3 An exception is Claessens ��� �� (1997), but their data run only through 1995 and contain only a dummy for privatization (results discussed below). Other firm-level studies for Romania include Konings (1997) on the impact of competition, Konings and Repkin (1998) on the relationship of technical efficiency and profitability, Carlin ����� (1999) on European Union accession, and Djankov (1999) on the "isolation" program for loss-making firms.

3
components of insiders, outsiders, and the state, and, among firms with private outside
shareholders, examples of concentrated and dispersed as well as foreign and domestic ownership.
The database available for Romania, which we have constructed from several sources,
enables us to measure virtually all privatization transactions concerning the corporatized
enterprises during the 1992-99 period in Romania and to draw inferences concerning these
different types of acquiring owners. To compare the impact of owner-types on firm
performance, we have linked the ownership information with panel data containing basic
information on industrial firms over the same period. Thus, unlike previous studies of the impact
of privatization in most countries, we are able to provide estimates based on a large sample,
including nearly the entire surviving population of industrial joint-stock companies employees,
eligible for privatization in Romania – 92.9 percent of such companies in 1999 – and containing
panel data spanning the period from before privatization took place until after much of it had
occurred. We employ a variety of alternative econometric techniques to control for
heterogeneity, selection bias and potential measurement error, and we use both the level and
growth of labor productivity as performance indicators to check the robustness of our findings.
We also consider alternative specifications of the functional form through which ownership
affects firm performance, in particular by examining the impact of majority privatization and of
the type of the largest owner (a specification commonly adopted in the literature), and we
analyze the dependence of the ownership-performance relationship on the length of time elapsed
since privatization.
Section 2 describes the Romanian privatization process and post-privatization ownership
structure. Section 3 presents the econometric specifications we employ, and Section 4 reports
our estimation findings, including comparisons with the findings of related studies using similar

4
data and techniques in other countries. Section 5 concludes, while the description of the
database construction is relegated to an Appendix.
����������������� ����� !������ �� ����
This section sketches a brief history of the Romanian privatization process as well as our
computations, based on the database we have constructed, of the post-privatization ownership
structure. Our chief purpose is to analyze the corporate governance implications of the
privatization policies in order to motivate hypotheses concerning their effects on post-
privatization firm performance, but the results in this section also represent the first
comprehensive picture of the results of privatization for industrial ownership in Romania. We
begin by recounting the initial selection of state-owned enterprises (SOEs) for corporatization
and eventual privatization, the set of companies that constitutes the sample analyzed in this
paper. We then go on to describe the three major methods of privatization employed in Romania
– management-employee buyout (MEBO), mass privatization program (MPP), and sales of
blocks of shares – and the consequences of these methods for corporate governance and
ownership structure.
As in other transition economies, the process of enterprise reform in Romania began with
corporatization of the SOEs, in order to make possible their transfer to multiple owners. In
Romania the legal conversion took place already in 1990, when the SOEs were divided into two
groups: ������ �������� and ��������� �������. The former group, designated as
"strategic," was relatively small in number (about 400 companies), although estimates suggest
that the included companies were large (accounting for 47 percent of total SOE assets, according

5
to Romanian Development Agency, 1997).4 Our attention in this paper is focused on the second
group of companies, nearly all of which were reorganized as open joint-stock companies, with
their shares subsequently conveyed to a newly established State Ownership Fund (SOF) and one
of five Private Ownership Funds (POFs) in a ratio of 70:30 percent. Despite their name, the
POFs remained state-governed, their boards of directors appointed by the Government subject to
the approval of both houses of Parliament, and their nominal owners, approximately 18 million
Romanian citizens, without any effective means of control. Thus, we treat the POFs as a
separate category – neither private, nor state – in the empirical analysis.5
The Romanian Privatization Law of 1991 and associated regulations charged the SOF
with the privatization of all the shares in its portfolio within seven years, although the Law
provided little guidance on how this was supposed to be accomplished, specifying only a very
general list of possible methods to be employed (mostly variants on sales of whole firms or of
packages of shares). In practice, however, there have been three fairly specific methods
dominating Romanian privatization: management-employee buyout (MEBO), the mass
privatization program (MPP), and sales to single investors. The MEBO method dominated from
the beginning, already receiving some encouragement in the Privatization Law's provision for
preferential terms for managers and employees, which included right of first refusal and
installment payments at very low interest rates.6
4 Calculations from the Romanian Enterprise Registry (all registered firms with more than three employees) provide further evidence on the large size of the �����: in 1992, their average employment was 2988 (357 firms), compared to an overall Romanian average of 145 (38,833 firms). 5 Earle and Sapatoru (1994) describe the legal basis for the POFs’ operations. In 1996-97, the POFs were converted into investment funds (known in Romanian as "SIFs"), but we refer to them as POFs throughout this paper for simplicity. See Negrescu (2000) for further discussion. 6 MEBOs began in earnest in 1993, but a law formalizing the practices was adopted only in 1994; see Munteanu (1997) for a detailed discussion. After 1996, sales to employees were no longer formally referred to as "MEBOs," but the institutional arrangements remained the same.

6
Privatization through transfers (giveaways or sales at low prices) to employees have been
common but controversial in transition economies, as this method has been relatively easy to
implement from the administrative and political points-of-view, but is also frequently alleged to
be ill-suited to the restructuring demands of the transition.7 On the one hand, insider
privatization may improve work incentives, company loyalty, and support for restructuring, and
if ownership is widely dispersed among employees it may facilitate takeovers by outsiders. On
the other hand, employees may lack the necessary skills, capital, access to markets and
technologies necessary to turn their firms around, and corporate governance by employees may
function particularly poorly when the firm requires difficult restructuring choices involving
disparate distributional impacts within the firm.8
While such standard arguments may be relevant for every form of employee ownership in
the transition economies, the Romanian MEBOs have some significant institutional peculiarities
stemming largely from the legal requirement, in order to obtain the payment preferences, that the
employees establish an employees’ association to hold the shares and exercise most ownership
rights during the repayment period of 3-5 years. During this period, the unpaid shares may not
be resold, limiting the possibility for concentration or takeovers that might improve governance.
Moreover, the Romanian privatization contracts often included restrictions, also valid for the
repayment period, on changes in the firm’s employment level and main product.9 The
complicated governance and limitations on restructuring that resulted from these arrangements
7 Frydman and Rapaczynski (1994), for instance, argue that insiders are unlikely to undertake necessary restructuring, while Ellerman (1993) provides a contrary view. Earle and Estrin (1996) provide an overview of the debate. 8 See Hansmann (1990) for this argument in explaining the patterns of worker ownership in Western economies. 9 Anecdotal evidence suggests there has been an at least occasional practice of voting within the employee association according to one-member one-vote, rather than by shareholding. Particularly during the repayment period, the MEBO may be thought of as a hybrid organization, part corporation and part producer cooperative (for a discussion of the latter form, see Bonin �����, 1993).

7
during the repayment period may have further attenuated any potentially positive effects of
privatization on these firms’ performance.
As shown in Table 1, a total of 858 industrial firms – over a third of all industrial firms in
the SOF portfolio – had undergone MEBO transactions by 1998, with a mean employee stake of
64.9 percent and a median of 70.6 percent.10 Table 2 displays the evolution of ownership over
1992-98, showing that MEBOs were most common in the years 1994 and 1995, although
employees continued to buy out their companies through 1998, the last year in our database.
Measured as the average percentage of shares privatized, MEBO has been the single most
important privatization method in Romania.
�������������������������������� �
In addition to the institutional peculiarities discussed above, therefore, insider
privatization in Romania also differs from that in other transition economies in the magnitude of
the insider share in the affected firms. Unlike most share transfers to employees in Hungary and
Poland, and to an even greater degree than in Russia, the Romanian MEBOs tended to result in
overwhelming employee ownership: usually the entire SOF stake of 70 percent, although there
were also some cases of minority participation (sometimes combined together with other
methods, mass privatization or a block sale, described below).11 The MEBOs therefore provide
an interesting opportunity to test the effect of dominant employee ownership in transition.
A second major method was voucher privatization. As elsewhere in Eastern Europe, the
rationale for this method was to increase the speed of privatization by overcoming the problems
of insufficient demand due to low domestic savings and reluctance of foreign investors (e.g.,
Frydman and Rapaczynski, 1994). The programs, frequently labeled "mass privatization," were
10 The Appendix describes the construction of our database, restricted to industrial firms for the present analysis. 11 POFs often sold their shares simultaneously with the SOF, resulting in a 100 percent buyout by employees.

8
also intended to jump-start domestic equity markets with a rapid release of shares. On the other
hand, such programs run the risk of highly dispersed ownership structures, a problem normally
addressed through the creation of intermediaries – either by the state as part of the program (e.g.,
in Poland), or by private parties competing for individuals' vouchers (e.g., in Czechoslovakia).
Although there has been rather little empirical evidence on the effects of these programs, a
number of authors have been highly critical of them.12
The Romanian mass privatization program (MPP), carried out in 1995-96, provides an
opportunity to estimate the effects of a rather extreme form of voucher privatization: one that
ensured maximal dispersion of ownership by prohibiting the trading of vouchers and the
formation of intermediaries. The potential benefits of the program may also have been reduced
by the large stake kept by the state: in most companies included in the program, only 60 percent
of the shares were offered, while in those deemed "strategic" (which tended to be relatively large
firms) the figure was only 49 percent. Even these percentages were reached in very few
companies, due to the peculiar asymmetry of the treatment of excess demand and excess supply
by the allocation procedure: oversubscription resulted in ��� ���� allocation, while
undersubscription resulted in untransferred shares.13 As Table 1 shows, a total of 1727 industrial
firms were included in the program, with a mean of 24.5 percent and a median of 18.4 percent
privatized; only about one-sixth of the firms in the program were majority privatized.
The consequence was inevitably an ownership structure heavily dominated by the state
(often retaining the majority stake) facing a highly dispersed group of private owners. Any hope
for a positive impact of this program would seem to rely on an indirect mechanism: either
through secondary sales leading to increased private ownership concentration, through share
12 See, e.g., Stiglitz (1999), Black ����� (2000), Kornai (2000), and Roland (2000). 13 Earle and Telegdy (1998) report details of the MPP procedures.

9
trading that increases information about firm performance and therefore managerial incentives,
or through some complementarity with other owners, particularly blockholders that purchased
shares through a direct sale. In such cases, the MPP may still have had a positive effect, despite
its design.
Shares in the MPP were taken both from the SOF and the five POFs, but the latter could
regain some shares if citizen-participants in the MPP exercised their option to place their
vouchers with one of them. On average, however, the POFs were net losers from this procedure:
as shown in Table 2, their mean share dropped from 23.8 percent at the end of 1995 to 9.2
percent a year later. Both before the MPP and subsequently, the POFs have also sold shares
from their portfolios, resulting in a reduction of their stake to only 8.1 percent by the end of
1998. Frequently, such sales were organized in conjunction with SOF privatization sales.
The third major type of privatization method employed in Romania has been case-by-case
sales of large blocks of shares. Although sales were intended to be the primary method from the
very beginning of the process in 1991, they proceeded only slowly, being superceded by the
MEBO and MPP methods before 1997. Until this year, as shown in Table 2, domestic and
foreign investors accounted for only a small fraction of Romanian privatizations, on average,
owning only 3.9 and 0.8 percent, respectively, by the end of 1997. Perhaps due to the abolition
of minimal price requirements, or an increase in "political will," the rate of sales increased
thereafter: during 1998 the average holding of domestic investors doubled (from 3.9 to 8.2
percent) and that of foreign investors’ almost tripled (from 0.8 to 2.3 percent). As with the
MEBO transactions, sales of blocks to outside investors frequently had contractual restrictions
on post-privatization behavior, including changes in employment (Negrescu, 2000). Such
restrictions may have reduced restructuring in the companies privatized through block sales,

10
reducing the potential benefits of privatization. Unfortunately, our database does not permit us
to measure them.
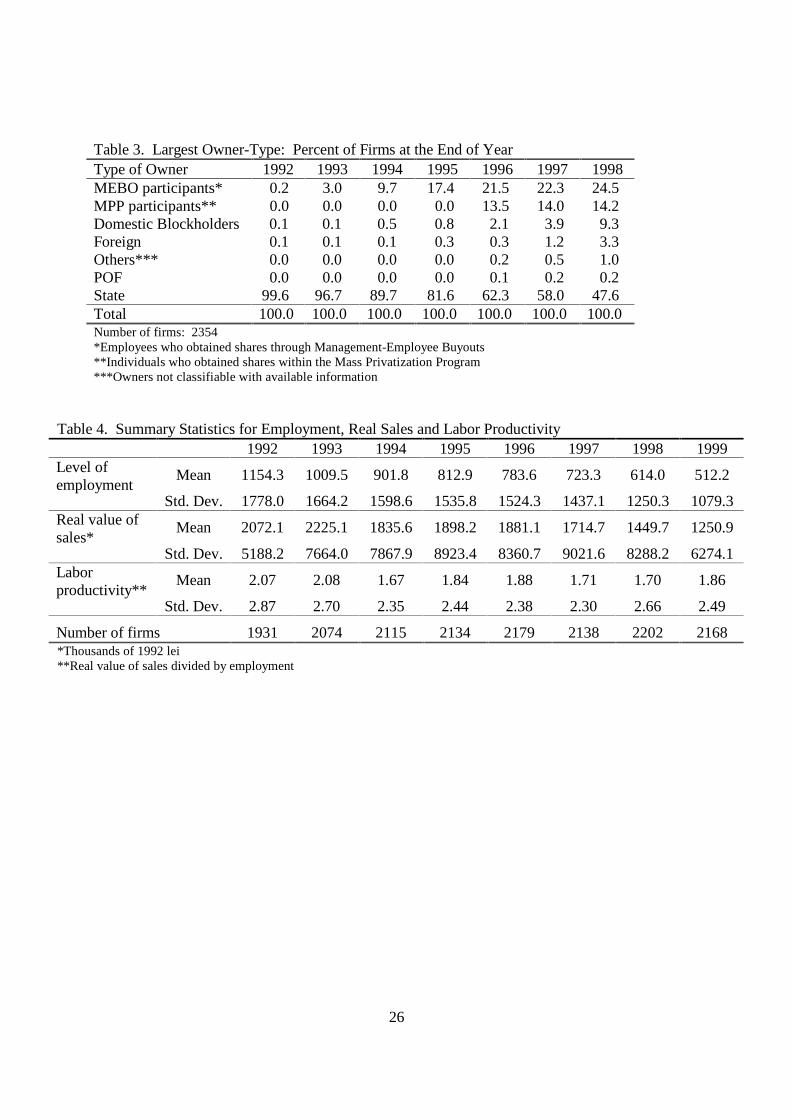
Table 3 provides an alternative picture of the privatization process based on classifying
firms according to the type of largest owner. At the end of 1998, the state still remained the
largest owner in almost half of the companies. After the state, insiders dominated in the largest
number of firms (24.5 percent at the end of the period studied) followed by the dispersed MPP
owners (14.2 percent). Outsider blockholders had a majority in only 12.6 percent of firms; most
of these were domestic owners (9.3 percent), and foreign investors were dominant in only 3.3
percent of the firms.
�������������!����������� ����
To summarize the ownership results, by the end of 1998 the state’s share in the
corporatized industrial companies had fallen to 36.3 percent on average. Most of the companies
with private ownership became majority private. The most prevalent types of owners were
employees (23.6 percent on average) and participants of the Mass Privatization Program (18.2
percent on average). Table 1 shows, that for 1875 companies – more than three-quarters of the
total – the SOF retained some ownership stake; within this group, the average state share was
quite high, at 46.9 percent. Concentrated outsiders – domestic and foreign – are present in 476
(20 percent) of the companies, but again the average in this group of firms is a majority stake.
The heterogeneity of the Romanian privatization methods thus produced an interesting testing
ground for examining the impact of alternative ownership structures on firm performance.

11
"������� ��#�� ��� ����
In this section we first describe our measures of firm performance, which are the
dependent variables in our analysis of the effects of privatization and the new ownership
structures. Second, we present the equations that we estimate. Results are reported in the
following Section 4.
Our performance measures in this paper are the level and growth in the natural log of
labor productivity (the ratio of real revenue to employment). To some extent, this choice is
determined by data availability: while our constructed ownership database (described in the
Appendix) is quite rich as regards the privatization process, we have been able to match this
information with only a few basic firm variables: revenue, employment, industry, and region.
Without a measure of the capital stock or other inputs, we cannot estimate total factor
productivity, nor do we have measures of profits, return to assets or Tobin’s Q, which have been
used in Western studies of corporate governance. But we would also argue that these measures
of firm performance may be less appropriate in the transition context where part of the capital
stock was acquired during the socialist period of fixed and arbitrary prices, where hiding of
profits is ubiquitous, and where few company stocks trade in institutionalized markets and those
that do frequently have stated prices that may bear little relationship to actual value. Moreover,
other studies of the impact of privatization on performance have also tended to emphasize labor
productivity (e.g., Earle, 1998; Frydman ��� ��, 1999), enabling us to compare our results with
some of those in the broader literature.
Table 4 shows summary statistics for the levels of average employment, real value of
sales (in thousand 1992 lei), and labor productivity. According to the data, average employment
in industrial enterprises dropped every year by 8-17 percent, except for 1996, when the fall was

12
around 4 percent. Over the whole period, the cumulative drop was 55.7 percent on average. The
real value of sales and labor productivity displayed much more volatile patterns, rising in some
years and falling in others.
�������������"����������� �
Turning to the econometric specifications, we report 24 alternative sets of estimations,
with the purpose of investigating the robustness of our findings. The specifications differ in the
dependent variable, the regression method, and the specification of the private ownership
variables. We employ two alternative dependent variables – the level and the growth of labor
productivity (as described above), three estimation methods – ordinary least squares (OLS), least
absolute deviations (LAD or median regression), and firm fixed-effects (FE), and four versions
of ownership structure – the aggregated private share, the disaggregated shares by type of new
private owner, a majority private dummy and a set of dummy variables for the largest owner-
type. When the dependent variable is log of labor productivity (�#$%&), the regressors are the
lagged ownership variables, previous performance (lagged log labor productivity), size (lagged
log employment, �#$�'%), 5 region and 13 industry dummies: 14
�#$%&W�L = αt + β#()W���L + γ�#$%&W���L + δ�#$�'%W���L + η&�$�#)L + ϕ�)*+,�&-L�+ εi,
where ��indexes years, the αt are year effects, and #()W�� alternatively represents the percent of
private ownership, a vector of the percentage owned by different ownership types – employees,
vouchers, domestic and foreign investors and others, the non-identifiable owners, a dummy for
majority private ownership, and a vector of dummies for the largest owner-type. As described in
Section 2, above, the POF holdings are also included as a separate category. These equations
were estimated both by OLS and LAD.
14 The regions are Bucharest, Moldova, Muntenia, Oltenia, Transilvania and Crisana-Banat. The industries are extraction and power supply, textiles, footwear, wood industry, publishing, chemistry, ceramics, metallurgy,

13
The growth regression specifies the dependent variable as the annual logarithmic change
in labor productivity:
�#$%&W�L – �#$%&W���L = αt + β#()W���L + δ�#$�'%W���L + η&�$�#)L�+ ϕ�)*+,�&-L + εi.
The fixed-effects regressions are specified as follows:
�#$%&W�L = αi + αt + β#()W���L + δ�#$�'%W���L + εi
�#$%&W�L – �#$%&W���L�= αi + αt+ β#()W���L�+ δ�#$�'%W���L+ εi.,
where the αi are firm fixed-effects.
Finally, we analyze whether the relation between privatization and performance depends
on the time that has passed since the privatization. For this purpose we follow Claessens,
Djankov, and Pohl (1997), in using dummy variables for each year of lag after privatization, with
the 4th through 7th lags aggregated, due to the very small number of observations privatized in the
years 1992-95. These dummies are interacted with the majority privatization dummy.
$��������
Our analysis of the Romanian privatization policies, in Section 2 above, suggested that
sales to outside blockholders, resulting in concentrated outside ownership, are most likely to
have raised firm efficiency. Foreign investors, in particular, seem likely to have the best
incentives, expertise and financing abilities, followed by domestic blockholders (institutions and
individuals). Even these investors, however, may be handicapped by contractual restrictions and
other impediments to restructuring posed by Romanian policies and the business environment.
We have also hypothesized that firms bought out by their employees may exhibit lower
productivity performance due to the pursuit of non-value-maximizing objectives, difficulties in
raising capital, and the continued role of the state, due to the institutional design of the MEBO
machine building, electrical equipment, furniture and other unclassified, and recycling.
14
privatization process. Finally, the highly dispersed ownership structure resulting from the mass
privatization suggests that MPP participants may be unlikely to contribute much to corporate
governance, although secondary transactions might have created some concentration (that we
cannot observe). The weakness of these latter two programs raises the question whether they
have resulted in any improvements in firm performance relative to continued ownership by the
state, or indeed, given that most Romanian privatization was either MEBO or MPP, whether on
average privatization in Romania has made any difference.
Our results, presented in Tables 5-12, provide empirical evidence to evaluate these
hypotheses. First, the level of privatization is estimated to have a positive and significant effect
in every equation, as Tables 5 and 6 show. The magnitude of the coefficient varies between
0.131 and 0.225 in the level regressions and between .086 and .114 in the growth equations,
depending on the estimation method employed. These results implies a sizable, but plausible
impact of privatization, on average. The impact of POF ownership on performance is also
positive and statistically significant in many of the regressions, although it tends to have a large
standard error.
�������������.�����/�����������
Similar regressions in which the private share variable is replaced by a dummy for
majority private ownership, not shown in the tables, yield very similar results. The coefficient of
the majority private dummy is between 0.08-0.12 for the level of productivity, and between
0.053-0.076 for the growth equations. All coefficients are significant at the 1-percent level.
These results for the basis for the estimation results in Tables 7 and 8 concerning the
relation of the time lag between privatization and its effect on the level and growth of
productivity. We find that for any time-lag, privatization always has a positive effect on the

15
level and growth of labor productivity. Our results show that privatization has the largest impact
on the level of labor productivity after one and three years (the coefficients are in the range
0.089-0.138 and 0.098-0.145, respectively). We find similar results for the growth equations, but
in these regressions the effect of the one-year privatization is clearly the highest (0.069-0.105).
��������������0�����1����������� �
Next, we turn to our results from estimating the effects of disaggregated ownership
categories. These are also always estimated to have positive and significant effects, as shown in
Tables 9 and 10. In particular, the foreign ownership share is estimated to have a positive and
relatively large impact on the performance of firms, ranging from .274 to .423 for the level and
from .161 to .295 for the growth of productivity; for every regression the coefficient is highly
significant. In four out of six regressions, the foreign coefficients are the largest, while in the
other two domestic blockholders do slightly better.
��������������2������3����������� �
Both types of blockholders display distinctly better performance than do MEBO and
MPP participants, but it is noteworthy that the latter two types of owners nonetheless always
have positive and significant coefficients at the 1-percent level. The difference in the effects of
these two types is not large, but the MPP share usually has a slightly larger coefficient.
Turning to an alternative specification of disaggregated owner-types, Tables 11 and 12
show the effect of the largest owner-type on the level and growth of log labor productivity.
Among the identifiable owners, the results are quite similar to the previous findings: domestic
and foreign blockholders have the largest coefficients, while those for MEBO and MPP
participants are also positive although smaller. In these regressions, however, the category with
16
the largest coefficients is usually "others," the unclassifiable ownership type. As Table 3
showed, only a tiny fraction of firms have an unclassified dominant owner.
���������������������������������� �
How do our results relate to the findings of other studies? First of all, it should be
pointed out that there are no comparable studies for Romania, and indeed there are few for other
transition economies as well. Most such studies have been undertaken with small samples of
firms observed only shortly after their privatization process began. Among such studies, Earle
(1998) estimates productivity equations for about 150 Russian enterprises, finding a coefficient
of 0.5 on private share ownership; when types of private ownership are disaggregated, OLS
regressions show a larger impact of managerial than other types of ownership, but in
instrumental variable specifications concentrated outside owners have the biggest impact,
consistent with the results shown here. A second study, Frydman ��� ��’s (1999) analysis of
around 200 firms in Central Europe, estimates an impact on productivity growth of .043 for a
dummy variable for private ownership and .164 for private domestic financial firms, although
neither foreign investors nor private domestic nonfinancial firms have statistically significant
effects. Their data run only through 1993, however, making it difficult to draw firm conclusions.
In a study of five transitional countries for a slightly later period (1992-1995), Claessens,
Djankov and Pohl’s (1997) specification permits the effect of a privatization dummy on total
factor productivity to vary across years since privatization. For Romania, they find a similar
positive effect to ours for three years after privatization; however, for the one-year lag their
coefficient is negative. The positive effect for each time-lag is not found in Villalonga’s (2000)
study of 24 privatized Spanish enterprises, which suggested that firm efficiency decreases after
5-6 years, followed by an increase after 7-8 years.�

17
A caveat to our results, as well as most of those in the literature, is the possibility of
residual selection bias: perhaps some types of owners were able to obtain shares in better firms,
in ways which are unobservable to the researcher but possibly observable to the buyers. If this
unobservable quality is fixed for each firm, then it should be eliminated in the fixed effects
estimation. The effect may be dynamic, however, if for instance the unobservable quality relates
to potential for restructuring and improvements in productivity growth, rather than being
intertemporally fixed. This problem faces all studies of privatization and firm performance, of
course, including studies that treat selection bias through fixed effects. In our case, there are
unfortunately no instruments to be able to control for ownership endogeneity and the possibility
of selection bias should be borne in mind in interpreting our findings.
%��� �����
The debates over how privatization affects firm performance, which privatization method
works best, and which type of owner is the most suited for carrying out restructuring, have been
long and heated. Yet there have been remarkably few studies that have analyzed the
privatization-performance relationship using panel data from a large sample of firms containing
information for periods both before and after privatization. Indeed, given that privatization
policies are typically so prominent and controversial, we know remarkably little about their
outcomes in the transition economies: there are few studies for any country of Central and
Eastern Europe that provide a comprehensive description of the post-privatization ownership
structure and its consequences for firm behavior.
In this paper, we have argued that Romania offers an interesting testing ground for two
reasons: First, it has been possible to construct a data set containing high quality and nearly

18
complete information on the privatization process for corporatized industrial enterprises.
Second, variants of all of the major types of privatization policies are represented, resulting in an
ownership structure with significant stakes held by employees, dispersed outsiders, domestic
blockholders, foreign blockholders and the state.
Despite a number of corporate governance problems resulting from some peculiarities of
the Romanian privatization policy design, which we have analyzed, our empirical findings
provide substantial evidence that privatization has had a positive and substantial effect on the
level and growth of labor productivity. As we have shown, the statistical significance of these
effects remain robust across all specifications, although the point estimates do fluctuate
depending on the estimation method employed. Our work also strongly supports the proposition
that outsider blockholders are the most effective owners, and that among them, foreigners have
the largest positive impact on the firms; again, these results are highly robust to changes in
performance measure and estimation method.
More surprisingly, the estimated regression coefficients on disaggregated outsider owners
(MPP participants) and on insiders (MEBO participants) are also positive, although distinctly
smaller and somewhat less robustly statistically significant than the effects of outside
blockholders. Thus the data provide some evidence that even these owners have a positive
impact, relative to continued state ownership.
Why we find that the MEBO and MPP privatizations may have yielded improved
performance is a subject on which our data permits us only to speculate, but we shall do so
nevertheless. First, we should recall that our ownership measures pertain only to the
privatization transactions, and we do not observe subsequent secondary sales of shares. Perhaps
the employees and other individuals acquiring small quantities of shares through these programs

19
were quick to sell them, and possibly some concentrated owners – outsiders or managers – have
emerged and begun restructuring, although we are unable to observe this process. Second, share
prices on secondary sales, particularly in an organized exchange – either the Bucharest Stock
Exchange or the over-the-counter RASDAQ could possibly provide additional information to
outside blockholders on firm performance, suggesting some complementarity between outside
blockholder ownership with dispersed investor trading. Third, perhaps the individuals acquiring
shares through the MPP were in fact employees, adding to the concentration of ownership in
relatively few hands. Fourth, there may be selection bias such that firms with better potential
were included in the MEBOs and MPP, as discussed in Section 4 above. Finally, the data may
contain measurement error in either labor productivity or (less likely) in the ownership structure
variables, creating a spurious correlation. Such measurement error would have to be biased such
that MEBO and MPP firms have upward-biased productivity measures, as uncorrelated
measurement error would produce simply larger standard errors (for measurement error in
productivity) or downward bias in the coefficients (for measurement error in ownership).
In closing, the results appear to us strong enough to conclude that privatization has been
surprisingly successful in Romania – for the firms which have in fact been privatized. For those
that have not, our results suggest that waiting has been deleterious. Given the large state
shareholdings that remain, this suggests that a further "acceleration" of the privatization process
is in order.

20
������&������� ��������'������� A1. Construction of Ownership Time Series
Our analysis is based on unpublished data from multiple sources that we have linked together. The information on the ownership of the initially state-owned joint-stock companies is compiled from seven databases: the SOF (State Ownership Fund) Transactions Database, the SOF Portfolio Database,15 and one database for each of the five POFs. Table 13 lists the databases, the types of the company they have information on, and the relevant variables for our analysis. ��������������!����������� �
From these sources, we were able to construct a nearly complete evolution of the ownership of all initially state-owned enterprises (except companies excluded from the SOF portfolio, most notably the ������ ��������, which were not originally slated for privatization). Incomplete information in these files, however, forced us to make a number of assumptions, especially about the date of privatization and about holdings of the POFs, as we discuss below. We should also point out that the SOF has been responsible for privatizing the shares only of joint-stock ("commercial") companies, thus excluding spin-offs of shops or assets from the parent companies. In this section we report the construction of ownership time-series, our imputations when information was incomplete, and cleaning procedures.
Our starting-point in developing the ownership time-series is a data set from the SOF that we call the "Transactions Database." For all share sale transactions carried out by the SOF, this file contains the date, percentage transferred and type of buyer. Four types of buyers can be distinguished in these data: employee association, domestic individuals, domestic institutions, and foreigners. The employee association is the legal group of employees acquiring shares in a MEBO transaction, while the other three types can be assumed to be non-employee outsiders.16
This database does not contain, however, companies that had no sales transaction at all. Among such companies are those still 100 percent state-owned, and those privatized only through the Mass Privatization Program. We added these companies from a second SOF source: the "Portfolio Database." This database does not report information on the date of transaction, but this did not present any difficulty in the case of MPP privatization, because all the MPP transfers took place in 1996. The database has additional information on shares transferred directly to managers and "others," which we describe below. After matching the companies with sales transactions with the totally state-owned and the MPP firms, we obtained 8,988 companies, the total number of initially state-owned companies.
The Transactions Database also does not provide information on the status of shares initially transferred to the POFs, 30 percent in each converted joint-stock company. Although they have been putatively private since their formation in 1991, we believe it is important to distinguish the POFs from other types of owners, thus the next step in the construction of the time series was to estimate the sales of shares by these organizations. A first step relied on a variable from the portfolio database: the percentage of shares sold by the POFs from 1992 to
15 Together, they provide information on the ownership structure of over 8,900 companies, all initially state-owned firms which were in the SOF’s portfolio. (&������������� are not included, because they belonged to the branch ministry and later a number of them were transferred to the local authorities, but the SOF never had them in its portfolio). 16 The data do not allow further disaggregation; for instance, different types of domestic institutions are not distinguishable.

21
1996, before these organizations were transformed into SIFs, as we discuss in section 2.17 The number of companies where the POF is reported to have sales is relatively small, 1633. We cleaned the variable first, because there were companies in which the POF is reported to have sold more than 30 percent, which is impossible according to the Romanian privatization laws. If the POF sale was above 35 percent (14 cases), we set the POF sale to zero, while if it was between 30-35 percent (11 cases), we set it to 30 percent, the maximum amount the POF could have owned.
Because the data did not include the transaction date of POF sales, nor the type of buyer, we had to make several assumptions in order to include them in the time-series. First, we assumed that the POF always sold at the same time and to the same buyer as the SOF. Thus, if there were any sales reported in the SOF database between 1992-1996, the POF sales were included there. If the SOF privatized shares of a company on more than one date, or to multiple buyers, the percentage of the shares the POF sold was split among the SOF sales, weighted by the shares transferred by the SOF in each sale. For the majority of firms with POF sales during 1992-96, the SOF also privatized: 87 percent of the firms where the POF did some privatization had also SOF sales. For the firms that did not have SOF sales (212 firms), we distributed the POF sales evenly among the years 1993-1996, and assumed it was bought up by "others," an ownership category where we included all transactions for which the type of buyer was neither reported nor possible to impute.18 By this procedure, we computed the POF’s ownership for the end 1992-1996 by subtracting the total yearly privatization from 30, the percentage of the shares that the POF received initially.
We also estimated the ownership time-series for the SIF holdings (Financial Investment Funds, the organizations into which the POFs were transformed after 1996).19 We took this information from five portfolio databases (one for each POF). These data were available only for the end of 1998, except in the case of POF Moldova, for which it was provided also for the end of 1997.20 We combined these information with the POF holdings in 1996, which we already used for the construction of the POF time series before 1996.
We computed the POF holdings in the following way: for the POF holdings in 1996 we used the POF information, and for the few cases when this variable was missing (0.3 percent of total), we made the 1996 POF holding equal with the POF holding which was the closest in time (1997 for POF Moldova, 1998 for the others). For the four POFs which did not have information for 1997, we imputed it by comparing the holdings in 1996 with those in 1998. If there was no difference between them, the case for 83.0 percent of the companies, we computed the 1997 POF holding as being equal to these holdings. If there was a difference, we computed the POF holding for 1997 as the average of 1996 and 1998 holdings, and we added the difference to the "others" category, where we included all transactions where we did not know the type of owner.
The Portfolio Database contains two more variables representing two types of transactions: managerial shares and "others," as mentioned above. The managerial shares resulted from the Law on the Management Contract (66/93), issued in the second part of 1993, and concern only 400 companies with a mean of only 0.5 percent in this subset. In the absence 17 Not only is this information on the POF privatization rather incomplete, but the variable itself is incomplete, according to a SOF official. 18 We did not distribute the POF sales over 1992, because in this year privatization hardly began: except of pilot privatizations (21 firms) and one other took place. 19 For simplicity, we continue to call them POFs. 20 Out of the 2825 firms that existed in the POF portfolio data, 179 were not in the SOF database. These may be acquisitions of the POFs other than state-owned companies. We did not add these companies to the time-series.

22
of further information, we therefore distributed these shares evenly over the years 1994-1998, and summed it with the employee association shares to the insiders’ share. The "others" variable is positive for 227 companies with a mean of 25.6 percent. According to a SOF official, this variable probably indicates capital increases after privatization, but there is no information on which type of owner acquired these shares. Thus, we cumulated them together with the several types of unknown owners to create a miscellaneous and unknown category, distributing them evenly over 1993-1998.
Due to internal inconsistencies, for a number of cases the sum of the total privatization and the POF holdings by end 1998 exceeded 100 percent. If it was more than 110, we dropped the case (222 companies). If it was between 100-110, we rescaled it to 100. The residual category is state ownership.
A2. Construction of the Performance Variable and Final Sample
We drew the basic firm variables (activity code, number of employees and real value of sales21) from the 1992-1999 Romanian Enterprise Registries, which is supposed to contain all registered firms. We built up our database from eight different files, one for each year. Our version of these data are restricted to firms with a minimum of five employees. After adding employment and sales figures to the ownership information, we constructed our final sample by selecting all industrial firms (2354 cases).
Table 14 shows the resulting database, combining the ownership and registry information. The "percentage of firms" refers to the firms with non-missing performance data as a percentage of those with ownership information. Missing values are not a large problem in these data. Table 15 shows the distribution of firms by industrial branch: the largest categories are food industry (21.5 percent), textiles and clothing (14.4 percent) and machine building and transportation equipment (12.9 percent). ��������������"4�.����������� �
21 We deflated sales by 4-digit level PPIs, where these were available: out of a total of 367 industrial 4-digit activity codes, 75 are missing for 1993-98. The number of missing PPIs for 1999 is 91. These were replaced by 2-digit CAEN codes. For two types of activities the PPIs were not computed: calculator production (since 1997), and recycling (for all years). In these two cases we used the industry-level PPI.

23
������ �� Black, Bernard, Reiner Kraakman, and Anna Tarrassova (2000), "Russian Privatization and
Corporate Governance: What Went Wrong?" ,������������&�5���, Vol. 52. Bonin, John P., Derek C. Jones, and Louis Putterman (1993), "Theoretical and Empirical Studies
of Producer Cooperatives: Will Ever the Twain Meet?" ����������������������������, vol 31, pp. 1290-1320.
Carlin, Wendy, Saul Estrin, and Mark Schaffer (1999), "Measuring Progress in Transition and Towards EU Accession. A Comparison of Manufacturing Firms in Poland, Romania and Spain." CERT Discussion Paper No. 99/22, January.
Claessens, Stijn, Simeon Djankov, and Gerhard Pohl (1997), "Determinants of Performance of Manufacturing Firms in Seven European Transition Economies." Davidson Institute Working Paper No. 74, February.
Djankov, Simeon (1999), "The Enterprise Isolation Program in Romania." �������� ���6�������5���������, Vol. 27, pp. 281-293.
Djankov, Simeon, and Peter Murrell (2000), "Enterprise Restructuring in Transition: A Quantitative Survey." Draft of April 17.
Earle, John S., (1998), "Post-Privatization Ownership Structure and Productivity in Russian Industrial Enterprises," SITE Working Paper, Stockholm.
Earle, John S., and Saul Estrin (1996), "Worker Ownership in Transition." In Roman Frydman, Cheryl W. Gray, and Andrzej Rapaczynski (editors), 6��������$�5������� ���6�����������������&����� �������������������,����, Budapest: World Bank and CEU Press.
Earle, John S., and Saul Estrin (1997), "After Voucher Privatization: The Structure of Corproate Ownership in Russian Manufacturing Industry." CEPR Discussion Paper No. 1736, December.
Earle John S., and Dana Sapatoru (1994), “Incentive Contracts, Corporate Governance, and Privatization Funds in Romania.” ����������������������, Vol 22(2), 61-79.
Earle, John S., and Álmos Telegdy (1998), "The Results of 'Mass Privatization' in Romania: A First Empirical Study." ���������������������, Vol. 6(2), 313-32.
Ellerman, David (1993), "Management and Employee Buy-Outs in Central and Eastern Europe: Introduction." In David Ellerman, editor, '���������� ���� ���� ��� 7� 4#���� ��� �������8������%��5���9�����, Central and Eastern European Privatization Network.
Frydman, Roman, Cheryl W. Gray, Marek Hessel, and Andrzej Rapaczynski (1999), "When Does Privatization Work? The Impact of Private Ownership on Corporate Performance in the Transition Economies," :������� �������������������, Vol. CXIV(4), 1153-92.
Frydman, Roman and Andzrej Rapaczynski (1994), %��5���9��������������������������������,�����(������������� ; Central European University Press, Budapest.
Hansmann, Henry (1990), "When Does Worker Ownership Work? ESOPs, Law Firms, Codetermination, and Economic Democracy," -���������������, Vol. 99, 1749-1816.
Konings, Jozef (1997), "Competition and Firm Performance in Transition Economies: Evidence from Firm Level Surveys in Slovenia, Hungary and Romania." CEPR Discussion Paper No. 1770, December.
Konings, Jozef and Alexander Repkin (1998), "How Efficient are Firms in Transition Countries? Firm-Level Evidence from Bulgaria and Romania," CEPR Discussion Paper No. 1839.

24
Kornai, Janos (2000), "Ten Years after ’The Road to a Free Economy’: The Author’s Self-Evaluation." Paper for the World Bank Annual Conference on Development Economics, Washington DC.
Megginson, William L., and Jeffry M. Netter (2000), "From State to Market: a Survey of Empirical Studies on Privatization." Draft paper.
Munteanu, Costea (1997), "Employee Share-Ownership in Romania: The Main Path to Privatization." In Milica Uvalic and Vaugham, Eds., %��5���9������ ,�������� �������������� ���������� ���� ��4#�������� ��� 6������� ���� �������� �����, Cheltenham, U.K., and Lyme, N.H.: Elgar.
Negrescu, Dragos (2000), "A Decade of Privatization in Romania." In Christof Ruhl and Daniel Daianu, Eds., ���� ������� ����������� ��� &�������� � %���<� %������<� ���� =�����, Bucharest: World Bank and Romanian Center for Economic Policies.
Romanian Development Agency (1997), &�������-���>������5��������$����. Roland, Gerard (2000), "Corporate Governance and Transition Economies: Lessons from
Transition." Paper presented at the World Bank Annual Conference on Development Economics, Washington DC.
Stiglitz, Joseph (1999), "Wither Reform? Ten Years of the Transition." Paper presented at the World Bank Annual Conference on Development Economics, Washington DC.
Villalonga, Belén (2000), "Privatization and Efficiency: Differentiating Ownership Effects from Political, Organizational, and Dynamic Effects." �������� ��� ������� 7���5���� ����#�����9�����, Vol. 42, pp. 43-74.

25
(�����Table 1. Post-Privatization Ownership Structure, End-1998 (conditional on a non-zero ownership share in the firm)
Type of Owner
Mean ownership (percent)
Median ownership (percent)
Number of firms
Number of firms with majority
ownership MEBO participants* 64.9 70.6 858 519 MPP participants** 24.5 18.4 1747 296 Domestic blockholders 52.7 42.3 378 173 Foreigners 56.6 51.0 98 72 Others*** 10.4 1.2 693 18 State 46.9 50.9 1822 935 POF 20.1 18.6 941 32 Total number of firms: 2354 *Employees who obtained shares through Management-Employee Buyouts **Individuals who obtained shares within the Mass Privatization Program ***Owners not classifiable with available information Table 2. Evolution of the Ownership Structure: Average Percent at Year-End Type of Owner 1992 1993 1994 1995 1996 1997 1998 MEBO participants* 0.2 3.0 9.6 17.5 21.3 22.1 23.6 MPP participants** 0.0 0.0 0.0 0.0 18.2 18.2 18.2 Domestic Blockholders 0.0 0.0 0.4 0.6 2.3 4.1 8.5 Foreign 0.1 0.1 0.2 0.2 0.3 0.9 2.4 Others*** 0.0 0.4 0.8 1.2 1.3 2.1 3.1 (����������� )�$ "�* ���) �+�* $"�$ $,�" %%�,POF 29.8 28.7 26.4 23.9 9.1 8.7 8.0 State 69.7 67.7 62.6 56.5 47.5 44.0 36.3 N.B. Percentage of firms majority private****
0.4 3.3 10.3 18.4 38.7 43.8 53.8
Number of firms: 2354 *Employees who obtained shares through Management-Employee Buyouts **Individuals who obtained shares within the Mass Privatization Program ***Owners not classifiable with available information ****Percentage of firms with more than 50 percent of shares privately owned
26
Table 3. Largest Owner-Type: Percent of Firms at the End of Year Type of Owner 1992 1993 1994 1995 1996 1997 1998 MEBO participants* 0.2 3.0 9.7 17.4 21.5 22.3 24.5 MPP participants** 0.0 0.0 0.0 0.0 13.5 14.0 14.2 Domestic Blockholders 0.1 0.1 0.5 0.8 2.1 3.9 9.3 Foreign 0.1 0.1 0.1 0.3 0.3 1.2 3.3 Others*** 0.0 0.0 0.0 0.0 0.2 0.5 1.0 POF 0.0 0.0 0.0 0.0 0.1 0.2 0.2 State 99.6 96.7 89.7 81.6 62.3 58.0 47.6 Total 100.0 100.0 100.0 100.0 100.0 100.0 100.0 Number of firms: 2354 *Employees who obtained shares through Management-Employee Buyouts **Individuals who obtained shares within the Mass Privatization Program ***Owners not classifiable with available information
Table 4. Summary Statistics for Employment, Real Sales and Labor Productivity 1992 1993 1994 1995 1996 1997 1998 1999
Mean 1154.3 1009.5 901.8 812.9 783.6 723.3 614.0 512.2 Level of employment
Std. Dev. 1778.0 1664.2 1598.6 1535.8 1524.3 1437.1 1250.3 1079.3
Mean 2072.1 2225.1 1835.6 1898.2 1881.1 1714.7 1449.7 1250.9 Real value of sales*
Std. Dev. 5188.2 7664.0 7867.9 8923.4 8360.7 9021.6 8288.2 6274.1
Mean 2.07 2.08 1.67 1.84 1.88 1.71 1.70 1.86 Labor productivity**
Std. Dev. 2.87 2.70 2.35 2.44 2.38 2.30 2.66 2.49
Number of firms 1931 2074 2115 2134 2179 2138 2202 2168 *Thousands of 1992 lei **Real value of sales divided by employment

27
Table 5: Impact of Privatization on the Level of Productivity Dependent variable: Log Labor Productivity OLS Median Fixed effects Coeff. Std.
Error Coeff. Std.
Error Coeff. Std.
Error Private share 0.185** 0.017 0.131** 0.011 0.225** 0.018 POF share 0.183** 0.040 0.119** 0.030 0.297** 0.046 Lagged productivity 0.823** 0.009 0.898** 0.004 0.402** 0.008 Lagged employment 0.047** 0.004 0.027** 0.002 0.107** 0.011 1994 -0.281** 0.015 -0.286** 0.011 -0.241** 0.013 1995 -0.007 0.015 -0.018 0.011 -0.052** 0.013 1996 -0.074** 0.014 -0.094** 0.011 -0.075** 0.014 1997 -0.222** 0.016 -0.208** 0.012 -0.199** 0.016 1998 -0.204** 0.016 -0.210** 0.012 -0.230** 0.017 1999 -0.095** 0.018 -0.075** 0.012 -0.144** 0.019 R2 0.733 0.553 0.215 Notes: Number of observations: 14,532. &�� adjusted R-sq for OLS, pseudo R-sq for median regression, R-sq within for fixed effects regressions. #��������5��������� One year lagged values. Robust standard errors for OLS. OLS and median regressions include controls for region (6 categories) and industry (14 categories). ** = significant at 1 percent level * = significant at 5 percent level Table 6: Impact of Privatization on Productivity Growth Dependent variable: Yearly Change in Log Labor Productivity OLS Median Fixed effects Coeff. Std.
Error Coeff. Std.
Error Coeff. Std.
Error Private share 0.105** 0.018 0.086** 0.011 0.114** 0.021 POF share 0.105** 0.041 0.081** 0.030 0.050 0.055 Lagged employment 0.022** 0.004 0.012** 0.002 0.168** 0.013 1994 -0.300** 0.016 -0.290** 0.011 -0.288** 0.015 1995 0.012 0.016 -0.004 0.011 0.044** 0.016 1996 -0.069** 0.015 -0.095** 0.011 -0.027 0.017 1997 -0.215** 0.016 -0.201** 0.012 -0.177** 0.020 1998 -0.179** 0.017 -0.189** 0.012 -0.136** 0.020 1999 -0.058** 0.019 -0.049** 0.013 0.001 0.022 R2 0.078 0.059 0.076 Notes: Number of observations: 14,532. &�� adjusted R-sq for OLS, pseudo R-sq for median regression, R-sq within for fixed effects regression. ��#��������5��������� One year lagged values. Robust standard errors for OLS. OLS and median regressions include controls for region (6 categories) and industry (14 categories). ** = significant at 1 percent level * = significant at 5 percent level

28
Table 7: Effect of Majority Privatization over Time on the Level of Productivity Dependent variable: Log Labor Productivity
OLS Median Fixed effects Number of years since privatization Coeff. Std.
Error Coeff. Std.
Error Coeff. Std.
Error Year 0 0.061** 0.013 0.043** 0.011 0.041** 0.014 Year 1 0.138** 0.016 0.089** 0.012 0.124** 0.016 Year 2 0.093** 0.016 0.077** 0.013 0.119** 0.018 Year 3 0.130** 0.023 0.098** 0.018 0.145** 0.025
Year 4-7 0.087** 0.029 0.058** 0.021 0.097** 0.031 R2 0.746 0.558 0.200
Notes: Number of observations: 12,393. &�� adjusted R-sq for OLS, pseudo R-sq for median regression, R-sq within for fixed effects regressions. Robust standard errors for OLS. All regressions include controls for previous performance, employment size and year effects. OLS and median regressions also include controls for region (6 categories) and industry (14 categories). ** = significant at 1 percent level * = significant at 5 percent level Table 8: Effect of Majority Privatization over Time on Productivity Growth Dependent variable: Change in Log Labor Productivity
OLS Median Fixed effects Number of years since privatization Coeff. Std.
Error Coeff. Std.
Error Coeff. Std.
Error Year 0 0.035** 0.013 0.034** 0.012 0.026 0.017 Year 1 0.105** 0.016 0.069** 0.013 0.101** 0.020 Year 2 0.042** 0.016 0.058** 0.014 0.044* 0.023 Year 3 0.055** 0.022 0.047** 0.020 0.051 0.031
Year 4-7 -0.005 0.022 -0.007 0.023 0.003 0.039 R2 0.091 0.064 0.077
Notes: Number of observations: 12,393. &�� adjusted R-sq for OLS, pseudo R-sq for median regression, R-sq within for fixed effects regressions. Robust standard errors for OLS. All regressions include controls for previous performance, employment size and year effects. OLS and median regressions also include controls for region (6 categories) and industry (14 categories). ** = significant at 1 percent level * = significant at 5 percent level

29
Table 9: Impact of Types of Owners on the Level of Productivity Dependent variable: Log Labor Productivity OLS Median Fixed effects Ownership shares:
Coeff. Std. Error
Coeff. Std. Error
Coeff. Std. Error
Foreign 0.423** 0.101 0.274** 0.046 0.352** 0.072 Domestic 0.319** 0.048 0.275** 0.027 0.403** 0.040 MEBO Partics. 0.161** 0.017 0.114** 0.011 0.178** 0.021 MPP Partics. 0.174** 0.034 0.107** 0.023 0.190** 0.036 POF 0.167** 0.040 0.114** 0.030 0.264** 0.047 Others 0.263** 0.074 0.179** 0.053 0.300** 0.106 R2 0.734 0.553 0.218 Notes: Number of observations: 14,532. &�� adjusted R-sq for OLS, pseudo R-sq for median regression, R-sq within for fixed effects regressions. #��������5��������� One year lagged values. Robust standard errors for OLS. All regressions include controls for previous performance, employment size and year effects. OLS and median regressions also include controls for region (6 categories) and industry (14 categories). ** = significant at 1 percent level * = significant at 5 percent level Table 10: Impact of Types of Owners on Productivity Growth Dependent variable: Change in Log Labor Productivity OLS Median Fixed effects Ownership shares:
Coeff. Std. Error
Coeff. Std. Error
Coeff. Std. Error
Foreign 0.295** 0.108 0.161** 0.048 0.252** 0.085 Domestic 0.262** 0.049 0.209** 0.028 0.319** 0.047 MEBO Partics. 0.073** 0.017 0.068** 0.012 0.045 0.025 MPP Partics. 0.132** 0.034 0.108** 0.024 0.126** 0.043 POF 0.081* 0.041 0.067* 0.032 0.009 0.056 Others 0.089 0.078 0.108 0.056 -0.026 0.126 R2 0.081 0.060 0.079 Notes: Number of observations: 14,532. &�� adjusted R-sq for OLS, pseudo R-sq for median regression, R-sq within for fixed effects regressions. Robust standard errors for OLS.��#��������5��������� One year lagged values. All regressions include controls for previous performance, employment size and year effects. OLS and median regressions also include controls for region (6 categories) and industry (14 categories). ** = significant at 1 percent level * = significant at 5 percent level

30
Table 11: Impact of the Largest Owner-Type on the Level of Productivity Dependent variable: Log Labor Productivity OLS Median Fixed effects Largest Owner-Type:
Coeff. Std. Error
Coeff. Std. Error
Coeff. Std. Error
Foreign 0.265** 0.069 0.175** 0.033 0.165** 0.047 Domestic 0.180** 0.030 0.151** 0.019 0.199** 0.028 MEBO Partics. 0.104** 0.011 0.070** 0.009 0.101** 0.016 MPP Partics. 0.073** 0.017 0.053** 0.013 0.084** 0.019 POF 0.144 0.092 0.070 0.095 0.227 0.137 Others 0.291** 0.088 0.173** 0.058 0.337** 0.083 R2 0.733 0.553 0.213 Note: Number of observations: 14,532. &�� adjusted R-sq for OLS, pseudo R-sq for median regression, R-sq within for fixed effects regressions. #��������5��������� One year lagged values. Robust standard errors for OLS. All regressions include controls for previous performance, employment size and year effects. OLS and median regressions also include controls for region (6 categories) and industry (14 categories). ** = significant at 1 percent level * = significant at 5 percent level Table 12: Impact of the Largest Owner-Type on Productivity Growth Dependent variable: Change in Log Labor Productivity OLS Median Fixed effects Largest Owner-Type:
Coeff. Std. Error
Coeff. Std. Error
Coeff. Std. Error
Foreign 0.178** 0.074 0.110** 0.034 0.120* 0.056 Domestic 0.141** 0.031 0.116** 0.020 0.159** 0.033 MEBO Partics. 0.047** 0.011 0.038** 0.009 0.032 0.019 MPP Partics. 0.072** 0.017 0.052** 0.013 0.087** 0.023 POF 0.125 0.092 0.088 0.098 0.152 0.163 Others 0.229** 0.092 0.124* 0.060 0.209* 0.099 R2 0.079 0.059 0.077 Note: Number of observations: 14,532. &�� adjusted R-sq for OLS, pseudo R-sq for median regression, R-sq within for fixed effects regressions. #��������5��������� One year lagged values. Robust standard errors for OLS. All regressions include controls for previous performance, employment size and year effects. OLS and median regressions also include controls for region (6 categories) and industry (14 categories). ** = significant at 1 percent level * = significant at 5 percent level

31
Table 13: Sources of the Data '������� ������������'������� �������-��������SOF Transactions Database
All sales that the SOF completed since the beginning of its activity by 1999:I.
Date of transaction County Percent of shares transacted Book value of the firm Method of privatization Type of buyer
SOF Portfolio Database
All companies that the SOF ever had in its portfolio.
County Industry code Percent owned by the SOF Percent sold by the POF by the end of the MPP Percent owned by the POF after the MPP Percent owned directly by managers Percent owned by "others" Percent distributed in the MPP
POF Crisana-Banat Companies with POF holding in December 1998.
POF holding in December 1998
POF Moldova Companies with POF holding in 1997 and 1998.
POF holding in December 1997 and 1998
POF Muntenia Companies with POF holding in 1998.
POF holding in December 1998
POF Oltenia Companies with POF holding in 1998.
POF holding in December 1998
POF Transilvania Companies with POF holding in 1998.
POF holding in December 1998
Romanian Enterprise Registry 1992-1999 (one database for each year)
All registered enterprises with at least 5 employees at the end of the given year.
County Industry Turnover Number of employees
Note: firm ID included in all databases

32
Table 14: Number of Firms with Non-Missing Employment and Turnover Data Year 1992 1993 1994 1995 1996 1997 1998 1999 Number of firms 1931 2074 2115 2134 2179 2183 2202 2168 Percent of firms 82.0 88.1 89.8 90.7 92.6 92.7 93.5 92.1 Total number of firms: 2354 Table 15. Distribution of Firms by Industry Percent of firms Industry Number
of firms Percent of firms
Extraction, energy, water supply 131 5.6 Food 509 21.6 Textiles, clothing 338 14.4 Leather, footwear 53 2.2 Wood, paper 108 4.6 Polygraphy 76 3.2 Chemistry, plastics, rubber 159 6.8 Ceramics 151 6.4 Metallurgy 69 2.9 Metallic constructions 186 7.9 Machine building and transportation equip. 300 12.7 Electrical and optical equip. 83 3.5 Furniture and other unclassified 146 6.2 Recycling 45 1.9 (���� �"%$ �))�)

�������������� ����� �� �������� ������
���� � � ���
241
W. Koeniger
Trade, Labor Market Rigidities, and Government-Financed Technological Change
2 01/01
242
G. Faggio J. Konings
Job Creation, Job Destruction and Employment Growth in Transition Countries in the 90’s
4 01/01
243
E. Brainerd
Economic Reform and Mortality in the Former Soviet Union: A Study of the Suicide Epidemic in the 1990s
4 01/01
244
S. M. Fuess, Jr. M. Millea
Pay and Productivity in a Corporatist Economy: Evidence from Austria
5 01/01
245
F. Andersson K. A. Konrad
Globalization and Human Capital Formation
5 01/01
246
E. Plug W. Vijverberg
Schooling, Family Background, and Adoption: Does Family Income Matter?
5 01/01
247
E. Plug W. Vijverberg
Schooling, Family Background, and Adoption: Is it Nature or is it Nurture?
5 01/01
248
P. M. Picard E. Toulemonde
The Impact of Labor Markets on Emergence and Persistence of Regional Asymmetries
2 01/01
249
B. M. S. van Praag P. Cardoso
“Should I Pay for You or for Myself?” The Optimal Level and Composition of Retirement Benefit Systems
3 01/01
250
T. J. Hatton J. G. Williamson
Demographic and Economic Pressure on Emigration out of Africa
1 01/01
251
R. Yemtsov
Labor Markets, Inequality and Poverty in Georgia
4 01/01
252
R. Yemtsov
Inequality and Income Distribution in Georgia
4 01/01
253
R. Yemtsov
Living Standards and Economic Vulnerability in Turkey between 1987 and 1994
4 01/01
254
H. Gersbach A. Schniewind
Learning of General Equilibrium Effects and the Unemployment Trap
3 02/01
255
H. Gersbach A. Schniewind
Product Market Reforms and Unemployment in Europe
3 02/01
256
T. Boeri H. Brücker
Eastern Enlargement and EU-Labour Markets: Perceptions, Challenges and Opportunities
2 02/01
257
T. Boeri
Transition with Labour Supply
4 02/01
258
M. Rosholm K. Scott L. Husted
The Times They Are A-Changin’: Organizational Change and Immigrant Employment Opportunities in Scandinavia
1 02/01
259
A. Ferrer-i-Carbonell B. M.S. van Praag
Poverty in the Russian Federation
4 02/01
260
P. Cahuc F. Postel-Vinay
Temporary Jobs, Employment Protection and Labor Market Performance
1/3 02/01
261
M. Lindahl
Home versus School Learning: A New Approach to Estimating the Effect of Class Size on Achievement
5 02/01
262
M. Lindahl
Summer Learning and the Effect of Schooling: Evidence from Sweden
5 02/01
263 N. Datta Gupta N. Smith
Children and Career Interruptions: The Family Gap in Denmark
5 02/01
264 C. Dustmann Return Migration, Wage Differentials, and the
Optimal Migration Duration 1 02/01
265 M. Rosholm
M. Svarer
Structurally Dependent Competing Risks
1 02/01
266 C. Dustmann O. Kirchkamp
The Optimal Migration Duration and Activity Choice after Re-migration
1 02/01
267 A. Newell
The Distribution of Wages in Transition Countries
4 03/01
268 A. Newell B. Reilly
The Gender Pay Gap in the Transition from Communism: Some Empirical Evidence
4 03/01
269 H. Buddelmeyer
Re-employment Dynamics of Disabled Workers
3 03/01
270 B. Augurzky
C. M. Schmidt
The Evaluation of Community-Based Interventions: A Monte Carlo Study
6 03/01
271 B. Augurzky
C. M. Schmidt
The Propensity Score: A Means to An End 6 03/01

272 C. Belzil J. Hansen
Heterogeneous Returns to Human Capital and Dynamic Self-Selection
5 03/01
273 G. Saint-Paul
Distribution and Growth in an Economy with Limited Needs
5 03/01
274 P. J. Pedersen N. Smith
Unemployment Traps: Do Financial Dis-incentives Matter?
3 03/01
275 G. S. Epstein T. Lecker
Multi-Generation Model of Immigrant Earnings: Theory and Application
1 03/01
276 B. Amable D. Gatti
The Impact of Product Market Competition on Employment and Wages
5 03/01
277 R. Winter-Ebmer Evaluating an Innovative Redundancy-Retraining
Project: The Austrian Steel Foundation
6 03/01
278 T. M. Andersen
Welfare Policies, Labour Taxation and Inter-national Integration
2 04/01
279 T. M. Andersen
Product Market Integration, Wage Dispersion and Unemployment
2 04/01
280 P. Apps R. Rees
Household Saving and Full Consumption over the Life Cycle
7 04/01
281 G. Saint-Paul
Information Technology and the Knowledge Elites
5 04/01
282 J. Albrecht A. Björklund S. Vroman
Is There a Glass Ceiling in Sweden?
5 04/01
283 M. Hagedorn A. Kaul V. Reinthaler
Welfare Analysis in a Schumpeterian Growth Model with Capital
7 04/01
284 H. Rapoport A. Weiss
The Optimal Size for a Minority
1 04/01
285 J. Jerger C. Pohnke A. Spermann
Gut betreut in den Arbeitsmarkt? Eine mikroökonometrische Evaluation der Mannheimer Arbeitsvermittlungsagentur
5 04/01
286 M. Fertig C. M. Schmidt
First- and Second-Generation Migrants in Germany –What Do We Know and What Do People Think
1 04/01

287 P. Guggenberger A. Kaul M. Kolmar
Efficiency Properties of Labor Taxation in a Spatial Model of Restricted Labor Mobility
3 04/01
288 D. A. Cobb-Clark
Getting Ahead: The Determinants of and Payoffs to Internal Promotion for Young U.S. Men and Women
5 04/01
289 L. Cameron D. A. Cobb-Clark
Old-Age Support in Developing Countries: Labor Supply, Intergenerational Transfers and Living Arrangements
3 04/01
290
D. A. Cobb-Clark M. D. Connolly C. Worswick
The Job Search and Education Investments of Immigrant Families
1 04/01
291
R� T. Riphahn
Cohort Effects in the Educational Attainment of Second Generation Immigrants in Germany: An Analysis of Census Data
1 05/01
292
E. Wasmer
Between-group Competition in the Labor Market and the Rising Returns to Skill: US and France 1964-2000
5 05/01
293
D. Cobb-Clark T. F. Crossley
Gender, Comparative Advantage and Labor Market Activity in Immigrant Families
1 05/01
294
Š. Jurajda
Estimating the Effect of Unemployment Insurance Compensation on the Labor Market Histories of Displaced Workers
3 05/01
295
F. Duffy P. P. Walsh
Individual Pay and Outside Options: Evidence from the Polish Labour Force Survey
4 05/01
296
H. S. Nielsen M. Rosholm N. Smith L. Husted
Intergenerational Transmissions and the School-to-Work transition of 2nd Generation Immigrants
1 05/01
297
J. C. van Ours J. Veenman�
The Educational Attainment of Second Generation Immigrants in The Netherlands
1 05/01
298
P. Telhado Pereira P. Silva Martins �
Returns to Education and Wage Equations 5 06/01
299
G. Brunello C. Lucifora R. Winter-Ebmer
The Wage Expectations of European College Students
5 06/01
300
A. Stutzer R. Lalive
The Role of Social Work Norms in Job Searching and Subjective Well-Being
5 06/01

301
J. R. Frick G.G. Wagner
Economic and Social Perspectives of Immigrant Children in Germany �
1 06/01
302
G. S. Epstein A. Weiss
A Theory of Immigration Amnesties
1 06/01
303
G. A. Pfann B. F. Blumberg
Social Capital and the Uncertainty Reduction of Self-Employment
5 06/01
304
P. Cahuc E. Wasmer
Labour Market Efficiency, Wages and Employ-ment when Search Frictions Interact with Intra-firm Bargaining
2 06/01
305
H. Bonin
Fiskalische Effekte der Zuwanderung nach Deutschland: Eine Generationenbilanz
1 06/01
306
H. Bonin G. Abío E. Berenguer J. Gil C. Patxot
Is the Deficit under Control? A Generational Accounting Perspective on Fiscal Policy and Labour Market Trends in Spain
2 06/01
307
G. A. Pfann
Downsizing
1/5 06/01
308
G. A. Pfann D. S. Hamermesh
Two-Sided Learning, Labor Turnover and Worker Displacement
1 06/01
309
G. Brunello On the Complementarity between Education and Training in Europe
�
5 06/01
310
U. Sunde Human Capital Accumulation, Education and Earnings Inequality
�
5 06/01
311
G. Brunello Unemployment, Education and Earnings Growth �
3 06/01
312
C. Furnée M. Kemler G. A. Pfann
The Value of Pain Relief �
5 06/01
313
A. Ferrer-i-Carbonell B. M.S. van Praag
The Subjective Costs of Health Losses due to Chronic Diseases: An Alternative Model for Monetary Appraisal
�
7 06/01
314
B. M.S. van Praag A. Ferrer-i-Carbonell
Age-Differentiated QALY Losses
�
7 06/01

315
W. H. J. Hassink R. Schettkat
On Price-Setting for Identical Products in Markets without Formal Trade Barriers
7 06/01
316
M. Frondel C. M. Schmidt
Rejecting Capital-Skill Complementarity at all Costs
5 06/01
317
R. Winkelmann
Health Care Reform and the Number of Doctor Visits – An Econometric Analysis
7 06/01
318
M. Pannenberg G. G. Wagner
Overtime Work, Overtime Compensation and the Distribution of Economic Well-Being: Evidence for West Germany and Great Britain
1 06/01
319
R. Euwals R. Winkelmann
Why do Firms Train? Empirical Evidence on the First Labour Market Outcomes of Graduated Apprentices
1 06/01
320
R. Fahr U. Sunde
Strategic Hiring Behavior in Empirical Matching Functions
1 06/01
321
P. Telhado Pereira��P. Silva Martins
Is there a Return – Risk Link in Education?
5 07/01
322
O. Hübler U. Jirjahn
Works Councils and Collective Bargaining in Germany: The Impact on Productivity and Wages
1 07/01
323
A. Frederiksen E. K. Graversen N. Smith
Overtime Work, Dual Job Holding and Taxation
1 07/01
324
M. Pflüger
Trade, Technology and Labour Markets: Empirical Controversies in the Light of the Jones Model
2 07/01
325
R. A. Hart J. R. Malley U. Woitek
Real Wages and the Cycle: The View from the Frequency Domain
1 07/01
326
J. S. Earle Á. Telegdy
Privatization and Productivity in Romanian Industry: Evidence from a Comprehensive Enterprise Panel
4 07/01
An updated list of IZA Discussion Papers is available on the center‘s homepage �����������.


