Embed Size (px)
Citation preview
Engineering Structures 134 (2017) 236–252
Contents lists available at ScienceDirect
Engineering Structures
journal homepage: www.elsevier .com/locate /engstruct
Estimating number of simultaneously yielding stories in a shear buildingsubjected to full-sine pulse velocity base excitation
http://dx.doi.org/10.1016/j.engstruct.2016.12.0230141-0296/� 2016 Elsevier Ltd. All rights reserved.
⇑ Corresponding author.E-mail addresses: [email protected] (L. Shrestha), [email protected]
(M. Bruneau).1 Formerly Graduate Research Assistant, Dept. of Civil, Structural and
Environmental Engineering, University at Buffalo, Buffalo, NY 14260, USA.
Lisa Shrestha a,⇑,1, Michel Bruneau b
a Structural Engineer, Earthquake Engineering Research and Consultation Center, Kathmandu, NepalbDept. of Civil, Structural and Environmental Engineering, University at Buffalo, The State University of New York Buffalo, New York, USA
a r t i c l e i n f o a b s t r a c t
Article history:Received 12 April 2016Revised 14 October 2016Accepted 14 December 2016
Keywords:Simultaneous story yieldingAxial force demandColumn designWave propagationSeismic designMultistory buildingsShear buildingsPulse excitation
Past research has shown that seismic force demands in the columns of lateral load resisting systemsdepend on the number of simultaneously yielding stories (NSYS) above the column considered. Currentdesign procedures for steel frames (e.g., those in AISC-341) typically specify that all stories are consideredto be yielding. Time history analyses show that this assumption may be overly conservative for tall build-ings. No systematic procedure exists for estimating this NSYS. Concepts of wave propagation theory areused here in seeking such a procedure. As a first step towards that goal, research was conducted to inves-tigate the NSYS due to an incident wave in a shear-type building subjected to full-sine velocity base exci-tation, to understand the relationships between input excitation, inter-story drifts, story forces, andhence to formulate a procedure to estimate the NSYS along the building height. Story yielding capacityof a base excitation was found to depend on the magnitude of its velocity record. Accordingly, a param-eter vy was defined that determines the minimum magnitude of the velocity wave required to yield astory. Mathematical expressions were derived to predict the beginning and end of story yielding dueto the incident wave. With this, NSYS values at any instant as the incident wave propagates up the buildingcould be determined. This estimation procedure was found to provide good estimates of the actual yield-ing for structures considered here that have vy values decreasing with height, with the estimated valuesbeing on the conservative side.
� 2016 Elsevier Ltd. All rights reserved.
1. Introduction
In design procedures based on capacity design principles, suchas the AISC 341-10 Seismic Provisions for Structural Steel Buildings[1], the axial force demand in columns of a seismic force resistingsystem (SFRS) is often specified to be obtained by considering thatall the ductile members along the height of the SFRS have yieldedsimultaneously. However, time history analyses show thatalthough occurrence of simultaneous yielding over the entireheight of a building may occur in low-rise structures, it is not nec-essarily the case for mid to high-rise structures. Studies on seismicdemands in columns have been done and techniques for estimat-ing column demands have been proposed in the past (e.g., by Red-wood and Channagiri [2], Tremblay and Robert [3], Lacerte andTremblay [4], Richards [5], to name a few). Many of these studies
report that maximum column axial forces occur when the plasticyielding mechanism is developed over multiple consecutive storiesabove the level under consideration. For example, for bracedframes, Redwood and Channagiri [2] proposed that the axial forcedemand in the column at a particular level be obtained by addingthe vertical component of the ultimate brace forces immediatelyabove that story, to the SRSS of vertical forces from all the otherbraces above that level, while Lacerte and Tremblay [4] proposeda method that considered the forces in critical braces as 1.0 and1.2 times the expected brace capacity in tension and compression,respectively, and brace forces in all the other floors as thoseobtained when brace buckling initiates in these stories. Richards[5] investigated the demands on seismic columns of various typesof braced frames considering four different system strengths andthree different structural heights and reported that performingcapacity design assuming simultaneous yielding over the entireheight of tall buildings was in some cases overly conservative.These studies have typically been empirical, relying on non-linear time history analysis of a number of typical frames. Whilethese have provided valuable (but limited) insights on seismicdemand in columns, there is much to gain by developing a
L. Shrestha, M. Bruneau / Engineering Structures 134 (2017) 236–252 237
systematic and generalized way to estimate the expected numberof simultaneously yielding stories (NSYS) in building frames,because this is an essential step towards being able to determinecolumn forces from a modified capacity design perspective. Inabsence of such a procedure, the capacity-design approach asimplemented in current design procedures could severely overesti-mate the actual axial demands on columns, resulting in overde-signed and economically inefficient columns.
Towards the above goal, the authors undertook to investigatewhether wave propagation theory could be used to develop a sys-tematic procedure for estimating the number of simultaneouslyyielding stories, and, eventually, axial force demand in columns.Three essential steps are envisioned for this purpose: First, a proce-dure must be developed for estimating the number of simultane-ously yielding stories in a simple shear building subjected tovelocity-pulse base excitation; Second, this procedure must beadapted as necessary for shear buildings subjected to actual earth-quake excitations, in the perspective that earthquakes can be rep-resented as a series of pulses, and; Third, a procedure must beformulated to estimate the axial force demand in columns consid-ering the force transferred from the simultaneously yielding storiesand the other non-yielded stories above the column underconsideration.
This paper focuses only on the first of these steps, by investigat-ing the number of simultaneous yielding stories due to an incidentwave in a tall shear type building subjected to full-sine velocitybase excitation, to understand the relationships between inputexcitation, inter-story drifts, story forces, and hence to formulatea procedure to estimate the number of simultaneously yieldingstories along the building height. Although some researchers havepreviously used wave propagation analysis or aspects of wavepropagation theory to find or understand the response of struc-tures due to pulses and earthquakes (e.g., Clough and Penzien[6], Humar [7], Safak [8], Hall et al. [9], Krishnan and Muto [10])and for system identification and health monitoring (e.g. Sneiderand Safak [11], Todorovska and Trifunac [12], Todorovska and Tri-funac [13], Todorovska and Rahmani [14], Ebrahimian and Todor-ovska [15]), the concepts and approach presented here to obtainthe number of simultaneously yielding stories and axial forcedemand in columns is novel.
Note that tall structures like those considered in the study pre-sented here are also subjected to flexural deformations. However,in this initial work, buildings deforming only in shear are consid-ered. Using such a simple model allows to investigate the validityand potential of the concepts before considering applications tomore complicated structures.
2. Concepts of wave propagation to find number ofsimultaneously yielding stories
2.1. Magnitude of velocity wave required to cause story yielding
A ground displacement is taken here as an excitation at the baseof a building, generating a traveling wave along its height. Based onclassical wave propagation theory, for a shear building with uni-form story height and mass, with no damping, and within elasticrange, displacement at any point x and instant t can be expressedas a combination of forward and backward propagating displace-ment waves along the height of the building. Here, the forwardand backward traveling displacement waves have been denotedas uf and ub, respectively, as shown in Eq. (1).
uðx; tÞ ¼ uf ðx� ctÞ þ ubðxþ ctÞ ð1Þ
where, c is the velocity of a propagating wave. Similarly, shearstrain s at any point can also be expressed as a summation of
forward and backward moving waves as shown in Eq. (2) and canbe expressed in terms of displacement waves as shown in Eq. (3).
s ¼ sf þ sb ð2Þ
@u@x
¼ @uf
@xþ @ub
@xð3Þ
The corresponding velocity v, and forward and backward veloc-ity waves vf and vb are expressed as in Eq. (4), and related to dis-placement and shear strain as per Eqs. (5) and (6), respectively.
v ¼ v f þ vb ð4Þor,
@u@t
¼ @uf
@tþ @ub
@tð5Þ
or,
@u@t
¼ �c@uf
@xþ c
@ub
@x¼ cð�sf þ sbÞ ð6Þ
For buildings having shear-type lateral-load resisting systems(a.k.a. shear buildings or shear frames), the corresponding elasticshear force induced at a particular story in a building is determinedby Eq. (7), where V is the story shear force, K is the shear stiffness,and @u
@x is the shear strain at that story.
V ¼ K � @u@x
ð7Þ
Story yielding occurs when the story shear force reaches itsyield capacity Vp. If the corresponding shear strain is representedas @u
@x
� �y, then the force deformation relationship, at the onset of
story yielding, can be expressed as:
Vp ¼ K � @u@x
� �y
ð8Þ
or, rearranging Eq. (8),
@u@x
� �y
¼ Vp
Kð9Þ
Also, if k is the story stiffness and h is the story height, shearstiffness K can be expressed as:
K ¼ k� h ð10ÞThen, Eq. (9) can be written as:
@u@x
� �y¼ Vp
khð11Þ
Thus, @u@x
� �yis the shear strain required to yield a story with story
stiffness of k and shear yield capacity of Vp.Shear strain can also be expressed as a combination of forward
and backward moving velocity waves expressed in Eq. (12).
@u@x
¼ 1c
� @uf
@tþ @ub
@t
� �¼ 1
cð�v f þ vbÞ ð12Þ
Substituting Eq. (12) in Eq. (11) and rearranging the terms, oneobtains:
ð�v f þ vbÞy ¼chVp
kð13Þ
The left hand side can be denoted as vy since it gives a measureof the minimum magnitude of the linear combination of the for-ward and backward moving velocity waves required to causeyielding in the story and it depends on the structural property of

Fig. 1. Points along the velocity wave corresponding to the beginning and end ofyielding at jth story.
2 For interpretation of color in Figs. 2 and 10, the reader is referred to the webersion of this article.
238 L. Shrestha, M. Bruneau / Engineering Structures 134 (2017) 236–252
the building under consideration. Denoting the time taken by thewave to travel through the story with height h as th, then vy canalso be expressed as:
vy ¼ ð�v f þ vbÞy ¼Vp
kthð14Þ
Since,
c ¼ffiffiffiffiffiffikhm
rð15Þ
where, m is the story mass. Time taken by the wave to travelthrough story height h can be calculated using Eq. (16).
th ¼ hc¼
ffiffiffiffiffiffiffimhk
rð16Þ
The advantage of expressing shear strain in terms of velocity inEq. (12) and obtaining a measure of story yielding in terms ofvelocity in Eq. (14), is that it enables to readily use the groundmotion velocity input to determine its potential to cause yieldingin the stories, as will be shown below.
Since shear force can also be expressed as a product of storystiffness k and inter-story drift Du,
V ¼ k� Du ð17Þ
Then, from Eqs. (7), (10), (12), and (17)
)� v f þ vb ¼ Vkth
¼ Duth
ð18Þ
The summation of the backward moving velocity wave and thenegative value of the forward moving velocity wave (i.e., �vf + vb)can also be expressed as Du/th, and will be referred to as the Du/th wave.
2.2. Estimating number of simultaneously yielding stories
As a Du/th wave enters a story, yielding initiates when the valueof the wave at that story exceeds its vy value. As the wave propa-gates further, the story continues to yield. For simplicity, it isassumed that yielding at a story occurs as long as the value ofthe wave exceeds the vy value of the story and stops once the valueof the wave decreases below the vy value. For example, if storyyielding due to the incident wave of the full-sine velocity baseexcitation shown in Fig. 1 is considered and assuming that theshape and magnitude of the wave does not change as it propagates,a particular story j will start to yield when point A along the veloc-ity wave, A being the point at which the value of the wave is equalto the vy value of the jth story, reaches that story. As the wave prop-agates, it continues to yield until point B along the velocity wave,after which the value of the wave is less than the vy value of thestory, reaches it. Therefore, story j yields for a duration of tyd,j asindicated in the figure. The story yielding actually does not endexactly at point B, but somewhere close to it; thus, yield durationtyd,j is an approximate value. Note that the assumption mentionedabove relates to the end of story yielding and will only affect theprediction of duration of story yielding.
Yield capacity and story stiffness typically vary for different sto-ries in the building; this will result in different vy values at variousstories of the building. As the velocity waves propagates along thebuilding height, yielding will occur in all the stories that areencompassed within the span of the Du/th wave and for whichthe vy value is smaller than the value of the Du/th wave (i.e., valueof ‘‘�vf + vb”) at that corresponding stories. Thus, at any instant, asthe wave is traveling along the building height, comparing thevalue of (�vf + vb) and the vy value at all the stories falling within
the wavelength should give an estimate of the number of storiesyielding simultaneously at that time. For example, consider aninstant when the input velocity motion at the base (without con-sidering change in its shape due to various effects) has reachedthe 16th floor of a twenty story building as the incident velocitywave shown in Fig. 2. At this instant, stories 6 to 16 fall withinthe wavelength of the velocity pulse. However, stories 7 to 9 and12 to 15 have vy values lower than the magnitude of the velocitywave at the respective floors. Thus, at that instant, only stories 7,8, 9, 12, 13, 14, and 15 will yield simultaneously, as indicated bythe red2 and blue solid circles in the figure. The yielding representedby the red and blue solid circles are due to the first and second partof the full-sine velocity wave respectively. Note that the yieldingcaused by these two parts are of opposite sign. So, the axial forceinduced by these two cases will be of opposite signs. Here, yieldingdue to first part only is considered as it provides results on the con-servative side.
Note that as the wave propagates up the building, the shape ofthe wave changes due to various factors, such as discontinuity insystem properties, inherent damping, and inelasticity. Here, thenumber of stories yielding simultaneously is estimated by consid-ering the original shape of the velocity base excitation, assumingthat the waves do not change in shape and magnitude as theypropagate along the building height. This assumption, togetherwith using velocity base excitation for the estimation procedurewas found to be reasonable for a structure having vy valuesdecreasing with height, as expected in regular building structures.
2.3. Potential of ground motion to cause yielding in a story andinstances of simultaneous story yielding
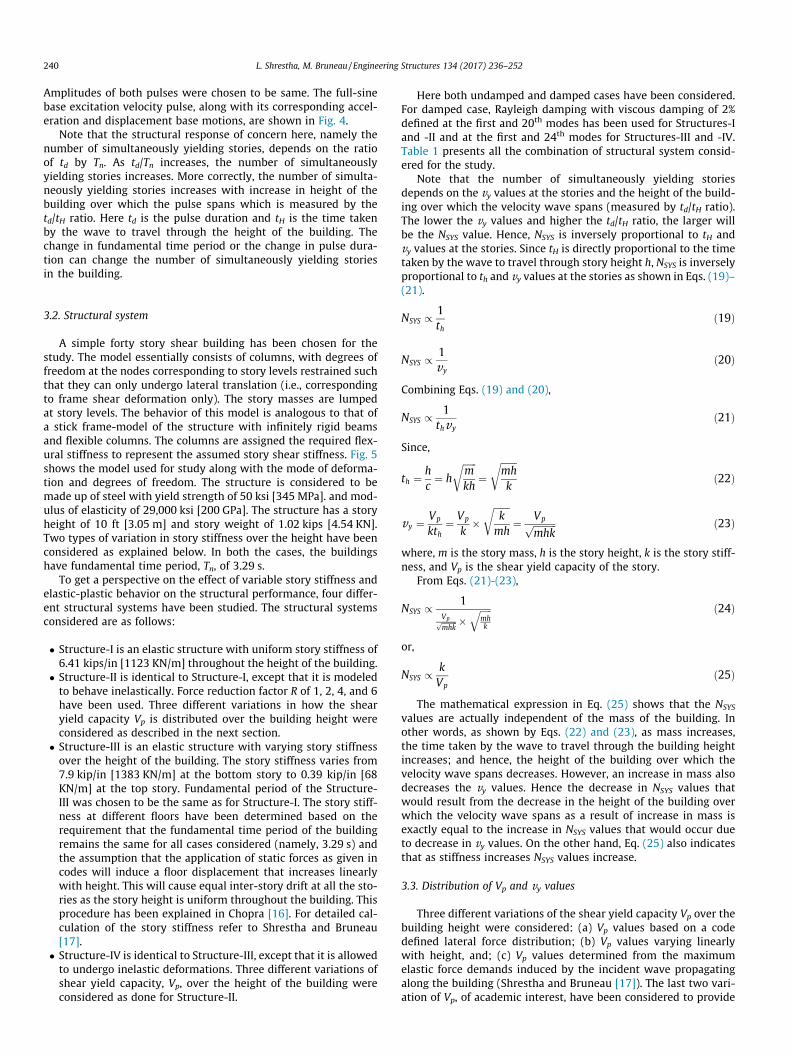
The potential of a ground motion to cause story yieldingdepends on the magnitude of the ground motion velocity inputand the vy values at respective stories. If the amplitude of thevelocity input excitation is greater than the vy value at any story,then the structure will yield when the incident wave first travelsfrom the base to the top of the building. However, due to construc-tive overlaps of �vf and vb waves, the magnitude of the resultingDu/th wave may be large enough to cause yielding of the storiesfalling within the overlapping region. Constructive phase overlap-ping for the full-sine velocity base-excitation wave considered hereoccurs only at two locations, namely, at the base and at one-fourthof the wavelength from the free end. Thus, simultaneous yieldingacross multiple stories can occur in three instances: (i) due toincident wave traveling up the building (Fig. 3a), (ii) due to
v
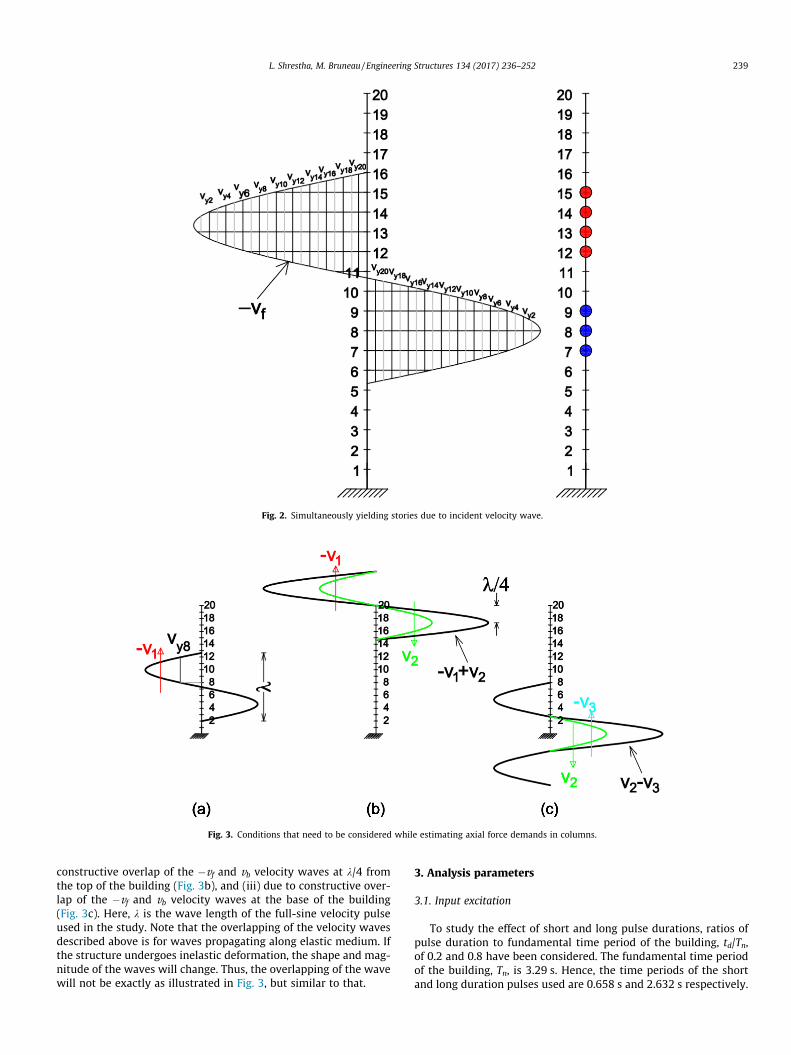
Fig. 2. Simultaneously yielding stories due to incident velocity wave.
Fig. 3. Conditions that need to be considered while estimating axial force demands in columns.
L. Shrestha, M. Bruneau / Engineering Structures 134 (2017) 236–252 239
constructive overlap of the �vf and vb velocity waves at k/4 fromthe top of the building (Fig. 3b), and (iii) due to constructive over-lap of the �vf and vb velocity waves at the base of the building(Fig. 3c). Here, k is the wave length of the full-sine velocity pulseused in the study. Note that the overlapping of the velocity wavesdescribed above is for waves propagating along elastic medium. Ifthe structure undergoes inelastic deformation, the shape and mag-nitude of the waves will change. Thus, the overlapping of the wavewill not be exactly as illustrated in Fig. 3, but similar to that.
3. Analysis parameters
3.1. Input excitation
To study the effect of short and long pulse durations, ratios ofpulse duration to fundamental time period of the building, td/Tn,of 0.2 and 0.8 have been considered. The fundamental time periodof the building, Tn, is 3.29 s. Hence, the time periods of the shortand long duration pulses used are 0.658 s and 2.632 s respectively.
240 L. Shrestha, M. Bruneau / Engineering Structures 134 (2017) 236–252
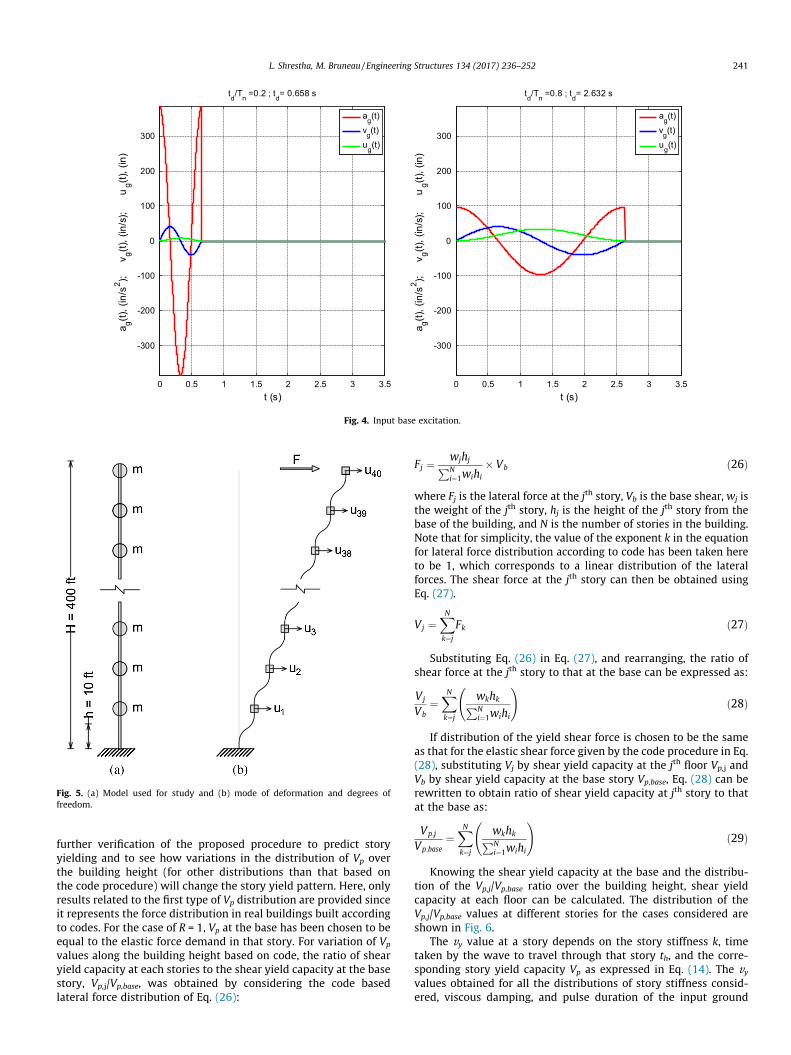
Amplitudes of both pulses were chosen to be same. The full-sinebase excitation velocity pulse, along with its corresponding accel-eration and displacement base motions, are shown in Fig. 4.
Note that the structural response of concern here, namely thenumber of simultaneously yielding stories, depends on the ratioof td by Tn. As td/Tn increases, the number of simultaneouslyyielding stories increases. More correctly, the number of simulta-neously yielding stories increases with increase in height of thebuilding over which the pulse spans which is measured by thetd/tH ratio. Here td is the pulse duration and tH is the time takenby the wave to travel through the height of the building. Thechange in fundamental time period or the change in pulse dura-tion can change the number of simultaneously yielding storiesin the building.
3.2. Structural system
A simple forty story shear building has been chosen for thestudy. The model essentially consists of columns, with degrees offreedom at the nodes corresponding to story levels restrained suchthat they can only undergo lateral translation (i.e., correspondingto frame shear deformation only). The story masses are lumpedat story levels. The behavior of this model is analogous to that ofa stick frame-model of the structure with infinitely rigid beamsand flexible columns. The columns are assigned the required flex-ural stiffness to represent the assumed story shear stiffness. Fig. 5shows the model used for study along with the mode of deforma-tion and degrees of freedom. The structure is considered to bemade up of steel with yield strength of 50 ksi [345 MPa]. and mod-ulus of elasticity of 29,000 ksi [200 GPa]. The structure has a storyheight of 10 ft [3.05 m] and story weight of 1.02 kips [4.54 KN].Two types of variation in story stiffness over the height have beenconsidered as explained below. In both the cases, the buildingshave fundamental time period, Tn, of 3.29 s.
To get a perspective on the effect of variable story stiffness andelastic-plastic behavior on the structural performance, four differ-ent structural systems have been studied. The structural systemsconsidered are as follows:
� Structure-I is an elastic structure with uniform story stiffness of6.41 kips/in [1123 KN/m] throughout the height of the building.
� Structure-II is identical to Structure-I, except that it is modeledto behave inelastically. Force reduction factor R of 1, 2, 4, and 6have been used. Three different variations in how the shearyield capacity Vp is distributed over the building height wereconsidered as described in the next section.
� Structure-III is an elastic structure with varying story stiffnessover the height of the building. The story stiffness varies from7.9 kip/in [1383 KN/m] at the bottom story to 0.39 kip/in [68KN/m] at the top story. Fundamental period of the Structure-III was chosen to be the same as for Structure-I. The story stiff-ness at different floors have been determined based on therequirement that the fundamental time period of the buildingremains the same for all cases considered (namely, 3.29 s) andthe assumption that the application of static forces as given incodes will induce a floor displacement that increases linearlywith height. This will cause equal inter-story drift at all the sto-ries as the story height is uniform throughout the building. Thisprocedure has been explained in Chopra [16]. For detailed cal-culation of the story stiffness refer to Shrestha and Bruneau[17].
� Structure-IV is identical to Structure-III, except that it is allowedto undergo inelastic deformations. Three different variations ofshear yield capacity, Vp, over the height of the building wereconsidered as done for Structure-II.
Here both undamped and damped cases have been considered.For damped case, Rayleigh damping with viscous damping of 2%defined at the first and 20th modes has been used for Structures-Iand -II and at the first and 24th modes for Structures-III and -IV.Table 1 presents all the combination of structural system consid-ered for the study.
Note that the number of simultaneously yielding storiesdepends on the vy values at the stories and the height of the build-ing over which the velocity wave spans (measured by td/tH ratio).The lower the vy values and higher the td/tH ratio, the larger willbe the NSYS value. Hence, NSYS is inversely proportional to tH andvy values at the stories. Since tH is directly proportional to the timetaken by the wave to travel through story height h, NSYS is inverselyproportional to th and vy values at the stories as shown in Eqs. (19)–(21).
NSYS / 1th
ð19Þ
NSYS / 1vy
ð20Þ
Combining Eqs. (19) and (20),
NSYS / 1thvy
ð21Þ
Since,
th ¼ hc¼ h
ffiffiffiffiffiffimkh
r¼
ffiffiffiffiffiffiffimhk
rð22Þ
vy ¼ Vp
kth¼ Vp
k�
ffiffiffiffiffiffiffikmh
r¼ Vpffiffiffiffiffiffiffiffiffiffi
mhkp ð23Þ
where, m is the story mass, h is the story height, k is the story stiff-ness, and Vp is the shear yield capacity of the story.
From Eqs. (21)-(23),
NSYS / 1Vpffiffiffiffiffiffiffimhk
p �ffiffiffiffiffimhk
q ð24Þ
or,
NSYS / kVp
ð25Þ
The mathematical expression in Eq. (25) shows that the NSYS
values are actually independent of the mass of the building. Inother words, as shown by Eqs. (22) and (23), as mass increases,the time taken by the wave to travel through the building heightincreases; and hence, the height of the building over which thevelocity wave spans decreases. However, an increase in mass alsodecreases the vy values. Hence the decrease in NSYS values thatwould result from the decrease in the height of the building overwhich the velocity wave spans as a result of increase in mass isexactly equal to the increase in NSYS values that would occur dueto decrease in vy values. On the other hand, Eq. (25) also indicatesthat as stiffness increases NSYS values increase.
3.3. Distribution of Vp and vy values
Three different variations of the shear yield capacity Vp over thebuilding height were considered: (a) Vp values based on a codedefined lateral force distribution; (b) Vp values varying linearlywith height, and; (c) Vp values determined from the maximumelastic force demands induced by the incident wave propagatingalong the building (Shrestha and Bruneau [17]). The last two vari-ation of Vp, of academic interest, have been considered to provide
0 0.5 1 1.5 2 2.5 3 3.5
-300
-200
-100
0
100
200
300
td/Tn =0.2 ; td= 0.658 s
t (s)
a g(t), (
in/s
2 );
vg(t)
, (in
/s);
u
g(t), (
in)
ag(t)
vg(t)
ug(t)
0 0.5 1 1.5 2 2.5 3 3.5
-300
-200
-100
0
100
200
300
td/Tn =0.8 ; td= 2.632 s
t (s)
a g(t), (
in/s
2 );
vg(t)
, (in
/s);
u
g(t), (
in)
ag(t)
vg(t)
ug(t)
Fig. 4. Input base excitation.
Fig. 5. (a) Model used for study and (b) mode of deformation and degrees offreedom.
L. Shrestha, M. Bruneau / Engineering Structures 134 (2017) 236–252 241
further verification of the proposed procedure to predict storyyielding and to see how variations in the distribution of Vp overthe building height (for other distributions than that based onthe code procedure) will change the story yield pattern. Here, onlyresults related to the first type of Vp distribution are provided sinceit represents the force distribution in real buildings built accordingto codes. For the case of R = 1, Vp at the base has been chosen to beequal to the elastic force demand in that story. For variation of Vp
values along the building height based on code, the ratio of shearyield capacity at each stories to the shear yield capacity at the basestory, Vp,j/Vp,base, was obtained by considering the code basedlateral force distribution of Eq. (26):
Fj ¼ wjhjPNi¼1wihi
� Vb ð26Þ
where Fj is the lateral force at the jth story, Vb is the base shear, wj isthe weight of the jth story, hj is the height of the jth story from thebase of the building, and N is the number of stories in the building.Note that for simplicity, the value of the exponent k in the equationfor lateral force distribution according to code has been taken hereto be 1, which corresponds to a linear distribution of the lateralforces. The shear force at the jth story can then be obtained usingEq. (27).
Vj ¼XNk¼j
Fk ð27Þ
Substituting Eq. (26) in Eq. (27), and rearranging, the ratio ofshear force at the jth story to that at the base can be expressed as:
Vj
Vb¼XNk¼j
wkhkPNi¼1wihi
!ð28Þ
If distribution of the yield shear force is chosen to be the sameas that for the elastic shear force given by the code procedure in Eq.(28), substituting Vj by shear yield capacity at the jth floor Vp,j andVb by shear yield capacity at the base story Vp,base, Eq. (28) can berewritten to obtain ratio of shear yield capacity at jth story to thatat the base as:
Vp;j
Vp;base¼XNk¼j
wkhkPNi¼1wihi
!ð29Þ
Knowing the shear yield capacity at the base and the distribu-tion of the Vp,j/Vp,base ratio over the building height, shear yieldcapacity at each floor can be calculated. The distribution of theVp,j/Vp,base values at different stories for the cases considered areshown in Fig. 6.
The vy value at a story depends on the story stiffness k, timetaken by the wave to travel through that story th, and the corre-sponding story yield capacity Vp as expressed in Eq. (14). The vyvalues obtained for all the distributions of story stiffness consid-ered, viscous damping, and pulse duration of the input ground
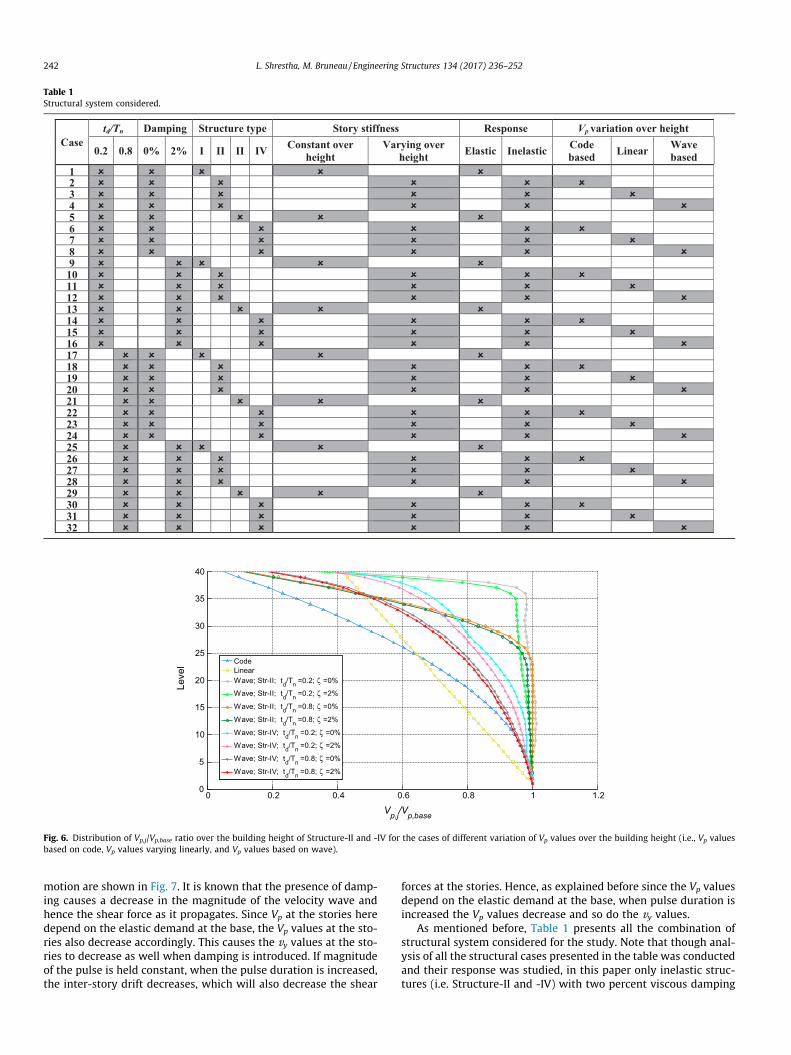
Table 1Structural system considered.
0 0.2 0.4 0.6 0.8 1 1.20
5
10
15
20
25
30
35
40
Vp,j/Vp,base
Leve
l CodeLinearWave; Str-II; td/Tn =0.2; ζ =0%
Wave; Str-II; td/Tn =0.2; ζ =2%
Wave; Str-II; td/Tn =0.8; ζ =0%
Wave; Str-II; td/Tn =0.8; ζ =2%
Wave; Str-IV; td/Tn =0.2; ζ =0%
Wave; Str-IV; td/Tn =0.2; ζ =2%
Wave; Str-IV; td/Tn =0.8; ζ =0%
Wave; Str-IV; td/Tn =0.8; ζ =2%
Fig. 6. Distribution of Vp,j/Vp,base ratio over the building height of Structure-II and -IV for the cases of different variation of Vp values over the building height (i.e., Vp valuesbased on code, Vp values varying linearly, and Vp values based on wave).
242 L. Shrestha, M. Bruneau / Engineering Structures 134 (2017) 236–252
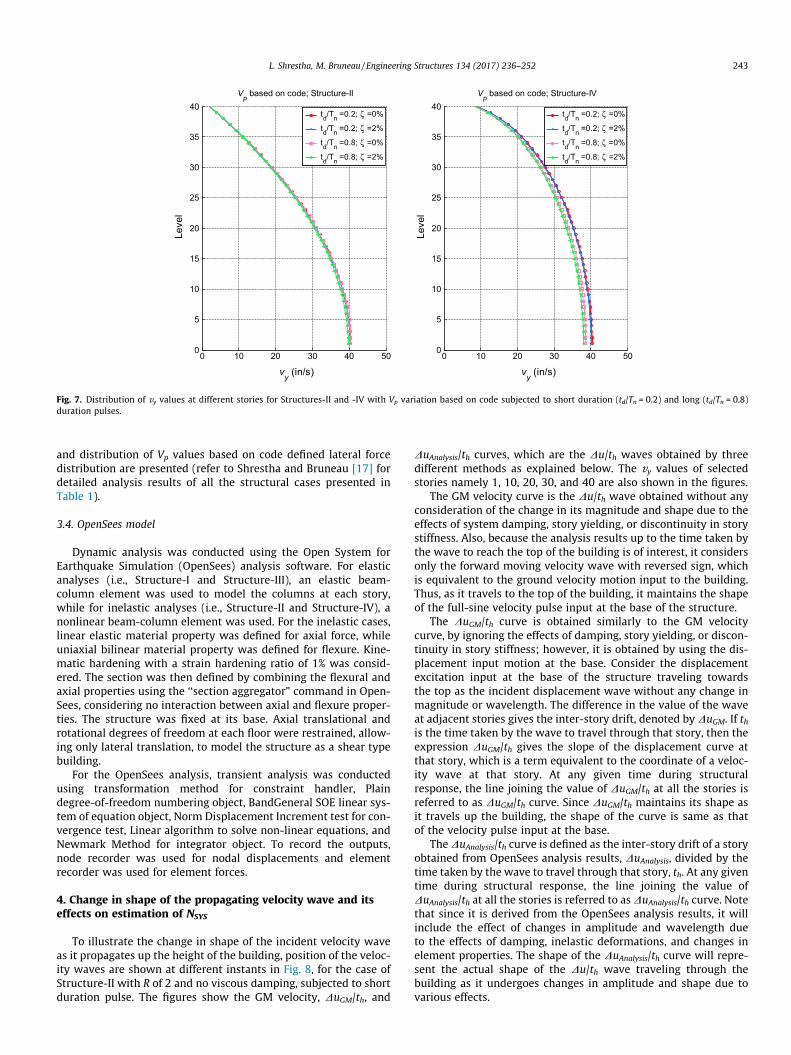
motion are shown in Fig. 7. It is known that the presence of damp-ing causes a decrease in the magnitude of the velocity wave andhence the shear force as it propagates. Since Vp at the stories heredepend on the elastic demand at the base, the Vp values at the sto-ries also decrease accordingly. This causes the vy values at the sto-ries to decrease as well when damping is introduced. If magnitudeof the pulse is held constant, when the pulse duration is increased,the inter-story drift decreases, which will also decrease the shear
forces at the stories. Hence, as explained before since the Vp valuesdepend on the elastic demand at the base, when pulse duration isincreased the Vp values decrease and so do the vy values.
As mentioned before, Table 1 presents all the combination ofstructural system considered for the study. Note that though anal-ysis of all the structural cases presented in the table was conductedand their response was studied, in this paper only inelastic struc-tures (i.e. Structure-II and -IV) with two percent viscous damping
0 10 20 30 40 500
5
10
15
20
25
30
35
40
vy (in/s)
Leve
l
Vp based on code; Structure-II
td/Tn =0.2; ζ =0%
td/Tn =0.2; ζ =2%
td/Tn =0.8; ζ =0%
td/Tn =0.8; ζ =2%
0 10 20 30 40 500
5
10
15
20
25
30
35
40
vy (in/s)
Leve
l
Vp based on code; Structure-IV
td/Tn =0.2; ζ =0%
td/Tn =0.2; ζ =2%
td/Tn =0.8; ζ =0%
td/Tn =0.8; ζ =2%
Fig. 7. Distribution of vy values at different stories for Structures-II and -IV with Vp variation based on code subjected to short duration (td/Tn = 0.2) and long (td/Tn = 0.8)duration pulses.
L. Shrestha, M. Bruneau / Engineering Structures 134 (2017) 236–252 243
and distribution of Vp values based on code defined lateral forcedistribution are presented (refer to Shrestha and Bruneau [17] fordetailed analysis results of all the structural cases presented inTable 1).
3.4. OpenSees model
Dynamic analysis was conducted using the Open System forEarthquake Simulation (OpenSees) analysis software. For elasticanalyses (i.e., Structure-I and Structure-III), an elastic beam-column element was used to model the columns at each story,while for inelastic analyses (i.e., Structure-II and Structure-IV), anonlinear beam-column element was used. For the inelastic cases,linear elastic material property was defined for axial force, whileuniaxial bilinear material property was defined for flexure. Kine-matic hardening with a strain hardening ratio of 1% was consid-ered. The section was then defined by combining the flexural andaxial properties using the ‘‘section aggregator” command in Open-Sees, considering no interaction between axial and flexure proper-ties. The structure was fixed at its base. Axial translational androtational degrees of freedom at each floor were restrained, allow-ing only lateral translation, to model the structure as a shear typebuilding.
For the OpenSees analysis, transient analysis was conductedusing transformation method for constraint handler, Plaindegree-of-freedom numbering object, BandGeneral SOE linear sys-tem of equation object, Norm Displacement Increment test for con-vergence test, Linear algorithm to solve non-linear equations, andNewmark Method for integrator object. To record the outputs,node recorder was used for nodal displacements and elementrecorder was used for element forces.
4. Change in shape of the propagating velocity wave and itseffects on estimation of NSYS
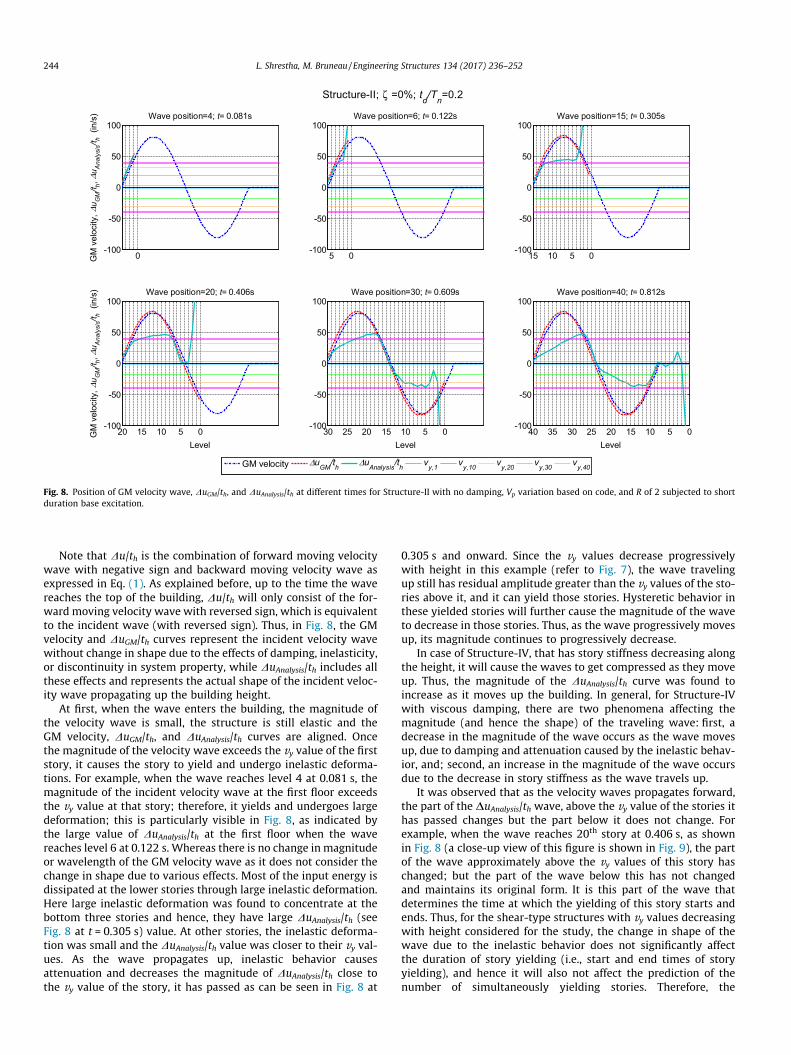
To illustrate the change in shape of the incident velocity waveas it propagates up the height of the building, position of the veloc-ity waves are shown at different instants in Fig. 8, for the case ofStructure-II with R of 2 and no viscous damping, subjected to shortduration pulse. The figures show the GM velocity, DuGM/th, and
DuAnalysis/th curves, which are the Du/th waves obtained by threedifferent methods as explained below. The vy values of selectedstories namely 1, 10, 20, 30, and 40 are also shown in the figures.
The GM velocity curve is the Du/th wave obtained without anyconsideration of the change in its magnitude and shape due to theeffects of system damping, story yielding, or discontinuity in storystiffness. Also, because the analysis results up to the time taken bythe wave to reach the top of the building is of interest, it considersonly the forward moving velocity wave with reversed sign, whichis equivalent to the ground velocity motion input to the building.Thus, as it travels to the top of the building, it maintains the shapeof the full-sine velocity pulse input at the base of the structure.
The DuGM/th curve is obtained similarly to the GM velocitycurve, by ignoring the effects of damping, story yielding, or discon-tinuity in story stiffness; however, it is obtained by using the dis-placement input motion at the base. Consider the displacementexcitation input at the base of the structure traveling towardsthe top as the incident displacement wave without any change inmagnitude or wavelength. The difference in the value of the waveat adjacent stories gives the inter-story drift, denoted by DuGM. If this the time taken by the wave to travel through that story, then theexpression DuGM/th gives the slope of the displacement curve atthat story, which is a term equivalent to the coordinate of a veloc-ity wave at that story. At any given time during structuralresponse, the line joining the value of DuGM/th at all the stories isreferred to as DuGM/th curve. Since DuGM/th maintains its shape asit travels up the building, the shape of the curve is same as thatof the velocity pulse input at the base.
TheDuAnalysis/th curve is defined as the inter-story drift of a storyobtained from OpenSees analysis results, DuAnalysis, divided by thetime taken by the wave to travel through that story, th. At any giventime during structural response, the line joining the value ofDuAnalysis/th at all the stories is referred to asDuAnalysis/th curve. Notethat since it is derived from the OpenSees analysis results, it willinclude the effect of changes in amplitude and wavelength dueto the effects of damping, inelastic deformations, and changes inelement properties. The shape of the DuAnalysis/th curve will repre-sent the actual shape of the Du/th wave traveling through thebuilding as it undergoes changes in amplitude and shape due tovarious effects.
0-100
-50
0
50
100
GM
vel
ocity
, Δu G
M/t h,
Δu A
naly
sis/
t h (i
n/s) Wave position=4; t= 0.081s
GM velocity ΔuGM/th ΔuAnalysis/th vy,1 vy,10 vy,20 vy,30 vy,40
5 0-100
-50
0
50
100Wave position=6; t= 0.122s
15 10 5 0-100
-50
0
50
100Wave position=15; t= 0.305s
20 15 10 5 0-100
-50
0
50
100
Level
GM
vel
ocity
, Δu G
M/t h,
Δu A
naly
sis/
t h (i
n/s) Wave position=20; t= 0.406s
30 25 20 15 10 5 0-100
-50
0
50
100
Level
Wave position=30; t= 0.609s
Structure-II; ζ =0%; td/Tn=0.2
40 35 30 25 20 15 10 5 0-100
-50
0
50
100
Level
Wave position=40; t= 0.812s
Fig. 8. Position of GM velocity wave, DuGM/th, and DuAnalysis/th at different times for Structure-II with no damping, Vp variation based on code, and R of 2 subjected to shortduration base excitation.
244 L. Shrestha, M. Bruneau / Engineering Structures 134 (2017) 236–252
Note that Du/th is the combination of forward moving velocitywave with negative sign and backward moving velocity wave asexpressed in Eq. (1). As explained before, up to the time the wavereaches the top of the building, Du/th will only consist of the for-ward moving velocity wave with reversed sign, which is equivalentto the incident wave (with reversed sign). Thus, in Fig. 8, the GMvelocity and DuGM/th curves represent the incident velocity wavewithout change in shape due to the effects of damping, inelasticity,or discontinuity in system property, while DuAnalysis/th includes allthese effects and represents the actual shape of the incident veloc-ity wave propagating up the building height.
At first, when the wave enters the building, the magnitude ofthe velocity wave is small, the structure is still elastic and theGM velocity, DuGM/th, and DuAnalysis/th curves are aligned. Oncethe magnitude of the velocity wave exceeds the vy value of the firststory, it causes the story to yield and undergo inelastic deforma-tions. For example, when the wave reaches level 4 at 0.081 s, themagnitude of the incident velocity wave at the first floor exceedsthe vy value at that story; therefore, it yields and undergoes largedeformation; this is particularly visible in Fig. 8, as indicated bythe large value of DuAnalysis/th at the first floor when the wavereaches level 6 at 0.122 s. Whereas there is no change in magnitudeor wavelength of the GM velocity wave as it does not consider thechange in shape due to various effects. Most of the input energy isdissipated at the lower stories through large inelastic deformation.Here large inelastic deformation was found to concentrate at thebottom three stories and hence, they have large DuAnalysis/th (seeFig. 8 at t = 0.305 s) value. At other stories, the inelastic deforma-tion was small and the DuAnalysis/th value was closer to their vy val-ues. As the wave propagates up, inelastic behavior causesattenuation and decreases the magnitude of DuAnalysis/th close tothe vy value of the story, it has passed as can be seen in Fig. 8 at
0.305 s and onward. Since the vy values decrease progressivelywith height in this example (refer to Fig. 7), the wave travelingup still has residual amplitude greater than the vy values of the sto-ries above it, and it can yield those stories. Hysteretic behavior inthese yielded stories will further cause the magnitude of the waveto decrease in those stories. Thus, as the wave progressively movesup, its magnitude continues to progressively decrease.
In case of Structure-IV, that has story stiffness decreasing alongthe height, it will cause the waves to get compressed as they moveup. Thus, the magnitude of the DuAnalysis/th curve was found toincrease as it moves up the building. In general, for Structure-IVwith viscous damping, there are two phenomena affecting themagnitude (and hence the shape) of the traveling wave: first, adecrease in the magnitude of the wave occurs as the wave movesup, due to damping and attenuation caused by the inelastic behav-ior, and; second, an increase in the magnitude of the wave occursdue to the decrease in story stiffness as the wave travels up.
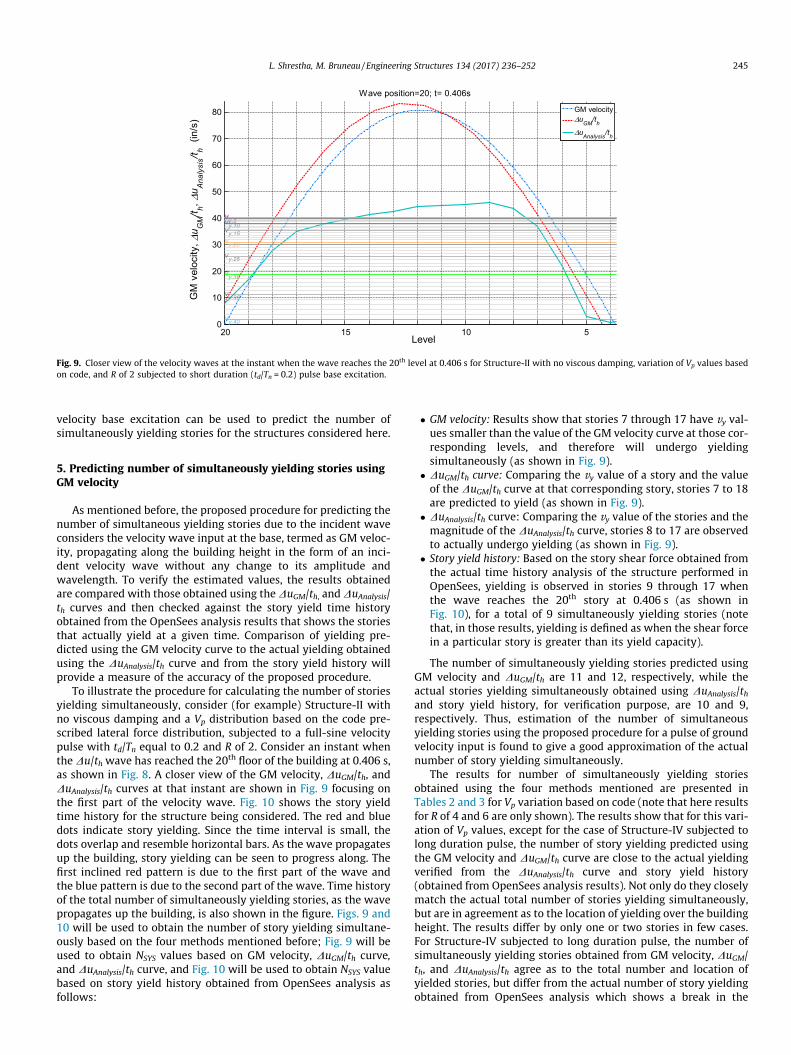
It was observed that as the velocity waves propagates forward,the part of the DuAnalysis/th wave, above the vy value of the stories ithas passed changes but the part below it does not change. Forexample, when the wave reaches 20th story at 0.406 s, as shownin Fig. 8 (a close-up view of this figure is shown in Fig. 9), the partof the wave approximately above the vy values of this story haschanged; but the part of the wave below this has not changedand maintains its original form. It is this part of the wave thatdetermines the time at which the yielding of this story starts andends. Thus, for the shear-type structures with vy values decreasingwith height considered for the study, the change in shape of thewave due to the inelastic behavior does not significantly affectthe duration of story yielding (i.e., start and end times of storyyielding), and hence it will also not affect the prediction of thenumber of simultaneously yielding stories. Therefore, the
20 15 10 50
10
20
30
40
50
60
70
80
Level
GM
vel
ocity
, Δu G
M/t h, Δ
u Ana
lysi
s/t h (in
/s)
Wave position=20; t= 0.406s
vy,1vy,5vy,10vy,15vy,20
vy,25
vy,30
vy,35
vy,40
GM velocityΔuGM/thΔuAnalysis/th
Fig. 9. Closer view of the velocity waves at the instant when the wave reaches the 20th level at 0.406 s for Structure-II with no viscous damping, variation of Vp values basedon code, and R of 2 subjected to short duration (td/Tn = 0.2) pulse base excitation.
L. Shrestha, M. Bruneau / Engineering Structures 134 (2017) 236–252 245
velocity base excitation can be used to predict the number ofsimultaneously yielding stories for the structures considered here.
5. Predicting number of simultaneously yielding stories usingGM velocity
As mentioned before, the proposed procedure for predicting thenumber of simultaneous yielding stories due to the incident waveconsiders the velocity wave input at the base, termed as GM veloc-ity, propagating along the building height in the form of an inci-dent velocity wave without any change to its amplitude andwavelength. To verify the estimated values, the results obtainedare compared with those obtained using theDuGM/th, andDuAnalysis/th curves and then checked against the story yield time historyobtained from the OpenSees analysis results that shows the storiesthat actually yield at a given time. Comparison of yielding pre-dicted using the GM velocity curve to the actual yielding obtainedusing the DuAnalysis/th curve and from the story yield history willprovide a measure of the accuracy of the proposed procedure.
To illustrate the procedure for calculating the number of storiesyielding simultaneously, consider (for example) Structure-II withno viscous damping and a Vp distribution based on the code pre-scribed lateral force distribution, subjected to a full-sine velocitypulse with td/Tn equal to 0.2 and R of 2. Consider an instant whenthe Du/th wave has reached the 20th floor of the building at 0.406 s,as shown in Fig. 8. A closer view of the GM velocity, DuGM/th, andDuAnalysis/th curves at that instant are shown in Fig. 9 focusing onthe first part of the velocity wave. Fig. 10 shows the story yieldtime history for the structure being considered. The red and bluedots indicate story yielding. Since the time interval is small, thedots overlap and resemble horizontal bars. As the wave propagatesup the building, story yielding can be seen to progress along. Thefirst inclined red pattern is due to the first part of the wave andthe blue pattern is due to the second part of the wave. Time historyof the total number of simultaneously yielding stories, as the wavepropagates up the building, is also shown in the figure. Figs. 9 and10 will be used to obtain the number of story yielding simultane-ously based on the four methods mentioned before; Fig. 9 will beused to obtain NSYS values based on GM velocity, DuGM/th curve,and DuAnalysis/th curve, and Fig. 10 will be used to obtain NSYS valuebased on story yield history obtained from OpenSees analysis asfollows:
� GM velocity: Results show that stories 7 through 17 have vy val-ues smaller than the value of the GM velocity curve at those cor-responding levels, and therefore will undergo yieldingsimultaneously (as shown in Fig. 9).
� DuGM/th curve: Comparing the vy value of a story and the valueof the DuGM/th curve at that corresponding story, stories 7 to 18are predicted to yield (as shown in Fig. 9).
� DuAnalysis/th curve: Comparing the vy value of the stories and themagnitude of the DuAnalysis/th curve, stories 8 to 17 are observedto actually undergo yielding (as shown in Fig. 9).
� Story yield history: Based on the story shear force obtained fromthe actual time history analysis of the structure performed inOpenSees, yielding is observed in stories 9 through 17 whenthe wave reaches the 20th story at 0.406 s (as shown inFig. 10), for a total of 9 simultaneously yielding stories (notethat, in those results, yielding is defined as when the shear forcein a particular story is greater than its yield capacity).
The number of simultaneously yielding stories predicted usingGM velocity and DuGM/th are 11 and 12, respectively, while theactual stories yielding simultaneously obtained using DuAnalysis/thand story yield history, for verification purpose, are 10 and 9,respectively. Thus, estimation of the number of simultaneousyielding stories using the proposed procedure for a pulse of groundvelocity input is found to give a good approximation of the actualnumber of story yielding simultaneously.
The results for number of simultaneously yielding storiesobtained using the four methods mentioned are presented inTables 2 and 3 for Vp variation based on code (note that here resultsfor R of 4 and 6 are only shown). The results show that for this vari-ation of Vp values, except for the case of Structure-IV subjected tolong duration pulse, the number of story yielding predicted usingthe GM velocity and DuGM/th curve are close to the actual yieldingverified from the DuAnalysis/th curve and story yield history(obtained from OpenSees analysis results). Not only do they closelymatch the actual total number of stories yielding simultaneously,but are in agreement as to the location of yielding over the buildingheight. The results differ by only one or two stories in few cases.For Structure-IV subjected to long duration pulse, the number ofsimultaneously yielding stories obtained from GM velocity, DuGM/th, and DuAnalysis/th agree as to the total number and location ofyielded stories, but differ from the actual number of story yieldingobtained from OpenSees analysis which shows a break in the

0 0.5 1 1.5 2 2.5 30
5
10
15
20
25
30
35
40
Time (s)
Leve
l
Number of simultaneously yielding stories (Positive)Number of simultaneously yielding stories (Negative)Story yielding (Positive)Story yielding (Negative)
Fig. 10. Story yield time history for Structure-II with no viscous damping and variation of Vp values based on code with R of 2, subjected to short duration pulse baseexcitation (td/Tn = 0.2).
Table 2Simultaneously yielding stories for Structure-II with 2% damping and Vp based on code specified lateral force distribution subjected to short and long duration pulses.
Structuretype
f td/Tn R Waveposition
Time Number of simultaneously yielding stories
(s) Based on GMvelocity
Based on DuGM/thcurve
Based on DuAnalysis/thcurve
Based on story yieldinghistory
Structure-II 2% 0.2 4 5 0.102 1–3 (3) 1–4 (4) 1–3 (3) 1–3 (3)10 0.203 1–8 (8) 1–9 (9) 1–7 (7) 1–8 (8)15 0.305 1–13 (13) 1–14 (14) 1–12 (12) 3–12 (10)20 0.406 6–19 (14) 6–19 (14) 7–17 (11) 8–17 (10)25 0.508 11–24 (14) 11–24 (14) 12–23 (12) 13–23 (11)30 0.609 15–29 (15) 16–29 (14) 17–28 (12) 18–28 (11)35 0.711 20–34 (15) 21–35 (15) 21–35 (15) 23–35 (13)40 0.812 25–39 (15) 26–40 (15) 25–40 (16) 27–40 (14)
6 5 0.102 1–4 (4) 1–4 (4) 1–3 (3) 1–3 (3)10 0.203 1–9 (9) 1–9 (9) 1–8 (8) 1–8 (8)15 0.305 1–14 (14) 1–14 (14) 1–13 (13) 2–13 (12)20 0.406 5–19 (15) 6–19 (14) 4–18 (15) 7–18 (12)25 0.508 10–24 (15) 11–24 (14) 11–23 (13) 12–23 (12)30 0.609 15–29 (15) 15–30 (16) 16–29 (14) 17–29 (13)35 0.711 20–34 (15) 20–35 (16) 20–35 (16) 22–35 (14)40 0.812 25–39 (15) 25–40 (16) 25–40 (16) 26–40 (15)
Structure-II 2% 0.8 4 5 0.102 – – – –10 0.203 1–4 (4) 1–5 (5) 1–4 (4) 1–4 (4)15 0.305 1–10 (10) 1–10 (10) 1–9 (9) 1–9 (9)20 0.406 1–15 (15) 1–16 (16) 1–16 (16) 1–15 (15)25 0.508 1–21 (21) 1–22 (22) 1–21 (21) 1–21 (21)30 0.609 1–27 (27) 1–27 (27) 1–27 (27) 1–27 (27)35 0.711 1–33 (33) 1–33 (33) 1–33 (33) 1–32 (32)40 0.812 1–39 (39) 1–40 (40) 1–40 (40) 1–40 (40)
6 5 0.102 1 (1) 1–2 (2) 1 (1) 1 (1)10 0.203 1–6 (6) 1–7 (7) 1–6 (6) 1–6 (6)15 0.305 1–11 (11) 1–12 (12) 1–11 (11) 1–11 (11)20 0.406 1–17 (17) 1–17 (17) 1–16 (16) 1–16 (16)25 0.508 1–22 (22) 1–23 (23) 1–22 (22) 1–22 (22)30 0.609 1–28 (28) 1–28 (28) 1–27 (27) 1–27 (27)35 0.711 1–33 (33) 1–34 (34) 1–34 (34) 1–34 (34)40 0.812 1–39 (39) 1–40 (40) 1–40 (40) 1–40 (40)
246 L. Shrestha, M. Bruneau / Engineering Structures 134 (2017) 236–252
sequence of simultaneously yielding stories. For example, for R of4, when the wave reaches the 35th story at 0.772 s (which corre-sponds to the 23rd row with bold text in Table 3), the GM velocity,DuGM/th, and DuAnalysis/th results predict that yielding will occurover stories 1 to 33. However, OpenSees analysis results revealyielding occurs in stories 1 to 9 and from 19 to 33; there was nosimultaneous yielding observed in the 10–18th stories. This discon-tinuity in the OpenSees results was partly due to some fluctuationsin the shear force history, producing slight unloading prior toreloading observed over the 10-18th stories, with the absence ofyielding being simply due to the temporary dip of the story forcebelow the yield strength of the story. When the strain hardening
ratio was increased, or when a tolerance value for the definitionof shear yield capacity was considered in the definition of storyyield, results gave a continuous yield pattern and the number ofstories yielding and their location obtained from the four methodswere in agreement.
6. Mathematical formulation for predicting simultaneouslyyielding stories
With the information on the geometry of the velocity base exci-tation and the vy values of the stories, mathematical expression for

Table 3Simultaneously yielding stories for Structure-IV with 2% damping and Vp based on code specified lateral force distribution subjected to short and long duration pulses.
Structuretype
f td/Tn R Waveposition
Time(s)
Number of simultaneously yielding stories
Based on GMvelocity
Based on DuGM/thcurve
Based on DuAnalysis/thcurve
Based on story yieldinghistory
Structure-IV 2% 0.2 4 5 0.092 1–3 (3) 1–4 (4) 1–3 (3) 1–3 (3)10 0.185 1–8 (8) 1–9 (9) 1–7 (7) 1–7 (7)15 0.281 1–13 (13) 1–14 (14) 1–12 (12) 2–12 (11)20 0.382 5–18 (14) 5–19 (15) 6–17 (12) 9–19 (11)25 0.493 11–24 (14) 11–24 (14) 12–23 (12) 14–23 (10)30 0.618 17–29 (13) 18–29 (12) 18–28 (11) 20–28 (9)35 0.772 24–34 (11) 25–34 (10) 25–35 (11) 26–34 (9)40 1.043 34–39 (6) 35–40 (6) 34–40 (7) 36–40 (5)
6 5 0.092 1–4 (4) 1–4 (4) 1–3 (3) 1–3 (3)10 0.185 1–9 (9) 1–9 (9) 1–8 (8) 1–8 (8)15 0.281 1–14 (14) 1–14 (14) 1–13 (13) 2–13 (12)20 0.382 4–19 (16) 5–19 (15) 4–18 (15) 6–18 (13)25 0.493 11–24 (14) 11–24 (14) 12–23 (12) 13–23 (11)30 0.618 17–29 (13) 17–30 (14) 18–28 (11) 19–28 (10)35 0.772 24–34 (11) 24–35 (12) 24–34 (11) 26–34 (9)40 1.043 34–39 (6) 35–40 (6) 34–40 (7) 35–40 (6)
Structure-IV 2% 0.8 4 5 0.092 – – – –10 0.185 1–4 (4) 1–5 (5) 1–4 (4) 1–4 (4)15 0.281 1–10 (10) 1–10 (10) 1–9 (9) 1–9 (9)20 0.382 1–15 (15) 1–16 (16) 1–15 (15) 1–15 (15)25 0.493 1–21 (21) 1–21 (21) 1–21 (21) 1–7,9–21 (20)30 0.618 1–27 (27) 1–27 (27) 1–27 (27) 1–8,14–27 (22)35 0.772 1–33 (33) 1–33 (33) 1–33 (33) 1–9,19–33 (24)40 1.043 1–39 (39) 1–40 (40) 1–40 (40) 6–12,24–40 (24)
6 5 0.092 1 (1) 1–2 (2) 1 (1) 1 (1)10 0.185 1–6 (6) 1–7 (7) 1–6 (6) 1–6 (6)15 0.281 1–11 (1) 1–12 (12) 1–11 (11) 1–11 (11)20 0.382 1–16 (16) 1–17 (17) 1–16 (16) 1–17 (17)25 0.493 1–22 (22) 1–23 (23) 1–22 (22) 1–8,10–22 (21)30 0.618 1–28 (28) 1–28 (28) 1–28 (28) 1–9,13–27 (24)35 0.772 1–33 (33) 1–34 (34) 1–34 (34) 1–10,18–34 (27)40 1.043 1–39 (39) 1–40 (40) 1–40 (40) 4–12,24–40 (25)
L. Shrestha, M. Bruneau / Engineering Structures 134 (2017) 236–252 247
finding the time at which yielding at a particular story begins andends can be obtained. With this, equations of the two lines, namedtC and tD, that envelop the story yielding at different stories, causedby the incident wave traveling up the building can be derived.Using these two lines, the number of stories yielding simultane-ously at any given time before the incident wave reaches to thetop of the building (i.e. simultaneous yielding due to an incidentwave) can be found. These mathematical expressions that can beused to predict the number of simultaneously yielding stories inshear-type building model considered, have been derived by twomethods: first, equations for lines tC and tD are derived based onthe full-sine velocity wave used as base excitation; next, the equa-tions are derived assuming that the base excitation is rectangularin shape, in an effort to obtain a closed form solution that directlygives a total number of simultaneously yielding stories due to theincident wave.
6.1. Considering full-sine pulse velocity base excitation
Consider a building subjected to a full-sine velocity base excita-tion, as shown in Fig. 11a. For time t less than the pulse duration td,the equation of a full-sine velocity base excitation, as shown inFig. 11a, can be written as:
vgðtÞ ¼ vg0 sinxdt ð30Þ
where vg0 is the amplitude andwd is the radial frequency of the full-sine velocity wave with time period td. Alternately, Eq. (30) can alsobe written as:
t ¼ 1xd
sin�1 vgðtÞvg0
� �ð31Þ
Horizontal lines representing the minimummagnitude of veloc-ity wave required to yield different stories in the building (the vyvalues) have also been shown in Fig. 11a. Let vyj denote the mini-mum magnitude of the velocity base excitation required to yieldthe jth story. When the value of the incident wave at the jth storyis greater than the vyj value, it will yield that story. Thus, in theexample shown, if the part of the incident velocity wave betweentime duration tAj and tBj falls within the jth story, there will beyielding in that story. The points along the velocity curve, corre-sponding to tAj and tBj have been marked as A and B. The value oftAj can be obtained by substituting vyj in place of vg(t) in Eq. (31).Thus,
tAj ¼ 1xd
sin�1 vyj
vg0
� �ð32Þ
The value of tBj can then be obtained as:
tBj ¼ td2� tAj ¼ td
2� 1xd
sin�1 vyj
vg0
� �ð33Þ
The values of tAj and tBj represent the time at which the twopoints A and B respectively reach the base of the building. As theincident wave moves up, when point A reaches the jth story, theyielding in that story will begin. The time taken by point A to reachthe jth story is denoted as tCj and will be equal to tAj plus the timethe wave takes to travel from the base to that floor, as shown in Eq.(34).
tCj ¼ tAj þXj
i¼1
thi ¼ 1xd
sin�1 vyj
vg0
� �þXj
i¼1
thi ð34Þ
In Eqs. (34), thi represents the time taken by the wave to travelthrough the ith story. If ci denotes the velocity of the traveling wave
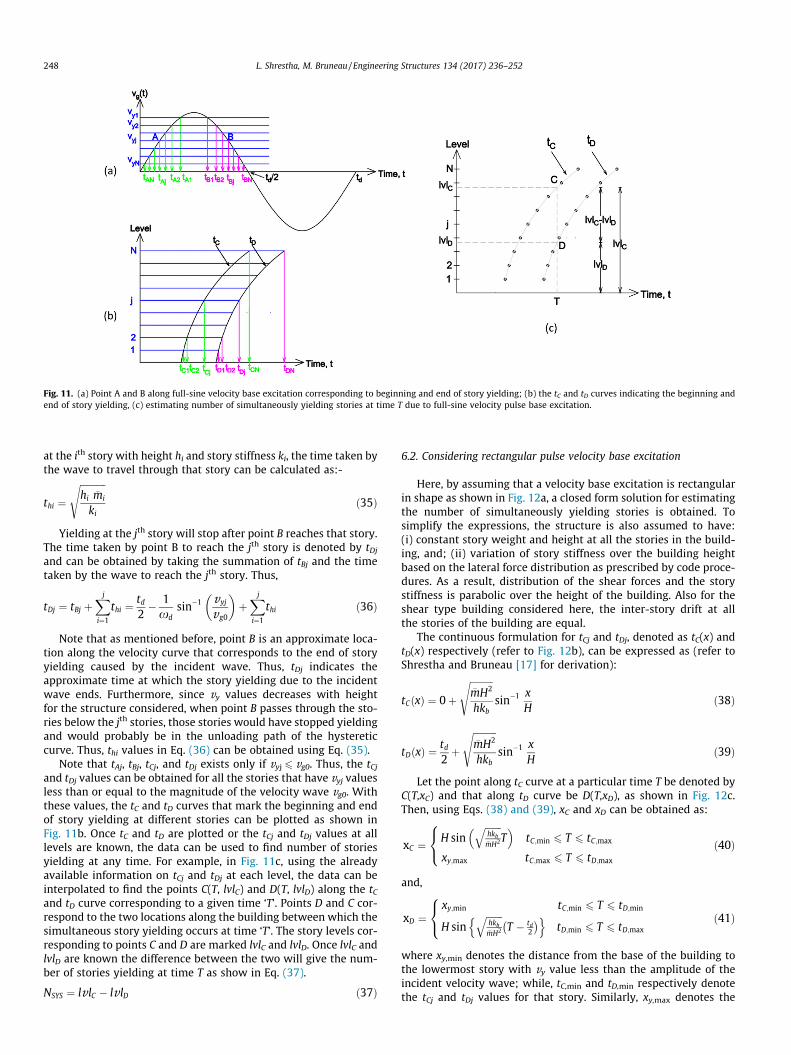
Fig. 11. (a) Point A and B along full-sine velocity base excitation corresponding to beginning and end of story yielding; (b) the tC and tD curves indicating the beginning andend of story yielding, (c) estimating number of simultaneously yielding stories at time T due to full-sine velocity pulse base excitation.
248 L. Shrestha, M. Bruneau / Engineering Structures 134 (2017) 236–252
at the ith story with height hi and story stiffness ki, the time taken bythe wave to travel through that story can be calculated as:-
thi ¼ffiffiffiffiffiffiffiffiffiffiffihi �mi
ki
sð35Þ
Yielding at the jth story will stop after point B reaches that story.The time taken by point B to reach the jth story is denoted by tDjand can be obtained by taking the summation of tBj and the timetaken by the wave to reach the jth story. Thus,
tDj ¼ tBj þXj
i¼1
thi ¼ td2� 1xd
sin�1 vyj
vg0
� �þXj
i¼1
thi ð36Þ
Note that as mentioned before, point B is an approximate loca-tion along the velocity curve that corresponds to the end of storyyielding caused by the incident wave. Thus, tDj indicates theapproximate time at which the story yielding due to the incidentwave ends. Furthermore, since vy values decreases with heightfor the structure considered, when point B passes through the sto-ries below the jth stories, those stories would have stopped yieldingand would probably be in the unloading path of the hystereticcurve. Thus, thi values in Eq. (36) can be obtained using Eq. (35).
Note that tAj, tBj, tCj, and tDj exists only if vyj 6 vg0. Thus, the tCjand tDj values can be obtained for all the stories that have vyj valuesless than or equal to the magnitude of the velocity wave vg0. Withthese values, the tC and tD curves that mark the beginning and endof story yielding at different stories can be plotted as shown inFig. 11b. Once tC and tD are plotted or the tCj and tDj values at alllevels are known, the data can be used to find number of storiesyielding at any time. For example, in Fig. 11c, using the alreadyavailable information on tCj and tDj at each level, the data can beinterpolated to find the points C(T, lvlC) and D(T, lvlD) along the tCand tD curve corresponding to a given time ‘T’. Points D and C cor-respond to the two locations along the building between which thesimultaneous story yielding occurs at time ‘T’. The story levels cor-responding to points C and D are marked lvlC and lvlD. Once lvlC andlvlD are known the difference between the two will give the num-ber of stories yielding at time T as show in Eq. (37).
NSYS ¼ lv lC � lv lD ð37Þ
6.2. Considering rectangular pulse velocity base excitation
Here, by assuming that a velocity base excitation is rectangularin shape as shown in Fig. 12a, a closed form solution for estimatingthe number of simultaneously yielding stories is obtained. Tosimplify the expressions, the structure is also assumed to have:(i) constant story weight and height at all the stories in the build-ing, and; (ii) variation of story stiffness over the building heightbased on the lateral force distribution as prescribed by code proce-dures. As a result, distribution of the shear forces and the storystiffness is parabolic over the height of the building. Also for theshear type building considered here, the inter-story drift at allthe stories of the building are equal.
The continuous formulation for tCj and tDj, denoted as tC(x) andtD(x) respectively (refer to Fig. 12b), can be expressed as (refer toShrestha and Bruneau [17] for derivation):
tCðxÞ ¼ 0þffiffiffiffiffiffiffiffiffiffi�mH2
hkb
ssin�1 x
Hð38Þ
tDðxÞ ¼ td2þ
ffiffiffiffiffiffiffiffiffiffi�mH2
hkb
ssin�1 x
Hð39Þ
Let the point along tC curve at a particular time T be denoted byC(T,xC) and that along tD curve be D(T,xD), as shown in Fig. 12c.Then, using Eqs. (38) and (39), xC and xD can be obtained as:
xC ¼ H sinffiffiffiffiffiffiffihkb�mH2
qT
� �tC;min 6 T 6 tC;max
xy;max tC;max 6 T 6 tD;max
8<: ð40Þ
and,
xD ¼xy;min tC;min 6 T 6 tD;min
H sinffiffiffiffiffiffiffihkb�mH2
qT � td
2
� �n otD;min 6 T 6 tD;max
8<: ð41Þ
where xy,min denotes the distance from the base of the building tothe lowermost story with vy value less than the amplitude of theincident velocity wave; while, tC,min and tD,min respectively denotethe tCj and tDj values for that story. Similarly, xy,max denotes the
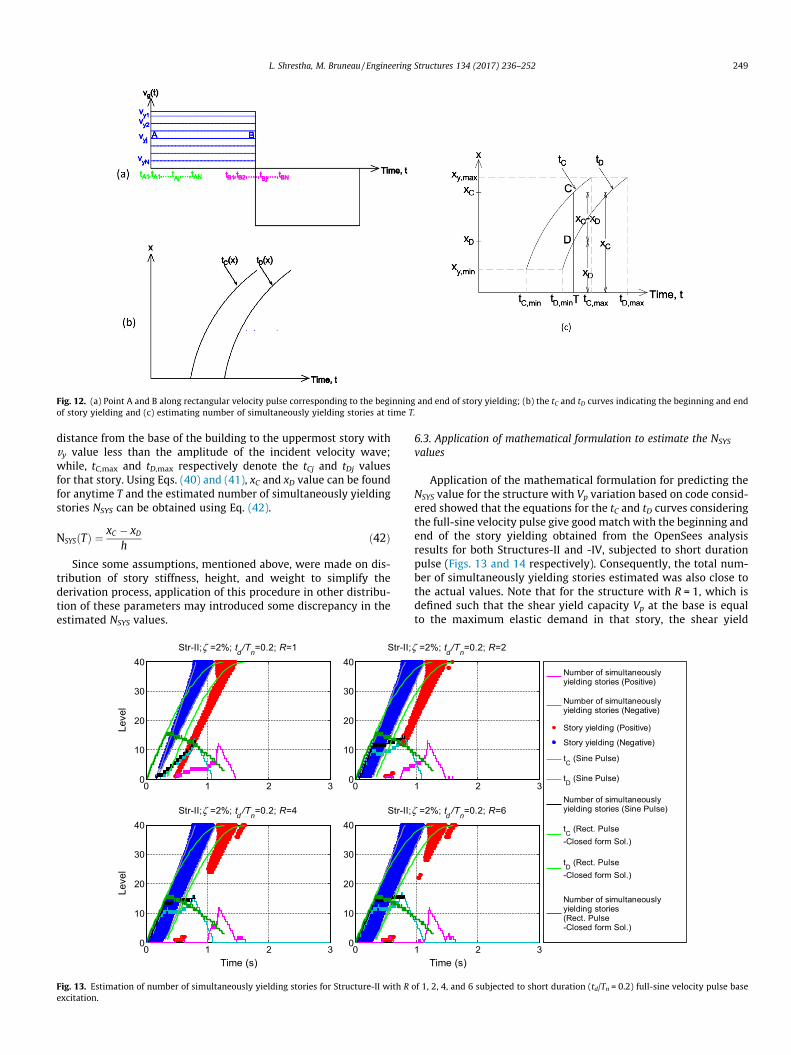
Fig. 12. (a) Point A and B along rectangular velocity pulse corresponding to the beginning and end of story yielding; (b) the tC and tD curves indicating the beginning and endof story yielding and (c) estimating number of simultaneously yielding stories at time T.
L. Shrestha, M. Bruneau / Engineering Structures 134 (2017) 236–252 249
distance from the base of the building to the uppermost story withvy value less than the amplitude of the incident velocity wave;while, tC,max and tD,max respectively denote the tCj and tDj valuesfor that story. Using Eqs. (40) and (41), xC and xD value can be foundfor anytime T and the estimated number of simultaneously yieldingstories NSYS can be obtained using Eq. (42).
NSYSðTÞ ¼ xC � xDh
ð42Þ
Since some assumptions, mentioned above, were made on dis-tribution of story stiffness, height, and weight to simplify thederivation process, application of this procedure in other distribu-tion of these parameters may introduced some discrepancy in theestimated NSYS values.
0 1 2 30
10
20
30
40
Leve
l
Str-II;ζ =2%; td/Tn=0.2; R=1
00
10
20
30
40Str-II;
0 1 2 30
10
20
30
40
Leve
l
Time (s)
Str-II;ζ =2%; td /Tn=0.2; R=4
00
10
20
30
40Str-II;
Fig. 13. Estimation of number of simultaneously yielding stories for Structure-II with Rexcitation.
6.3. Application of mathematical formulation to estimate the NSYS
values
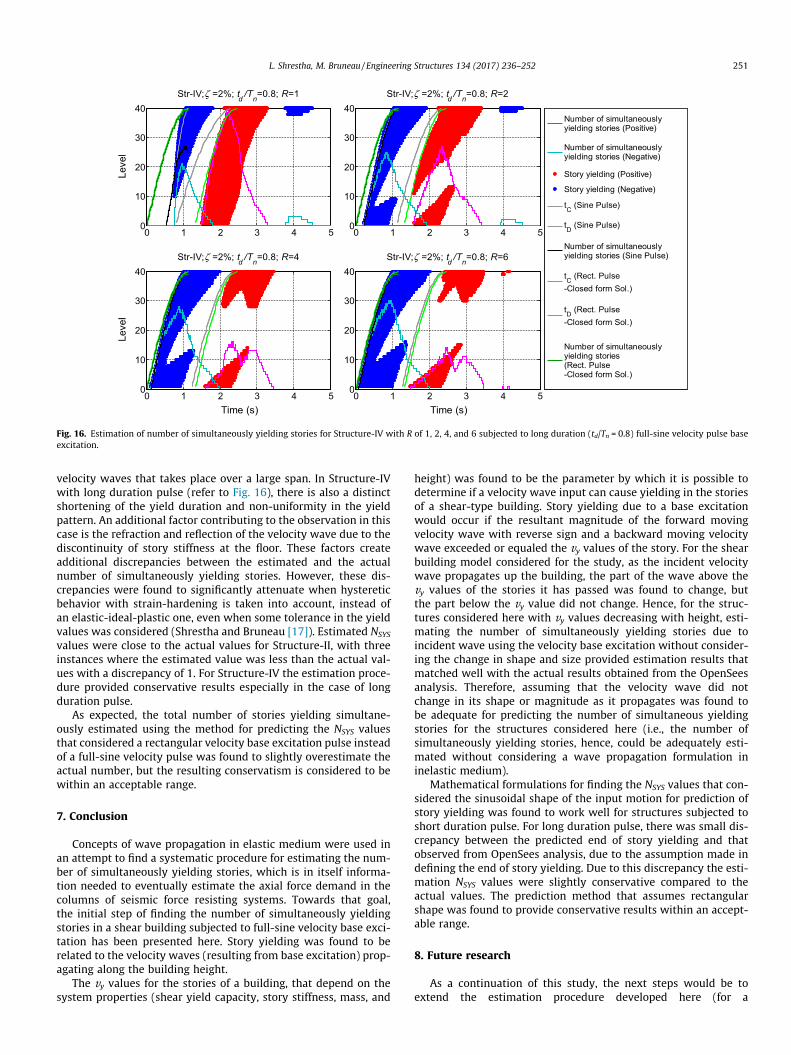
Application of the mathematical formulation for predicting theNSYS value for the structure with Vp variation based on code consid-ered showed that the equations for the tC and tD curves consideringthe full-sine velocity pulse give goodmatch with the beginning andend of the story yielding obtained from the OpenSees analysisresults for both Structures-II and -IV, subjected to short durationpulse (Figs. 13 and 14 respectively). Consequently, the total num-ber of simultaneously yielding stories estimated was also close tothe actual values. Note that for the structure with R = 1, which isdefined such that the shear yield capacity Vp at the base is equalto the maximum elastic demand in that story, the shear yield
Number of simultaneously yielding stories (Positive)
Number of simultaneously yielding stories (Negative)
Story yielding (Positive)
Story yielding (Negative)
tC (Sine Pulse)
tD (Sine Pulse)
Number of simultaneously yielding stories (Sine Pulse)
tC (Rect. Pulse -Closed form Sol.)
tD (Rect. Pulse -Closed form Sol.)
Number of simultaneouslyyielding stories (Rect. Pulse -Closed form Sol.)
1 2 3
ζ =2%; td/Tn=0.2; R=2
1 2 3Time (s)
ζ =2%; td /Tn=0.2; R=6
of 1, 2, 4, and 6 subjected to short duration (td/Tn = 0.2) full-sine velocity pulse base
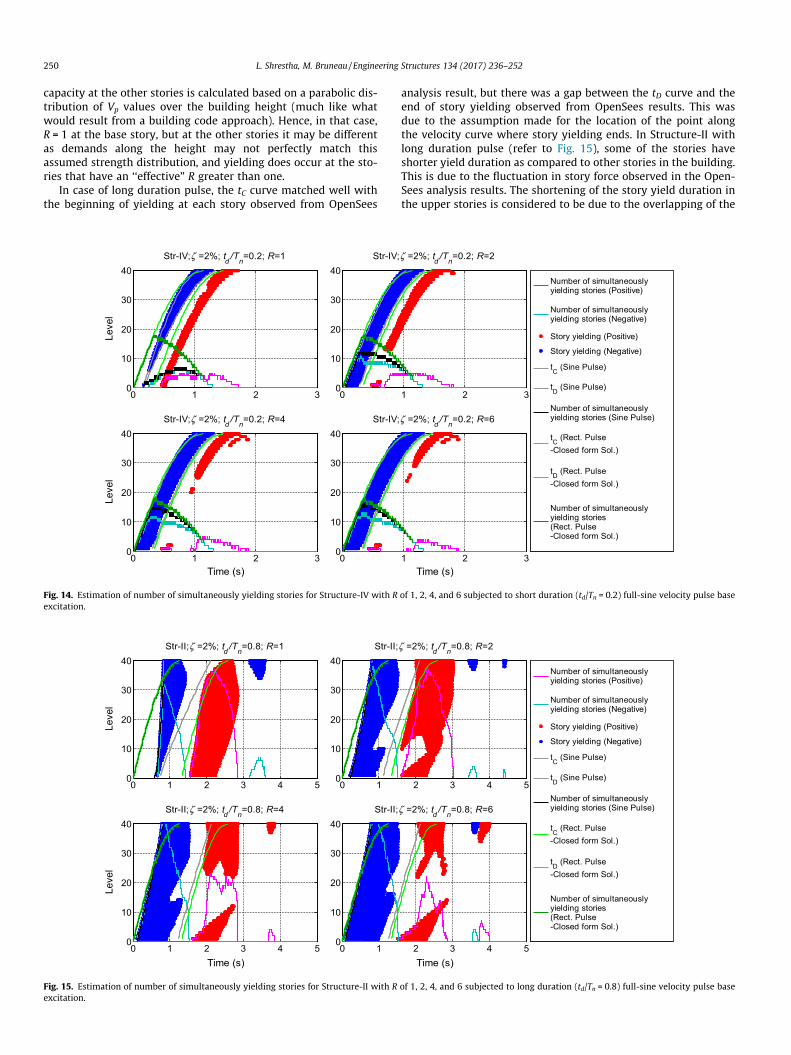
250 L. Shrestha, M. Bruneau / Engineering Structures 134 (2017) 236–252
capacity at the other stories is calculated based on a parabolic dis-tribution of Vp values over the building height (much like whatwould result from a building code approach). Hence, in that case,R = 1 at the base story, but at the other stories it may be differentas demands along the height may not perfectly match thisassumed strength distribution, and yielding does occur at the sto-ries that have an ‘‘effective” R greater than one.
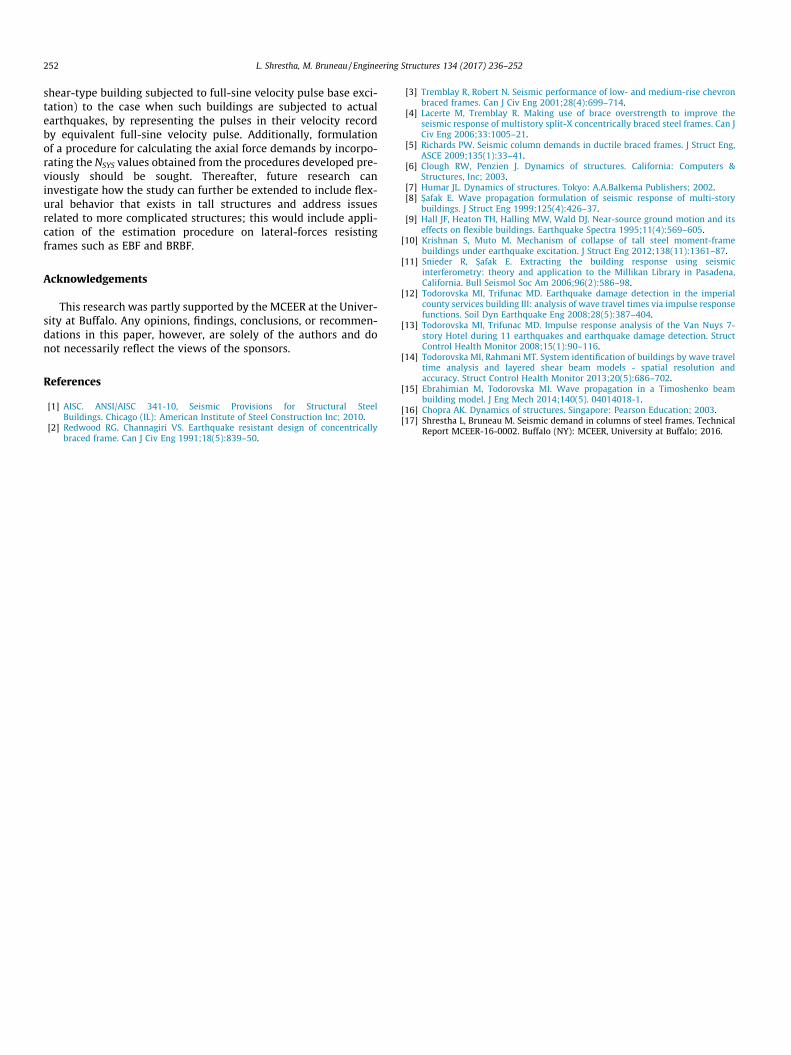
In case of long duration pulse, the tC curve matched well withthe beginning of yielding at each story observed from OpenSees
0 1 2 3 4 50
10
20
30
40
Leve
l
Str-II;ζ =2%; td /Tn=0.8; R=1
0 10
10
20
30
40Str-II;
0 1 2 3 4 50
10
20
30
40
Leve
l
Time (s)
Str-II;ζ =2%; td /Tn=0.8; R=4
0 10
10
20
30
40Str-II;
Fig. 15. Estimation of number of simultaneously yielding stories for Structure-II with Rexcitation.
0 1 2 30
10
20
30
40
Leve
l
Str-IV;ζ =2%; td /Tn=0.2; R=1
00
10
20
30
40Str-IV;
0 1 2 30
10
20
30
40
Leve
l
Time (s)
Str-IV;ζ =2%; td /Tn=0.2; R=4
00
10
20
30
40Str-IV;
Fig. 14. Estimation of number of simultaneously yielding stories for Structure-IV with Rexcitation.
analysis result, but there was a gap between the tD curve and theend of story yielding observed from OpenSees results. This wasdue to the assumption made for the location of the point alongthe velocity curve where story yielding ends. In Structure-II withlong duration pulse (refer to Fig. 15), some of the stories haveshorter yield duration as compared to other stories in the building.This is due to the fluctuation in story force observed in the Open-Sees analysis results. The shortening of the story yield duration inthe upper stories is considered to be due to the overlapping of the
Number of simultaneously yielding stories (Positive)
Number of simultaneously yielding stories (Negative)
Story yielding (Positive)
Story yielding (Negative)
tC (Sine Pulse)
tD (Sine Pulse)
Number of simultaneously yielding stories (Sine Pulse)
tC (Rect. Pulse -Closed form Sol.)
tD (Rect. Pulse -Closed form Sol.)
Number of simultaneouslyyielding stories (Rect. Pulse -Closed form Sol.)
2 3 4 5
ζ =2%; td /Tn=0.8; R=2
2 3 4 5Time (s)
ζ =2%; td /Tn=0.8; R=6
of 1, 2, 4, and 6 subjected to long duration (td/Tn = 0.8) full-sine velocity pulse base
Number of simultaneously yielding stories (Positive)
Number of simultaneously yielding stories (Negative)
Story yielding (Positive)
Story yielding (Negative)
tC (Sine Pulse)
tD (Sine Pulse)
Number of simultaneously yielding stories (Sine Pulse)
tC (Rect. Pulse -Closed form Sol.)
tD (Rect. Pulse -Closed form Sol.)
Number of simultaneouslyyielding stories (Rect. Pulse -Closed form Sol.)
1 2 3
ζ =2%; td /Tn=0.2; R=2
1 2 3Time (s)
ζ =2%; td /Tn=0.2; R=6
of 1, 2, 4, and 6 subjected to short duration (td/Tn = 0.2) full-sine velocity pulse base
0 1 2 3 4 50
10
20
30
40Le
vel
Str-IV;ζ =2%; td /Tn=0.8; R=1
Number of simultaneously yielding stories (Positive)
Number of simultaneously yielding stories (Negative)
Story yielding (Positive)
Story yielding (Negative)
tC (Sine Pulse)
tD (Sine Pulse)
Number of simultaneously yielding stories (Sine Pulse)
tC (Rect. Pulse -Closed form Sol.)
tD (Rect. Pulse -Closed form Sol.)
Number of simultaneouslyyielding stories (Rect. Pulse -Closed form Sol.)
0 1 2 3 4 50
10
20
30
40Str-IV;ζ =2%; td /Tn=0.8; R=2
0 1 2 3 4 50
10
20
30
40
Leve
l
Time (s)
Str-IV;ζ =2%; td /Tn=0.8; R=4
0 1 2 3 4 50
10
20
30
40
Time (s)
Str-IV;ζ =2%; td /Tn=0.8; R=6
Fig. 16. Estimation of number of simultaneously yielding stories for Structure-IV with R of 1, 2, 4, and 6 subjected to long duration (td/Tn = 0.8) full-sine velocity pulse baseexcitation.
L. Shrestha, M. Bruneau / Engineering Structures 134 (2017) 236–252 251
velocity waves that takes place over a large span. In Structure-IVwith long duration pulse (refer to Fig. 16), there is also a distinctshortening of the yield duration and non-uniformity in the yieldpattern. An additional factor contributing to the observation in thiscase is the refraction and reflection of the velocity wave due to thediscontinuity of story stiffness at the floor. These factors createadditional discrepancies between the estimated and the actualnumber of simultaneously yielding stories. However, these dis-crepancies were found to significantly attenuate when hystereticbehavior with strain-hardening is taken into account, instead ofan elastic-ideal-plastic one, even when some tolerance in the yieldvalues was considered (Shrestha and Bruneau [17]). Estimated NSYS
values were close to the actual values for Structure-II, with threeinstances where the estimated value was less than the actual val-ues with a discrepancy of 1. For Structure-IV the estimation proce-dure provided conservative results especially in the case of longduration pulse.
As expected, the total number of stories yielding simultane-ously estimated using the method for predicting the NSYS valuesthat considered a rectangular velocity base excitation pulse insteadof a full-sine velocity pulse was found to slightly overestimate theactual number, but the resulting conservatism is considered to bewithin an acceptable range.
7. Conclusion
Concepts of wave propagation in elastic medium were used inan attempt to find a systematic procedure for estimating the num-ber of simultaneously yielding stories, which is in itself informa-tion needed to eventually estimate the axial force demand in thecolumns of seismic force resisting systems. Towards that goal,the initial step of finding the number of simultaneously yieldingstories in a shear building subjected to full-sine velocity base exci-tation has been presented here. Story yielding was found to berelated to the velocity waves (resulting from base excitation) prop-agating along the building height.
The vy values for the stories of a building, that depend on thesystem properties (shear yield capacity, story stiffness, mass, and
height) was found to be the parameter by which it is possible todetermine if a velocity wave input can cause yielding in the storiesof a shear-type building. Story yielding due to a base excitationwould occur if the resultant magnitude of the forward movingvelocity wave with reverse sign and a backward moving velocitywave exceeded or equaled the vy values of the story. For the shearbuilding model considered for the study, as the incident velocitywave propagates up the building, the part of the wave above thevy values of the stories it has passed was found to change, butthe part below the vy value did not change. Hence, for the struc-tures considered here with vy values decreasing with height, esti-mating the number of simultaneously yielding stories due toincident wave using the velocity base excitation without consider-ing the change in shape and size provided estimation results thatmatched well with the actual results obtained from the OpenSeesanalysis. Therefore, assuming that the velocity wave did notchange in its shape or magnitude as it propagates was found tobe adequate for predicting the number of simultaneous yieldingstories for the structures considered here (i.e., the number ofsimultaneously yielding stories, hence, could be adequately esti-mated without considering a wave propagation formulation ininelastic medium).
Mathematical formulations for finding the NSYS values that con-sidered the sinusoidal shape of the input motion for prediction ofstory yielding was found to work well for structures subjected toshort duration pulse. For long duration pulse, there was small dis-crepancy between the predicted end of story yielding and thatobserved from OpenSees analysis, due to the assumption made indefining the end of story yielding. Due to this discrepancy the esti-mation NSYS values were slightly conservative compared to theactual values. The prediction method that assumes rectangularshape was found to provide conservative results within an accept-able range.
8. Future research
As a continuation of this study, the next steps would be toextend the estimation procedure developed here (for a
252 L. Shrestha, M. Bruneau / Engineering Structures 134 (2017) 236–252
shear-type building subjected to full-sine velocity pulse base exci-tation) to the case when such buildings are subjected to actualearthquakes, by representing the pulses in their velocity recordby equivalent full-sine velocity pulse. Additionally, formulationof a procedure for calculating the axial force demands by incorpo-rating the NSYS values obtained from the procedures developed pre-viously should be sought. Thereafter, future research caninvestigate how the study can further be extended to include flex-ural behavior that exists in tall structures and address issuesrelated to more complicated structures; this would include appli-cation of the estimation procedure on lateral-forces resistingframes such as EBF and BRBF.
Acknowledgements
This research was partly supported by the MCEER at the Univer-sity at Buffalo. Any opinions, findings, conclusions, or recommen-dations in this paper, however, are solely of the authors and donot necessarily reflect the views of the sponsors.
References
[1] AISC. ANSI/AISC 341-10, Seismic Provisions for Structural SteelBuildings. Chicago (IL): American Institute of Steel Construction Inc; 2010.
[2] Redwood RG, Channagiri VS. Earthquake resistant design of concentricallybraced frame. Can J Civ Eng 1991;18(5):839–50.
[3] Tremblay R, Robert N. Seismic performance of low- and medium-rise chevronbraced frames. Can J Civ Eng 2001;28(4):699–714.
[4] Lacerte M, Tremblay R. Making use of brace overstrength to improve theseismic response of multistory split-X concentrically braced steel frames. Can JCiv Eng 2006;33:1005–21.
[5] Richards PW. Seismic column demands in ductile braced frames. J Struct Eng,ASCE 2009;135(1):33–41.
[6] Clough RW, Penzien J. Dynamics of structures. California: Computers &Structures, Inc; 2003.
[7] Humar JL. Dynamics of structures. Tokyo: A.A.Balkema Publishers; 2002.[8] S�afak E. Wave propagation formulation of seismic response of multi-story
buildings. J Struct Eng 1999;125(4):426–37.[9] Hall JF, Heaton TH, Halling MW, Wald DJ. Near-source ground motion and its
effects on flexible buildings. Earthquake Spectra 1995;11(4):569–605.[10] Krishnan S, Muto M. Mechanism of collapse of tall steel moment-frame
buildings under earthquake excitation. J Struct Eng 2012;138(11):1361–87.[11] Snieder R, S�afak E. Extracting the building response using seismic
interferometry: theory and application to the Millikan Library in Pasadena,California. Bull Seismol Soc Am 2006;96(2):586–98.
[12] Todorovska MI, Trifunac MD. Earthquake damage detection in the imperialcounty services building III: analysis of wave travel times via impulse responsefunctions. Soil Dyn Earthquake Eng 2008;28(5):387–404.
[13] Todorovska MI, Trifunac MD. Impulse response analysis of the Van Nuys 7-story Hotel during 11 earthquakes and earthquake damage detection. StructControl Health Monitor 2008;15(1):90–116.
[14] Todorovska MI, Rahmani MT. System identification of buildings by wave traveltime analysis and layered shear beam models - spatial resolution andaccuracy. Struct Control Health Monitor 2013;20(5):686–702.
[15] Ebrahimian M, Todorovska MI. Wave propagation in a Timoshenko beambuilding model. J Eng Mech 2014;140(5). 04014018-1.
[16] Chopra AK. Dynamics of structures. Singapore: Pearson Education; 2003.[17] Shrestha L, Bruneau M. Seismic demand in columns of steel frames. Technical
Report MCEER-16-0002. Buffalo (NY): MCEER, University at Buffalo; 2016.