Embed Size (px)
Citation preview

8/3/2019 finalsoln2010spr
http://slidepdf.com/reader/full/finalsoln2010spr 1/6
EE 3512 – Signals – Spring 2011
Dr. Obeid
5/9/2011 NAME_____________________
SHOW ALL WORK IN ORDER TO RECEIVE PARTIAL CREDIT! Page 1 of 6
Final Exam
1. (20 points total) Consider the square wave shown here:
The magnitude of the Fourier Series of this square wave is given by the expression !!!
!
!"
when ! is odd and !!!
! when ! is even. Suppose we want to sample this continuous timesignal at a sampling rate of !!! !"!"#.
a. (10 points) Which harmonic (i.e. which value of !) will be the first one to alias?
Fmax = Fs/2 = 8kHz.
Harmonics are at odd integer multiples of 1/T = 1/1ms = 1kHz.
Therefore, the first aliased harmonic will be at 9kHz (n=9)
b. (5 points) For the harmonic corresponding to ! ! !, what will be the corresponding discrete-time frequency !?
f=3*1000 = 3000Hz
! = 2*pi*f/Fs = 0.375pi
c. (5 points) For the harmonic corresponding to ! ! !!, what will be the correspondingdiscrete-time frequency !?
! = 2*pi*11,000/16,000 = 11pi/8 => 5pi/8 = 0.675pi
2.5 2 1.5 1 0.5 0 0.5 1 1.5 2 2.5
0
0.5
1
time (ms)
x(t)

8/3/2019 finalsoln2010spr
http://slidepdf.com/reader/full/finalsoln2010spr 2/6
EE 3512 – Signals – Spring 2011
Dr. Obeid
5/9/2011 NAME_____________________
SHOW ALL WORK IN ORDER TO RECEIVE PARTIAL CREDIT! Page 2 of 6
2. (25 points total) Discrete-Time Convolution
a. (10 points) Convolve the following two signals:
Y[n] = [3 1 1 0 0] + [0 0 -6 -2 -2] = [3 1 -5 -2 -2]
2 1 0 1 2 33
2
1
0
1
2
34
x[n]
sample (n)2 1 0 1 2 33
2
1
0
1
2
34
h[n]
sample (n)

8/3/2019 finalsoln2010spr
http://slidepdf.com/reader/full/finalsoln2010spr 3/6
EE 3512 – Signals – Spring 2011
Dr. Obeid
5/9/2011 NAME_____________________
SHOW ALL WORK IN ORDER TO RECEIVE PARTIAL CREDIT! Page 3 of 6
b. (10 points) Suppose you are given the filter ! ! ! !!!!!!!!!!!. Explain how you could
determine what kind of filter this is, i.e. high-pass, low-pass, or other. [Note – you shouldn’tactually try to determine what kind of filter this is, but rather just explain the method of how it
could be done in two or three sentences].
Two methods:
1. You could take the discrete time fourier transform of h[n] and plot it with respect to !.
2. You could convolve h[n] with cosines of different frequencies and measure the amplitude
of the resulting signals y[n]
c. (5 points) Suppose that when an input signal !! ! ! !!!!! is passed into a filter, the output
is ! ! ! !!!!! . What is the filter response to input signal !! ! ! !!!!!!!"?Two methods:
1. Determine h[n] such that x1[n] convolved with h[n] gives y[n]. You will find that h[n] mustequal [1 2]. Then convolve x2[n] with h[n] to produce y2[n] = 1 2 -1 -2.
2. Note that x2[n] = x1[n] – x1[n-1]. Therefore y2[n] = y[n] – y[n-1] = 1 2 -1 -2
8/3/2019 finalsoln2010spr
http://slidepdf.com/reader/full/finalsoln2010spr 4/6
EE 3512 – Signals – Spring 2011
Dr. Obeid
5/9/2011 NAME_____________________
SHOW ALL WORK IN ORDER TO RECEIVE PARTIAL CREDIT! Page 4 of 6
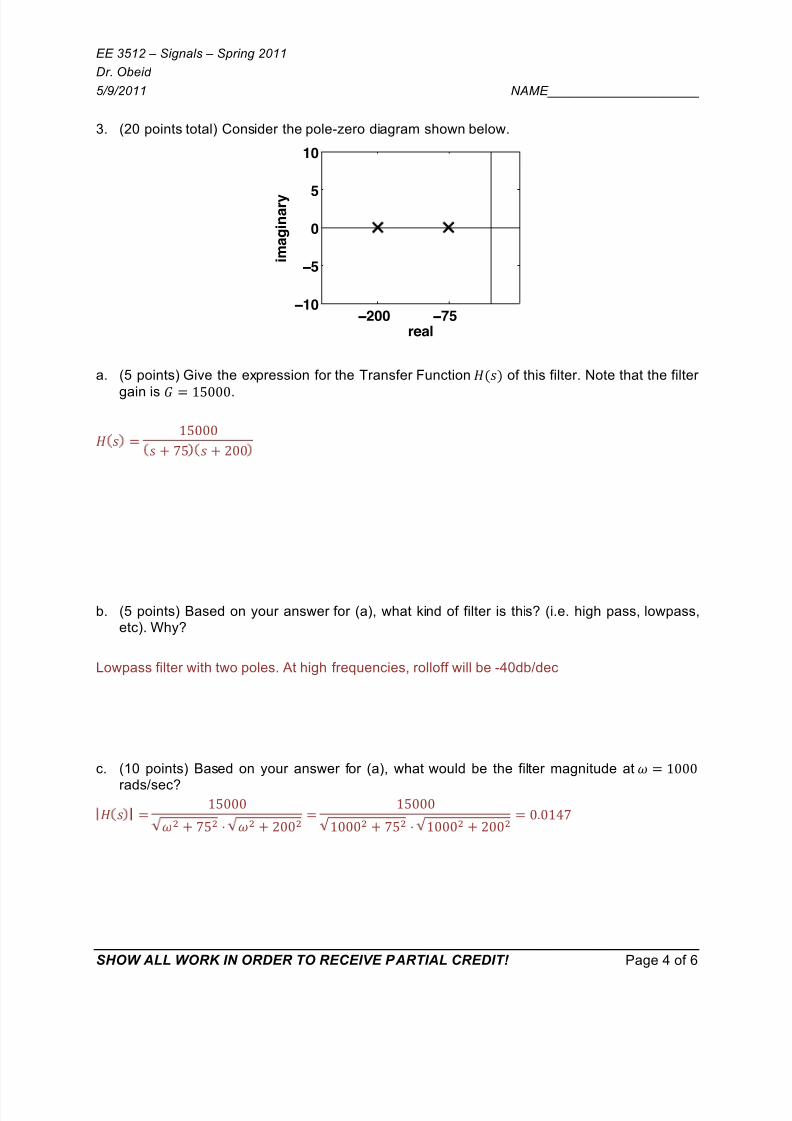
3. (20 points total) Consider the pole-zero diagram shown below.
a. (5 points) Give the expression for the Transfer Function !!!! of this filter. Note that the filter
gain is ! ! !"###.
! ! !
!"###
! ! !" ! ! !""
b. (5 points) Based on your answer for (a), what kind of filter is this? (i.e. high pass, lowpass,etc). Why?
Lowpass filter with two poles. At high frequencies, rolloff will be -40db/dec
c. (10 points) Based on your answer for (a), what would be the filter magnitude at ! ! !"""
rads/sec?
! ! !
!"###
!! ! !"! ! !
! ! !""!!
!"###
!"""! ! !"! ! !"""! ! !""!! !!!"#$
200 7510
5
0
5
10
real
i m a g i n a r y

8/3/2019 finalsoln2010spr
http://slidepdf.com/reader/full/finalsoln2010spr 5/6
EE 3512 – Signals – Spring 2011
Dr. Obeid
5/9/2011 NAME_____________________
SHOW ALL WORK IN ORDER TO RECEIVE PARTIAL CREDIT! Page 5 of 6
4. (15 points) Suppose you are asked to anti-alias a signal using a five-pole filter using either aButterworth, Chebyshev, or Elliptic filer. Explain the tradeoffs involved in making this
decision. When might it make sense to use one type or another?
Butterworth has smooth passband but doesn’t roll off as quickly in the stopband. In contrast,
Cheby and Elliptic filters have passband ripple but roll off much more effectively in the stopband. If your application can tolerate adding some magnitude ripple in the passband, you arebetter off using Cheby or Elliptic filters. Otherwise, you will have to use a Butterworth.

8/3/2019 finalsoln2010spr
http://slidepdf.com/reader/full/finalsoln2010spr 6/6
EE 3512 – Signals – Spring 2011
Dr. Obeid
5/9/2011 NAME_____________________
SHOW ALL WORK IN ORDER TO RECEIVE PARTIAL CREDIT! Page 6 of 6
5. (20 points total) The following plot shows the Fourier Transform ! ! of an audio signal !!!!
and the transfer function of a filter ! ! that will be used to filter !!!!. The filter output will be
!!!!.
a. (5 points) Based on the Fourier Transform !! !!, describe what the signal !!!! might soundlike. Although this is a vague question, answer as best as you can in one or two sentences.
You only need to look at !! !! to answer this part – no need to consider !! !!.
The signal appears to have a lot of energy around 100Hz. This is a low frequency in the audiospectrum and therefore we would expect the signal to have a lot of bass tones. In fact, the audioused to generate this figure comes from the hip-hop song “Mama Said Knock You Out” by LL
Cool J which has heavy bass tones throughout.
b. (10 points) Sketch as best as possible what the Fourier Transform of the filter output ! !
would look like.
c. (5 points) How would you expect the filter output ! ! to sound in comparison to the filter
input !!!!?
High frequency tones get amplified by 10x; low frequency tones also get amplified but by much
less than 10x. Overall effect is to make signal sound less bassy than before.
101
102
103
104
0
5
10
15
20
freq (Hz)
M a g n i t u d e ( d B )
Filter H(f)
101
102
103
104
0
0.5
1 x 10⁵
freq (Hz)
s i g n a l a m p l i t u d e
Signal X(f)
101
102
103
104
0
0.5
1x 10
4
freq (Hz)
s i g n a l a m p l i t u d e
Signal Y(f)


