Embed Size (px)
Citation preview

Globalisation or Regionalisation?A New Approach to Measure the International
Fragmentation of Value Chains
Bart Los, Marcel Timmer and Gaaitzen de Vries(University of Groningen)
Workshop “The Wealth of Nations in a Globalizing World”
Groningen, July 18‐19, 2013
[the authors blame each other for any mistakes]
Motivation
• Rapid increase in international fragmentation of production International Trade Theory: Grossman and Rossi‐Hansberg, 2008; Costinot et al., 2013Empirical work: Feenstra and Hanson, 1999; Hummels, Ishii and Yi, 2001; Johnson and Noguera, 2012a,b; Koopman et al., 2013; Baldwin and Lopez‐Gonzalez, 2013
• To what extent is this international fragmentation of production regional or global?
Johnson and Noguera, 2012b; Baldwin and Lopez‐Gonzalez, 2013
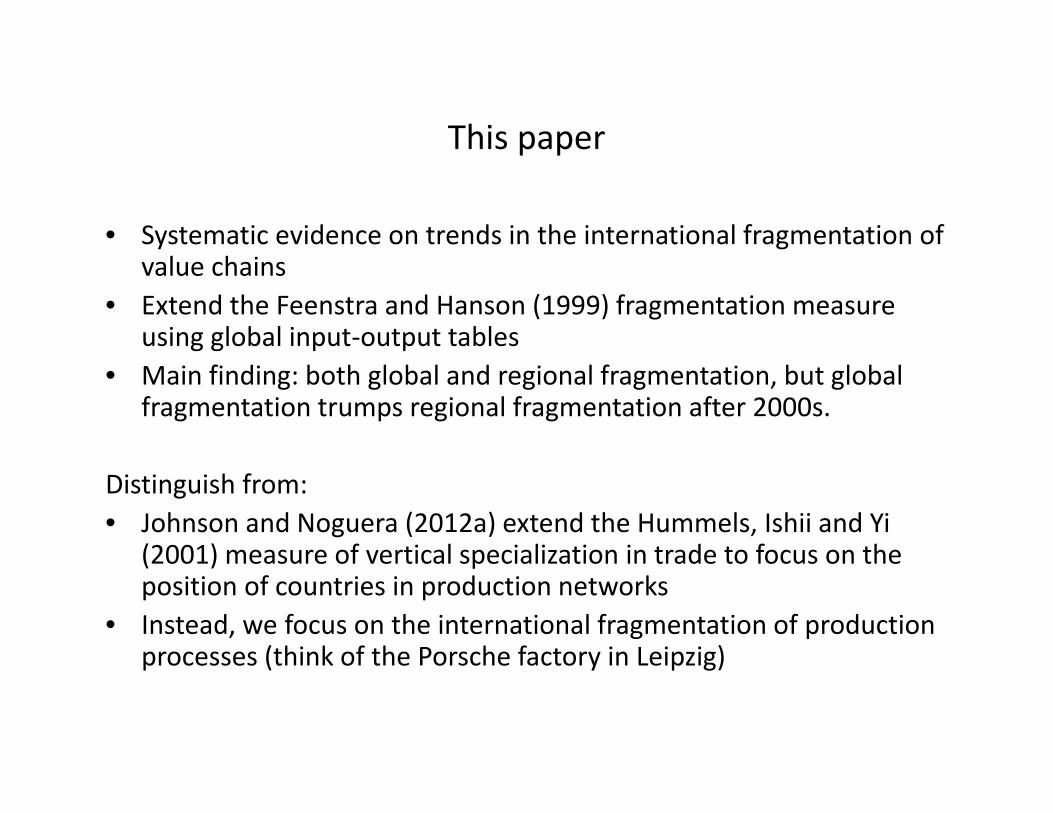
This paper
• Systematic evidence on trends in the international fragmentation of value chains
• Extend the Feenstra and Hanson (1999) fragmentation measure using global input‐output tables
• Main finding: both global and regional fragmentation, but global fragmentation trumps regional fragmentation after 2000s.
Distinguish from:• Johnson and Noguera (2012a) extend the Hummels, Ishii and Yi
(2001) measure of vertical specialization in trade to focus on the position of countries in production networks
• Instead, we focus on the international fragmentation of productionprocesses (think of the Porsche factory in Leipzig)

Methodology
• Feenstra and Hanson (FH, 1999) measure* is in principle silent on origin of imported inputs* can be affected by the substitution of domestic value
added for intermediates* disregards back and forth trade in intermediates
• Our measure is based on final output values, it takes into account multiple rounds of production and traces the geographical origin of value added.
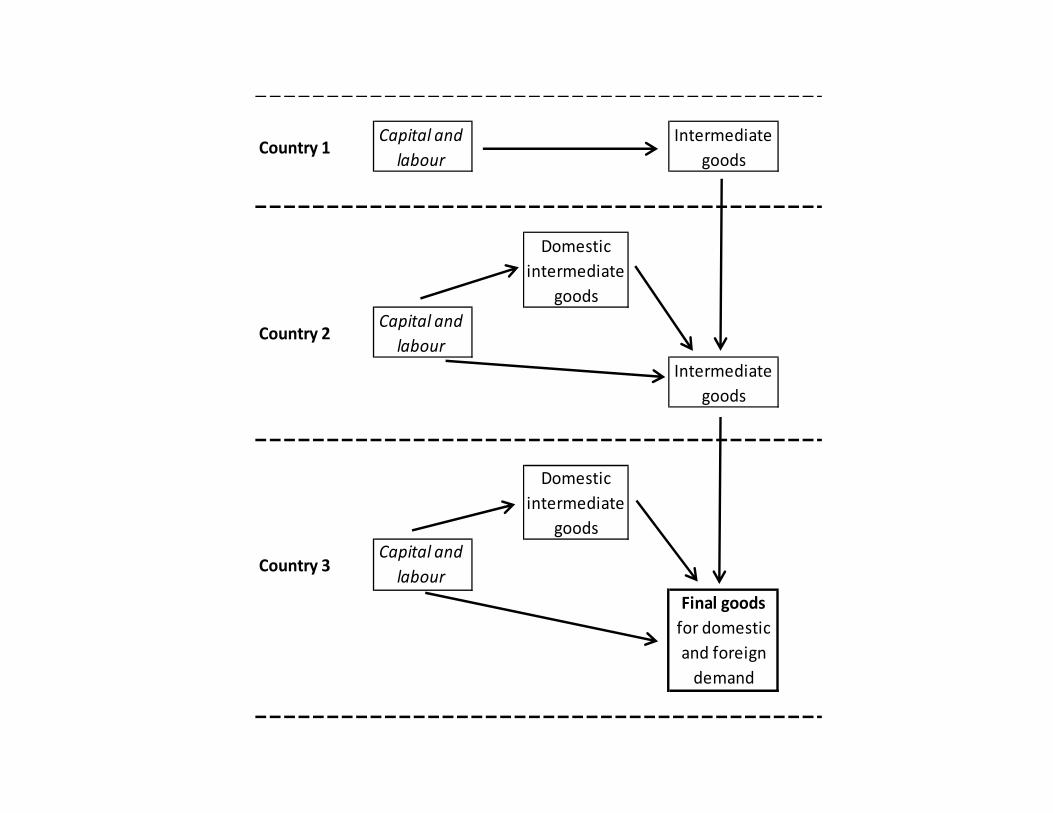
Country 1Capital and labour
Intermediate goods
Domestic intermediate
goods
Country 2Capital and labour
Intermediate goods
Domestic intermediate
goods
Country 3Capital and labour
Final goods for domestic and foreign demand

More formally
• We define the global value chain of a final product from industry ilocated in a specific country j as the activities in industries s=1,…,Sin each of the countries n=1,…,N required to produce it. We will label (i,j) the “country‐industry‐of‐completion”
• To decompose its value, we start with the levels of gross output associated with the production of (i,j).
• Global input‐output tables contain information on the values of intermediate input flows among all country‐industries in the world, as well as on the values of flows from each of these country‐industries to final use in each of the countries.
• These tables also contain information on value added generated in each of the country‐industries.

Foreign Value Added (FVA)
g = (I ‐A)‐1( e)
g is the vector of value added created in each of the SN country‐industries within a global value chain. is the matrix of final output delivered for household consumption
and investment demand. only the row representing final demand for country‐industry (i,j) have their actual value and all other final demand is set to 0
e is a summation vector. (I‐A)‐1 is the well‐known Leontief inverse, the use of which ensures that value added contributions in all tiers of suppliers are taken into account. v is a vector with value added over gross output ratios, for each of the country‐industries.

Foreign Value Added (FVA)
Denote the value of final product (i,j) by VA(i,j) and the value added by country k in its production by VA(k)(i,j). The vector g contains for each (i,j) the matching VA(k)(i,j)’s such that
VA i, j ∑ VA k i, j
Summed over all countries, the value added contributions to the production of (i,j) is equal to the final output value of (i,j). We define our measure of foreign value added as all value added outside the country‐of‐completion of product (i,j):
FVA i, j VA k i, j VA i, j VA j i, j
FVAs(i,j) = FVA(i,j)/VA(i,j)

Main characteristics of WIOD
• Time‐series (1995‐2011) benchmarked on NA data • National supply and use tables as the point of departure • Based on detailed accounts of trade in goods and services• Improved allocation of imports of goods to use categories
(modified BEC)• Based on official statistics with maximum of transparency
in calculations• Fully compatible satellite accounts with data on use and
remuneration of production factors (capital and labour of three skill levels)

A stylized world input‐output table

WWW. WIOD.ORG
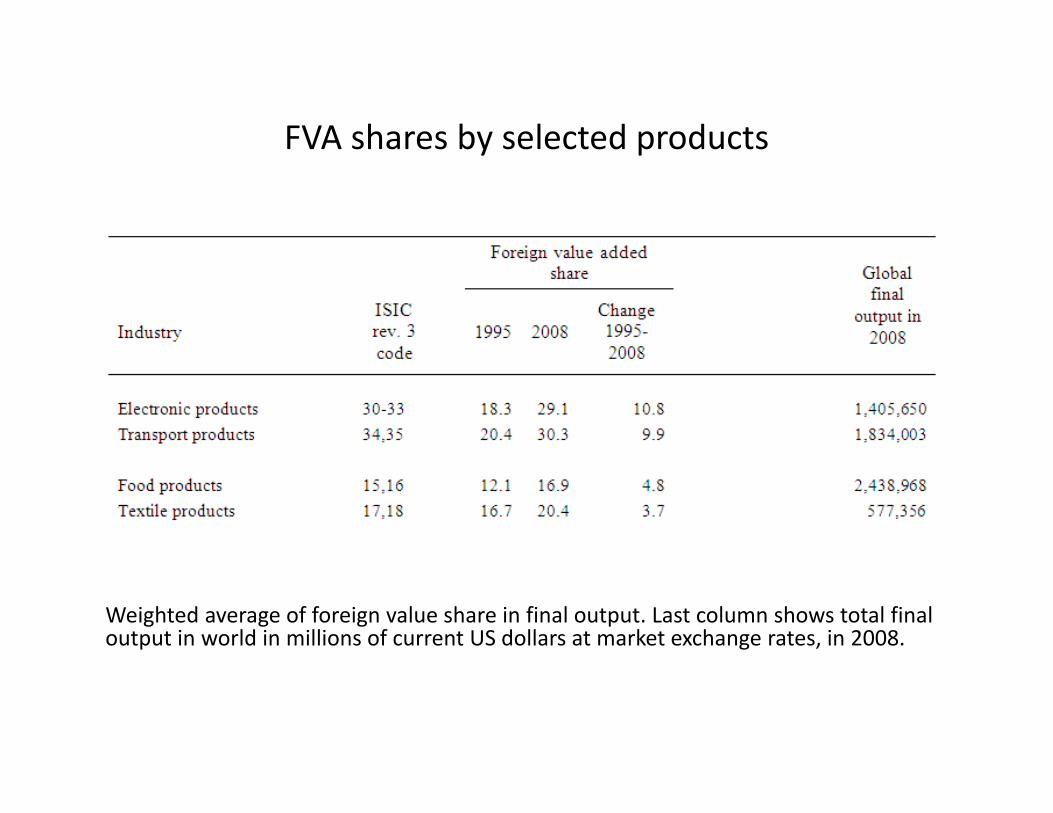
FVA shares by selected products
Weighted average of foreign value share in final output. Last column shows total final output in world in millions of current US dollars at market exchange rates, in 2008.

Regression of shares of foreign value added in output of final manufactures on country‐of‐completiondummies, industry‐of‐completion dummies and year dummies. The figure provides estimated coefficients and95 percent confidence intervals of year dummies. The observations (6,351) are weighted by final output.
0.0
2.0
4.0
6.0
8
1995 1997 1999 2001 2003 2005 2007 2009 2011year
ub2/lb2 beta

Global or regional fragmentation?
Based on the measures of foreign value added, we can easily define regional and global fragmentation. We measure regional value added (RVA) in the value of product i with country j as country‐of‐completion as the value added contribution of other countries in the region to which country j belongs, as follows:
RVA i, j ∑ VA k i, j VA j i, j∈
If the change in RVA is positive we say that the VC of this product is regionally fragmenting. Along the same lines, we measure global value added in this VC as the value added contribution of all countries outside the region of country j, as follows:
GVA i, j ∑ VA k i, j∈
and we say that a VC is globally fragmenting when the change in GVA is positive.
Note: FVA(i,j) = RVA(i,j) + GVA(i,j)

0.2
.4.6
regi
onal
VA
shar
e 20
08
0 .2 .4 .6regional VA share 1995
0.2
.4.6
.81
glob
al V
A sh
are
2008
0 .2 .4 .6 .8 1global VA share 1995

Foreign value added originating in‐ and outside the region in a country’s VCs
Weighted foreign value added shares of fourteen manufacturing product groups in final output of GVCs for which a country is the final stage of production. Shares are weighted with final output for each product group.

Concluding remarks• Driven by rapid advances in information and communication
technology and the opening up of China and Eastern Europe in the 1990s, companies increasingly moved parts of their production activities to benefit from location advantages of other countries.
• We generalized the Feenstra and Hanson (1999) measure toprovide quantitative evidence
• Both regional and global fragmentation of value‐addingactivities, but especially global fragmentation
Thank youGaaitzen de Vries: [email protected]


International Production Fragmentation (IPF) index
Our International Production Fragmentation (IPF) index is based on the Theil’s Mean‐log‐deviation index which is a cross‐entropy measure. It measures the distance between two country‐distributions of the value of a particular product
1. the actual value distribution: the shares of countries in the value of a product
2. the value distribution in a world with no fragmentation costs. When all production factors are perfectly mobile, this would be equal to the shares of countries in world GDP

International Production Fragmentation (IPF) index
t,j: “country‐industry”‐of‐assembly of interestm,n: macroregions and countries or regions
Theil’s Mean‐log‐deviation indexZero if global value chain income shares identical to GDP sharesGoes down when fragmentation goes upCan be decomposed, to study extent of “globalization” vs. “regionalization”

Fragmentation: 1995 – 2011
Slope: 0.81
Production fragmentation has increased

Fragmentation heterogeneity across Product groups
0 .5 1 1.5 2
Paper and printing products
Wood products
Other non-metallic minerals
Food products
Leather products
Petroleum products
Manufacturing n.e.c.
Textile products
Machinery, n.e.c.
Chemical products
Rubber and plastics
Basic and fabricated metals
Transport products
Electronic products
IPF index, 2011