Embed Size (px)
Citation preview

Healthy Schools = Healthy Kids = Learning BetterHealthy Schools = Healthy Kids = Learning Better
OROR
What is the relationship between school What is the relationship between school
health policy and learning?health policy and learning?
Julia Dilley PhD MESJulia Dilley PhD MESWashington State - Healthy Schools SummitWashington State - Healthy Schools Summit
May 2008May 2008
? ?

22
ObjectivesObjectives
Increase skills for: Increase skills for: Using WA Healthy Youth Survey to Using WA Healthy Youth Survey to
describe “healthy students”describe “healthy students” Using WA School Health Profile data to Using WA School Health Profile data to
describe “healthy schools”describe “healthy schools” Describing association between academic Describing association between academic
achievement & healthachievement & health Describing association between school Describing association between school
health policies and student healthhealth policies and student health
33
BackgroundBackground
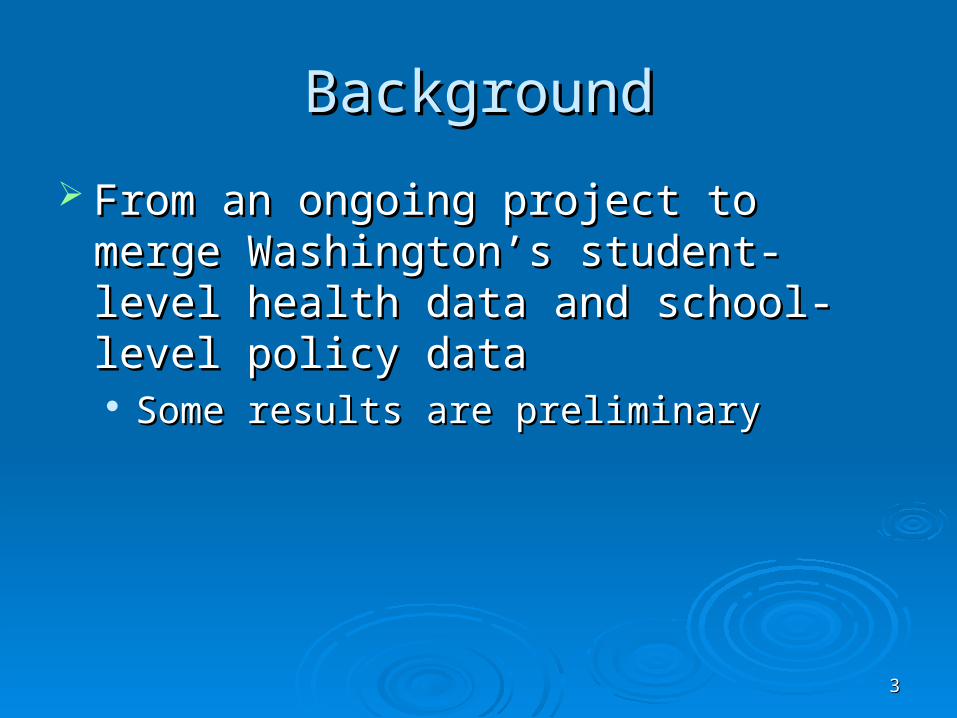
From an ongoing project to merge From an ongoing project to merge Washington’s student-level health data Washington’s student-level health data and school-level policy dataand school-level policy data Some results are preliminary Some results are preliminary

44
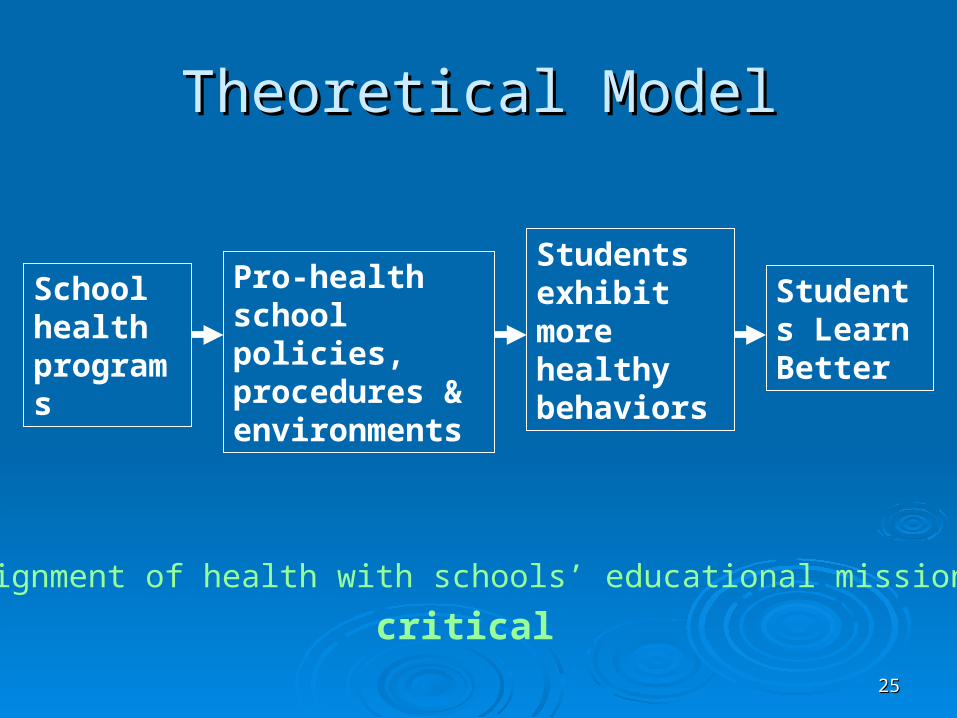
Theoretical ModelTheoretical Model
Students Learn Better
Students exhibit more healthy behaviors
Pro-health school policies, procedures & environments
School health programs

55
Theoretical ModelTheoretical Model
Students exhibit more healthy behaviors
Pro-health school policies, procedures & environments
School health programs
Students Learn Better
What are importanthealth conditions?
Who is at risk?

66
Washington State’s Washington State’s Healthy Youth SurveyHealthy Youth Survey

77
Healthy Youth Survey Healthy Youth Survey (HYS)(HYS)
Paper-based questionnaire given to 6Paper-based questionnaire given to 6 thth, 8, 8thth, 10, 10thth & 12& 12thth graders in fall of even years graders in fall of even years
Asks questions about Asks questions about Risk & protective factorsRisk & protective factors Alcohol, drug & tobacco useAlcohol, drug & tobacco use Health statusHealth status
Next survey is Fall 2008:Next survey is Fall 2008: Visit Visit www.hys.wa.gov for materials, recruitment for materials, recruitment
information, reports, link to online data analysisinformation, reports, link to online data analysis Schools need to register by June 30 (it’s free)Schools need to register by June 30 (it’s free)

88
Health Indicators of InterestHealth Indicators of Interest
1.1. Smoking cigarettesSmoking cigarettes2.2. Using alcoholUsing alcohol3.3. Using marijuanaUsing marijuana4.4. Obesity Obesity 5.5. Severe asthmaSevere asthma6.6. Poor nutrition: not eating breakfastPoor nutrition: not eating breakfast7.7. Poor nutrition: not enough fruit & vegPoor nutrition: not enough fruit & veg8.8. Poor nutrition: 2+ soda pop per dayPoor nutrition: 2+ soda pop per day9.9. Sedentary lifestyle: Insufficient exerciseSedentary lifestyle: Insufficient exercise10.10. Sedentary lifestyle: 3+ hours TV per daySedentary lifestyle: 3+ hours TV per day11.11. Feeling unsafe at schoolFeeling unsafe at school12.12. Mental distress/depressionMental distress/depression13.13. Insufficient (<8 hours) sleep per nightInsufficient (<8 hours) sleep per night
99
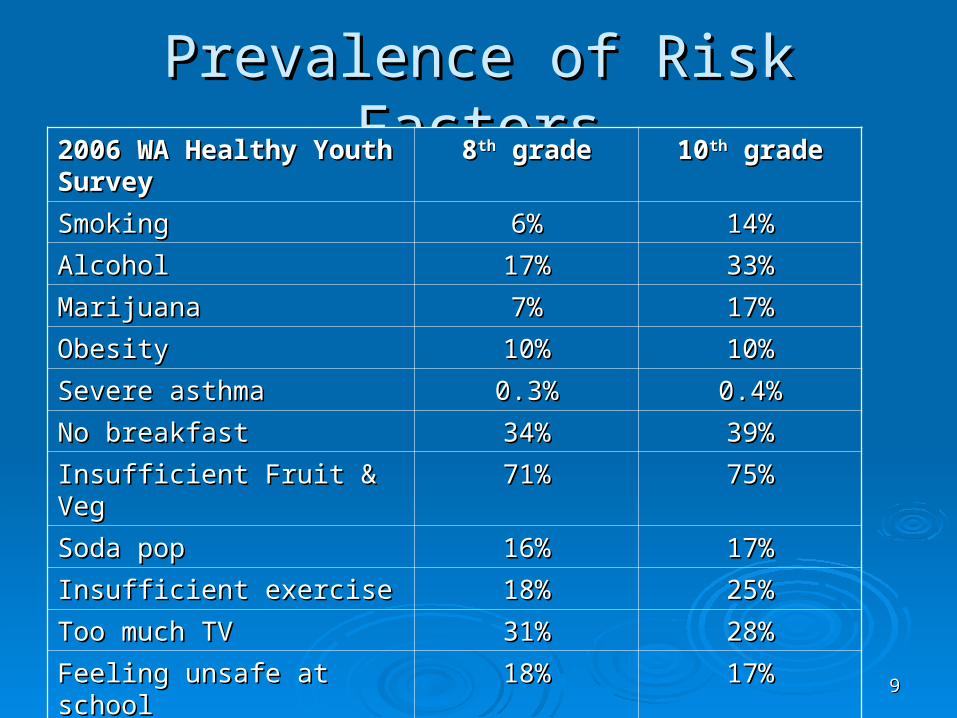
Prevalence of Risk FactorsPrevalence of Risk Factors2006 WA Healthy Youth Survey 2006 WA Healthy Youth Survey 88thth grade grade 1010thth grade grade
SmokingSmoking 6%6% 14%14%
AlcoholAlcohol 17%17% 33%33%
MarijuanaMarijuana 7%7% 17%17%
ObesityObesity 10%10% 10%10%
Severe asthmaSevere asthma 0.3%0.3% 0.4%0.4%
No breakfastNo breakfast 34%34% 39%39%
Insufficient Fruit & VegInsufficient Fruit & Veg 71%71% 75%75%
Soda popSoda pop 16%16% 17%17%
Insufficient exerciseInsufficient exercise 18%18% 25%25%
Too much TVToo much TV 31%31% 28%28%
Feeling unsafe at schoolFeeling unsafe at school 18%18% 17%17%
Mental distressMental distress 24%24% 28%28%
Insufficient sleepInsufficient sleep 43%43% 65%65%
1010
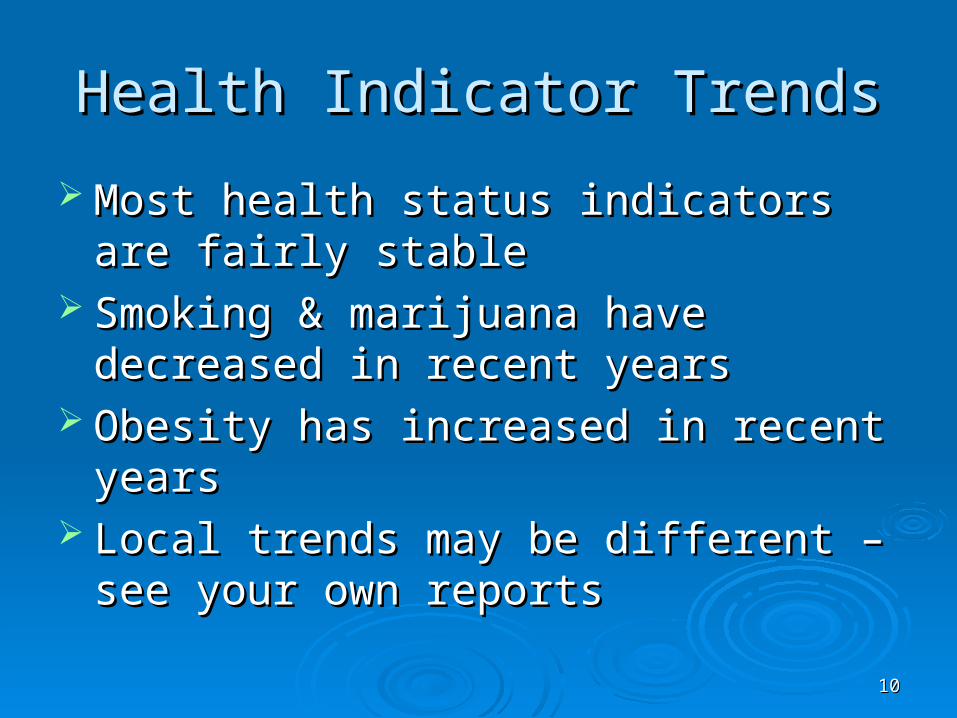
Health Indicator TrendsHealth Indicator Trends
Most health status indicators are fairly Most health status indicators are fairly stablestable
Smoking & marijuana have decreased in Smoking & marijuana have decreased in recent yearsrecent years
Obesity has increased in recent yearsObesity has increased in recent years Local trends may be different – see your Local trends may be different – see your
own reportsown reports

1111
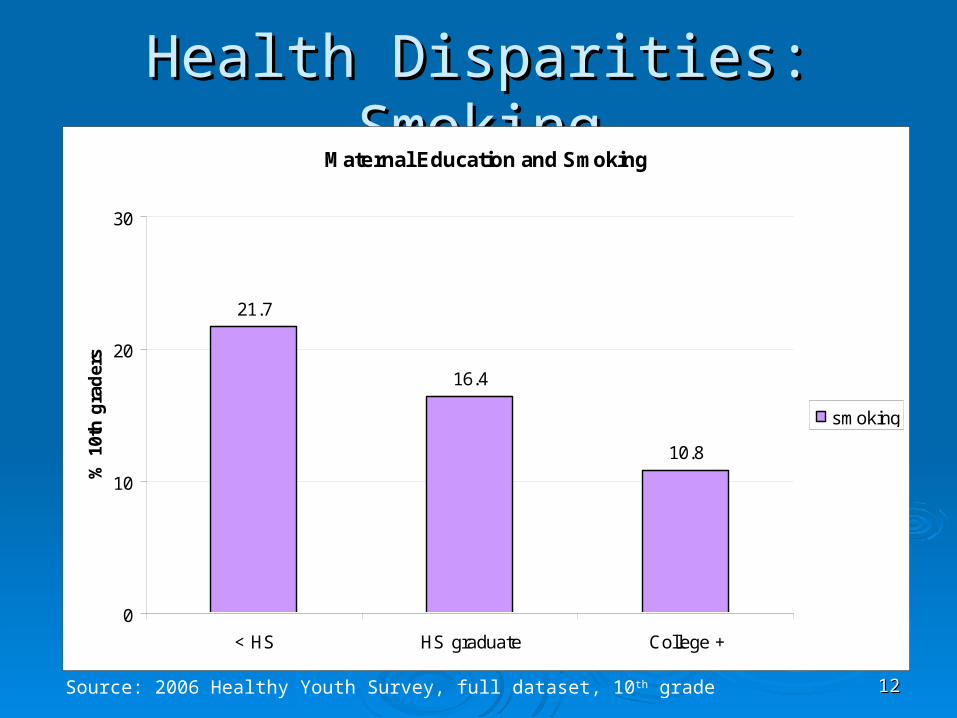
Health Disparities: SmokingHealth Disparities: Smoking
Cigarette Smoking by Race/Ethnicity
13.4%
6.6%
19.5%
14.4%11.6%
13.0%
0%
10%
20%
30%
White,non-
Hispanic
Asian NativeAmerican
Black/Af.Amer.
Hispanic/Latino
Nativ.Haw /Pac Isl.S
mo
ked
Cig
aret
tes
in P
ast
Mo
nth
*
**
Source: 2006 Healthy Youth Survey, state sample only grades 8-10-12 combined.
1212
Health Disparities: SmokingHealth Disparities: SmokingMaternal Education and Smoking
21.7
16.4
10.8
0
10
20
30
< HS HS graduate College +
% 1
0th
gra
der
s
smoking
Source: 2006 Healthy Youth Survey, full dataset, 10th grade

1313
Health Disparities: Feeling UnsafeHealth Disparities: Feeling Unsafe
Feel Unsafe at School by Race/Ethnicity
17.1%19.1%
25.0%
29.5%26.6%
23.6%
0%
10%
20%
30%
White, non-Hispanic
Asian NativeAmerican
Black/Af.Amer.
Hispanic/Latino
Nativ.Haw /Pac Isl.
Fee
l U
nsa
fe a
t S
cho
ol
* * **
Source: 2006 Healthy Youth Survey, state sample only grades 8-10-12 combined.

1414
Health Disparities: Feeling UnsafeHealth Disparities: Feeling Unsafe
Source: 2006 Healthy Youth Survey, full dataset, 10th grade
Maternal Education and Feeling Unsafe at School
81.7 8076.1
0
20
40
60
80
100
< HS HS graduate College +
% 1
0th
gra
der
s

1515
Health Disparities: Overweight Health Disparities: Overweight Overweight by Race/Ethnicity
9.4%6.9%
15.9%14.3% 13.8%
16.9%
0%
10%
20%
30%
White, non-Hispanic
Asian NativeAmerican
Black/Af.Amer.
Hispanic/Latino
Nativ.Haw /Pac Isl.
Ove
rwei
gh
t b
y B
MI
**
**
*
Source: 2006 Healthy Youth Survey, state sample only grades 8-10-12 combined.

1616
Health Disparities: OverweightHealth Disparities: Overweight
Source: 2006 Healthy Youth Survey, full dataset, 10th grade
Maternal Education and Overweight
13.9
11.2
8.7
0
10
20
30
< HS HS graduate College +
% 1
0th
gra
der
s

1717
Summary: how are different Summary: how are different students at-risk?students at-risk?
Race/ethnicityRace/ethnicity Asian students and white non-Hispanic Asian students and white non-Hispanic
students tend to have lowest risk for a variety students tend to have lowest risk for a variety of factorsof factors
Native American, Black, Latino and Pacific Native American, Black, Latino and Pacific Islander/Hawaiian students tend to have Islander/Hawaiian students tend to have higher riskhigher risk
Socio-Economic StatusSocio-Economic Status Students in lower income families tend to Students in lower income families tend to
have greater health riskshave greater health risks

1818
Theoretical ModelTheoretical Model
Pro-health school policies, procedures & environments
School health programs
Students Learn Better
Students exhibit more healthy behaviors
What is the status of school healthpolicies in Washington?

1919
Washington StateWashington StateSchool Health Profile SurveySchool Health Profile Survey

2020
School Health Profiles SurveySchool Health Profiles Survey
Paper-based questionnaire given to Paper-based questionnaire given to principals & lead health teachers in principals & lead health teachers in secondary schoolssecondary schools
Given in spring of even-numbered years Given in spring of even-numbered years (in the field now!)(in the field now!)
Asks about health-related policies and Asks about health-related policies and environmentsenvironments
Reports & more information: Reports & more information: http://www.k12.wa.us/CoordinatedSchoolHealth/SchlHealthProfiles.aspx

2121
School Health Policy IndicatorsSchool Health Policy Indicators
School Health CapacitySchool Health Capacity 52% have an advisory group52% have an advisory group 65% have any health-related SIP 65% have any health-related SIP
goals/objectives (31% nutrition, 36% physical goals/objectives (31% nutrition, 36% physical activity, 23% tobacco, 26% illness)activity, 23% tobacco, 26% illness)
59% have any staff wellness programs59% have any staff wellness programs
2222
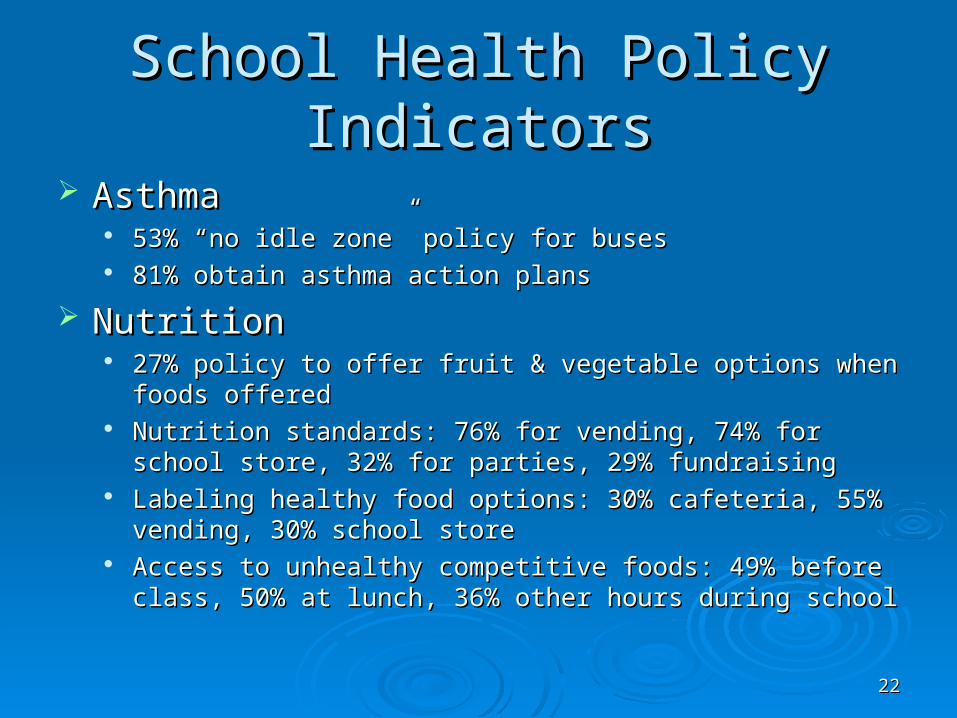
School Health Policy IndicatorsSchool Health Policy Indicators
AsthmaAsthma 53% “no idle zone” policy for buses53% “no idle zone” policy for buses 81% obtain asthma action plans 81% obtain asthma action plans
NutritionNutrition 27% policy to offer fruit & vegetable options when foods offered27% policy to offer fruit & vegetable options when foods offered Nutrition standards: 76% for vending, 74% for school store, 32% Nutrition standards: 76% for vending, 74% for school store, 32%
for parties, 29% fundraisingfor parties, 29% fundraising Labeling healthy food options: 30% cafeteria, 55% vending, 30% Labeling healthy food options: 30% cafeteria, 55% vending, 30%
school storeschool store Access to unhealthy competitive foods: 49% before class, 50% Access to unhealthy competitive foods: 49% before class, 50%
at lunch, 36% other hours during schoolat lunch, 36% other hours during school

2323
School Health Policy IndicatorsSchool Health Policy Indicators
Physical ActivityPhysical Activity 32% required 4+ PE classes32% required 4+ PE classes 34% had staff who received training in fitness 34% had staff who received training in fitness
instructioninstruction 50% promoted walking & biking to school50% promoted walking & biking to school 38% have “safe route to school” partnerships38% have “safe route to school” partnerships
TobaccoTobacco 89% posted “no-tobacco” signs89% posted “no-tobacco” signs 87% enforced a “no-tobacco” zone near school 87% enforced a “no-tobacco” zone near school
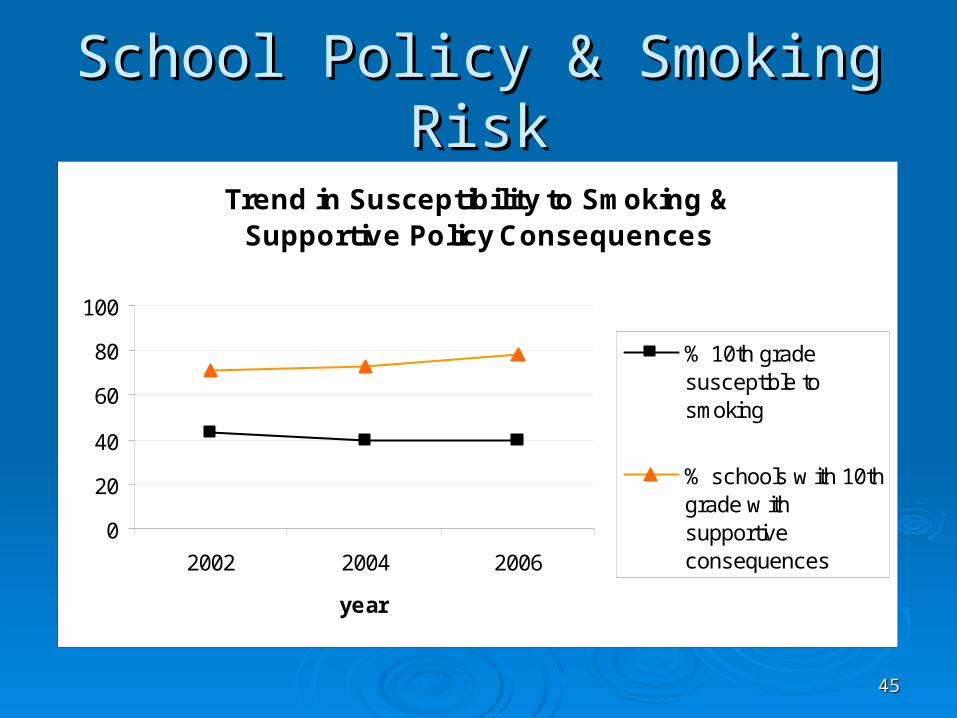
propertyproperty 64% had supportive consequences64% had supportive consequences

2424
Associations: School Associations: School Characteristics and Strong PoliciesCharacteristics and Strong Policies
Schools with advisory groups tend to have Schools with advisory groups tend to have stronger health policiesstronger health policies
Larger schools tend to have stronger health Larger schools tend to have stronger health policiespolicies
We are exploring whether having health-related We are exploring whether having health-related SIP goals/objectives improves health policiesSIP goals/objectives improves health policies
Staff wellness programs appear correlated with Staff wellness programs appear correlated with some improved policies and student behaviorssome improved policies and student behaviors
2525
Theoretical ModelTheoretical Model
Pro-health school policies, procedures & environments
School health programs
Students Learn Better
Students exhibit more healthy behaviors
Alignment of health with schools’ educational mission is
critical

2626
Student Health & Academic AchievementStudent Health & Academic Achievement

2727
Summarizing the ResearchSummarizing the Research Building evidence base for associationsBuilding evidence base for associations
CDC DASH website: CDC DASH website: http://www.cdc.gov/HealthyYouth/health_and_academics/index.htm
California Study (Update 5) California Study (Update 5) http://www.gettingresults.org/ Active Living Research summary: Active Living Research summary:
http://www.activelivingresearch.org/alr/alr/files/Active_Ed.pdf UW SDRG study linked WASL scores with school-level HYS UW SDRG study linked WASL scores with school-level HYS
(Arthur & Brown, 2005)(Arthur & Brown, 2005) One study estimated that up to one-quarter of minority One study estimated that up to one-quarter of minority
achievement gap due to health disparities achievement gap due to health disparities (Currie, 2005)(Currie, 2005)
2828
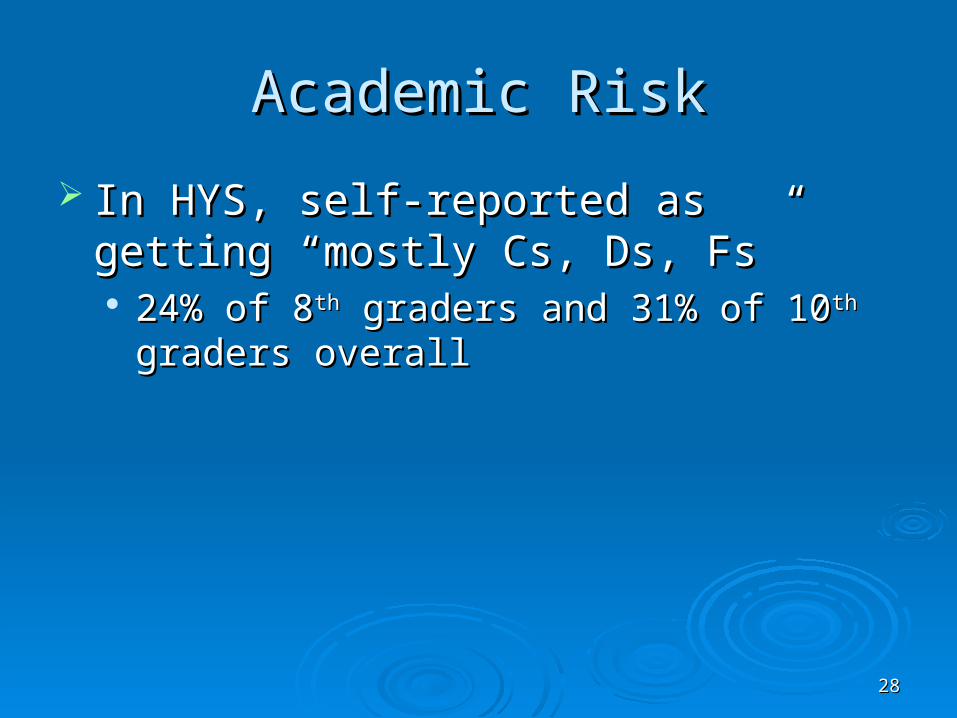
Academic RiskAcademic Risk
In HYS, self-reported as getting “mostly In HYS, self-reported as getting “mostly Cs, Ds, Fs”Cs, Ds, Fs” 24% of 824% of 8thth graders and 31% of 10 graders and 31% of 10thth graders graders
overalloverall
2929
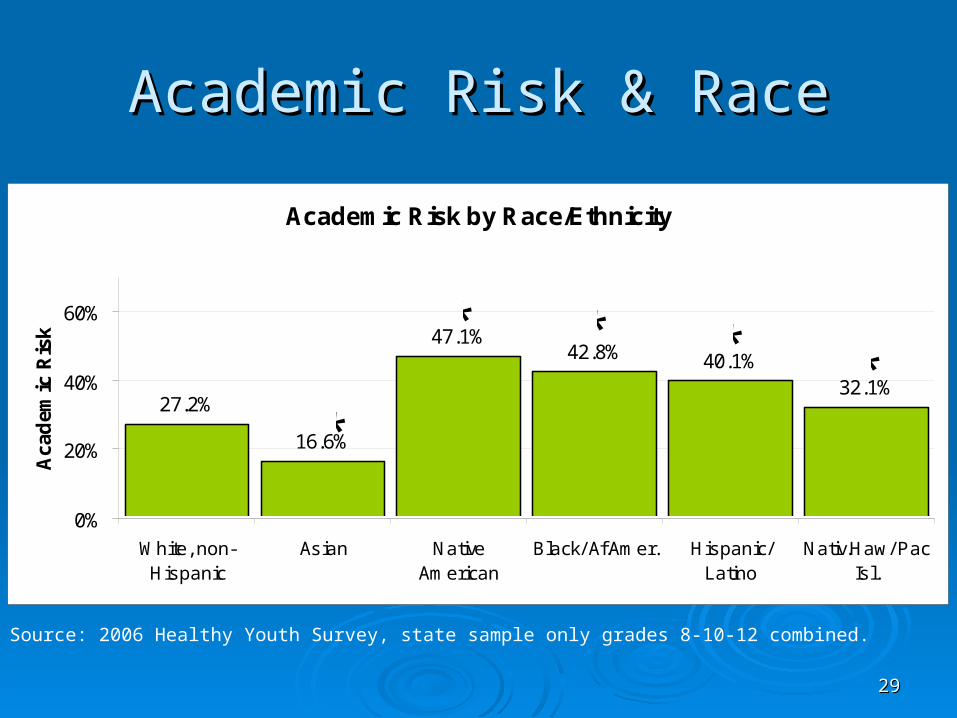
Academic Risk & RaceAcademic Risk & Race
Source: 2006 Healthy Youth Survey, state sample only grades 8-10-12 combined.
Academic Risk by Race/Ethnicity
27.2%
16.6%
47.1%42.8% 40.1%
32.1%
0%
20%
40%
60%
White, non-Hispanic
Asian NativeAmerican
Black/ Af.Amer. Hispanic/Latino
Nativ.Haw/ PacIsl.
Aca
dem
ic R
isk *
**
* * *

3030
Disparities in Achievement: Disparities in Achievement: Math WASLMath WASL
Percent of Students in Grade 10 Meeting Standard in 1999 and 2006 by Ethnicity
14.3
37.3
9.5 11.6
38.131.0
59.9
23.3 25.5
56.7
0.0
10.0
20.0
30.0
40.0
50.0
60.0
70.0
80.0
90.0
100.0
American Indian Asian/PacificIslander
Black Hispanic White
1999
2006
NOTE: on this graph “higher” is better

3131
Academic Risk & Socio-economic Academic Risk & Socio-economic StatusStatus
Academic Risk by Maternal Education
40.3%
30.1%
19.5%
0%
10%
20%
30%
40%
50%
no HS HS/GED Some college or more
Aca
dem
ic R
isk
Source: 2006 Healthy Youth Survey, state sample only grades 8-10-12 combined.

3232
Academic Risk by Specific Health Academic Risk by Specific Health Indicators: 8Indicators: 8thth graders graders
0
20
40
60
80
CigaretteSmoking
Alcohol Use MarijuanaUse
Obesity SevereAsthma
Not EatingBreakfast
InsufficientFruit & Veg
% A
cad
emic
Ris
k
Without risk factor With risk factor
Source: 2006 Healthy Youth Survey
3333
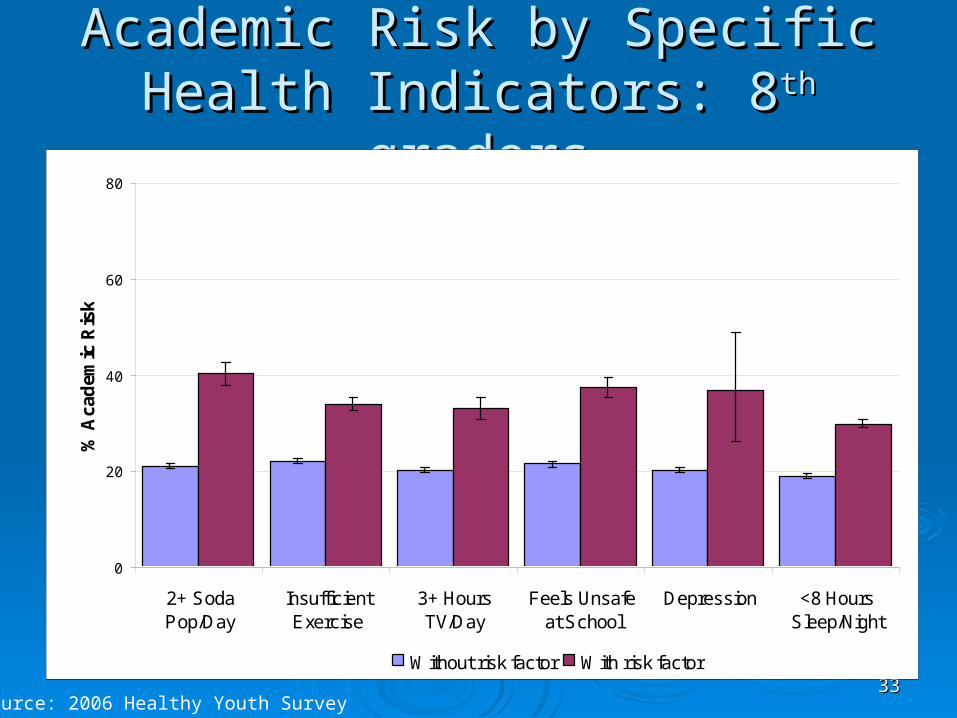
Academic Risk by Specific Health Academic Risk by Specific Health Indicators: 8Indicators: 8thth graders graders
0
20
40
60
80
2+ SodaPop/Day
InsufficientExercise
3+ HoursTV/Day
Feels Unsafeat School
Depression <8 HoursSleep/Night
% A
cad
emic
Ris
k
Without risk factor With risk factor
Source: 2006 Healthy Youth Survey

3434
Which comes first?Which comes first?
3535
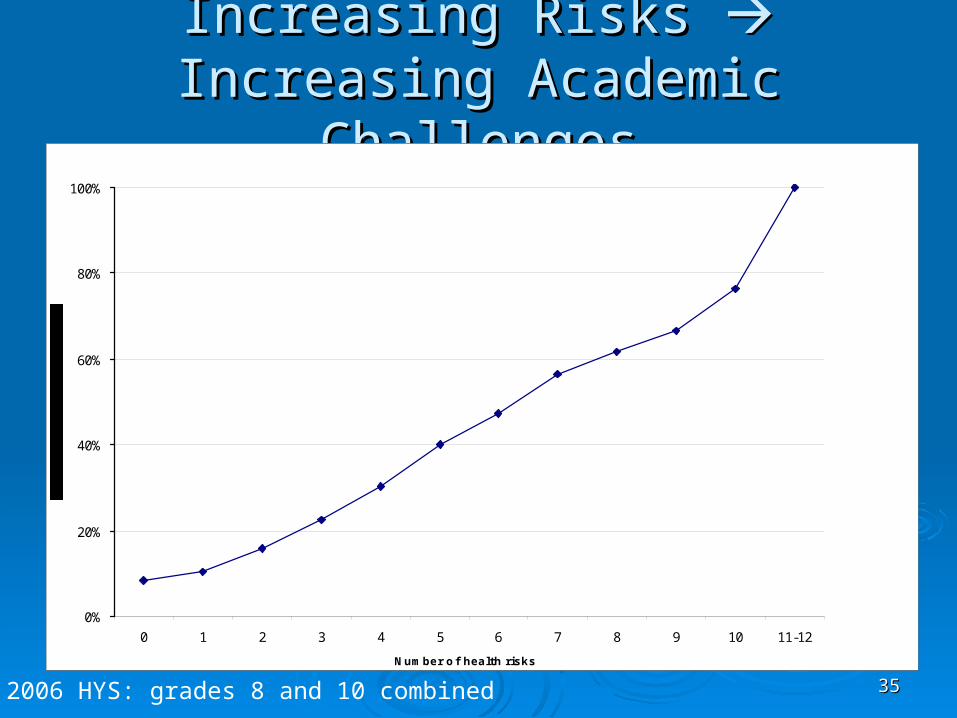
Increasing Risks Increasing Risks Increasing Increasing Academic ChallengesAcademic Challenges
0%
20%
40%
60%
80%
100%
0 1 2 3 4 5 6 7 8 9 10 11-12
Number of health risks
2006 HYS: grades 8 and 10 combined
3636
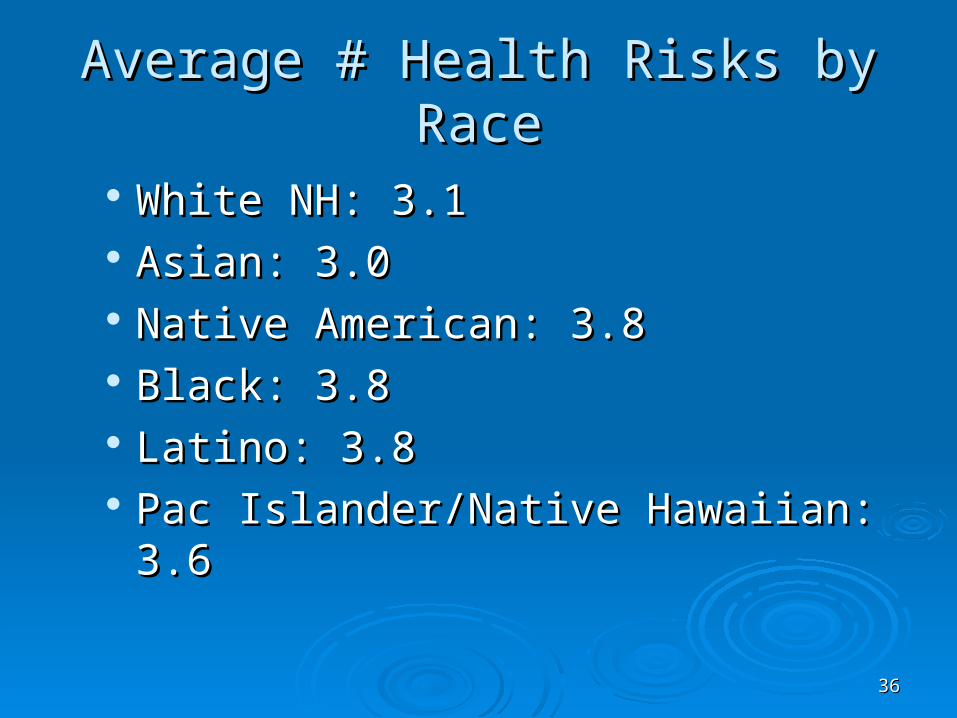
Average # Health Risks by RaceAverage # Health Risks by Race
White NH: 3.1White NH: 3.1 Asian: 3.0Asian: 3.0 Native American: 3.8Native American: 3.8 Black: 3.8Black: 3.8 Latino: 3.8Latino: 3.8 Pac Islander/Native Hawaiian: 3.6Pac Islander/Native Hawaiian: 3.6
3737
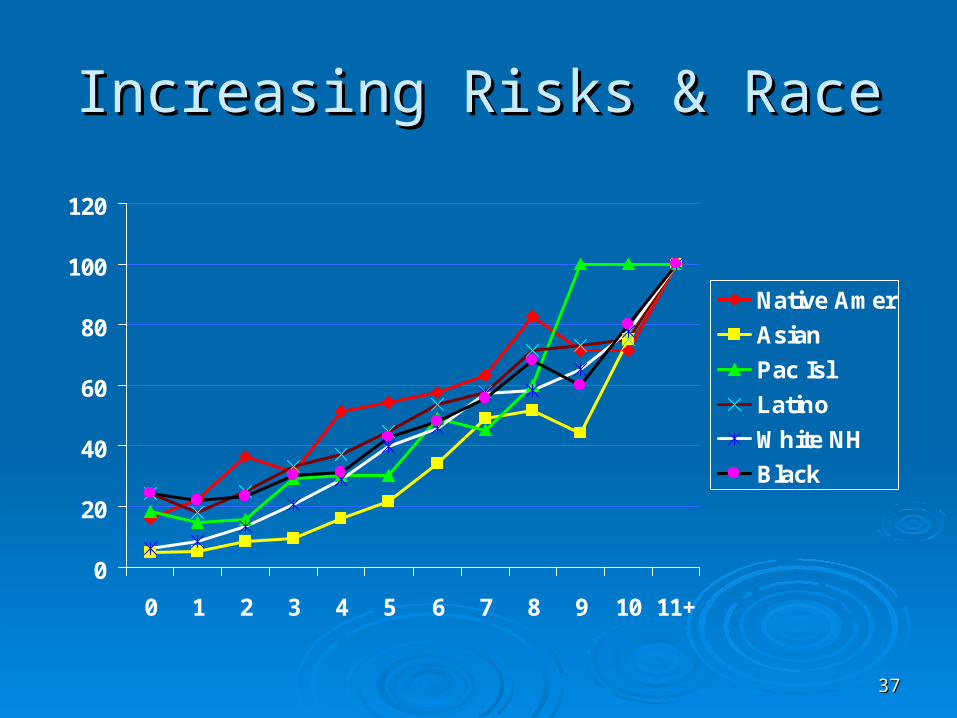
Increasing Risks & RaceIncreasing Risks & Race
0
20
40
60
80
100
120
0 1 2 3 4 5 6 7 8 9 10 11+
Native Amer
Asian
Pac Isl
Latino
White NH
Black

3838
Multivariate Statistical ModelsMultivariate Statistical Models We used a multivariate logistic regression model to We used a multivariate logistic regression model to
simultaneously take all factors into account.simultaneously take all factors into account.
For those factors that are no longer significant, we can For those factors that are no longer significant, we can say that associations we originally observed can actually say that associations we originally observed can actually be attributed to other factors (those that remained be attributed to other factors (those that remained significant). significant).
For example, soda pop remains statistically significant in For example, soda pop remains statistically significant in our full model – this means that for youth with all the our full model – this means that for youth with all the same other factors (nutrition, overweight, exercise, same other factors (nutrition, overweight, exercise, safety, maternal education/SES, etc.) that drinking safety, maternal education/SES, etc.) that drinking increasing numbers of soda pop per day is still is increasing numbers of soda pop per day is still is associated with increased academic risk.associated with increased academic risk.

3939
Which are most important?Which are most important?
Strongest associationsStrongest associations Smoking, severe asthma, marijuana, no Smoking, severe asthma, marijuana, no
breakfast, depressionbreakfast, depression Moderate associationsModerate associations
Obesity, soda pop, insufficient exercise, TV, Obesity, soda pop, insufficient exercise, TV, alcohol, feeling unsafe at school alcohol, feeling unsafe at school
Weakest associations Weakest associations Sufficient fruit & veg, not enough sleepSufficient fruit & veg, not enough sleep

4040
Which health risks can we change with Which health risks can we change with school-based interventions, and how?school-based interventions, and how?
Would be good to have interventions with Would be good to have interventions with broad influence, that reach race/ethnic broad influence, that reach race/ethnic minority and low SES students equitablyminority and low SES students equitably
Would be good to have interventions that Would be good to have interventions that can include families, but do not rely on can include families, but do not rely on them or place any burden on them – them or place any burden on them – things that can become “how the school things that can become “how the school works” or “what is normal”works” or “what is normal”
Policy, Procedure, SystemsPolicy, Procedure, Systems

4141
Theoretical ModelTheoretical Model
School health programs
Students exhibit more healthy behaviors
Pro-health school policies, procedures & environments
Students Learn Better
This is currently the weakest link

4242
What about Individual What about Individual Interventions?Interventions?
Individual interventions can change student Individual interventions can change student healthhealth
ProsPros Can be tailored to meet individual needsCan be tailored to meet individual needs
ConsCons Expensive/resource intensive to implement, Expensive/resource intensive to implement,
difficult to sustaindifficult to sustain May not always reach students in greatest needMay not always reach students in greatest need Changing students one-by-one takes a long timeChanging students one-by-one takes a long time
4343
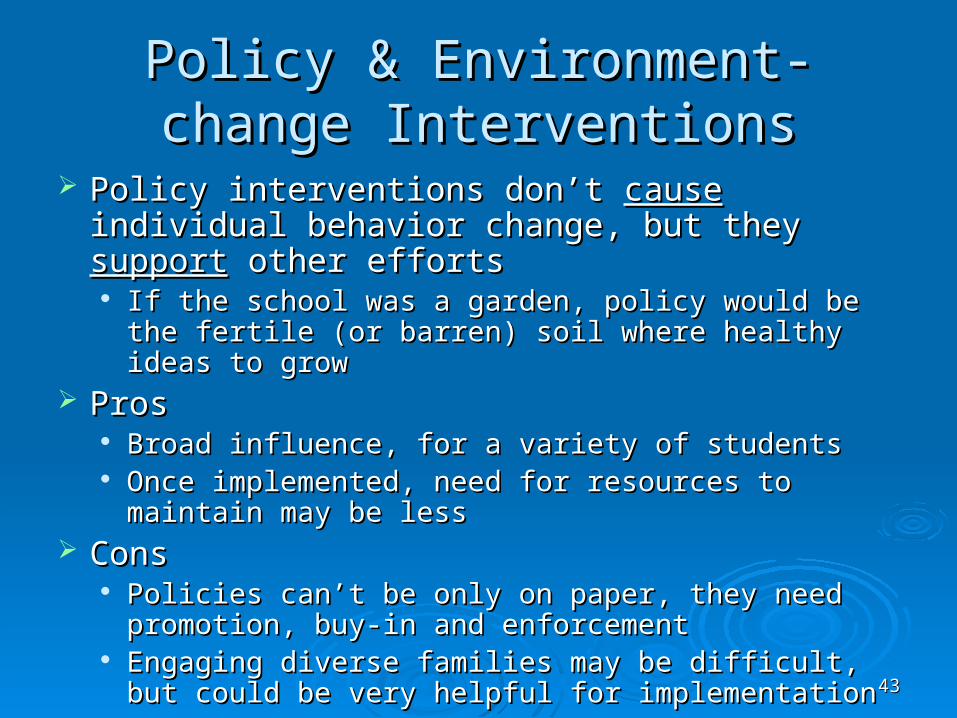
Policy & Environment-change Policy & Environment-change InterventionsInterventions
Policy interventions don’t Policy interventions don’t causecause individual individual behavior change, but they behavior change, but they supportsupport other efforts other efforts If the school was a garden, policy would be the fertile If the school was a garden, policy would be the fertile
(or barren) soil where healthy ideas to grow(or barren) soil where healthy ideas to grow ProsPros
Broad influence, for a variety of students Broad influence, for a variety of students Once implemented, need for resources to maintain Once implemented, need for resources to maintain
may be lessmay be less ConsCons
Policies can’t be only on paper, they need promotion, Policies can’t be only on paper, they need promotion, buy-in and enforcementbuy-in and enforcement
Engaging diverse families may be difficult, but could Engaging diverse families may be difficult, but could be very helpful for implementationbe very helpful for implementation
4444
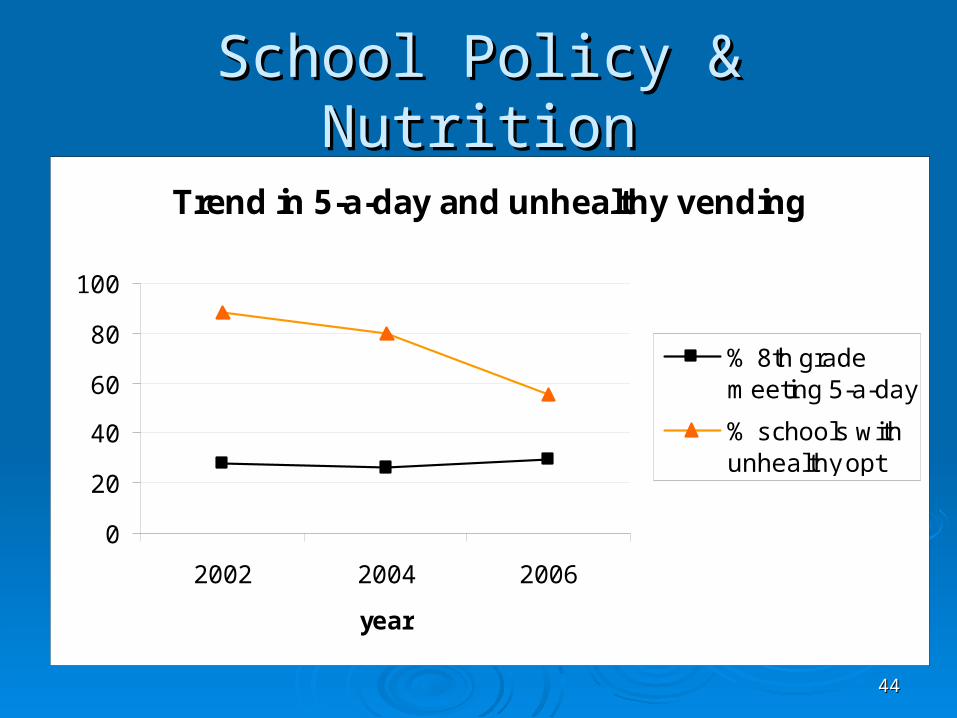
School Policy & NutritionSchool Policy & Nutrition
Trend in 5-a-day and unhealthy vending
0
20
40
60
80
100
2002 2004 2006
year
% 8th grademeeting 5-a-day
% schools withunhealthy opt
4545
School Policy & Smoking RiskSchool Policy & Smoking Risk
Trend in Susceptibility to Smoking & Supportive Policy Consequences
0
20
40
60
80
100
2002 2004 2006
year
% 10th gradesusceptible tosmoking
% schools w ith 10thgrade w ithsupportiveconsequences

4646
School Policy & Physical ActivitySchool Policy & Physical Activity
Trend in exercise and requiring PE
0
10
20
30
40
50
60
70
80
2002 2004 2006
year
% 10th grade gettingsuff icient exercise
% schools w ith 10thgrade requiring 4+ PEclasses

4747
Exploratory statistical modelsExploratory statistical models We linked school policy data and student We linked school policy data and student
behavior data to describe changes in student behavior data to describe changes in student behavior associated with changes in school behavior associated with changes in school policypolicy Reducing access to competitive foods was linked with Reducing access to competitive foods was linked with
decreases in student consumption of high-fat snacks decreases in student consumption of high-fat snacks and pop from school sourcesand pop from school sources
Implementing more PE requirements increased Implementing more PE requirements increased student physical activity (this might be especially student physical activity (this might be especially important for overweight students)important for overweight students)
Lower SES schools had better PE participation, Lower SES schools had better PE participation, maybe due to fewer college-bound students seeking maybe due to fewer college-bound students seeking PE exemptions?PE exemptions?
4848
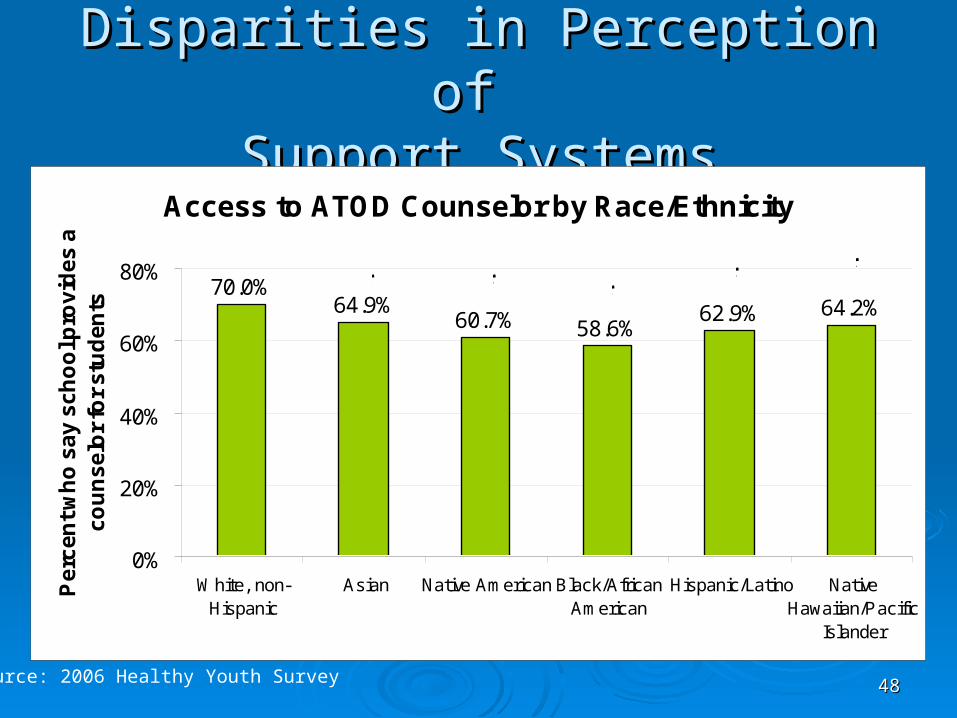
Disparities in Perception of Disparities in Perception of Support SystemsSupport Systems
Access to ATOD Counselor by Race/Ethnicity
64.9%60.7% 58.6%
62.9% 64.2%70.0%
0%
20%
40%
60%
80%
White, non-Hispanic
Asian Native American Black/AfricanAmerican
Hispanic/Latino NativeHawaiian/Pacific
Islander
Pe
rce
nt
wh
o s
ay
sc
ho
ol p
rov
ide
s a
c
ou
ns
elo
r fo
r s
tud
en
ts
* * * * *
Source: 2006 Healthy Youth Survey

4949
Disparities in Perceived Disparities in Perceived EnforcementEnforcement
Policy Enforcement by Race/Ethnicity
21.9% 18.7%22.4%
18.0%22.7%
18.9%
0%
20%
40%
60%
White, non-Hispanic
Asian Native American Black/ Af.Amer. Hispanic/ Latino Nativ.Haw / PacIsl.
No
To
bac
co R
ule
s A
lway
s E
nfo
rced
**
* *
Source: 2006 Healthy Youth Survey, 10th grade

5050
Possible InterpretationPossible Interpretation
The more individualized an intervention, The more individualized an intervention, the more critical cultural competence the more critical cultural competence becomesbecomes

5151
Theoretical ModelTheoretical Model
School health programs
Students Learn Better
Students exhibit more healthy behaviors
Pro-health school policies, procedures & environments
You are here

5252
So now what???So now what???
5353
Summarizing what we knowSummarizing what we know
There is a strong association between health There is a strong association between health risks and academic risks, probably healthy risks and academic risks, probably healthy students learn better students learn better it certainly couldn’t hurt to help students be healthier!it certainly couldn’t hurt to help students be healthier!
Health disparities may play an important role in Health disparities may play an important role in minority & socio-economic achievement gapsminority & socio-economic achievement gaps
School policy interventions can have a modest School policy interventions can have a modest but broad-based, sustainable influence on but broad-based, sustainable influence on student health behaviorsstudent health behaviors
5454
Which Health Factors to Prioritize?Which Health Factors to Prioritize?
ConsiderConsider Prevalence of the health risk factor, number of Prevalence of the health risk factor, number of
students to influencestudents to influence Strength of association, logical direction of Strength of association, logical direction of
associationassociation Evidence for school-based interventionsEvidence for school-based interventions Resources for interventionsResources for interventions Potential reach and sustainability of outcomesPotential reach and sustainability of outcomes Political/community buy-in and opportunitiesPolitical/community buy-in and opportunities Building comprehensive capacity to address Building comprehensive capacity to address
health in schoolshealth in schools

5555
Thank you!Thank you!
Keep watching the research… Keep watching the research…
Julia DilleyJulia [email protected](360) 705-1358(360) 705-1358