Embed Size (px)
Citation preview
本研究报告仅通过邮件提供给 民生加银 使用。1
kuxsmi:30448kuxe
Software & Services | Company Bringing China to the World
SWS Research Co. Ltd is a subsidiary of Shenwan Hongyuan Securities. 99 East Nanjing Road, Shanghai | +86 21 2329 7818 www.swsresearch.com
July 29,2015
Outperform Unchanged
二季度前瞻
腾讯控股 (700 HK )
Market Data: Jul,27
Closing Price (HK$) 146.5
Price Target (HK$) 170
HSCEI 11,173
HSCCI 4,366
52-week High/Low (HK$) 171.00/104.50
Market Cap (USD Mn) 183,332
Market Cap (HK$ Mn) 1,373,800
Shares Outstanding (Mn) 9,377
Exchange Rate (RMB-HK$) 1.27
Price Performance Chart:
Source: Bloomberg
Analyst Ashley Sheng A0230512080002 BBS394 [email protected]
Contact Ashley Sheng (8621)23297818×7389
Related Reports " Tencent (700 HK) - Advertising growth" May 14,2015
Financial summary and valuation 2013 2014 2015E 2016E 2017E
Revenue (RMB million) 60,437.11 78,932.00 96,191.17 117,277.65 138,031.78 YOY (%) 37.69 30.60 21.87 21.92 17.70 Net income (RMB million) 15,502.33 23,810.00 29,660.10 37,552.90 44,871.49 YOY (%) 21.72 53.49 24.37 26.57 19.46 EPS (RMB) 1.69 2.58 3.22 4.07 4.87 Diluted EPS (RMB) 8.30 2.55 3.18 4.02 4.80 ROE (%) 26.62 29.09 26.96 25.81 23.94 Debt/asset (%) 45.48 52.02 45.96 42.36 38.44 Dividend Yield (%) 0.12 0.22 0.28 0.35 0.42 P/E (x) 68.68 45.08 36.13 28.55 23.90 P/B (x) 25.26 18.36 13.07 9.74 7.37 EV/EBITDA (x) 45.07 28.65 23.05 17.29 13.59 Note: Diluted EPS is calculated as if all outstanding convertible securities, such as convertible preferred shares, convertible
debentures, stock options and warrants, were exercised. P/E is calculated as closing price divided by each year’s EPS..
投资要点:
二季度前瞻。腾讯将于 8月 12日收盘后公布 2015 年二季度业绩。我们预计收入人民币 239亿 (+21% YoY, +7% QoQ),vs. 彭博预期 240亿;预计净利润 71亿 (+22% YoY, +3% QoQ), vs.彭博预期 72亿;预计 non-GAAP利润 77亿(+31% YoY, +9% QoQ),vs.彭博预期 75 亿。预计广告业务表现将是业绩增长的核心驱动力。
游戏表现预计较淡。我们预计 PC 游戏收入环比平、智能手机游戏收入环比增9%。手游表现受到来自传统 PC 自研巨头的竞争影响,网易的梦幻西游二季度霸占了中国 iOS畅销榜首位。
广告业务将是长期增长动力。我们预计二季度广告业务将有 71%的同比增长,达 35亿元,主要受益于视频广告、QQ空间信息流广告以及微信朋友圈广告。
未来关注点:微信朋友圈广告进展、手游前景展望以及 O2O战略。
维持增持评级。维持 2015/16/17 年盈利预测为人民币 305/383/458 亿,以及目标价 170港币。目标价对应 16%空间,维持增持 评级。近期 A股流动性危机以及海外市场不确定因素影响带来的系统性风险拖累公司股价由前期高位下跌14%。公司基本面良好,仍不失为长期投资标的。
催化剂:微信朋友圈广告进展好于预期、业绩超预期
风险:市场系统性风险、业绩低于预期、游戏增速放缓加速
The company does not hold any equities or
derivatives of the listed company
mentioned in this report (“target”), but then
we shall provide financial advisory services
subject to the relevant laws and
regulations. Any affiliates of the company
may hold equities of the target, which may
exceed 1 percent of issued shares subject
to the relevant laws and regulations. The
company may also provide investment
banking services to the target. The
Company fulfills its duty of disclosure within
its sphere of knowledge. The clients may
contact [email protected] for
relevant disclosure materials or log into
www.swsresearch.com under disclosure
column for further information. The clients
shall have a comprehensive understanding
of the disclosure and disclaimer upon the
last page.
本研究报告仅通过邮件提供给 民生加银 使用。2
kuxsmi:30448kuxe
October 12, 2010 Building Materials | Company Research
Please refer to the last page for important disclosures Page 1
January 12,2015 Food, Beverage & Tobacco | Company Research
July 29,2015 Software & Services | Company Research
Investment highlight
2Q15 preview. We expect Tencent, due to release 2Q15 results on 12 August, to report revenue for the quarter of Rmb23.9bn (+21% YoY, +7% QoQ), vs a consensus forecast of Rmb24.0bn. We forecast 2Q15 net profit of Rmb7.1bn (+22% YoY, +3% QoQ), vs consensus of Rmb7.2bn, and a non-GAAP net profit of Rmb7.7bn (+31% YoY, +9% QoQ), vs consensus of Rmb.7.5bn. Expectations of steady growth stem from a solid online advertising segment performance in the quarter.
Gaming weakness. We forecast relatively flat QoQ growth in its PC game revenue, but 9% QoQ growth from smartphone games. The company’s mobile games continue to experience competition from traditional PC game developers, such as NetEase (NTES:US) and its Fantasy Westward Journey title, which remains the most downloaded game for iOS in China.
Online advertising to become long-term driver. We forecast 71% YoY growth for online advertising segment to reach Rmb3.5bn in 2Q15, mostly driven by online video advertising and advertising through Tencent’s Qzone and WeChat news feeds.
Key trends to watch. We remain positive on the company’s prospects for developing advertising through its WeChat Moments service, and see further positives in its mobile gaming segment.
Maintain Outperform. We maintain earnings forecast at Rmb30.5bn for the full-year 15E (+27.5% YoY), Rmb38.3bn in 16E and Rmb45.8bn in 17E (+19.8% YoY). Impelled by the sharp sell-off in A-share markets over the quarter, Tencent’s share price dropped by 14.0% from a peak in mid-April. However, we still see Tencent as offering long-term investment value. We maintain our target price at HK$170. With 16% upside, we maintain Outperform rating
Catalysts: Solid mobile monetization progress on Wexin from mobile advertising; better-than-expected results
Risks: systematic risks; weaker-than-expected results; slower-than-expected game revenue growth
本研究报告仅通过邮件提供给 民生加银 使用。3
kuxsmi:30448kuxe
October 12, 2010 Building Materials | Company Research
Please refer to the last page for important disclosures Page 2
January 12,2015 Food, Beverage & Tobacco | Company Research
July 29,2015 Software & Services | Company Research
Appendix
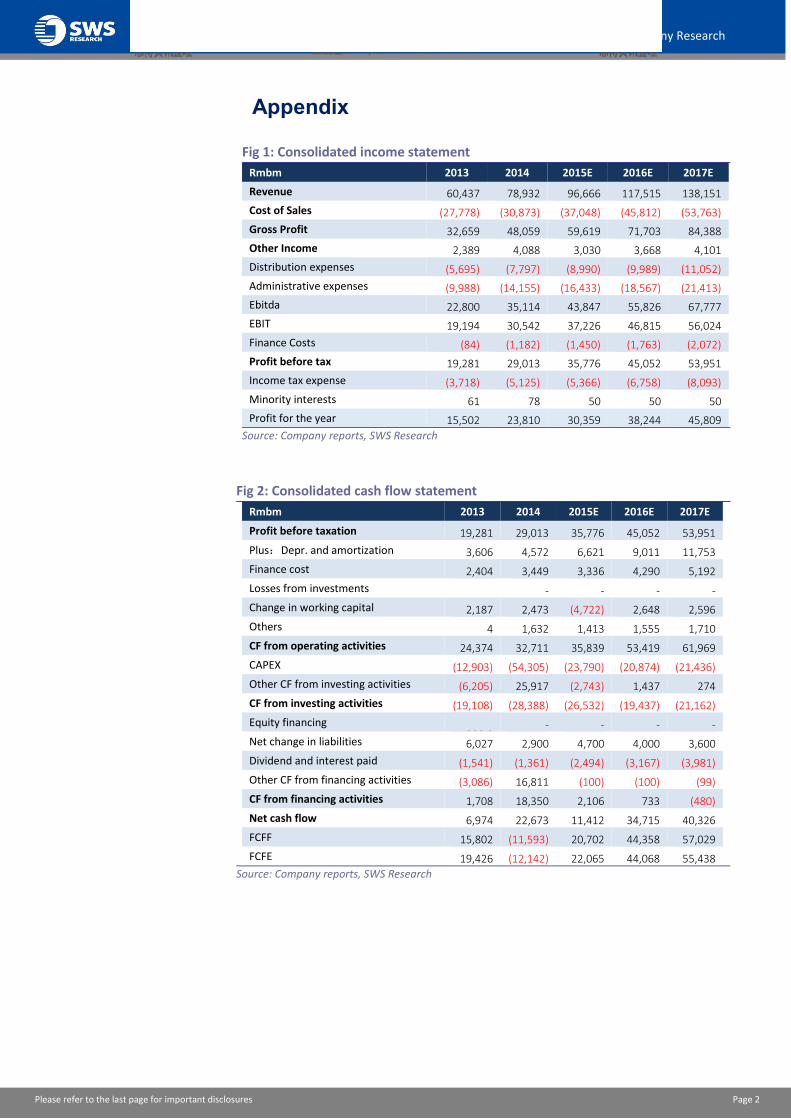
Fig 1: Consolidated income statement
Rmbm 2013 2014 2015E 2016E 2017E
Revenue 60,437 78,932 96,666 117,515 138,151
Cost of Sales (27,778) (30,873) (37,048) (45,812) (53,763)
Gross Profit 32,659 48,059 59,619 71,703 84,388
Other Income 2,389 4,088 3,030 3,668 4,101
Distribution expenses (5,695) (7,797) (8,990) (9,989) (11,052)
Administrative expenses (9,988) (14,155) (16,433) (18,567) (21,413)
Ebitda 22,800 35,114 43,847 55,826 67,777
EBIT 19,194 30,542 37,226 46,815 56,024
Finance Costs (84) (1,182) (1,450) (1,763) (2,072)
Profit before tax 19,281 29,013 35,776 45,052 53,951
Income tax expense (3,718) (5,125) (5,366) (6,758) (8,093)
Minority interests 61 78 50 50 50
Profit for the year 15,502 23,810 30,359 38,244 45,809
Source: Company reports, SWS Research
Fig 2: Consolidated cash flow statement
Rmbm 2013 2014 2015E 2016E 2017E
Profit before taxation 19,281 29,013 35,776 45,052 53,951
Plus:Depr. and amortization 3,606 4,572 6,621 9,011 11,753
Finance cost 2,404 3,449 3,336 4,290 5,192
Losses from investments -
- - - -
Change in working capital 2,187 2,473 (4,722) 2,648 2,596
Others 4 1,632 1,413 1,555 1,710
CF from operating activities 24,374 32,711 35,839 53,419 61,969
CAPEX (12,903) (54,305) (23,790) (20,874) (21,436)
Other CF from investing activities (6,205) 25,917 (2,743) 1,437 274
CF from investing activities (19,108) (28,388) (26,532) (19,437) (21,162)
Equity financing 308.0
- - - -
Net change in liabilities 6,027 2,900 4,700 4,000 3,600
Dividend and interest paid (1,541) (1,361) (2,494) (3,167) (3,981)
Other CF from financing activities (3,086) 16,811 (100) (100) (99)
CF from financing activities 1,708 18,350 2,106 733 (480)
Net cash flow 6,974 22,673 11,412 34,715 40,326
FCFF 15,802 (11,593) 20,702 44,358 57,029
FCFE 19,426 (12,142) 22,065 44,068 55,438
Source: Company reports, SWS Research
本研究报告仅通过邮件提供给 民生加银 使用。4
kuxsmi:30448kuxe
October 12, 2010 Building Materials | Company Research
Please refer to the last page for important disclosures Page 3
January 12,2015 Food, Beverage & Tobacco | Company Research
July 29,2015 Software & Services | Company Research
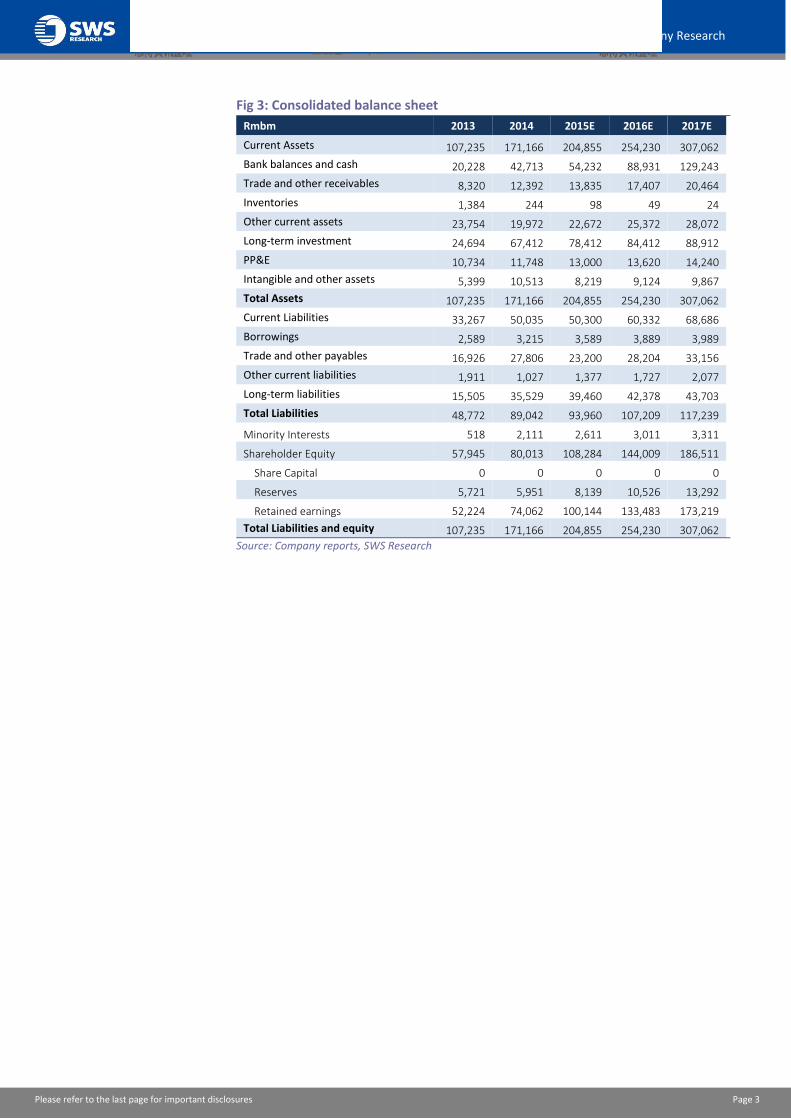
Fig 3: Consolidated balance sheet
Rmbm 2013 2014 2015E 2016E 2017E
Current Assets 107,235 171,166 204,855 254,230 307,062
Bank balances and cash 20,228 42,713 54,232 88,931 129,243
Trade and other receivables 8,320 12,392 13,835 17,407 20,464
Inventories 1,384 244 98 49 24
Other current assets 23,754 19,972 22,672 25,372 28,072
Long-term investment 24,694 67,412 78,412 84,412 88,912
PP&E 10,734 11,748 13,000 13,620 14,240
Intangible and other assets 5,399 10,513 8,219 9,124 9,867
Total Assets 107,235 171,166 204,855 254,230 307,062
Current Liabilities 33,267 50,035 50,300 60,332 68,686
Borrowings 2,589 3,215 3,589 3,889 3,989
Trade and other payables 16,926 27,806 23,200 28,204 33,156
Other current liabilities 1,911 1,027 1,377 1,727 2,077
Long-term liabilities 15,505 35,529 39,460 42,378 43,703
Total Liabilities 48,772 89,042 93,960 107,209 117,239
Minority Interests 518 2,111 2,611 3,011 3,311
Shareholder Equity 57,945 80,013 108,284 144,009 186,511
Share Capital 0 0 0 0 0
Reserves 5,721 5,951 8,139 10,526 13,292
Retained earnings 52,224 74,062 100,144 133,483 173,219
Total Liabilities and equity 107,235 171,166 204,855 254,230 307,062
Source: Company reports, SWS Research
本研究报告仅通过邮件提供给 民生加银 使用。5
kuxsmi:30448kuxe
October 12, 2010 Building Materials | Company Research
Please refer to the last page for important disclosures Page 4
January 12,2015 Food, Beverage & Tobacco | Company Research
July 29,2015 Software & Services | Company Research
Information Disclosure: The views expressed in this report accurately reflect the personal views of the analyst. The analyst declares that neither he/she nor his/her associate serves as an officer of nor has any financial interests in relation to the listed corporation reviewed by the analyst. None of the listed corporations reviewed or any third party has provided or agreed to provide any compensation or other benefits in connection with this report to any of the analyst, the Company or the group company(ies). A group company(ies) of the Company confirm that they, whether individually or as a group (i) are not involved in any market making activities for any of the listed corporation reviewed; or (ii) do not have any individual employed by or associated with any group company(ies) of the Company serving as an officer of any of the listed corporation reviewed; or (iii) do not have any financial interest in relation to the listed corporation reviewed or (iv) do not, presently or within the last 12 months, have any investment banking relationship with the listed corporation reviewed. Undertakings of the Analyst I (We) am (are) conferred the Professional Quality of Securities Investment Consulting Industry by the Securities Association of China and have registered as the Securities Analyst. I hereby issue this report independently and objectively with due diligence, professional and prudent research methods and only legitimate information is used in this report. I am also responsible for the content and opinions of this report. I have never been, am not, and will not be compensated directly or indirectly in any form for the specific recommendations or opinions herein. Disclosure with respect to the Company The company is a subsidiary of Shenwan Hongyuan Securities. The company is a qualified securities investment consulting institute approved by China Securities Regulatory Commission with the code number ZX0065. Releasing securities research reports is the basic form of the securities investment consulting services. The company may analyze the values or market trends of securities and related products or other relevant affecting factors, provide investment analysis advice on securities valuation/ investment rating, etc. by issuing securities research reports solely to its clients. The Company fulfills its duty of disclosure within its sphere of knowledge. The clients may contact [email protected] for the relevant disclosure materials or log into www.swsresearch.com for the analysts' qualifications,the arrangement of the quiet period and the affiliates’ shareholdings. Introduction of Share Investment Rating Security Investment Rating: When measuring the difference between the markup of the security and that of the market’s benchmark within six months after the release of this report, we define the terms as follows: Trading BUY: Share price performance is expected to generate more than 20% upside over a 6-month period. BUY: Share price performance is expected to generate more than 20% upside over a 12-month period. Outperform: Share price performance is expected to generate between 10-20% upside over a 12-month period. Hold: Share price performance is expected to generate between 10% downside to 10% upside over a 12-month period. Underperform: Share price performance is expected to generate between 10-20% downside over a 12-month period. SELL: Share price performance is expected to generate more than 20% downside over a 12-month period. Industry Investment Rating: When measuring the difference between the markup of the industry index and that of the market’s benchmark within six months after the release of the report, we define the terms as follows: Overweight:Industry performs better than that of the whole market;
Equal weight: Industry performs about the same as that of the whole market;
Underweight:Industry performs worse than that of the whole market. We would like to remind you that different security research institutions adopt different rating terminologies and rating standards. We adopt the relative rating method to recommend the relative weightings of investment. The clients’ decisions to buy or sell securities shall be based on their actual situation, such as their portfolio structures and other necessary factors. The clients shall read through the whole report so as to obtain the complete opinions and information and shall not rely solely on the investment ratings to reach a conclusion. The Company employs its own industry classification system. The industry classification is available at our sales personnel if you are interested. HSCEI is the benchmark employed in this report.
Disclaimer: This report is to be used solely by the clients of SWS Research Co., Ltd. ( subsidiary of Shenwan Hongyuan Securities, hereinafter referred to as the “Company”). The Company will not deem any other person as its client notwithstanding his receipt of this report. This report is based on public information, however, the authenticity, accuracy or completeness of such information is not warranted by the Company. The materials, tools, opinions and speculations contained herein are for the clients’ reference only, and are not to be regarded or deemed as an invitation for the sale or purchase of any security or other investment instruments. The clients understand that the text message reminder and telephone recommendation are no more than a brief communication of the research opinions, which are subject to the complete report released on the Company’s website (http://www.swsresearch.com). The clients may ask for follow-up explanations if they so wish. The materials, opinions and estimates contained herein only reflect the judgment of the Company on the day this report is released. The prices, values and investment returns of the securities or investment instruments referred to herein may fluctuate. At different periods, the Company may release reports which are inconsistent with the materials, opinions and estimates contained herein. Save and except as otherwise stipulated in this report, the contactor upon the first page of the report only acts as the liaison who shall not provide any consulting services. The clients shall consider the Company’s possible conflict of interests which may affect the objectivity of this report, and shall not base their investment decisions solely on this report. The clients should make investment decisions independently and solely at your own risk. Please be reminded that in any event, the company will not share gains or losses of any securities investment with the clients. Whether written or oral, any commitment to share gains or losses of securities investment is invalid. The investment and services referred to herein may not be suitable for certain clients and shall not constitute personal advice for individual clients. The Company does not ensure that this report fully takes into consideration of the particular investment objectives, financial situations or needs of individual clients. The Company strongly suggests the clients to consider themselves whether the opinions or suggestions herein are suitable for the clients’ particular situations; and to consult an independent investment consultant if necessary. Under no circumstances shall the information contained herein or the opinions expressed herein forms an investment recommendation to anyone. Under no circumstances shall the Company be held responsible for any loss caused by the use of any contents herein by anyone. Please be particularly cautious to the risks and exposures of the market via investment. Independent investment consultant should be consulted before any investment decision is rendered based on this report or at any request of explanation for this report where the receiver of this report is not a client of the Company.
本研究报告仅通过邮件提供给 民生加银 使用。6
kuxsmi:30448kuxe
October 12, 2010 Building Materials | Company Research
Please refer to the last page for important disclosures Page 5
January 12,2015 Food, Beverage & Tobacco | Company Research
July 29,2015 Software & Services | Company Research
The Company possesses all copyrights of this report which shall be treated as non-public information. The Company reserves all rights related to this report. Unless otherwise indicated in writing, all the copyrights of all the materials herein belong to the Company. In the absence of any prior authorization by the Company in writing, no part of this report shall be copied, photocopied, replicated or redistributed to any other person in any form by any means, or be used in any other ways which will infringe upon the copyrights of the Company. All the trademarks, service marks and marks used herein are trademarks, service marks or marks of the Company, and no one shall have the right to use them at any circumstances without the prior consent of the Company. This report may be translated into different languages. The Company does not warrant that the translations are free from errors or discrepancies. This report is for distribution in Hong Kong only to persons who fall within the definition of professional investors whether under the Securities and Futures Ordinance (Chapter 571 of the laws of Hong Kong) (the “SFO”) or the Securities and Futures (Professional Investor) Rules (Chapter 571D of the laws of the Hong Kong under the SFO). This report is for distribution in the United Kingdom only to persons who (i) have professional experience in matters relating to investments falling within Article 19(5) of the Financial Services and Markets Act 2000 (Financial Promotion) order 2001 (as amended) (the “Order”) or (ii) are persons falling within Article 49(2)(a) to (d) (“High Net Worth Companies, Unincorporated Associations, etc”) of the Order (All such persons together being referred to as “Relevant Persons”). This document is directed only at Relevant Persons. Other Persons who are not Relevant Persons must not act or rely upon this document or any of its contents.
Distribution in Singapore If distributed in Singapore, this report is meant only for Accredited Investors and Institutional Investors as defined under Section 4A of the Securities and Futures Act of Singapore. If you are not an Accredited Investor or an Institutional Investor, you shall ignore the report and its contents. The Singapore recipients of the report are to contact the Singapore office of Shenwan Hongyuan Singapore Private Limited. at 65-6323-5208, or 65-6323-5209 in respect of any matters arising from, or in connection with, the report.
![[Table MainInfo] - jrj.com.cnpg.jrj.com.cn/acc/Res/CN_RES/INDUS/2019/5/19/d... · 0% 8% 2018/5 2018/8 2018/11 2019/2 信息技术 沪深300. 资料来. 源 : Wind [Table相关研究_Doc]](https://img.pdfslide.tips/doc/110x75/5f0c452e7e708231d43491b6/table-maininfo-jrjcomcnpgjrjcomcnaccrescnresindus2019519d.jpg)