Embed Size (px)
Citation preview
9/11/2011
1
LECTURE 410/09/11
Productivity
RECAP
LEADERSHIP WITHOUT TITLEYOU CAN BRING POSITIVE CHANGE
INCREASE YOUR INFLUENCE/ SATISFACTIONImportance Statistical ControlImportance Statistical Control
A system NOT under control is erratic & out of limitsCannot be used for anything!Should be stabilized by removing special causes
A System under control is predictableCan be used for accurate estimates, sampling, forecasts,…The average cannot improve by itselfImproving the average is the real management challenge
HOW IS THE PLAN?
How accurately are you following your roadmap?Within what time limit would you reach your destination?destination?How do you know you are on the right track?What is the right track?“If you do not know where you are going, you would reach anywhere”.
9/11/2011
2
RECAP LECTURE 1- ESSENCE OF MANAGEMENT
Can we do marketing and innovate effortlessly?The enterprise should discharge its purpose of creating a customer efficientlyof creating a customer efficientlyUtilizing the resources productivelyProductivity means balance between all factors of production that will give the greatest output for the smallest effort.
4
ENTERPRISE PRODUCTIVITY – PART 1
How do you know your enterprise/ dept is functioning?How would you know that it is functioning well?well?How well?When can you tell?What are its functions supposed to be?
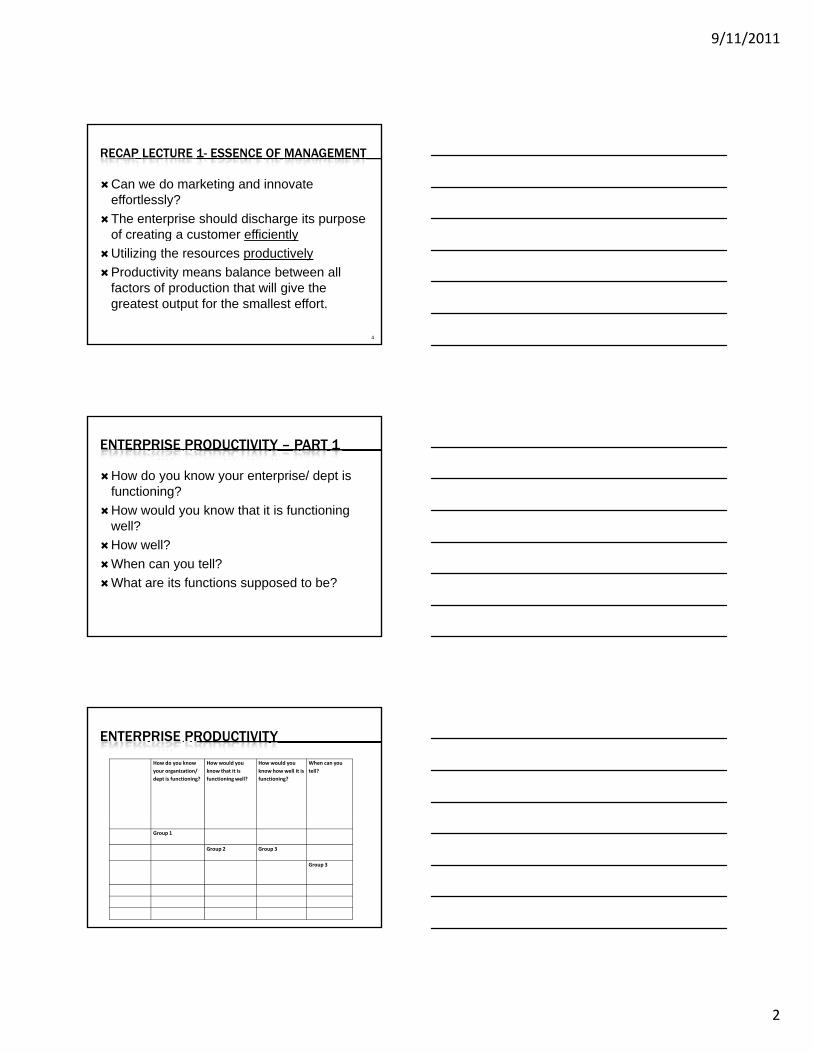
ENTERPRISE PRODUCTIVITY
How do you know your organization/ dept is functioning?
How would you know that it is functioning well?
How would you know how well it is functioning?
When can you tell?
Group 1
Group 2 Group 3
Group 3
9/11/2011
3
PRODUCTIVITY
How do you measure productivity in your organization?Measures…I d t S ifi M th dIndustry Specific MethodsKey Success Factors
WHY PRODUCTIVITY?
TYPICAL QUESTIONS ON ANY INITIATIVE
WHAT WOULD THIS BRING?
WHAT WOULD THIS CHANGE?
WHY IS THIS IMPORTANT?
WHY PRODUCTIVITY?
Productivity an objective of TQMA measure of TQM’s effectiveness
Any program's effectivenessIn the long term, TQM should bring tangible g , g gbenefitsTQM in the path of Productivity Search,Vice Versa
9/11/2011
4
WHY PRODUCTIVITY?
Productivity is the ONLY True Source of CompetitivenessCompetitiveness – ability to compete in the market, in the world & prosperThe most competitive countries are the most productiveThe most prosperous
COMPETITIVENESS
Industrial Competitiveness“the immediate and future ability of, and opportunities for, entrepreneurs to design, produce and market goods within theirproduce and market goods within their respective environments whose price and non-price qualities form a more attractive package than those of competitors abroad or in domestic markets”. EU Management Forum.
DEFINITIONS OF PRODUCTIVITY
Traditional definitionOutput ÷ Input = ProductivityAccomplishing more with the same amount of resourcesresourcesAchieving higher output in terms of volume and quality for the same inputApplies to all sectors
9/11/2011
5
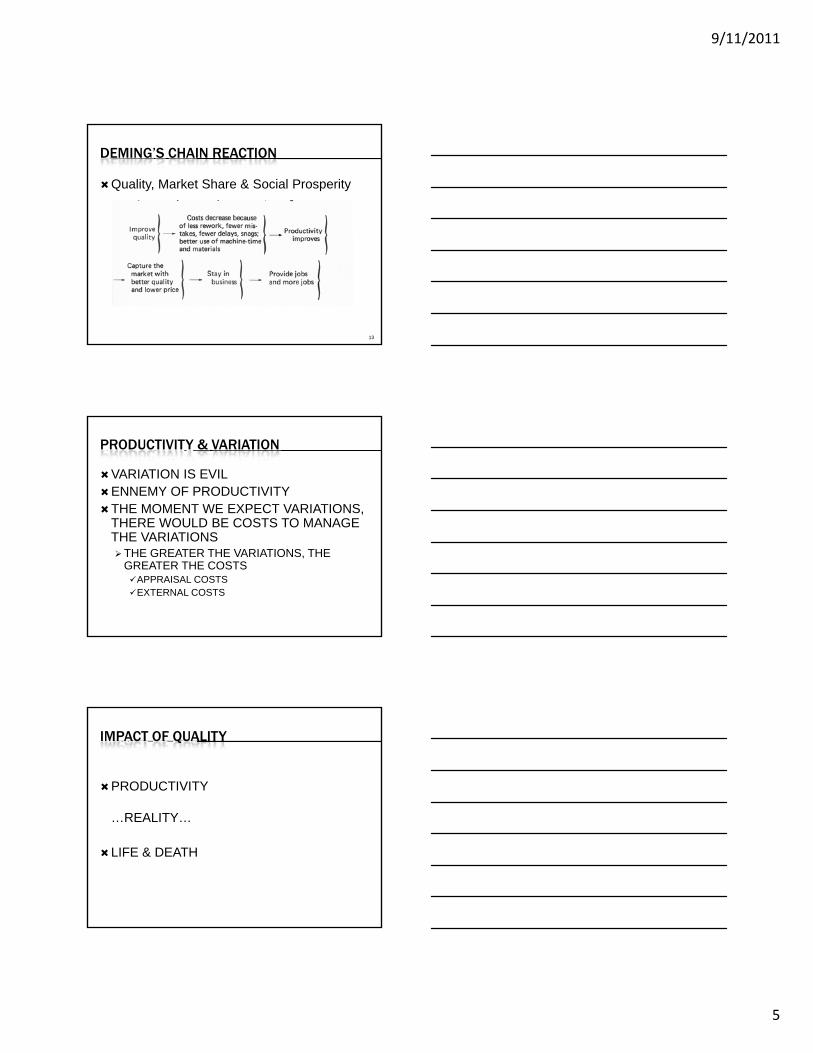
DEMING’S CHAIN REACTION
Quality, Market Share & Social Prosperity
13
PRODUCTIVITY & VARIATION
VARIATION IS EVILENNEMY OF PRODUCTIVITYTHE MOMENT WE EXPECT VARIATIONS, THERE WOULD BE COSTS TO MANAGETHERE WOULD BE COSTS TO MANAGE THE VARIATIONS
THE GREATER THE VARIATIONS, THE GREATER THE COSTS
APPRAISAL COSTSEXTERNAL COSTS
IMPACT OF QUALITY
PRODUCTIVITY
REALITY…REALITY…
LIFE & DEATH
9/11/2011
6
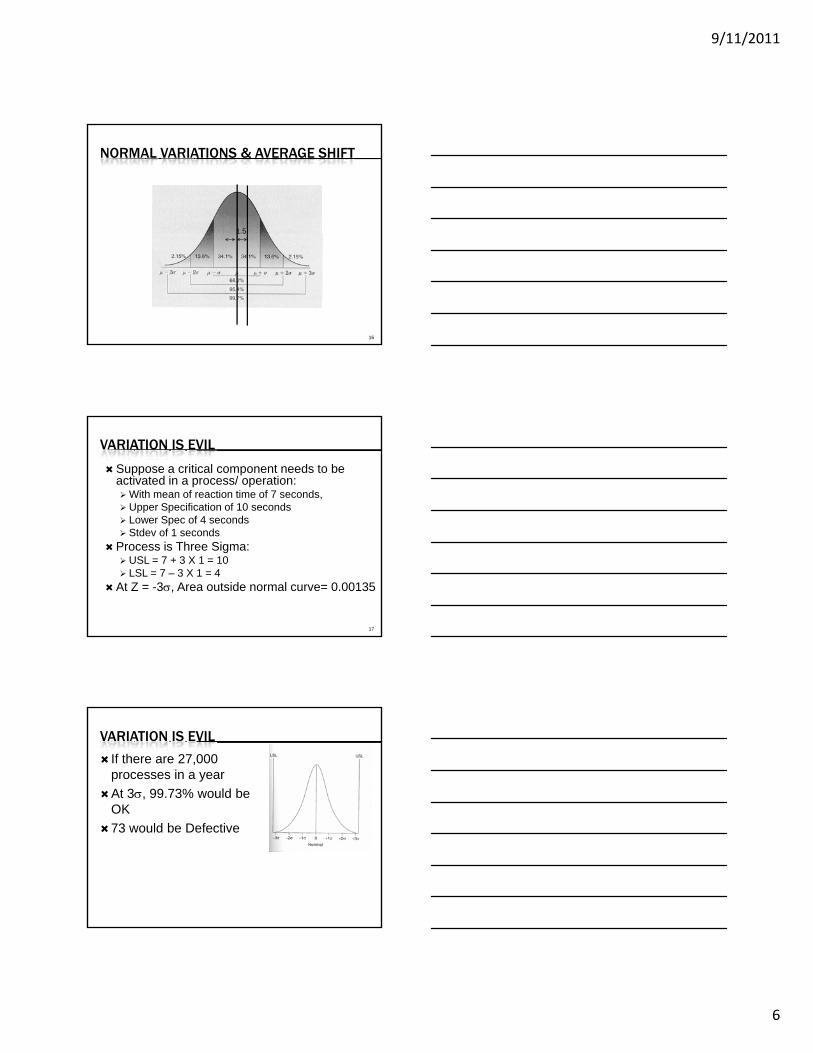
NORMAL VARIATIONS & AVERAGE SHIFT
1.5
16
VARIATION IS EVIL
Suppose a critical component needs to be activated in a process/ operation:
With mean of reaction time of 7 seconds, Upper Specification of 10 secondsLower Spec of 4 seconds
17
Stdev of 1 secondsProcess is Three Sigma:
USL = 7 + 3 X 1 = 10LSL = 7 – 3 X 1 = 4
At Z = -3σ, Area outside normal curve= 0.00135
VARIATION IS EVIL
If there are 27,000 processes in a year At 3σ, 99.73% would be OK73 would be Defective
9/11/2011
7
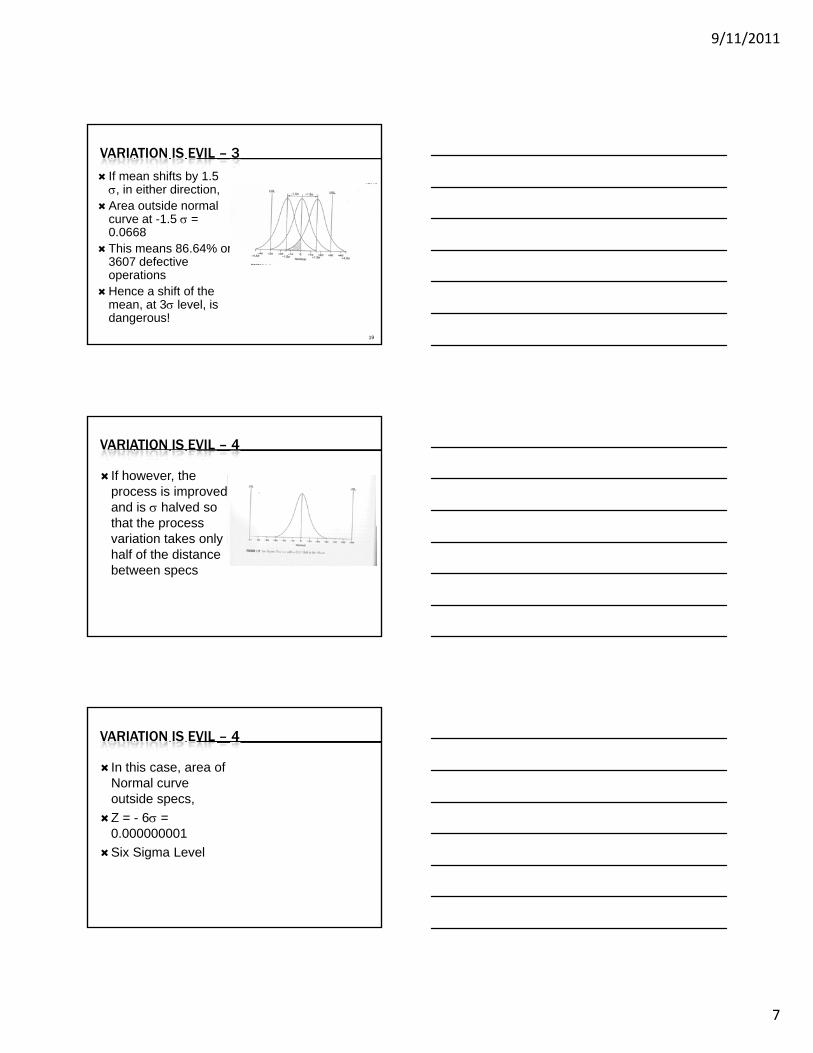
VARIATION IS EVIL – 3
If mean shifts by 1.5 σ, in either direction,Area outside normal curve at -1.5 σ = 0 0668
19
0.0668This means 86.64% or 3607 defective operationsHence a shift of the mean, at 3σ level, is dangerous!
VARIATION IS EVIL – 4
If however, the process is improved and is σ halved so that the processthat the process variation takes only half of the distance between specs
VARIATION IS EVIL – 4
In this case, area of Normal curve outside specs, Z = 6σ =Z = - 6σ = 0.000000001Six Sigma Level
9/11/2011
8
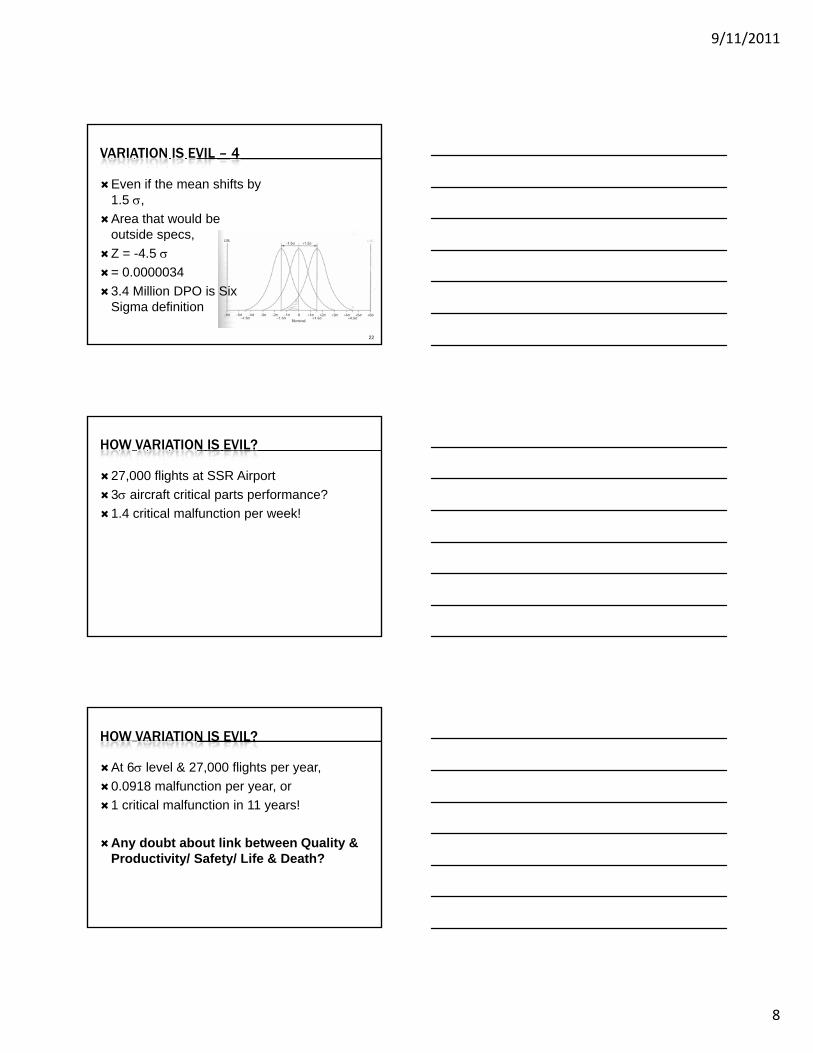
VARIATION IS EVIL – 4
Even if the mean shifts by 1.5 σ,Area that would be outside specs
22
outside specs,Z = -4.5 σ= 0.0000034 3.4 Million DPO is Six Sigma definition
HOW VARIATION IS EVIL?
27,000 flights at SSR Airport3σ aircraft critical parts performance?1.4 critical malfunction per week!
HOW VARIATION IS EVIL?
At 6σ level & 27,000 flights per year,0.0918 malfunction per year, or 1 critical malfunction in 11 years!
Any doubt about link between Quality & Productivity/ Safety/ Life & Death?
9/11/2011
9
PART 2 - MISCONCEPTIONS
Productivity doest NOT concern only LabourProductivity is NOT only OutputProfitability is NOT the absolute measure, b it i ff t d b i ti i i &because it is affected by variations in price & exchange ratesEfficiency means producing high-quality goods/ services in the shortest time
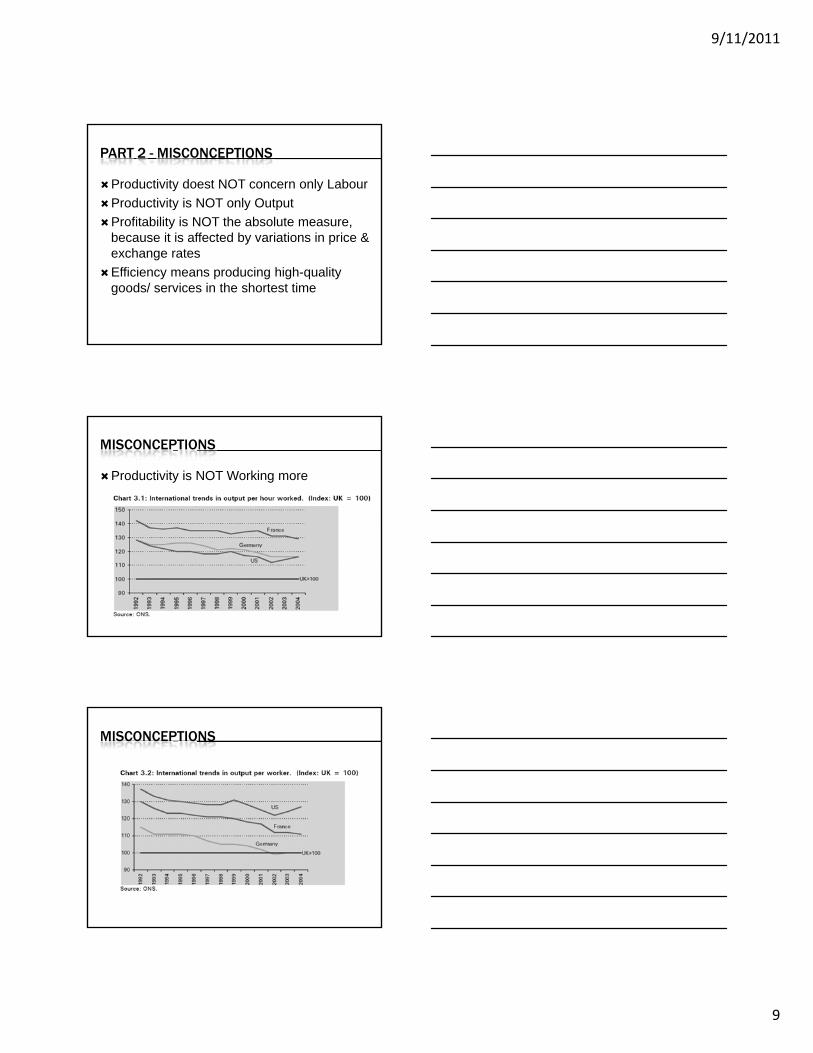
MISCONCEPTIONS
Productivity is NOT Working more
MISCONCEPTIONS
9/11/2011
10
DEFINITIONS
Productivity is a complex conceptProductivity could be considered as a comprehensive measure of how organizations satisfy the following criteria:
Objectives: degree to which they are achievedEfficiency: how resources are used to generate useful outputEffectiveness: what is achieved compared to what is possibleComparability: how productivity performance is recorded over time
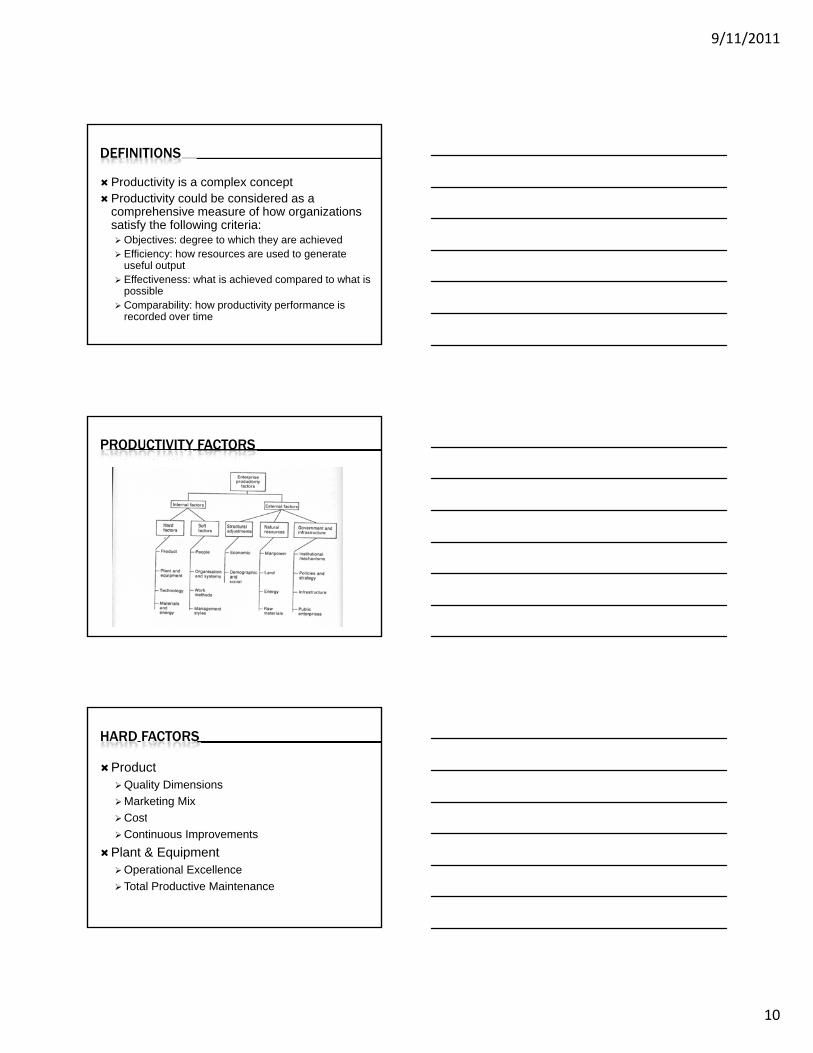
PRODUCTIVITY FACTORS
HARD FACTORS
ProductQuality DimensionsMarketing MixCostCostContinuous Improvements
Plant & EquipmentOperational ExcellenceTotal Productive Maintenance
9/11/2011
11
HARD FACTORS
TechnologyCan make the differenceAutomation
Materials & EnergyMaterials & EnergyInput QualityCost of energy
SOFT FACTORS
PeopleApplication – Degree to which people apply themselves to work
ValuesMotivation
Willingness to give maximum performance,Willingness to learnAttitude at all levels
Standard of PerformanceExpectation
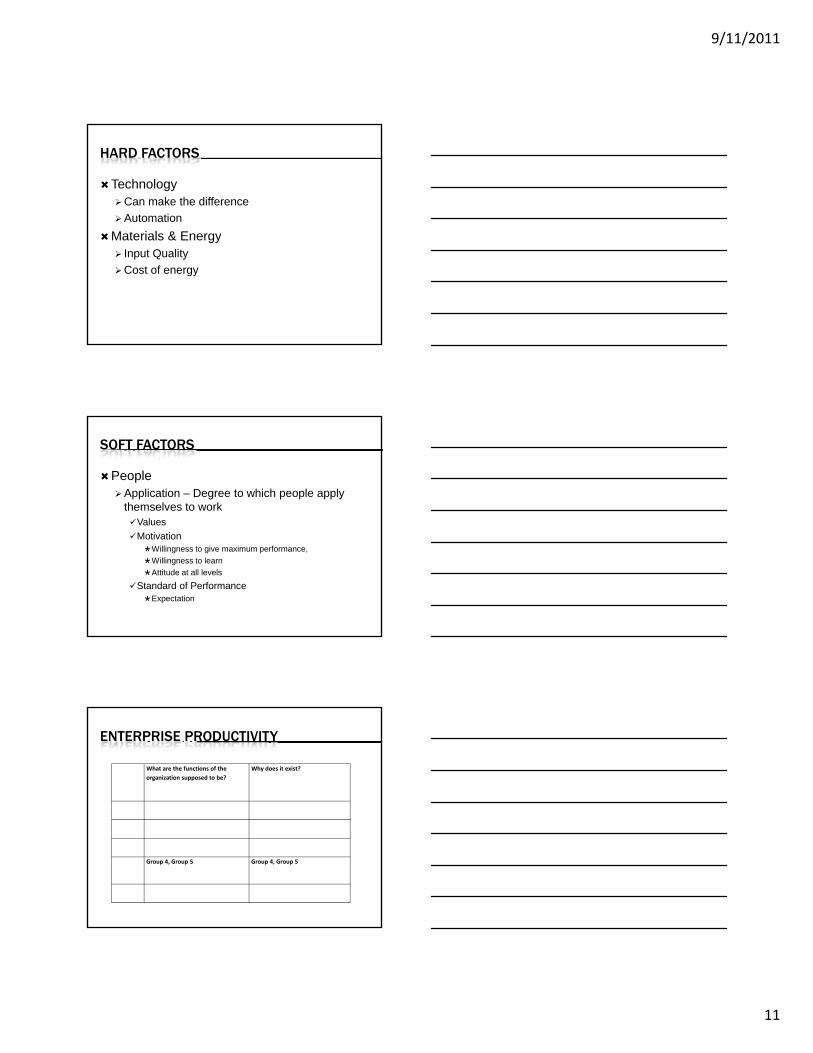
ENTERPRISE PRODUCTIVITY
What are the functions of the organization supposed to be?
Why does it exist?
Group 4, Group 5 Group 4, Group 5
9/11/2011
12
BREAK
KEY SUCCESS FACTORS (KSF)
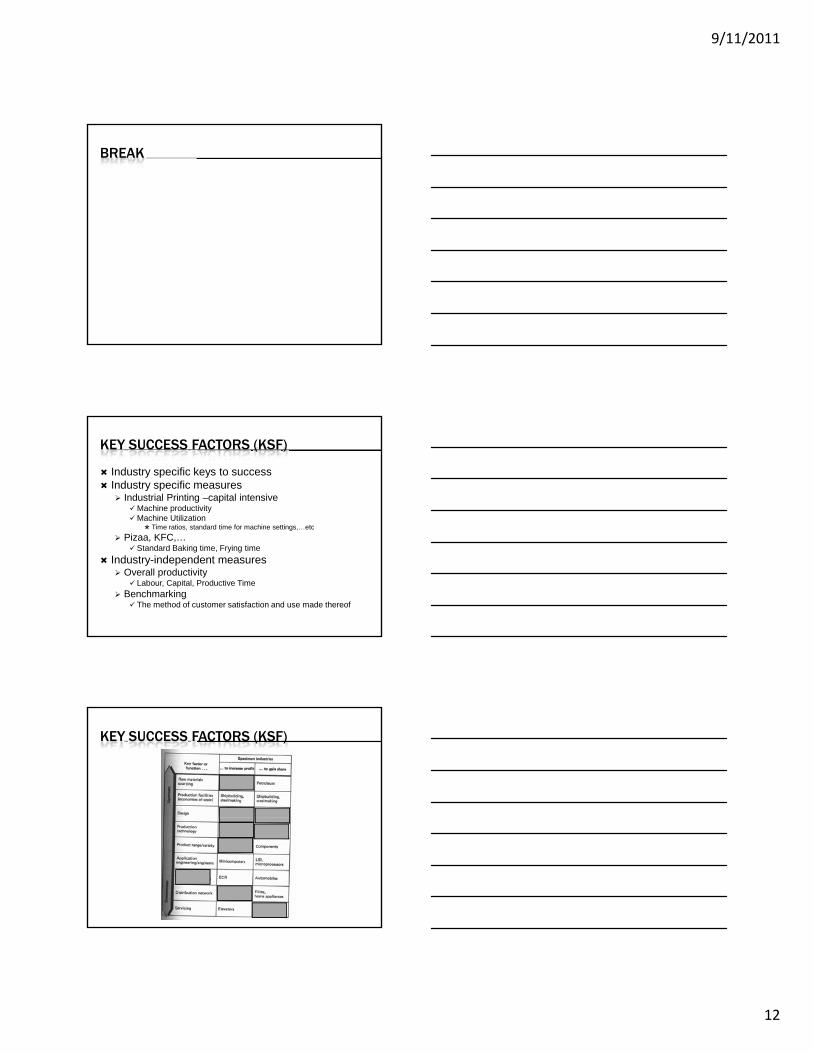
Industry specific keys to successIndustry specific measures
Industrial Printing –capital intensiveMachine productivityMachine Utilization
Time ratios standard time for machine settings etcTime ratios, standard time for machine settings,…etcPizaa, KFC,…
Standard Baking time, Frying timeIndustry-independent measures
Overall productivityLabour, Capital, Productive Time
BenchmarkingThe method of customer satisfaction and use made thereof
KEY SUCCESS FACTORS (KSF)
9/11/2011
13
SOFT FACTORS
PeopleEffectiveness – Extent to which application human effort brings desired result
MethodsTechniquesSkillsKnowledgeAttitudeAptitude
SOFT FACTORS
Organization StructureRigidity
Strategic Blindness to market changesCompartmentation/ Silos
Sub optimizationSub-optimization
SystemsManagement SystemsQuality systemsWork methods
Industrial Engineering
SOFT FACTORS
Obsolete Management StylesFormalHierarchicalRigidRigidOpen but closed door policyDistantGood for very stable, unchanging environments“Dodo in Paradise”
9/11/2011
14
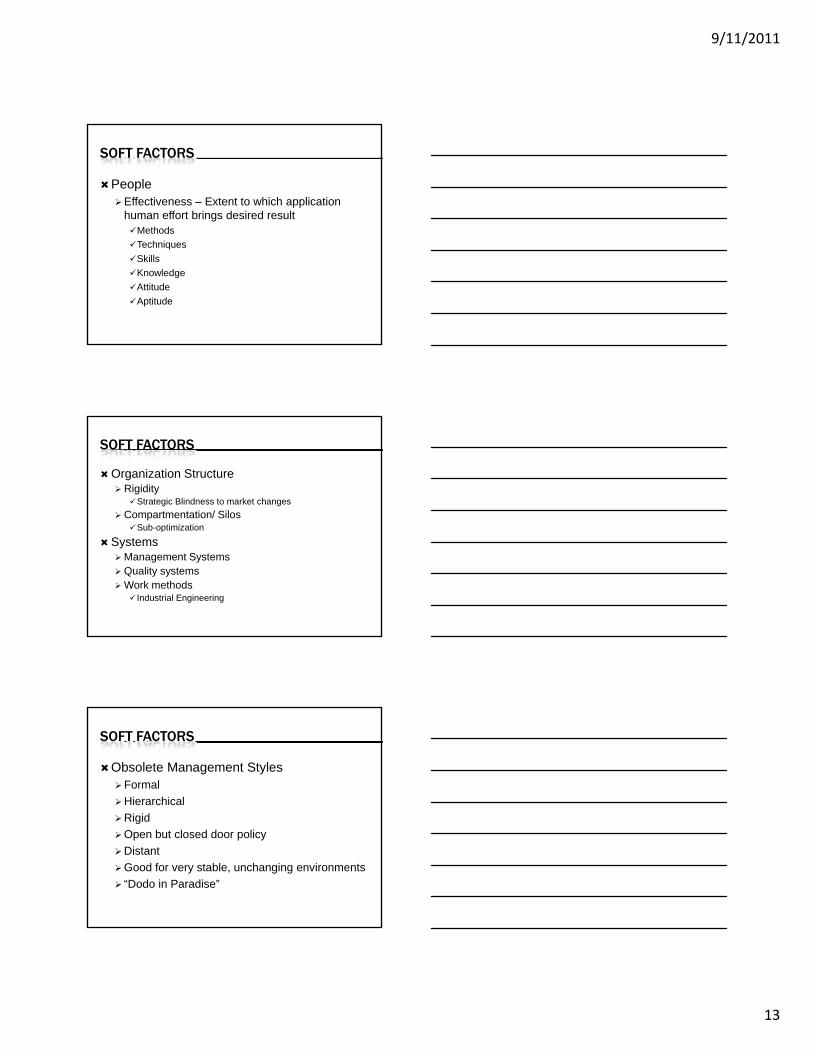
SOFT FACTORS
Adaptive Management StylesFlexibleFlatMatrixMatrixManagement by Walking AroundProximity ManagementInformal
INTERNAL PRODUCTIVITY FACTORS CHECKLIST
Hard Factors Soft FactorsProduct
People
Plant & Equipment
Organization & Systems
Technology
Work Methods
Materials & Energy
Management Systems
PRODUCTIVITY & PROFITABILITY
Output Value = Quantity Sold x Unit Price
Profitability = Productivity x Price Recovery
Input Value = Quantity Used x Unit Cost
9/11/2011
15
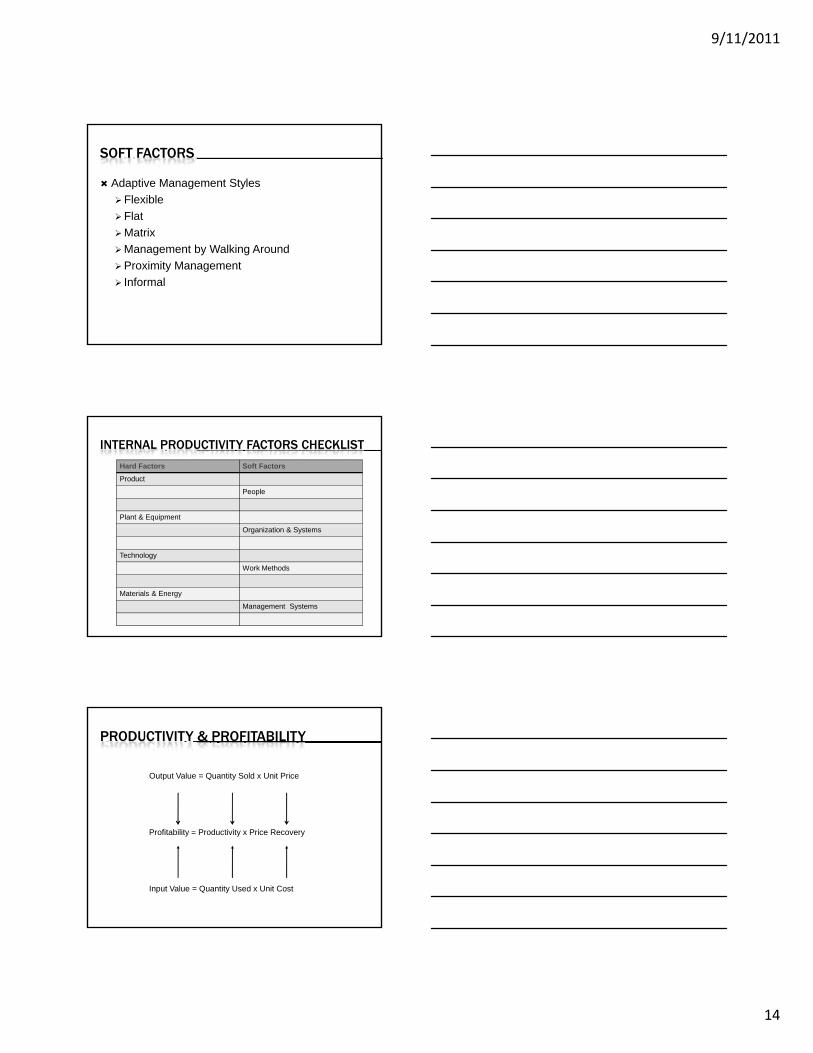
PRODUCTIVITY & PROFITABILITY
PRODUCTIVITY ANALYSIS
PRODUCTIVITY ANALYSIS EXERCISECRITERIA ACTUAL THEORECTICAL PRODUCTIVITYOutput of Production
Project Costs
Success Rate
Dept Budget
9/11/2011
16
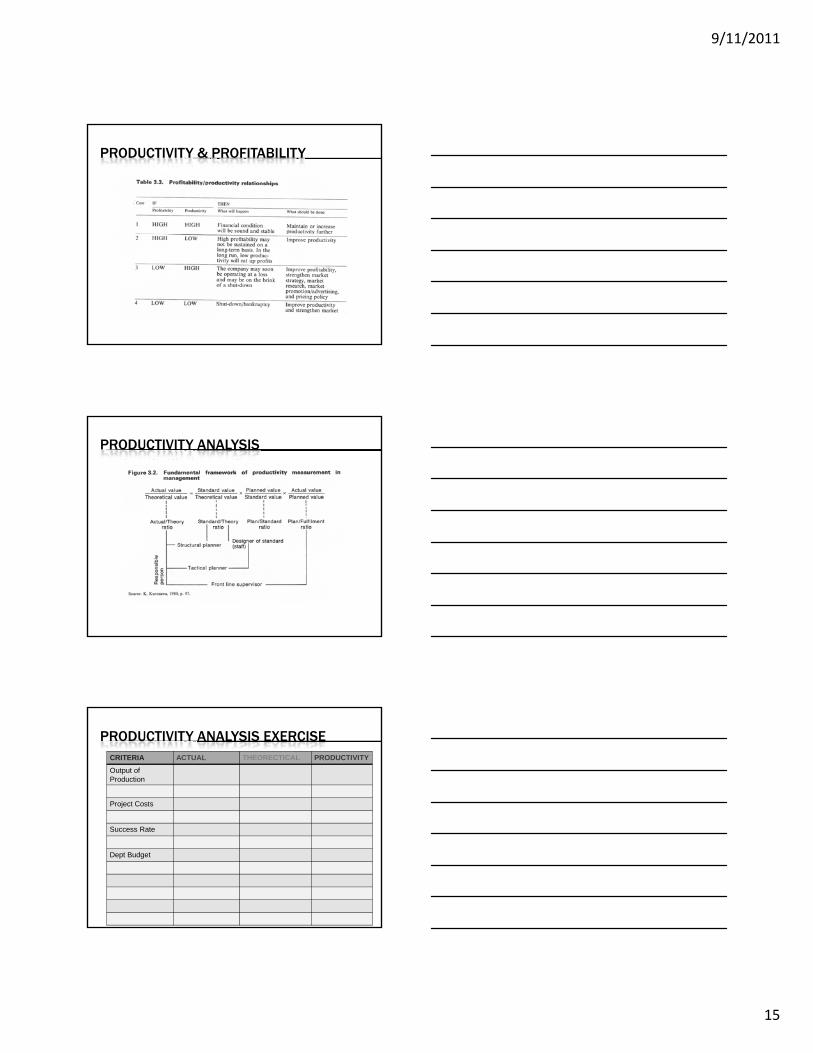
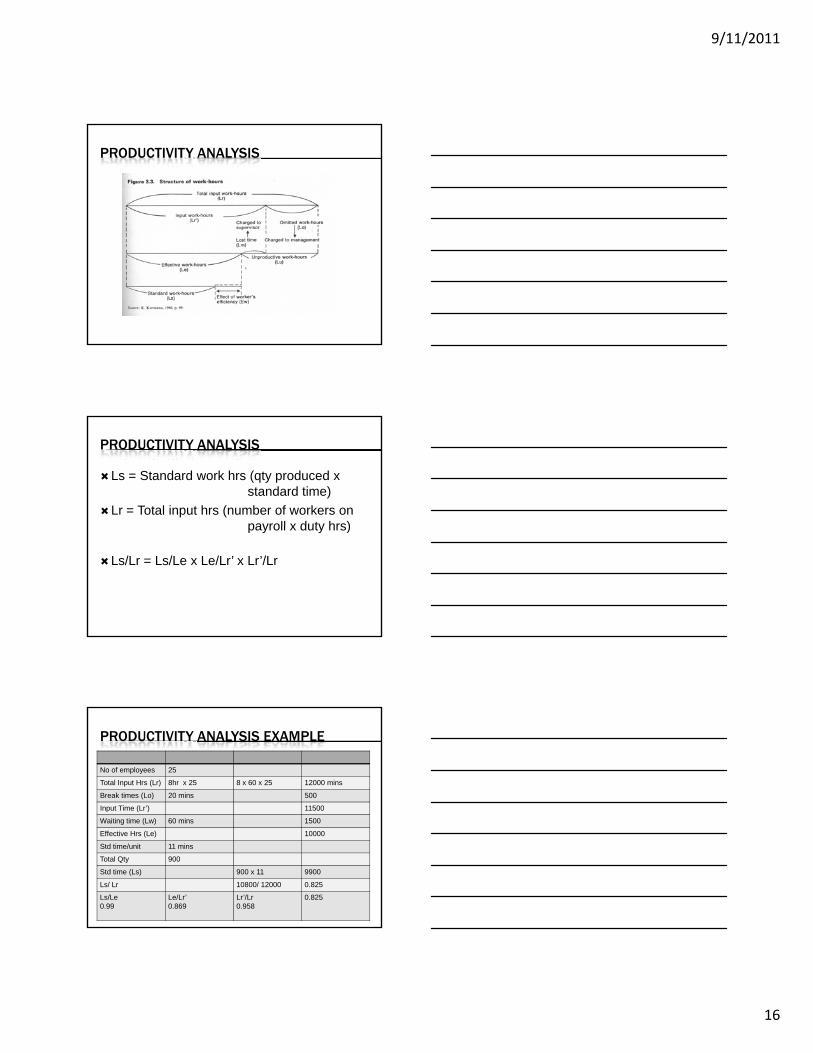
PRODUCTIVITY ANALYSIS
PRODUCTIVITY ANALYSIS
Ls = Standard work hrs (qty produced x standard time)
Lr = Total input hrs (number of workers on payroll x duty hrs)payroll x duty hrs)
Ls/Lr = Ls/Le x Le/Lr’ x Lr’/Lr
PRODUCTIVITY ANALYSIS EXAMPLE
No of employees 25
Total Input Hrs (Lr) 8hr x 25 8 x 60 x 25 12000 mins
Break times (Lo) 20 mins 500
Input Time (Lr’) 11500
Waiting time (Lw) 60 mins 1500
Effective Hrs (Le) 10000
Std time/unit 11 mins
Total Qty 900
Std time (Ls) 900 x 11 9900
Ls/ Lr 10800/ 12000 0.825
Ls/Le0.99
Le/Lr’ 0.869
Lr’/Lr0.958
0.825
9/11/2011
17
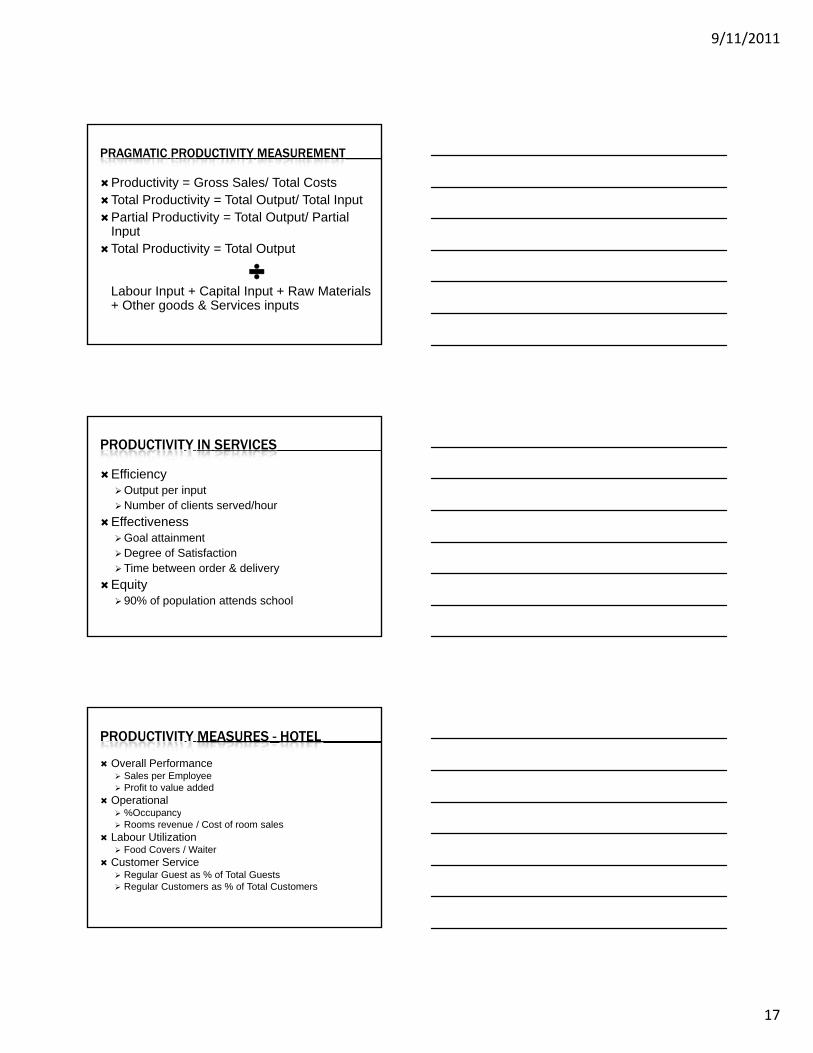
PRAGMATIC PRODUCTIVITY MEASUREMENT
Productivity = Gross Sales/ Total CostsTotal Productivity = Total Output/ Total InputPartial Productivity = Total Output/ Partial InputInputTotal Productivity = Total Output
Labour Input + Capital Input + Raw Materials + Other goods & Services inputs
PRODUCTIVITY IN SERVICES
EfficiencyOutput per inputNumber of clients served/hour
EffectivenessGoal attainmentDegree of SatisfactionTime between order & delivery
Equity90% of population attends school
PRODUCTIVITY MEASURES - HOTEL
Overall PerformanceSales per EmployeeProfit to value added
Operational%Occupancyp yRooms revenue / Cost of room sales
Labour UtilizationFood Covers / Waiter
Customer ServiceRegular Guest as % of Total GuestsRegular Customers as % of Total Customers
9/11/2011
18
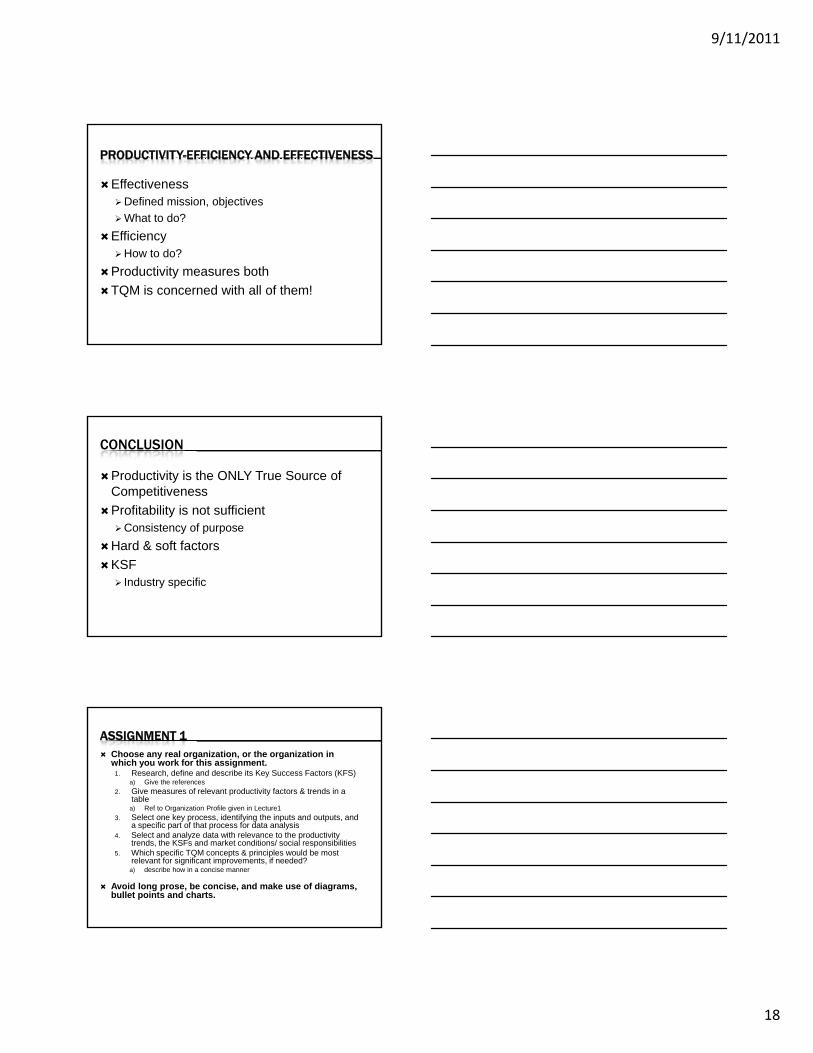
PRODUCTIVITY-EFFICIENCY AND EFFECTIVENESS
Effectiveness Defined mission, objectivesWhat to do?
EfficiencyEfficiencyHow to do?
Productivity measures bothTQM is concerned with all of them!
CONCLUSION
Productivity is the ONLY True Source of CompetitivenessProfitability is not sufficient
Consistency of purposeConsistency of purposeHard & soft factorsKSF
Industry specific
ASSIGNMENT 1Choose any real organization, or the organization in which you work for this assignment.
1. Research, define and describe its Key Success Factors (KFS)a) Give the references
2. Give measures of relevant productivity factors & trends in a table
a) Ref to Organization Profile given in Lecture13 Select one key process identifying the inputs and outputs and3. Select one key process, identifying the inputs and outputs, and
a specific part of that process for data analysis4. Select and analyze data with relevance to the productivity
trends, the KSFs and market conditions/ social responsibilities5. Which specific TQM concepts & principles would be most
relevant for significant improvements, if needed?a) describe how in a concise manner
Avoid long prose, be concise, and make use of diagrams, bullet points and charts.