Embed Size (px)
Citation preview
LIQUOR STORES N.A. LTD.Investor Presentation March 2016
Investor Presentation
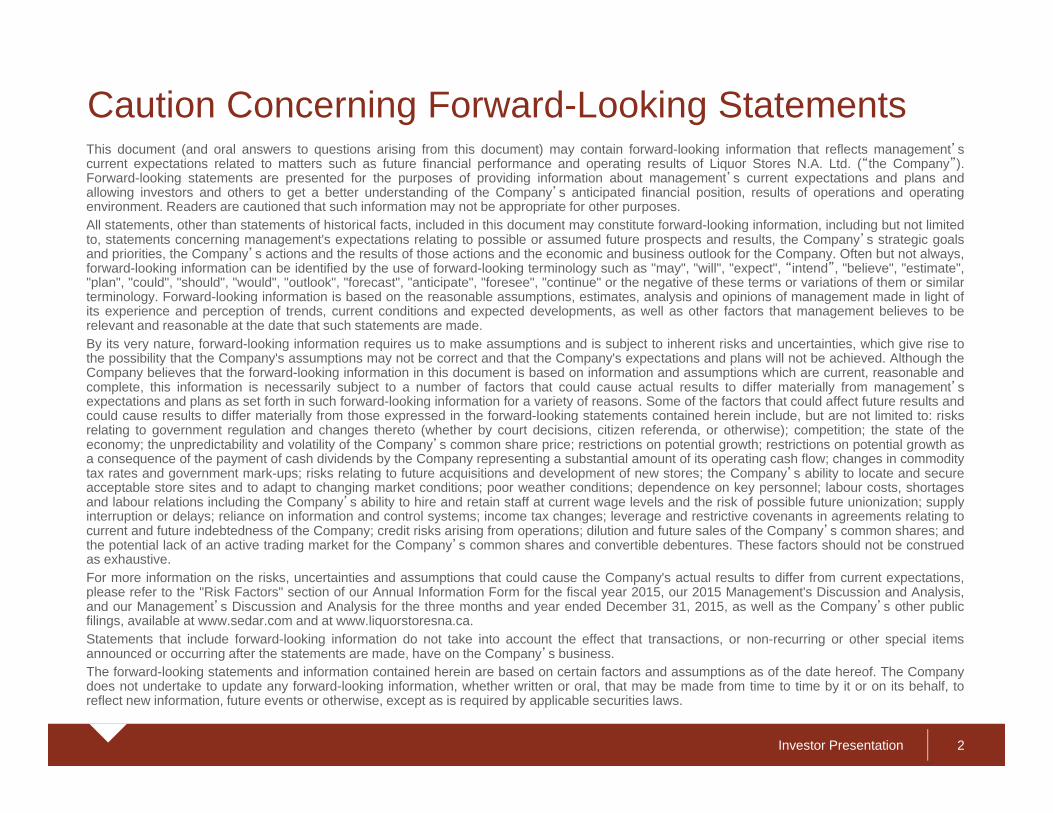
Caution Concerning Forward-Looking StatementsThis document (and oral answers to questions arising from this document) may contain forward-looking information that reflects management’scurrent expectations related to matters such as future financial performance and operating results of Liquor Stores N.A. Ltd. (“the Company”).Forward-looking statements are presented for the purposes of providing information about management’s current expectations and plans andallowing investors and others to get a better understanding of the Company’s anticipated financial position, results of operations and operatingenvironment. Readers are cautioned that such information may not be appropriate for other purposes.All statements, other than statements of historical facts, included in this document may constitute forward-looking information, including but not limitedto, statements concerning management's expectations relating to possible or assumed future prospects and results, the Company’s strategic goalsand priorities, the Company’s actions and the results of those actions and the economic and business outlook for the Company. Often but not always,forward-looking information can be identified by the use of forward-looking terminology such as "may", "will", "expect", “intend”, "believe", "estimate","plan", "could", "should", "would", "outlook", "forecast", "anticipate", "foresee", "continue" or the negative of these terms or variations of them or similarterminology. Forward-looking information is based on the reasonable assumptions, estimates, analysis and opinions of management made in light ofits experience and perception of trends, current conditions and expected developments, as well as other factors that management believes to berelevant and reasonable at the date that such statements are made.By its very nature, forward-looking information requires us to make assumptions and is subject to inherent risks and uncertainties, which give rise tothe possibility that the Company's assumptions may not be correct and that the Company's expectations and plans will not be achieved. Although theCompany believes that the forward-looking information in this document is based on information and assumptions which are current, reasonable andcomplete, this information is necessarily subject to a number of factors that could cause actual results to differ materially from management’sexpectations and plans as set forth in such forward-looking information for a variety of reasons. Some of the factors that could affect future results andcould cause results to differ materially from those expressed in the forward-looking statements contained herein include, but are not limited to: risksrelating to government regulation and changes thereto (whether by court decisions, citizen referenda, or otherwise); competition; the state of theeconomy; the unpredictability and volatility of the Company’s common share price; restrictions on potential growth; restrictions on potential growth asa consequence of the payment of cash dividends by the Company representing a substantial amount of its operating cash flow; changes in commoditytax rates and government mark-ups; risks relating to future acquisitions and development of new stores; the Company’s ability to locate and secureacceptable store sites and to adapt to changing market conditions; poor weather conditions; dependence on key personnel; labour costs, shortagesand labour relations including the Company’s ability to hire and retain staff at current wage levels and the risk of possible future unionization; supplyinterruption or delays; reliance on information and control systems; income tax changes; leverage and restrictive covenants in agreements relating tocurrent and future indebtedness of the Company; credit risks arising from operations; dilution and future sales of the Company’s common shares; andthe potential lack of an active trading market for the Company’s common shares and convertible debentures. These factors should not be construedas exhaustive.For more information on the risks, uncertainties and assumptions that could cause the Company's actual results to differ from current expectations,please refer to the "Risk Factors" section of our Annual Information Form for the fiscal year 2015, our 2015 Management's Discussion and Analysis,and our Management’s Discussion and Analysis for the three months and year ended December 31, 2015, as well as the Company’s other publicfilings, available at www.sedar.com and at www.liquorstoresna.ca.Statements that include forward-looking information do not take into account the effect that transactions, or non-recurring or other special itemsannounced or occurring after the statements are made, have on the Company’s business.The forward-looking statements and information contained herein are based on certain factors and assumptions as of the date hereof. The Companydoes not undertake to update any forward-looking information, whether written or oral, that may be made from time to time by it or on its behalf, toreflect new information, future events or otherwise, except as is required by applicable securities laws.
2
Investor Presentation
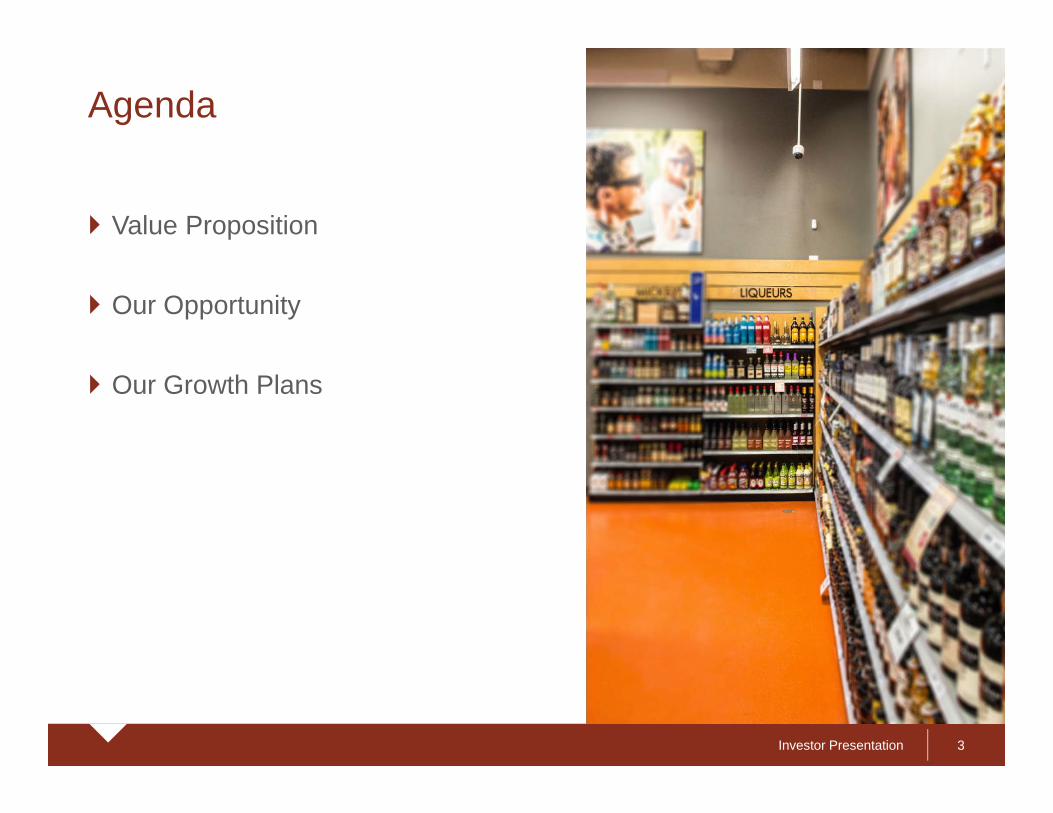
Agenda
Value Proposition
Our Opportunity
Our Growth Plans
3
Investor Presentation
Compelling value proposition Largest publicly traded liquor retailer offers exposure to stable and growing industry with significant potential upside
Attractive business today
• Strong management team, with robust Canadian and U.S. retail experience
• Quality asset base – prime & strategic locations
• Solid balance sheet
• Leading brands in Alberta, British Columbia, Alaska and Kentucky
• Increasing overall profitability despite market challenges in Alberta
Well positioned for future growth
• Hard to replicate competitive advantages –locations, scale and vendor relationships
• Fragmented industry ripe for expansion
• Experiential new store concept – industry game changer
4
Investor Presentation
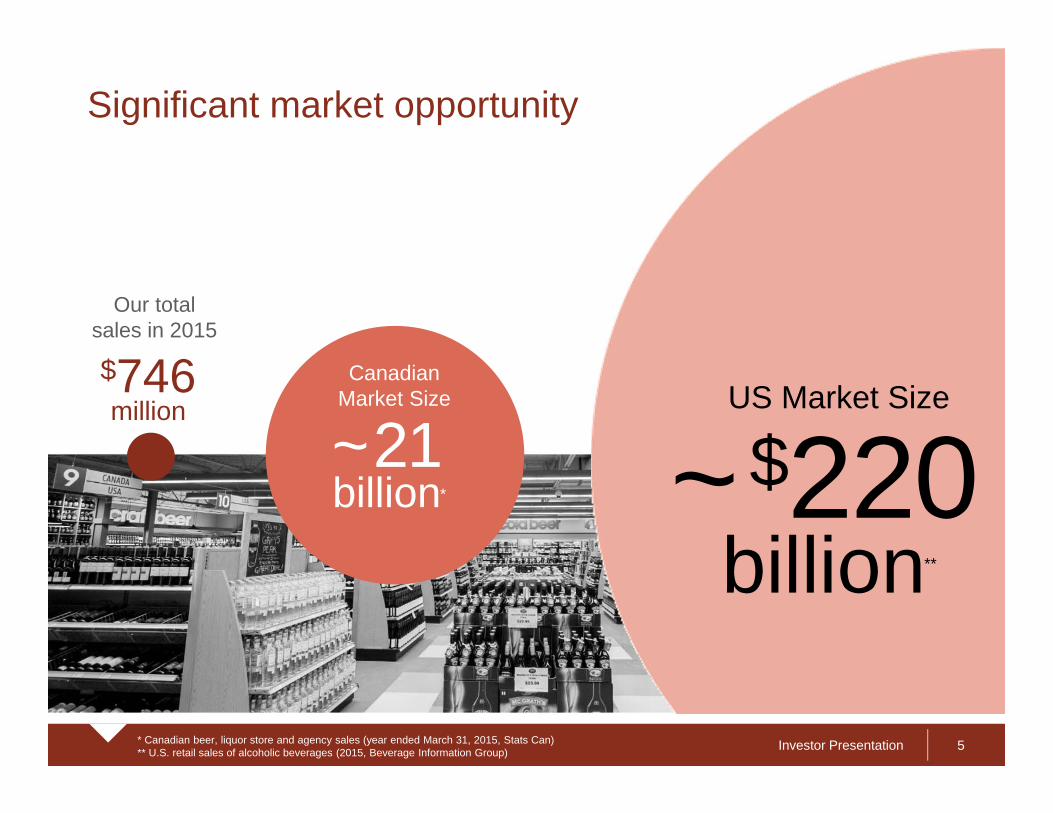
Significant market opportunity
* Canadian beer, liquor store and agency sales (year ended March 31, 2015, Stats Can)** U.S. retail sales of alcoholic beverages (2015, Beverage Information Group) 5
Our total sales in 2015
$746million
~21billion ~$220
billion
US Market Size
**
*
Canadian Market Size
Investor Presentation
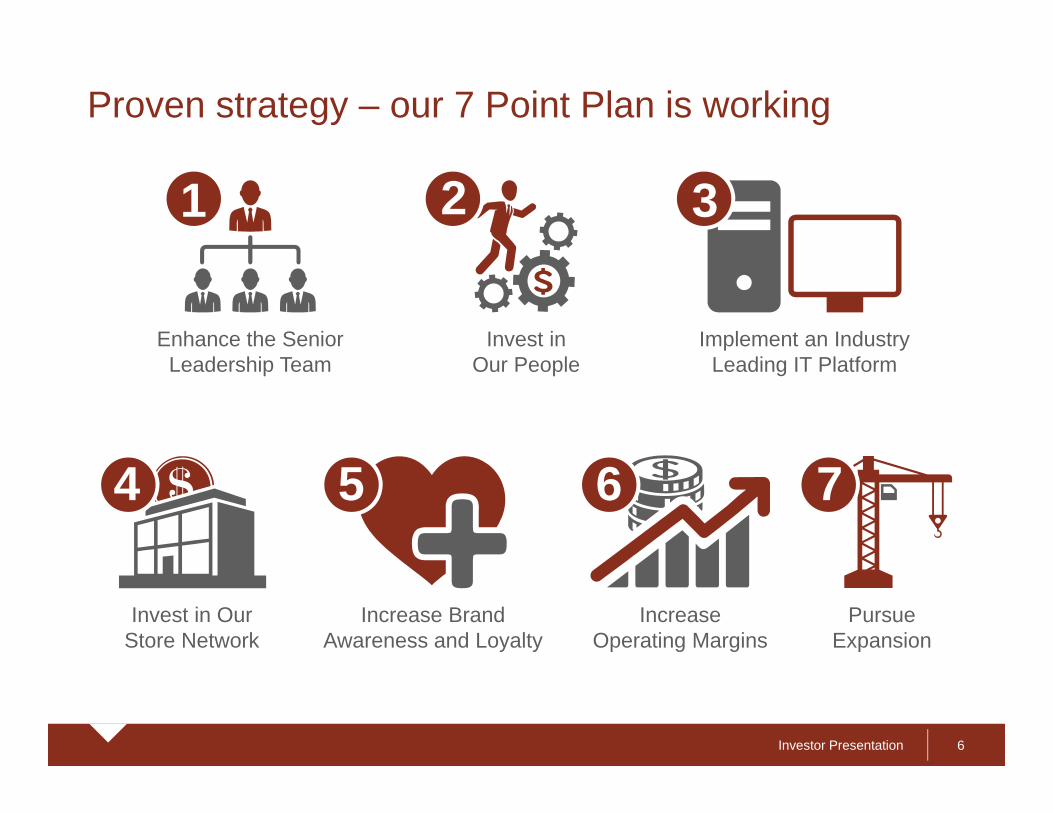
Proven strategy – our 7 Point Plan is working
6
Enhance the Senior Leadership Team
Invest in Our People
Implement an Industry Leading IT Platform
Invest in Our Store Network
Increase Brand Awareness and Loyalty
Increase Operating Margins
Pursue Expansion
1 2 3
4 5 76
Investor Presentation
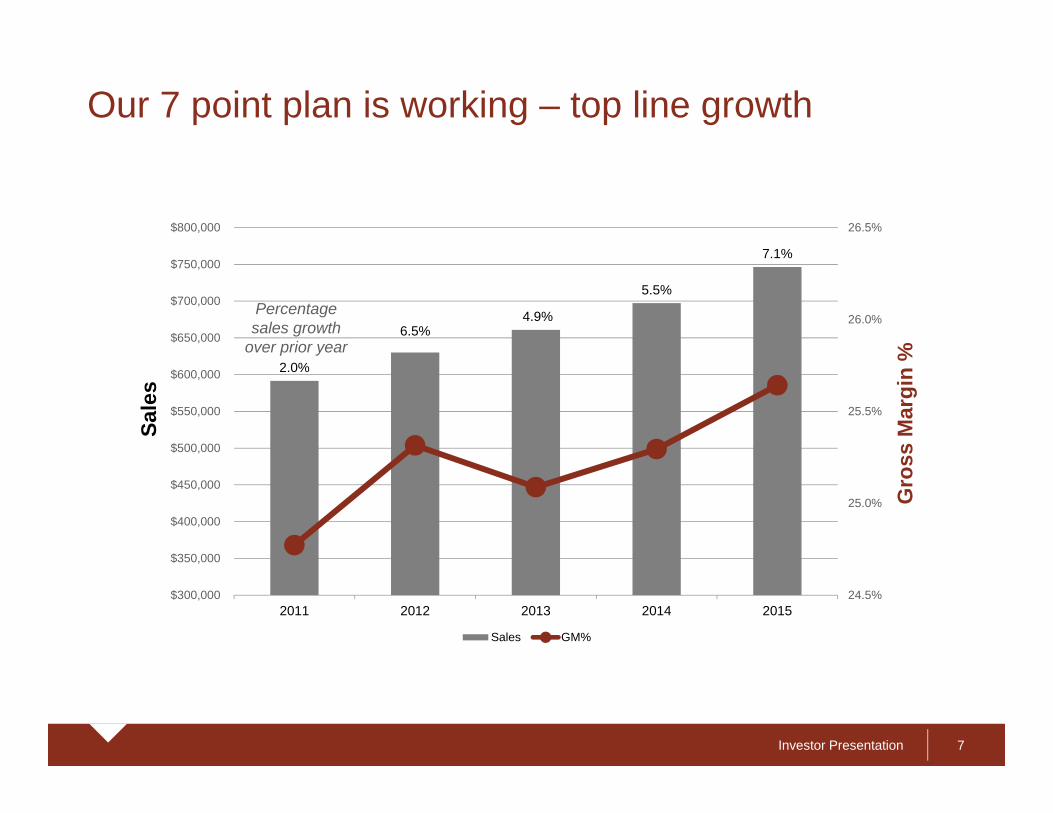
Our 7 point plan is working – top line growth
7
2.0%
6.5%4.9%
5.5%
7.1%
24.5%
25.0%
25.5%
26.0%
26.5%
$300,000
$350,000
$400,000
$450,000
$500,000
$550,000
$600,000
$650,000
$700,000
$750,000
$800,000
2011 2012 2013 2014 2015
Gro
ss M
argi
n %
Sale
s
Sales GM%
Percentage sales growth
over prior year
Investor Presentation
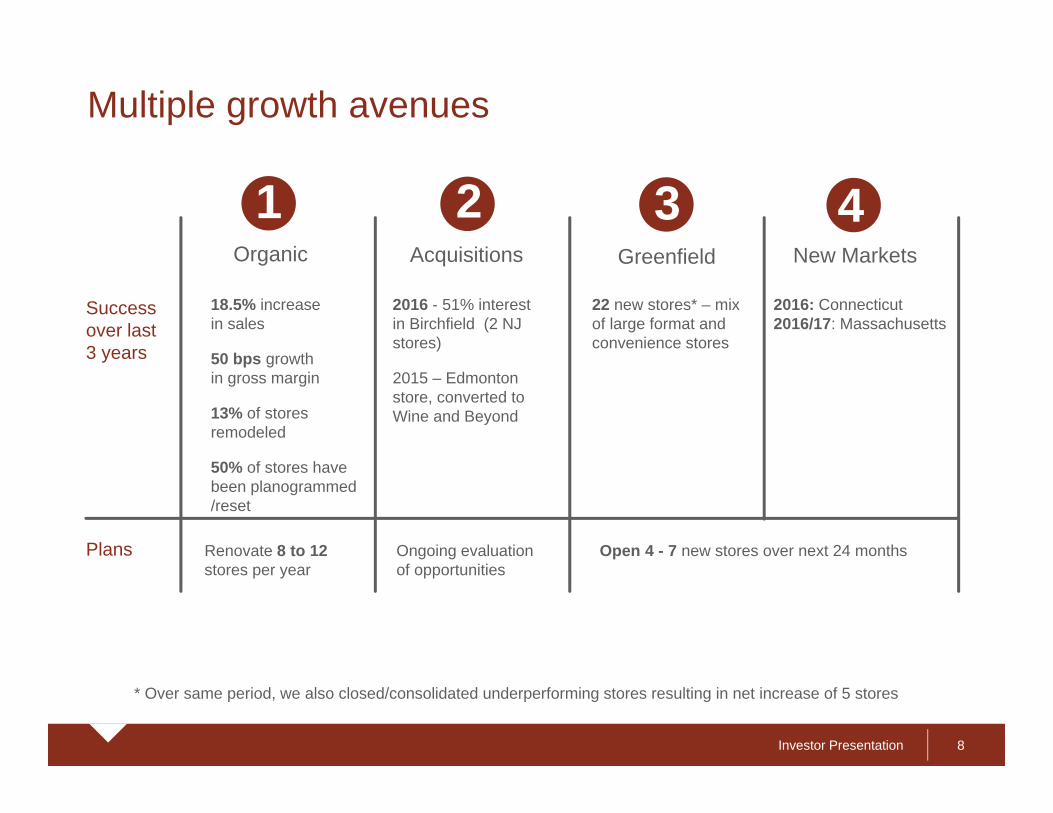
Multiple growth avenues
8
Organic Acquisitions Greenfield New Markets
1 2 3 4
18.5% increase in sales
50 bps growthin gross margin
13% of stores remodeled
50% of stores have been planogrammed/reset
Successover last 3 years
Plans
2016 - 51% interest in Birchfield (2 NJstores)
2015 – Edmonton store, converted to Wine and Beyond
22 new stores* – mix of large format and convenience stores
2016: Connecticut2016/17: Massachusetts
Open 4 - 7 new stores over next 24 months Renovate 8 to 12 stores per year
Ongoing evaluation of opportunities
* Over same period, we also closed/consolidated underperforming stores resulting in net increase of 5 stores
Investor Presentation
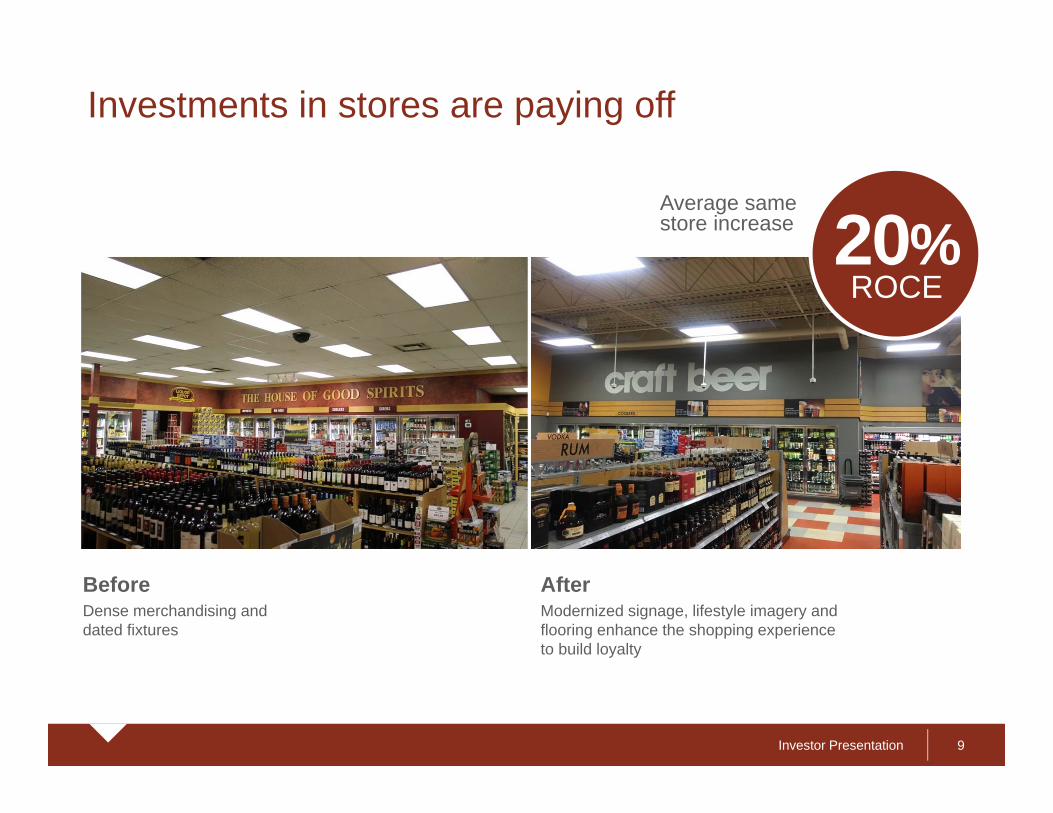
Investments in stores are paying off
9
BeforeDense merchandising and dated fixtures
AfterModernized signage, lifestyle imagery and flooring enhance the shopping experience to build loyalty
20%ROCE
Average same store increase
Investor Presentation
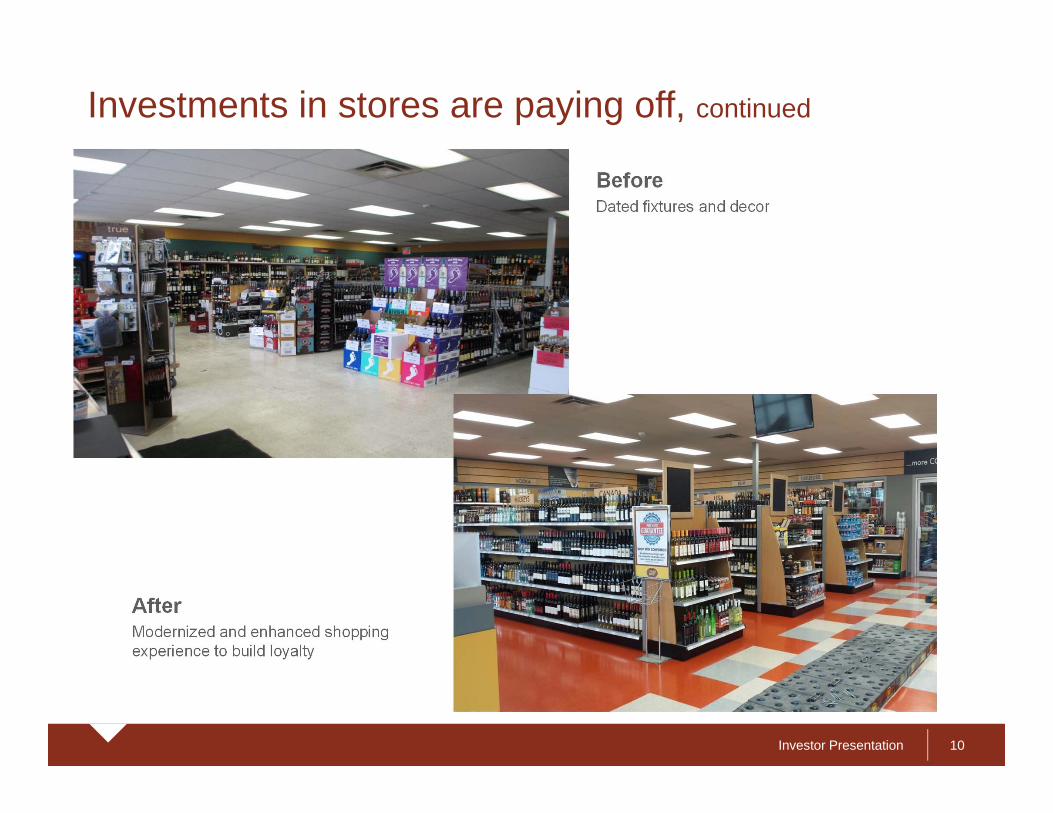
Investments in stores are paying off, continued
10
BeforeDated fixtures and decor
AfterModernized and enhanced shopping experience to build loyalty
Investor Presentation
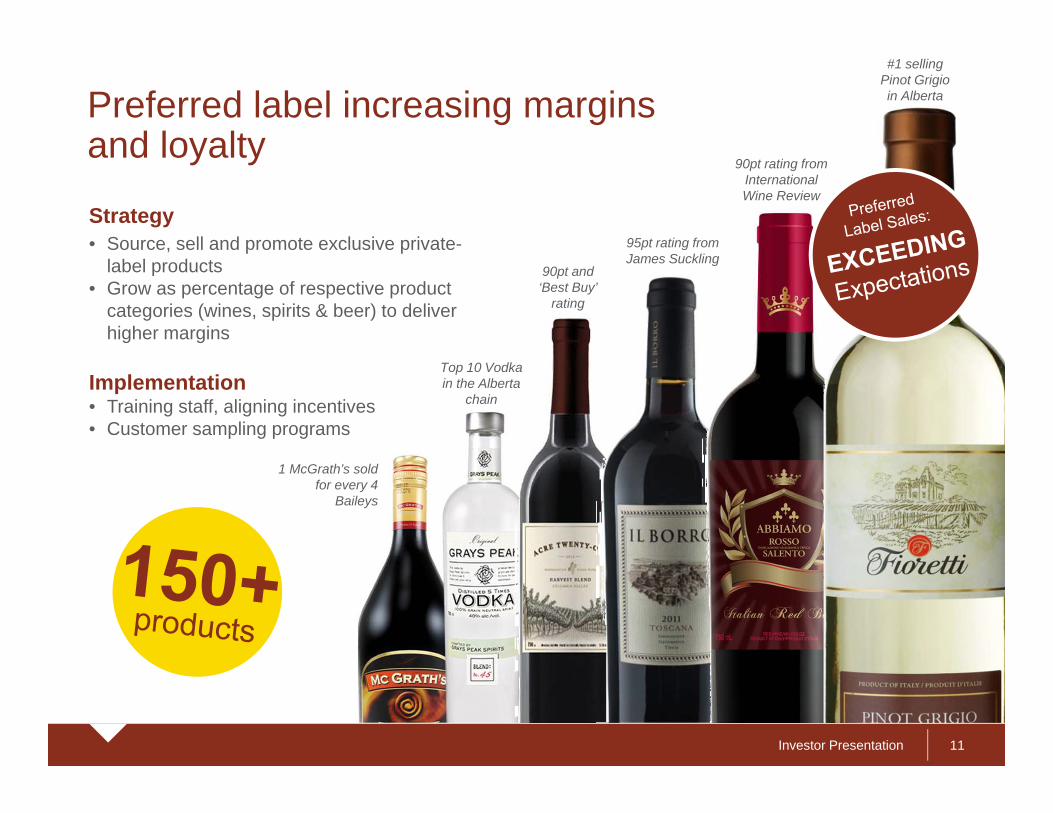
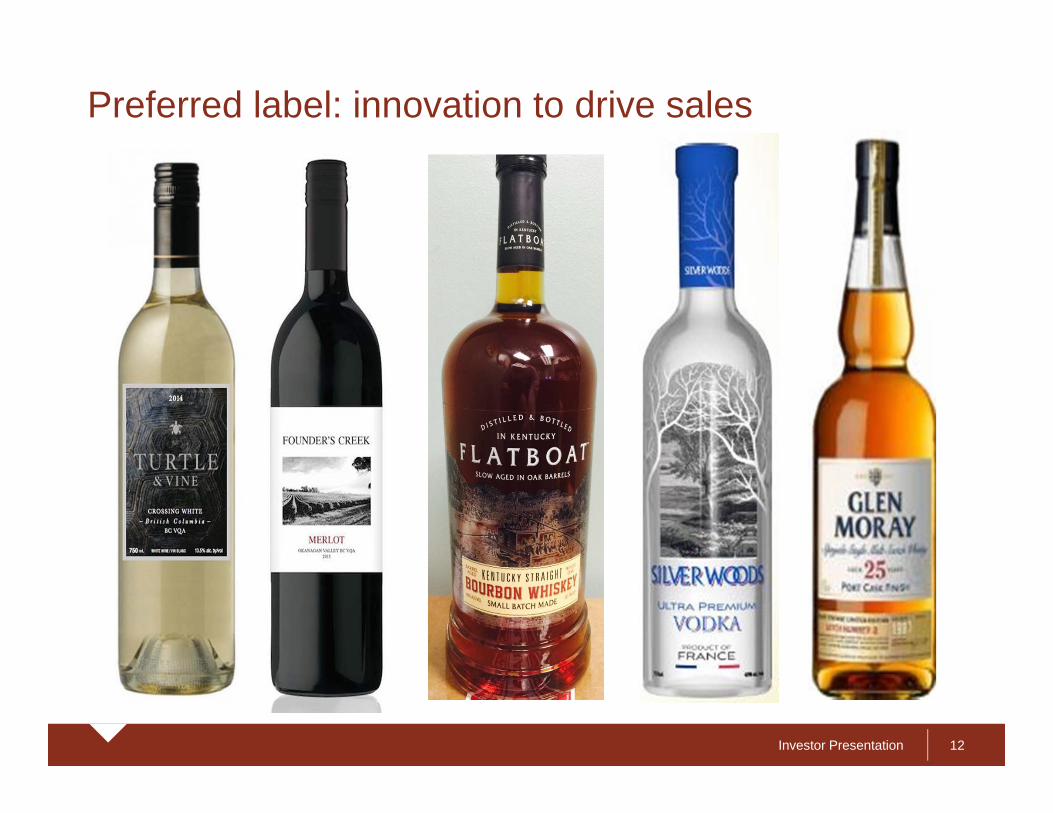
Preferred label increasing margins and loyalty
11
Strategy• Source, sell and promote exclusive private-
label products• Grow as percentage of respective product
categories (wines, spirits & beer) to deliver higher margins
Implementation• Training staff, aligning incentives • Customer sampling programs
1 McGrath’s sold for every 4
Baileys
#1 selling Pinot Grigioin Alberta
Top 10 Vodka in the Alberta
chain
90pt rating from International Wine Review
95pt rating from James Suckling
90pt and ‘Best Buy’
rating
Investor Presentation
Preferred label: innovation to drive sales
12
Investor Presentation 13
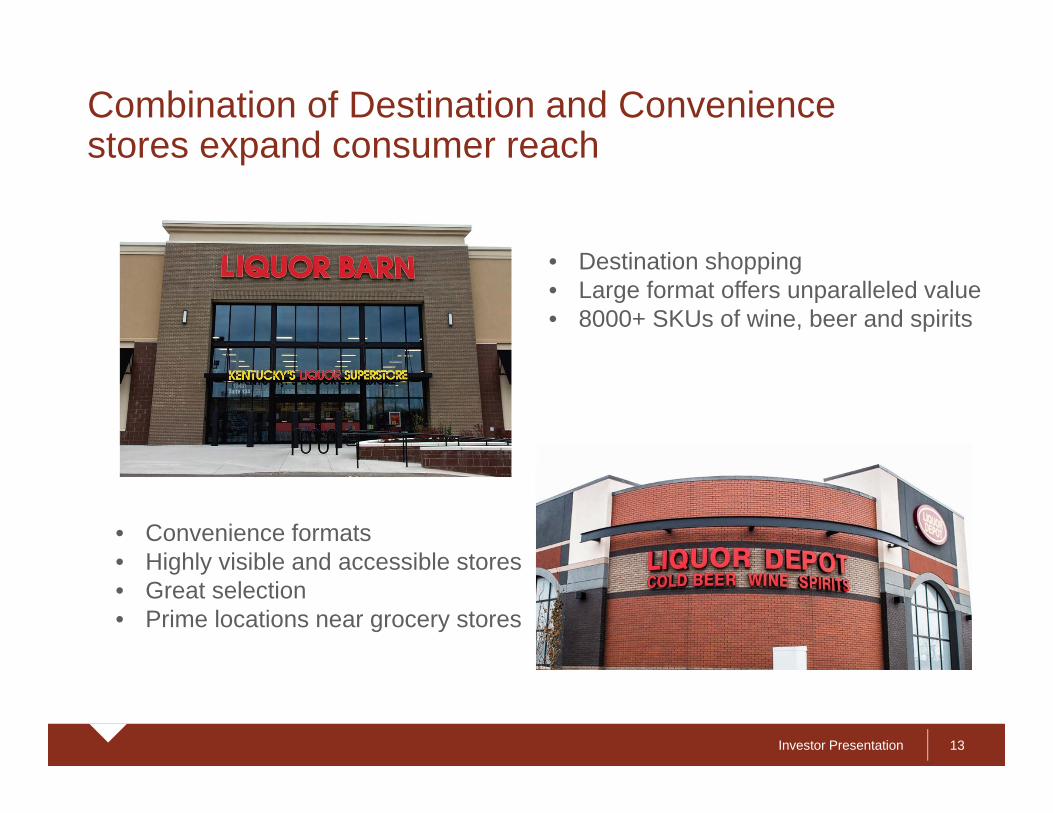
• Convenience formats• Highly visible and accessible stores• Great selection• Prime locations near grocery stores
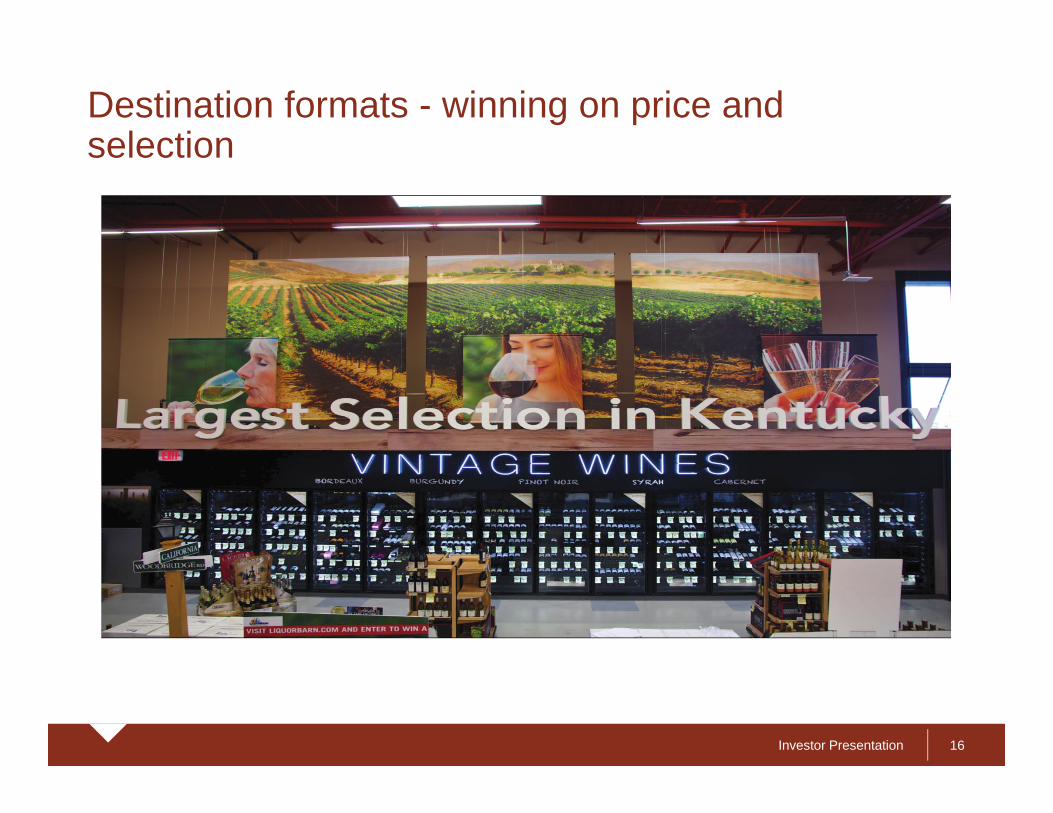
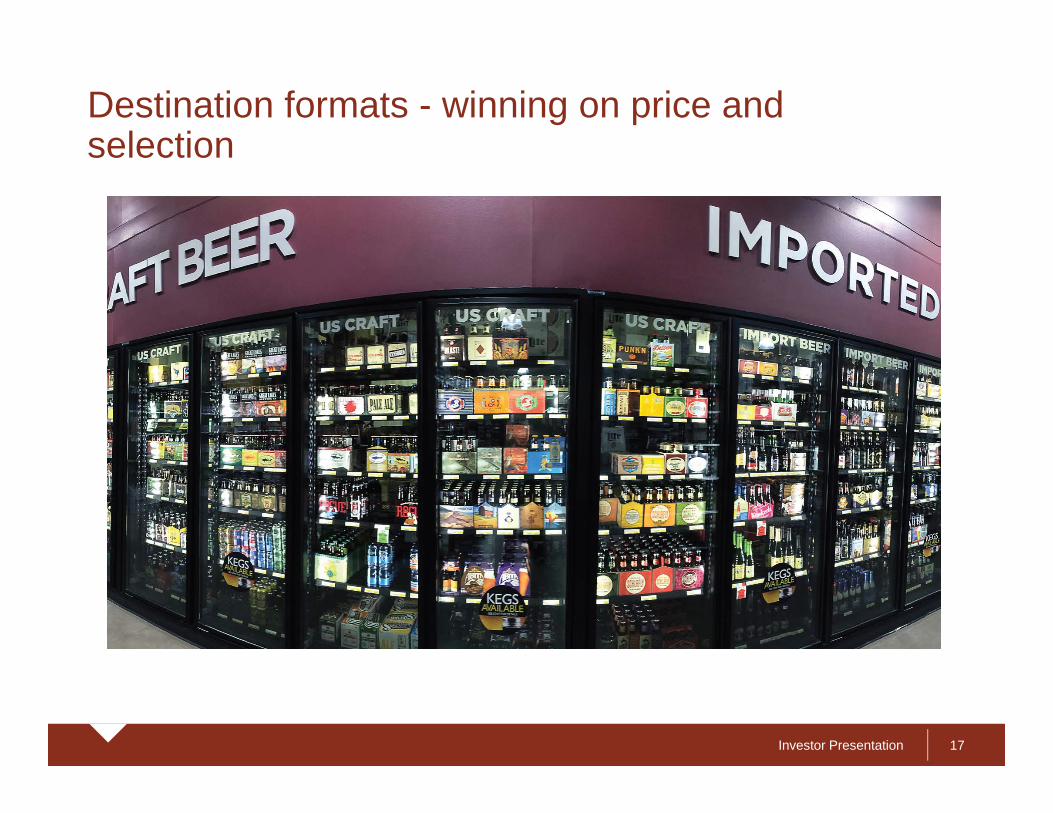
• Destination shopping• Large format offers unparalleled value• 8000+ SKUs of wine, beer and spirits
Combination of Destination and Convenience stores expand consumer reach
Investor Presentation
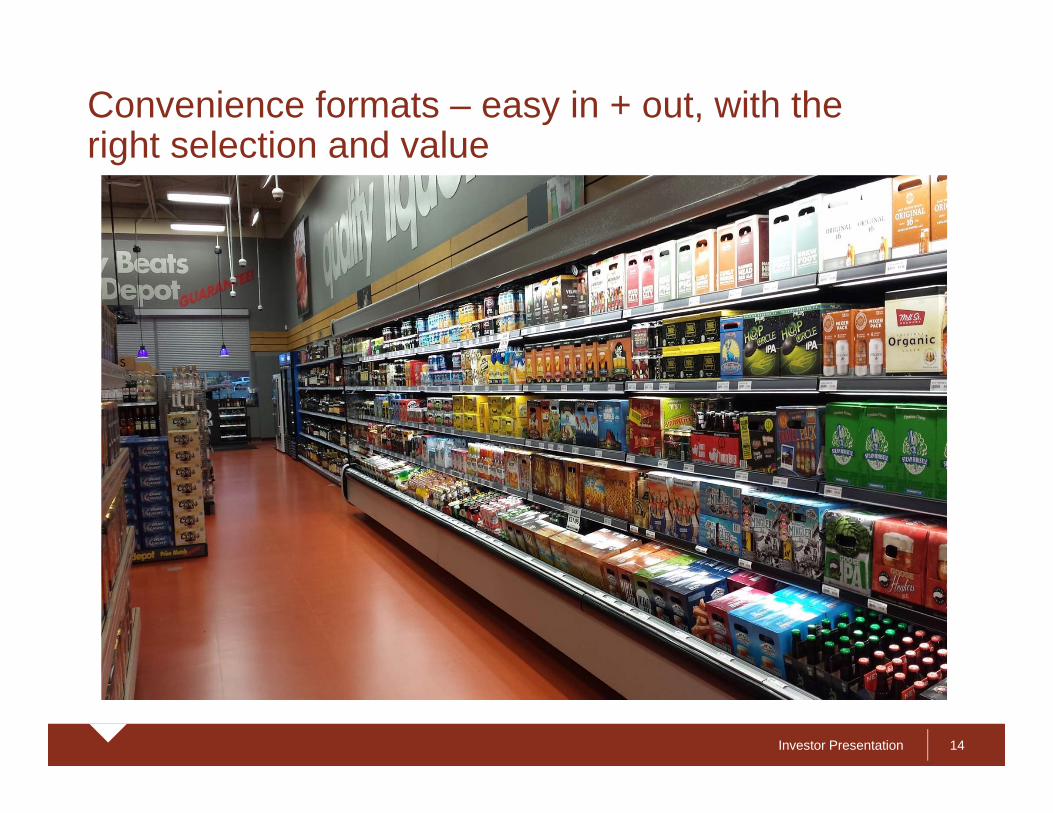
Convenience formats – easy in + out, with the right selection and value
14
Investor Presentation
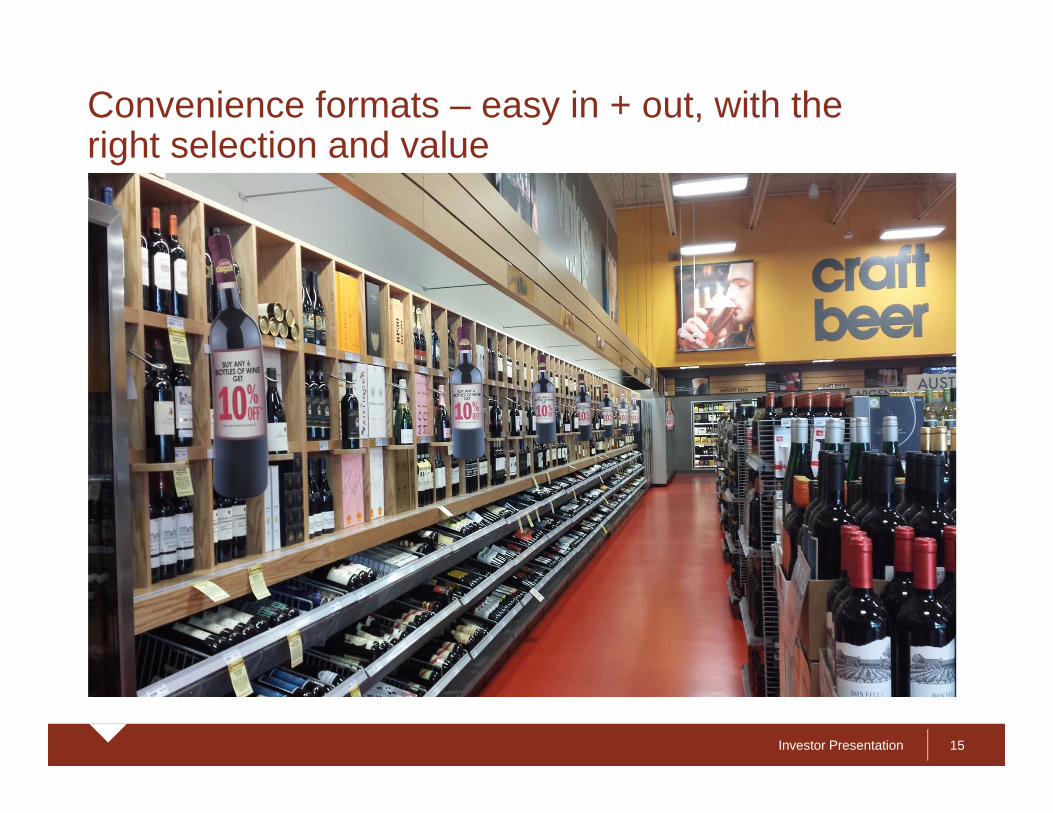
Convenience formats – easy in + out, with the right selection and value
15
Investor Presentation
Destination formats - winning on price and selection
16
Investor Presentation
Destination formats - winning on price and selection
17
Investor Presentation
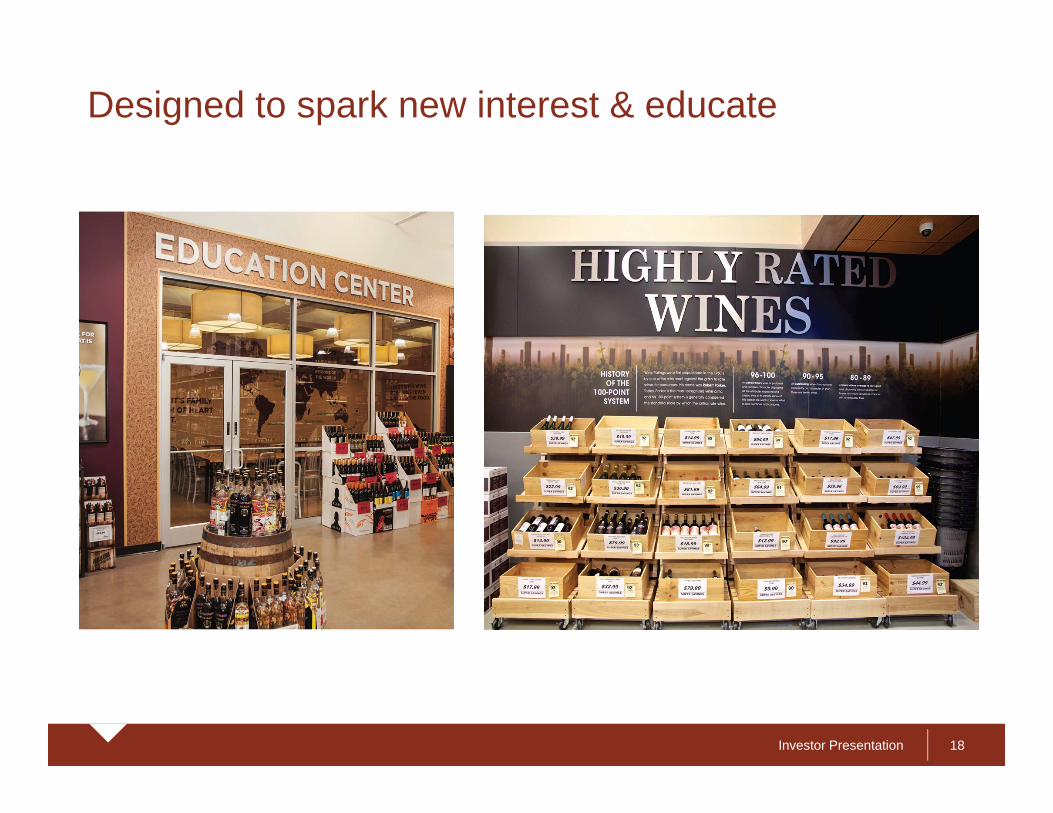
Designed to spark new interest & educate
18
Investor Presentation
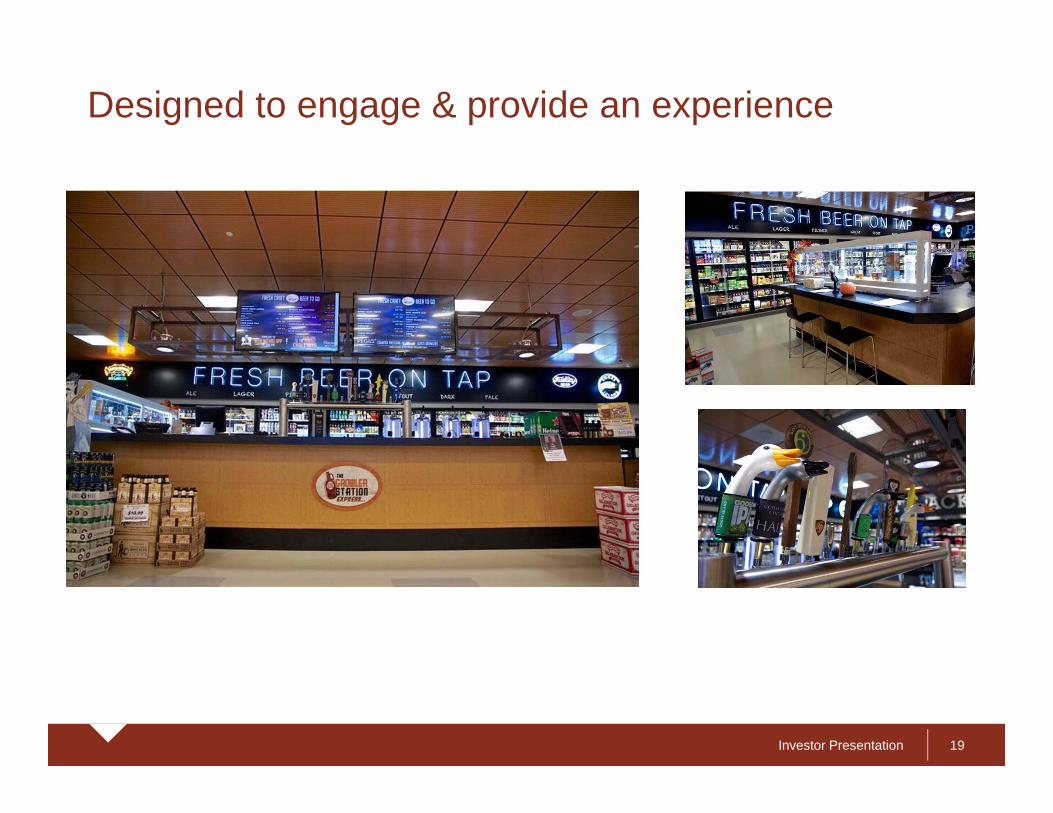
Designed to engage & provide an experience
19
Investor Presentation
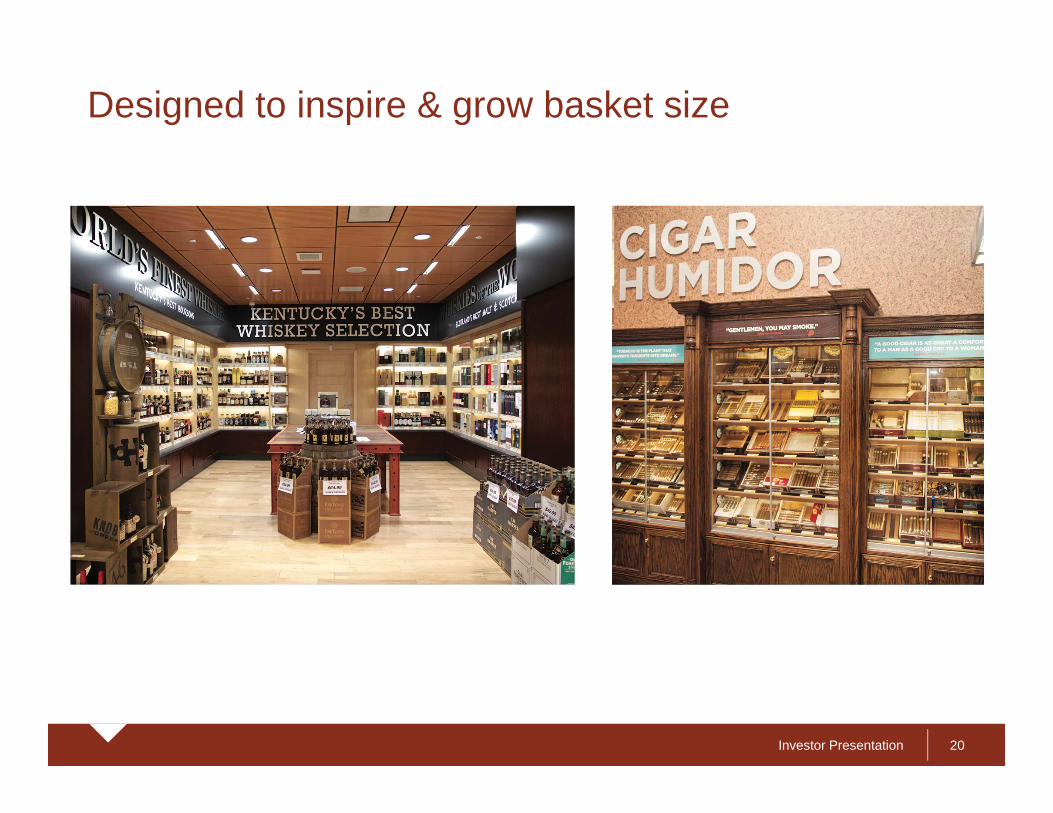
Designed to inspire & grow basket size
20
Investor Presentation
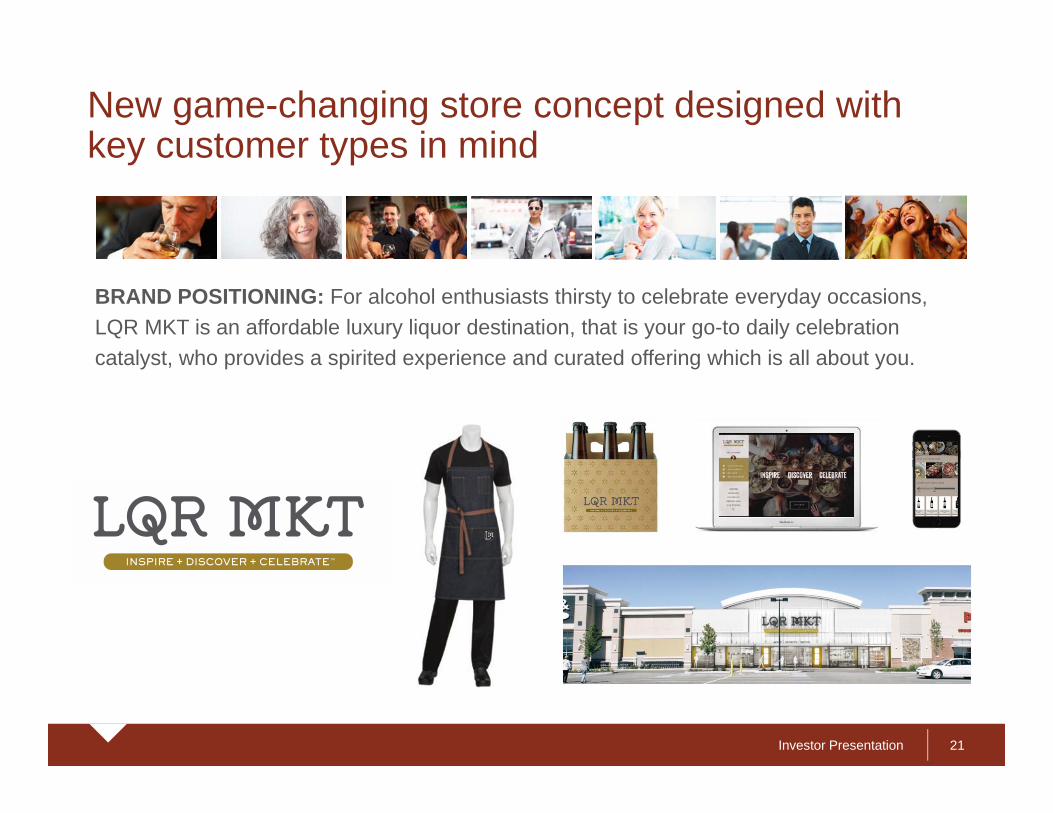
New game-changing store concept designed with key customer types in mind
21
BRAND POSITIONING: For alcohol enthusiasts thirsty to celebrate everyday occasions, LQR MKT is an affordable luxury liquor destination, that is your go-to daily celebration catalyst, who provides a spirited experience and curated offering which is all about you.
Investor Presentation
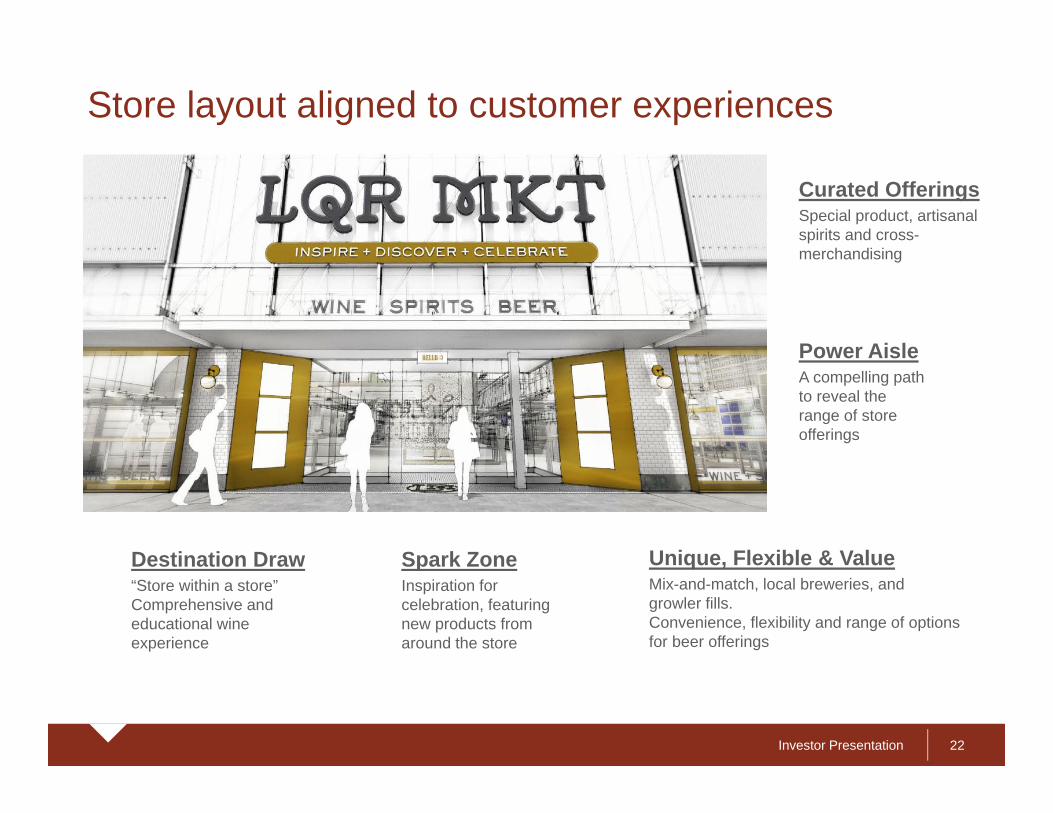
Store layout aligned to customer experiences
22
Spark ZoneInspiration for celebration, featuring new products from around the store
Curated OfferingsSpecial product, artisanal spirits and cross-merchandising
Power AisleA compelling path to reveal the range of store offerings
Destination Draw “Store within a store” Comprehensive and educational wine experience
Unique, Flexible & ValueMix-and-match, local breweries, and growler fills. Convenience, flexibility and range of options for beer offerings
Investor Presentation
Invest + Grow + Celebrate
• Invest • Solid balance sheet and means to invest in the business• 7 Point Plan initiatives proven to deliver
• Grow• Multiple avenues for growth• Measured and flexible approach to growth
• Scale up/down in light of market conditions
• Celebrate • Exciting growth strategy and opportunities for team• Transformation of retail experience for customers• Value creation for shareholders
23
Investor Presentation
Supporting Details
24
Investor Presentation
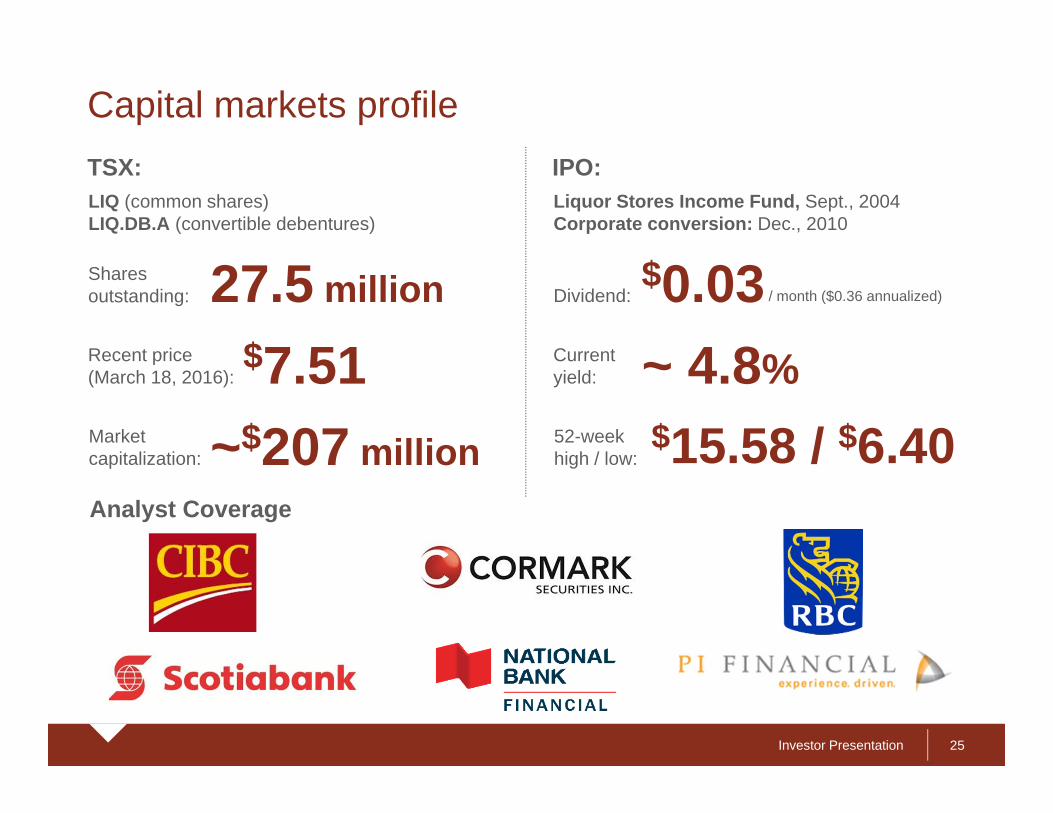
Capital markets profile
25
IPO:TSX:
Analyst Coverage
LIQ (common shares)LIQ.DB.A (convertible debentures)
Shares outstanding:
Market capitalization:
27.5 millionRecent price (March 18, 2016):
$7.51 ~$207 million
Liquor Stores Income Fund, Sept., 2004Corporate conversion: Dec., 2010
Dividend:
52-week high / low:
$0.03Current yield: ~ 4.8%
$15.58 / $6.40
/ month ($0.36 annualized)
Investor Presentation
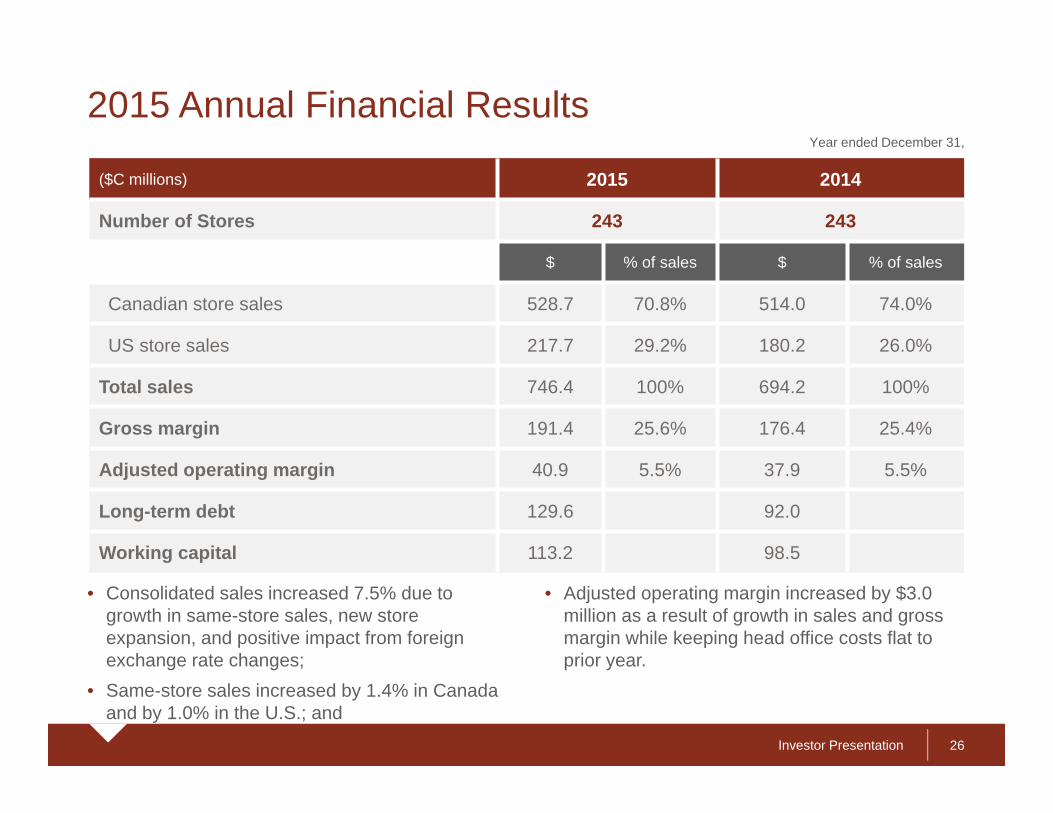
($C millions) 2015 2014
Number of Stores 243 243
$ % of sales $ % of sales
Canadian store sales 528.7 70.8% 514.0 74.0%
US store sales 217.7 29.2% 180.2 26.0%
Total sales 746.4 100% 694.2 100%
Gross margin 191.4 25.6% 176.4 25.4%
Adjusted operating margin 40.9 5.5% 37.9 5.5%
Long-term debt 129.6 92.0
Working capital 113.2 98.5
Year ended December 31,
2015 Annual Financial Results
• Consolidated sales increased 7.5% due to growth in same-store sales, new store expansion, and positive impact from foreign exchange rate changes;
• Same-store sales increased by 1.4% in Canada and by 1.0% in the U.S.; and
• Adjusted operating margin increased by $3.0 million as a result of growth in sales and gross margin while keeping head office costs flat to prior year.
26
Investor Presentation
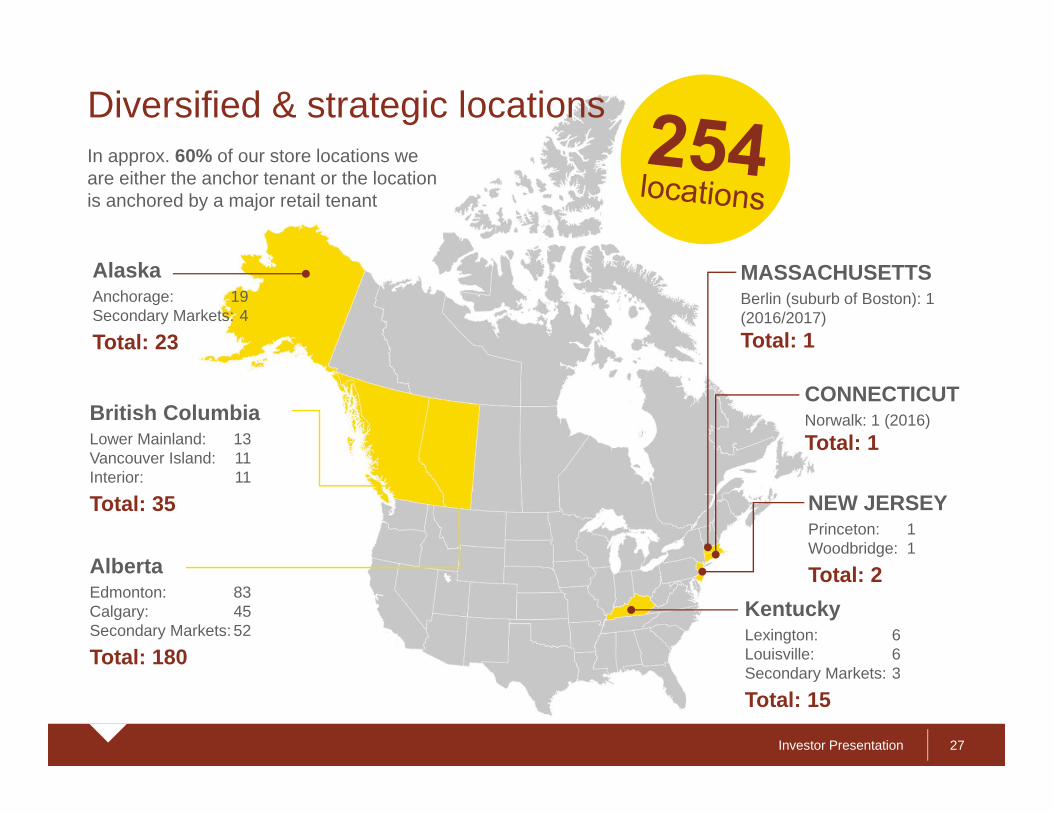
Diversified & strategic locations
27
In approx. 60% of our store locations we are either the anchor tenant or the location is anchored by a major retail tenant
AlaskaAnchorage: 19Secondary Markets: 4
Total: 23
KentuckyLexington: 6Louisville: 6Secondary Markets: 3
Total: 15
British ColumbiaLower Mainland: 13Vancouver Island: 11Interior: 11
Total: 35
AlbertaEdmonton: 83Calgary: 45Secondary Markets: 52
Total: 180
MASSACHUSETTSBerlin (suburb of Boston): 1 (2016/2017)Total: 1
CONNECTICUTNorwalk: 1 (2016)Total: 1
NEW JERSEYPrinceton: 1Woodbridge: 1
Total: 2
Investor Presentation
Non-IFRS Measures• Operating margin as a percentage of sales, adjusted operating margin, adjusting items, and same-store sales are not
measures recognized by IFRS and do not have a standardized meaning prescribed by IFRS. Investors are cautioned thatoperating margin as a percentage of sales, adjusted operating margin, adjusting items, and same-store sales should notreplace net earnings or loss (as determined in accordance with IFRS) as an indicator of the Company's performance, ofits cash flows from operating, investing and financing activities or as a measure of its liquidity and cash flows. TheCompany's method of calculating operating margin as a percentage of sales, adjusted operating margin, adjusting items,and same-store sales may differ from the methods used by other issuers. Therefore, the Company's operating margin asa percentage of sales, adjusted operating margin, adjusting items, and same-store sales may not be comparable tosimilar measures presented by other issuers.
• Same-store sales include sales for stores that have been open 12 full months at the beginning of the reporting period.This is one of the key metrics that we use to assess our performance and provides a useful comparison between periods.Same-store sales exclude: (i) all sales to wholesale customers, (ii) stores where same-store sales have been negativelyimpacted due to sales being shifted to closely-located convenience-focused stores we’ve opened in the last 12 fullmonths, and (iii) stores where same-store sales have increased due to the closure of closely-located stores in the last 12full months.
• Operating margin as a percentage of sales is calculated by dividing operating margin (derived by subtracting Operatingand Administrative expenses from Gross Margin) by sales.
• Adjusted operating margin represents operating margin adjusted for unusual, non-recurring or non-operating factors onboth a consolidated and segmented basis. These factors, referred to as adjusting items, are reconciled and discussed inthe Company’s MD&A for the year ended December 31, 2015.
• Management believes the presentation of adjusted operating margin provides for useful information to investors andshareholders as it provides increased transparency and predictive value. Management uses adjusted operating margin toset targets and assess performance of the Company.
28