Embed Size (px)
Citation preview
962 Krung Kasem Road, Pomprab, Bangkok 10100
NESDB ECONOMIC REPORT
Thai Economic Performance in Q1 and Outlook for 2016 18 พฤษภาคม 2558
Press Release 9.30 a.m. May 16, 2016 Macroeconomic Strategy and Planning Office
Office of the National Economic and Social Development Board (NESDB) www.nesdb.go.th
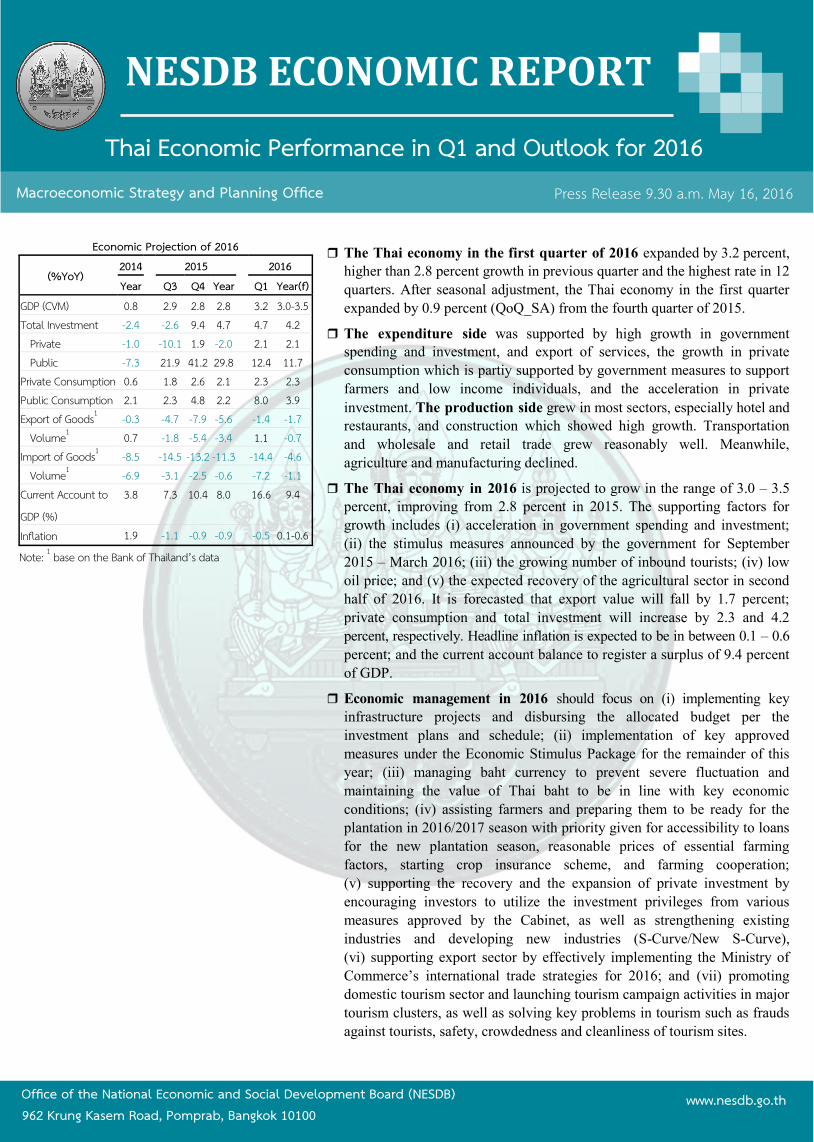
The Thai economy in the first quarter of 2016 expanded by 3.2 percent,
higher than 2.8 percent growth in previous quarter and the highest rate in 12
quarters. After seasonal adjustment, the Thai economy in the first quarter
expanded by 0.9 percent (QoQ_SA) from the fourth quarter of 2015.
The expenditure side was supported by high growth in government
spending and investment, and export of services, the growth in private
consumption which is partiy supported by government measures to support
farmers and low income individuals, and the acceleration in private
investment. The production side grew in most sectors, especially hotel and
restaurants, and construction which showed high growth. Transportation
and wholesale and retail trade grew reasonably well. Meanwhile,
agriculture and manufacturing declined.
The Thai economy in 2016 is projected to grow in the range of 3.0 – 3.5
percent, improving from 2.8 percent in 2015. The supporting factors for
growth includes (i) acceleration in government spending and investment;
(ii) the stimulus measures announced by the government for September
2015 – March 2016; (iii) the growing number of inbound tourists; (iv) low
oil price; and (v) the expected recovery of the agricultural sector in second
half of 2016. It is forecasted that export value will fall by 1.7 percent;
private consumption and total investment will increase by 2.3 and 4.2
percent, respectively. Headline inflation is expected to be in between 0.1 – 0.6
percent; and the current account balance to register a surplus of 9.4 percent
of GDP.
Economic management in 2016 should focus on (i) implementing key
infrastructure projects and disbursing the allocated budget per the
investment plans and schedule; (ii) implementation of key approved
measures under the Economic Stimulus Package for the remainder of this
year; (iii) managing baht currency to prevent severe fluctuation and
maintaining the value of Thai baht to be in line with key economic
conditions; (iv) assisting farmers and preparing them to be ready for the
plantation in 2016/2017 season with priority given for accessibility to loans
for the new plantation season, reasonable prices of essential farming
factors, starting crop insurance scheme, and farming cooperation;
(v) supporting the recovery and the expansion of private investment by
encouraging investors to utilize the investment privileges from various
measures approved by the Cabinet, as well as strengthening existing
industries and developing new industries (S-Curve/New S-Curve), (vi) supporting export sector by effectively implementing the Ministry of
Commerce’s international trade strategies for 2016; and (vii) promoting
domestic tourism sector and launching tourism campaign activities in major
tourism clusters, as well as solving key problems in tourism such as frauds
against tourists, safety, crowdedness and cleanliness of tourism sites.
Economic Projection of 2016
(%YoY) 2014 2015 2016 Year Q3 Q4 Year Q1 Year(f)
GDP (CVM) 0.8 2.9 2.8 2.8 3.2 3.0-3.5 Total Investment -2.4 -2.6 9.4 4.7 4.7 4.2
Private -1.0 -10.1 1.9 -2.0 2.1 2.1 Public -7.3 21.9 41.2 29.8 12.4 11.7
Private Consumption 0.6 1.8 2.6 2.1 2.3 2.3 Public Consumption 2.1 2.3 4.8 2.2 8.0 3.9 Export of Goods1 -0.3 -4.7 -7.9 -5.6 -1.4 -1.7
Volume1 0.7 -1.8 -5.4 -3.4 1.1 -0.7 Import of Goods1 -8.5 -14.5 -13.2 -11.3 -14.4 -4.6
Volume1 -6.9 -3.1 -2.5 -0.6 -7.2 -1.1 Current Account to
GDP (%)
3.8 7.3 10.4 8.0 16.6 9.4
Inflation 1.9 -1.1 -0.9 -0.9 -0.5 0.1-0.6 Note: 1 base on the Bank of Thailand’s data
Macroeconomic Strategy and Planning Office May 16, 2016
Economic Outlook NESDB
2
The Thai economy in the first quarter and the outlook for the remainder of
2016
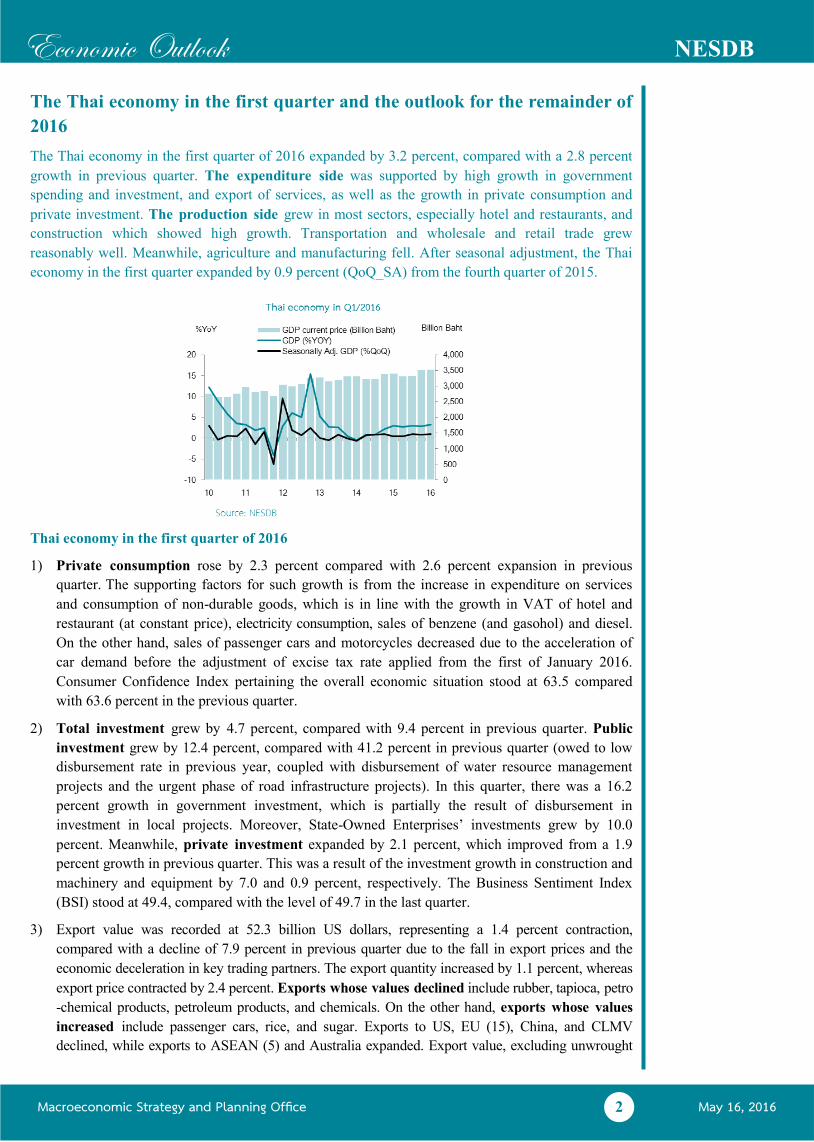
The Thai economy in the first quarter of 2016 expanded by 3.2 percent, compared with a 2.8 percent
growth in previous quarter. The expenditure side was supported by high growth in government
spending and investment, and export of services, as well as the growth in private consumption and
private investment. The production side grew in most sectors, especially hotel and restaurants, and
construction which showed high growth. Transportation and wholesale and retail trade grew
reasonably well. Meanwhile, agriculture and manufacturing fell. After seasonal adjustment, the Thai
economy in the first quarter expanded by 0.9 percent (QoQ_SA) from the fourth quarter of 2015.
Thai economy in the first quarter of 2016
1) Private consumption rose by 2.3 percent compared with 2.6 percent expansion in previous
quarter. The supporting factors for such growth is from the increase in expenditure on services
and consumption of non-durable goods, which is in line with the growth in VAT of hotel and
restaurant (at constant price), electricity consumption, sales of benzene (and gasohol) and diesel.
On the other hand, sales of passenger cars and motorcycles decreased due to the acceleration of
car demand before the adjustment of excise tax rate applied from the first of January 2016.
Consumer Confidence Index pertaining the overall economic situation stood at 63.5 compared
with 63.6 percent in the previous quarter.
2) Total investment grew by 4.7 percent, compared with 9.4 percent in previous quarter. Public
investment grew by 12.4 percent, compared with 41.2 percent in previous quarter (owed to low
disbursement rate in previous year, coupled with disbursement of water resource management
projects and the urgent phase of road infrastructure projects). In this quarter, there was a 16.2
percent growth in government investment, which is partially the result of disbursement in
investment in local projects. Moreover, State-Owned Enterprises’ investments grew by 10.0
percent. Meanwhile, private investment expanded by 2.1 percent, which improved from a 1.9
percent growth in previous quarter. This was a result of the investment growth in construction and
machinery and equipment by 7.0 and 0.9 percent, respectively. The Business Sentiment Index
(BSI) stood at 49.4, compared with the level of 49.7 in the last quarter.
3) Export value was recorded at 52.3 billion US dollars, representing a 1.4 percent contraction,
compared with a decline of 7.9 percent in previous quarter due to the fall in export prices and the
economic deceleration in key trading partners. The export quantity increased by 1.1 percent, whereas
export price contracted by 2.4 percent. Exports whose values declined include rubber, tapioca, petro
-chemical products, petroleum products, and chemicals. On the other hand, exports whose values
increased include passenger cars, rice, and sugar. Exports to US, EU (15), China, and CLMV
declined, while exports to ASEAN (5) and Australia expanded. Export value, excluding unwrought
Macroeconomic Strategy and Planning Office May 16, 2016
Economic Outlook NESDB
3
gold, contracted by 5.1 percent. In baht term, the value of export, recorded at 1,862 billion baht,
increased by 7.7 percent, compared with a growth of 0.9 percent in the previous quarter.
4) Manufacturing sector decreased by 0.3 percent, compared with a 0.8 percent growth in previous
quarter. Industries with positive growth include furniture, machinery and parts, rubber and
plastic products, food and beverages, chemical products. Industries with negative growth
include clothing, vehicles, textiles, and radio and television parts. The Capacity Utilization Rate
(CAPU) stood at 67.3 percent.
5) Hotel and restaurants sector expanded by 15.8 percent, accelerating from 5.0 percent growth in
previous quarter. Number of inbound tourists stood at 9.0 million persons, or a 15.5 percent
growth, accelerating from 3.7 percent growth in the previous quarter. This was owed to the high
number of inbound tourists from Eastern Asia, Europe, United States, South Asia, Middle East
Asia and Africa. The highest numbers of inbound tourists were from China, Malaysia, Korea,
Japan, and Russia, respectively. The tourism revenue amounted to 494.2 billion baht, increased by
21.7 percent. The average occupancy rate was at 69.9 percent, accelerating from 61.8 percent in
the previous quarter.
6) Construction sector expanded by 11.2 percent which slightly contracted from a 23.9 percent
growth in the previous quarter. Both public and private construction expanded. Public
construction rose by 14.9 percent, with 15.3 percent growth in government construction, and 13.9
percent growth in state enterprises construction, respectively. Meanwhile, the private construction
rose by 7.0 percent, which is in line with expansion of condominium project along Bangkok Mass
Transit System routes in Bangkok and vicinities, as well as that of factory construction projects.
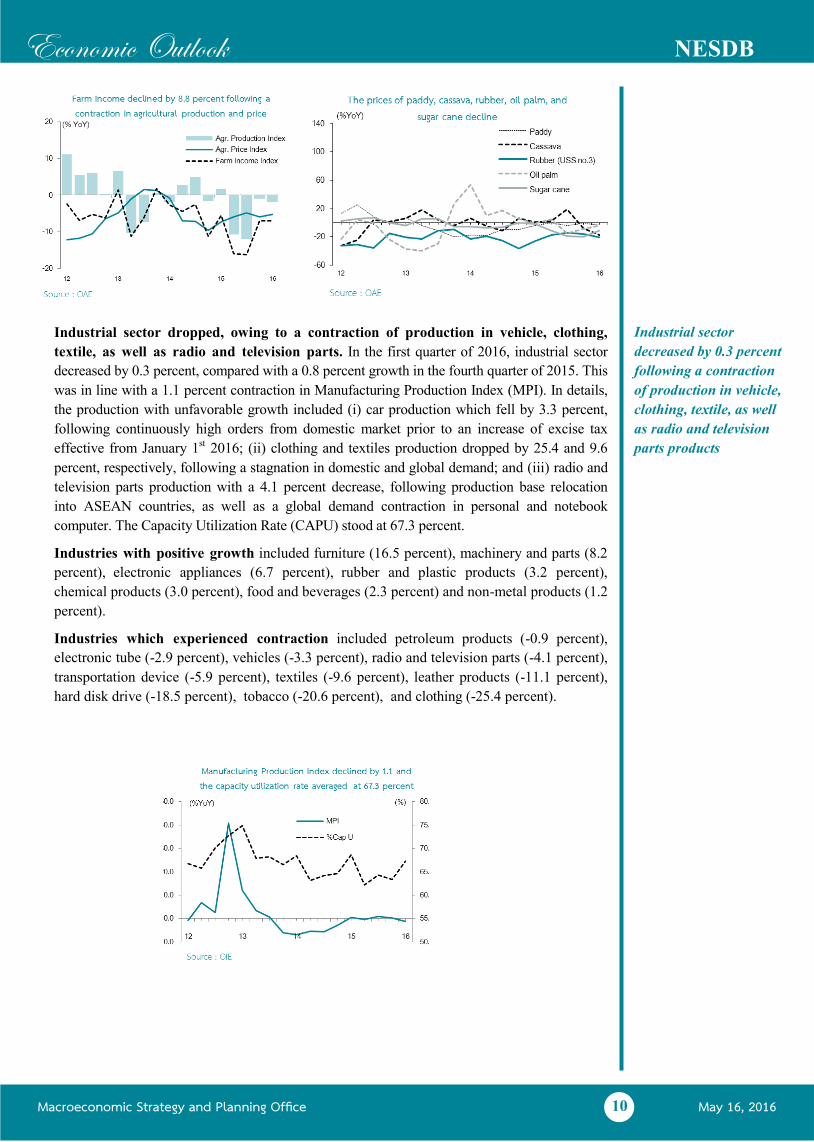
7) Agricultural sector dropped by 1.5 percent, compared with a 2.1 percent contraction in previous
quarter, following a decline in the production of major agricultural products caused by drought.
The crops which experienced a decline include paddy, cassava, maize, and oil palm. Agricultural
Price Index decreased by 5.2 percent. The decreases of major agricultural products and prices led
to lower farmers’ income which dropped by 7.0 percent.
Economic Outlook for 2016
NESDB projects that the Thai economy in 2016 will grow in the range of 3.0 – 3.5 percent,
improving from 2.8 percent in 2015. The supporting factors for growth includes (i) acceleration in
government spending and investment, which expanded relatively well and remained a key supporting
factor for growth since 2015 given the expedited disbursement and increased budget, as well as the
additional annual budget whose disbursement is expected to be around 33,362.7 million baht; (ii) the
push from the 10 stimulus measures announced by the government for September 2015 – March
2016, with a total budget of 645,354 million baht; (iii) the growing number of inbound tourists; (iv) oil
price which is expected to remain low, which will lead to an increase in real private purchasing power,
reduction in business cost, and facilitate the implementation of accommodating monetary policy; and
(v) the expected recovery of the agricultural sector in second half of 2016. It is forecasted that export
value will fall by 1.7 percent, private consumption and total investment will increase by 2.3 and 4.2
percent, respectively. Headline inflation is expected to lie between 0.1 – 0.6 percent. The current
account balance is forecasted to register a surplus of 9.4 percent of GDP.
Macroeconomic Strategy and Planning Office May 16, 2016
Economic Outlook NESDB
4
1. The Thai Economy in Q1/2016
Expenditure Side:
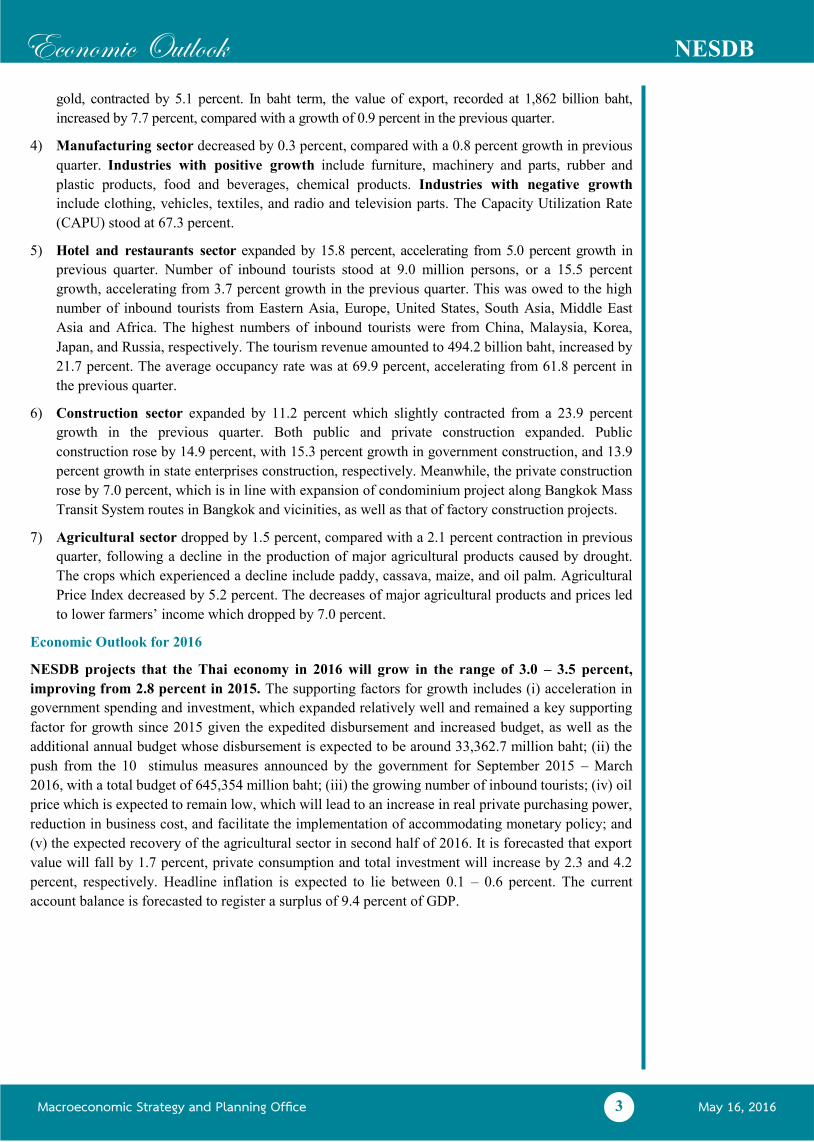
Private consumption continuously increased due to an expansion of consumption
expenditure on non-durable goods. In the first quarter of 2016, private consumption rose by
2.3 percent, compared with 2.6 percent expansion in previous quarter. Sales of benzene (and
gasohol) and diesel increased by 8.8 and 5.8 percent which decelerated from a 12.7 and
6.0 percent expansion, respectively in previous quarter. Meanwhile, electricity consumption
and VAT of hotel and restaurant index at 2010 price grew by 11.0 and 11.5 percent,
respectively, which improved from 8.2 and 4.0 percent expansion, respectively in last quarter.
Sales of passenger cars and motorcycles decreased by 26.6 and 7.7 percent, respectively. Such
fall was due to the acceleration of car demand in last quarter before the adjustment of excise
tax rated applied from the first of January 2016. Consumer Confidence Index pertaining the
overall economic situation stood at 63.5, compared with 63.6 in the previous quarter.
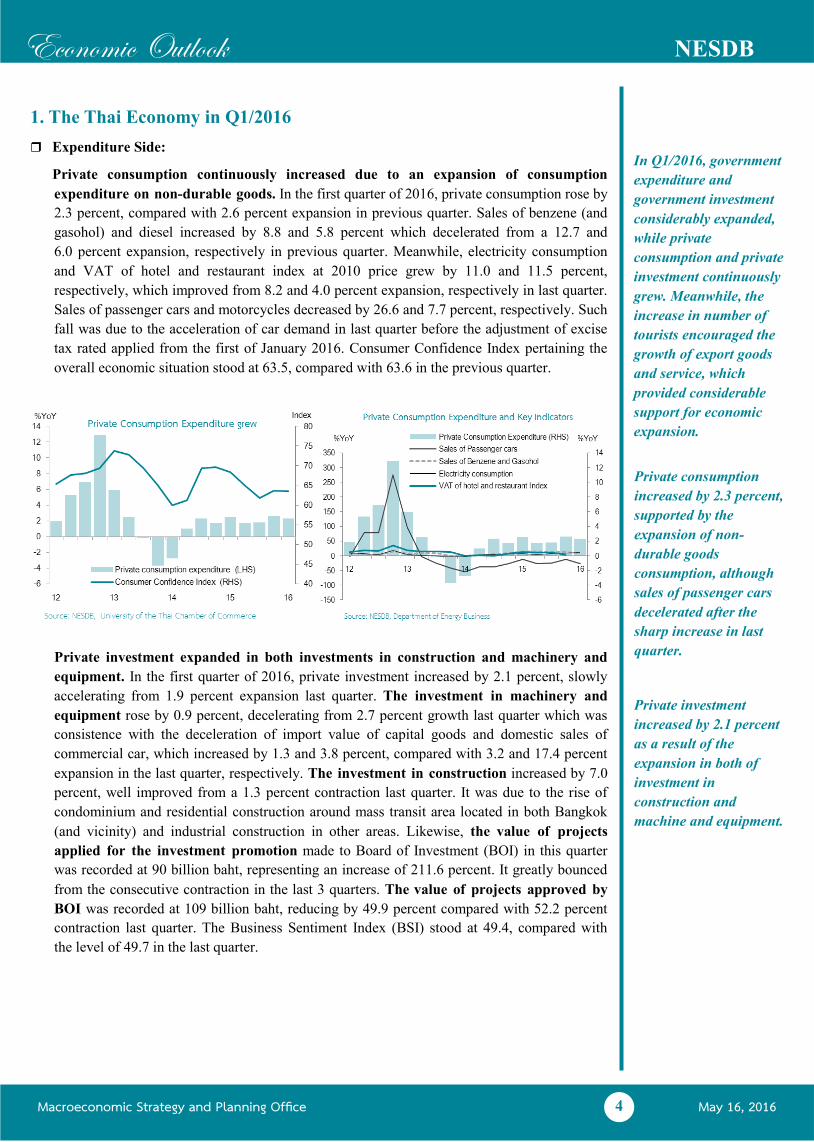
Private investment expanded in both investments in construction and machinery and
equipment. In the first quarter of 2016, private investment increased by 2.1 percent, slowly
accelerating from 1.9 percent expansion last quarter. The investment in machinery and
equipment rose by 0.9 percent, decelerating from 2.7 percent growth last quarter which was
consistence with the deceleration of import value of capital goods and domestic sales of
commercial car, which increased by 1.3 and 3.8 percent, compared with 3.2 and 17.4 percent
expansion in the last quarter, respectively. The investment in construction increased by 7.0
percent, well improved from a 1.3 percent contraction last quarter. It was due to the rise of
condominium and residential construction around mass transit area located in both Bangkok
(and vicinity) and industrial construction in other areas. Likewise, the value of projects
applied for the investment promotion made to Board of Investment (BOI) in this quarter
was recorded at 90 billion baht, representing an increase of 211.6 percent. It greatly bounced
from the consecutive contraction in the last 3 quarters. The value of projects approved by
BOI was recorded at 109 billion baht, reducing by 49.9 percent compared with 52.2 percent
contraction last quarter. The Business Sentiment Index (BSI) stood at 49.4, compared with
the level of 49.7 in the last quarter.
In Q1/2016, government
expenditure and
government investment
considerably expanded,
while private
consumption and private
investment continuously
grew. Meanwhile, the
increase in number of
tourists encouraged the
growth of export goods
and service, which
provided considerable
support for economic
expansion.
Private investment
increased by 2.1 percent
as a result of the
expansion in both of
investment in
construction and
machine and equipment.
Private consumption
increased by 2.3 percent,
supported by the
expansion of non-
durable goods
consumption, although
sales of passenger cars
decelerated after the
sharp increase in last
quarter.
Macroeconomic Strategy and Planning Office May 16, 2016
Economic Outlook NESDB
5
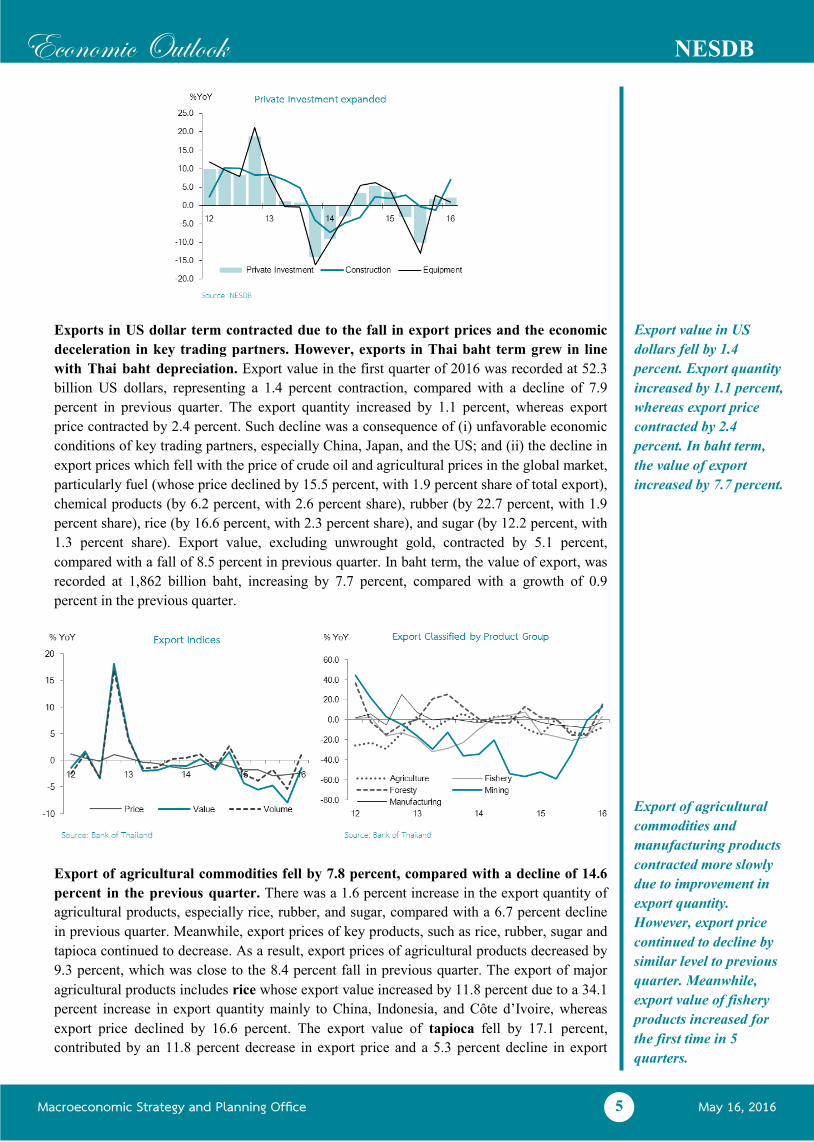
Exports in US dollar term contracted due to the fall in export prices and the economic
deceleration in key trading partners. However, exports in Thai baht term grew in line
with Thai baht depreciation. Export value in the first quarter of 2016 was recorded at 52.3
billion US dollars, representing a 1.4 percent contraction, compared with a decline of 7.9
percent in previous quarter. The export quantity increased by 1.1 percent, whereas export
price contracted by 2.4 percent. Such decline was a consequence of (i) unfavorable economic
conditions of key trading partners, especially China, Japan, and the US; and (ii) the decline in
export prices which fell with the price of crude oil and agricultural prices in the global market,
particularly fuel (whose price declined by 15.5 percent, with 1.9 percent share of total export),
chemical products (by 6.2 percent, with 2.6 percent share), rubber (by 22.7 percent, with 1.9
percent share), rice (by 16.6 percent, with 2.3 percent share), and sugar (by 12.2 percent, with
1.3 percent share). Export value, excluding unwrought gold, contracted by 5.1 percent,
compared with a fall of 8.5 percent in previous quarter. In baht term, the value of export, was
recorded at 1,862 billion baht, increasing by 7.7 percent, compared with a growth of 0.9
percent in the previous quarter.
Export of agricultural commodities fell by 7.8 percent, compared with a decline of 14.6
percent in the previous quarter. There was a 1.6 percent increase in the export quantity of
agricultural products, especially rice, rubber, and sugar, compared with a 6.7 percent decline
in previous quarter. Meanwhile, export prices of key products, such as rice, rubber, sugar and
tapioca continued to decrease. As a result, export prices of agricultural products decreased by
9.3 percent, which was close to the 8.4 percent fall in previous quarter. The export of major
agricultural products includes rice whose export value increased by 11.8 percent due to a 34.1
percent increase in export quantity mainly to China, Indonesia, and Côte d’Ivoire, whereas
export price declined by 16.6 percent. The export value of tapioca fell by 17.1 percent,
contributed by an 11.8 percent decrease in export price and a 5.3 percent decline in export
Export of agricultural
commodities and
manufacturing products
contracted more slowly
due to improvement in
export quantity.
However, export price
continued to decline by
similar level to previous
quarter. Meanwhile,
export value of fishery
products increased for
the first time in 5
quarters.
Export value in US
dollars fell by 1.4
percent. Export quantity
increased by 1.1 percent,
whereas export price
contracted by 2.4
percent. In baht term,
the value of export
increased by 7.7 percent.
Macroeconomic Strategy and Planning Office May 16, 2016
Economic Outlook NESDB
6
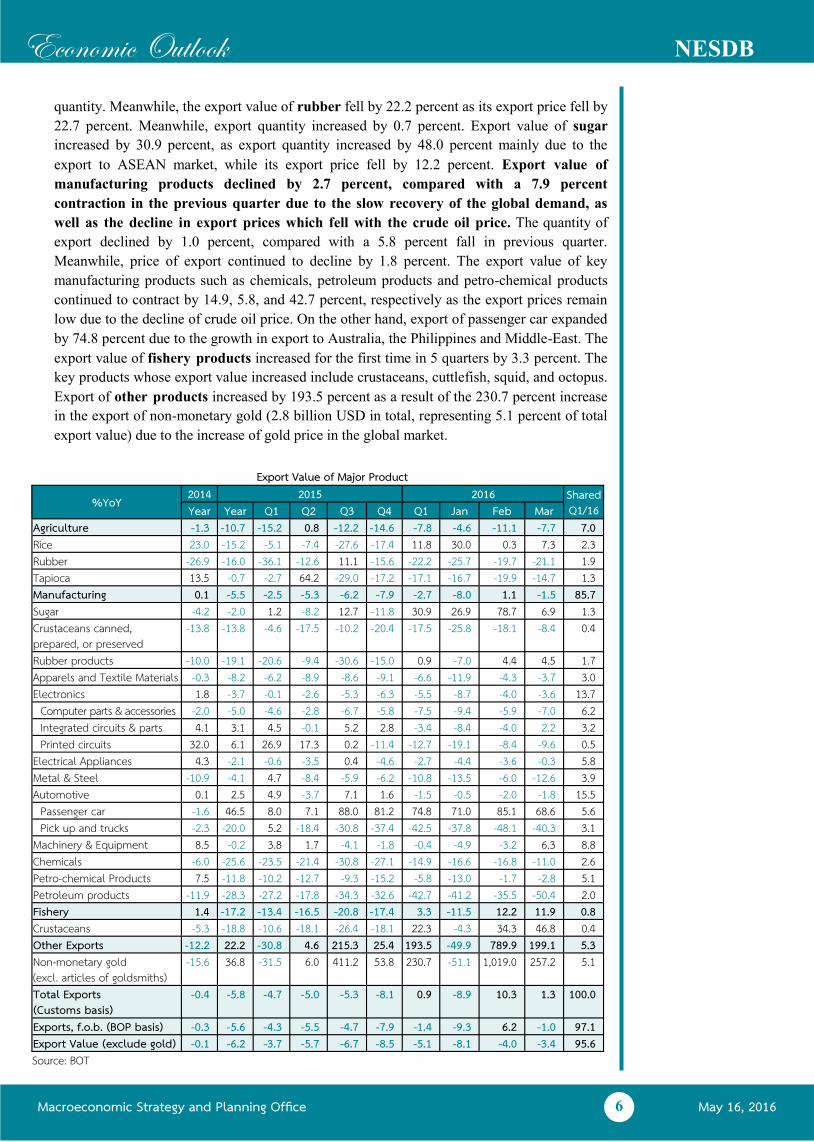
quantity. Meanwhile, the export value of rubber fell by 22.2 percent as its export price fell by
22.7 percent. Meanwhile, export quantity increased by 0.7 percent. Export value of sugar
increased by 30.9 percent, as export quantity increased by 48.0 percent mainly due to the
export to ASEAN market, while its export price fell by 12.2 percent. Export value of
manufacturing products declined by 2.7 percent, compared with a 7.9 percent
contraction in the previous quarter due to the slow recovery of the global demand, as
well as the decline in export prices which fell with the crude oil price. The quantity of
export declined by 1.0 percent, compared with a 5.8 percent fall in previous quarter.
Meanwhile, price of export continued to decline by 1.8 percent. The export value of key
manufacturing products such as chemicals, petroleum products and petro-chemical products
continued to contract by 14.9, 5.8, and 42.7 percent, respectively as the export prices remain
low due to the decline of crude oil price. On the other hand, export of passenger car expanded
by 74.8 percent due to the growth in export to Australia, the Philippines and Middle-East. The
export value of fishery products increased for the first time in 5 quarters by 3.3 percent. The
key products whose export value increased include crustaceans, cuttlefish, squid, and octopus.
Export of other products increased by 193.5 percent as a result of the 230.7 percent increase
in the export of non-monetary gold (2.8 billion USD in total, representing 5.1 percent of total
export value) due to the increase of gold price in the global market.
Export Value of Major Product
%YoY 2014 2015 2016 Shared Q1/16 Year Year Q1 Q2 Q3 Q4 Q1 Jan Feb Mar
Agriculture -1.3 -10.7 -15.2 0.8 -12.2 -14.6 -7.8 -4.6 -11.1 -7.7 7.0 Rice 23.0 -15.2 -5.1 -7.4 -27.6 -17.4 11.8 30.0 0.3 7.3 2.3 Rubber -26.9 -16.0 -36.1 -12.6 11.1 -15.6 -22.2 -25.7 -19.7 -21.1 1.9 Tapioca 13.5 -0.7 -2.7 64.2 -29.0 -17.2 -17.1 -16.7 -19.9 -14.7 1.3 Manufacturing 0.1 -5.5 -2.5 -5.3 -6.2 -7.9 -2.7 -8.0 1.1 -1.5 85.7 Sugar -4.2 -2.0 1.2 -8.2 12.7 -11.8 30.9 26.9 78.7 6.9 1.3 Crustaceans canned, prepared, or preserved
-13.8 -13.8 -4.6 -17.5 -10.2 -20.4 -17.5 -25.8 -18.1 -8.4 0.4
Rubber products -10.0 -19.1 -20.6 -9.4 -30.6 -15.0 0.9 -7.0 4.4 4.5 1.7 Apparels and Textile Materials -0.3 -8.2 -6.2 -8.9 -8.6 -9.1 -6.6 -11.9 -4.3 -3.7 3.0 Electronics 1.8 -3.7 -0.1 -2.6 -5.3 -6.3 -5.5 -8.7 -4.0 -3.6 13.7
Computer parts & accessories -2.0 -5.0 -4.6 -2.8 -6.7 -5.8 -7.5 -9.4 -5.9 -7.0 6.2 Integrated circuits & parts 4.1 3.1 4.5 -0.1 5.2 2.8 -3.4 -8.4 -4.0 2.2 3.2 Printed circuits 32.0 6.1 26.9 17.3 0.2 -11.4 -12.7 -19.1 -8.4 -9.6 0.5
Electrical Appliances 4.3 -2.1 -0.6 -3.5 0.4 -4.6 -2.7 -4.4 -3.6 -0.3 5.8 Metal & Steel -10.9 -4.1 4.7 -8.4 -5.9 -6.2 -10.8 -13.5 -6.0 -12.6 3.9 Automotive 0.1 2.5 4.9 -3.7 7.1 1.6 -1.5 -0.5 -2.0 -1.8 15.5
Passenger car -1.6 46.5 8.0 7.1 88.0 81.2 74.8 71.0 85.1 68.6 5.6 Pick up and trucks -2.3 -20.0 5.2 -18.4 -30.8 -37.4 -42.5 -37.8 -48.1 -40.3 3.1
Machinery & Equipment 8.5 -0.2 3.8 1.7 -4.1 -1.8 -0.4 -4.9 -3.2 6.3 8.8 Chemicals -6.0 -25.6 -23.5 -21.4 -30.8 -27.1 -14.9 -16.6 -16.8 -11.0 2.6 Petro-chemical Products 7.5 -11.8 -10.2 -12.7 -9.3 -15.2 -5.8 -13.0 -1.7 -2.8 5.1 Petroleum products -11.9 -28.3 -27.2 -17.8 -34.3 -32.6 -42.7 -41.2 -35.5 -50.4 2.0 Fishery 1.4 -17.2 -13.4 -16.5 -20.8 -17.4 3.3 -11.5 12.2 11.9 0.8 Crustaceans -5.3 -18.8 -10.6 -18.1 -26.4 -18.1 22.3 -4.3 34.3 46.8 0.4 Other Exports -12.2 22.2 -30.8 4.6 215.3 25.4 193.5 -49.9 789.9 199.1 5.3 Non-monetary gold (excl. articles of goldsmiths)
-15.6 36.8 -31.5 6.0 411.2 53.8 230.7 -51.1 1,019.0 257.2 5.1
Total Exports (Customs basis)
-0.4 -5.8 -4.7 -5.0 -5.3 -8.1 0.9 -8.9 10.3 1.3 100.0
Exports, f.o.b. (BOP basis) -0.3 -5.6 -4.3 -5.5 -4.7 -7.9 -1.4 -9.3 6.2 -1.0 97.1 Export Value (exclude gold) -0.1 -6.2 -3.7 -5.7 -6.7 -8.5 -5.1 -8.1 -4.0 -3.4 95.6 Source: BOT
Macroeconomic Strategy and Planning Office May 16, 2016
Economic Outlook NESDB
7
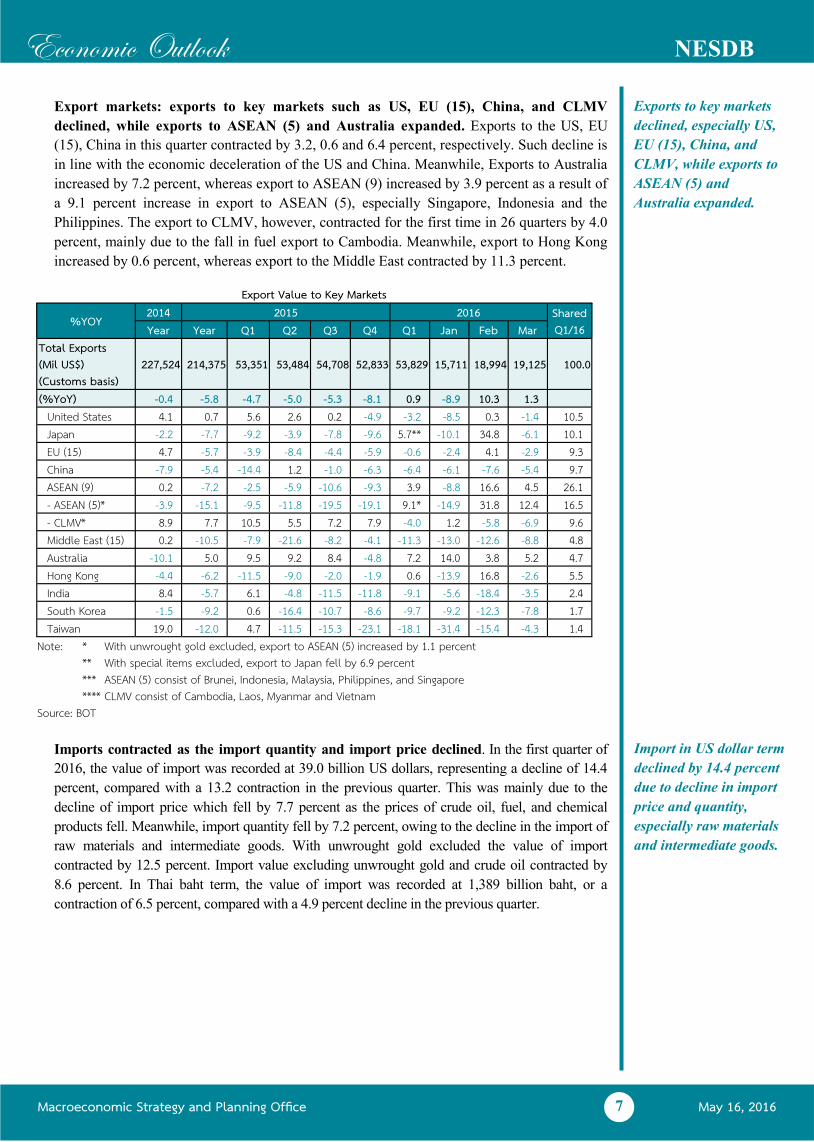
Export markets: exports to key markets such as US, EU (15), China, and CLMV
declined, while exports to ASEAN (5) and Australia expanded. Exports to the US, EU
(15), China in this quarter contracted by 3.2, 0.6 and 6.4 percent, respectively. Such decline is
in line with the economic deceleration of the US and China. Meanwhile, Exports to Australia
increased by 7.2 percent, whereas export to ASEAN (9) increased by 3.9 percent as a result of
a 9.1 percent increase in export to ASEAN (5), especially Singapore, Indonesia and the
Philippines. The export to CLMV, however, contracted for the first time in 26 quarters by 4.0
percent, mainly due to the fall in fuel export to Cambodia. Meanwhile, export to Hong Kong
increased by 0.6 percent, whereas export to the Middle East contracted by 11.3 percent.
Imports contracted as the import quantity and import price declined. In the first quarter of
2016, the value of import was recorded at 39.0 billion US dollars, representing a decline of 14.4
percent, compared with a 13.2 contraction in the previous quarter. This was mainly due to the
decline of import price which fell by 7.7 percent as the prices of crude oil, fuel, and chemical
products fell. Meanwhile, import quantity fell by 7.2 percent, owing to the decline in the import of
raw materials and intermediate goods. With unwrought gold excluded the value of import
contracted by 12.5 percent. Import value excluding unwrought gold and crude oil contracted by
8.6 percent. In Thai baht term, the value of import was recorded at 1,389 billion baht, or a
contraction of 6.5 percent, compared with a 4.9 percent decline in the previous quarter.
Exports to key markets
declined, especially US,
EU (15), China, and
CLMV, while exports to
ASEAN (5) and
Australia expanded.
Import in US dollar term
declined by 14.4 percent
due to decline in import
price and quantity,
especially raw materials
and intermediate goods.
Export Value to Key Markets
%YOY 2014 2015 Shared
Q1/16 2016
Year Year Q1 Q2 Q3 Q4 Q1 Jan Feb Mar Total Exports (Mil US$) (Customs basis)
227,524 214,375 53,351 53,484 54,708 52,833 53,829 15,711 18,994 19,125 100.0
(%YoY) -0.4 -5.8 -4.7 -5.0 -5.3 -8.1 0.9 -8.9 10.3 1.3 United States 4.1 0.7 5.6 2.6 0.2 -4.9 -3.2 -8.5 0.3 -1.4 10.5 Japan -2.2 -7.7 -9.2 -3.9 -7.8 -9.6 5.7** -10.1 34.8 -6.1 10.1 EU (15) 4.7 -5.7 -3.9 -8.4 -4.4 -5.9 -0.6 -2.4 4.1 -2.9 9.3 China -7.9 -5.4 -14.4 1.2 -1.0 -6.3 -6.4 -6.1 -7.6 -5.4 9.7 ASEAN (9) 0.2 -7.2 -2.5 -5.9 -10.6 -9.3 3.9 -8.8 16.6 4.5 26.1 - ASEAN (5)* -3.9 -15.1 -9.5 -11.8 -19.5 -19.1 9.1* -14.9 31.8 12.4 16.5 - CLMV* 8.9 7.7 10.5 5.5 7.2 7.9 -4.0 1.2 -5.8 -6.9 9.6 Middle East (15) 0.2 -10.5 -7.9 -21.6 -8.2 -4.1 -11.3 -13.0 -12.6 -8.8 4.8 Australia -10.1 5.0 9.5 9.2 8.4 -4.8 7.2 14.0 3.8 5.2 4.7 Hong Kong -4.4 -6.2 -11.5 -9.0 -2.0 -1.9 0.6 -13.9 16.8 -2.6 5.5 India 8.4 -5.7 6.1 -4.8 -11.5 -11.8 -9.1 -5.6 -18.4 -3.5 2.4 South Korea -1.5 -9.2 0.6 -16.4 -10.7 -8.6 -9.7 -9.2 -12.3 -7.8 1.7 Taiwan 19.0 -12.0 4.7 -11.5 -15.3 -23.1 -18.1 -31.4 -15.4 -4.3 1.4
Note: * With unwrought gold excluded, export to ASEAN (5) increased by 1.1 percent ** With special items excluded, export to Japan fell by 6.9 percent *** ASEAN (5) consist of Brunei, Indonesia, Malaysia, Philippines, and Singapore **** CLMV consist of Cambodia, Laos, Myanmar and Vietnam
Source: BOT
Macroeconomic Strategy and Planning Office May 16, 2016
Economic Outlook NESDB
8
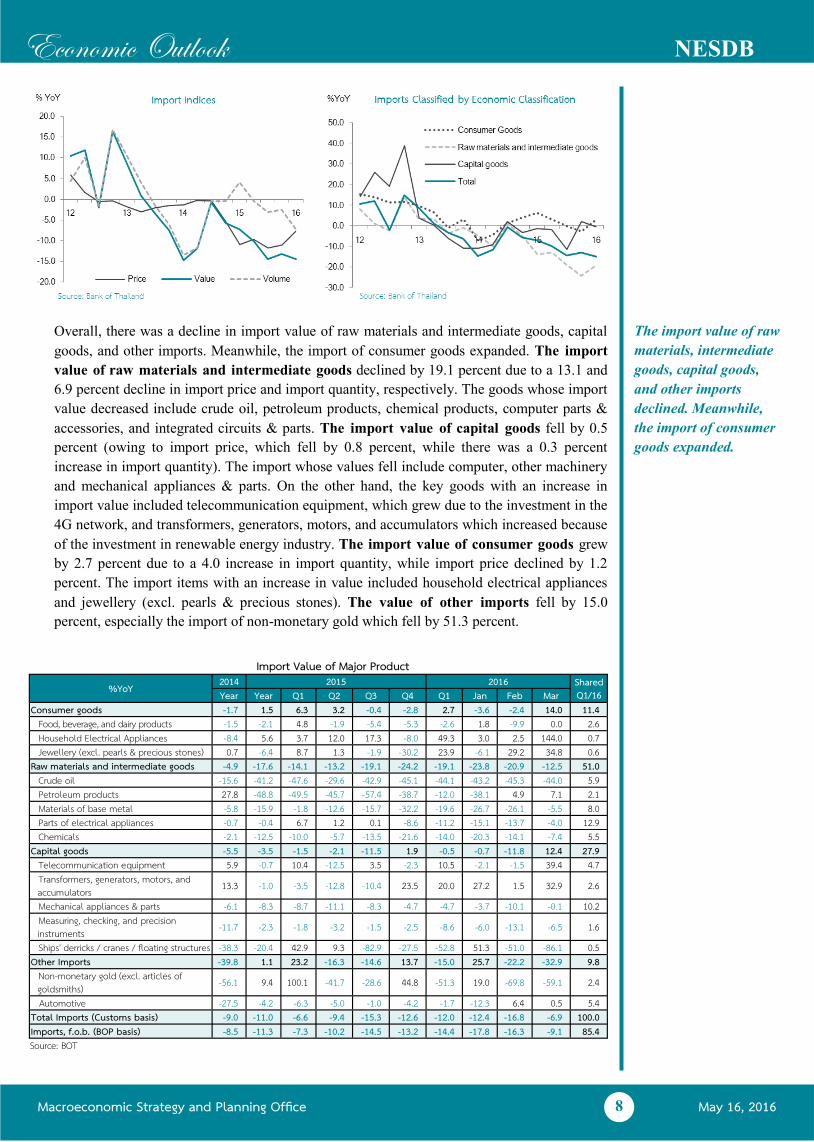
Overall, there was a decline in import value of raw materials and intermediate goods, capital
goods, and other imports. Meanwhile, the import of consumer goods expanded. The import
value of raw materials and intermediate goods declined by 19.1 percent due to a 13.1 and
6.9 percent decline in import price and import quantity, respectively. The goods whose import
value decreased include crude oil, petroleum products, chemical products, computer parts &
accessories, and integrated circuits & parts. The import value of capital goods fell by 0.5
percent (owing to import price, which fell by 0.8 percent, while there was a 0.3 percent
increase in import quantity). The import whose values fell include computer, other machinery
and mechanical appliances & parts. On the other hand, the key goods with an increase in
import value included telecommunication equipment, which grew due to the investment in the
4G network, and transformers, generators, motors, and accumulators which increased because
of the investment in renewable energy industry. The import value of consumer goods grew
by 2.7 percent due to a 4.0 increase in import quantity, while import price declined by 1.2
percent. The import items with an increase in value included household electrical appliances
and jewellery (excl. pearls & precious stones). The value of other imports fell by 15.0
percent, especially the import of non-monetary gold which fell by 51.3 percent.
The import value of raw
materials, intermediate
goods, capital goods,
and other imports
declined. Meanwhile,
the import of consumer
goods expanded.
Import Value of Major Product %YoY 2014 2015 2016 Shared
Q1/16 Year Year Q1 Q2 Q3 Q4 Q1 Jan Feb Mar Consumer goods -1.7 1.5 6.3 3.2 -0.4 -2.8 2.7 -3.6 -2.4 14.0 11.4
Food, beverage, and dairy products -1.5 -2.1 4.8 -1.9 -5.4 -5.3 -2.6 1.8 -9.9 0.0 2.6 Household Electrical Appliances -8.4 5.6 3.7 12.0 17.3 -8.0 49.3 3.0 2.5 144.0 0.7 Jewellery (excl. pearls & precious stones) 0.7 -6.4 8.7 1.3 -1.9 -30.2 23.9 -6.1 29.2 34.8 0.6
Raw materials and intermediate goods -4.9 -17.6 -14.1 -13.2 -19.1 -24.2 -19.1 -23.8 -20.9 -12.5 51.0 Crude oil -15.6 -41.2 -47.6 -29.6 -42.9 -45.1 -44.1 -43.2 -45.3 -44.0 5.9 Petroleum products 27.8 -48.8 -49.5 -45.7 -57.4 -38.7 -12.0 -38.1 4.9 7.1 2.1 Materials of base metal -5.8 -15.9 -1.8 -12.6 -15.7 -32.2 -19.6 -26.7 -26.1 -5.5 8.0 Parts of electrical appliances -0.7 -0.4 6.7 1.2 0.1 -8.6 -11.2 -15.1 -13.7 -4.0 12.9 Chemicals -2.1 -12.5 -10.0 -5.7 -13.5 -21.6 -14.0 -20.3 -14.1 -7.4 5.5
Capital goods -5.5 -3.5 -1.5 -2.1 -11.5 1.9 -0.5 -0.7 -11.8 12.4 27.9 Telecommunication equipment 5.9 -0.7 10.4 -12.5 3.5 -2.3 10.5 -2.1 -1.5 39.4 4.7 Transformers, generators, motors, and accumulators 13.3 -1.0 -3.5 -12.8 -10.4 23.5 20.0 27.2 1.5 32.9 2.6
Mechanical appliances & parts -6.1 -8.3 -8.7 -11.1 -8.3 -4.7 -4.7 -3.7 -10.1 -0.1 10.2 Measuring, checking, and precision instruments -11.7 -2.3 -1.8 -3.2 -1.5 -2.5 -8.6 -6.0 -13.1 -6.5 1.6
Ships' derricks / cranes / floating structures -38.3 -20.4 42.9 9.3 -82.9 -27.5 -52.8 51.3 -51.0 -86.1 0.5 Other Imports -39.8 1.1 23.2 -16.3 -14.6 13.7 -15.0 25.7 -22.2 -32.9 9.8
Non-monetary gold (excl. articles of goldsmiths) -56.1 9.4 100.1 -41.7 -28.6 44.8 -51.3 19.0 -69.8 -59.1 2.4
Automotive -27.5 -4.2 -6.3 -5.0 -1.0 -4.2 -1.7 -12.3 6.4 0.5 5.4 Total Imports (Customs basis) -9.0 -11.0 -6.6 -9.4 -15.3 -12.6 -12.0 -12.4 -16.8 -6.9 100.0 Imports, f.o.b. (BOP basis) -8.5 -11.3 -7.3 -10.2 -14.5 -13.2 -14.4 -17.8 -16.3 -9.1 85.4 Source: BOT
Macroeconomic Strategy and Planning Office May 16, 2016
Economic Outlook NESDB
9
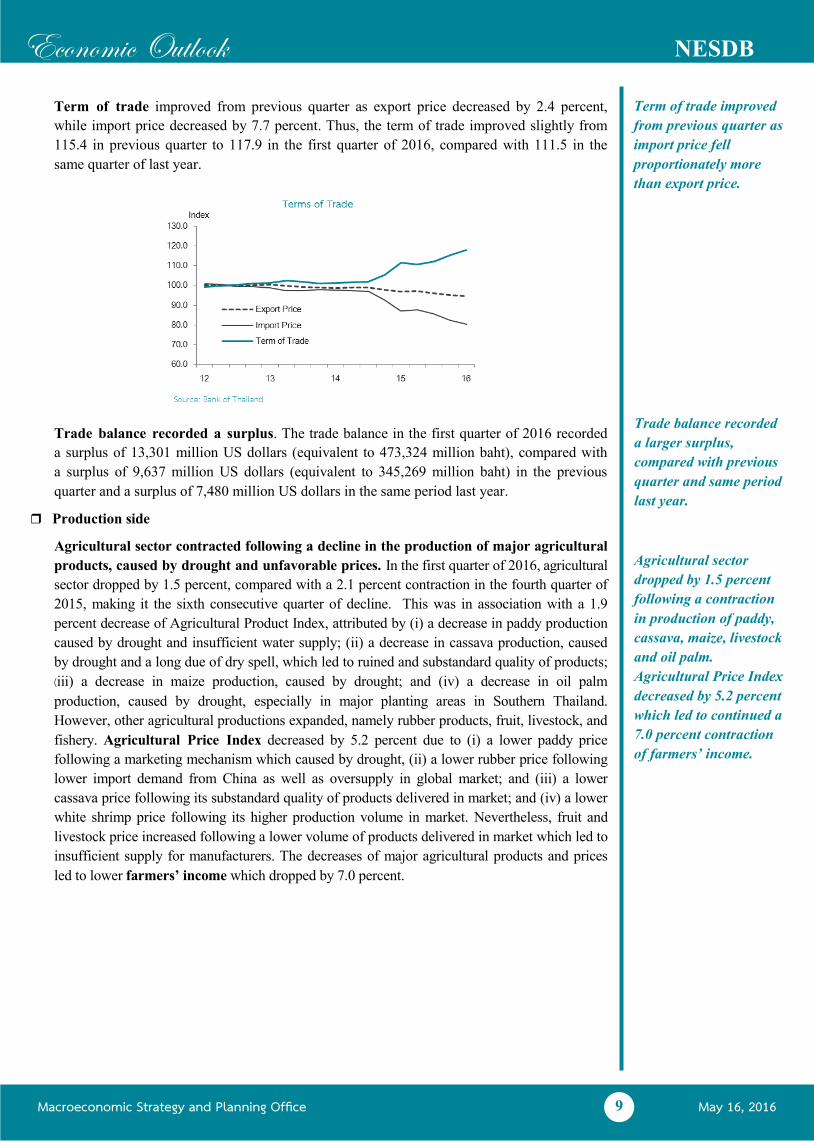
Term of trade improved from previous quarter as export price decreased by 2.4 percent,
while import price decreased by 7.7 percent. Thus, the term of trade improved slightly from
115.4 in previous quarter to 117.9 in the first quarter of 2016, compared with 111.5 in the
same quarter of last year.
Trade balance recorded a surplus. The trade balance in the first quarter of 2016 recorded
a surplus of 13,301 million US dollars (equivalent to 473,324 million baht), compared with
a surplus of 9,637 million US dollars (equivalent to 345,269 million baht) in the previous
quarter and a surplus of 7,480 million US dollars in the same period last year.
Production side
Agricultural sector contracted following a decline in the production of major agricultural
products, caused by drought and unfavorable prices. In the first quarter of 2016, agricultural
sector dropped by 1.5 percent, compared with a 2.1 percent contraction in the fourth quarter of
2015, making it the sixth consecutive quarter of decline. This was in association with a 1.9
percent decrease of Agricultural Product Index, attributed by (i) a decrease in paddy production
caused by drought and insufficient water supply; (ii) a decrease in cassava production, caused
by drought and a long due of dry spell, which led to ruined and substandard quality of products; (iii) a decrease in maize production, caused by drought; and (iv) a decrease in oil palm
production, caused by drought, especially in major planting areas in Southern Thailand.
However, other agricultural productions expanded, namely rubber products, fruit, livestock, and
fishery. Agricultural Price Index decreased by 5.2 percent due to (i) a lower paddy price
following a marketing mechanism which caused by drought, (ii) a lower rubber price following
lower import demand from China as well as oversupply in global market; and (iii) a lower
cassava price following its substandard quality of products delivered in market; and (iv) a lower
white shrimp price following its higher production volume in market. Nevertheless, fruit and
livestock price increased following a lower volume of products delivered in market which led to
insufficient supply for manufacturers. The decreases of major agricultural products and prices
led to lower farmers’ income which dropped by 7.0 percent.
Term of trade improved
from previous quarter as
import price fell
proportionately more
than export price.
Agricultural sector
dropped by 1.5 percent
following a contraction
in production of paddy,
cassava, maize, livestock
and oil palm.
Agricultural Price Index
decreased by 5.2 percent
which led to continued a
7.0 percent contraction
of farmers’ income.
Trade balance recorded
a larger surplus,
compared with previous
quarter and same period
last year.
Macroeconomic Strategy and Planning Office May 16, 2016
Economic Outlook NESDB
10
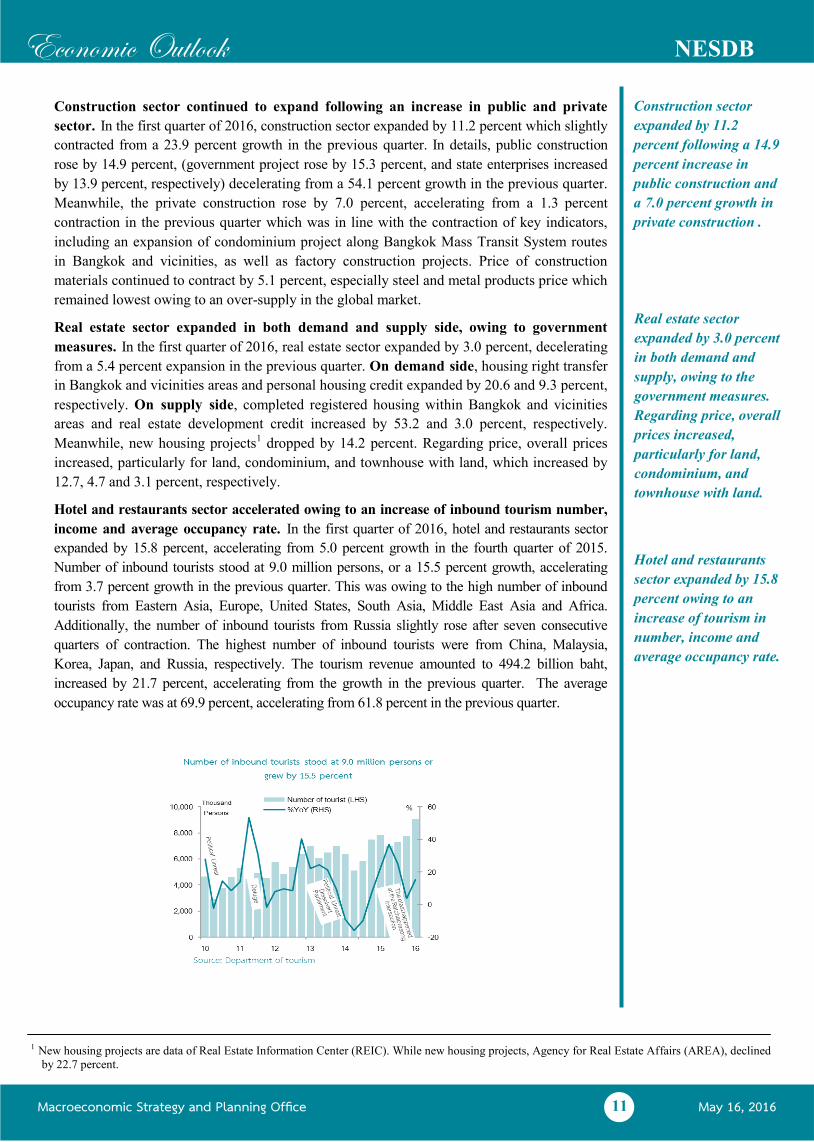
Industrial sector dropped, owing to a contraction of production in vehicle, clothing,
textile, as well as radio and television parts. In the first quarter of 2016, industrial sector
decreased by 0.3 percent, compared with a 0.8 percent growth in the fourth quarter of 2015. This
was in line with a 1.1 percent contraction in Manufacturing Production Index (MPI). In details,
the production with unfavorable growth included (i) car production which fell by 3.3 percent,
following continuously high orders from domestic market prior to an increase of excise tax
effective from January 1st 2016; (ii) clothing and textiles production dropped by 25.4 and 9.6
percent, respectively, following a stagnation in domestic and global demand; and (iii) radio and
television parts production with a 4.1 percent decrease, following production base relocation
into ASEAN countries, as well as a global demand contraction in personal and notebook
computer. The Capacity Utilization Rate (CAPU) stood at 67.3 percent.
Industries with positive growth included furniture (16.5 percent), machinery and parts (8.2
percent), electronic appliances (6.7 percent), rubber and plastic products (3.2 percent),
chemical products (3.0 percent), food and beverages (2.3 percent) and non-metal products (1.2 percent).
Industries which experienced contraction included petroleum products (-0.9 percent),
electronic tube (-2.9 percent), vehicles (-3.3 percent), radio and television parts (-4.1 percent),
transportation device (-5.9 percent), textiles (-9.6 percent), leather products (-11.1 percent),
hard disk drive (-18.5 percent), tobacco (-20.6 percent), and clothing (-25.4 percent).
Industrial sector
decreased by 0.3 percent
following a contraction
of production in vehicle,
clothing, textile, as well
as radio and television
parts products
Macroeconomic Strategy and Planning Office May 16, 2016
Economic Outlook NESDB
11
Construction sector continued to expand following an increase in public and private
sector. In the first quarter of 2016, construction sector expanded by 11.2 percent which slightly
contracted from a 23.9 percent growth in the previous quarter. In details, public construction
rose by 14.9 percent, (government project rose by 15.3 percent, and state enterprises increased
by 13.9 percent, respectively) decelerating from a 54.1 percent growth in the previous quarter.
Meanwhile, the private construction rose by 7.0 percent, accelerating from a 1.3 percent
contraction in the previous quarter which was in line with the contraction of key indicators,
including an expansion of condominium project along Bangkok Mass Transit System routes
in Bangkok and vicinities, as well as factory construction projects. Price of construction
materials continued to contract by 5.1 percent, especially steel and metal products price which
remained lowest owing to an over-supply in the global market.
Real estate sector expanded in both demand and supply side, owing to government
measures. In the first quarter of 2016, real estate sector expanded by 3.0 percent, decelerating
from a 5.4 percent expansion in the previous quarter. On demand side, housing right transfer
in Bangkok and vicinities areas and personal housing credit expanded by 20.6 and 9.3 percent,
respectively. On supply side, completed registered housing within Bangkok and vicinities
areas and real estate development credit increased by 53.2 and 3.0 percent, respectively.
Meanwhile, new housing projects1 dropped by 14.2 percent. Regarding price, overall prices
increased, particularly for land, condominium, and townhouse with land, which increased by
12.7, 4.7 and 3.1 percent, respectively.
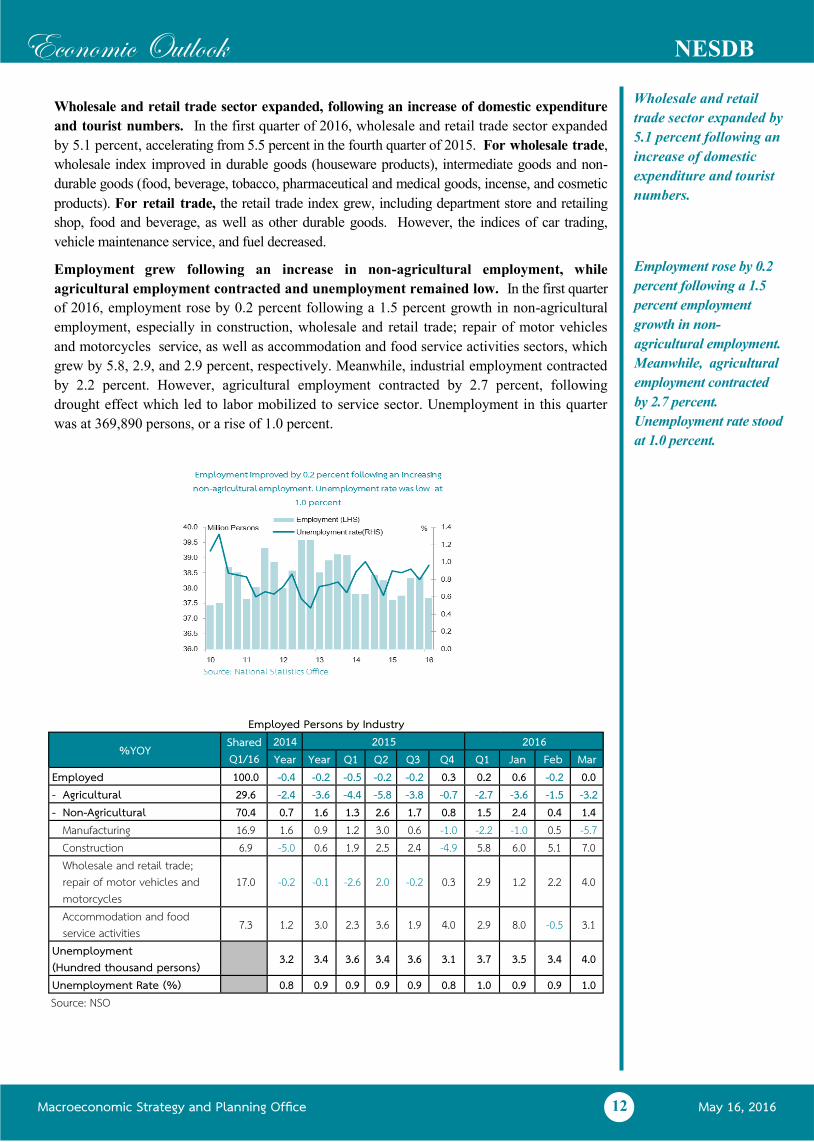
Hotel and restaurants sector accelerated owing to an increase of inbound tourism number,
income and average occupancy rate. In the first quarter of 2016, hotel and restaurants sector
expanded by 15.8 percent, accelerating from 5.0 percent growth in the fourth quarter of 2015.
Number of inbound tourists stood at 9.0 million persons, or a 15.5 percent growth, accelerating
from 3.7 percent growth in the previous quarter. This was owing to the high number of inbound
tourists from Eastern Asia, Europe, United States, South Asia, Middle East Asia and Africa.
Additionally, the number of inbound tourists from Russia slightly rose after seven consecutive
quarters of contraction. The highest number of inbound tourists were from China, Malaysia,
Korea, Japan, and Russia, respectively. The tourism revenue amounted to 494.2 billion baht,
increased by 21.7 percent, accelerating from the growth in the previous quarter. The average
occupancy rate was at 69.9 percent, accelerating from 61.8 percent in the previous quarter.
Construction sector
expanded by 11.2
percent following a 14.9
percent increase in
public construction and
a 7.0 percent growth in
private construction .
Hotel and restaurants
sector expanded by 15.8
percent owing to an
increase of tourism in
number, income and
average occupancy rate.
Real estate sector
expanded by 3.0 percent
in both demand and
supply, owing to the
government measures.
Regarding price, overall
prices increased,
particularly for land,
condominium, and
townhouse with land.
1 New housing projects are data of Real Estate Information Center (REIC). While new housing projects, Agency for Real Estate Affairs (AREA), declined
by 22.7 percent.
Macroeconomic Strategy and Planning Office May 16, 2016
Economic Outlook NESDB
12
Wholesale and retail trade sector expanded, following an increase of domestic expenditure
and tourist numbers. In the first quarter of 2016, wholesale and retail trade sector expanded
by 5.1 percent, accelerating from 5.5 percent in the fourth quarter of 2015. For wholesale trade,
wholesale index improved in durable goods (houseware products), intermediate goods and non-
durable goods (food, beverage, tobacco, pharmaceutical and medical goods, incense, and cosmetic
products). For retail trade, the retail trade index grew, including department store and retailing
shop, food and beverage, as well as other durable goods. However, the indices of car trading,
vehicle maintenance service, and fuel decreased.
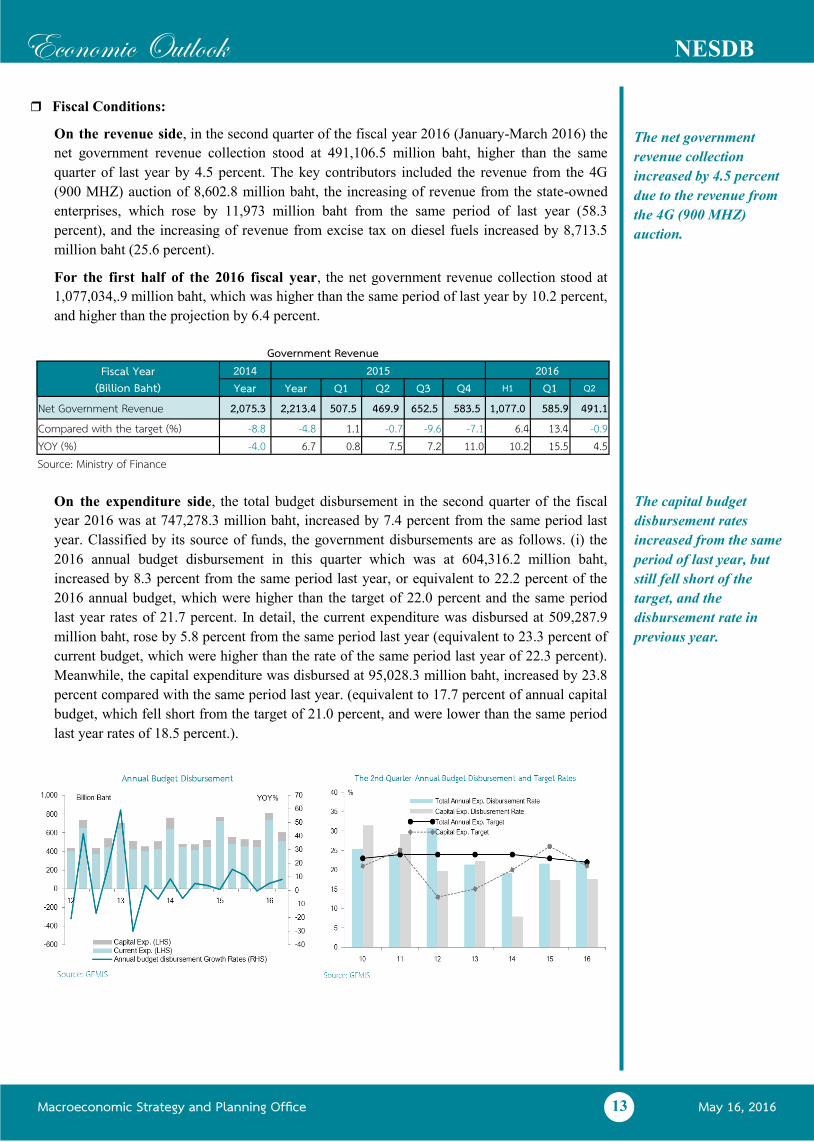
Employment grew following an increase in non-agricultural employment, while
agricultural employment contracted and unemployment remained low. In the first quarter
of 2016, employment rose by 0.2 percent following a 1.5 percent growth in non-agricultural
employment, especially in construction, wholesale and retail trade; repair of motor vehicles
and motorcycles service, as well as accommodation and food service activities sectors, which
grew by 5.8, 2.9, and 2.9 percent, respectively. Meanwhile, industrial employment contracted
by 2.2 percent. However, agricultural employment contracted by 2.7 percent, following
drought effect which led to labor mobilized to service sector. Unemployment in this quarter
was at 369,890 persons, or a rise of 1.0 percent.
Wholesale and retail
trade sector expanded by
5.1 percent following an
increase of domestic
expenditure and tourist
numbers.
Employment rose by 0.2
percent following a 1.5
percent employment
growth in non-
agricultural employment.
Meanwhile, agricultural
employment contracted
by 2.7 percent.
Unemployment rate stood
at 1.0 percent.
Employed Persons by Industry
%YOY Shared Q1/16
2014 2015 2016 Year Year Q1 Q2 Q3 Q4 Q1 Jan Feb Mar
Employed 100.0 -0.4 -0.2 -0.5 -0.2 -0.2 0.3 0.2 0.6 -0.2 0.0 - Agricultural 29.6 -2.4 -3.6 -4.4 -5.8 -3.8 -0.7 -2.7 -3.6 -1.5 -3.2 - Non-Agricultural 70.4 0.7 1.6 1.3 2.6 1.7 0.8 1.5 2.4 0.4 1.4
Manufacturing 16.9 1.6 0.9 1.2 3.0 0.6 -1.0 -2.2 -1.0 0.5 -5.7 Construction 6.9 -5.0 0.6 1.9 2.5 2.4 -4.9 5.8 6.0 5.1 7.0 Wholesale and retail trade; repair of motor vehicles and motorcycles
17.0 -0.2 -0.1 -2.6 2.0 -0.2 0.3 2.9 1.2 2.2 4.0
Accommodation and food service activities 7.3 1.2 3.0 2.3 3.6 1.9 4.0 2.9 8.0 -0.5 3.1
Unemployment (Hundred thousand persons) 3.2 3.4 3.6 3.4 3.6 3.1 3.7 3.5 3.4 4.0
Unemployment Rate (%) 0.8 0.9 0.9 0.9 0.9 0.8 1.0 0.9 0.9 1.0 Source: NSO
Macroeconomic Strategy and Planning Office May 16, 2016
Economic Outlook NESDB
13
Fiscal Conditions:
On the revenue side, in the second quarter of the fiscal year 2016 (January-March 2016) the
net government revenue collection stood at 491,106.5 million baht, higher than the same
quarter of last year by 4.5 percent. The key contributors included the revenue from the 4G
(900 MHZ) auction of 8,602.8 million baht, the increasing of revenue from the state-owned
enterprises, which rose by 11,973 million baht from the same period of last year (58.3
percent), and the increasing of revenue from excise tax on diesel fuels increased by 8,713.5 million baht (25.6 percent).
For the first half of the 2016 fiscal year, the net government revenue collection stood at
1,077,034,.9 million baht, which was higher than the same period of last year by 10.2 percent,
and higher than the projection by 6.4 percent.
On the expenditure side, the total budget disbursement in the second quarter of the fiscal
year 2016 was at 747,278.3 million baht, increased by 7.4 percent from the same period last
year. Classified by its source of funds, the government disbursements are as follows. (i) the
2016 annual budget disbursement in this quarter which was at 604,316.2 million baht,
increased by 8.3 percent from the same period last year, or equivalent to 22.2 percent of the
2016 annual budget, which were higher than the target of 22.0 percent and the same period
last year rates of 21.7 percent. In detail, the current expenditure was disbursed at 509,287.9
million baht, rose by 5.8 percent from the same period last year (equivalent to 23.3 percent of
current budget, which were higher than the rate of the same period last year of 22.3 percent).
Meanwhile, the capital expenditure was disbursed at 95,028.3 million baht, increased by 23.8 percent compared with the same period last year. (equivalent to 17.7 percent of annual capital
budget, which fell short from the target of 21.0 percent, and were lower than the same period
last year rates of 18.5 percent.).
The net government
revenue collection
increased by 4.5 percent
due to the revenue from
the 4G (900 MHZ)
auction.
The capital budget
disbursement rates
increased from the same
period of last year, but
still fell short of the
target, and the
disbursement rate in
previous year.
Government Revenue 2014 2015 2016 Fiscal Year
(Billion Baht) Year Year Q1 Q2 Q3 Q4 H1 Q1 Q2
Net Government Revenue 2,075.3 2,213.4 507.5 469.9 652.5 583.5 1,077.0 585.9 491.1 Compared with the target (%) -8.8 -4.8 1.1 -0.7 -9.6 -7.1 6.4 13.4 -0.9 YOY (%) -4.0 6.7 0.8 7.5 7.2 11.0 10.2 15.5 4.5 Source: Ministry of Finance
Macroeconomic Strategy and Planning Office May 16, 2016
Economic Outlook NESDB
14
(ii) The carry-over budget disbursement was at 75,643.7 million baht, increased by 26.4 percent from the same period last year (equivalent to 24.6 percent of the overall carry-over
budget, which were higher than the rate of 17.0 percent in the same period last year).
(iii) State-owned enterprises’ capital expenditure budget, after deducting the disbursement of
capital budget of 2,758.6 million baht which was already counted in (i), was expected to
disburse in this quarter at 56,913.9 million baht, declined by 12.4 percent, compared with the
same period last year. It was mainly due to the revised investment plan of the PTT Public
Limited2. However, other state-owned enterprises i.e. the Mass Rapid Transit Authority of
Thailand, Provincial Autoworks Authority, State Railway of Thailand and National Housing
Authority were expected to expand their investment in this quarter. (iv) The off-budget loans
were disbursed at 10,404.5 million baht, which included the Economic Stimulus Package
phase II: Loans for water resource management and road transport system projects of 8,562.7
million baht, Thai Khem Kaeng stimulus package phase II (TKK) of 540.0 million baht, the
Development Policy Loan (DPL) of 768.2 million baht and special budget reallocating from
TKK of 533.6 million baht.
For the first half of the 2016 fiscal year, the annual budget disbursement amounted to
1,411,970.6 million baht, increased by 6.6 percent from the previous year (the disbursement
rate was at 51.9 percent, fell short from the target of 52.0 percent, but were higher than the
same period of last year rate of 51.4 percent). (i) The capital budget was disbursed at
163,184.0 million baht, increased by 38.3 percent from last year (equivalent to 30.4 percent of
total capital budget, fell short from the target of 40.0 percent, but were higher than the same
period of last year rate of 28.4 percent); (ii) the carry-over budget disbursement amounted to
307,832.5 million baht, (equivalent to 51.7 percent of total carry-over budget); (iii) State-
owned enterprises’ capital budget disbursement amounted to 134,861.1 million baht; and
(iv) the off-budget loans disbursement amounted to 40,148.0 million baht.
Fiscal Balance: in the second quarter of fiscal year 2016, the budgetary balance recorded a
deficit of 201,336.0 million baht. The non-budgetary balance also recorded a deficit of
29,663.5 million baht. In the meantime, the government conducted a cash balance
management through borrowing total of 47,720.0 million baht. Therefore, the cash balance
after debt financing recorded a net deficit of 183,279.5 million baht, compared with the net
deficit in the same period of last year of 58,226.5 million baht.
For the first half of the 2016 fiscal year, the budgetary balance recorded a deficit of
508,503.5 million baht, whereas the non-budgetary balance recorded a deficit of 27,483.9
million baht. The government has conducted a cash balance management through borrowing
total of 313,023.0 million baht. Thus, the net balance after debt financing still remained deficit
of 222,964.4 million baht. Then, summing up with the treasury reserve recorded at the end of
2015 fiscal year of 426,181.9 million baht, the treasury reserve at the end of the second
quarter of fiscal year 2016 amounted to 203,217.5 million baht, which was lower than the end
of fiscal year 2015 by 52.3 percent.
At the end of the second
quarter of fiscal year
2016, the treasury
reserve stood at
203,217.5 million baht
2 Excluding the PTT Public Limited, state-owned enterprises’ capital expenditure budget is expected to increase by 16.6 percent. 3 This amount included the disbursement of fiscal year 2015, from October-December 2015.
Macroeconomic Strategy and Planning Office May 16, 2016
Economic Outlook NESDB
15
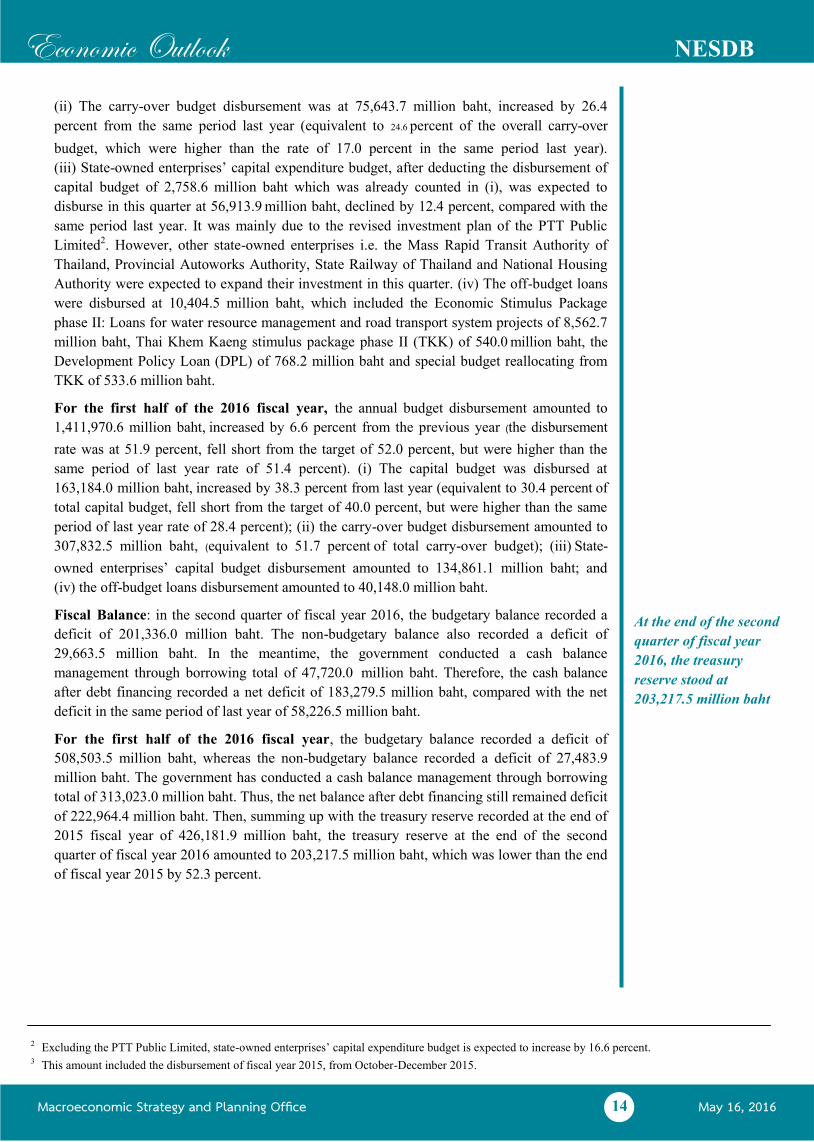
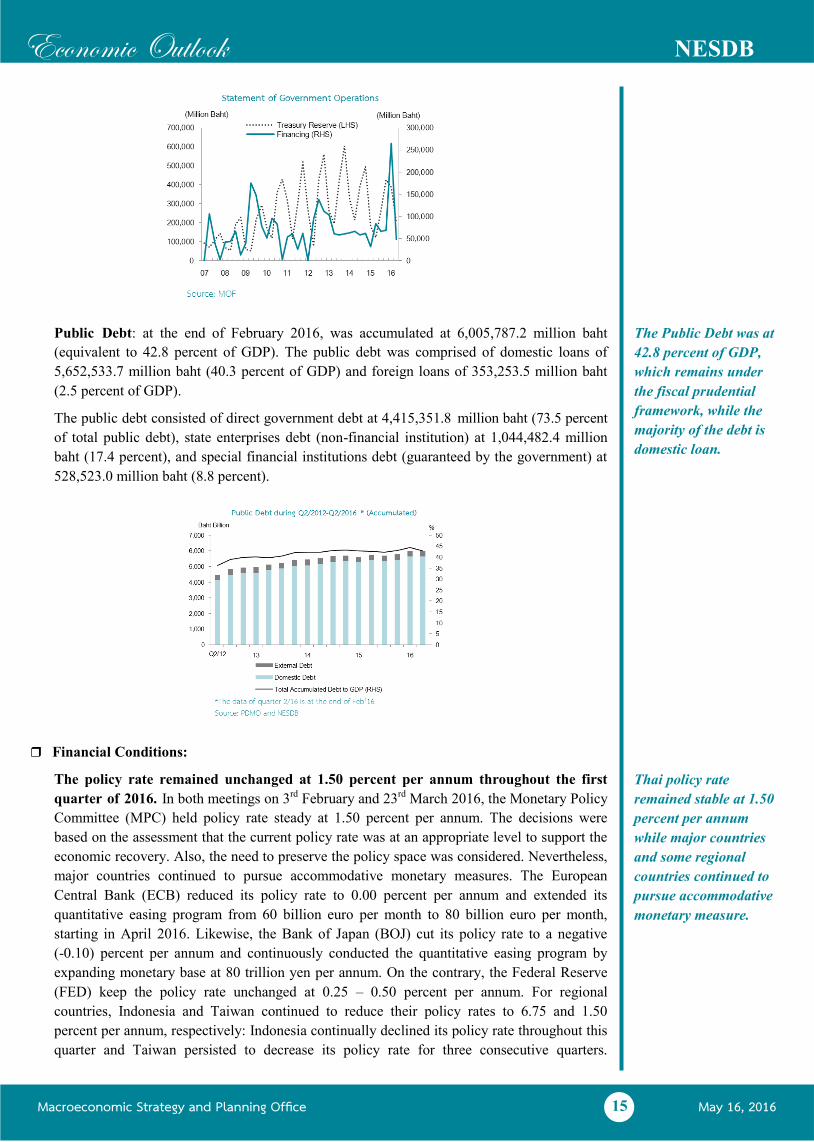
Public Debt: at the end of February 2016, was accumulated at 6,005,787.2 million baht
(equivalent to 42.8 percent of GDP). The public debt was comprised of domestic loans of
5,652,533.7 million baht (40.3 percent of GDP) and foreign loans of 353,253.5 million baht
(2.5 percent of GDP).
The public debt consisted of direct government debt at 4,415,351.8 million baht (73.5 percent
of total public debt), state enterprises debt (non-financial institution) at 1,044,482.4 million
baht (17.4 percent), and special financial institutions debt (guaranteed by the government) at
528,523.0 million baht (8.8 percent).
Financial Conditions:
The policy rate remained unchanged at 1.50 percent per annum throughout the first
quarter of 2016. In both meetings on 3rd February and 23rd March 2016, the Monetary Policy
Committee (MPC) held policy rate steady at 1.50 percent per annum. The decisions were
based on the assessment that the current policy rate was at an appropriate level to support the
economic recovery. Also, the need to preserve the policy space was considered. Nevertheless,
major countries continued to pursue accommodative monetary measures. The European
Central Bank (ECB) reduced its policy rate to 0.00 percent per annum and extended its
quantitative easing program from 60 billion euro per month to 80 billion euro per month,
starting in April 2016. Likewise, the Bank of Japan (BOJ) cut its policy rate to a negative
(-0.10) percent per annum and continuously conducted the quantitative easing program by
expanding monetary base at 80 trillion yen per annum. On the contrary, the Federal Reserve
(FED) keep the policy rate unchanged at 0.25 – 0.50 percent per annum. For regional
countries, Indonesia and Taiwan continued to reduce their policy rates to 6.75 and 1.50
percent per annum, respectively: Indonesia continually declined its policy rate throughout this
quarter and Taiwan persisted to decrease its policy rate for three consecutive quarters.
Thai policy rate
remained stable at 1.50
percent per annum
while major countries
and some regional
countries continued to
pursue accommodative
monetary measure.
The Public Debt was at
42.8 percent of GDP,
which remains under
the fiscal prudential
framework, while the
majority of the debt is
domestic loan.
Macroeconomic Strategy and Planning Office May 16, 2016
Economic Outlook NESDB
16
Moreover, New Zealand, Norway, and Sweden also cut their policy rate by 0.25, 0.25, and
0.15 percent, respectively. In April 2016, India reduced its policy rate by 0.25 percent to 6.50
percent per annum.
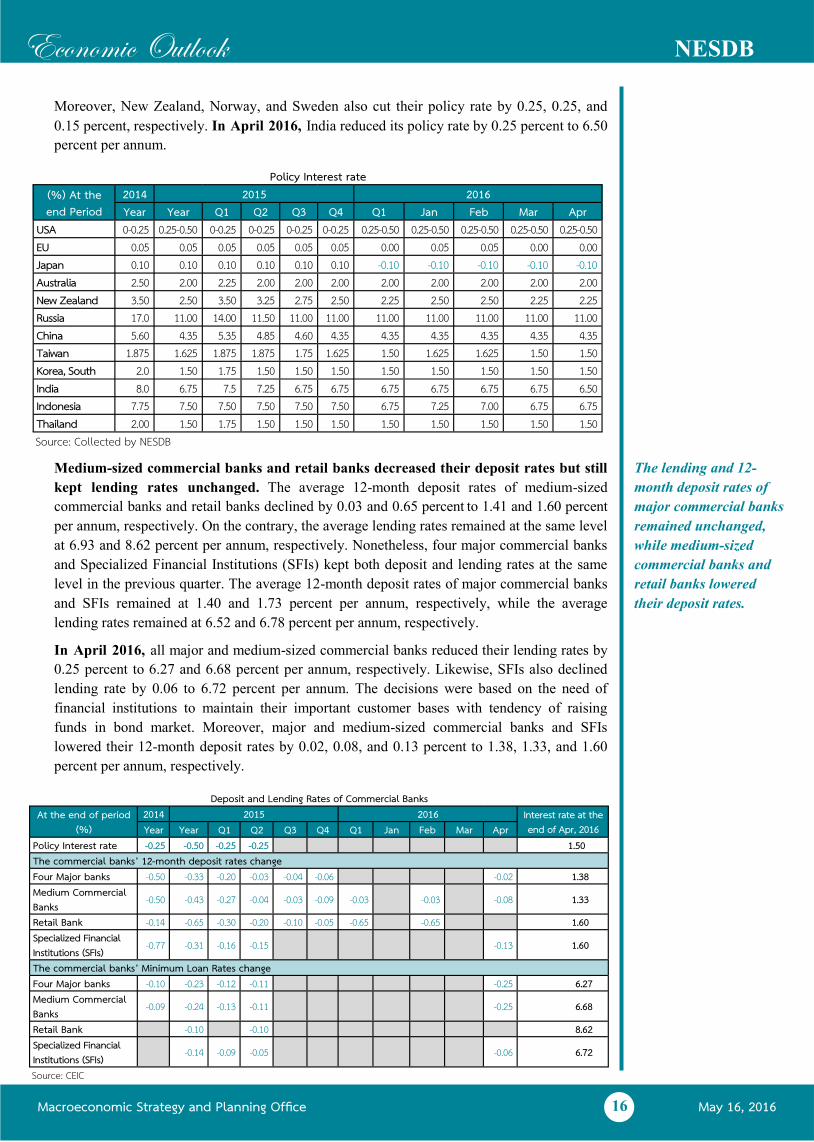
Medium-sized commercial banks and retail banks decreased their deposit rates but still
kept lending rates unchanged. The average 12-month deposit rates of medium-sized
commercial banks and retail banks declined by 0.03 and 0.65 percent to 1.41 and 1.60 percent
per annum, respectively. On the contrary, the average lending rates remained at the same level
at 6.93 and 8.62 percent per annum, respectively. Nonetheless, four major commercial banks
and Specialized Financial Institutions (SFIs) kept both deposit and lending rates at the same
level in the previous quarter. The average 12-month deposit rates of major commercial banks
and SFIs remained at 1.40 and 1.73 percent per annum, respectively, while the average
lending rates remained at 6.52 and 6.78 percent per annum, respectively.
In April 2016, all major and medium-sized commercial banks reduced their lending rates by
0.25 percent to 6.27 and 6.68 percent per annum, respectively. Likewise, SFIs also declined
lending rate by 0.06 to 6.72 percent per annum. The decisions were based on the need of
financial institutions to maintain their important customer bases with tendency of raising
funds in bond market. Moreover, major and medium-sized commercial banks and SFIs
lowered their 12-month deposit rates by 0.02, 0.08, and 0.13 percent to 1.38, 1.33, and 1.60
percent per annum, respectively.
The lending and 12-
month deposit rates of
major commercial banks
remained unchanged,
while medium-sized
commercial banks and
retail banks lowered
their deposit rates.
Policy Interest rate (%) At the end Period
2014 2015 2016 Year Year Q1 Q2 Q3 Q4 Q1 Jan Feb Mar Apr
USA 0-0.25 0.25-0.50 0-0.25 0-0.25 0-0.25 0-0.25 0.25-0.50 0.25-0.50 0.25-0.50 0.25-0.50 0.25-0.50 EU 0.05 0.05 0.05 0.05 0.05 0.05 0.00 0.05 0.05 0.00 0.00 Japan 0.10 0.10 0.10 0.10 0.10 0.10 -0.10 -0.10 -0.10 -0.10 -0.10 Australia 2.50 2.00 2.25 2.00 2.00 2.00 2.00 2.00 2.00 2.00 2.00 New Zealand 3.50 2.50 3.50 3.25 2.75 2.50 2.25 2.50 2.50 2.25 2.25 Russia 17.0 11.00 14.00 11.50 11.00 11.00 11.00 11.00 11.00 11.00 11.00 China 5.60 4.35 5.35 4.85 4.60 4.35 4.35 4.35 4.35 4.35 4.35 Taiwan 1.875 1.625 1.875 1.875 1.75 1.625 1.50 1.625 1.625 1.50 1.50 Korea, South 2.0 1.50 1.75 1.50 1.50 1.50 1.50 1.50 1.50 1.50 1.50 India 8.0 6.75 7.5 7.25 6.75 6.75 6.75 6.75 6.75 6.75 6.50 Indonesia 7.75 7.50 7.50 7.50 7.50 7.50 6.75 7.25 7.00 6.75 6.75 Thailand 2.00 1.50 1.75 1.50 1.50 1.50 1.50 1.50 1.50 1.50 1.50 Source: Collected by NESDB
Deposit and Lending Rates of Commercial Banks At the end of period
(%) 2014 2015 2016 Interest rate at the
end of Apr, 2016 Year Year Q1 Q2 Q3 Q4 Q1 Jan Feb Mar Apr Policy Interest rate -0.25 -0.50 -0.25 -0.25 1.50 The commercial banks’ 12-month deposit rates change Four Major banks -0.50 -0.33 -0.20 -0.03 -0.04 -0.06 -0.02 1.38 Medium Commercial Banks -0.50 -0.43 -0.27 -0.04 -0.03 -0.09 -0.03 -0.03 -0.08 1.33
Retail Bank -0.14 -0.65 -0.30 -0.20 -0.10 -0.05 -0.65 -0.65 1.60 Specialized Financial Institutions (SFIs) -0.77 -0.31 -0.16 -0.15 -0.13 1.60
The commercial banks’ Minimum Loan Rates change Four Major banks -0.10 -0.23 -0.12 -0.11 -0.25 6.27 Medium Commercial Banks -0.09 -0.24 -0.13 -0.11 -0.25 6.68
Retail Bank -0.10 -0.10 8.62 Specialized Financial Institutions (SFIs) -0.14 -0.09 -0.05 -0.06 6.72
Source: CEIC
Macroeconomic Strategy and Planning Office May 16, 2016
Economic Outlook NESDB
17
Real deposit and lending rates declined from the previous quarter. The real deposit and
lending rates decreased to 1.86 and 6.98 percent per annum, respectively, following an
improvement in the headline inflation rate.
In April 2016, the real deposit and lending rates dropped to 1.31 and 6.20 percent per annum,
respectively; in accordance with the reduction in deposit and lending rates as well as an
improvement in the headline inflation rate.
Deposits including Bill of Exchange (B/E) of commercial banks expanded in a diminishing
trend from 2.6 percent in the previous quarter to 2.3 percent in the first quarter of 2016.
Deposits in both business and household sectors decelerated; as a result of a downward trend
of deposit rate which caused the depositors and investors to seek for alternative investments
with higher rates of return.
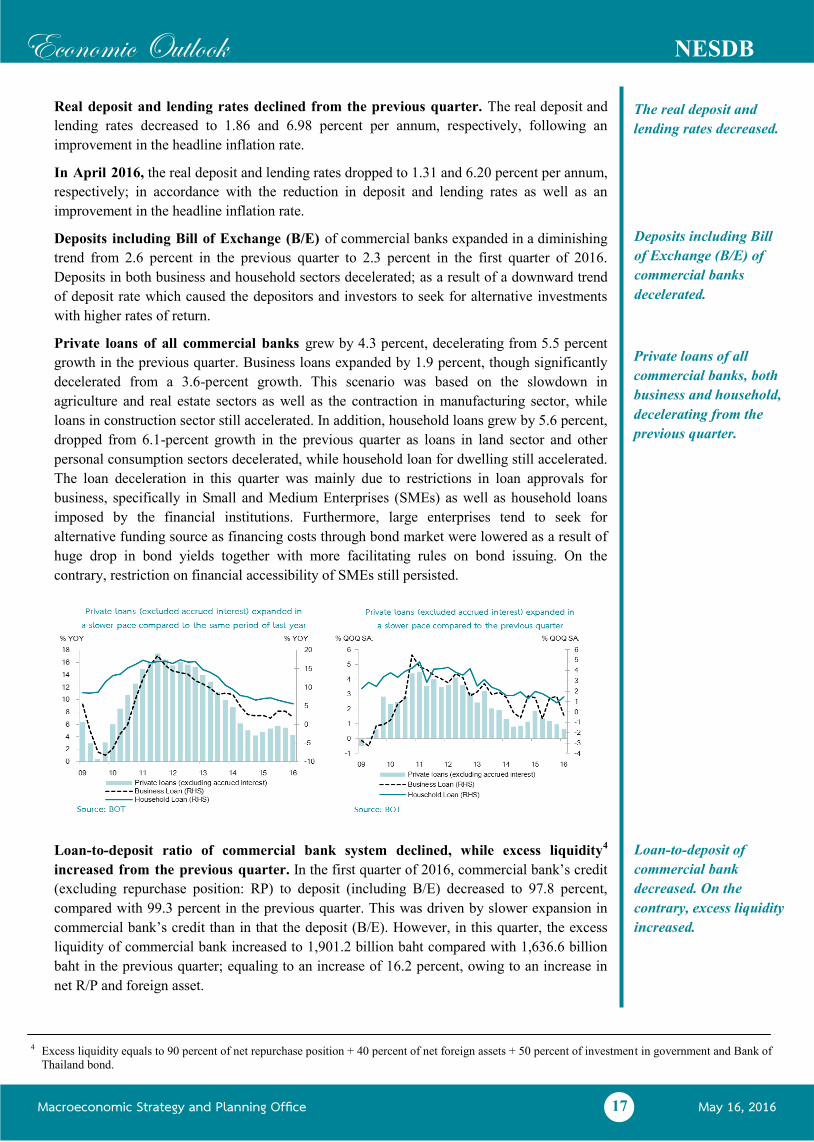
Private loans of all commercial banks grew by 4.3 percent, decelerating from 5.5 percent
growth in the previous quarter. Business loans expanded by 1.9 percent, though significantly
decelerated from a 3.6-percent growth. This scenario was based on the slowdown in
agriculture and real estate sectors as well as the contraction in manufacturing sector, while
loans in construction sector still accelerated. In addition, household loans grew by 5.6 percent,
dropped from 6.1-percent growth in the previous quarter as loans in land sector and other
personal consumption sectors decelerated, while household loan for dwelling still accelerated.
The loan deceleration in this quarter was mainly due to restrictions in loan approvals for
business, specifically in Small and Medium Enterprises (SMEs) as well as household loans
imposed by the financial institutions. Furthermore, large enterprises tend to seek for
alternative funding source as financing costs through bond market were lowered as a result of
huge drop in bond yields together with more facilitating rules on bond issuing. On the
contrary, restriction on financial accessibility of SMEs still persisted.
Loan-to-deposit ratio of commercial bank system declined, while excess liquidity4
increased from the previous quarter. In the first quarter of 2016, commercial bank’s credit
(excluding repurchase position: RP) to deposit (including B/E) decreased to 97.8 percent,
compared with 99.3 percent in the previous quarter. This was driven by slower expansion in
commercial bank’s credit than in that the deposit (B/E). However, in this quarter, the excess
liquidity of commercial bank increased to 1,901.2 billion baht compared with 1,636.6 billion
baht in the previous quarter; equaling to an increase of 16.2 percent, owing to an increase in
net R/P and foreign asset.
The real deposit and
lending rates decreased.
Loan-to-deposit of
commercial bank
decreased. On the
contrary, excess liquidity
increased.
Deposits including Bill
of Exchange (B/E) of
commercial banks
decelerated.
4 Excess liquidity equals to 90 percent of net repurchase position + 40 percent of net foreign assets + 50 percent of investment in government and Bank of
Thailand bond.
Private loans of all
commercial banks, both
business and household,
decelerating from the
previous quarter.
Macroeconomic Strategy and Planning Office May 16, 2016
Economic Outlook NESDB
18
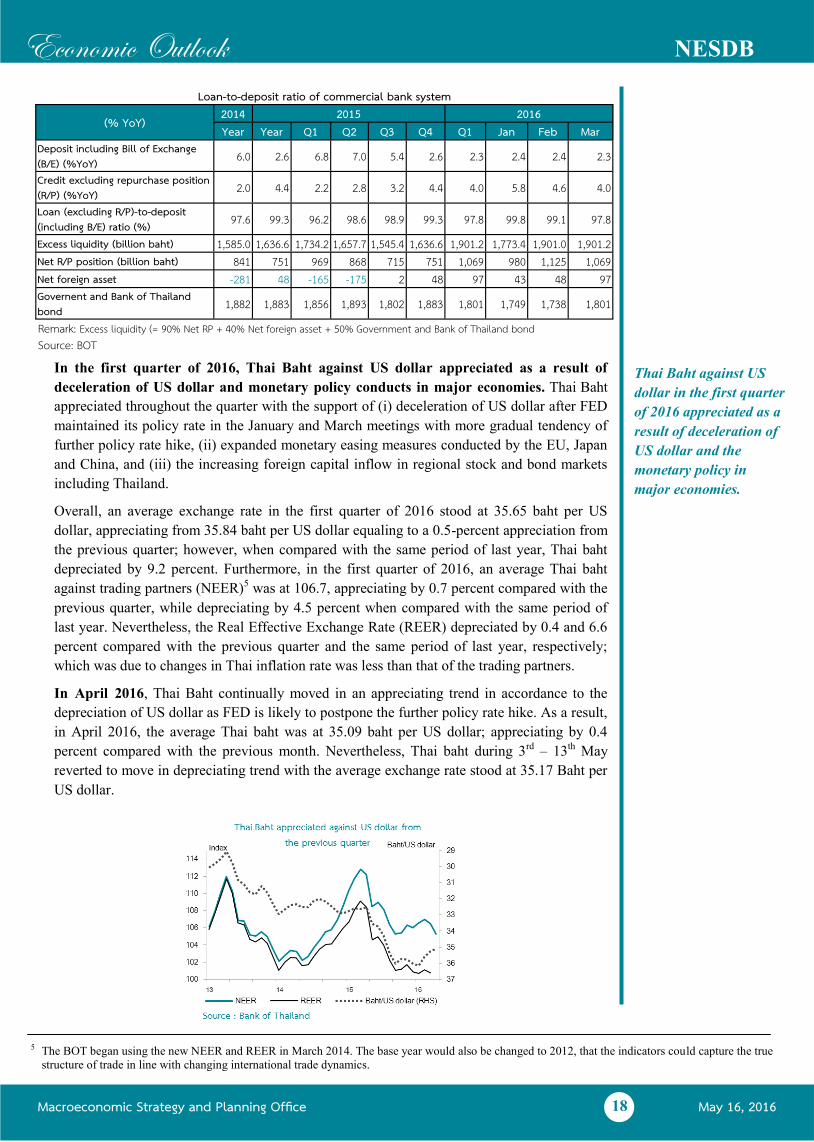
In the first quarter of 2016, Thai Baht against US dollar appreciated as a result of
deceleration of US dollar and monetary policy conducts in major economies. Thai Baht
appreciated throughout the quarter with the support of (i) deceleration of US dollar after FED
maintained its policy rate in the January and March meetings with more gradual tendency of
further policy rate hike, (ii) expanded monetary easing measures conducted by the EU, Japan
and China, and (iii) the increasing foreign capital inflow in regional stock and bond markets
including Thailand.
Overall, an average exchange rate in the first quarter of 2016 stood at 35.65 baht per US
dollar, appreciating from 35.84 baht per US dollar equaling to a 0.5-percent appreciation from
the previous quarter; however, when compared with the same period of last year, Thai baht
depreciated by 9.2 percent. Furthermore, in the first quarter of 2016, an average Thai baht
against trading partners (NEER)5 was at 106.7, appreciating by 0.7 percent compared with the
previous quarter, while depreciating by 4.5 percent when compared with the same period of
last year. Nevertheless, the Real Effective Exchange Rate (REER) depreciated by 0.4 and 6.6
percent compared with the previous quarter and the same period of last year, respectively;
which was due to changes in Thai inflation rate was less than that of the trading partners.
In April 2016, Thai Baht continually moved in an appreciating trend in accordance to the
depreciation of US dollar as FED is likely to postpone the further policy rate hike. As a result,
in April 2016, the average Thai baht was at 35.09 baht per US dollar; appreciating by 0.4
percent compared with the previous month. Nevertheless, Thai baht during 3rd – 13th May
reverted to move in depreciating trend with the average exchange rate stood at 35.17 Baht per
US dollar.
Thai Baht against US
dollar in the first quarter
of 2016 appreciated as a
result of deceleration of
US dollar and the
monetary policy in
major economies.
Loan-to-deposit ratio of commercial bank system
(% YoY) 2014 2015 2016 Year Year Q1 Q2 Q3 Q4 Q1 Jan Feb Mar
Deposit including Bill of Exchange (B/E) (%YoY) 6.0 2.6 6.8 7.0 5.4 2.6 2.3 2.4 2.4 2.3
Credit excluding repurchase position (R/P) (%YoY) 2.0 4.4 2.2 2.8 3.2 4.4 4.0 5.8 4.6 4.0
Loan (excluding R/P)-to-deposit (including B/E) ratio (%) 97.6 99.3 96.2 98.6 98.9 99.3 97.8 99.8 99.1 97.8
Excess liquidity (billion baht) 1,585.0 1,636.6 1,734.2 1,657.7 1,545.4 1,636.6 1,901.2 1,773.4 1,901.0 1,901.2 Net R/P position (billion baht) 841 751 969 868 715 751 1,069 980 1,125 1,069 Net foreign asset -281 48 -165 -175 2 48 97 43 48 97 Governent and Bank of Thailand bond
1,882 1,883 1,856 1,893 1,802 1,883 1,801 1,749 1,738 1,801
Remark: Excess liquidity (= 90% Net RP + 40% Net foreign asset + 50% Government and Bank of Thailand bond Source: BOT
5 The BOT began using the new NEER and REER in March 2014. The base year would also be changed to 2012, that the indicators could capture the true
structure of trade in line with changing international trade dynamics.
Macroeconomic Strategy and Planning Office May 16, 2016
Economic Outlook NESDB
19
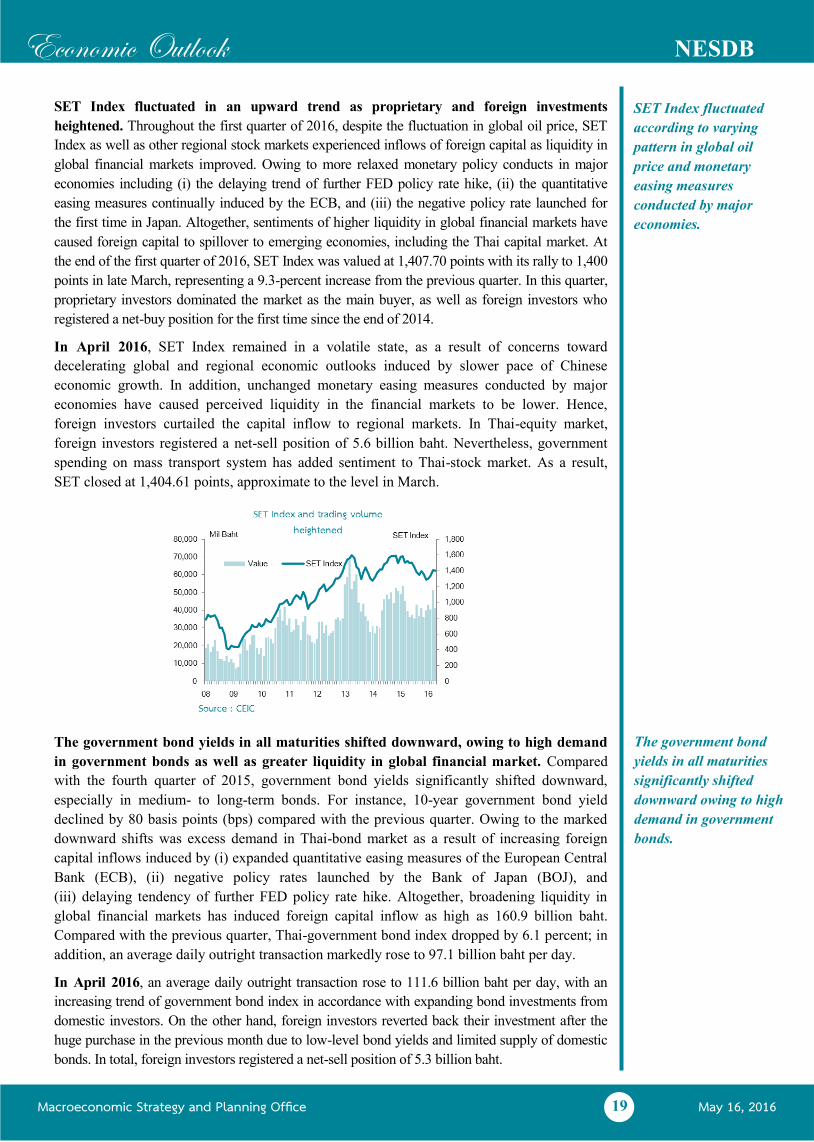
SET Index fluctuated in an upward trend as proprietary and foreign investments
heightened. Throughout the first quarter of 2016, despite the fluctuation in global oil price, SET
Index as well as other regional stock markets experienced inflows of foreign capital as liquidity in
global financial markets improved. Owing to more relaxed monetary policy conducts in major
economies including (i) the delaying trend of further FED policy rate hike, (ii) the quantitative
easing measures continually induced by the ECB, and (iii) the negative policy rate launched for
the first time in Japan. Altogether, sentiments of higher liquidity in global financial markets have
caused foreign capital to spillover to emerging economies, including the Thai capital market. At
the end of the first quarter of 2016, SET Index was valued at 1,407.70 points with its rally to 1,400
points in late March, representing a 9.3-percent increase from the previous quarter. In this quarter,
proprietary investors dominated the market as the main buyer, as well as foreign investors who
registered a net-buy position for the first time since the end of 2014.
In April 2016, SET Index remained in a volatile state, as a result of concerns toward
decelerating global and regional economic outlooks induced by slower pace of Chinese
economic growth. In addition, unchanged monetary easing measures conducted by major
economies have caused perceived liquidity in the financial markets to be lower. Hence,
foreign investors curtailed the capital inflow to regional markets. In Thai-equity market,
foreign investors registered a net-sell position of 5.6 billion baht. Nevertheless, government
spending on mass transport system has added sentiment to Thai-stock market. As a result,
SET closed at 1,404.61 points, approximate to the level in March.
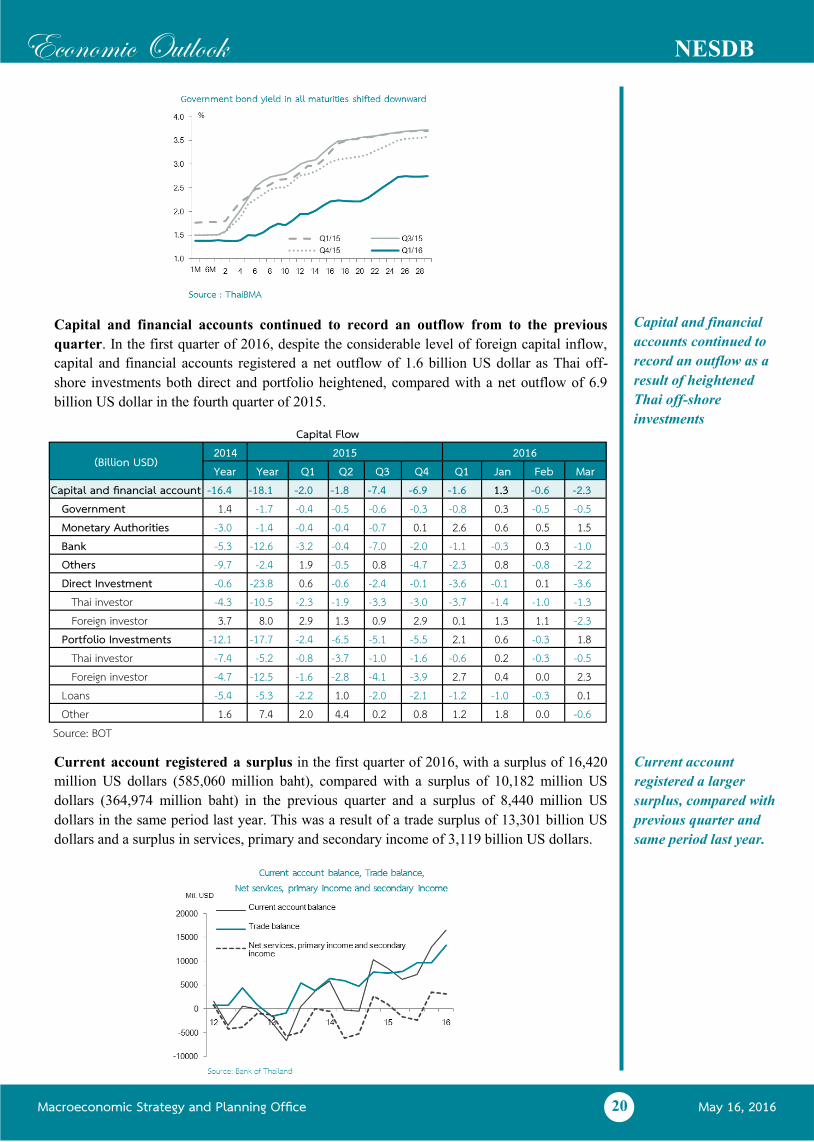
The government bond yields in all maturities shifted downward, owing to high demand
in government bonds as well as greater liquidity in global financial market. Compared
with the fourth quarter of 2015, government bond yields significantly shifted downward,
especially in medium- to long-term bonds. For instance, 10-year government bond yield
declined by 80 basis points (bps) compared with the previous quarter. Owing to the marked
downward shifts was excess demand in Thai-bond market as a result of increasing foreign
capital inflows induced by (i) expanded quantitative easing measures of the European Central
Bank (ECB), (ii) negative policy rates launched by the Bank of Japan (BOJ), and
(iii) delaying tendency of further FED policy rate hike. Altogether, broadening liquidity in
global financial markets has induced foreign capital inflow as high as 160.9 billion baht.
Compared with the previous quarter, Thai-government bond index dropped by 6.1 percent; in
addition, an average daily outright transaction markedly rose to 97.1 billion baht per day.
In April 2016, an average daily outright transaction rose to 111.6 billion baht per day, with an
increasing trend of government bond index in accordance with expanding bond investments from
domestic investors. On the other hand, foreign investors reverted back their investment after the
huge purchase in the previous month due to low-level bond yields and limited supply of domestic
bonds. In total, foreign investors registered a net-sell position of 5.3 billion baht.
SET Index fluctuated
according to varying
pattern in global oil
price and monetary
easing measures
conducted by major
economies.
The government bond
yields in all maturities
significantly shifted
downward owing to high
demand in government
bonds.
Macroeconomic Strategy and Planning Office May 16, 2016
Economic Outlook NESDB
20
Capital and financial accounts continued to record an outflow from to the previous
quarter. In the first quarter of 2016, despite the considerable level of foreign capital inflow,
capital and financial accounts registered a net outflow of 1.6 billion US dollar as Thai off-
shore investments both direct and portfolio heightened, compared with a net outflow of 6.9
billion US dollar in the fourth quarter of 2015.
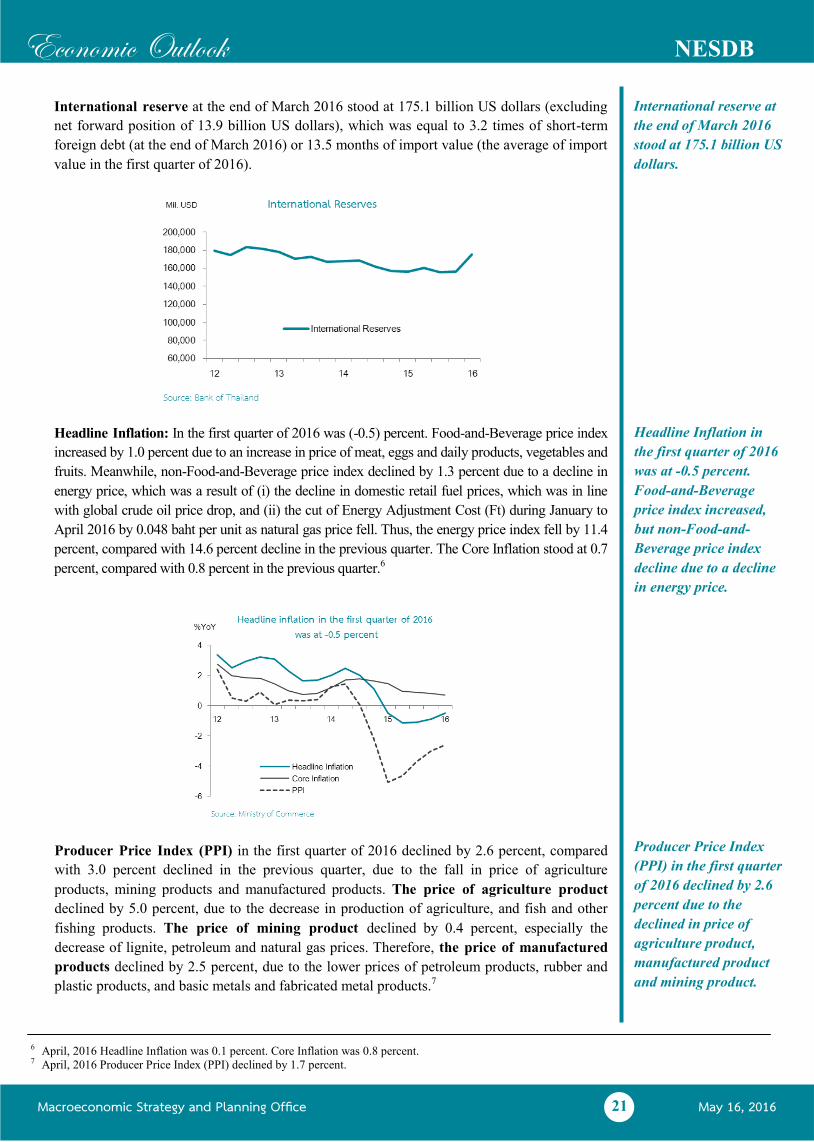
Current account registered a surplus in the first quarter of 2016, with a surplus of 16,420
million US dollars (585,060 million baht), compared with a surplus of 10,182 million US
dollars (364,974 million baht) in the previous quarter and a surplus of 8,440 million US
dollars in the same period last year. This was a result of a trade surplus of 13,301 billion US
dollars and a surplus in services, primary and secondary income of 3,119 billion US dollars.
Capital and financial
accounts continued to
record an outflow as a
result of heightened
Thai off-shore
investments
Current account
registered a larger
surplus, compared with
previous quarter and
same period last year.
Capital Flow
(Billion USD) 2014 2015 2016 Year Year Q1 Q2 Q3 Q4 Q1 Jan Feb Mar
Capital and financial account -16.4 -18.1 -2.0 -1.8 -7.4 -6.9 -1.6 1.3 -0.6 -2.3 Government 1.4 -1.7 -0.4 -0.5 -0.6 -0.3 -0.8 0.3 -0.5 -0.5 Monetary Authorities -3.0 -1.4 -0.4 -0.4 -0.7 0.1 2.6 0.6 0.5 1.5 Bank -5.3 -12.6 -3.2 -0.4 -7.0 -2.0 -1.1 -0.3 0.3 -1.0 Others -9.7 -2.4 1.9 -0.5 0.8 -4.7 -2.3 0.8 -0.8 -2.2 Direct Investment -0.6 -23.8 0.6 -0.6 -2.4 -0.1 -3.6 -0.1 0.1 -3.6 Thai investor -4.3 -10.5 -2.3 -1.9 -3.3 -3.0 -3.7 -1.4 -1.0 -1.3 Foreign investor 3.7 8.0 2.9 1.3 0.9 2.9 0.1 1.3 1.1 -2.3 Portfolio Investments -12.1 -17.7 -2.4 -6.5 -5.1 -5.5 2.1 0.6 -0.3 1.8 Thai investor -7.4 -5.2 -0.8 -3.7 -1.0 -1.6 -0.6 0.2 -0.3 -0.5 Foreign investor -4.7 -12.5 -1.6 -2.8 -4.1 -3.9 2.7 0.4 0.0 2.3 Loans -5.4 -5.3 -2.2 1.0 -2.0 -2.1 -1.2 -1.0 -0.3 0.1 Other 1.6 7.4 2.0 4.4 0.2 0.8 1.2 1.8 0.0 -0.6 Source: BOT
Macroeconomic Strategy and Planning Office May 16, 2016
Economic Outlook NESDB
21
International reserve at the end of March 2016 stood at 175.1 billion US dollars (excluding
net forward position of 13.9 billion US dollars), which was equal to 3.2 times of short-term
foreign debt (at the end of March 2016) or 13.5 months of import value (the average of import
value in the first quarter of 2016).
Headline Inflation: In the first quarter of 2016 was (-0.5) percent. Food-and-Beverage price index
increased by 1.0 percent due to an increase in price of meat, eggs and daily products, vegetables and
fruits. Meanwhile, non-Food-and-Beverage price index declined by 1.3 percent due to a decline in
energy price, which was a result of (i) the decline in domestic retail fuel prices, which was in line
with global crude oil price drop, and (ii) the cut of Energy Adjustment Cost (Ft) during January to
April 2016 by 0.048 baht per unit as natural gas price fell. Thus, the energy price index fell by 11.4
percent, compared with 14.6 percent decline in the previous quarter. The Core Inflation stood at 0.7
percent, compared with 0.8 percent in the previous quarter.6
International reserve at
the end of March 2016
stood at 175.1 billion US
dollars.
Producer Price Index
(PPI) in the first quarter
of 2016 declined by 2.6
percent due to the
declined in price of
agriculture product,
manufactured product
and mining product.
Headline Inflation in
the first quarter of 2016
was at -0.5 percent.
Food-and-Beverage
price index increased,
but non-Food-and-
Beverage price index
decline due to a decline
in energy price.
Producer Price Index (PPI) in the first quarter of 2016 declined by 2.6 percent, compared
with 3.0 percent declined in the previous quarter, due to the fall in price of agriculture
products, mining products and manufactured products. The price of agriculture product
declined by 5.0 percent, due to the decrease in production of agriculture, and fish and other
fishing products. The price of mining product declined by 0.4 percent, especially the
decrease of lignite, petroleum and natural gas prices. Therefore, the price of manufactured
products declined by 2.5 percent, due to the lower prices of petroleum products, rubber and
plastic products, and basic metals and fabricated metal products.7
6 April, 2016 Headline Inflation was 0.1 percent. Core Inflation was 0.8 percent. 7 April, 2016 Producer Price Index (PPI) declined by 1.7 percent.
Macroeconomic Strategy and Planning Office May 16, 2016
Economic Outlook NESDB
22
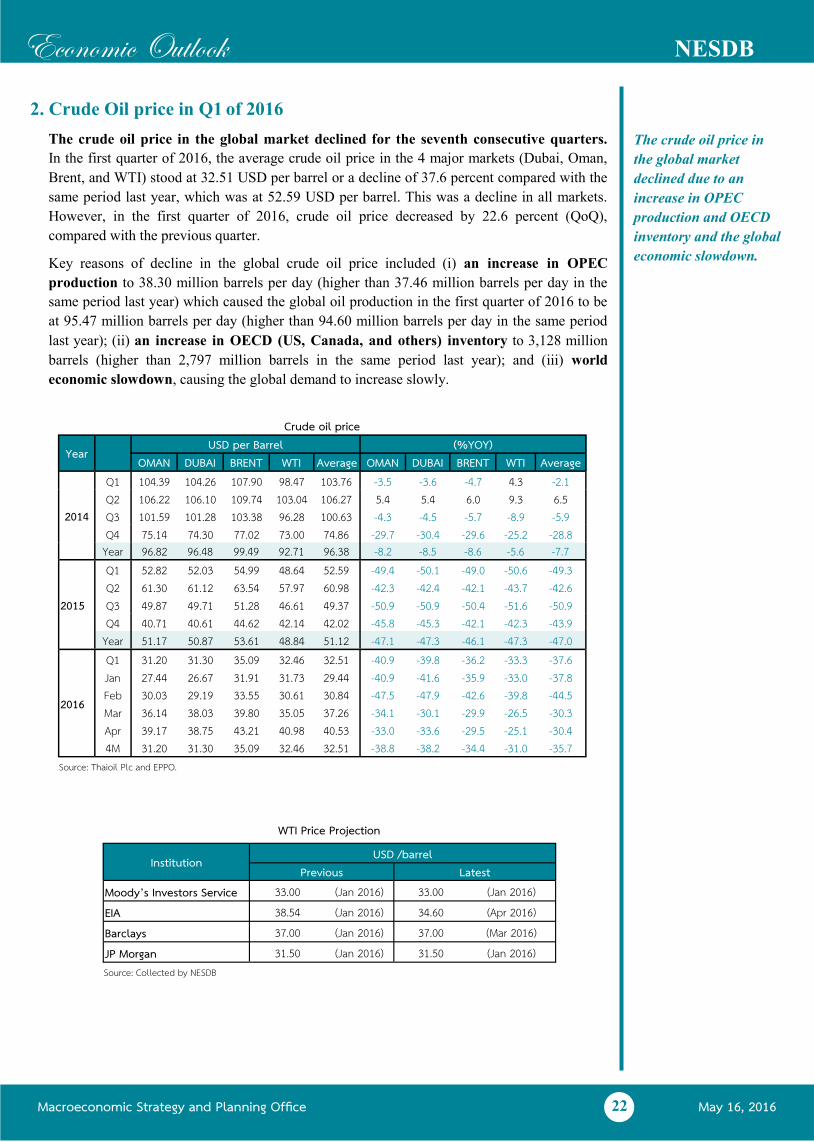
2. Crude Oil price in Q1 of 2016
The crude oil price in the global market declined for the seventh consecutive quarters.
In the first quarter of 2016, the average crude oil price in the 4 major markets (Dubai, Oman,
Brent, and WTI) stood at 32.51 USD per barrel or a decline of 37.6 percent compared with the
same period last year, which was at 52.59 USD per barrel. This was a decline in all markets.
However, in the first quarter of 2016, crude oil price decreased by 22.6 percent (QoQ),
compared with the previous quarter.
Key reasons of decline in the global crude oil price included (i) an increase in OPEC
production to 38.30 million barrels per day (higher than 37.46 million barrels per day in the
same period last year) which caused the global oil production in the first quarter of 2016 to be
at 95.47 million barrels per day (higher than 94.60 million barrels per day in the same period
last year); (ii) an increase in OECD (US, Canada, and others) inventory to 3,128 million
barrels (higher than 2,797 million barrels in the same period last year); and (iii) world
economic slowdown, causing the global demand to increase slowly.
The crude oil price in
the global market
declined due to an
increase in OPEC
production and OECD
inventory and the global
economic slowdown.
WTI Price Projection
Institution USD /barrel Previous Latest
Moody’s Investors Service 33.00 (Jan 2016) 33.00 (Jan 2016) EIA 38.54 (Jan 2016) 34.60 (Apr 2016) Barclays 37.00 (Jan 2016) 37.00 (Mar 2016) JP Morgan 31.50 (Jan 2016) 31.50 (Jan 2016) Source: Collected by NESDB
Crude oil price
Year USD per Barrel (%YOY)
OMAN DUBAI BRENT WTI Average OMAN DUBAI BRENT WTI Average
2014
Q1 104.39 104.26 107.90 98.47 103.76 -3.5 -3.6 -4.7 4.3 -2.1 Q2 106.22 106.10 109.74 103.04 106.27 5.4 5.4 6.0 9.3 6.5 Q3 101.59 101.28 103.38 96.28 100.63 -4.3 -4.5 -5.7 -8.9 -5.9 Q4 75.14 74.30 77.02 73.00 74.86 -29.7 -30.4 -29.6 -25.2 -28.8
Year 96.82 96.48 99.49 92.71 96.38 -8.2 -8.5 -8.6 -5.6 -7.7
2015
Q1 52.82 52.03 54.99 48.64 52.59 -49.4 -50.1 -49.0 -50.6 -49.3 Q2 61.30 61.12 63.54 57.97 60.98 -42.3 -42.4 -42.1 -43.7 -42.6 Q3 49.87 49.71 51.28 46.61 49.37 -50.9 -50.9 -50.4 -51.6 -50.9 Q4 40.71 40.61 44.62 42.14 42.02 -45.8 -45.3 -42.1 -42.3 -43.9
Year 51.17 50.87 53.61 48.84 51.12 -47.1 -47.3 -46.1 -47.3 -47.0
2016
Q1 31.20 31.30 35.09 32.46 32.51 -40.9 -39.8 -36.2 -33.3 -37.6 Jan 27.44 26.67 31.91 31.73 29.44 -40.9 -41.6 -35.9 -33.0 -37.8 Feb 30.03 29.19 33.55 30.61 30.84 -47.5 -47.9 -42.6 -39.8 -44.5 Mar 36.14 38.03 39.80 35.05 37.26 -34.1 -30.1 -29.9 -26.5 -30.3 Apr 39.17 38.75 43.21 40.98 40.53 -33.0 -33.6 -29.5 -25.1 -30.4 4M 31.20 31.30 35.09 32.46 32.51 -38.8 -38.2 -34.4 -31.0 -35.7
Source: Thaioil Plc and EPPO.
Macroeconomic Strategy and Planning Office May 16, 2016
Economic Outlook NESDB
23
3. The World economy in Q1 of 2016
In the first quarter of 2016, the world economy slowed down from the previous quarter due
mainly to (i) the lower-than expected US economic growth; (ii) the deceleration of the Chinese
growth amidst the financial volatility in the early period of this quarter; and (iii) the delay in
recovery of the European and the Japanese economies. A deceleration of those major
economies caused other emerging economies, and the world economy, to expand less than in
the last quarter of 2015. Coupled with the concerns over the stability of the Chinese economy
early on in this quarter, such conditions led to a decrease in oil and commodity prices, thereby
imposing a downward inflationary pressure in several countries, making it harder for them to
revert back to the monetary targets more slowly than previously anticipated. Consequently,
FED continued to maintain its current policy rate. Moreover, other major central banks
including Japan, China, and Europe also continued their monetary policy easing in order to
curtail the risk of economic deceleration and the deflationary pressure. As monetary policies
shifted amid concerns of economic slowdown and the changes in investors' sentiment
regarding the monetary policy stance of key countries, major currencies experienced more
fluctuation. The US dollar began to weaken against other major currencies, especially the Yen
and Euro, while the Yuan became more stable after sharp depreciation early on in this quarter.
US economy expanded at the slowest pace in 8-quarter periods; mismatched the market
expectations. In the first quarter of 2016, US economy expanded by 1.9 percent, slightly
slowing down from a 2.0-percent growth in the fourth quarter of 2015. A deceleration in
economic growth was mainly due to (i) fall in exports, (ii) decline in changes of inventories,
(iii) dramatic decrease in non-residential fixed investment, particularly in equipment, and
(iv) slowdown in private consumption. Nevertheless, improvements in the labor market
continued, which brought about decline in unemployment rate to the lowest level in 8 years.
Inflation rate remained low at 1.1 percent. Altogether, considering the deceleration in
economy with low inflation pressure; combined with higher risk of the market volatility and
decelerated global economy, the FOMC decided to maintain its policy rate and signaled more
gradual trend of further hike.
The Eurozone economy gradually expanded in accordance with an improvement in
domestic demand. In the first quarter of 2016, the Eurozone economy expanded by 1.6
percent, equivalent to the previous quarter. It was supported by a gradual improvement in
employment and continued accommodative monetary policy, which resulted in a stronger
domestic demand. However, inflation rate remained low at 0.0 percent, stepped down from 0.1
percent in the previous quarter, which led to higher deflationary risk. Hence, the ECB decided
to impose additional monetary easing measures in the meeting on 10th March 2016, consisting
of (i) reducing the Main Refinancing rate to 0.00 percent (ii) lowering the Marginal Lending
Facility to 0.25 percent (iii) decreasing the Deposit Facility to (-0.4) percent (iv) expanding
the amount of monthly asset purchase (QE) by 20 billion EUR and extending its condition to
purchase bonds issued by non-bank corporations and (v) providing low-interest loans to
commercial banks under TLTRO II program.
Japanese economy still experienced fragile recovery. Key indicators in the first quarter
showed signaled further economic slowdown. Export and manufacturing sectors declined due
to downturn in trading partners’ economies and appreciation in the Yen. Retail sales gradually
recovered while the inflation rate remained low. As a result, the BOJ decided to launch
additional monetary easing on 29th January 2016, in order to encourage commercial banks to
lend more credit for economic system by applying a negative interest rate and pursing an 80
trillion yen target to continue expanding the monetary base.
US economy expanded
by 1.9 percent, lowest
growth rate in 8
quarters. Meanwhile,
Fed decided to delay
policy rate hike.
Japan: economic
recovery remained weak.
As lower inflation and
higher appreciation in
Yen. BOJ introduced a
negative interest rate.
Eurozone economy
improved gradually.
Meanwhile, deflationary
pressure heightened,
leading the ECB to
reduce Deposit Facility
into negative territory
and expand the amount
of monthly asset
purchase by 20 billion
EUR.
Macroeconomic Strategy and Planning Office May 16, 2016
Economic Outlook NESDB
24
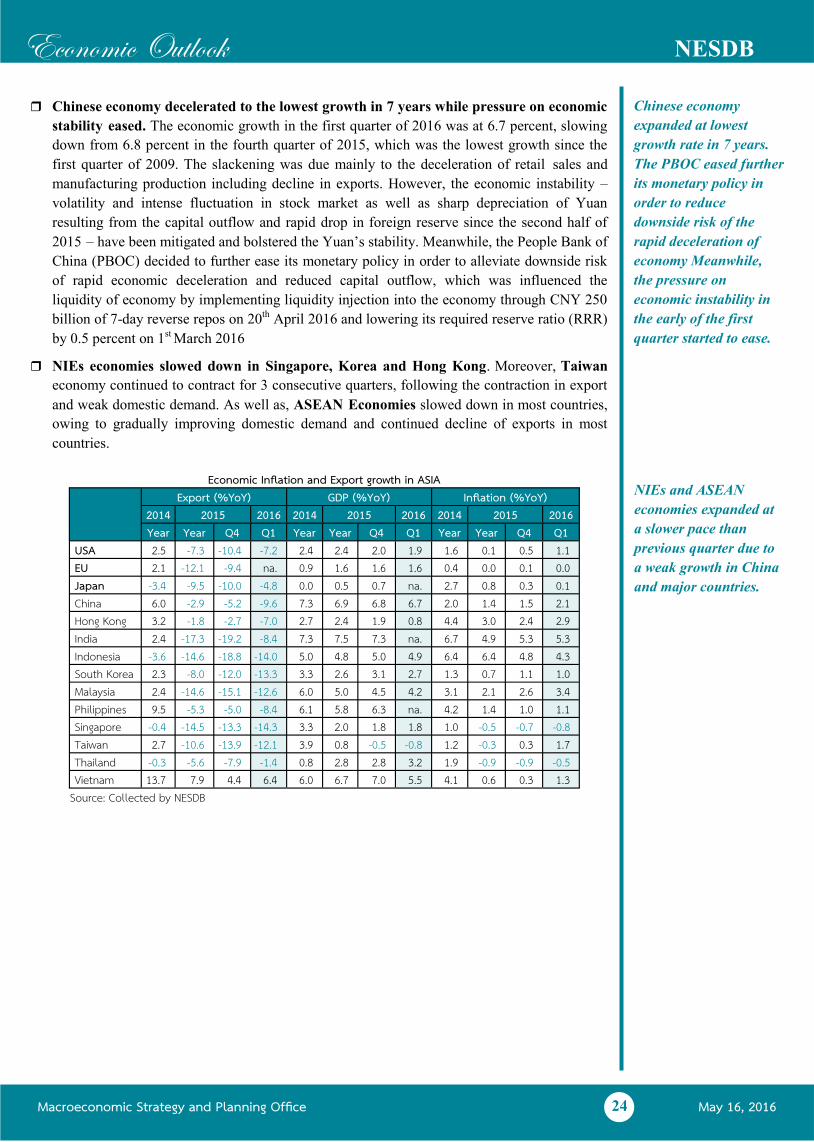
Chinese economy decelerated to the lowest growth in 7 years while pressure on economic
stability eased. The economic growth in the first quarter of 2016 was at 6.7 percent, slowing
down from 6.8 percent in the fourth quarter of 2015, which was the lowest growth since the
first quarter of 2009. The slackening was due mainly to the deceleration of retail sales and
manufacturing production including decline in exports. However, the economic instability –
volatility and intense fluctuation in stock market as well as sharp depreciation of Yuan
resulting from the capital outflow and rapid drop in foreign reserve since the second half of
2015 – have been mitigated and bolstered the Yuan’s stability. Meanwhile, the People Bank of
China (PBOC) decided to further ease its monetary policy in order to alleviate downside risk
of rapid economic deceleration and reduced capital outflow, which was influenced the
liquidity of economy by implementing liquidity injection into the economy through CNY 250
billion of 7-day reverse repos on 20th April 2016 and lowering its required reserve ratio (RRR)
by 0.5 percent on 1st March 2016
NIEs economies slowed down in Singapore, Korea and Hong Kong. Moreover, Taiwan
economy continued to contract for 3 consecutive quarters, following the contraction in export
and weak domestic demand. As well as, ASEAN Economies slowed down in most countries,
owing to gradually improving domestic demand and continued decline of exports in most
countries.
Chinese economy
expanded at lowest
growth rate in 7 years.
The PBOC eased further
its monetary policy in
order to reduce
downside risk of the
rapid deceleration of
economy Meanwhile,
the pressure on
economic instability in
the early of the first
quarter started to ease.
NIEs and ASEAN
economies expanded at
a slower pace than
previous quarter due to
a weak growth in China
and major countries.
Economic Inflation and Export growth in ASIA
Export (%YoY) GDP (%YoY) Inflation (%YoY)
2014 2015 2016 2014 2015 2016 2014 2016 2015 Year Year Q4 Q1 Year Year Q4 Q1 Year Year Q4 Q1
USA 2.5 -7.3 -10.4 -7.2 2.4 2.4 2.0 1.9 1.6 0.1 0.5 1.1 EU 2.1 -12.1 -9.4 na. 0.9 1.6 1.6 1.6 0.4 0.0 0.1 0.0 Japan -3.4 -9.5 -10.0 -4.8 0.0 0.5 0.7 na. 2.7 0.8 0.3 0.1 China 6.0 -2.9 -5.2 -9.6 7.3 6.9 6.8 6.7 2.0 1.4 1.5 2.1 Hong Kong 3.2 -1.8 -2.7 -7.0 2.7 2.4 1.9 0.8 4.4 3.0 2.4 2.9 India 2.4 -17.3 -19.2 -8.4 7.3 7.5 7.3 na. 6.7 4.9 5.3 5.3 Indonesia -3.6 -14.6 -18.8 -14.0 5.0 4.8 5.0 4.9 6.4 6.4 4.8 4.3 South Korea 2.3 -8.0 -12.0 -13.3 3.3 2.6 3.1 2.7 1.3 0.7 1.1 1.0 Malaysia 2.4 -14.6 -15.1 -12.6 6.0 5.0 4.5 4.2 3.1 2.1 2.6 3.4 Philippines 9.5 -5.3 -5.0 -8.4 6.1 5.8 6.3 na. 4.2 1.4 1.0 1.1 Singapore -0.4 -14.5 -13.3 -14.3 3.3 2.0 1.8 1.8 1.0 -0.5 -0.7 -0.8 Taiwan 2.7 -10.6 -13.9 -12.1 3.9 0.8 -0.5 -0.8 1.2 -0.3 0.3 1.7 Thailand -0.3 -5.6 -7.9 -1.4 0.8 2.8 2.8 3.2 1.9 -0.9 -0.9 -0.5 Vietnam 13.7 7.9 4.4 6.4 6.0 6.7 7.0 5.5 4.1 0.6 0.3 1.3
Source: Collected by NESDB
Macroeconomic Strategy and Planning Office May 16, 2016
Economic Outlook NESDB
25
4. The World economic outlook for 2016
In 2016, the world economy is expected to expand by 3.2 percent with a gradual pickup from
the 3.0-percent growth in 2015. This projection, however, is a downward revision of the
previous forecast of 3.3 percent growth. The world economy in the first quarter continued to
slowdown and grow less than in the fourth quarter in 2015, which constrained the global
economic recovery. Furthermore, world economic recovery in the rest of 2016 still faces a
number of limitations and risk factors including (i) the decelerating trend of Chinese economy
as concerns about its financial stability still persist, albeit at a lesser level than in early 2016,
(ii) United Kingdom’s referendum whether to remain in the European Union, (iii) dramatic and
continuous decline in global oil price which affected the recovery of countries which rely on
export of oil and primary goods, especially the ones facing stability issues, (iv) constraints in
using domestic economic stimulus imposed by high public and private debts, as well as
unprecedented low policy rates.
In baseline scenario, US economy is projected to expand by 2.4 percent equal to the growth
in 2015. Owing to the gradual pickup trend in the first quarter was recovery in labor market
causing the unemployment rate to drop to 4.9 percent, while labor income accelerated. Other
than that, the depreciation trend in US dollar, and expansion in public expenditure also
contributed to the improving prospects of US economy. Nevertheless, there are high
possibilities that FED will postpone the further policy rate hike toward the second half of 2016.
Upon the tendency of delaying prospects of further FED policy rate hike were purposes to
ensure (i) more obvious signs of US economic recovery after subdued growth rate in the first
quarter, (ii) lower risks toward deceleration of global economy, and (iii) tendency of achieving
inflation targeting rate. The Eurozone economy is expected to expand by 1.7 percent, close to
a 1.6-percent expansion in the previous year. The economic prospect in this year will be
mainly underpinned by an expansionary monetary policy which helps in strengthening the
labor market as well as supporting the economic recovery. Also, a progress in economic reform
will alleviate a drag from fiscal conditions. However, the economic recovery tends to be
gradually improved in the midst of the global economic slowdown, concerns over the United
Kingdom’s upcoming vote on whether to remain in the European Union and the risk of
terrorism. Moreover, the risk of deflationary pressure remains high which possibly lead ECB to
further loosen its monetary policy, especially when the effect of negative interest rate and
additional quantitative easing in the early-year including US’ monetary policy stance could be
clearly seen in the second half of the year. Japanese economy is expected to expand by 0.7
percent, slightly accelerating from 0.5 percent in 2015, as export and manufacturing sectors are
affected from the economic slowdown in trading-partner countries and appreciation of the Yen
Although the BOJ continues to conduct further monetary policy, domestic demand recovery
remains weak and the inflation rate is expected to remain subdued. According to this condition,
the BOJ tends to expand the monetary policy to lessen the pressure against the Yen
appreciation, reduce risk from the economic slowdown and to achieve the inflation
target. Chinese economy is expected to grow by 6.5 percent, slowing down from 6.9 percent
in 2015, owing to the gradual deceleration of domestic demand, a restriction on exportation
and the impact of structural reforms in the economy. However, the economic expansion
continues to be driven by the easing monetary policy over the upcoming months as well as the
fiscal stimulus measures at approximately 3.0 percent of the GDP; in addition, it is expected
that the People bank of China (PBOC) will further ease its monetary policy to maintain its
economic growth target range of 6.5 - 7.0 percent. Meanwhile, the pressure on capital outflow,
higher debt burdens and financial instability are expected to remain arising, despite these
factors declined in the early year.
Macroeconomic Strategy and Planning Office May 16, 2016
Economic Outlook NESDB
26
The deceleration in major economies caused other emerging economies in Asia to expand
more slowly than expected. NIEs economies: Korea, Taiwan, Hong Kong and Singapore
economies are expected to grow by 2.8, 1.5, 2.5 and 2.2 percent, accelerating from 2.6, 0.8, 2.4
and 2.0 percent in 2015, respectively. Most ASEAN Economies are likely to be decelerated as
the domestic demand and commodity prices remained low in the global market. The Malaysian
and Vietnam economies are expected to expand by 4.4 and 6.5 percent, decelerating from 5.0
and 6.7 percent in 2015, respectively. Meanwhile, The Indonesian economy is expected to
grow by 5.2 percent, accelerating from 4.8 percent in 2015 and The Philippines economy is
forecasted to develop by 5.8 percent, similar rate in 2015.
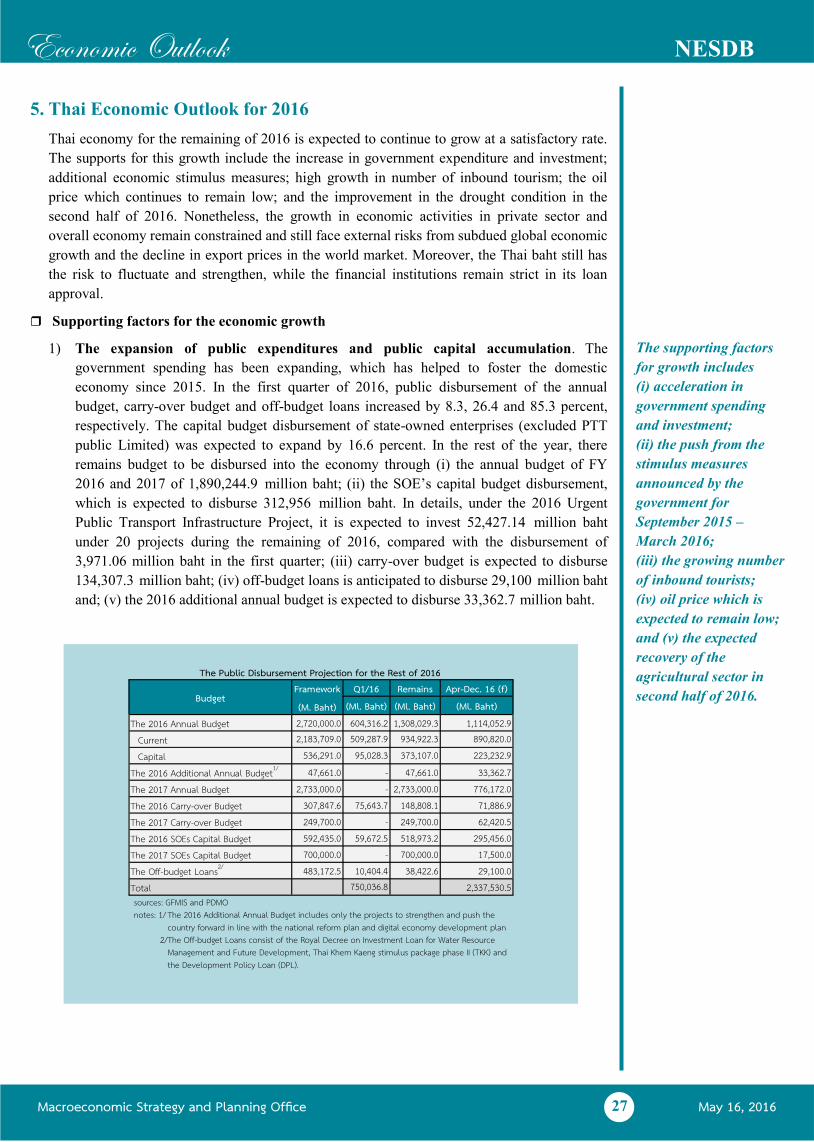
Macroeconomic Strategy and Planning Office May 16, 2016
Economic Outlook NESDB
27
5. Thai Economic Outlook for 2016
Thai economy for the remaining of 2016 is expected to continue to grow at a satisfactory rate.
The supports for this growth include the increase in government expenditure and investment;
additional economic stimulus measures; high growth in number of inbound tourism; the oil
price which continues to remain low; and the improvement in the drought condition in the
second half of 2016. Nonetheless, the growth in economic activities in private sector and
overall economy remain constrained and still face external risks from subdued global economic
growth and the decline in export prices in the world market. Moreover, the Thai baht still has
the risk to fluctuate and strengthen, while the financial institutions remain strict in its loan
approval.
Supporting factors for the economic growth
1) The expansion of public expenditures and public capital accumulation. The
government spending has been expanding, which has helped to foster the domestic
economy since 2015. In the first quarter of 2016, public disbursement of the annual
budget, carry-over budget and off-budget loans increased by 8.3, 26.4 and 85.3 percent,
respectively. The capital budget disbursement of state-owned enterprises (excluded PTT
public Limited) was expected to expand by 16.6 percent. In the rest of the year, there
remains budget to be disbursed into the economy through (i) the annual budget of FY
2016 and 2017 of 1,890,244.9 million baht; (ii) the SOE’s capital budget disbursement,
which is expected to disburse 312,956 million baht. In details, under the 2016 Urgent
Public Transport Infrastructure Project, it is expected to invest 52,427.14 million baht
under 20 projects during the remaining of 2016, compared with the disbursement of
3,971.06 million baht in the first quarter; (iii) carry-over budget is expected to disburse
134,307.3 million baht; (iv) off-budget loans is anticipated to disburse 29,100 million baht
and; (v) the 2016 additional annual budget is expected to disburse 33,362.7 million baht.
The supporting factors
for growth includes
(i) acceleration in
government spending
and investment;
(ii) the push from the
stimulus measures
announced by the
government for
September 2015 –
March 2016;
(iii) the growing number
of inbound tourists;
(iv) oil price which is
expected to remain low;
and (v) the expected
recovery of the
agricultural sector in
second half of 2016.
The Public Disbursement Projection for the Rest of 2016
Budget Framework
(M. Baht)
Q1/16 Remains Apr-Dec. 16 (f) (Ml. Baht) (Ml. Baht) (Ml. Baht)
The 2016 Annual Budget 2,720,000.0 604,316.2 1,308,029.3 1,114,052.9 Current 2,183,709.0 509,287.9 934,922.3 890,820.0 Capital 536,291.0 95,028.3 373,107.0 223,232.9
The 2016 Additional Annual Budget1/ 47,661.0 - 47,661.0 33,362.7 The 2017 Annual Budget 2,733,000.0 - 2,733,000.0 776,172.0 The 2016 Carry-over Budget 307,847.6 75,643.7 148,808.1 71,886.9 The 2017 Carry-over Budget 249,700.0 - 249,700.0 62,420.5 The 2016 SOEs Capital Budget 592,435.0 59,672.5 518,973.2 295,456.0 The 2017 SOEs Capital Budget 700,000.0 - 700,000.0 17,500.0 The Off-budget Loans2/ 483,172.5 10,404.4 38,422.6 29,100.0 Total 750,036.8 2,337,530.5 sources: GFMIS and PDMO notes: 1/ The 2016 Additional Annual Budget includes only the projects to strengthen and push the
country forward in line with the national reform plan and digital economy development plan 2/The Off-budget Loans consist of the Royal Decree on Investment Loan for Water Resource
Management and Future Development, Thai Khem Kaeng stimulus package phase II (TKK) and the Development Policy Loan (DPL).
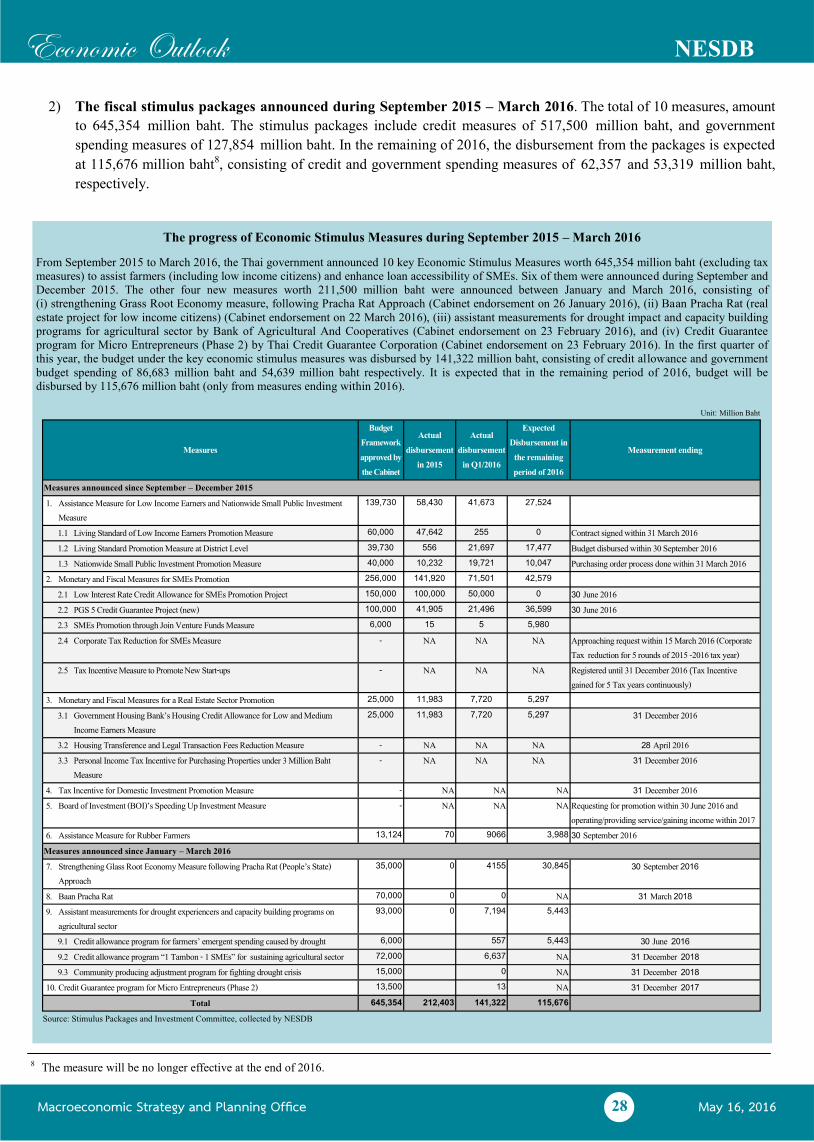
Macroeconomic Strategy and Planning Office May 16, 2016
Economic Outlook NESDB
28
2) The fiscal stimulus packages announced during September 2015 – March 2016. The total of 10 measures, amount
to 645,354 million baht. The stimulus packages include credit measures of 517,500 million baht, and government
spending measures of 127,854 million baht. In the remaining of 2016, the disbursement from the packages is expected
at 115,676 million baht8, consisting of credit and government spending measures of 62,357 and 53,319 million baht,
respectively.
8 The measure will be no longer effective at the end of 2016.
The progress of Economic Stimulus Measures during September 2015 – March 2016
From September 2015 to March 2016, the Thai government announced 10 key Economic Stimulus Measures worth 645,354 million baht (excluding tax
measures) to assist farmers (including low income citizens) and enhance loan accessibility of SMEs. Six of them were announced during September and
December 2015. The other four new measures worth 211,500 million baht were announced between January and March 2016, consisting of
(i) strengthening Grass Root Economy measure, following Pracha Rat Approach (Cabinet endorsement on 26 January 2016), (ii) Baan Pracha Rat (real
estate project for low income citizens) (Cabinet endorsement on 22 March 2016), (iii) assistant measurements for drought impact and capacity building
programs for agricultural sector by Bank of Agricultural And Cooperatives (Cabinet endorsement on 23 February 2016), and (iv) Credit Guarantee
program for Micro Entrepreneurs (Phase 2) by Thai Credit Guarantee Corporation (Cabinet endorsement on 23 February 2016). In the first quarter of
this year, the budget under the key economic stimulus measures was disbursed by 141,322 million baht, consisting of credit allowance and government
budget spending of 86,683 million baht and 54,639 million baht respectively. It is expected that in the remaining period of 2016, budget will be
disbursed by 115,676 million baht (only from measures ending within 2016).
Unit: Million Baht
Measures
Budget Framework approved by the Cabinet
Actual disbursement
in 2015
Actual disbursement
in Q1/2016
Expected Disbursement in
the remaining period of 2016
Measurement ending
Measures announced since September – December 2015 1. Assistance Measure for Low Income Earners and Nationwide Small Public Investment
Measure 139,730 58,430 41,673 27,524
1.1 Living Standard of Low Income Earners Promotion Measure 60,000 47,642 255 0 Contract signed within 31 March 2016 1.2 Living Standard Promotion Measure at District Level 39,730 556 21,697 17,477 Budget disbursed within 30 September 2016 1.3 Nationwide Small Public Investment Promotion Measure 40,000 10,232 19,721 10,047 Purchasing order process done within 31 March 2016
2. Monetary and Fiscal Measures for SMEs Promotion 256,000 141,920 71,501 42,579 2.1 Low Interest Rate Credit Allowance for SMEs Promotion Project 150,000 100,000 50,000 0 30 June 2016 2.2 PGS 5 Credit Guarantee Project (new) 100,000 41,905 21,496 36,599 30 June 2016 2.3 SMEs Promotion through Join Venture Funds Measure 6,000 15 5 5,980 2.4 Corporate Tax Reduction for SMEs Measure - NA NA NA Approaching request within 15 March 2016 (Corporate
Tax reduction for 5 rounds of 2015 -2016 tax year) 2.5 Tax Incentive Measure to Promote New Start-ups - NA NA NA Registered until 31 December 2016 (Tax Incentive
gained for 5 Tax years continuously) 3. Monetary and Fiscal Measures for a Real Estate Sector Promotion 25,000 11,983 7,720 5,297
3.1 Government Housing Bank’s Housing Credit Allowance for Low and Medium Income Earners Measure
25,000 11,983 7,720 5,297 31 December 2016
3.2 Housing Transference and Legal Transaction Fees Reduction Measure - NA NA NA 28 April 2016 3.3 Personal Income Tax Incentive for Purchasing Properties under 3 Million Baht
Measure - NA NA NA 31 December 2016
4. Tax Incentive for Domestic Investment Promotion Measure - NA NA NA 31 December 2016 5. Board of Investment (BOI)’s Speeding Up Investment Measure - NA NA NA Requesting for promotion within 30 June 2016 and
operating/providing service/gaining income within 2017 6. Assistance Measure for Rubber Farmers 13,124 70 9066 3,988 30 September 2016
Measures announced since January – March 2016 7. Strengthening Glass Root Economy Measure following Pracha Rat (People’s State)
Approach 35,000 0 4155 30,845 30 September 2016
8. Baan Pracha Rat 70,000 0 0 NA 31 March 2018 9. Assistant measurements for drought experiencers and capacity building programs on
agricultural sector 93,000 0 7,194 5,443
9.1 Credit allowance program for farmers’ emergent spending caused by drought 6,000 557 5,443 30 June 2016 9.2 Credit allowance program “1 Tambon - 1 SMEs” for sustaining agricultural sector 72,000 6,637 NA 31 December 2018 9.3 Community producing adjustment program for fighting drought crisis 15,000 0 NA 31 December 2018
10. Credit Guarantee program for Micro Entrepreneurs (Phase 2) 13,500 13 NA 31 December 2017 Total 645,354 212,403 141,322 115,676
Source: Stimulus Packages and Investment Committee, collected by NESDB
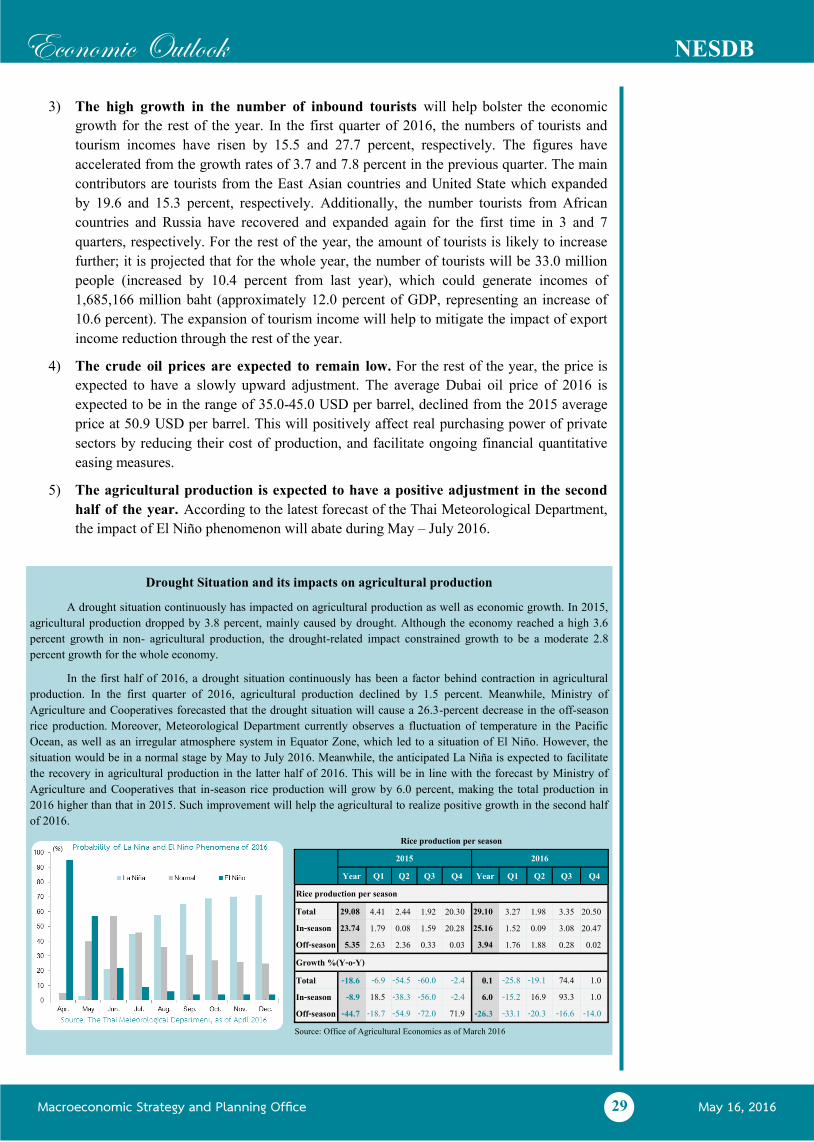
Macroeconomic Strategy and Planning Office May 16, 2016
Economic Outlook NESDB
29
3) The high growth in the number of inbound tourists will help bolster the economic
growth for the rest of the year. In the first quarter of 2016, the numbers of tourists and
tourism incomes have risen by 15.5 and 27.7 percent, respectively. The figures have
accelerated from the growth rates of 3.7 and 7.8 percent in the previous quarter. The main
contributors are tourists from the East Asian countries and United State which expanded
by 19.6 and 15.3 percent, respectively. Additionally, the number tourists from African
countries and Russia have recovered and expanded again for the first time in 3 and 7
quarters, respectively. For the rest of the year, the amount of tourists is likely to increase
further; it is projected that for the whole year, the number of tourists will be 33.0 million
people (increased by 10.4 percent from last year), which could generate incomes of
1,685,166 million baht (approximately 12.0 percent of GDP, representing an increase of
10.6 percent). The expansion of tourism income will help to mitigate the impact of export
income reduction through the rest of the year.
4) The crude oil prices are expected to remain low. For the rest of the year, the price is
expected to have a slowly upward adjustment. The average Dubai oil price of 2016 is
expected to be in the range of 35.0-45.0 USD per barrel, declined from the 2015 average
price at 50.9 USD per barrel. This will positively affect real purchasing power of private
sectors by reducing their cost of production, and facilitate ongoing financial quantitative
easing measures.
5) The agricultural production is expected to have a positive adjustment in the second
half of the year. According to the latest forecast of the Thai Meteorological Department,
the impact of El Niño phenomenon will abate during May – July 2016.
Drought Situation and its impacts on agricultural production
A drought situation continuously has impacted on agricultural production as well as economic growth. In 2015,
agricultural production dropped by 3.8 percent, mainly caused by drought. Although the economy reached a high 3.6
percent growth in non- agricultural production, the drought-related impact constrained growth to be a moderate 2.8
percent growth for the whole economy.
In the first half of 2016, a drought situation continuously has been a factor behind contraction in agricultural
production. In the first quarter of 2016, agricultural production declined by 1.5 percent. Meanwhile, Ministry of
Agriculture and Cooperatives forecasted that the drought situation will cause a 26.3-percent decrease in the off-season
rice production. Moreover, Meteorological Department currently observes a fluctuation of temperature in the Pacific
Ocean, as well as an irregular atmosphere system in Equator Zone, which led to a situation of El Niño. However, the
situation would be in a normal stage by May to July 2016. Meanwhile, the anticipated La Niña is expected to facilitate
the recovery in agricultural production in the latter half of 2016. This will be in line with the forecast by Ministry of
Agriculture and Cooperatives that in-season rice production will grow by 6.0 percent, making the total production in
2016 higher than that in 2015. Such improvement will help the agricultural to realize positive growth in the second half
of 2016.
Rice production per season
2015 2016
Year Q1 Q2 Q3 Q4 Year Q1 Q2 Q3 Q4 Rice production per season Total 29.08 4.41 2.44 1.92 20.30 29.10 3.27 1.98 3.35 20.50 In-season 23.74 1.79 0.08 1.59 20.28 25.16 1.52 0.09 3.08 20.47 Off-season 5.35 2.63 2.36 0.33 0.03 3.94 1.76 1.88 0.28 0.02 Growth %(Y-o-Y) Total -18.6 -6.9 -54.5 -60.0 -2.4 0.1 -25.8 -19.1 74.4 1.0 In-season -8.9 18.5 -38.3 -56.0 -2.4 6.0 -15.2 16.9 93.3 1.0 Off-season -44.7 -18.7 -54.9 -72.0 71.9 -26.3 -33.1 -20.3 -16.6 -14.0 Source: Office of Agricultural Economics as of March 2016
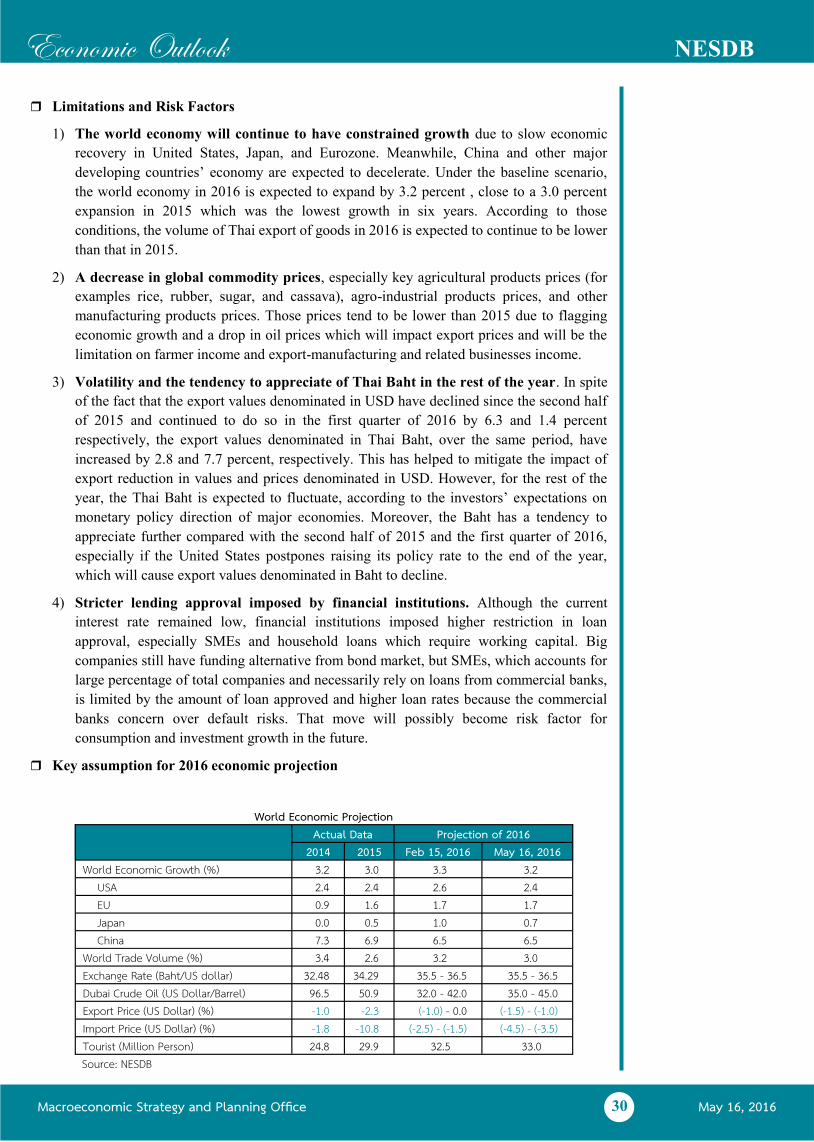
Macroeconomic Strategy and Planning Office May 16, 2016
Economic Outlook NESDB
30
Limitations and Risk Factors
1) The world economy will continue to have constrained growth due to slow economic
recovery in United States, Japan, and Eurozone. Meanwhile, China and other major
developing countries’ economy are expected to decelerate. Under the baseline scenario,
the world economy in 2016 is expected to expand by 3.2 percent , close to a 3.0 percent
expansion in 2015 which was the lowest growth in six years. According to those
conditions, the volume of Thai export of goods in 2016 is expected to continue to be lower
than that in 2015.
2) A decrease in global commodity prices, especially key agricultural products prices (for
examples rice, rubber, sugar, and cassava), agro-industrial products prices, and other
manufacturing products prices. Those prices tend to be lower than 2015 due to flagging
economic growth and a drop in oil prices which will impact export prices and will be the
limitation on farmer income and export-manufacturing and related businesses income.
3) Volatility and the tendency to appreciate of Thai Baht in the rest of the year. In spite
of the fact that the export values denominated in USD have declined since the second half
of 2015 and continued to do so in the first quarter of 2016 by 6.3 and 1.4 percent
respectively, the export values denominated in Thai Baht, over the same period, have
increased by 2.8 and 7.7 percent, respectively. This has helped to mitigate the impact of
export reduction in values and prices denominated in USD. However, for the rest of the
year, the Thai Baht is expected to fluctuate, according to the investors’ expectations on
monetary policy direction of major economies. Moreover, the Baht has a tendency to
appreciate further compared with the second half of 2015 and the first quarter of 2016,
especially if the United States postpones raising its policy rate to the end of the year,
which will cause export values denominated in Baht to decline.
4) Stricter lending approval imposed by financial institutions. Although the current
interest rate remained low, financial institutions imposed higher restriction in loan
approval, especially SMEs and household loans which require working capital. Big
companies still have funding alternative from bond market, but SMEs, which accounts for
large percentage of total companies and necessarily rely on loans from commercial banks,
is limited by the amount of loan approved and higher loan rates because the commercial
banks concern over default risks. That move will possibly become risk factor for
consumption and investment growth in the future.
Key assumption for 2016 economic projection
World Economic Projection
Actual Data Projection of 2016
2014 2015 Feb 15, 2016 May 16, 2016 World Economic Growth (%) 3.2 3.0 3.3 3.2
USA 2.4 2.4 2.6 2.4 EU 0.9 1.6 1.7 1.7 Japan 0.0 0.5 1.0 0.7 China 7.3 6.9 6.5 6.5
World Trade Volume (%) 3.4 2.6 3.2 3.0 Exchange Rate (Baht/US dollar) 32.48 34.29 35.5 - 36.5 35.5 - 36.5 Dubai Crude Oil (US Dollar/Barrel) 96.5 50.9 32.0 - 42.0 35.0 - 45.0 Export Price (US Dollar) (%) -1.0 -2.3 (-1.0) - 0.0 (-1.5) - (-1.0) Import Price (US Dollar) (%) -1.8 -10.8 (-2.5) - (-1.5) (-4.5) - (-3.5) Tourist (Million Person) 24.8 29.9 32.5 33.0 Source: NESDB
Macroeconomic Strategy and Planning Office May 16, 2016
Economic Outlook NESDB
31
1) The world economy and world trade volumes in 2016 are projected to grow by 3.2
and 3.0 percent respectively, revising down from 3.3 and 3.2 percent in the previous
projection. This downward revision due to the lower-than expected growths of major
economies, especially US, Japan and key Asian economies and in the remaining of 2016 is
likely to recover slowly.
2) The average Thai Baht value of 2016 is expected to be in the range of 35.5 – 36.5 Baht
per US dollar, depreciating from average of 34.29 Baht per US dollar in 2015 and equivalent
to the previous projection. The average Thai baht in the first four months was at 35.51 Baht per
US dollar. In the remaining of 2016, Thai baht is likely to appreciate until the Fed signals
raising its interest rate, which is anticipated to be in the second half of the year.
3) The average Dubai crude oil prices in 2016 is expected to be in the range of 35.0–45.0
US dollar per barrel, lower than 50.9 US dollar per barrel in 2015 and revising up from
32.0–42.0 US dollar per barrel in the previous assumption. The reasons for this revision
includes (i) the appreciation of US dollar is likely to be slower than expected, as a result of
Fed’s decision to postpone raising its policy rate; (ii) a decrease in price of crude oil has
caused demands for oil to rise faster than expectation, although the global economic
recovery has been at a sluggish pace. Additionally, oil production in non-OPEC countries
especially in the United State has started to decline (on 6 May 2016, the operating oil rigs
in the United State were 328 rigs, which was lowest in 6 years, or declining by 80 percent
compared with 1,601 rigs, which were highest level in September 2014). This would lead
to a deceleration in oil stock and cause an upward pressure on crude oil prices.
4) Export price of goods in US Dollar term is likely to decline by (-1.5) – (-1.0) percent
compared with a decline by 2.3 percent in 2015, revising from (-1.0) - 0.0 in the previous
estimation. The revision is mainly due to the lower-than-expected export price in the first
quarter, especially agricultural price, which contracted by 9.1 percent, compared with a
contraction of 8.4 percent in previous quarter. Import price of goods declines by (-4.5) –
(-3.5) percent compare with a contraction of 10.8 percent in 2015 and revising down from
a contraction by (-2.5) – (-1.5) percent in the previous projection due to the fact that a
reduction in import price in the first quarter was lower than estimate, together with a
slowdown in non-oil import prices.
5) The number of tourist in 2016 is expected to be 33 million people, increasing by 10.4
percent from 29.9 million people in 2015, and the figure is revised upwardly from previous
assumption of 32.5 million people. Meanwhile, income from tourism in 2016 is projected to be
at 1.69 trillion Baht in 2016, growing by 10.6 percent from 1.52 trillion Baht in 2015 because
the number of tourists has increased higher than expectation and is likely to expand further in
the rest of the year. The supporting factors includes: (i) domestic political stability;
(ii) Thailand is still a highly popular destination; (iii) an increase in economically short-haul
international routes operated by low-cost airlines, and (iv) Russian economy has been more
stability..
6) Government disbursements are expected to disburse as follow: (i) FY 2016 annual
budget of 92.9 percent of the overall budget, including current and capital expenditure
budget disbursement of 98.0 and 72.0 percent; (ii) State-owned enterprises’ capital budget
disbursement of 70.0 percent; (iii) Carry-over budget disbursement of 75.0 percent;
(iv) Off-budget loans of 63,600 million Baht, including Thai Khem Kaeng stimulus
package, the Development Policy Loans (DPL) and water resource management and road
transport system projects, compared with 44,200 million Baht in FY 2015 and;
(v) Additional government budget framework of 56,000 million baht that was disbursed
by 33,362.7 million Baht.
Macroeconomic Strategy and Planning Office May 16, 2016
Economic Outlook NESDB
32
Economic Projection for 2016:
The Thai economy in 2016 is projected to grow in the range of 3.0 – 3.5 percent, improving
from 2.8 percent in 2015. Headline inflation is expected to lie between 0.1 – 0.6 percent. The
current account balance is forecasted to register a surplus of 9.4 percent of GDP.
In the press release on 16th May 2016, NESDB estimated that the Thai economy will expand
by 3.0 – 3.5 percent, narrowing down the projection range with revised estimation of growth
components. Key reasons for the revision are as follows:
1) Thai economy in the first quarter of 2016 grew by 3.2 percent, which is close to the
projected average growth of 3.3 percent of the 2.8 – 3.8 percent growth projection
announced in previous report. Moreover, the chances that the Thai economy will grow
more than 3.5 percent is less likely as the global economic situation increasingly impose
constraint on Thai export. Furthermore, it is also less likely that the Thai economy will
grow by less than 3.0 percent as the agricultural sector is expected to improve in the
second half of the year due to the anticipated end of the El Niño. Therefore, NESDB
revises its economic growth expectation from 2.8 – 3.8 percent to be a narrower band of
3.0 – 3.5 percent, with the same average growth projection of 3.3 percent as in the
previous forecast.
2) The revision of growth components to be more in line with the facts in the first quarter of
2016, and the key forecast assumptions consist of: (i) reduced forecast of global economic
growth and global trade, as well as a downward revision of export price which will
adversely impact the drive for growth from export sector to be lower than previous
projection; (ii) an upward revision in the number of inbound tourists projection, which will
positively contribute to economic growth through export of services, and (iii) a reduction
in assumption of government budget disbursement rate in 2016 from 93.4 percent to 92.9
percent, as well as an increase in government budget due to the 33.3-billion baht
additional annual budget for this fiscal year, which will positively impact the contribution
from government spending on economic growth.
Key contributions to the economic growth
1) Private consumption expenditure is expected to grow by 2.3 percent, accelerating
gradually from 2.1 percent in 2015, but still lower than a 2.7 percent growth in the
previous projection. The revision is due to the downward adjustment of exports and major
agricultural prices which still show no clear recovery sign yet, causing a sluggish growth
for household income. However, the low price of crude oil, together with an expansion of
income from tourism, and fiscal stimulus packages to support farmer and low-income
earners, will support an ongoing growth of household consumption. Meanwhile, public
expenditure is expected to grow by 3.9 percent, accelerating from 2.2 percent in 2015,
which is an upward revision from 3.7 percent in the previous projection. The revision is
due to the fact that the government has enacted an additional annual budget act in fiscal
year 2016.
2) Total investment is expected to expand by 4.2 percent, slightly decelerating from 4.7
percent in 2015. This is a slight downward revision from 4.9 percent in the previous
projection. Private investment is expected to grow by 2.1 percent, picking up from a 2.0
percent contraction in 2015, but revising downwardly from the 3.2 percent in the previous
projection. This is due to the fact that the growth rate was lower than estimation in the first
quarter, and capacity utilization in several industries remained low in line with the
sluggish growth of the export-oriented industries; although domestic investment climate
has been improving from various supporting factors, including low interest rates, and the
The Thai economy in
2016 is projected to grow
in the range of 3.0 – 3.5
percent, improving from
2.8 percent in 2015.
Headline inflation is
expected to lie between
0.1 – 0.6 percent. The
current account balance
is forecasted to register a
surplus of 9.4 percent of
GDP.
It is forecasted that
export value will fall by
1.7 percent; private
consumption and total
investment will increase
by 2.3 and 4.2 percent,
respectively. Headline
inflation is expected to
lie between 0.1 – 0.6
percent; and the current
account balance to
register a surplus of 9.4
percent of GDP.
Macroeconomic Strategy and Planning Office May 16, 2016
Economic Outlook NESDB
33
government’s key investment projects are in good progress. Public investment is
expected to grow by 11.7 percent, decelerating from 29.8 percent due to a high base in the
same period of last year. Yet, an upward revision from the previous projection is owed to
the disbursement being higher than the target in the first quarter.
3) Export value of goods in US dollar term is likely to decline by 1.7 percent, improving
from a contraction of 5.6 percent in 2015, revising down from a 1.2 percent growth in the
previous quarter. The revision was mainly due to a downward revision in export prices
and volumes due to downward adjustments on world economic growth and world trade
volumes. However, an upward adjustment on export volumes of services is higher than the
previous projection following an increase adjustment on the number of tourist assumption.
Thus, Volume of export of goods and services is expected to expand by 2.0 percent,
improving from 0.2 percent in 2015.
4) Import value of goods in US dollars term is forecasted to contract by 4.6 percent;
compared with a 11.3 percent contraction in 2015; which is revised downward from an
expansion of 1.3 percent in previous estimation. This revision is owed to the downward
revision in import price from a contraction by (-2.5) – (-1.5) to (-4.5) – (-3.5) percent and
the lower estimation in export growth and private investment which cause a decline in
demand for import from previous estimation. Import volume of goods and services is
expected to grow by 0.0 percent compared with a 0.4 percent contraction in 2015.
5) Trade balance is projected to register a surplus of 39.1 billion US dollars, increasing
from 34.6 billion US dollars in 2015, representing an upward revision from 34.8 billion
US dollars in previous estimation due to the revision in import value being revised down
proportionately more than the export value. Meanwhile, the current account is expected to
register a surplus of 36.5 billion US dollars, or an equivalence of 9.4 percent of GDP,
increasing from 8.2 percent of GDP in the preceding forecast mainly due to an increase in
trade surplus.
6) Economic Stability remains favorable. The average headline inflation in 2016 is
projected to be in the range of 0.1 - 0.6 percent, compared with a decline of 0.9 percent in
2015 and the range of (-0.1) – 0.9 percent in the preceding forecast.
Macroeconomic Strategy and Planning Office May 16, 2016
Economic Outlook NESDB
34
6. Economic Management in 2016
Overall, the Thai economy in 2016 is expected to have a satisfactory growth rate, given the
global economic slowdown, the subdued agricultural prices in the world market, and the severe
drought in the first half of the year. Nonetheless, Thai economic growth still can rely on the
public spending and the growth in tourism sector. Meanwhile, the recovery of the agriculture
sector, the export sector and the related enterprises remain slow. Given such conditions, the
economic management in the remaining of 2016 should give priority to the momentum in
government spending and public investment, and supporting the growth in tourism sector to
continue to grow in order to maintain the growth dynamics in the rest of 2016. Moreover, the
private sector’s constraints, especially that of the agricultural and export sectors, should be
addressed and resolved so that they can contribute to economic growth in 2017 when the push
from public sector is expected to be less forceful. The key policy issues are as follows.
1) Achieving target of public spending and the implementation of key public
infrastructure according to their action planned. This is in particular (i) the 2016 annual
budget, (with 92.9 percent of total budget expected disbursement rate); (ii) the 2016 carry-
over budget (with no less than the expected disbursement rate of 75.0 percent); (iii) the
SOE’s capital budget (with no less than the expected disbursement rate of 70.0 percent). By
accelerating the bidding process of 9 key projects ready for bidding (worth 488,634.79
million baht), all of which are under the 2016 Urgent Action Plan for Public Transport
Infrastructure Projects, to finish as soon as possible will help spurring public spending and
capital accumulation and help to foster the economic growth aside from fiscal stimulus
packages; (iv) the off-budget loans (with 63,600 million baht expected disbursement); and
(V) the 2016 additional annual budget (with 33,362.7 million baht expected disbursement).
2) The implementation of key measures under the economic stimulus package already
approved to be completed as planned (with 115,676 million baht expected disbursement) in
order to support income of farmers and low-income earners, as well as to promote credit
accessibility for SMEs. There have been 4 more measures approved in the first quarter of
2016, including (i) strengthening Grassroots Economy Projects in line with Civil
Partnership Principle; (ii) Civil Partnership Housing Program; (iii) Financial Assistance
Measure for Drought Mitigation and Competitiveness Improvement Measure for
Agriculture; and (iv) Credit Guarantee Measure for Micro Entrepreneur Phase II. These 4
measures account for 211,500 million baht in total.
3) Reducing the fluctuation and maintaining the value of Thai baht to be in line with key
economic conditions, especially (i) the reduced export quantity and prices in US dollars;
(ii) the strictness in approving loans by financial institutions; and (iii) the probability that
the FED will postpone raising US interest rate which will put more pressure on the Thai
baht to appreciate.
4) Assisting farmers and preparing them for the plantation in 2016/2017 season:
Meteorological Department forecasts that the effects from El Niño will subside by May –
July, and it is anticipated that La Niña will occur during late 2016 which will positively
affect the agricultural sector. Preparing for such opportunity will have to rely on access to
loans by farmers for the new growing season. The prices of essential farming factors should
be kept in line with the international prices, especially that of the petro-chemical materials.
Moreover, crop-share farm lease should be promoted over the conventional rent paid in
sum. The support on farming machines and equipment should also be provided for farmers
who can form a cooperation or co-production. Furthermore, crop insurance should be
provided for farmers to mitigate risks.
Macroeconomic Strategy and Planning Office May 16, 2016
Economic Outlook NESDB
35
5) Supporting the recovery and the expansion of private investment by (i) promoting and
supporting investors to utilize investment privileges already approved by the cabinet, such
as, tax incentive for investment promotion, investment acceleration measures under BOI,
and fiscal and monetary measures to promote SMEs; and (ii) implementing proactive
measures to incentivize investors to invest in the targeted industries and service sectors
which will contribute to future development of the country, such as targeted industries and
services listed under industrial cluster development and the supporting framework for
International Headquarters (IHQ) and International Trading Center (ITC).
6) Effectively implementing measures under Thailand’s International Trade Strategies
2016 announced by Ministry of Commerce to increase exports, especially by
(i) promoting and facilitating border trade promotion within CLMV countries; (ii) seeking
for new trade and service markets particularly those service sector that Thailand has
advantages and being well known for; (iii) collaborating with private sectors in seeking
new potential markets; and (iv) reducing obstacles and red tapes caused by the
government’s operational process and regulations.
7) Launching Thailand’s tourism promotion campaign activities in major tourism clusters
and also developing tourism-related products together with neighboring countries, as well
as solving key problems such as frauds against tourists, safety, crowdedness and cleanliness
of tourism sites. .
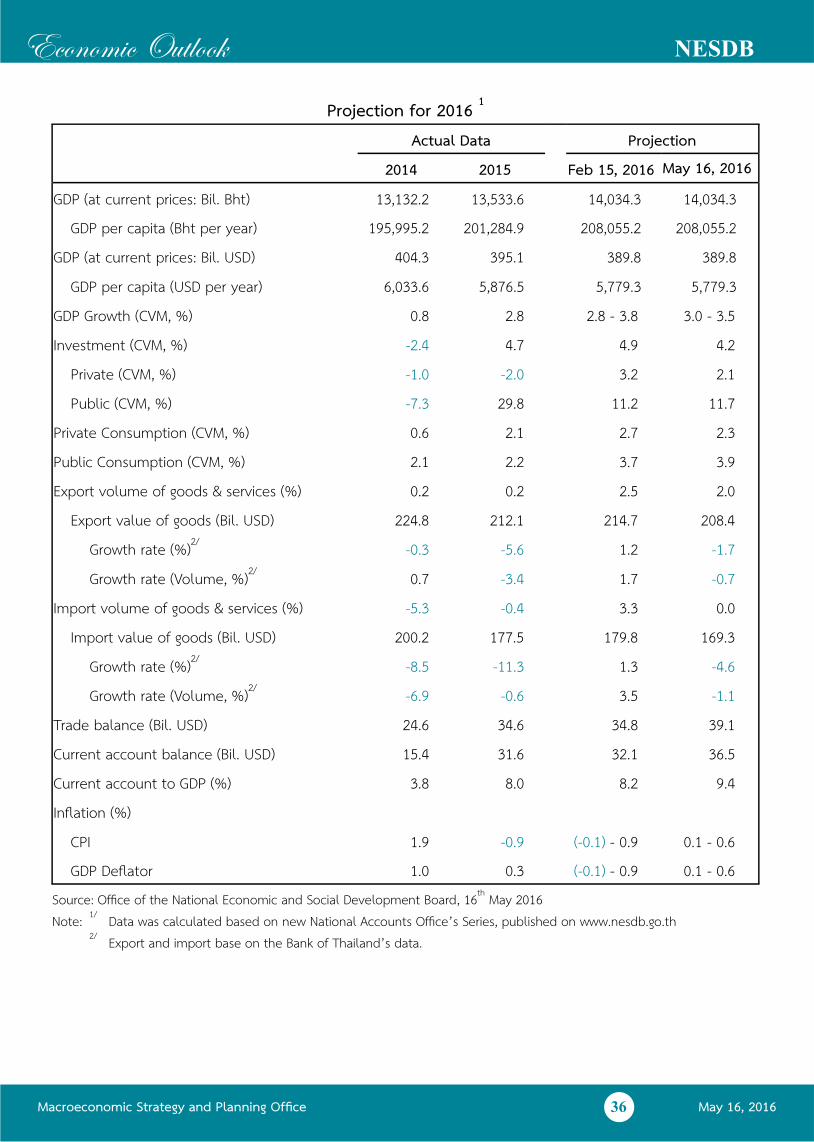
Macroeconomic Strategy and Planning Office May 16, 2016
Economic Outlook NESDB
36
Projection for 2016 1
Actual Data Projection
2014 2015 Feb 15, 2016 May 16, 2016
GDP (at current prices: Bil. Bht) 13,132.2 13,533.6 14,034.3 14,034.3 GDP per capita (Bht per year) 195,995.2 201,284.9 208,055.2 208,055.2
GDP (at current prices: Bil. USD) 404.3 395.1 389.8 389.8
GDP per capita (USD per year) 6,033.6 5,876.5 5,779.3 5,779.3
GDP Growth (CVM, %) 0.8 2.8 2.8 - 3.8 3.0 - 3.5
Investment (CVM, %) -2.4 4.7 4.9 4.2
Private (CVM, %) -1.0 -2.0 3.2 2.1
Public (CVM, %) -7.3 29.8 11.2 11.7
Private Consumption (CVM, %) 0.6 2.1 2.7 2.3
Public Consumption (CVM, %) 2.1 2.2 3.7 3.9
Export volume of goods & services (%) 0.2 0.2 2.5 2.0
Export value of goods (Bil. USD) 224.8 212.1 214.7 208.4
Growth rate (%)2/ -0.3 -5.6 1.2 -1.7
Growth rate (Volume, %)2/ 0.7 -3.4 1.7 -0.7
Import volume of goods & services (%) -5.3 -0.4 3.3 0.0
Import value of goods (Bil. USD) 200.2 177.5 179.8 169.3
Growth rate (%)2/ -8.5 -11.3 1.3 -4.6
Growth rate (Volume, %)2/ -6.9 -0.6 3.5 -1.1
Trade balance (Bil. USD) 24.6 34.6 34.8 39.1
Current account balance (Bil. USD) 15.4 31.6 32.1 36.5
Current account to GDP (%) 3.8 8.0 8.2 9.4
Inflation (%)
CPI 1.9 -0.9 (-0.1) - 0.9 0.1 - 0.6
GDP Deflator 1.0 0.3 (-0.1) - 0.9 0.1 - 0.6
Source: Office of the National Economic and Social Development Board, 16th May 2016 Note: 1/ Data was calculated based on new National Accounts Office’s Series, published on www.nesdb.go.th
2/ Export and import base on the Bank of Thailand’s data.