Embed Size (px)
Citation preview
Nutritional status among older people
Risk factors and consequences of malnutrition
Lisa Söderström
Licentiate thesis 2013-10-15
Department of Public Health and Caring Sciences
Clinical Nutrition and Metabolism
Uppsala University
Centre for Clinical Research
Uppsala University and County Council of Västmanland
Västmanland County Hospital, Västerås
Main Supervisor: Leif Bergkvist, Ph.D., M.D.
Co-supervisors: Eva Thors Adolfsson, Ph.D., registered dietitian
Anja Saletti, Ph.D., registered dietitian
Andreas Rosenblad, Ph.D., statistician
Examination committee: Elisabet Rothenberg, Associate Professor, registered dietitian
Lennart Christensson, Associate Professor, registered nurse
Albert Westergren, Professor, registered nurse
List of Papers
This thesis is based on the following original papers referred to in the text by their Roman
numerals.
I. Söderström L, Thors Adolfsson E, Rosenblad A, Frid H, Saletti A, Bergkvist L.
Mealtime habits and meal provision are associated with malnutrition among
elderly patients admitted to hospital. Clin Nutr 2013;32(2):281–8.
http://dx.doi.org/10.1016/j.clnu.2012.07.013.
II. Söderström L, Rosenblad A, Adolfsson ET, Saletti A, Bergkvist L, Nutritional
status predicts preterm death in older people: a prospective cohort study, Clinical
Nutrition (2013), http://dx.doi.org/10.1016/j.clnu.2013.06.004.
Reprints were made with permission from Clinical Nutrition.
ISBN: 978-91-506-2345-1
Abstract
Despite the high frequency and serious consequences of protein–energy malnutrition,
prevention and treatment of malnutrition do not currently receive appropriate attention.
Increased awareness of the importance of nutritional screening among older people is needed.
The overall aim of this thesis was to extend our current knowledge about malnutrition and the
consequences of a poor nutritional status in relation to preterm death, and to identify possible
risk factors for developing malnutrition among older people. The aim of Paper I was to
estimate the prevalence of malnutrition and to examine the associations between mealtime
habits, meal provision, and malnutrition among older people admitted to a Swedish hospital.
The aim of Paper II was to examine whether nutritional status, defined according to the three
categories in the full Mini Nutritional Assessment (MNA) instrument, is an independent
predictor of preterm death in older people.
The baseline survey was a cross-sectional study of 1771 patients aged 65 years who were
admitted to hospital. Nutritional status was assessed using the MNA instrument, and possible
risk factors associated with malnutrition were recorded during the hospital stay (Paper I).
Overall survival was followed up after 35–50 months in a cohort study of 1767 participants
(Paper II).
Of the 1771 participants, 35.5% were well-nourished, 55.1% were at risk of malnutrition, and
9.4% were malnourished at baseline. An overnight fast >11 hours was associated with risk of
malnutrition (odds ratio (OR) 1.46; 95% confidence interval (CI) 1.14–1.87) and being
malnourished (OR 1.67; 95% CI 1.04–2.69). Fewer than four eating episodes a day was
associated with both risk of malnutrition (OR 1.88, 95% CI 1.52–2.32) and being
malnourished (OR 3.10; 95% CI 2.14–4.49). Not cooking independently was also associated
with both risk of malnutrition (OR 1.9; 95% CI 1.30–2.93) and being malnourished (OR 5.04;
95% CI 2.95–8.61). At the 50-month follow-up, the survival rates were 75.2% for well-
nourished participants, 60.0% for those at risk of malnutrition, and 33.7% for malnourished
participants. After adjusting for confounders, the hazard ratios (95% CI) for all-cause
mortality were 1.56 (1.18–2.07) in the group at risk of malnutrition and 3.71 (2.28–6.04) in
the malnourished group. Nutritional status defined according to the three categories in the full
MNA independently predicted preterm death in people aged 65 years and older.
This thesis provides additional knowledge of the current nutritional situation among older
people admitted to hospital. The high prevalence and serious consequences of malnutrition
demonstrated in this thesis underline the importance of screening and taking actions to
counteract malnutrition among older people. The data showing that the length of overnight
fasting and number of eating episodes per day are possible risk factors for malnutrition are
consistent with the current nutritional recommendations. This knowledge may stimulate care
providers to decrease the length of overnight fasting and increase the number of eating
episodes per day among older people at risk of malnutrition.
Abbreviations
ESPEN European Society of Clinical Nutrition and Metabolism
PEM Protein–energy malnutrition
MNA Mini Nutritional Assessment
BMI Body mass index
SD Standard deviation
ANOVA Analysis of Variance
OR Odds ratio
CI Confidence interval
HR Hazard ratio
Contents
Introduction ....................................................................................................................................... 1
Initiatives to promote nutritional care ............................................................................................... 1
Demographic changes and definition of malnutrition ................................................................. 1
Nutritional status ........................................................................................................................................ 2
Prevalence of malnutrition ..................................................................................................................... 2
Risk factors for malnutrition .................................................................................................................. 3
Consequences of malnutrition ............................................................................................................... 4
Rationale of this thesis ................................................................................................................... 5
Overall and specific aims ............................................................................................................... 6
Methods ................................................................................................................................................ 7
Design (Papers I and II) ............................................................................................................................ 7
Participants (Papers I and II) ................................................................................................................. 8
Data collection (Papers I and II) ........................................................................................................... 9 Nutritional status (Papers I and II) ..................................................................................... 9 Risk factors for malnutrition (Paper I) ............................................................................... 9
Preterm death (Paper II) ................................................................................................... 10
Sample size calculation .......................................................................................................................... 10
Statistical analysis ................................................................................................................................... 10
Ethical considerations............................................................................................................................ 11
Results ............................................................................................................................................... 12
Nutritional status (Paper I) ............................................................................................... 12
Risk factors for malnutrition (Paper I) ............................................................................. 12 Preterm death (Paper II) ................................................................................................... 12
Discussion ........................................................................................................................................ 14
Nutritional status (Paper I) ............................................................................................... 14 Risk factors for malnutrition (Paper I) ............................................................................. 14 Preterm death (Paper II) ................................................................................................... 15
Methodological considerations .......................................................................................................... 16
General discussion .................................................................................................................................. 17
Conclusions ...................................................................................................................................... 18
Clinical implications ............................................................................................................................... 18
Sammanfattning, Summary in Swedish ................................................................................. 19
Forthcoming research .................................................................................................................. 20
Paper III ....................................................................................................................................................... 20
Paper IV ....................................................................................................................................................... 20
References ........................................................................................................................................ 21
1
Introduction
Initiatives to promote nutritional care
Public awareness of malnutrition has increased in recent years, and improvement in
nutritional care for older people is on the agenda both internationally and nationally. In 2003,
the Council of Europe published a resolution on food and nutritional care in hospitals that was
signed by 18 European countries, including Sweden. The resolution states that the nutritional
risk of all patients should be routinely assessed at admission to hospital and that those who are
malnourished or at risk of malnutrition should have a treatment plan that includes dietary
goals, monitoring of food intake and body weight, and adjustment of the treatment plan.1
However, in clinical practice, nutritional risk screening is not routine in Swedish hospitals.2
On a national level, the Swedish government has recognized the seriousness of malnutrition.
Beginning in 2007, the municipalities and county councils in Sweden have been given
national incentive grants to improve the care of older people (≥65 years old) with
multimorbidity, including nutritional care. In 2010 and forward, performance-based
government funding has been given to the municipalities and county councils to implement a
quality register, Senior Alert, in hospitals, primary health care and municipality elderly care.
At present, 284 municipalities (98%) and 21 county councils (100%) report data to the quality
register. The aim is to increase the quality of care for people 65 years and older by recording
risk assessments and actions taken to prevent and treat malnutrition, pressure sores, falls, and
problems with oral health.3 The introduction of the quality register is a step forward in the
processes of attaining the Council of Europe’s nutritional goals.
Senior Alert comprises four evidence-based instruments covering the four risk areas.
However in Sweden, there is a lack of up-to-date data on the prevalence of malnutrition
among older people admitted to hospital before the quality register was introduced.
Also, there remains a need for studies evaluating the independent effect of nutritional status
on survival, after controlling for competing risks, if no targeted interventions against
malnutrition are provided.
Demographic changes and definition of malnutrition
In Western countries, there is a demographic transition towards a progressively increasing
percentage of older people. About 1.8 million of the 9.5 million inhabitants in Sweden (19%)
are 65 years and older, and this percentage is expected to increase to 25% within the next 50
years. In addition, life expectancy is predicted to rise from 84 to 89 years for women and from
80 to 87 years for men from 2011 to 2060.4 The risk of developing malnutrition increases with
advancing age.5-7
Therefore, it can be anticipated that the proportion of malnourished people
will increase in the future.
2
The European Society of Clinical Nutrition and Metabolism (ESPEN) defines malnutrition as
“a state of nutrition in which a deficiency or excess (or imbalance) of energy, protein, and
other nutrients causes measurable adverse effects on tissue/body form (body shape, size and
composition) and function, and clinical outcome” p.182.8 The most frequent state of
malnutrition in older people is protein–energy malnutrition (PEM), which is characterized by
a deficiency in protein and energy. In this thesis, malnutrition refers to PEM.
Nutritional status
Because of the lack of a standard diagnostic criterion (gold standard) to define malnutrition,
various screening and assessment tools have been developed to evaluate nutritional status.9
Most tools include questions about body mass index (BMI), recent weight loss, and decreased
food intake.10
To promote routine nutritional screening, the ESPEN has published guidelines on nutritional
screening for different settings. The Mini Nutritional Assessment (MNA) instrument is
recommended for people aged 65 years and older independent of their setting.10
The original
full MNA is an 18-item questionnaire developed in the 1990s by practising geriatricians in the
USA and Europe to provide a simple, reliable way to assess nutritional status.11
The development and validation studies were performed on older people, both frail and
healthy, in France and the USA. The MNA was validated against a clinical evaluation of
nutritional status as assessed by two physicians, which was considered the gold standard. The
clinical evaluation was based on a comprehensive nutritional assessment including
anthropometry, biochemical markers, dietary intake, and functional geriatric assessment. In
the validation studies of the MNA, the sensitivity was found to be 96% and the specificity
98%.11
However, because there is no gold standard to determine nutritional status, the
sensitivity and specificity of the MNA vary depending on which reference is used.12
Prevalence of malnutrition
The exact prevalence of malnutrition is unknown. This is partly because of the lack of a gold
standard for the definition of malnutrition. However, the prevalence of malnutrition defined
according to the MNA also varies depending on the setting. An international pooled dataset
including more than 4500 people aged 65 years and older (mean age 82 years) in different
settings reported a 23% overall prevalence of malnutrition and that 46% were at risk of
malnutrition.13
The percentage of people with malnutrition was highest in geriatric
rehabilitation units (51%) followed by hospitals (39%), nursing homes (14%), and the
community (6%).13
In a large Belgian cross-sectional multicentre study (n = 2329) of people
aged 75 years and older (mean age 83 years) in hospital elderly wards, the prevalence of
malnutrition was 33%, and almost 43% were at risk of malnutrition.7
3
In Sweden, several studies have aimed to estimate the prevalence of malnutrition in different
settings.14-19
Two multicentre studies were performed in hospital settings.16 19
However, both
these studies estimated the prevalence of malnutrition in people 18 years of age and thus did
not use the MNA instrument.16 19
Consequently, in Sweden, no large-scale study has assessed
the nutritional status using the MNA solely in older people in a hospital setting.
Risk factors for malnutrition
Malnutrition is a condition with multifactorial causes,20
and the cause of malnutrition at the
individual level is not always clear. The question is whether the aging process by itself leads
to malnutrition or whether malnutrition in older people indicates other underlying disease(s).21
Factors associated with malnutrition, such as impaired functional ability,5 22
can be both a
cause and effect of malnutrition. In this thesis, factors associated with malnutrition are
hereafter referred to as risk factors for malnutrition.
Age is the most important risk factor for malnutrition.5-7
With increasing age, the natural drive
to eat and drink decreases, resulting in the so-called anorexia of aging. This is partly because
of the decline in smell and taste sensations that accompanies aging.20
The decline in food
intake compensates for the decline in energy utilization that occurs with aging.23
These age-
related changes are regarded as an adaption to the natural decrease in energy requirement but
also predispose older people to malnutrition by increasing the risk of an extreme reduction in
food intake. If additional risk factors such as disease develop, dietary intake is often no longer
sufficient to meet the requirements.20 23
Therefore, it is crucial to identify modifiable risk
factors that can prevent an excessive decline in food intake in older people.
With age, the risk of developing various diseases and conditions increases. Diseases such as
dementia,7 22
symptoms of depression,7 22
and the presence of infections24 25
are often
associated with malnutrition. Drug therapy can also negatively affect nutritional status
through the side effects often caused by polypharmacy26
such as decreased appetite, nausea,
alterations in taste and smell, dry mouth, constipation, diarrhoea, and confusion.27
Mealtime habits such as overnight fasting and the number of eating episodes and meal
provision such as receiving meals on wheels are modifiable factors thought to be related to
malnutrition.28-30
European1 and more specific Nordic recommendations
31 state that the
overnight fast should not exceed 11 hours in older people and that the number of eating
episodes should be at least four each day in adults.31
On a national level, the Swedish National
Board of Health and Welfare performs an annual national survey, called “Open
Comparisons”, which compares the quality of health care in Swedish municipalities. In this
survey, the length of the overnight fast and number of eating episodes are included in the
quality indicator “good meal pattern”. To fulfil this quality indicator, meals should be offered
at least six times a day on given time intervals according to expert recommendations, so that
the overnight fast does not exceed 11 hours.32
Actions to prevent malnutrition are also
suggested in the national quality register (Senior Alert).
4
One of these actions is to decrease the length of overnight fasting to <11 hours. Despite these
recommendations, no clinical study has been undertaken to clarify whether there is an
association between malnutrition and the length of overnight fasting or the number of eating
episodes per day.
Consequences of malnutrition
It is important to identify older people with poor nutritional status because malnutrition is
related to negative consequences, such as increased morbidity,16
poor quality of life,33
and
increased health care costs.34
Even more critically, a systematic review in 2012 that evaluated
different nutrition screening tools concluded that there is some evidence that malnutrition is
associated with increased mortality.35
However, it is uncertain whether this association is
independent of confounders.
When examining the relationship between malnutrition and mortality, most studies analyse
the total MNA score or use varying methods of subcategorization. Fewer studies have
investigated the three nutritional status groups used in clinical practice (well-nourished, at risk
of malnutrition, or malnourished) separately.35
Finally, considerable covariation may exist
between nutritional status and possible confounders. Therefore, it is important to determine
whether nutritional status predicts a preterm death after adjusting for possible confounders.
5
Rationale of this thesis
The planning for the present project started in 2007, when the municipalities and county
councils received national incentive grants from the Swedish government to improve
nutritional care for older people with multimorbidity. The overall aims were to extend our
current knowledge about malnutrition and the consequences of a poor nutritional status in
relation to preterm death, and to identify possible risk factors for developing malnutrition
among older people.
No large-scale Swedish study has evaluated nutritional status exclusively in older people
admitted to hospital. Therefore, up-to-date data are needed to increase our awareness of
malnutrition and the consequences of poor nutritional status if no nutritional interventions are
given. There is some evidence that malnutrition is associated with increased mortality.35
However, it is uncertain whether this association is independent of confounders. There is also
a lack of evidence behind the nutritional recommendations about the length of the overnight
fast and number of eating episodes per day. Thus, there is a need for studies to confirm that
the length of the overnight fast and the number of eating episodes are associated with
malnutrition.
6
Overall and specific aims
The overall aim of this thesis was to extend our current knowledge about malnutrition and the
consequences of a poor nutritional status in relation to preterm death, and to identify possible
risk factors for developing malnutrition among older people.
The specific aims were as follows.
Paper I: To estimate the prevalence of malnutrition and to examine the associations between
mealtime habits, meal provision, and malnutrition among older people admitted to a medium-
sized Swedish hospital.
Paper II: To examine whether nutritional status defined according to the three categories in
the full MNA instrument is an independent predictor of preterm death in older people.
7
Methods
This thesis is based on data collected from participants 65 years of age admitted to hospital
whose nutritional status was assessed during their hospital stay. Nutritional status was
assessed by the original 18-item MNA instrument, hereafter referred to as the full MNA. An
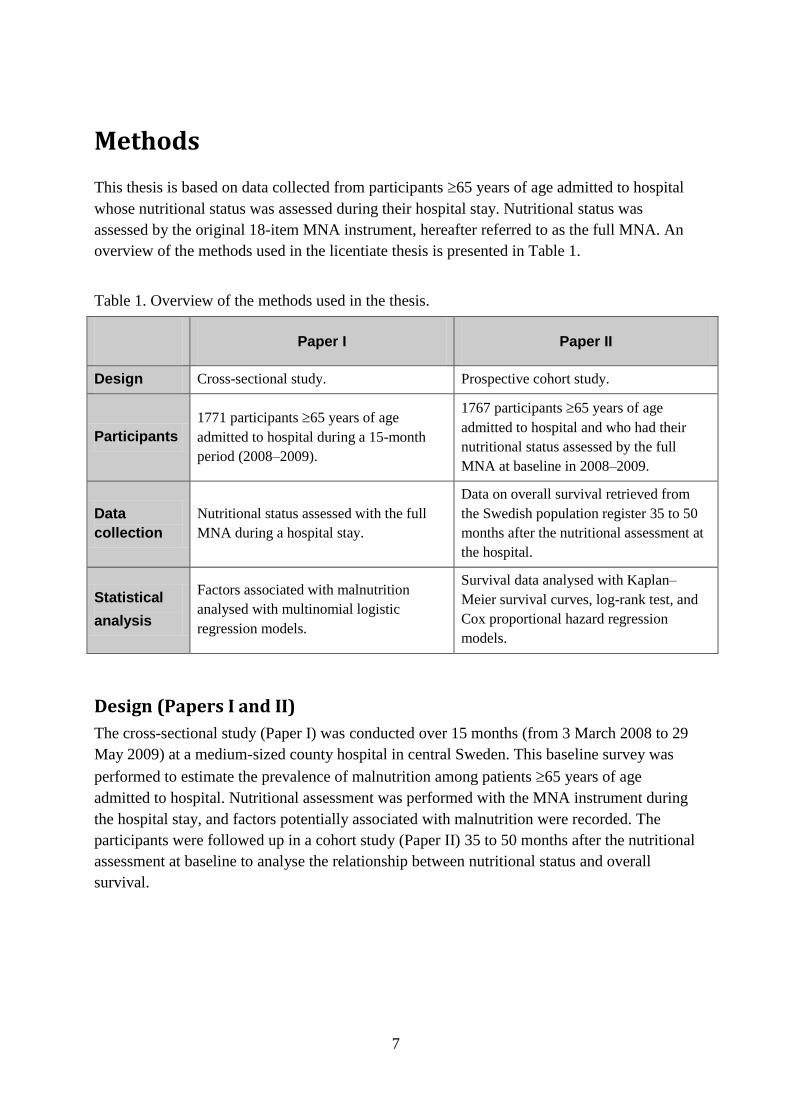
overview of the methods used in the licentiate thesis is presented in Table 1.
Table 1. Overview of the methods used in the thesis.
Paper I Paper II
Design Cross-sectional study. Prospective cohort study.
Participants
1771 participants 65 years of age
admitted to hospital during a 15-month
period (2008–2009).
1767 participants 65 years of age
admitted to hospital and who had their
nutritional status assessed by the full
MNA at baseline in 2008–2009.
Data
collection
Nutritional status assessed with the full
MNA during a hospital stay.
Data on overall survival retrieved from
the Swedish population register 35 to 50
months after the nutritional assessment at
the hospital.
Statistical
analysis
Factors associated with malnutrition
analysed with multinomial logistic
regression models.
Survival data analysed with Kaplan–
Meier survival curves, log-rank test, and
Cox proportional hazard regression
models.
Design (Papers I and II)
The cross-sectional study (Paper I) was conducted over 15 months (from 3 March 2008 to 29
May 2009) at a medium-sized county hospital in central Sweden. This baseline survey was
performed to estimate the prevalence of malnutrition among patients 65 years of age
admitted to hospital. Nutritional assessment was performed with the MNA instrument during
the hospital stay, and factors potentially associated with malnutrition were recorded. The
participants were followed up in a cohort study (Paper II) 35 to 50 months after the nutritional
assessment at baseline to analyse the relationship between nutritional status and overall
survival.
8
Participants (Papers I and II)
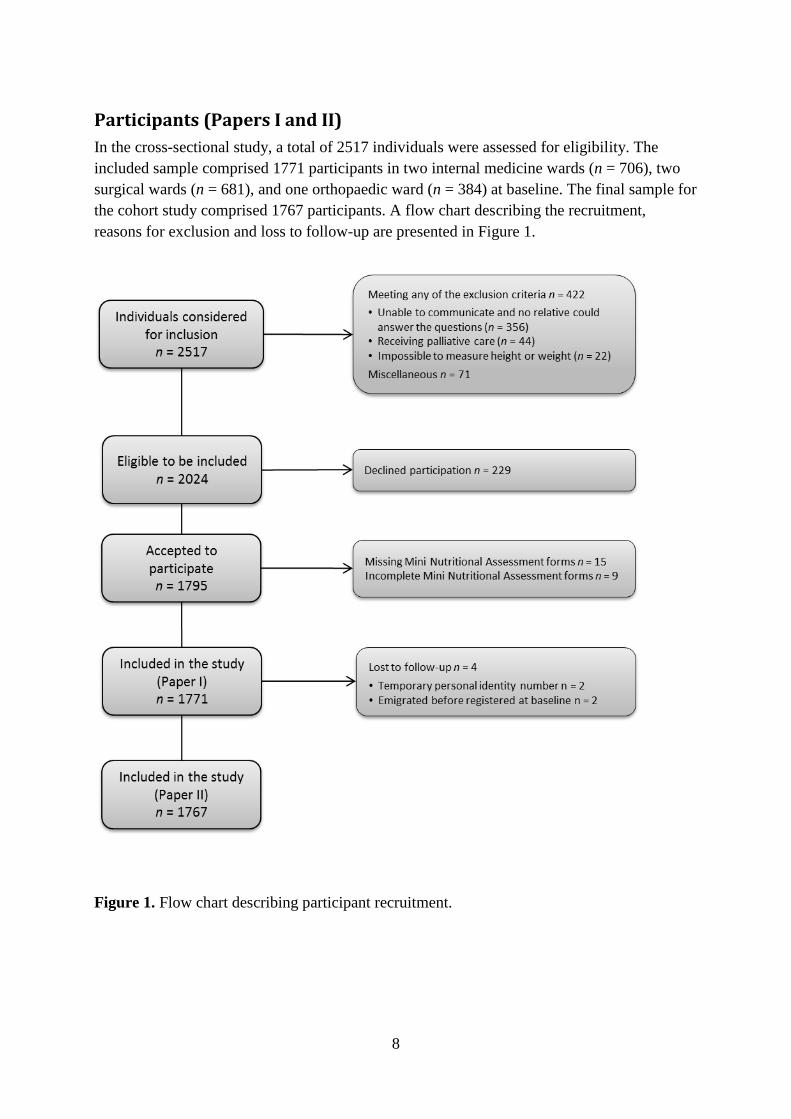
In the cross-sectional study, a total of 2517 individuals were assessed for eligibility. The
included sample comprised 1771 participants in two internal medicine wards (n = 706), two
surgical wards (n = 681), and one orthopaedic ward (n = 384) at baseline. The final sample for
the cohort study comprised 1767 participants. A flow chart describing the recruitment,
reasons for exclusion and loss to follow-up are presented in Figure 1.
Figure 1. Flow chart describing participant recruitment.
9
Data collection (Papers I and II)
Baseline data on nutritional status and clinical characteristics were collected consecutively
during the hospital stay. Nutritional status was assessed with the MNA given by registered
dietitians, nurses, or assistant nurses (18 personnel). Before the study, the health care
professionals received training on interpreting the questions in the MNA and performing the
measurements.
The participants were followed up in the cohort study through the Swedish population register
until 23 May 2012, which was 35 to 50 months after the nutritional assessment at baseline.
Nutritional status (Papers I and II)
In the present study, nutritional status was assessed in all participants with the full MNA. The
questions in the MNA cover the preceding three months and comprise four areas. These
include anthropometric measurements (arm and calf circumference, recent weight loss, and
BMI); a global assessment (lifestyle, medication, mobility, presence of acute stress, and
cognitive impairment or depression); dietary questions (changes in appetite, meals per day,
daily intake of protein, fruit, vegetables, fluid, and autonomy of feeding); and a subjective
assessment (self-perception of health and nutrition).11
The 18 questions are weighted, and the
threshold values of the instrument categorize patients into three nutritional status groups:
well-nourished (MNA score 24–30), at risk of malnutrition (MNA score 17–23.5), or
malnourished (MNA score <17).11
BMI was calculated with the standard formula of (weight in kg)/(height in m²). Weight was
measured with a calibrated chair or mobile lift scale (n = 21) to the nearest kg after emptying
the bladder and with the patient wearing a light hospital robe. Height was measured to the
nearest centimetre with a stadiometer. Participants unable to stand upright were measured
with a sliding calliper (n = 345) or, as a last resort, by calculating their height from half the
arm span (demi-span) (n = 18) using the formula (1.40 demi-span [cm]) + 57.8 for men and
(1.35 demi-span [cm]) + 60.1 for women.36 37
Risk factors for malnutrition (Paper I)
Data on clinical characteristics were collected at baseline to examine possible risk factors for
malnutrition including age, sex, BMI, smoking status, medication use, diagnoses, length of
overnight fast, number of eating episodes per day, meal provision, and living situation. Age
was retrieved from the personal identification number. Smoking status was defined as current
or non-smoker. Medication use before admission and the patient’s diagnoses at discharge
were retrieved from the patient’s medical records. The diagnoses were defined according to
the International Statistical Classification of Diseases and Related Health Problems, 10th
Revision (ICD-10). The length of the overnight fast was defined as the period between the last
eating episode in the evening and the first eating episode the following morning.
10
The number of eating episodes per day was recorded as how often the patient usually ate
breakfast, lunch, dinner, and between-meal and evening snacks. Meal provision was recorded
as cooking independently and/or with help from a spouse (cooks independently), meals on
wheels, or meals in a nursing home or restaurant. Living situation was defined as living alone,
cohabiting, or living in a nursing home. Country of birth was obtained from the Swedish
population register.
Preterm death (Paper II)
The main focus of the cohort study was to examine the association between nutritional status
as measured with the MNA and overall survival during the follow-up period. Survival was
calculated from the date of the MNA assessment to the date of death. Date of emigration and
end of follow-up were used as censoring dates. The participants’ characteristics registered at
baseline were considered as potential confounders for the association between nutritional
status and overall survival.
Sample size calculation
As a basis for a sample size calculation, studies evaluating malnutrition and mortality in older
people in hospital were used.38-41
In these studies, the percentage of well-nourished older
people was 17% to 59%, and the percentage of malnourished older people was 16% to 49%.
Thus, the smallest percentages of well-nourished and malnourished people one would expect,
in an extreme case, would be 17% well-nourished and 16% malnourished older people. Based
on the aforementioned studies, the expected mortality during the three years of follow-up was
24% among well-nourished people and 35% among the malnourished. To obtain a power
(1–) of 80% at a two-sided significance level of = 0.05 with a Z-test for difference in
percentage with an expected difference in mortality of 11 percentage points, a total study
population of 1682 participants would be needed. To take into account expected dropouts,
non-response, and missing values, the aim was to recruit a total of 2080 participants. Because
the dropout rate was lower than expected, a decision was made to end recruitment when the
nutritional status of 1795 participants had been assessed in the study.
Statistical analysis
For descriptive statistics, categorical data are presented as frequencies and percentages
n (%), ordinal data are presented as median and interquartile range (q1–q3), and discrete and
continuous data are given as mean and standard deviation (SD). Univariate tests of differences
between the three nutritional assessment status groups were performed using Pearson’s ²-test
for categorical data, the Kruskal–Wallis test for ordinal and discrete data, ANOVA for
continuous data, and log-ranks tests for survival data. Kaplan–Meier curves were calculated
for survival data.
11
For multivariate analyses, Paper I used multinomial logistic regression models with
nutritional assessment status as the dependent variable. The analyses were performed in two
steps. In the first step, a base model was constructed by including as independent variables all
significant variables in the univariate analysis, except for those that contributed directly or
indirectly to the MNA score, together with interaction effects. In the second step, a final
model was constructed using a backward stepwise selection procedure with an entry
probability of 0.05 and removal probabilities of 0.2 for the main effects and 0.05 for the
interaction effects. In a subgroup analysis of the 1685 participants living at home, the variable
meal provision was also included.
Paper II used Cox proportional hazards regression models for multivariate analyses, with
nutritional status as the main variable of interest. The latter was entered as a three-level
(well-nourished, at risk of malnutrition, malnourished) categorical variable, with well-
nourished used as the reference category. The participants’ characteristics at baseline were
considered as potential confounders. The analyses were performed in four steps. In the first
step, nutritional status and potential confounders were entered into separate Cox regression
models. In the second step, variables that were significant in the first step were entered into a
multivariate Cox regression model (base model). In the third step, non-significant variables
were removed from the base model through a backward selection procedure until the model
included only significant variables (reduced model). In the fourth step, all confounding
variables included in the reduced model were tested for interaction effects with nutritional
status, and significant effects were then added to the reduced model. Finally, non-significant
variables were removed through a backward selection procedure until the model included
only significant variables (final model). All regression models were hierarchical.
For all statistical tests, a two-sided p-value < 0.05 was considered significant. All analyses
were performed in IBM SPSS Statistics 18/20.
Ethical considerations
The study was approved by the Uppsala Ethical Review Board (approval number: 2007-323).
All participants provided their written informed consent before entering the study. If a
participant was unable to communicate, a relative was asked if he/she objected to the patient’s
participation in the study.
12
Results
Nutritional status (Paper I)
The mean age ± SD of the included patients was 78.1 ± 7.8 years at baseline, which was
significantly lower than that of those excluded (mean age 82.0 ± 8.2 years; p < 0.001).
Women were predominant among both the included (56.0%) and excluded (53.3%) patients.
The sex distribution did not differ between those excluded and those included (p = 0.266).
Most of the participants lived at home (n = 1685; 95.1%) before their admission to hospital,
and the others lived in a nursing home (n = 86; 4.9%). According to the MNA, 35.5%
(n = 629) of the participants were well-nourished, 55.1% (n = 976) were at risk of
malnutrition, and 9.4% (n = 166) were malnourished. The participants from medical, surgical
and orthopaedic clinics did not differ significantly regarding nutritional status (p = 0.382).
Risk factors for malnutrition (Paper I)
In the multinomial logistic regression analysis, an overnight fast >11 hours was associated
with risk of malnutrition (odds ratio (OR) 1.46, 95% confidence interval (CI) 1.14–1.87) and
being malnourished (OR 1.67; 95% CI 1.04–2.69). Fewer than four eating episodes a day was
associated with both risk of malnutrition (OR 1.88; 95% CI 1.52–2.32) and being
malnourished (OR 3.10; 95% CI 2.14–4.49). In a subgroup analysis (n = 1685) that excluded
those living in a nursing home, not cooking independently was associated with both risk of
malnutrition (OR 1.95; 95% CI 1.30–2.93) and being malnourished (OR 5.04; 95% CI 2.95–
8.61). The association between overnight fast >11 hours and malnutrition was no longer
significant in the malnourished group not living in a nursing home.
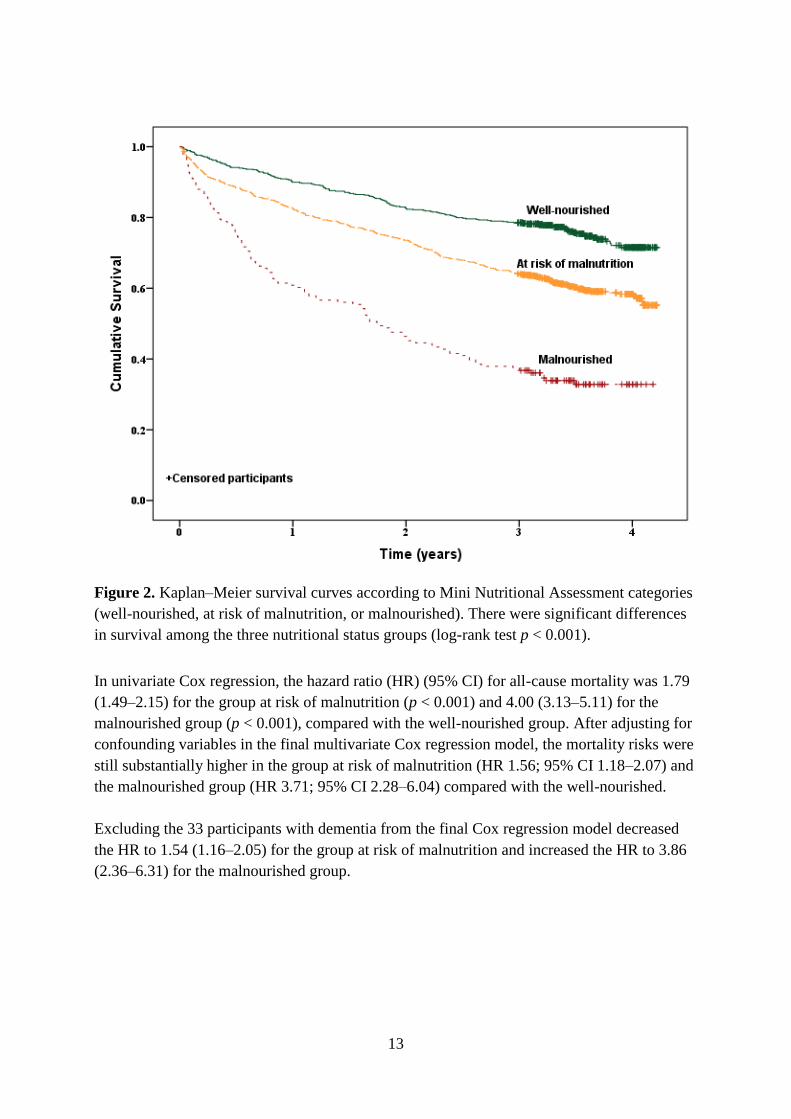
Preterm death (Paper II)
A total of 1767 participants were followed up in the cohort study. The follow-up period was
between 35 and 50 months (median 3.5 years). During this period, 37% (n = 655) died. The
survival curves for the three nutritional status groups are shown in Figure 2. At the 50-month
follow-up, survival was 75.2% (n = 472) for the well-nourished group, 60.0% (n = 584) for
those at risk of malnutrition, and 33.7% (n = 56) for the malnourished (p < 0.001).
13
Figure 2. Kaplan–Meier survival curves according to Mini Nutritional Assessment categories
(well-nourished, at risk of malnutrition, or malnourished). There were significant differences
in survival among the three nutritional status groups (log-rank test p < 0.001).
In univariate Cox regression, the hazard ratio (HR) (95% CI) for all-cause mortality was 1.79
(1.49–2.15) for the group at risk of malnutrition (p < 0.001) and 4.00 (3.13–5.11) for the
malnourished group (p < 0.001), compared with the well-nourished group. After adjusting for
confounding variables in the final multivariate Cox regression model, the mortality risks were
still substantially higher in the group at risk of malnutrition (HR 1.56; 95% CI 1.18–2.07) and
the malnourished group (HR 3.71; 95% CI 2.28–6.04) compared with the well-nourished.
Excluding the 33 participants with dementia from the final Cox regression model decreased
the HR to 1.54 (1.16–2.05) for the group at risk of malnutrition and increased the HR to 3.86
(2.36–6.31) for the malnourished group.
14
Discussion
Nutritional status (Paper I)
In the cross-sectional study, more than half of the study population was at risk for
malnutrition and almost one out of 10 were malnourished. The prevalence of malnutrition was
lower than expected; previous studies using the MNA in Sweden have estimated the
prevalence among older people in hospitals to 26 %,41
and internationally the prevalence of
malnutrition in hospitals using the MNA varies between 23 and 38.7 % 7 12 13
One possible
explanation for this difference is that the most frequent reason for not participating in the
cross-sectional study was “unable to communicate and no relative could answer the
questions” (n = 356). The excluded patients were also significantly older than the included
patients. Thus, it is reasonable to assume that those with multimorbidity were excluded from
the study and that this can partly explain the relatively low prevalence of malnutrition.
Another possible reason is that almost all participants (95.1%) were living at home before
hospital admission and the remaining (4.9%) came from nursing homes. According to
previous Swedish studies, the prevalence of malnutrition in older people living at home is low
(0–1%),14 15
compared with those living in nursing homes (30%).18
The malnutrition
prevalence in the present study is consistent with that of a previous Swedish study of older
people receiving support at home, which reported an 8% prevalence of being malnourished
and 41% prevalence of being at risk of malnutrition.28
Risk factors for malnutrition (Paper I)
The mealtime habits, length of overnight fast, and number of eating episodes per day were
associated with both risk of malnutrition and being malnourished. These findings support the
nutritional recommendations for the Nordic countries, which state that the overnight fast
should not exceed 11 hours in older people and that adults should have at least four eating
episodes per day.31
The findings also support the recommendations from the National Board
of Health and Welfare in Sweden, which includes an overnight fast of <11 hours in the quality
indicator “good meal pattern”, for comparing the quality of health care in the Swedish
municipalities.32
In the subgroup analysis of participants living at home, the association
between malnutrition and overnight fasting was no longer significant (p = 0.158). One
explanation for this may be a decisive loss of statistical power when those living in nursing
homes were excluded from the analysis, since this group included 15.7% (n = 26) of the
malnourished participants.
Not cooking independently was associated with both risk of malnutrition and being
malnourished. One explanation may be that older people at risk of malnutrition use meals on
wheels more frequently and have a reduced function in daily life activities compared with the
well-nourished.28
15
This association may be bidirectional; that is, the decline in function, which increases the
need for help (e.g., in the form of meals on wheels), can both be a cause and an effect of
malnutrition. Regardless of the underlying reason, older people who do not have the strength
or ability to cook independently should be recognized as individuals at risk of malnutrition.
Preterm death (Paper II)
In this prospective cohort study of 1767 participants 65 years of age, nutritional status
defined according to the three categories of the full MNA was independently associated with
preterm death. Findings from other studies support a relationship between nutritional status
and mortality.35
A literature review from 2012 that analysed 28 papers evaluating different
nutritional screening tools (NSTs) and their relationship with mortality reported an association
between poor score on the NSTs and mortality. However, this review did not specifically
focus on whether there is a relationship between nutritional status according to the MNA and
mortality in older people in hospital. Further, most studies have either analysed the
importance of the total MNA score or use varying methods of subcategorization. Fewer
studies have investigated the three nutritional status groups separately.35
A large study from Taiwan (n = 2802), which included independently living older people
residing in the community, reported a HR of 2.4 for risk of malnutrition and 6.5 for being
malnourished at the four-year follow-up.42
However, this study did not adjust for covariates
such as concomitant diseases, but only for sex and age, and it remains uncertain whether
malnutrition is an independent risk factor for mortality. By contrast, a small Swedish study
(n = 68) of older people receiving support at home found an OR of 3.3 (95% CI 1.1–9.8) for
death at the three-year follow-up for the combined group of malnourished people and those at
risk of malnutrition after adjusting for age and cardiovascular disorders.28
Our results are consistent with those of previous studies that used the full MNA to examine
the association between nutritional status and mortality in older people in a hospital
setting.38 43-46
Most of these studies did not conduct any regression analysis,38 44-46
which is a
limitation when analysing the predictive value of the MNA in an observational study. Only a
few studies measured mortality after discharge from hospital.43 44
One Australian study
(n = 476) used the Cox regression model to analyse long-term mortality and adjusted the
analyses for major disease classifications at admission. The study was based on retrospective
nutritional assessment data of older people who had already been assessed with the MNA at
two rehabilitation hospitals before the study started. At the 18-month follow-up, the HR was
3.4 (95% CI 1.07–10.87) in the malnourished group. However, the survival analysis only
included those who had survived 12 months.43
This introduces bias and hampers a direct
comparison with our cohort, which exhibited substantial mortality in the first year of follow-
up. By contrast, one prospective Scandinavian study (n = 101) adjusted the regression
analysis for age, sex, and Charlton comorbidity index, but did not find an association between
malnutrition assessed with the MNA and mortality at the one-year follow-up.47
16
The prospective design of our cohort study, the large sample size, and the adjustment for
several important confounders including comorbidities, contribute to clarifying the
independent relationship between nutritional status defined by the MNA and mortality.
Methodological considerations
The major strengths of the two studies were the sample size, the use of a widely utilized
instrument to assess nutritional status, and the training given to the health care professionals
for interpreting the questions in the MNA and performing the measurements.
The strength in the cohort study was the limited number lost to follow up (n = 4) and the
length of the follow-up. Study II is so far the largest study examining the relationship between
mortality and the three nutritional status groups, as defined by the MNA (well-nourished,
at risk of malnutrition, or malnourished) among older people admitted to hospital.35
43
47
From the clinical point of view, it is more relevant to examine the three nutritional status
groups rather than to examine the overall MNA score (0–30) because these categories are
used to screen patients for malnutrition in the municipalities and county councils in Sweden
through the Senior Alert quality register.
The prospective study design in the cohort study allowed us to control for a number of
comorbidities and several other patient characteristics recorded at baseline. This is essential
when examining the independent relationship between nutritional status and mortality in an
observational study. Other unrecognized potentially confounding factors may exist and these
could affect the HRs. However, the large risk estimates did not change noticeably in the four-
step regression model, making it unlikely that the results occurred by chance.
The major limitation of the cross-sectional study is the characteristics of the excluded
patients. An analysis of the exclusion criteria showed that the most common reason for being
excluded from the study was “unable to communicate and no relative could answer the
questions”. The excluded patients were significantly older than those included. Consequently,
the participants in the current study might have been healthier than the average population of
older people found in hospitals, and the true prevalence of malnutrition may have been
underestimated in the present population. Further, because study I was a cross-sectional study,
no causal relationships could be identified. Factors identified as associated with malnutrition
in the cross-sectional study could be risk factors for malnutrition but could also be a result of
malnutrition. Regardless of the underlying reason, older people who have a long overnight
fast, few eating episodes and do not have the strength or ability to cook independently should
be recognized as individuals at risk of malnutrition.
A limitation in both studies is that the results cannot be generalized to institutionalized older
people. The findings from this study relate to those who were living at home before admission
to hospital, as only a minority (4.9%) came from nursing homes.
17
General discussion
Despite the high frequency and serious consequences of malnutrition, as demonstrated in the
present and in previous studies, the prevention and treatment of malnutrition do not currently
receive appropriate attention. Increased awareness of the importance of nutritional screening
is needed. There have been recent initiatives to promote nutritional care both in Europe1 and
on a national level.3 According to the recommendations for food and nutritional care in
European hospitals, all patients admitted to hospital should be screened regarding their
nutritional status.1 Further, the national quality register (Senior Alert) introduced in the
municipalities and county councils in Sweden incorporate the MNA screening instrument.
This represents good progress in the process of improving nutritional care and implementing
the resolution from the Council of Europe in the Swedish health and social care system.
The two studies in this thesis provide additional knowledge about the current nutritional
situation among older people admitted to hospital. Several different international studies
have used the MNA instrument for nutritional assessment of older people admitted to
hospital.7 12 13
However, on a national level, no large Swedish study has estimated the
prevalence of malnutrition exclusively in older people admitted to hospital.41
The cross-
sectional study provides up-to-date data of the prevalence of malnutrition, as defined by
the MNA, in older people admitted to hospital before the national quality register was
implemented. Paper I is also the first study to report an association between malnutrition and
the length of overnight fasting and number of eating episodes per day. These parameters are
included in the quality indicator “good meal pattern” in Swedish municipality elderly care and
in the national quality register Senior Alert. Hence, the current study supports the importance
of care givers taking action to decrease the length of the overnight fast and to increase the
number of daily eating episodes in older people at risk of malnutrition. The cohort study
demonstrates the independent role of nutritional status as a predictor of preterm death and
confirms previous data on the consequences of malnutrition. There was a profound effect on
survival in this study involving routine intervention that was not directed specifically against
malnutrition.
Screening for malnutrition is an important first step towards increased awareness. The
screening process is a prerequisite for detecting nutritional problems and risk factors for
malnutrition as early as possible and for promoting nutritional interventions. Nutritional
supplementation and dietary advice results in a modest weight gain48 49
or weight
maintenance.50
More research is needed to identify which interventions are most effective in
terms of patient-centred outcomes and who would and would not benefit from such options.
The high prevalence and serious consequences of malnutrition as demonstrated in the two
studies in this thesis emphasize the urgent need to answer these questions.
18
Conclusions
Two-thirds of older people admitted to hospital were malnourished or at risk of
malnutrition, as defined by the full MNA.
An overnight fast exceeding 11 hours, fewer than four eating episodes a day, and not
cooking independently were associated with malnutrition and with risk of
malnutrition.
Nutritional status defined according to the three categories in the full MNA
independently predicts preterm death in people 65 years and older.
Clinical implications
The evidence that the length of overnight fasting and number of eating episodes per day are
possible risk factors for malnutrition is consistent with the current nutritional
recommendations.31
This knowledge might stimulate care givers to taking actions towards
decreasing the length of the overnight fast and increasing the number of eating episodes per
day in older people at risk of malnutrition.
The independent association between nutritional status assessed with the MNA and preterm
death emphasizes the usefulness of the MNA for screening nutritional status. The finding that
two-thirds of older people admitted to hospital were malnourished or at risk of malnutrition,
and thus had an increased risk of death, underline the importance of screening for nutritional
status in older people and taking appropriate actions to counteract malnutrition. It is unknown
which interventions are most effective and to whom these interventions should be targeted48 49
however, the present study supports the actions of policymakers in continuing to establish
effective interventions against malnutrition in older people admitted to hospital. Large-scale
prospective studies are needed to evaluate the effect of nutritional interventions in terms of
quality of life, functional status, and survival.
19
Sammanfattning, Summary in Swedish
Trots den höga förekomsten och de allvarliga konsekvenserna av protein-energi malnutrition
(härefter kallat undernäring) är prevention och behandling av undernäring inte tillräckligt
uppmärksammat. Ökad medvetenhet om vikten av nutritionsscreening bland äldre personer är
nödvändigt. Det övergripande syftet med denna avhandling var att öka vår nuvarande kunskap
om undernäring och konsekvenserna av ett försämrat nutritionsstatus med avseende på en för
tidig död, samt att identifiera möjliga riskfaktorer för att utveckla undernäring bland äldre
personer. Syftet med delarbete I var att uppskatta prevalensen av undernäring samt att
undersöka sambandet mellan måltidsvanor, måltidsförsörjning och undernäring bland äldre
personer som skrivs in på ett svenskt sjukhus. Syftet med delarbete II var att undersöka om
nutritionsstatus definierat enligt de tre kategorierna i hela MNA instrumentet är en oberoende
prediktor för en för tidig död hos äldre personer.
Baslinjeundersökningen var en tvärsnittsstudie av 1771 deltagare ≥65 år gamla som skrevs in
på sjukhus. Nutritionsstatus bedömdes med Mini Nutritional Assessment (MNA) instrumentet
och möjliga risk faktorer associerade med undernäring registrerades under vårdtiden på
sjukhuset (delarbete I). Total överlevnad följdes upp efter 35–50 månader i en kohort studie
av 1767 deltagare (delstudie II).
Utav 1771 undersökta deltagare var 35,5 % välnärda, 55,1 % hade risk för undernäring och
9,4 % var undernärda vid baslinjen. En nattfasta > 11 timmar var associerad med risk för
undernäring (odds ratio (OR) 1,46; 95 % konfidensintervall (CI) (1,14–1,87) och undernäring
(OR 1,67; 95 % CI 1,04–2,69). Dessutom, färre än fyra ättillfällen per dag var associerat med
risk för undernäring (OR 1,88; 95 % CI 1,52–2,32) och undernäring (OR 3,10; 95 % CI 2,14–
4.49). Slutligen, att inte laga mat själv var också associerat med risk för undernäring
(OR 1,95; 95 % CI 1,30–2,93) och undernäring (OR 5,04; 95 % CI 2,95– 8,61).
Vid uppföljning efter 50 månader var överlevnaden 75,2 % för välnärda deltagare, 60,0 % för
dem med risk för undernäring och 33,7 % för undernärda. Efter justering för störningsfaktorer
(confounders), var hazard ratio (95 % CI) för total mortalitet 1,56 (1,18–2,07) hos dem med
risk för undernäring och 3,71 (2,28–6,04) för de undernärda. Nutritionsstatus definierat enligt
de tre kategorierna i hela MNA var en oberoende prediktor för en för tidig död hos personer
65 år och äldre.
Denna avhandling ger ytterligare kunskap om den aktuella näringsmässiga situationen bland
äldre personer som skrivs in på sjukhus. Den höga förekomsten och de allvarliga
konsekvenserna av undernäring som framkommit i denna avhandling, understryker vikten av
screening och att vidta åtgärder för att motverka undernäring. Uppgifterna om nattfastans
längd och antalet ättillfällen per dag som möjliga riskfaktorer för undernäring är förenliga
med de nuvarande näringsrekommendationerna. Denna kunskap kan stimulera vård- och
omsorgspersonal till att minska nattfastans längd och öka antalet ättillfällen bland äldre
personer som har risk för undernäring.
20
Forthcoming research
Paper III
The association between nutritional status in older people admitted to hospital and
energy and nutrient intake 10 years earlier.
Aim: To analyse the associations between current nutritional status in older people admitted
to hospital and their previous dietary intake.
Design: A prospective cohort study.
Participants: The study population comprises 728 participants whose nutritional status was
assessed in a cross-sectional study (n = 1771) performed in 2008–2009 and who also
participated in two cohort studies of eating habits in 1997.
Data collection: The personal identification number of the participants in the cross-sectional
study was matched with the personal identification number from two cohort studies—the
Swedish Mammography Cohort (SMC) and the Cohort of Swedish Men (COSM)—to identify
participants in both studies. The participants answered a food frequency questionnaire (FFQ)
in 1997, and the results of the FFQ will be used to analyse the associations between previous
dietary intake and malnutrition 10 years later.
Progress: Data have been collected and will be analysed in autumn 2013.
Paper IV
The association between nutritional status in older people admitted to hospital and
health care consumption during the subsequent two years.
Aim: To analyse the association between nutritional status and health care consumption
during the subsequent two years after assessment of nutritional status at hospital.
Design: A prospective nested case–control study.
Participants: All malnourished participants from a cross-sectional study performed in 2008–
2009 will comprise the cases (n = 166) and will be matched against an equal number of well-
nourished controls from the same study (n = 166). The controls will be matched for sex and
family practitioner.
Data collection: The participant’s health care consumption will be followed up two years
after the nutritional assessment in 2008–2009. Data on health care consumption will be
collected through the hospital inpatient care, hospital outpatient care, primary health care, and
the health care system in the municipalities. Drug prescription data will be collected through
the Swedish Drug Register.
Progress: Data will be collected during autumn 2013 and spring 2014, and the analyses are
planned to take place in autumn 2014 and spring 2015.
21
References
1. Council of Europe. Resolution ResAP (2003) 3 on Food and Nutritional Care in Hospital: Council
of Europe Committee of Ministers, 2003. http://www.hospitalcaterers.org/documents/cu.pdf
[accessed 05.27.13].
2. Johansson U, Larsson J, Rothenberg E, Stene C, Unosson M, Bosaeus I. Nutritional care in
hospitals. Swedish hospitals do not manage to follow the European committee's guidelines.
[Nutritionsbehandling inom slutenvården. Svenska sjukhus klarar inte Europarådets riktlinjer.] (in
Swedish). Läkartidningen 2006;103(21-22):1718-24.
3. Ministry of Health and Social Affairs [Socialdepartementet]. Coherent health care for older people
with multimorbidity 2013. An agreement between the State and the Swedish Association of Local
Authorities and Regions. [Sammanhållen vård och omsorg om de mest sjuka äldre 2013.
Överrenskommelse mellan staten och Sveriges Kommuner och Landsting] (in Swedish).
Stockholm, 2013:1-27. http://www.skl.se/BinaryLoader.axd?OwnerID=1d5d2dec-bd80-4027-
bd10-192af02201a1&OwnerType=0&PropertyName=EmbeddedImg_67461adb-a8e8-458d-
9750-e6700db9d1b2&FileName=underskrivna+%c3%96K+Sammanh%c3%a5llen+
v%c3%a5rd+och+omsorg+om+de+mest+sjuka+%c3%a4ldre+2013.pdf&Attachment=False
[accecced 06.13.13].
4. Statistics Sweden [Statistiska centralbyrån]. The future population of Sweden 2012-2060
Stockholm, 2012:1-266. http://www.scb.se/statistik/_publikationer/BE0401_2012I60_BR_
BE51BR1202ENG.pdf [accecced 06.13.13].
5. Amaral TF, Matos LC, Teixeira MA, Tavares MM, Alvares L, Antunes A. Undernutrition and
associated factors among hospitalized patients. Clin Nutr 2010;29(5):580-5.
6. Pirlich M, Schutz T, Kemps M, Luhman N, Minko N, Lubke HJ, et al. Social risk factors for
hospital malnutrition. Nutrition 2005;21(3):295-300.
7. Vanderwee K, Clays E, Bocquaert I, Gobert M, Folens B, Defloor T. Malnutrition and associated
factors in elderly hospital patients: a Belgian cross-sectional, multi-centre study. Clin Nutr
2010;29(4):469-76.
8. Lochs H, Allison SP, Meier R, Pirlich M, Kondrup J, Schneider S, et al. Introductory to the ESPEN
Guidelines on Enteral Nutrition: Terminology, definitions and general topics. Clin Nutr
2006;25(2):180-86.
9. van Bokhorst-de van der Schueren MA, Guaitoli PR, Jansma EP, de Vet HC. Nutrition screening
tools: Does one size fit all? A systematic review of screening tools for the hospital setting. Clin
Nutr 2013 Apr 19. doi: 10.1016/j.clnu.2013.04.008. [Epub ahead of print].
10. Kondrup J, Allison SP, Elia M, Vellas B, Plauth M. ESPEN guidelines for nutrition screening
2002. Clin Nutr 2003;22(4):415-21.
11. Vellas B, Guigoz Y, Garry PJ, Nourhashemi F, Bennahum D, Lauque S, et al. The Mini
Nutritional Assessment (MNA) and its use in grading the nutritional state of elderly patients.
Nutrition 1999;15(2):116-22.
12. Guigoz Y. The Mini Nutritional Assessment (MNA) review of the literature--What does it tell us?
J Nutr Health Aging 2006;10(6):466-85; discussion 85-7.
13. Kaiser MJ, Bauer JM, Ramsch C, Uter W, Guigoz Y, Cederholm T, et al. Frequency of
malnutrition in older adults: a multinational perspective using the mini nutritional assessment. J
Am Geriatr Soc 2010;58(9):1734-8.
14. Johansson L, Sidenvall B, Malmberg B, Christensson L. Who will become malnourished? A
prospective study of factors associated with malnutrition in older persons living at home. J Nutr
Health Aging 2009;13(10):855-61.
22
15. Johansson Y, Bachrach-Lindstrom M, Carstensen J, Ek AC. Malnutrition in a home-living older
population: prevalence, incidence and risk factors. A prospective study. J Clin Nurs
2009;18(9):1354-64.
16. Larsson J, Andersson M, Askelof N, Bark T. Malnutrition common in Swedish hospitals. Risk of
complications and prolonged care increases. [Undernäring vanligt vid svenska sjukhus. Risken for
komplikationer och förlängd vårdtid ökar. ] (in Swedish). Nord Med 1994;109(11):292-5.
17. Saletti A, Lindgren EY, Johansson L, Cederholm T. Nutritional status according to mini nutritional
assessment in an institutionalized elderly population in Sweden. Gerontology 2000;46(3):139-45.
18. Torma J, Winblad U, Cederholm T, Saletti A. Does undernutrition still prevail among nursing
home residents? Clin Nutr 2012.Oct 23. doi: 10.1016/j.clnu.2012.10.007. [Epub ahead of print].
19. Westergren A, Wann-Hansson C, Borgdal EB, Sjolander J, Stromblad R, Klevsgard R, et al.
Malnutrition prevalence and precision in nutritional care differed in relation to hospital volume--a
cross-sectional survey. 2009;8(20).
20. Volkert D. Malnutrition in Older Adults - Urgent Need for Action: A Plea for Improving the
Nutritional Situation of Older Adults. Gerontology 2013. Feb 8. doi:10.1159/000346142. [Epub
ahead of print].
21. Pirlich M, Lochs H. Nutrition in the elderly. Best Pract Res Clin Gastroenterol 2001;15(6):869-84.
22. Saka B, Kaya O, Ozturk GB, Erten N, Karan MA. Malnutrition in the elderly and its relationship
with other geriatric syndromes. Clin Nutr 2010;29(6):745-8.
23. Morley JE. Anorexia of aging: a true geriatric syndrome. J Nutr Health Aging 2012;16(5):422-5.
24. Meijers JM, Schols JM, van Bokhorst-de van der Schueren MA, Dassen T, Janssen MA, Halfens
RJ. Malnutrition prevalence in The Netherlands: results of the annual dutch national prevalence
measurement of care problems. Br J Nutr 2009;101(3):417-23.
25. Waitzberg DL, Caiaffa WT, Correia MI. Hospital malnutrition: the Brazilian national survey
(IBRANUTRI): a study of 4000 patients. Nutrition 2001;17(7-8):573-80.
26. Swedish Council on Technology Assessment [Statens beredning för medicinsk utvärdering]. Older
people´s drug therapy - how can it bee improved? A systematical review. [Äldres
läkemedelsanvändning – hur kan den förbättras? En systematisk litteraturöversikt.] (in Swedish).
Stockholm, 2009:1-345. http://www.sbu.se/upload/Publikationer/Content0/1/Lakemedel_Aldre_
Fulltext.pdf [accecced 06.13.13].
27. Sloane PD, Ivey J, Helton M, Barrick AL, Cerna A. Nutritional issues in long-term care. J Am Med
Dir Assoc 2008;9(7):476-85.
28. Saletti A, Johansson L, Yifter-Lindgren E, Wissing U, Osterberg K, Cederholm T. Nutritional
status and a 3-year follow-up in elderly receiving support at home. Gerontology 2005;51(3):192-
8.
29. Suominen M, Muurinen S, Routasalo P, Soini H, Suur-Uski I, Peiponen A, et al. Malnutrition and
associated factors among aged residents in all nursing homes in Helsinki. Eur J Clin Nutr
2005;59(4):578-83.
30. Engelheart S, Lammes E, Akner G. Elderly peoples' meals. A comparative study between elderly
living in a nursing home and frail, self-managing elderly. J Nutr Health Aging 2006;10(2):96-
102.
31. Nordic Council of Ministers. Nordic Nutrition Recommendations 2004: Integrating nutrition and
physical activity. 4th ed. Copenhagen: Nordic Council of Ministers, 2004:95-96.
32. The Swedish National Board of Health and Welfare [Socialstyrelsen]. Method appendix.
Elderlyguide 2012. Open comparissons. [Metodbilaga. Äldreguiden 2012. Öppna jämförelser.]
(in Swedish). Uppsala: The Swedish National Board of Health and Welfare, 2012:1-17.
http://www.socialstyrelsen.se/oppnajamforelser/aldreomsorg/Documents/Metodbilaga-
aldreguiden-2012.pdf [accecced 06.13.13].
23
33. Rasheed S, Woods RT. An investigation into the association between nutritional status and quality
of life in older people admitted to hospital. J Hum Nutr Diet 2013. April 30. doi
10.1111/jhn.12072. [Epub ahead of print].
34. Guest JF, Panca M, Baeyens JP, de Man F, Ljungqvist O, Pichard C, et al. Health economic impact
of managing patients following a community-based diagnosis of malnutrition in the UK. Clin
Nutr 2011;30(4):422-9.
35. Dent E, Visvanathan R, Piantadosi C, Chapman I. Nutritional screening tools as predictors of
mortality, functional decline, and move to higher level care in older people: a systematic review.
J Nutr Gerontol Geriatr 2012;31(2):97-145.
36. Bassey EJ. Demi-span as a measure of skeletal size. Ann Hum Biol 1986;13(5):499-502.
37. Frid H, Thors Adolfsson E, Rosenblad A, Nydahl M. Agreement between different methods of
measuring height in elderly patients. J Hum Nutr Diet 2013. Jan 7. doi: 10.1111/jhn.12031. [Epub
ahead of print]
38. Compan B, di Castri A, Plaze JM, Arnaud-Battandier F. Epidemiological study of malnutrition in
elderly patients in acute, sub-acute and long-term care using the MNA. J Nutr Health Aging
1999;3(3):146-51.
39. Covinsky KE, Martin GE, Beyth RJ, Justice AC, Sehgal AR, Landefeld CS. The relationship
between clinical assessments of nutritional status and adverse outcomes in older hospitalized
medical patients. J Am Geriatr Soc 1999;47(5):532-8.
40. Kagansky N, Berner Y, Koren-Morag N, Perelman L, Knobler H, Levy S. Poor nutritional habits
are predictors of poor outcome in very old hospitalized patients. Am J Clin Nutr 2005;82(4):784-
91; quiz 913-4.
41. Persson MD, Brismar KE, Katzarski KS, Nordenstrom J, Cederholm TE. Nutritional status using
mini nutritional assessment and subjective global assessment predict mortality in geriatric
patients. J Am Geriatr Soc 2002;50(12):1996-2002.
42. Tsai AC, Yang SF, Wang JY. Validation of population-specific Mini-Nutritional Assessment with
its long-term mortality-predicting ability: results of a population-based longitudinal 4-year study
in Taiwan. Br J Nutr 2010;104(1):93-9.
43. Charlton K, Nichols C, Bowden S, Milosavljevic M, Lambert K, Barone L, et al. Poor nutritional
status of older subacute patients predicts clinical outcomes and mortality at 18 months of follow-
up. Eur J Clin Nutr 2012;66(11):1224-8.
44. Donini LM, Savina C, Rosano A, De Felice MR, Tassi L, De Bernardini L, et al. MNA predictive
value in the follow-up of geriatric patients. J Nutr Health Aging 2003;7(5):282-93.
45. Gazzotti C, Albert A, Pepinster A, Petermans J. Clinical usefulness of the mini nutritional
assessment (MNA) scale in geriatric medicine. J Nutr Health Aging 2000;4(3):176-81.
46. Van Nes MC, Herrmann FR, Gold G, Michel JP, Rizzoli R. Does the Mini Nutritional Assessment
predict hospitalization outcomes in older people? Age and Ageing 2001;30(3):221-26.
47. Holst M, Yifter-Lindgren E, Surowiak M, Nielsen K, Mowe M, Carlsson M, et al. Nutritional
screening and risk factors in elderly hospitalized patients: association to clinical outcome? Scand
J Caring Sci 2012. Nov 26. doi: 10.1111/scs.12010. [Epub ahead of print].
48. Baldwin C, Weekes CE. Dietary advice with or without oral nutritional supplements for disease-
related malnutrition in adults. Cochrane Database Syst Rev 2011(9):CD002008.
49. Milne AC, Potter J, Vivanti A, Avenell A. Protein and energy supplementation in elderly people at
risk from malnutrition. Cochrane Database Syst Rev 2009(2):CD003288.
50. Persson M, Hytter-Landahl A, Brismar K, Cederholm T. Nutritional supplementation and dietary
advice in geriatric patients at risk of malnutrition. Clin Nutr 2007;26(2):216-24.