Embed Size (px)
Citation preview
Sains Malaysiana 48(11)(2019): 2391–2403 http://dx.doi.org/10.17576/jsm-2019-4811-10
Statistical Evaluation of Landfill Leachate System and Its Impact on Groundwater and Surface Water in Malaysia
(Penilaian Statistik Sistem Air Larut Resap Tapak Pelupusan Sampah dan Kesannya terhadap Air Bawah Tanah dan Air Permukaan di Malaysia)
TAWFIQ J.H. BANCH, MARLIA M. HANAFIAH*, ABBAS F.M. ALKARKHI & SALEM S. ABU AMR
ABSTRACT
In this study, leachate collection and processing system in Ampar Tenang Closed Landfill (ATCL) and its impact on both groundwater and surface water was evaluated. Samples from three locations in leachate processing system (Collection, aeration and stabilization ponds), groundwater and surface water were collected and tested for twenty-one parameters covering nine heavy metals (Fe2+, Zn2+, Cu2+, Cr2+, Cd2+, Pb+, As3+, Co2+ and Mn2+) and twelve physiochemical parameters (Mg2+, Ca2+, Na+, chemical oxygen demand (COD), biochemical oxygen demand (BOD), total dissolved solids (TDS), total suspended solids (TSS), electrical conductivity (EC), pH, ammoniacal nitrogen (NH3
-N) and dissolved oxygen (DO). Correlation analysis for landfill leachate ponds, groundwater and surface water showed different patterns of relationships between all possible combinations of two parameters. Similarity and dissimilarity were studied through cluster analysis, three clusters were found to entirely separate the collection pond (cluster 1) while the two ponds were clustered with groundwater samples (cluster 2) and the third cluster is for the surface water. This study shows the benefit of statistical analysis such as correlation analysis and cluster analysis for evaluation and interpretation of landfill data to understand the behavior of the selected parameters and to have a clear picture about the pattern of the relationship for effective landfill management.
Keywords: Cluster analysis; correlation matrix; descriptive statistics; heavy metals; landfill site; leachate
ABSTRAK
Dalam kajian ini, sistem pengumpulan dan pemprosesan air larut resap di Tapak Pelupusan Tertutup Ampar Tenang (ATCL) dan kesannya terhadap air bawah tanah dan air permukaan telah dinilai. Sampel daripada tiga lokasi dalam sistem pemprosesan air larut resap (kolam pengumpulan, pengudaraan dan penstabilan), air bawah tanah dan air permukaan diperoleh dan diuji untuk dua puluh satu parameter iaitu sembilan jenis logam berat (Fe2+, Zn2+, Cu2+, Cr2+, Cd2+, Pb+, As3+, Co2+ dan Mn2+) dan dua belas parameter fizikokimia (Mg2+, Ca2+, Na+, permintaan oksigen kimia (COD), permintaan oksigen biokimia (BOD), jumlah pepejal terlarut (TDS), jumlah pepejal terampai (TSS), konduktiviti elektrik (EC), pH, ammonia nitrogen (NH3
-N) dan oksigen terlarut (DO)). Analisis korelasi untuk kolam air larut resap, air bawah tanah dan air permukaan menunjukkan corak hubungan yang berbeza antara semua kemungkinan gabungan dua parameter. Persamaan dan ketidaksetaraan dikaji melalui analisis kelompok dan tiga kelompok didapati memisahkan kolam pungutan sepenuhnya (kelompok 1) manakala dua kolam berkumpul dengan sampel air bawah tanah (kelompok 2) dan kelompokketiga adalah untuk air permukaan. Analisis statistik seperti analisis korelasi dan analisis kelompok untuk penilaian dan pentafsiran data tapak pelupusan sampah dapat membantu dalam memahami ciri-ciri parameter terpilih dan untuk mendapatkan gambaran yang jelas mengenai corak perhubungan bagi pengurusan tapak pelupusan sampah yang berkesan.
Kata kunci: Air larut resap; analisis kelompok; logam berat; matriks korelasi; statistik diskriptif; tapak pelupusan sampah
INTRODUCTION
In the last few years, there has been a growing interest in finding an effective treatment process to reduce the generated pollutants of leachate which cause risks to environment and human health. Population growth and behavioral patterns associated with modern lifestyle have led to an increase of waste generation (Abdulhasan et al. 2019; Abdul Aziz et al. 2020, 2019; Ismail & Hanafiah 2019a, 2019b). Therefore, more effective methods have been proposed for solid waste disposal. Landfilling is
preferable and considered as a common method used to dispose solid wastes due to its low cost and do not involve complex process (Ngoc et al. 2009). Simple technique, environmental, social and economic features make landfilling widely accepted around the world. The Malaysian Federal Government has been utilized landfilling as one of the main disposal methods for the municipal solid wastes as it proposed in its plan of sanitary landfilling constitutes by the year 2020. However, leachate is generated when water percolates through landfill
2392
that contains large amounts of organic and non-organic pollutants (Banch et al. 2019; Biswas et al. 2010; Kebria et al. 2018). It is estimated that the total volume of leachate generated from landfills in Malaysia is about 3 million liter/day, and the quantity of leachate is often more in some countries due to heavy rainfall as Malaysia (Agamuthu et al. 2011). Leachate produced from the interaction of wastes and rainfall also contains trace amounts of chemical pollutants, heavy metals, dissolved and colloidal solids and various pathogens that can potentially contaminate groundwater and surface water (Ashraf et al. 2019; Razarinah et al. 2015; Tzoupanos & Zouboulis 2009). Several factors affecting the characteristics of leachate such as collection system of solid waste, the age of the landfill which that reflect on the stabilization of the waste, the type and composition of the discarded waste, the ability of solid waste component to be dissolved, site and hydrological factors, solid waste compaction, as well as landfill design and operations (Jeeva & Umar 2012; Salem et al. 2008; Weng et al. 2011). Even though being economical and ease operation, leachate also remains the most critical issues for landfill operators and environmental pollution, where polluted the abundant environment even penetrates to groundwater (Emenike et al. 2016; Madera-Parra & Ríos 2017). Soluble organic and inorganic compounds are formed as a result of biological and chemical process in the landfill (Banar et al. 2006). Large volumes of leachate are produced during biological treatments which contain various hazardous and harmful substances that can have potential adverse effect on the surrounding environment (Roy 2018). According to previous toxicity study, 133 different toxic chemicals have been reported in 56 conventional municipal waste landfills compared to 72 toxic chemicals in the industrial waste landfills (Foo & Hameed 2009). Toxic chemicals can adversely affect plant growth, contaminate the drinking water and impair the ecosystem as it penetrates the soils, groundwater and surface water. Moreover, leachate treatment is one of the most difficult issues to handle, as it could be released from the start of landfill operations until potentially many decades after closure (Fatta et al. 1999). In Malaysia, solid waste generation is expected to reach 30,000 ton/day in 2020 with an average of 0.8 kg/capita/day (Bong et al. 2017; Desa 2011). The annual production of solid waste in Malaysia reported at the rate between 3% and 4% (Manaf et al. 2009). This increasing trend could be the result of the rapid economic growth, changing life style and rural-urban migration. About 70% of this waste was collected and about 95% of collected wastes are disposed in landfills (Agamuthu et al. 2009). There are more than 256 landfill sites in Malaysia with one of the landfill sites located in Dengkil, Selangor is Ampar Tenang Closed Landfill (ATCL) site. ATCL is a closed landfill and the leachate collection system contains three stages for leachate processing prior to final discharge to the river namely; collection, aeration and stabilization ponds. Therefore, this study aimed to evaluate the efficiency of leachate processing system and determine
the effect to the groundwater and surface water quality. In this study, physiochemical parameters and heavy metals were analyzed for leachate from each processing stages (collection, aeration and stabilization), groundwater and surface water. The parameters considered in this study include pH, electrical conductivity (EC), dissolved oxygen (DO), total dissolved solid (TDS), total suspended solid (TSS), chemical oxygen demand (COD), biochemical oxygen demand (BOD), ammoniacal nitrogen (NH3-N), magnesium (Mg2+), calcium (Ca2+), sodium (Na+), iron (Fe2+), zinc (Zn2+), copper (Cu2+), chromium (Cr2+), cadmium (Cd2+), led (Pb2+), arsenic (As3+), cobalt (Co2+) and manganese (Mn2+). Statistical methods have been widely used from various scientific fields for analyzing a huge data to interpret the results and draw conclusions (Alkarkhi et al. 2009; Yusri et al. 2016). In this study, descriptive statistics for the concentration of 21 parameters in each stage of the landfill leachate processing system (collection, aeration and stabilization), groundwater and surface water were presented. Correlation matrix between all possible combinations of two parameters included in the study was calculated and examined for each stage of the landfill leachate processing system, groundwater and surface water. Cluster analysis between the three leachate collection ponds and the five locations of groundwater and surface water were investigated.
MATERIALS AND METHODS
SAMPLING AND SITE CHARACTERISTICS
Leachate samples were collected from Ampar Tenang Closed Landfill (ATCL) site, located in the Sepang district, approximately 4 km to the southeast of Dengkil town in Selangor, Malaysia at latitude N 02̊ 48.925 and longitude E 101̊ 4.933, 40 km southeast of Kuala Lumpur (Mohamed et al. 2009). The landfill site is bounded mainly by oil palm plantations and housing projects were developed adjacent to the landfill site. The southern area of the site is located approximately 300 meters from Sungai Labu, a tributary of Sungai Langat, Selangor. The average precipitation in Dengkil is approximately 2,450 mm/year. Annual temperatures consistently range from 24°C to 32°C with a mean temperature of 27°C (Bahaa-eldin et al. 2003). ATCL is located on Langat Basin alluvial aquifer (MHLG 2011). Layers from silt and sands represent the shallow confined aquifer but the ground surface is more clayey (Agamuthu 2001) with thickness 5-12 meters (Esmail 2005). There is another layer of clay under the aquifer with thickness 8-15 meters that makes the aquifer consist of lenses on its bottom (Bahaa-eldin et al. 2010). ATCL has a total area of 10 acres that has been operating for 15 years since 1994. During operation, ATCL received approximately 100 tons of solid waste per day. A total of 500,000 tons of solid waste was disposed of at a site (Taha et al. 2011). The site is fully closed in 2010 following the opening of the new sanitary landfill
2393
in August 2014 (Rashid et al. 2018). ATCL was a mere open dump is being upgraded with the installation of gas piping system, leachate collection and treatment pond, fencing, monitoring wells and other amenities to a Class IV standard. Leachate generated from ATCL is collected through pipe and flows into detention (collection) pond followed by aeration and stabilization ponds. The aeration pond is aerated via diffused air with a high-pressure pump, equalizer (stabilized) and infiltration pond which leachate infiltrate from it to the landfill. Finally, leachate infiltrates down the landfill then discharged to Sungai Labu causing environmental risk. Leachate samples were collected from collection, aeration and stabilized ponds in ATCL leachate collection system. Leachate samples were collected three times during the period between August 2017 and January 2018 from collection, aeration and stabilized ponds in ATCL leachate collection system. Leachate was manually collected and placed in 500 mL polyethene containers. Samples were collected from point in each of the pond at depths 0.3 meter. Samples for heavy metals were preserved separately by adding 1 mL concentrated nitric acid. The samples were immediately transported to the laboratory and cooled at 4°C to reduce the biological and chemical reaction. ATCL contains five exploration holes drilled for subsurface mapping with 30 m depth to monitor groundwater quality. There are six boreholes at this site. Three boreholes were installed at the up slope, while three boreholes were built at down slope of the site. Out of the six monitoring wells installed, only two remain functional. Groundwater was sampled from the remaining 2 boreholes, one in up slope (Groundwater well 1) and the other one in down slope (Groundwater well 2). Three samples were collected from every well that were transferred in 500 mL polyethene bottles and preserved in the laboratory at 4oC. Surface water samples were collected from Sungai Labu about 300 meters away from ATCL that run across the study area. Samples were collected from the three selected points as follow: upstream point (LR1), leachate discharge point (LR2) and downstream point (LR3). Three samples were collected from each point. All collected samples were stored, transferred and characterized in accordance with standard method by APHA (2005).
ANALYTICAL STUDY
The measured parameters comprise temperature, pH and DO tested by YSI EcoSense meter, pH100A meter, and YSI 5000 bench top meter. EC and TDS were determined by using portable EcoSense EC300A, COD and NH3-N were determined using a spectrophotometer, HACH Model (DR/2010). All tests were analyzed according to the standard method (APHA 2005). Heavy metals and physiochemical parameters include the following elements: Mg2+, Ca2+, Na+, Fe2+, Zn2+, Cu2+, Cr2+, Cd2+, Pb+, As3+, Co2+ and Mn2+ were analyzed by using Inductively Coupled Plasma Mass Spectrometry (ICP-MS) model Perkin Elmer ELAN 9000 ICP-MS. Twenty mL of samples was filtered
using the 0.45 μm membrane filter, while vacuum was applied through the membrane filtration set. Then 15 mL of filtered water sample was transferred into the centrifuge tube. Each centrifuge tube was analyzed using Optima 8300 ICP-OES Spectrometer.
STATISTICAL ANALYSIS
The data for water quality and heavy metals concentrations obtained from the landfill leachate, surface water and groundwater were analyzed using descriptive statistics. The relationship between different parameters was studied by computing Pearson correlation coefficient between all possible pairs of parameters (Alkarkhi et al. 2008). The similarity between the three sampling sites was determined using cluster analysis (CA) which can summarize the results in a pictorial form or a dendrogram as done by Yusup and Alkarkhi (2011). The analyses were performed using the statistical software R.
RESULTS AND DISCUSSION
DESCRIPTIVE STATISTICS
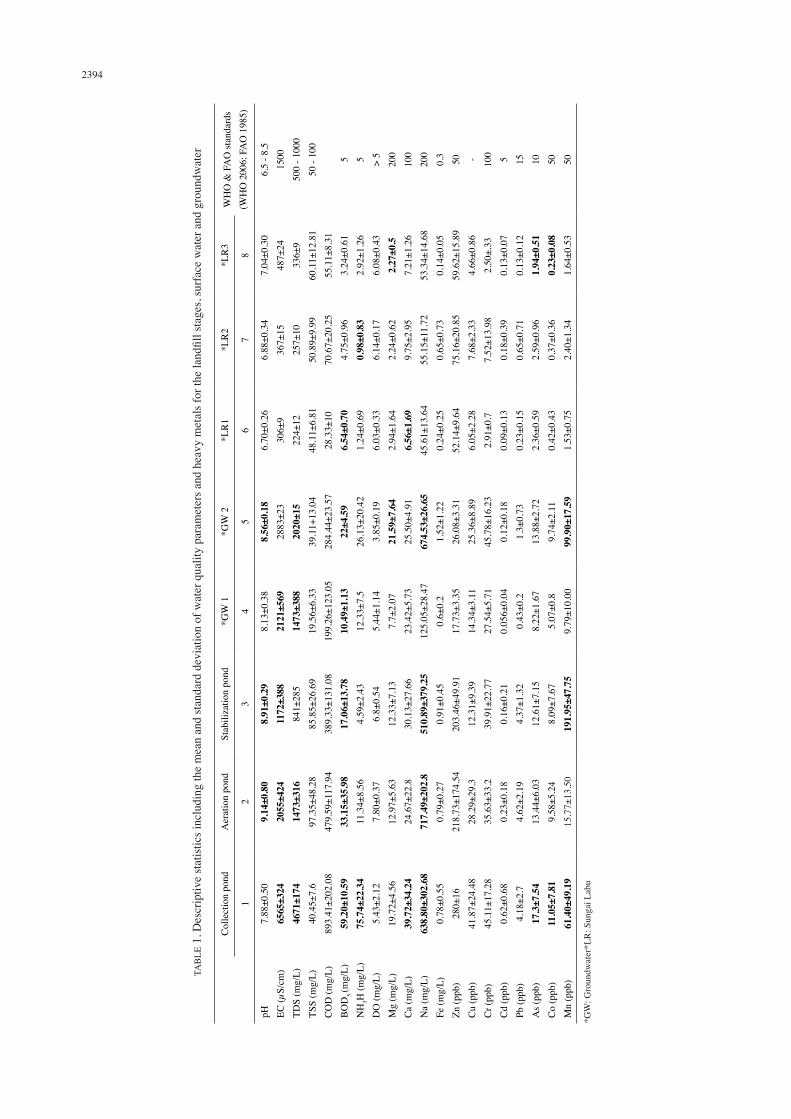
Descriptive statistics including the mean and standard deviation for the concentration of heavy metals and physiochemical parameters in each stage of the landfill leachate treatment system, groundwater and surface water are given in Table 1. It can be observed that the position of the highest and the lowest average of selected parameters varies among landfill stages, surface water and groundwater which considered as an indication of the changing in the properties or the behavior of selected parameters that influenced by the treatment of the landfill leachate at different stages (collection, aeration and stabilization ponds). On the other hand, the higher standard deviation for some parameters in some sampling locations represents the high flocculation in the parameters concentration during the monitoring time. As shown in Table 1, the highest value for the 21 parameters was observed at the collection pond, and the lowest value was observed at the river sampling points LR1, LR2 and LR3. Although the average level of leachate parameters is reduced by aeration and stabilization processes, however, the concentration of most 21 parameters are still higher than the acceptable discharge limit for industrial wastewater according to Regulations 2009, Malaysian Environmental Quality Act 1974 (Act 127). Different behavior was observed for other parameters as shown in Table 1; the average values for the most parameters in the collection pond are generally reduced in aeration and stabilization ponds. Aeration process can reduce the level of COD, BOD and ammonia in the leachate (Huang et al. 2006). Additional reduction of organic and ammonia level was reported in stabilization pond. During stabilization of leachate, anaerobic treatment is carried out by anaerobic microorganism which can degrade organics to carbon dioxide and methane. This result is in line with the results
2394
TAB
LE 1
. Des
crip
tive
stat
istic
s inc
ludi
ng th
e m
ean
and
stan
dard
dev
iatio
n of
wat
er q
ualit
y pa
ram
eter
s and
hea
vy m
etal
s for
the
land
fill s
tage
s, su
rfac
e w
ater
and
gro
undw
ater
C
olle
ctio
n po
ndA
erat
ion
pond
Stab
iliza
tion
pond
*GW
1
*GW
2
*LR
1*L
R2
*LR
3W
HO
& F
AO
stan
dard
s (W
HO
200
6; F
AO
198
5)
12
34
56
78
pH EC (µ
S/cm
)TD
S (m
g/L)
TSS
(mg/
L)C
OD
(mg/
L)B
OD
5 (m
g/L)
NH
3H (m
g/L)
DO
(mg/
L)M
g (m
g/L)
Ca
(mg/
L)N
a (m
g/L)
Fe (m
g/L)
Zn (p
pb)
Cu
(ppb
)C
r (pp
b)C
d (p
pb)
Pb (p
pb)
As (
ppb)
Co
(ppb
)M
n (p
pb)
7.88
±0.5
065
65±3
2446
71±1
7440
.45±
7.6
893.
41±2
02.0
859
.20±
10.5
975
.74±
22.3
45.
43±2
.12
19.7
2±4.
5639
.72±
34.2
463
8.80
±302
.68
0.78
±0.5
528
0±16
41.8
7±24
.48
45.1
1±17
.28
0.62
±0.6
84.
18±2
.717
.3±7
.54
11.0
5±7.
8161
.40±
49.1
9
9.14
±0.8
020
55±4
2414
73±3
1697
.35±
48.2
847
9.59
±117
.94
33.1
5±35
.98
11.3
4±8.
567.
80±0
.37
12.9
7±5.
6324
.67±
22.8
717.
49±2
02.8
0.79
±0.2
721
8.73
±174
.54
28.2
9±29
.335
.63±
33.2
0.23
±0.1
84.
62±2
.19
13.4
4±6.
039.
58±5
.24
15.7
7±13
.50
8.91
±0.2
911
72±3
8884
1±28
585
.85±
26.6
938
9.33
±131
.08
17.0
6±13
.78
4.59
±2.4
36.
8±0.
5412
.33±
7.13
30.1
3±27
.66
510.
89±3
79.2
50.
91±0
.45
203.
46±4
9.91
12.3
1±9.
3939
.91±
22.7
70.
16±0
.21
4.37
±1.3
212
.61±
7.15
8.09
±7.6
719
1.95
±47.
75
8.13
±0.3
821
21±5
6914
73±3
8819
.56±
6.33
199.
26±1
23.0
510
.49±
1.13
12.3
3±7.
55.
44±1
.14
7.7±
2.07
23.4
2±5.
7312
5.05
±28.
470.
6±0.
217
.73±
3.35
14.3
4±3.
1127
.54±
5.71
0.05
6±0.
040.
43±0
.28.
22±1
.67
5.07
±0.8
9.79
±10.
00
8.56
±0.1
828
83±2
320
20±1
539
.11+
13.0
428
4.44
±23.
5722
±4.5
926
.13±
20.4
23.
85±0
.19
21.5
9±7.
6425
.50±
4.91
674.
53±2
6.65
1.52
±1.2
226
.08±
3.31
25.3
6±8.
8945
.78±
16.2
30.
12±0
.18
1.3±
0.73
13.8
8±2.
729.
74±2
.11
99.9
0±17
.59
6.70
±0.2
630
6±9
224±
1248
.11±
6.81
28.3
3±10
6.54
±0.7
01.
24±0
.69
6.03
±0.3
32.
94±1
.64
6.56
±1.6
945
.61±
13.6
40.
24±0
.25
52.1
4±9.
646.
05±2
.28
2.91
±0.7
0.09
±0.1
30.
23±0
.15
2.36
±0.5
90.
42±0
.43
1.53
±0.7
5
6.88
±0.3
436
7±15
257±
1050
.89±
9.99
70.6
7±20
.25
4.75
±0.9
60.
98±0
.83
6.14
±0.1
72.
24±0
.62
9.75
±2.9
555
.15±
11.7
20.
65±0
.73
75.1
6±20
.85
7.68
±2.3
37.
52±1
3.98
0.18
±0.3
90.
65±0
.71
2.59
±0.9
60.
37±0
.36
2.40
±1.3
4
7.04
±0.3
048
7±24
336±
960
.11±
12.8
155
.11±
8.31
3.24
±0.6
12.
92±1
.26
6.08
±0.4
32.
27±0
.57.
21±1
.26
53.3
4±14
.68
0.14
±0.0
559
.62±
15.8
94.
66±0
.86
2.50
±.33
0.13
±0.0
70.
13±0
.12
1.94
±0.5
10.
23±0
.08
1.64
±0.5
3
6.5
- 8.5
1500
500
- 100
050
- 10
0
5 5 > 5
200
100
200
0.3 50 - 100 5 15 10 50 50
*GW
: Gro
undw
ater
*LR
: Sun
gai L
abu
2395
obtained by Kamaruddin et al. (2013). The study monitored the effect of leachate stabilization on organic and ammonia removal and reported 76% and 52% removal for COD and ammonia, respectively, during leachate stabilization. However, the level of some other parameters like pH, DO, TDS, TSS and some other trace elements and heavy metals are observed to be increased in the aeration and stabilization ponds (Table 1). The relationship between pH and dissolved oxygen was discussed by Cohen and Kirchmann (2004). The study concluded that the pH value can be increased by increasing the dissolved oxygen. As shown in Table 1, the average value of pH was increased from 7.88 in the collection pond to 9.15 in aeration pond and then slightly reduced to 8.9 in stabilization pond. Samples from groundwater wells were analyzed to monitor and evaluate the effect of leachate collection and treatment system on groundwater. It was found that the average values of the parameters are in the same level of leachate parameters in stabilization pond implying that the groundwater is affected by the leachate contamination. Moreover, the level of parameters in GW2 (landfill down slope well) is slightly higher than in GW1 (landfill upslope well) which may due to the effect of groundwater and percolated leachate flow direction. The same results were obtained by Alslaibi et al. (2018) that assessed the effect of landfill leachate parameters on subsurface and groundwater. Although the leachate ponds are lined, due to heavy rain and overflow of leachate ponds, large quantity of leachate can contaminate the soil surrounding the landfill. Sungai Labu is a final discharge point of flooded leachate. Samples from the river were collected and characterized to determine the level of contamination of samples collected from Sungai Labu. As shown in Table 1, the highest level for the parameter in the river can be observed in LR2 which located adjacent to the landfill leachate discharge area. Maiti et al. (2016) characterized the parameters for landfill leachate and evaluate its impact to the groundwater and surface water in Dhapa, Kolkata, India.
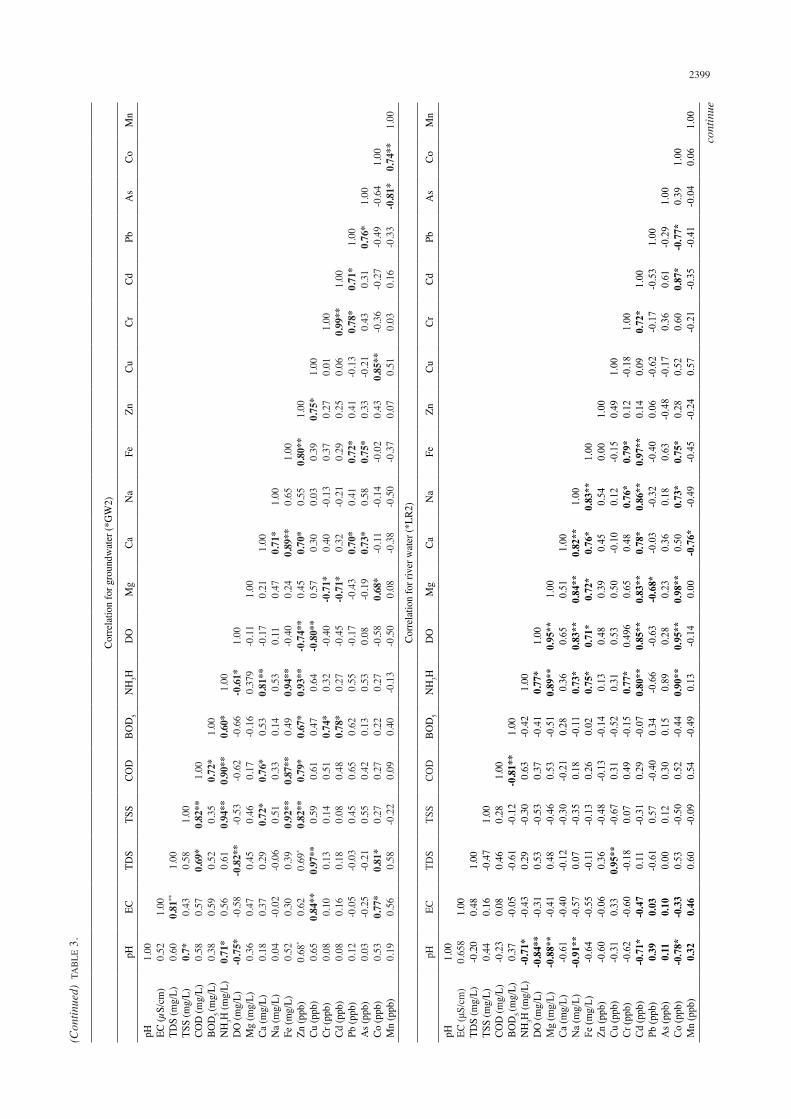
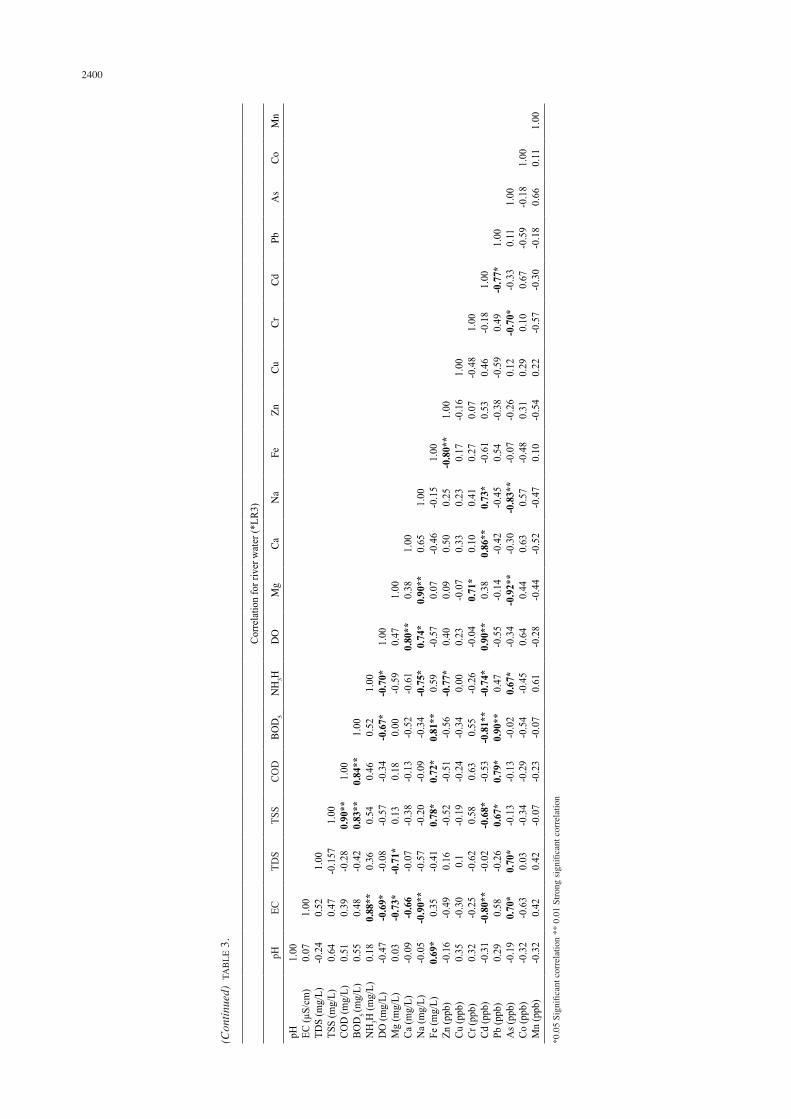
CORRELATION ANALYSIS
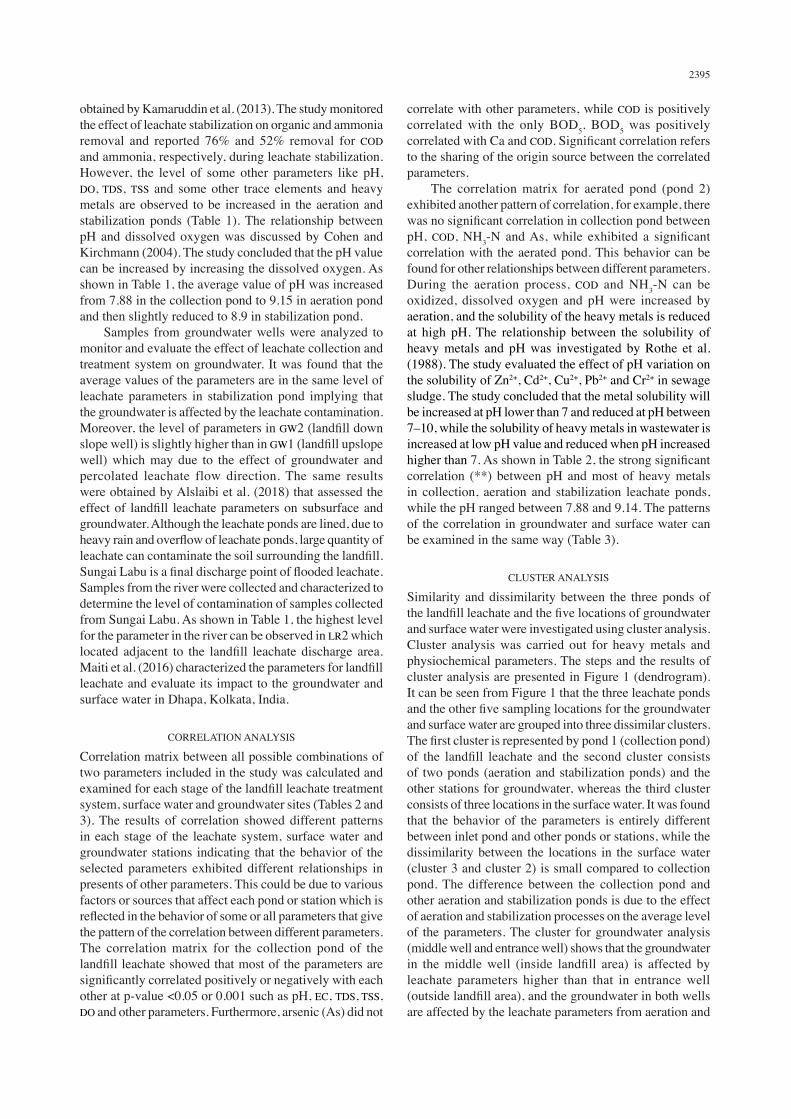
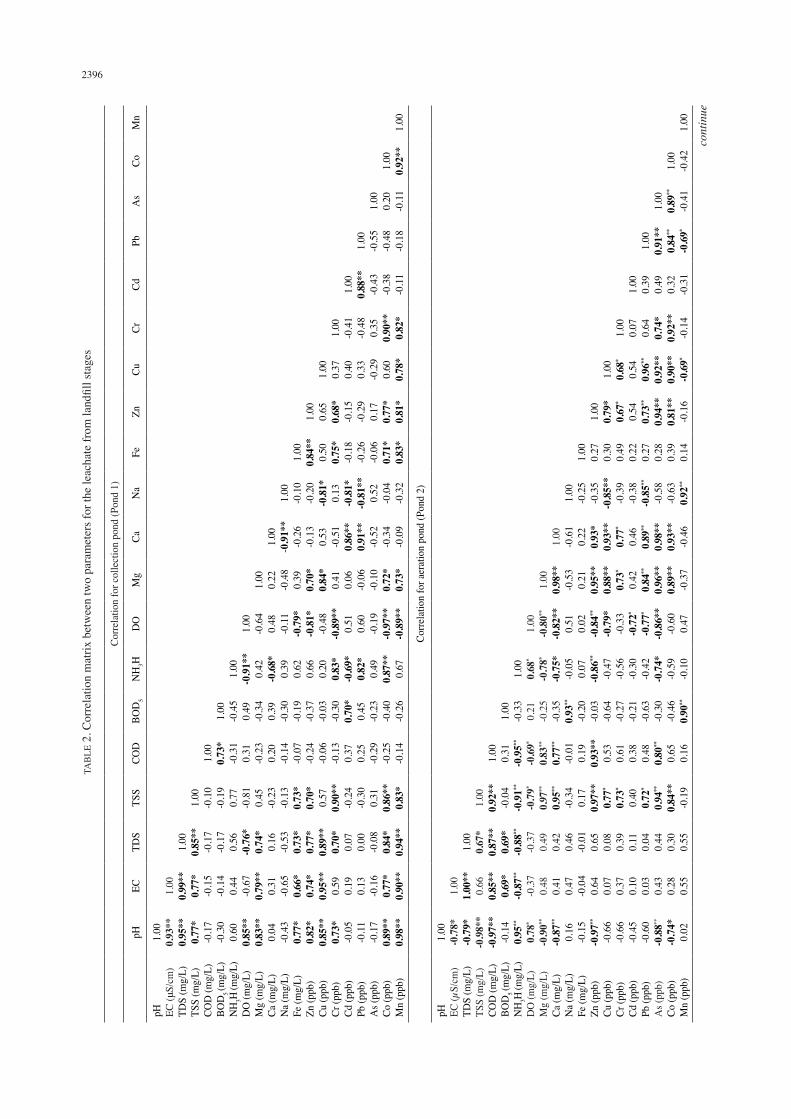
Correlation matrix between all possible combinations of two parameters included in the study was calculated and examined for each stage of the landfill leachate treatment system, surface water and groundwater sites (Tables 2 and 3). The results of correlation showed different patterns in each stage of the leachate system, surface water and groundwater stations indicating that the behavior of the selected parameters exhibited different relationships in presents of other parameters. This could be due to various factors or sources that affect each pond or station which is reflected in the behavior of some or all parameters that give the pattern of the correlation between different parameters. The correlation matrix for the collection pond of the landfill leachate showed that most of the parameters are significantly correlated positively or negatively with each other at p-value <0.05 or 0.001 such as pH, EC, TDS, TSS, DO and other parameters. Furthermore, arsenic (As) did not
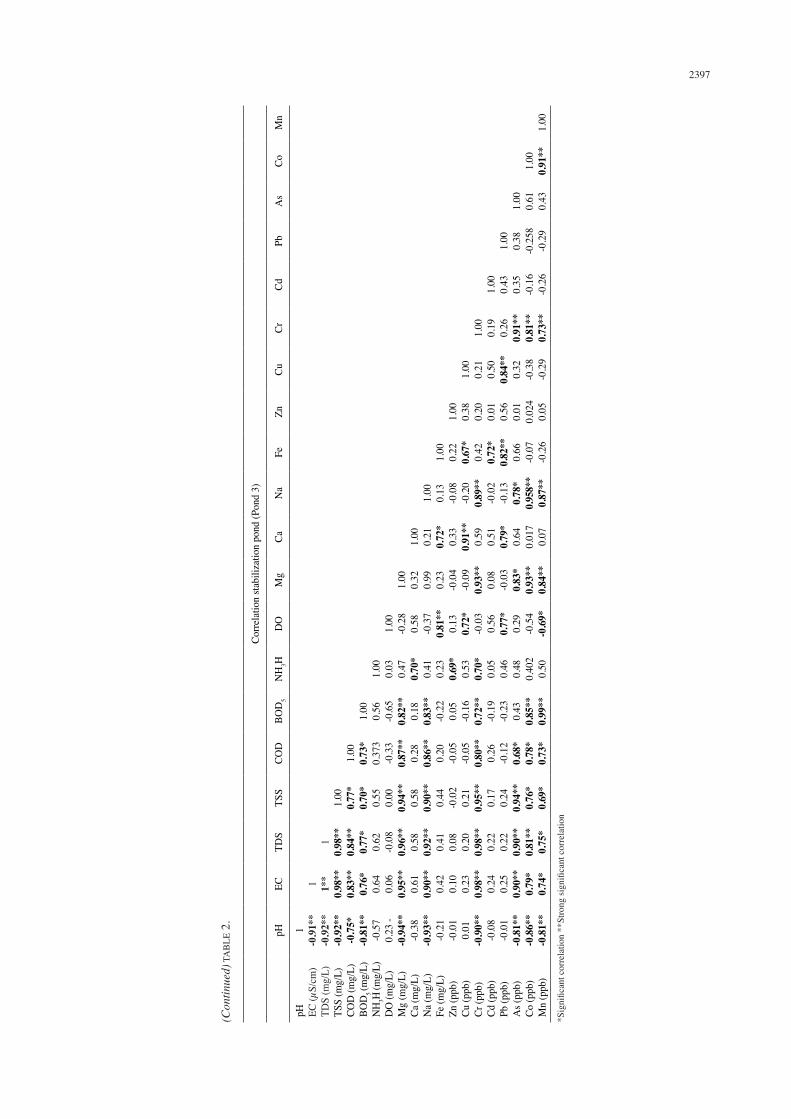
correlate with other parameters, while COD is positively correlated with the only BOD5. BOD5 was positively correlated with Ca and COD. Significant correlation refers to the sharing of the origin source between the correlated parameters. The correlation matrix for aerated pond (pond 2) exhibited another pattern of correlation, for example, there was no significant correlation in collection pond between pH, COD, NH3-N and As, while exhibited a significant correlation with the aerated pond. This behavior can be found for other relationships between different parameters. During the aeration process, COD and NH3-N can be oxidized, dissolved oxygen and pH were increased by aeration, and the solubility of the heavy metals is reduced at high pH. The relationship between the solubility of heavy metals and pH was investigated by Rothe et al. (1988). The study evaluated the effect of pH variation on the solubility of Zn2+, Cd2+, Cu2+, Pb2+ and Cr2+ in sewage sludge. The study concluded that the metal solubility will be increased at pH lower than 7 and reduced at pH between 7–10, while the solubility of heavy metals in wastewater is increased at low pH value and reduced when pH increased higher than 7. As shown in Table 2, the strong significant correlation (**) between pH and most of heavy metals in collection, aeration and stabilization leachate ponds, while the pH ranged between 7.88 and 9.14. The patterns of the correlation in groundwater and surface water can be examined in the same way (Table 3).
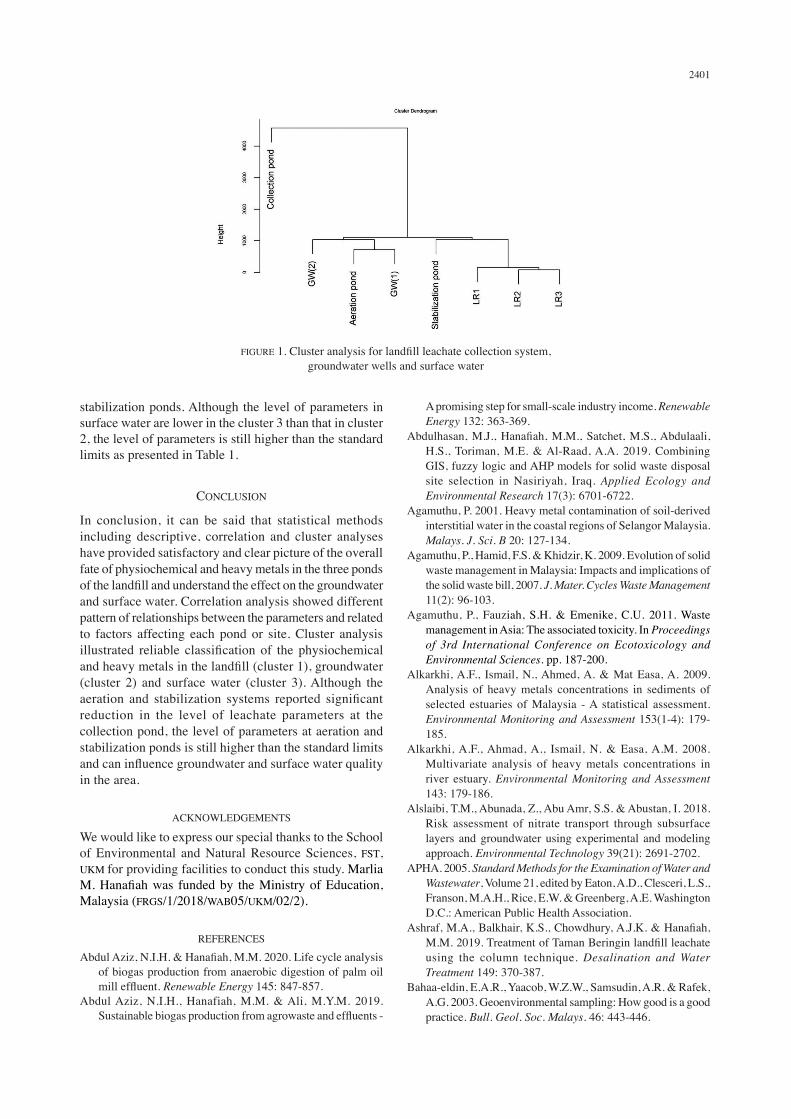
CLUSTER ANALYSIS
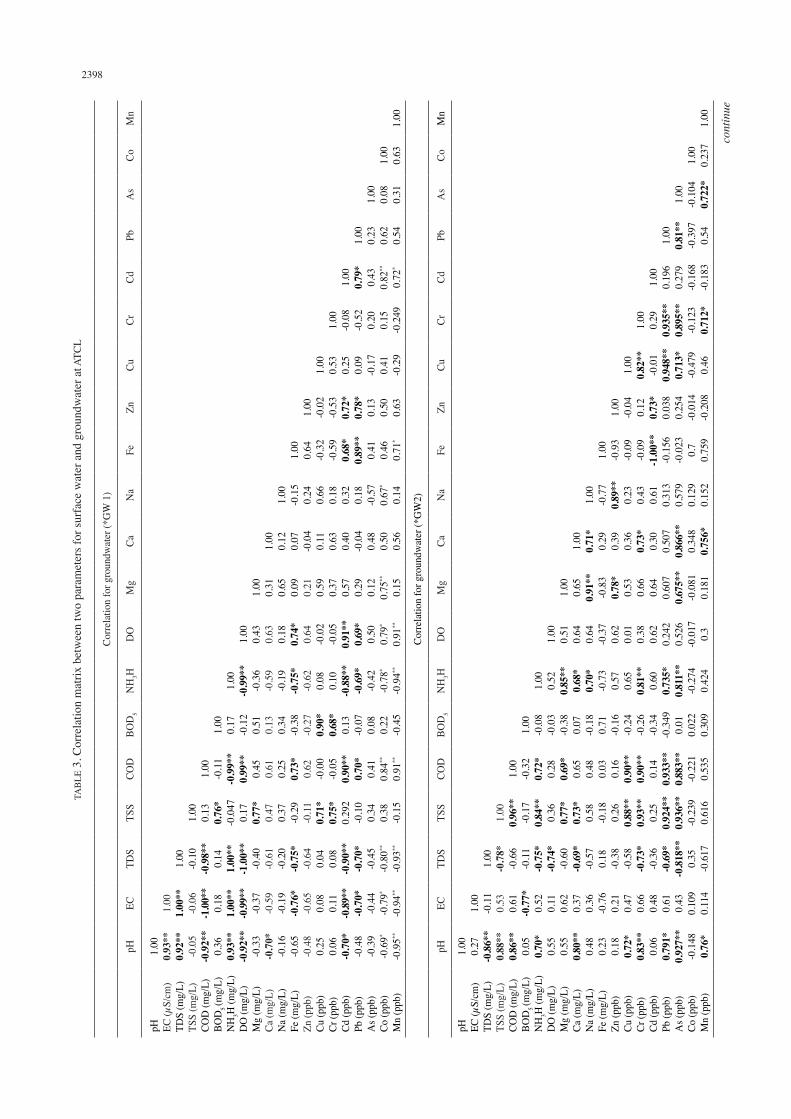
Similarity and dissimilarity between the three ponds of the landfill leachate and the five locations of groundwater and surface water were investigated using cluster analysis. Cluster analysis was carried out for heavy metals and physiochemical parameters. The steps and the results of cluster analysis are presented in Figure 1 (dendrogram). It can be seen from Figure 1 that the three leachate ponds and the other five sampling locations for the groundwater and surface water are grouped into three dissimilar clusters. The first cluster is represented by pond 1 (collection pond) of the landfill leachate and the second cluster consists of two ponds (aeration and stabilization ponds) and the other stations for groundwater, whereas the third cluster consists of three locations in the surface water. It was found that the behavior of the parameters is entirely different between inlet pond and other ponds or stations, while the dissimilarity between the locations in the surface water (cluster 3 and cluster 2) is small compared to collection pond. The difference between the collection pond and other aeration and stabilization ponds is due to the effect of aeration and stabilization processes on the average level of the parameters. The cluster for groundwater analysis (middle well and entrance well) shows that the groundwater in the middle well (inside landfill area) is affected by leachate parameters higher than that in entrance well (outside landfill area), and the groundwater in both wells are affected by the leachate parameters from aeration and
2396 TA
BLE
2. C
orre
latio
n m
atrix
bet
wee
n tw
o pa
ram
eter
s for
the
leac
hate
from
land
fill s
tage
s
Corre
latio
n fo
r col
lect
ion
pond
(Pon
d 1)
pHEC
TDS
TSS
COD
BOD
5N
H3H
DO
Mg
CaN
aFe
ZnCu
CrCd
PbA
sCo
Mn
pH EC (μ
S/cm
)TD
S (m
g/L)
TSS
(mg/
L)CO
D (m
g/L)
BOD
5 (m
g/L)
NH
3H (m
g/L)
DO
(mg/
L)M
g (m
g/L)
Ca (m
g/L)
Na
(mg/
L)Fe
(mg/
L)Zn
(ppb
)Cu
(ppb
)Cr
(ppb
)Cd
(ppb
)Pb
(ppb
)A
s (pp
b)Co
(ppb
)M
n (p
pb)
1.00
0.93
**0.
95**
0.77
*-0
.17
-0.3
00.
600.
85**
0.83
**0.
04-0
.43
0.77
*0.
82*
0.85
**0.
73*
-0.0
5-0
.11
-0.1
70.
89**
0.98
**
1.00
0.99
**0.
77*
-0.1
5-0
.14
0.44
-0.6
70.
79**
0.31
-0.6
50.
66*
0.74
*0.
95**
0.59
0.19
0.13
-0.1
60.
77*
0.90
**
1.00
0.85
**-0
.17
-0.1
70.
56-0
.76*
0.74
*0.
16-0
.53
0.73
*0.
77*
0.89
**0.
70*
0.07
0.00
-0.0
80.
84*
0.94
**
1.00
-0.1
0-0
.19
0.77
-0.8
10.
45-0
.23
-0.1
30.
73*
0.70
*0.
570.
90**
-0.2
4-0
.30
0.31
0.86
**0.
83*
1.00
0.73
*-0
.31
0.31
-0.2
30.
20-0
.14
-0.0
7-0
.24
-0.0
6-0
.13
0.37
0.25
-0.2
9-0
.25
-0.1
4
1.00
-0.4
50.
49-0
.34
0.39
-0.3
0-0
.19
-0.3
7-0
.03
-0.3
00.
70*
0.45
-0.2
3-0
.40
-0.2
6
1.00
-0.9
1**
0.42
-0.6
8*0.
390.
620.
660.
200.
83*
-0.6
9*0.
82*
0.49
0.87
**0.
67
1.00
-0.6
40.
48-0
.11
-0.7
9*-0
.81*
-0.4
8-0
.89*
*0.
510.
60-0
.19
-0.9
7**
-0.8
9**
1.00
0.22
-0.4
80.
390.
70*
0.84
*0.
410.
06-0
.06
-0.1
00.
72*
0.73
*
1.00
-0.9
1**
-0.2
6-0
.13
0.53
-0.5
10.
86**
0.91
**-0
.52
-0.3
4-0
.09
1.00
-0.1
0-0
.20
-0.8
1*0.
13-0
.81*
-0.8
1**
0.52
-0.0
4-0
.32
1.00
0.84
**0.
500.
75*
-0.1
8-0
.26
-0.0
60.
71*
0.83
*
1.00
0.65
0.68
*-0
.15
-0.2
90.
170.
77*
0.81
*
1.00
0.37
0.40
0.33
-0.2
90.
600.
78*
1.00
-0.4
1-0
.48
0.35
0.90
**0.
82*
1.00
0.88
**-0
.43
-0.3
8-0
.11
1.00
-0.5
5-0
.48
-0.1
8
1.00
0.20
-0.1
11.
000.
92**
1.00
Corre
latio
n fo
r aer
atio
n po
nd (P
ond
2)
pH EC (µ
S/cm
)TD
S (m
g/L)
TSS
(mg/
L)CO
D (m
g/L)
BOD
5 (m
g/L)
NH
3H (m
g/L)
DO
(mg/
L)M
g (m
g/L)
Ca (m
g/L)
Na
(mg/
L)Fe
(mg/
L)Zn
(ppb
)Cu
(ppb
)Cr
(ppb
)Cd
(ppb
)Pb
(ppb
)A
s (pp
b)Co
(ppb
)M
n (p
pb)
1.00
-0.7
8*-0
.79*
-0.9
8**
-0.9
7**
-0.1
40.
95**
0.78
*
-0.9
0**
-0.8
7**
0.16
-0.1
5-0
.97**
-0.6
6-0
.66
-0.4
5-0
.60
-0.8
8**
-0.7
4*0.
02
1.00
1.00
**0.
660.
85**
0.69
*-0
.87**
-0.3
70.
480.
410.
47-0
.04
0.64
0.07
0.37
0.10
0.03
0.43
0.28
0.55
1.00
0.67
*0.
87**
0.69
*-0
.88**
-0.3
70.
490.
420.
46-0
.01
0.65
0.08
0.39
0.11
0.04
0.44
0.30
0.55
1.00
0.92
**-0
.04
-0.9
1**
-0.7
9*
0.97
**
0.95
**
-0.3
40.
170.
97**
0.77
*
0.73
*
0.40
0.72
*
0.94
**
0.84
**-0
.19
1.00
0.31
-0.9
5**
-0.6
9*
0.83
**
0.77
**
-0.0
10.
190.
93**
0.53
0.61
0.38
0.48
0.80
**
0.65
0.16
1.00
-0.3
30.
21-0
.25
-0.3
50.
93**
-0.2
0-0
.03
-0.6
4-0
.27
-0.2
1-0
.63
-0.3
0-0
.46
0.90
**
1.00
0.68
*
-0.7
8*
-0.7
5*-0
.05
0.07
-0.8
6**
-0.4
7-0
.56
-0.3
0-0
.42
-0.7
4*-0
.59
-0.1
0
1.00
-0.8
0**
-0.8
2**
0.51
0.02
-0.8
4**
-0.7
9*-0
.33
-0.7
2*
-0.7
7*
-0.8
6**
-0.6
00.
47
1.00
0.98
**-0
.53
0.21
0.95
**0.
88**
0.73
*
0.42
0.84
**
0.96
**0.
89**
-0.3
7
1.00
-0.6
10.
220.
93*
0.93
**0.
77*
0.46
0.89
**
0.98
**0.
93**
-0.4
6
1.00
-0.2
5-0
.35
-0.8
5**
-0.3
9-0
.38
-0.8
5**
-0.5
8-0
.63
0.92
**
1.00
0.27
0.30
0.49
0.22
0.27
0.28
0.39
0.14
1.00
0.79
*0.
67*
0.54
0.73
**
0.94
**0.
81**
-0.1
6
1.00
0.68
*
0.54
0.96
**
0.92
**0.
90**
-0.6
9*
1.00
0.07
0.64
0.74
*0.
92**
-0.1
4
1.00
0.39
0.49
0.32
-0.3
1
1.00
0.91
**0.
84**
-0.6
9*
1.00
0.89
**
-0.4
11.
00-0
.42
1.00
cont
inue
2397
(Con
tinue
d) T
AB
LE 2
.
Corre
latio
n sta
biliz
atio
n po
nd (P
ond
3)
pHEC
TDS
TSS
COD
BOD
5N
H3H
DO
Mg
CaN
aFe
ZnCu
CrCd
PbA
sCo
Mn
pH EC (µ
S/cm
)TD
S (m
g/L)
TSS
(mg/
L)CO
D (m
g/L)
BOD
5 (m
g/L)
NH
3H (m
g/L)
DO
(mg/
L)M
g (m
g/L)
Ca (m
g/L)
Na
(mg/
L)Fe
(mg/
L)Zn
(ppb
)Cu
(ppb
)Cr
(ppb
)Cd
(ppb
)Pb
(ppb
)A
s (pp
b)Co
(ppb
)M
n (p
pb)
1-0
.91*
*-0
.92*
*-0
.92*
*-0
.75*
-0.8
1**
-0.5
70.
23 -
-0.9
4**
-0.3
8-0
.93*
*-0
.21
-0.0
10.
01-0
.90*
*-0
.08
-0.0
1-0
.81*
*-0
.86*
*-0
.81*
*
1 1**
0.98
**0.
83**
0.76
*0.
640.
060.
95**
0.61
0.90
**0.
420.
100.
230.
98**
0.24
0.25
0.90
**0.
79*
0.74
*
10.
98**
0.84
**0.
77*
0.62
-0.0
80.
96**
0.58
0.92
**0.
410.
080.
200.
98**
0.22
0.22
0.90
**0.
81**
0.75
*
1.00
0.77
*0.
70*
0.55
0.00
0.94
**0.
580.
90**
0.44
-0.0
20.
210.
95**
0.17
0.24
0.94
**0.
76*
0.69
*
1.00
0.73
*0.
373
-0.3
30.
87**
0.28
0.86
**0.
20-0
.05
-0.0
50.
80**
0.26
-0.1
20.
68*
0.78
*0.
73*
1.00
0.56
-0.6
50.
82**
0.18
0.83
**-0
.22
0.05
-0.1
60.
72**
-0.1
9-0
.23
0.43
0.85
**0.
99**
1.00
0.03
0.47
0.70
*0.
410.
230.
69*
0.53
0.70
*0.
050.
460.
480.
402
0.50
1.00
-0.2
80.
58-0
.37
0.81
**0.
130.
72*
-0.0
30.
560.
77*
0.29
-0.5
4-0
.69*
1.00
0.32
0.99
0.23
-0.0
4-0
.09
0.93
**0.
08-0
.03
0.83
*0.
93**
0.84
**
1.00
0.21
0.72
*0.
330.
91**
0.59
0.51
0.79
*0.
640.
017
0.07
1.00
0.13
-0.0
8-0
.20
0.89
**-0
.02
-0.1
30.
78*
0.95
8**
0.87
**
1.00
0.22
0.67
*0.
420.
72*
0.82
**0.
66-0
.07
-0.2
6
1.00
0.38
0.20
0.01
0.56
0.01
0.02
40.
05
1.00
0.21
0.50
0.84
**0.
32-0
.38
-0.2
9
1.00
0.19
0.26
0.91
**0.
81**
0.73
**
1.00
0.43
0.35
-0.1
6-0
.26
1.00
0.38
-0.2
58-0
.29
1.00
0.61
0.43
1.00
0.91
**1.
00
*Sig
nific
ant c
orre
latio
n **
Stro
ng si
gnifi
cant
cor
rela
tion
2398 TA
BLE
3. C
orre
latio
n m
atrix
bet
wee
n tw
o pa
ram
eter
s for
surf
ace
wat
er a
nd g
roun
dwat
er a
t ATC
L
Corre
latio
n fo
r gro
undw
ater
(*G
W 1
)
pHEC
TDS
TSS
COD
BOD
5N
H3H
DO
Mg
CaN
aFe
ZnCu
CrCd
PbA
sCo
Mn
pH EC (µ
S/cm
)TD
S (m
g/L)
TSS
(mg/
L)CO
D (m
g/L)
BOD
5 (m
g/L)
NH
3H (m
g/L)
DO
(mg/
L)M
g (m
g/L)
Ca (m
g/L)
Na
(mg/
L)Fe
(mg/
L)Zn
(ppb
)Cu
(ppb
)Cr
(ppb
)Cd
(ppb
)Pb
(ppb
)A
s (pp
b)Co
(ppb
)M
n (p
pb)
1.00
0.93
**0.
92**
-0.0
5-0
.92*
*0.
360.
93**
-0.9
2**
-0.3
3-0
.70*
-0.1
6-0
.65
-0.4
80.
250.
06-0
.70*
-0.4
8-0
.39
-0.6
9*
-0.9
5**
1.00
1.00
**-0
.06
-1.0
0**
0.18
1.00
**-0
.99*
*-0
.37
-0.5
9-0
.19
-0.7
6*-0
.65
0.08
0.11
-0.8
9**
-0.7
0*-0
.44
-0.7
9*
-0.9
4**
1.00
-0.1
0-0
.98*
*0.
141.
00**
-1.0
0**
-0.4
0-0
.61
-0.2
0-0
.75*
-0.6
40.
040.
08-0
.90*
*-0
.70*
-0.4
5-0
.80**
-0.9
3**
1.00
0.13
0.76
*-0
.047
0.17
0.77
*0.
470.
37-0
.29
-0.1
10.
71*
0.75
*0.
292
-0.1
00.
340.
38-0
.15
1.00
-0.1
1-0
.99*
*0.
99**
0.45
0.61
0.25
0.73
*0.
62-0
.00
-0.0
50.
90**
0.70
*0.
410.
84**
0.91
**
1.00
0.17
-0.1
20.
510.
130.
34-0
.38
-0.2
70.
90*
0.68
*0.
13-0
.07
0.08
0.22
-0.4
5
1.00
-0.9
9**
-0.3
6-0
.59
-0.1
9-0
.75*
-0.6
20.
080.
10-0
.88*
*-0
.69*
-0.4
2-0
.78*
-0.9
4**
1.00
0.43
0.63
0.18
0.74
*0.
64-0
.02
-0.0
50.
91**
0.69
*0.
500.
79*
0.91
**
1.00
0.31
0.65
0.09
0.21
0.59
0.37
0.57
0.29
0.12
0.75
**
0.15
1.00
0.12
0.07
-0.0
40.
110.
630.
40-0
.04
0.48
0.50
0.56
1.00
-0.1
50.
240.
660.
180.
320.
18-0
.57
0.67
*
0.14
1.00
0.64
-0.3
2-0
.59
0.68
*0.
89**
0.41
0.46
0.71
*
1.00
-0.0
2-0
.53
0.72
*0.
78*
0.13
0.50
0.63
1.00
0.53
0.25
0.09
-0.1
70.
41-0
.29
1.00
-0.0
8-0
.52
0.20
0.15
-0.2
49
1.00
0.79
*0.
430.
82**
0.72
*
1.00
0.23
0.62
0.54
1.00
0.08
0.31
1.00
0.63
1.00
Corre
latio
n fo
r gro
undw
ater
(*G
W2)
pHEC
TDS
TSS
COD
BOD
5N
H3H
DO
Mg
CaN
aFe
ZnCu
CrCd
PbA
sCo
Mn
pH EC (µ
S/cm
)TD
S (m
g/L)
TSS
(mg/
L)CO
D (m
g/L)
BOD
5 (m
g/L)
NH
3H (m
g/L)
DO
(mg/
L)M
g (m
g/L)
Ca (m
g/L)
Na
(mg/
L)Fe
(mg/
L)Zn
(ppb
)Cu
(ppb
)Cr
(ppb
)Cd
(ppb
)Pb
(ppb
)A
s (pp
b)Co
(ppb
)M
n (p
pb)
1.00
0.27
-0.8
6**
0.88
**0.
86**
0.05
0.70
*0.
550.
550.
80**
0.48
0.23
0.18
0.72
*0.
83**
0.06
0.79
1*0.
927*
*-0
.148
0.76
*
1.00
-0.1
10.
530.
61-0
.77*
0.52
0.11
0.62
0.37
0.36
-0.7
60.
210.
470.
660.
480.
610.
430.
109
0.11
4
1.00
-0.7
8*-0
.66
-0.1
1-0
.75*
-0.7
4*-0
.60
-0.6
9*-0
.57
0.18
-0.3
8-0
.58
-0.7
3*-0
.36
-0.6
9*-0
.818
**0.
35-0
.617
1.00
0.96
**-0
.17
0.84
**0.
360.
77*
0.73
*0.
58-0
.18
0.26
0.88
**0.
93**
0.25
0.92
4**
0.93
6**
-0.2
390.
616
1.00
-0.3
20.
72*
0.28
0.69
*0.
650.
480.
030.
160.
90**
0.90
**0.
140.
933*
*0.
883*
*-0
.221
0.53
5
1.00
-0.0
8-0
.03
-0.3
80.
07-0
.18
0.71
-0.1
6-0
.24
-0.2
6-0
.34
-0.3
490.
010.
022
0.30
9
1.00
0.52
0.85
**0.
68*
0.70
*-0
.73
0.57
0.65
0.81
**0.
600.
735*
0.81
1**
-0.2
740.
424
1.00
0.51
0.64
0.64
-0.3
70.
620.
010.
380.
620.
242
0.52
6-0
.017
0.3
1.00
0.65
0.91
**-0
.83
0.78
*0.
530.
660.
640.
607
0.67
5**
-0.0
810.
181
1.00
0.71
*0.
290.
390.
360.
73*
0.30
0.50
70.
866*
*0.
348
0.75
6*
1.00
-0.7
70.
89**
0.23
0.43
0.61
0.31
30.
579
0.12
90.
152
1.00
-0.9
3-0
.09
-0.0
9-1
.00*
*-0
.156
-0.0
230.
70.
759
1.00
-0.0
40.
120.
73*
0.03
80.
254
-0.0
14-0
.208
1.00
0.82
**-0
.01
0.94
8**
0.71
3*-0
.479
0.46
1.00
0.29
0.93
5**
0.89
5**
-0.1
230.
712*
1.00
0.19
60.
279
-0.1
68-0
.183
1.00
0.81
**-0
.397
0.54
1.00
-0.1
040.
722*
1.00
0.23
71.
00
cont
inue
2399(C
ontin
ued)
TA
BLE
3.
Corre
latio
n fo
r gro
undw
ater
(*G
W2)
pHEC
TDS
TSS
COD
BOD
5N
H3H
DO
Mg
CaN
aFe
ZnCu
CrCd
PbA
sCo
Mn
pH EC (µ
S/cm
)TD
S (m
g/L)
TSS
(mg/
L)CO
D (m
g/L)
BOD
5 (m
g/L)
NH
3H (m
g/L)
DO
(mg/
L)M
g (m
g/L)
Ca (m
g/L)
Na
(mg/
L)Fe
(mg/
L)Zn
(ppb
)Cu
(ppb
)Cr
(ppb
)Cd
(ppb
)Pb
(ppb
)A
s (pp
b)Co
(ppb
)M
n (p
pb)
1.00
0.52
0.60
0.7*
0.58
0.38
0.71
*-0
.75*
0.36
0.18
0.04
0.52
0.68
*
0.65
0.08
0.08
0.12
0.03
0.53
0.19
1.00
0.81
**
0.43
0.57
0.59
0.56
-0.5
80.
470.
37-0
.02
0.30
0.62
0.84
**0.
100.
16-0
.05
-0.2
50.
77*
0.56
1.00
0.58
0.69
*0.
520.
61-0
.82*
*0.
450.
29-0
.06
0.39
0.69
*
0.97
**0.
130.
18-0
.03
-0.2
10.
81*
0.58
1.00
0.82
**0.
350.
94**
-0.5
30.
460.
72*
0.51
0.92
**0.
82**
0.59
0.14
0.08
0.45
0.55
0.27
-0.2
2
1.00
0.72
*0.
90**
-0.6
20.
170.
76*
0.33
0.87
**0.
79*
0.61
0.51
0.48
0.65
0.42
0.27
0.09
1.00
0.60
*-0
.66
-0.1
60.
530.
140.
490.
67*
0.47
0.74
*0.
78*
0.62
0.13
0.22
0.40
1.00
-0.6
1*0.
379
0.81
**0.
530.
94**
0.93
**0.
640.
320.
270.
550.
530.
27-0
.13
1.00
-0.1
1-0
.17
0.11
-0.4
0-0
.74*
*-0
.80*
*-0
.40
-0.4
5-0
.17
0.08
-0.5
8-0
.50
1.00
0.21
0.47
0.24
0.45
0.57
-0.7
1*-0
.71*
-0.4
3-0
.19
0.68
*0.
08
1.00
0.71
*0.
89**
0.70
*0.
300.
400.
320.
70*
0.73
*-0
.11
-0.3
8
1.00
0.65
0.55
0.03
-0.1
3-0
.21
0.41
0.58
-0.1
4-0
.50
1.00
0.80
**0.
390.
370.
290.
72*
0.75
*-0
.02
-0.3
7
1.00
0.75
*0.
270.
250.
410.
330.
430.
07
1.00
0.01
0.06
-0.1
3-0
.21
0.85
**0.
51
1.00
0.99
**0.
78*
0.43
-0.3
60.
03
1.00
0.71
*0.
31-0
.27
0.16
1.00
0.76
*-0
.49
-0.3
3
1.00
-0.6
4-0
.81*
1.00
0.74
**1.
00
Corre
latio
n fo
r riv
er w
ater
(*LR
2)
pHEC
TDS
TSS
COD
BOD
5N
H3H
DO
Mg
CaN
aFe
ZnCu
CrCd
PbA
sCo
Mn
pH EC (μ
S/cm
)TD
S (m
g/L)
TSS
(mg/
L)CO
D (m
g/L)
BOD
5 (m
g/L)
NH
3H (m
g/L)
DO
(mg/
L)M
g (m
g/L)
Ca (m
g/L)
Na
(mg/
L)Fe
(mg/
L)Zn
(ppb
)Cu
(ppb
)Cr
(ppb
)Cd
(ppb
)Pb
(ppb
)A
s (pp
b)Co
(ppb
)M
n (p
pb)
1.00
0.65
8-0
.20
0.44
-0.2
30.
37-0
.71*
-0.8
4**
-0.8
8**
-0.6
1-0
.91*
*-0
.64
-0.6
0-0
.31
-0.6
2-0
.71*
0.39
0.11
-0.7
8*0.
32
1.00
0.48
0.16
0.08
-0.0
5-0
.43
-0.3
1-0
.41
-0.4
0-0
.57
-0.5
5-0
.06
0.33
-0.6
0-0
.47
0.03
0.10
-0.3
30.
46
1.00
-0.4
70.
46-0
.61
0.29
0.53
0.48
-0.1
20.
07-0
.11
0.36
0.95
**-0
.18
0.11
-0.6
10.
000.
530.
60
1.00
0.28
-0.1
2-0
.30
-0.5
3-0
.46
-0.3
0-0
.35
-0.1
3-0
.48
-0.6
70.
07-0
.31
0.57
0.12
-0.5
0-0
.09
1.00
-0.8
1**
0.63
0.37
0.53
-0.2
10.
180.
26-0
.13
0.31
0.49
0.29
-0.4
00.
300.
520.
54
1.00
-0.4
2-0
.41
-0.5
10.
28-0
.11
0.02
-0.1
4-0
.52
-0.1
5-0
.07
0.34
0.15
-0.4
4-0
.49
1.00
0.77
*0.
89**
0.36
0.73
*0.
75*
0.13
0.31
0.77
*0.
80**
-0.6
60.
890.
90**
0.13
1.00
0.95
**0.
650.
83**
0.71
*0.
480.
530.
496
0.85
**-0
.63
0.28
0.95
**-0
.14
1.00
0.51
0.84
**0.
72*
0.39
0.50
0.65
0.83
**-0
.68*
0.23
0.98
**0.
00
1.00
0.82
**0.
76*
0.45
-0.1
00.
480.
78*
-0.0
30.
360.
50-0
.76*
1.00
0.83
**0.
540.
120.
76*
0.86
**-0
.32
0.18
0.73
*-0
.49
1.00
0.00
-0.1
50.
79*
0.97
**-0
.40
0.63
0.75
*-0
.45
1.00
0.49
0.12
0.14
0.06
-0.4
80.
28-0
.24
1.00
-0.1
80.
09-0
.62
-0.1
70.
520.
57
1.00
0.72
*-0
.17
0.36
0.60
-0.2
1
1.00
-0.5
30.
610.
87*
-0.3
5
1.00
-0.2
9-0
.77*
-0.4
1
1.00
0.39
-0.0
41.
000.
061.
00
cont
inue
2400
(Con
tinue
d) T
AB
LE 3
.
Corre
latio
n fo
r riv
er w
ater
(*LR
3)
pHEC
TDS
TSS
COD
BOD
5N
H3H
DO
Mg
CaN
aFe
ZnCu
CrCd
PbA
sCo
Mn
pH EC (µ
S/cm
)TD
S (m
g/L)
TSS
(mg/
L)CO
D (m
g/L)
BOD
5 (m
g/L)
NH
3H (m
g/L)
DO
(mg/
L)M
g (m
g/L)
Ca (m
g/L)
Na
(mg/
L)Fe
(mg/
L)Zn
(ppb
)Cu
(ppb
)Cr
(ppb
)Cd
(ppb
)Pb
(ppb
)A
s (pp
b)Co
(ppb
)M
n (p
pb)
1.00
0.07
-0.2
40.
640.
510.
550.
18-0
.47
0.03
-0.0
9-0
.05
0.69
*-0
.16
0.35
0.32
-0.3
10.
29-0
.19
-0.3
2-0
.32
1.00
0.52
0.47
0.39
0.48
0.88
**-0
.69*
-0.7
3*-0
.66
-0.9
0**
0.35
-0.4
9-0
.30
-0.2
5-0
.80*
*0.
580.
70*
-0.6
30.
42
1.00
-0.1
57-0
.28
-0.4
20.
36-0
.08
-0.7
1*-0
.07
-0.5
7-0
.41
0.16 0.1
-0.6
2-0
.02
-0.2
60.
70*
0.03
0.42
1.00
0.90
**0.
83**
0.54
-0.5
70.
13-0
.38
-0.2
00.
78*
-0.5
2-0
.19
0.58
-0.6
8*0.
67*
-0.1
3-0
.34
-0.0
7
1.00
0.84
**0.
46-0
.34
0.18
-0.1
3-0
.09
0.72
*-0
.51
-0.2
40.
63-0
.53
0.79
*-0
.13
-0.2
9-0
.23
1.00
0.52
-0.6
7*0.
00-0
.52
-0.3
40.
81**
-0.5
6-0
.34
0.55
-0.8
1**
0.90
**-0
.02
-0.5
4-0
.07
1.00
-0.7
0*-0
.59
-0.6
1-0
.75*
0.59
-0.7
7*0.
00-0
.26
-0.7
4*0.
470.
67*
-0.4
50.
61
1.00
0.47
0.80
**0.
74*
-0.5
70.
400.
23-0
.04
0.90
**-0
.55
-0.3
40.
64-0
.28
1.00
0.38
0.90
**0.
070.
09-0
.07
0.71
*0.
38-0
.14
-0.9
2**
0.44
-0.4
4
1.00
0.65
-0.4
60.
500.
330.
100.
86**
-0.4
2-0
.30
0.63
-0.5
2
1.00
-0.1
50.
250.
230.
410.
73*
-0.4
5-0
.83*
*0.
57-0
.47
1.00
-0.8
0**
0.17
0.27
-0.6
10.
54-0
.07
-0.4
80.
10
1.00
-0.1
60.
070.
53-0
.38
-0.2
60.
31-0
.54
1.00
-0.4
80.
46-0
.59
0.12
0.29
0.22
1.00
-0.1
80.
49-0
.70*
0.10
-0.5
7
1.00
-0.7
7*-0
.33
0.67
-0.3
0
1.00
0.11
-0.5
9-0
.18
1.00
-0.1
80.
661.
000.
111.
00
*0.0
5 Si
gnifi
cant
cor
rela
tion
** 0
.01
Stro
ng si
gnifi
cant
cor
rela
tion
2401
stabilization ponds. Although the level of parameters in surface water are lower in the cluster 3 than that in cluster 2, the level of parameters is still higher than the standard limits as presented in Table 1.
CONCLUSION
In conclusion, it can be said that statistical methods including descriptive, correlation and cluster analyses have provided satisfactory and clear picture of the overall fate of physiochemical and heavy metals in the three ponds of the landfill and understand the effect on the groundwater and surface water. Correlation analysis showed different pattern of relationships between the parameters and related to factors affecting each pond or site. Cluster analysis illustrated reliable classification of the physiochemical and heavy metals in the landfill (cluster 1), groundwater (cluster 2) and surface water (cluster 3). Although the aeration and stabilization systems reported significant reduction in the level of leachate parameters at the collection pond, the level of parameters at aeration and stabilization ponds is still higher than the standard limits and can influence groundwater and surface water quality in the area.
ACKNOWLEDGEMENTS
We would like to express our special thanks to the School of Environmental and Natural Resource Sciences, FST, UKM for providing facilities to conduct this study. Marlia M. Hanafiah was funded by the Ministry of Education, Malaysia (FRGS/1/2018/WAB05/UKM/02/2).
REFERENCES
Abdul Aziz, N.I.H. & Hanafiah, M.M. 2020. Life cycle analysis of biogas production from anaerobic digestion of palm oil mill effluent. Renewable Energy 145: 847-857.
Abdul Aziz, N.I.H., Hanafiah, M.M. & Ali, M.Y.M. 2019. Sustainable biogas production from agrowaste and effluents -
A promising step for small-scale industry income. Renewable Energy 132: 363-369.
Abdulhasan, M.J., Hanafiah, M.M., Satchet, M.S., Abdulaali, H.S., Toriman, M.E. & Al-Raad, A.A. 2019. Combining GIS, fuzzy logic and AHP models for solid waste disposal site selection in Nasiriyah, Iraq. Applied Ecology and Environmental Research 17(3): 6701-6722.
Agamuthu, P. 2001. Heavy metal contamination of soil-derived interstitial water in the coastal regions of Selangor Malaysia. Malays. J. Sci. B 20: 127-134.
Agamuthu, P., Hamid, F.S. & Khidzir, K. 2009. Evolution of solid waste management in Malaysia: Impacts and implications of the solid waste bill, 2007. J. Mater. Cycles Waste Management 11(2): 96-103.
Agamuthu, P., Fauziah, S.H. & Emenike, C.U. 2011. Waste management in Asia: The associated toxicity. In Proceedings of 3rd International Conference on Ecotoxicology and Environmental Sciences. pp. 187-200.
Alkarkhi, A.F., Ismail, N., Ahmed, A. & Mat Easa, A. 2009. Analysis of heavy metals concentrations in sediments of selected estuaries of Malaysia - A statistical assessment. Environmental Monitoring and Assessment 153(1-4): 179-185.
Alkarkhi, A.F., Ahmad, A., Ismail, N. & Easa, A.M. 2008. Multivariate analysis of heavy metals concentrations in river estuary. Environmental Monitoring and Assessment 143: 179-186.
Alslaibi, T.M., Abunada, Z., Abu Amr, S.S. & Abustan, I. 2018. Risk assessment of nitrate transport through subsurface layers and groundwater using experimental and modeling approach. Environmental Technology 39(21): 2691-2702.
APHA. 2005. Standard Methods for the Examination of Water and Wastewater, Volume 21, edited by Eaton, A.D., Clesceri, L.S., Franson, M.A.H., Rice, E.W. & Greenberg, A.E. Washington D.C.: American Public Health Association.
Ashraf, M.A., Balkhair, K.S., Chowdhury, A.J.K. & Hanafiah, M.M. 2019. Treatment of Taman Beringin landfill leachate using the column technique. Desalination and Water Treatment 149: 370-387.
Bahaa-eldin, E.A.R., Yaacob, W.Z.W., Samsudin, A.R. & Rafek, A.G. 2003. Geoenvironmental sampling: How good is a good practice. Bull. Geol. Soc. Malays. 46: 443-446.
FIGURE 1. Cluster analysis for landfill leachate collection system, groundwater wells and surface water
2402
Bahaa-eldin, E.A.R., Yusoff, I., Samsudin, A.R., Yaacob, W.Z.W. & Rafek, A.G. 2010. Deterioration of groundwater quality in the vicinity of an active open-tipping site in West Malaysia. Hydrogeology Journal 18: 997-1006.
Banar, M., Özkan, A. & Kürkçüoğlu, M. 2006. Characterization of the leachate in an urban landfill by physicochemical analysis and solid phase microextraction-GC/MS. Environmental Monitoring and Assessment 121(1-3): 439-459.
Banch, T.J.H., Hanafiah, M.M., Alkarkhi, A.F.M. & Amr, S.A. 2019. Factorial design and optimization of landfill leachate treatment using tannin-based natural coagulant. Polymers 11(8): 1349.
Biswas, A.K., Kumar, S., Babu, S.S., Bhattacharyya, J.K. & Chakrabarti, T. 2010. Studies on environmental quality in and around municipal solid waste dumpsite. Resources, Conservation and Recycling 55(2): 129-134.
Bong, C.P.C., Ho, W.S., Hashim, H., Lim, J.S., Ho, C.S., Tan, W.S.P. & Lee, C.T. 2017. Review on the renewable energy and solid waste management policies towards biogas development in Malaysia. Renewable and Sustainable Energy Reviews 70: 988-998.
Cohen, Y. & Kirchmann, H. 2004. Increasing the pH of wastewater to high levels with different gases - CO
2 stripping.
Water, Air & Soil Pollution 159(1): 265-275. Desa, A., Kadir, N.B. & Yusooff, F. 2011. A study on the
knowledge, attitudes, awareness status and behaviour concerning solid waste management. Procedia-Social and Behavioral Sciences 18: 643-648.
Emenike, C.U., Agamuthu, P. & Fauziah, S.H. 2016. Blending Bacillus sp., Lysinibacillus sp. and Rhodococcus sp. for optimal reduction of heavy metals in leachate contaminated soil. Environmental Earth Sciences 75(1): 26.
Esmail, A.S. 2005. Assessment of groundwater pollution in the vicinity of Ampar Tenang landfill site. MSc Thesis. Bangi: Universiti Kebangsaan Malaysia (Unpublished).
Fatta, D., Papadopoulos, A. & Loizidou, M. 1999. A study on the landfill leachate and its impact on the groundwater quality of the greater area. Environmental Geochemistry and Health 21(2): 175-190.
Foo, K.Y. & Hameed, B.H. 2009. An overview of landfill leachate treatment via activated carbon adsorption process. Journal of Hazardous Materials 171(1-3): 54-60.
Huang, S.D., Valsaraj, K.T. & Wilson, D.J. 2006. Removal of refractory organics by aeration. V. Solvent sublation of naphthalene and phenanthrene. Journal Separation Science and Technology 18(10): 941-968.
Ismail, H. & Hanafiah, M.M. 2019a. An overview of LCA application in WEEE management: Current practices, progress and challenges. Journal of Cleaner Production 232: 79-93.
Jeeva, M. & Umar, H. 2012. Study of leachate migration at Sungai Sedu, Telok Datuk waste disposal site by geophysical and geochemical methods. Sains Malaysiana 41(7): 829-840
Kamaruddin, M.A., Yusoff, M.S., Aziz, H.A. & Basri, N.K. 2013. Removal of COD, ammoniacal nitrogen and colour from stabilized landfill leachate by anaerobic organism. Applied Water Sciences 3(2): 359-366.
Kebria, D.Y., Ghavami, M., Javadi, S. & Goharimanesh, M. 2018. Combining an experimental study and ANFIS modeling to predict landfill leachate transport in underlying soil-A case study in north of Iran. Environmental Monitoring and Assessment 190(1): 26.
Madera-Parra, C.A. & Ríos, D.A. 2017. Constructed wetlands for landfill leachate treatment. In Sustainable Heavy Metal Remediation, edited by Rene, E.R., Sahinkaya, E., Lewis, A. & Lens, P.N.L. Cham: Springer. pp 121-163.
Maiti, S.K., De, S., Hazra, T., Debsarkar, A. & Dutta, A. 2016. Characterization of leachate and its impact on surface and groundwater quality of a closed dumpsite-A case study at Dhapa, Kolkata, India. Procedia Environmental Sciences 35: 391-399.
Manaf, L.A., Samah, M.A. & Zukki, N.I. 2009. Municipal solid waste management in Malaysia: Practices and challenges. Waste Management 29(11): 2902-2906.
Mohamed, A.F., Yaacob, W.W., Taha, M.R. & Samsudin, A.R. 2009. Groundwater and soil vulnerability in the Langat basin Malaysia. European Journal of Scientific Research 27(4): 628-635.
Ngoc, U.N. & Schnitzer, H. 2009. Sustainable solutions for solid waste management in Southeast Asian countries. Waste Management 29(6): 1982-1995.
Rashid, R.I.M., Ibrahim, M.Z., Abdullah, M.A. & Ishak, A.R. 2018. Characterization and toxicity study of leachate from closed landfills in Selangor. Asia Pacific Environmental and Occupational Health Journal 4(2): 16-20.
Razarinah, W.A.R.W., Zalina, M.N. & Abdullah, N. 2015. Utilization of the white-rot fungus, Trametes menziesii for landfill leachate treatment. Sains Malaysiana 44: 309-316.
Rothe, N., Gundermann, K.O. & Jentsch, F. 1988. The pH-dependent solubility of heavy metals from sewage sludge of different compositions. Zentralblatt fur Bakteriologie, Mikrobiologie und Hygiene 187(2): 112-124.
Roy, D., Azaïs, A., Benkaraache, S., Drogui, P. & Tyagi, R.D. 2018. Composting leachate: Characterization, treatment, and future perspectives. Reviews in Environmental Science and BioTechnology 17(2): 323-349.
Salem, Z., Hamouri, K., Djemaa, R. & Allia, K. 2008. Evaluation of landfill leachate pollution and treatment. Desalination 220(1-3): 108-114.
Taha, M.R., Zuhairi, W., Yaacob, W., Samsudin, A.R. & Yaakob, J. 2011. Groundwater quality at two landfill sites in Selangor, Malaysia. Bulletin of the Geological Society of Malaysia 57: 13-18.
Tzoupanos, N.D. & Zouboulis, A.I. 2009. Characterization and application of novel coagulant reagent (polyaluminium silicate chloride) for the post-treatment of landfill leachates. In Water Treatment Technologies for the Removal of High-Toxicity Pollutants, edited by Václavíková, M., Vitale, K., Gallios, G.P. & Ivanicová, L. Dordrecht: Springer. pp: 247-252.
Weng, H.X., Zhang, F., Zhu, Y.M., Qin, Y.C., Ji, Z.Q. & Cheng, C. 2011. Treatment of leachate from domestic landfills with three-stage physicochemical and biochemical technology. Environmental Earth Sciences 64(6): 1675-1681.
Yusri, Y., Alqaraghuli, W.A. & Alkarkhi, A.F. 2016. Factor analysis and back trajectory of PM and its metal constituents. Environmental Forensics 17(4): 319-337.
Yusup, Y. & Alkarkhi, A.F. 2011. Cluster analysis of inorganic elements in particulate matter in the air environment of an equatorial urban coastal location. Chemistry and Ecology 27(3): 273-286.
Tawfiq J.H. Banch & Marlia M. Hanafiah*Center for Earth Sciences and Environment

2403
Faculty of Science and Technology Universiti Kebangsaan Malaysia43600 UKM Bangi, Selangor Darul EhsanMalaysia
Marlia M. Hanafiah*Centre for Tropical Climate Change SystemInstitute of Climate Change Universiti Kebangsaan Malaysia43600 UKM Bangi, Selangor Darul Ehsan Malaysia
Abbas F.M. AlKarkhi & Salem S. Abu AmrMalaysian Institute of Chemical & Bioengineering TechnologyUniversiti Kuala Lumpur (UniKL, MICET)78000 MelakaMalaysia
*Corresponding author; email: [email protected]
Received: 4 April 2019Accepted: 15 August 2019