Embed Size (px)
Citation preview

PROJECT MANAGEMENT
Task estimating: completion time versus
team size A careful estimate of a certain task indicated that it could be completed by 4 engineers in 6 months, so the completion
effort was 24 engineer-months.
Question: But (4 x 6) = 24 = (6 x 4) = (8 x 3), yes?
Question: So 6 engineers will complete it in 4 months and
Answer: Wrong, probably. At the best, a firm ‘maybe’. Question: Why?
Answer: Yes, splendid!
8 engineers in 3 months, right?
This article offers an answer to that last question.
by M. J. Lanigan
Introduction n observation in an earlier article’-to the effect that adding people to a late A project rarely accelerates its progress-
has been endorsed by a number of readers. One also commented that ‘project tasks seem to have a natural time-scale largely independent of team size beyond some minimum level’. All confessed to being less than certain why such experiences are common. This author struggled with that problem some years ago and found a reasonably satisfying (to him, at least) and useful solution. It is presented in this article.
The ’constant effort’ fallacy A central issue in project planning and
control is the relationship between the comple- tion time of project tasks and the amount of human effort assigned to them. Effort is measured in units such as people-hours or people-months. It is commonly assumed the effort needed to complete a task is a constant
determined only by the nature of the task, i.e. that PT = a constant, where P = task team size and T = task completion time.
This is the constant effort fallacy, which claims that task (completion) time varies inversely with task team size. It is a dangerous illusion which can compound a small time- slip problem into a project disaster. This observation is now illustrated in an extended example which yields some clues about task estimating. These are then developed into a useful task completion time versus team size theory.
The sample disaster A &wed initial estimate
A project task on the critical path of a product design project was estimated to need 6 months with 4 engineers assigned to it full-time. Task progress was reviewed at the end of the first and second months. Both reviews showed that progress was only about half of that
212 ENGINEERING MANAGEMENTJOURNAL OCTOBER 1994

PROJECT MANAGEMENT
planned at review time. The deviation detected at the end of the first month was ignored because ‘the team needs a bit of time to get familiar with the task and, anyway, there is another five months to catch up’.
At the end of the second month it was accepted, reluctantly but wisely, that the original estimate was flawed. The extent of the error was unknown but cautious pessimism, supported by the evidence, suggested that the rate of progress would remain at about half that originally planned. This view predicted a task completion time of 12 months for an effort spend of 48 engineer-months: a 6 month slip and a 24 engineer-months effort overspend. The task leader bravely reported this prospect to the overall project manager. He decided that the consequential delay of 6 months to the whole project could not be tolerated. An edict was issued: ‘this task must not slip: do whatever is necessary to complete it on time’.
Accelerating the rate ofprogress It is the obvious, incorrect, and (sadly)
entirely conventional response to t h i s type of problem which is explored here. This merely notes that there are 40 (48 - 8) more engineer- months of work still to do and 4 months in which to do it. Ten engineers are therefore required, so 6 more must be added to the existing team.
Armed with the authority of the project manager, the task leader then borrowed 6 engineers (from other tasks within the project) and launched into the new plan. But the progress review one month later revealed some deterioration in the rate of progress! In fact, this then remained about constant until the task was finally completed 12 months later at a total effort cost of 128 engineer-months. The new product was launched 8 months later than originally planned and it failed to capture a viable market share. The disaster was directly attributable to the constant effort fallacy.
This case history is an illustration of Brooks’s ‘Law’* which, when slightly modified to broaden its application, states that adding people to a luteproject makes it later. It must be treated with caution, but it is supported by a great deal of painful experience.
What went wrong? The first thing that went wrong was that the
original estimate was flawed. It probably understated the effort required to complete the task but, just possibly, the error was in the other
ENGINEERING MANAGEMENT JOURNAL
direction. The second mistake was to ignore the early warning of trouble at the first progress review. Time is a non-renewable resource: once lost it is gone for ever. Many problems do wither away from neglect, which is fortunate or no manager could manage. But this one did not. (The ability to recognise problems which can be safely ignored is a hallmark of a good manager.)
The edict from the project manager was an abdication of
I
responsibility. There is no evidence that he made any attempt to understand the problem. Nor, it seems, did he explore any other possible action was problem solutions (such as reconsidering other activities on demanded, the critical path or reducing the size of the problem task). When the simp’e corrective action was demanded, arithmetic the simple arithmetic employed
When corrective
required that 6 engineers be required that added to the current team. This was the kiss of death, because 6 engineers be -
added-t his three consequences flow from such an action:
was the kiss (i) The task organisation and
work partitioning arrange- of death ments must be changed to accommodate the new team members. Not only will implementing these changes take time and absorb effort, but they will also modify the roles of the original team. The original team will need time to learn their new roles.
(ii) The new team members will need time to learn their roles and how they fit into the overall task structure. The people best qualified to assist their learning are the members of the original team. Every hour that they spend educating their new colleagues is at least eight engineer-hours lost to the task.
(iii) The volume of necessary communication and interaction between members of the team will increase from a level appropriate to 4 engineers in the original structure to that appropriate to 10 engineers in the new structure. The multiplier is a non-linear function of the number of engineers. It might be as high as (about) 6 if the new task structure is unfavourable.
So, adding more people to increase the rate of progressalso increases the amount of work
OCTOBER 1994

PROJECT MANAGEMENT
Fig. 1 PERT model of a
$~~~~~~~~~~ to be done. Conceivably, the additional effort will not compensate for the additional work and the rate of progress will diminish rather than increase. Brooks’s Law strikes again!
The nature of tasks The principal message to emerge from this
cautionary tale describing how to ruin a perfectly good project is that:
the effort required to complete a task is a function both of the nature of the task and of the number of people assigned to it.
This observation is the basis of an approach to task estimating which recognises that people and time are not usually interchangeable. The method is described under the next major heading.
Task classification First, however, the nature of tasks is
examined. This is aided by the small PERT network of Fig. 1, which models a micro- processor-based product design project.
The tasks comprising the network are described in Fig. 2, where they are labelled in a (start event).(end event) notation to align with Fig. 1.
Project tasks can be classified into three types:
(i) Zndivisible tasks have completion times which are independent of the number of people assigned to them beyond a certain minimum, which might be zero.
(ii) Divisible tasks can be partitioned into a number of smaller sub-tasks which may
then be assigned to different people. Within limits, therefore, the task completion time will decrease as the number of people assigned to it increases.
(iii) Partially divisible tasks are separable into indivisible and divisible sub-tasks. They are estimated by combining estimates for the indivisible and divisible sub-tasks which they contain.
The delivery delays 08.15 and 10.16 are examples of indivisible tasks. The correspond- ing ordering tasks, 04.08 and 05.10, are also indivisible because these represent mechanistic actions by the purchasing department whose response time is determined (here) by a rigid data-processing schedule.
The various design tasks are divisible because they can all be partitioned on some rational basis. For example, 01.02 is concerned with translating a purely functional specification (the product requirements definition) into an outline product design employing three different technologies. This task, therefore, divides quite naturally into software, electronic, mechanical and co-ordinating sub-tasks. Similarly, 04.07 defines several electronic circuit modules which are then to be designed and accommodated on printed circuit boards in 07.12. This latter task is highly divisible on the basis of the several defined modules. The situation with 06.11 is much the same, but in terms of software modules.
Testing, be it electronic, mechanical, software or whatever, tends to be a serial process and this introduces an indivisible element into most of the remaining tasks which then fall into the partially divisible category.
Estimating indivisible tasks This is usually easy because completion time
is set by some reasonably well-defined, non- effort dependent, serial process. This might be a delivery delay, the limited throughput of a machine, restricted access to a some necessary facility, or other constraint of a like nature. In other cases, the task completion time is virmally independent of the number of people assigned to it beyond a certain (and usually fairly obvious) minimum. Any and every sort of testing seems to exhibit this characteristic: it is essentially a sequential process with little scope for parallel action. There is no magic formula for estimating indivisible tasks, but a combination of experience and step-by-step analysis generally yields acceptable results.
214 ENGINEERING MANAGEMENTJOURNAL OCTOBER 1994

PROJECT MANAGEMENT
Estimating divisible tasks Achieving good estimates for the divisible
tasks is the most important and the most difficult part of the whole job. It is important because only such tasks offer opportunities for interchanging time and people, which is one way of adjusting project completion time. It is difficult because it contains the twin problems of estimating the individual sub-tasks and of assessing the relationship between time and people. Again, there is no magic available for estimating the sub-tasks: a combination of experience, careful analysis and a degree of pessimism are essential elements of the recommended approach.
Time versus people: thef-factor method Describing the relationship between the
completion time of a divisible task and the number of people assigned to it is a demanding, and not entirely resolved, problem. The approach to it that is now described has served the author well over a number of years. However, as with some other aspects of project management, its assumptions can be challenged and its results are supported by experience rather than by unassailable theory or extensive empirical research.
The sparse estimate The first requirement is to make a ‘sparse’
estimate of the divisible task. A sparse estimate assigns the absolute minimum number of full- time people to the task by considering only the different skills required to complete it. It is not important, at this stage, if the estimated completion time under these circumstances is unacceptably large. The aim is to achieve an estimate which measures, as closely as possible, the intrinsic work content of the task. This should recognise the whole context of the task, including internally and externally imposed constraints and the competence of the personnel likely to be involved. It is a ‘minimum people’ estimate, which reduces the effort dispersed in role learning and person-to- person communication to its inescapable minimum.
Consider, for example, the Task 01.02 (Figs. 1 and 2) that was previously cited. This requires a minimum of three, or possibly four, different people because it embraces three different technological sub-tasks and a co-ordination task. Task 04.07 might require at least two different people, one for the electronic design and one for the printed circuit board design.
ENGINEERING MANAGEMENT JOURNAL
. .
. .
Label Activity description
01.02 Design product architecture 02.03 Dummy 02.04 Dummy 02.05 Dummy 03.06 Design software architecture 04.07 Design electronic architecture 04.08 Order bought-out electronic components 05.09 Design mechanical architecture 05.1 0 Order bought-out mechanical components 06.11 Design software modules 07.12 Design printed circuit boards 08.1 5 Wait for delivery and inspection of bought-out electronic Components 09.13 Design mechanical piece-parts 10.16 Wait for delivery and inspection of boughtat mechanical components 11.14 Code and test the software modules 12.15 Make and test the printed circuit boards 13.1 6 Make and test the mechanical piece-parts 14.18 Assemble and test sohare architecture 15.1 7 Assemble and test electronic architecture 16.1 7 Assemble and test mechanical architecture 17.1 8 Integrate electronic architecture and mechanical architecture 18.19 Assemble and prove the product prototype 19.20 Prepare manufacturing data
But a sparse estimate for Task 06.1 1 could well involve iust one Derson. unless there is some
Fig. 2 Description of network tasks in Fig. 1
special applicatiokrelated skill implicit in the specification of the software modules.
The steps involved in achieving a sparse estimate for a particular divisible task are:
(i) Partitioning it into several sub-tasks on some rational basis, such as different technologies and/or modules with different functions. Ideally, the sub-tasks should be the same size (in effort terms) and totally independent. The greater their independence the less time lost on person- to-person communication.
(ii) Obtaining credible, experience-based, time and people estimates for each sub-task treated as a stand-alone, fully understood, independent item. Ideally, for reasons already explained, a sub-task estimate should relate to the time required for one (qualified) person to complete the task. ‘Part-timers’ (people sharing their time with other tasks) should not be assigned to the task if this can be avoided. Their efficiency is limited by the need to re-climb learning curves each time they switch from one task to another.
(iii) Summing the individual sub-task estimates to yield an effort subtotal and a sparse people total, called E.
(iv) Adding allowances to the effort subtotal for effort ‘lost’ in necessary learning and inter-person communication. This yields an effort total and, hence, a sparse time total, called 7;. The magnitude of the allowances will depend on the people total, the complexity of the task and its sub-tasks, and on the degree of coupling between the sub-tasks.
OCTOBER 1994 215

PROJECT MANAGEMENT
Nothing in what follows does anything to improve the accuracy of the sparse estimate encapsulated in the P, and I; numbers. It should be prepared with some care by experienced escimators.
The theory Then, for any combination of people
numbers (P) and completion time (T):
PT = RiT; + F(P) (1)
where F(P) is some function of the number of people, P.
F(P) represents the incremental effort required to complete the task when P is not equal to P,. Two factors contribute to F(P):
the learning effort arising from the need for people to understand the task and sub-tasks the need for communication between the people.
Two factors contribute to
the incremental effort: the
learning effort in understanding the tasks and
sub-tasks, and the need for
communication between the
people
These factors are already accounted for, at the R level, in the sparse estimate. So F(P) is zero when P is equal to P,, negative when P is less than P, and positive when P is greater than E.
The magnitude of the effort increment due to learning depends on the nature of the task and sub-tasks (unfamiliarity, complexity, and so on) and on the number of people. Each person involved will spend some time in learning. So this increment is assumed to be proportional to the number of people, P.
The magnitude of the effort increment due to the need for communication between the people depends on the degree of coupling between the sub-tasks and on the number of people. If the sub-tasks are totally independent the communication increment will be zero. This ideal is rarely achieved because the separate targets at which the sub-tasks are Himed
are carved out of the same whole task objective. Suppose that the names of theppeople assigned to the task are used to label the P rows and P columns of a matrix of P z boxes. Each box in the matrix represents a person-to-person communication opportunity. If a com- munication from a row to a column is regarded as a different transaction to that from a column to a row then there are P(P - 1) such
216
-__
opportunities between different people. If people are allowed to communicate with themselves (a reasonable concession which allows them to think) then the number of communication opportunities rises to Pz. Each person involved will spend some time communicating. This increment is assumed, therefore, to be proportional to P2.
These arguments allow eqn. 1 to be rewritten as:
PT=P, I ;+(LP+ CP') (2)
where F(P) has been replaced by the expression in the parentheses, and L and C are constants. The constant L is a measure of the need for learning and C is an indicator of the degree of coupling between the sub-tasks. This equation is now recast in the form:
T = (P,Z)/P + (L + CP) (3 )
If L and C were both zero the equation expresses the simplistic (and wrong) view that task completion time varies inversely with the number of people assigned to the task. When L and C are not zero, the equation shows that the time derived from the simplistic view is increased by an amount (positive, zero or negative) which varies linearly with P.
Now, suppose that when P = 2Pr the value of Tis (1 +f) times larger than that suggested by the simplistic view (i.e. iT;/2), where f is numerical factor greater than zero. In this case, eqn. 3 shows that:
L + 2cp, =f7;/2 (4)
and, as previously argued:
L+CR=O ( 5 )
Solving the simultaneous eqns. 4 and 5 yields:
C = cf/2)( ?;/E) and L = - ( f /2 )T ,
Eqn. 3 then becomes:
T/I; = l/(P/l?) + ( f /2)(P/R - 1) (6)
where (T/Z) is the task completion time normalised with respect to Z, and @'/E) is the number of people assigned to it normalised with respect to P,.
It will be appreciated that this development
ENGINEERING MANAGEMENT JOURNAL OCTOBER 1994
~- ___-

PROJECT MANAGEMENT
normalis6d people, PIP,
of the form of the F(P) function makes some breathtaking simplifications. Other formula- tions of F(P) are possible. The one employed here has the merit of stark simplicity and it appears to be a reasonable approximation to reality.
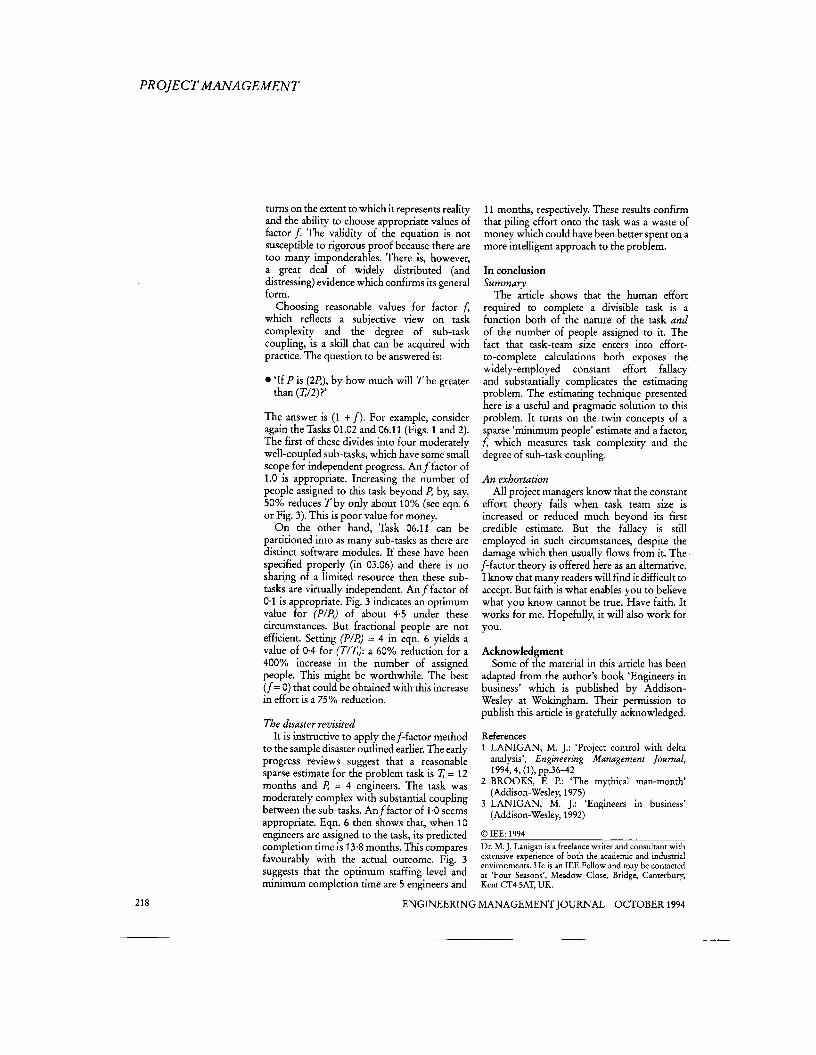
The relationship between (T/7;) and (P/R) expressed in eqn. 6 is shown, for various values of the factor f, in Fig. 3. (The curve for f = 0, which describes the discredited ‘constant effort’ theory, is included for comparison purposes.)
Whatever the imperfections of the theory behind eqn. 6, the form of the curves for f greater than zero does align with practical experience. In particular, they show that there is a point beyond which increasing the number of people assigned to a task increases rather than decreases its completion time. It is also clear that increasing the number of people assigned to a task in order to reduce its completion time is a worsening strategy as theffactor increases, i.e. as tasks become less divisible.
Eqn. 6 can be manipulated to yield expressions for the ‘optimum’ value of (P/Ps) which gives a minimum value (T/T) for any value off(other than zero). An expression for task completion effort, and hence people-cost to complete, is also easily derived. These exercises are included in Reference 3.
Using the theory But the author has found that a large-scale
version of Fig. 3 (created with a spreadsheet) is the most useful practical means of using the f-factor theory. Given this, the completion time
versus team size aspect of task estimating is reduced to:
1 Building a sparse estimate as described earlier under The sparse estimate sub-heading. The estimate provides the ‘sparse people’ (R) and ‘sparse time’ (7;) numbers.
which measures task complexity and the degree of sub-task coupling. This choice is, perhaps, the most challenging aspect of using the theory because it can only be a subjective, experience-based, judgment. An orderly approach to this challenge is examined in the next major section.
Fig. 3 Task completion time versus task team size
2 Choosing a reasonable value for factor
The f number then determines which of the Fig. 3 curves models the completion time versus team size characteristics of the task, while the P, and T, numbers set the curve scaling.
The approach outlined above is recommended both for initial task estimating and when any re-estimating becomes necessary. Fig. 3 (and the theory behind it) is also a powerful argument exposing the constant effort fallacy. The author has used it profitably on many occasions to persuade recalcitrant task leaders and project managers to think more deeply about their problems. Perhaps the sample disaster (discussed earlier) which stimulated its development was worthwhile after all.
But does it work? The value of eqn. 6 as a management tool
ENGINEERING MANAGEMENT JOURNAL OCTOBER 1994 217
. ..
PROJECT MANAGEMENT
218
turns on the extent to which it represents reality and the ability to choose appropriate values of factor f. The validity of the equation is not susceptible to rigorous proof because there are too many imponderables. There is, however, a great deal of widely distributed (and distressing) evidence which confirms its general form.
Choosing reasonable values for factor f, which reflects a subjective view on task complexity and the degree of sub-task coupling, is a skill that can be acquired with practice. The question to be answered is:
‘If P is (ZP,), by how much will T be greater than (TJ2) ?’
The answer is (1 + f). For example, consider again the Tasks 01.02 and 06.11 (Figs. 1 and 2). The first of these divides into four moderately well-coupled sub-tasks, which have some small scope for independent progress. An f factor of 1.0 is appropriate. Increasing the number of people assigned to this task beyond P, by, say, 50% reduces T by only about 10% (see eqn. 6 or Fig. 3). This is poor value for money.
On the other hand, Task 06.11 can be partitioned into as many sub-tasks as there are distinct software modules. If these have been specified properly (in 03.06) and there is no sharing of a limited resource then these sub- tasks are virmally independent. Anffactor of 0.1 is appropriate. Fig. 3 indicates an optimum value for (P/P,) of about 4.5 under these circumstances. But fractional people are not efficient. Setting (P/I:) = 4 in eqn. 6 yields a value of 0.4 for (T/K): a 60% reduction for a 400% increase in the number of assigned people. This might be worthwhile. The best (f= 0) that could be obtained with this increase in effort is a 75% reduction.
The disaster revisited It is instructive to apply thef-factor method
to the sample disaster outlined earlier. The early progress reviews suggest that a reasonable sparse estimate for the problem task is z = 12 months and I: = 4 engineers. The task was moderately complex with substantial coupling between the sub-tasks. Anffactor of 1.0 seems appropriate. Eqn. 6 then shows that, when 10 engineers are assigned to the task, its predicted completion time is 13.8 months. This compares favourably with the actual outcome. Fig. 3 suggests that the optimum staffing level and minimum completion time are 5 engineers and
11 months, respectively. These results confirm that piling effort onto the task was a waste of money which could have been better spent on a more intelligent approach to the problem.
In conclusion Summary
The article shows that the human effort required to complete a divisible task is a function both of the nature of the task and of the number of people assigned to it. The fact that task-team size enters into effort- to-complete calculations both exposes the widely-employed constant effort fallacy and substantially complicates the estimating problem. The estimating technique presented here is a useful and pragmatic solution to this problem. It turns on the twin concepts of a sparse ‘minimum people’ estimate and a factor,
which measures task complexity and the degree of sub-task coupling.
An exhortation All project managers know that the constant
effort theory fails when task team size is increased or reduced much beyond its first credible estimate. But the fallacy is still employed in such circumstances, despite the damage which then usually flows from it. The f-factor theory is offered here as an alternative. I know that many readers will find it difficult to accept. But faith is what enables you to believe what you know cannot be true. Have faith. It works for me. Hopefully, it will also work for you.
Acknowledgment Some of the material in this article has been
adapted from the author’s book ‘Engineers in business’ which is published by Addison- Wesley at Wokingham. Their permission to publish this article is gratefully acknowledged.
References 1 LANIGAN, M. J.: ‘Project control with delta
analysis’, Engineering Management Journal, 1994,4, (I), p p . 3 6 4 2
2 BROOKS, E P.: ‘The mythical man-month‘ (Addison-Wesley, 1975)
3 LANIGAN, M. J.: ‘Engineers in business’ (Addison-Wesley, 1992)
0 IFF. 1994
Dr. M. J. Lanigan is a freelance writer and consultant with extensive experience of both the academic and industrial environments. He is an IEE Fellow and may be contacted at ‘Four Seasons’, Meadow Close, Bridg;, Canterbury Kent CT4 5AT, UK.
ENGINEERING MANAGEMENT JOURNAL OCTOBER 1994
__- ~~