Embed Size (px)
Citation preview
UltaBeauty’sUnconven0onalGrowthStory:OmnichannelExpansionisaBeau0fulThing
JeffHammSrDirector,E-Commerce
UltaBeauty
Presented:September27,2016atRetail’sDigitalSummit
PatOgawaManagingDirector
DeloiQe

CONFIDENTIAL&PROPRIETARY2015 2

CONFIDENTIAL&PROPRIETARY2015 3
PlayUltaIntroVideo
CONFIDENTIAL&PROPRIETARY2015 4
• Founded in 1990
• The largest beauty retailer in the U.S.
• The premier beauty des<na<on that provides All Things Beauty, All in One Place
CONFIDENTIAL&PROPRIETARY2015 5
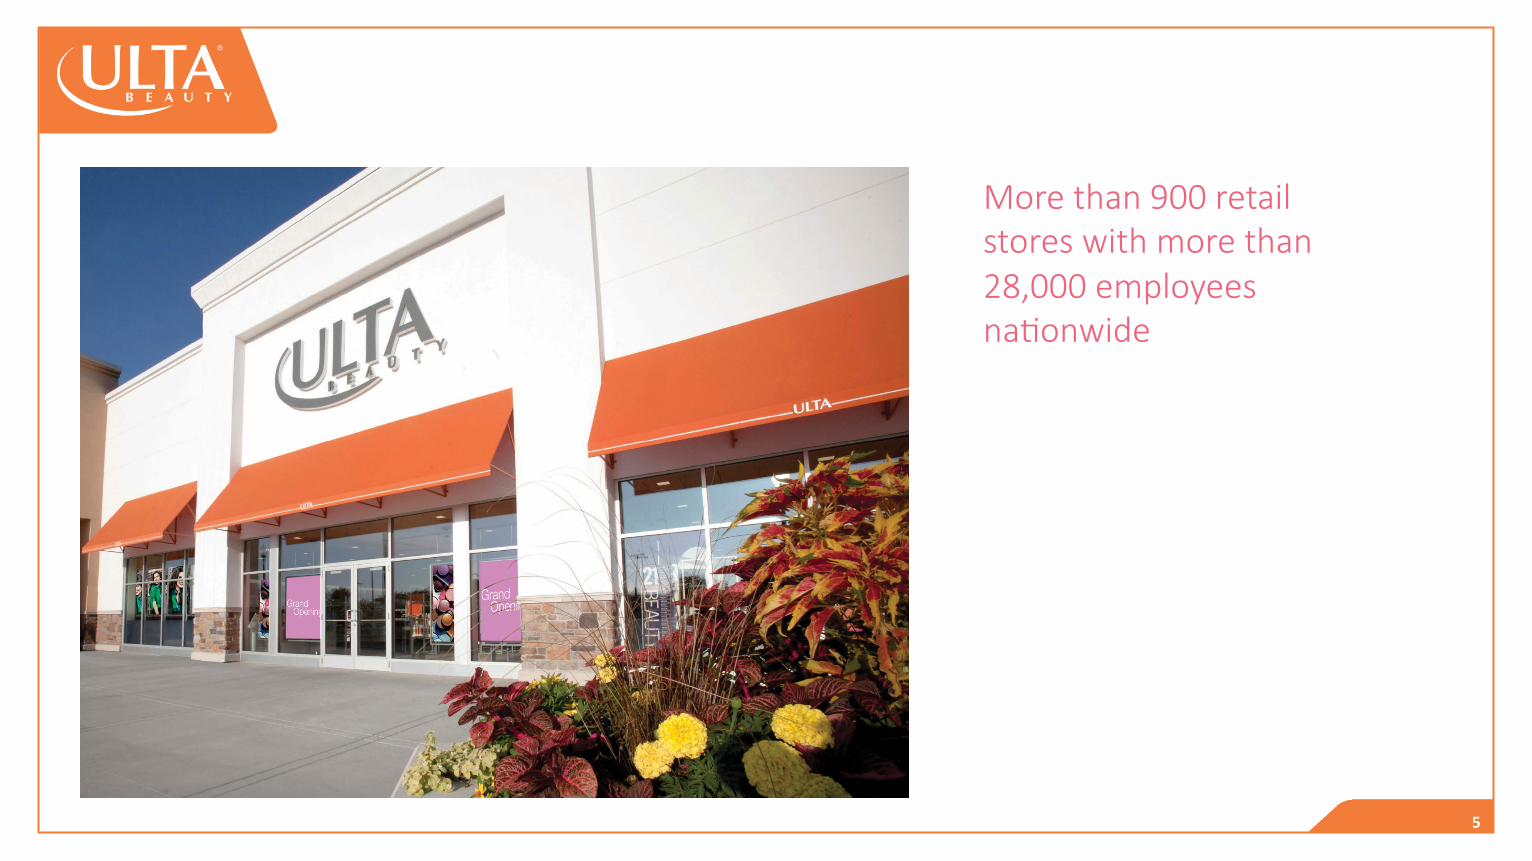
More than 900 retail stores with more than 28,000 employees na<onwide
CONFIDENTIAL&PROPRIETARY2015 6
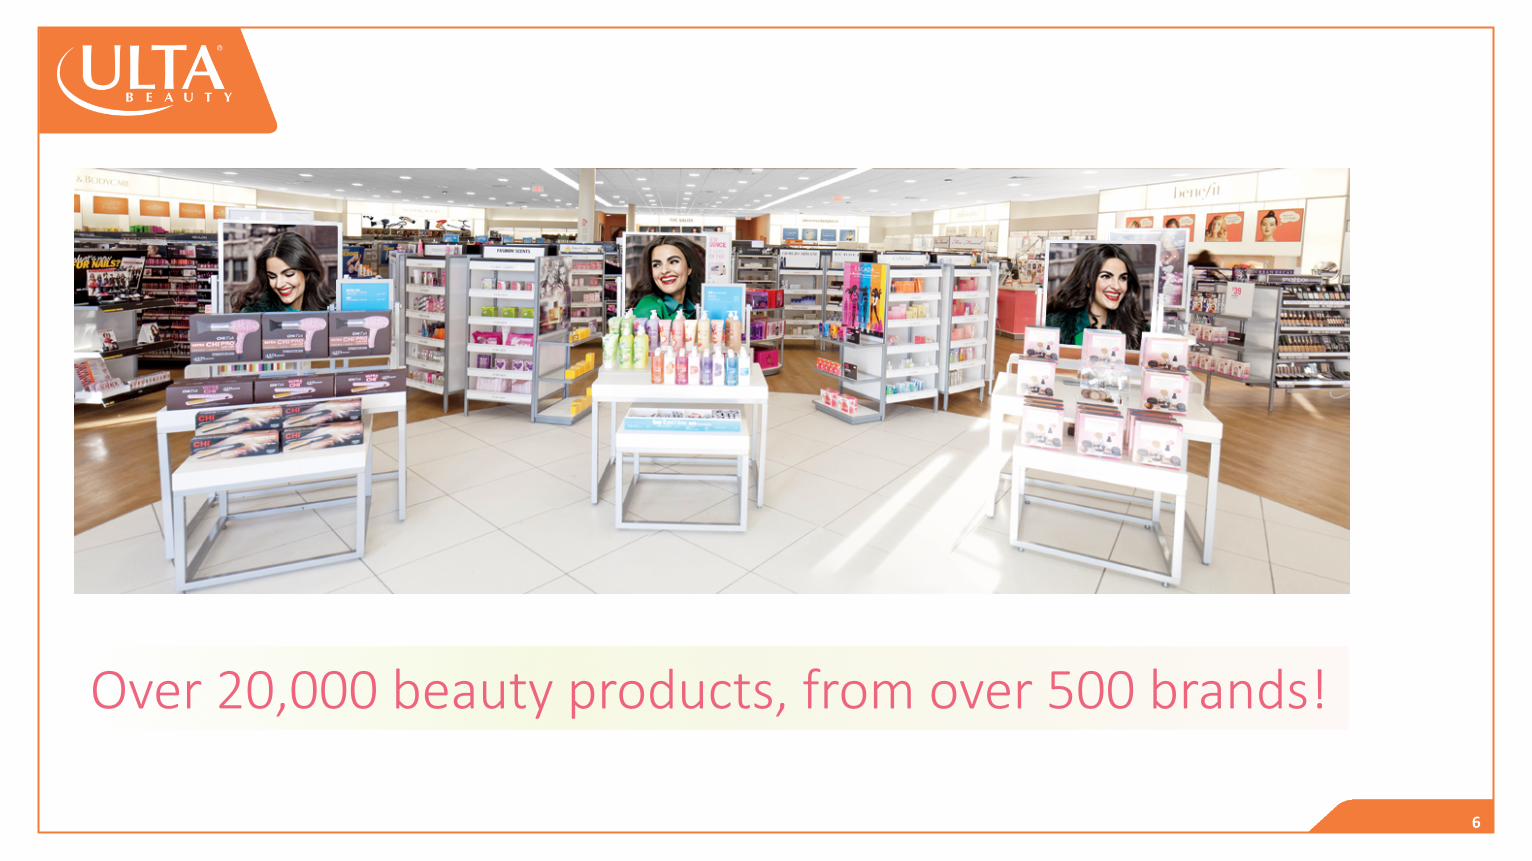
Over 20,000 beauty products, from over 500 brands!
CONFIDENTIAL&PROPRIETARY2015 7
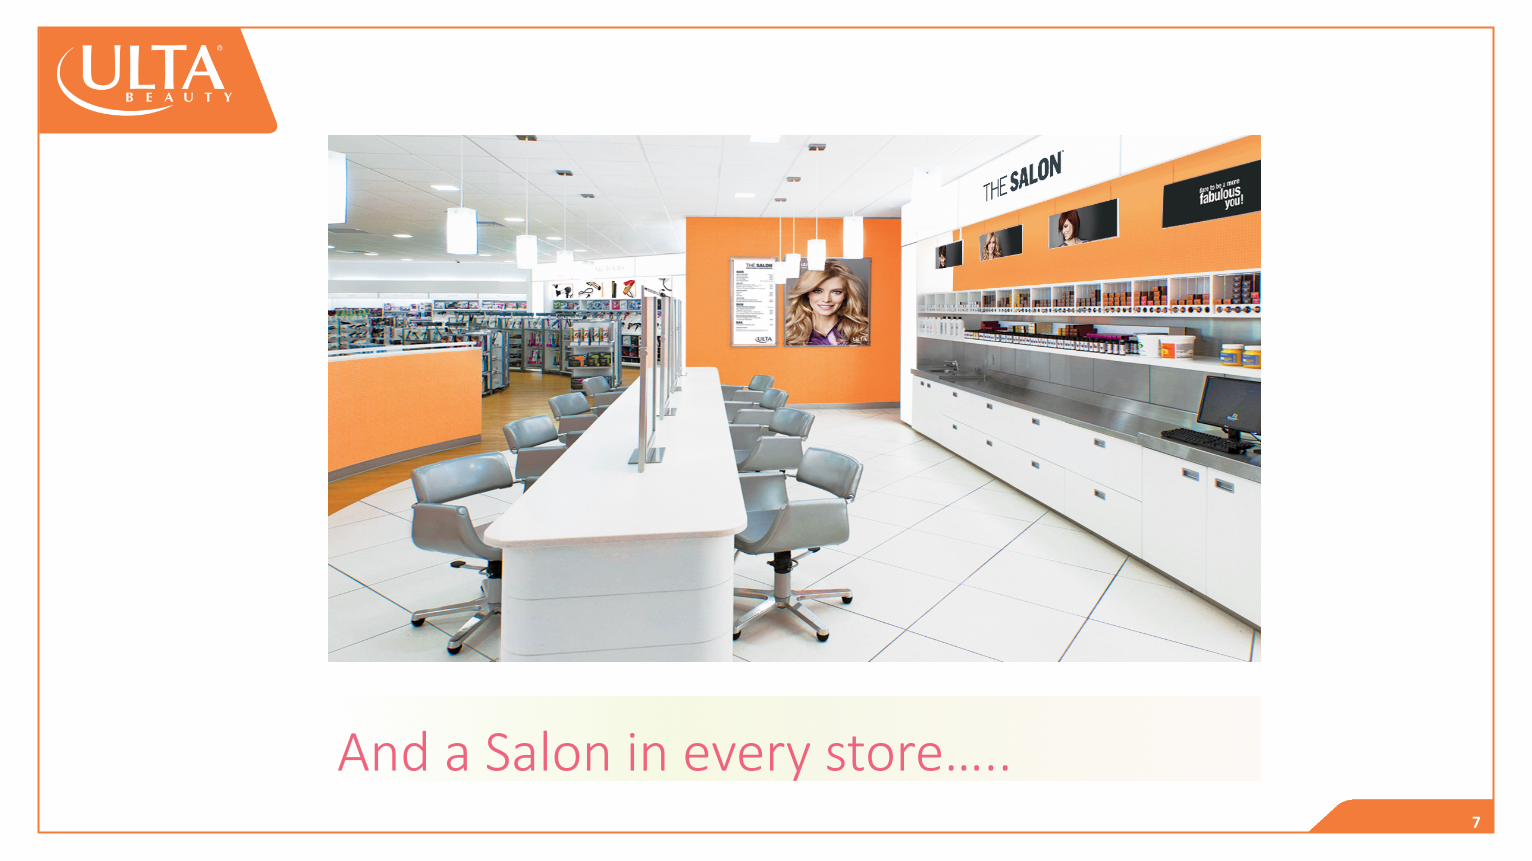
And a Salon in every store…..

CONFIDENTIAL&PROPRIETARY2015 8
More than 20 million ac<ve members!!
9
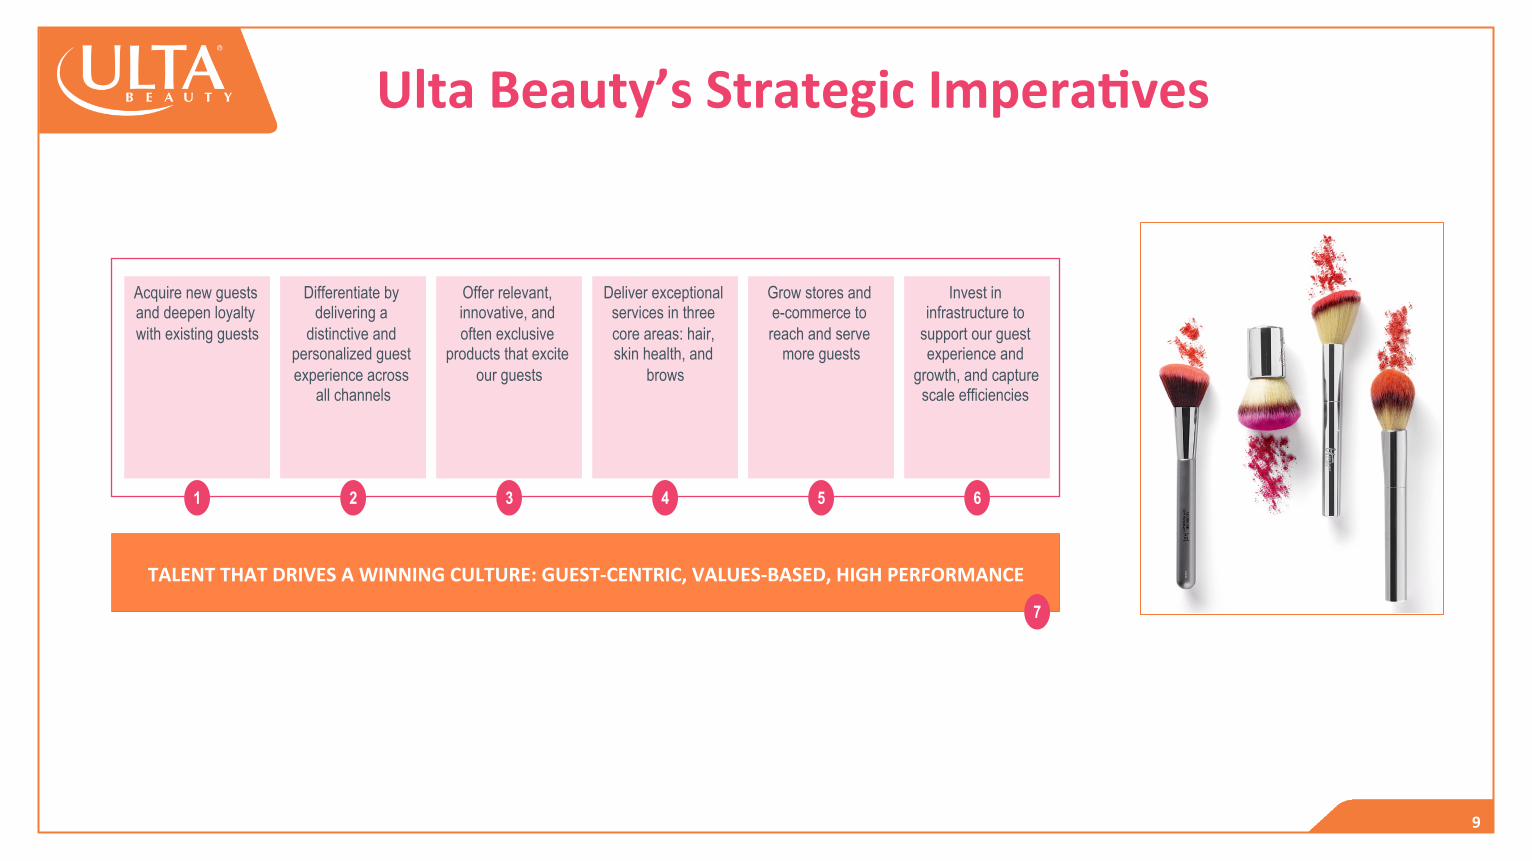
UltaBeauty’sStrategicImperaOves
Acquire new guests and deepen loyalty with existing guests
Differentiate by delivering a
distinctive and personalized guest experience across
all channels
Offer relevant, innovative, and often exclusive
products that excite our guests
Deliver exceptional services in three core areas: hair, skin health, and
brows
Grow stores and e-commerce to reach and serve
more guests
Invest in infrastructure to
support our guest experience and
growth, and capture scale efficiencies
1 2 3 4 5 6
TALENTTHATDRIVESAWINNINGCULTURE:GUEST-CENTRIC,VALUES-BASED,HIGHPERFORMANCE
7
10
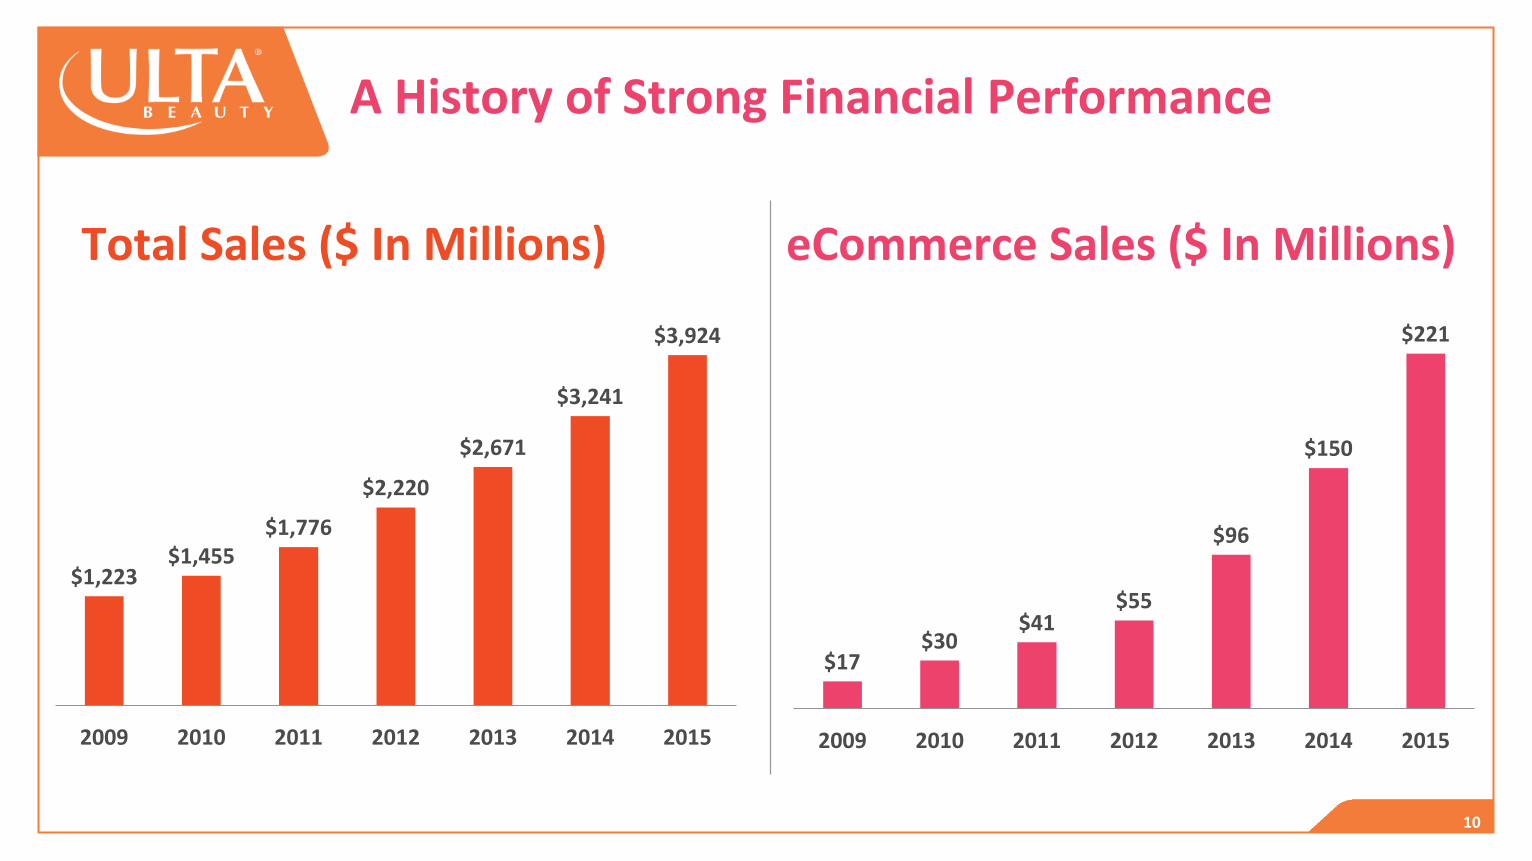
AHistoryofStrongFinancialPerformance
$1,223$1,455
$1,776
$2,220
$2,671
$3,241
$3,924
2009 2010 2011 2012 2013 2014 2015
TotalSales($InMillions)
$17$30
$41$55
$96
$150
$221
2009 2010 2011 2012 2013 2014 2015
eCommerceSales($InMillions)

CONFIDENTIAL&PROPRIETARY2015 11
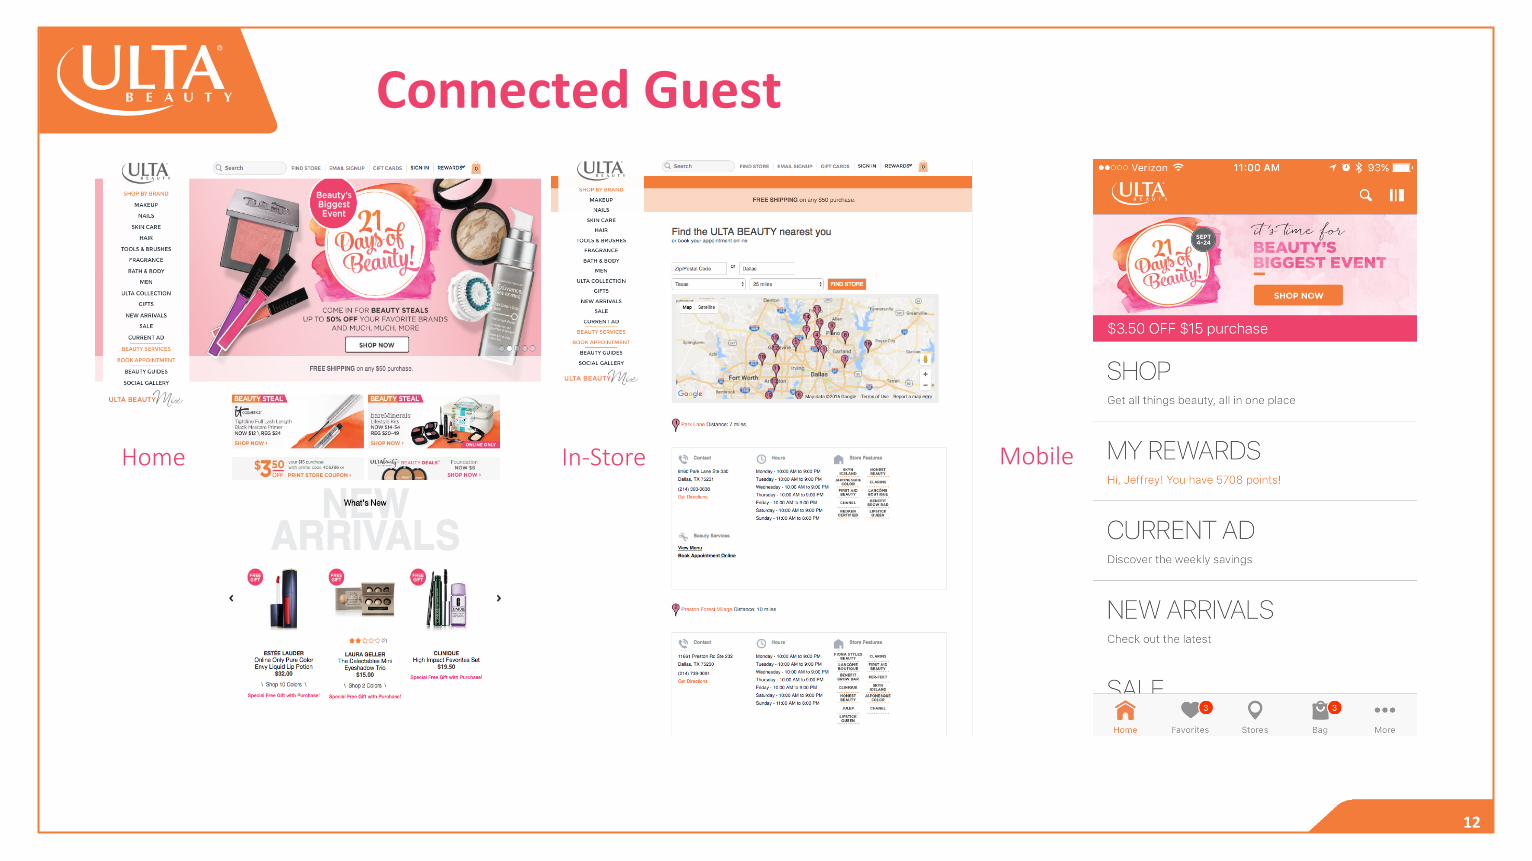
Omni-ChannelatUltaBeauty–PuSngtheGuestattheCenter
12
ConnectedGuest
Home In-Store Mobile
13
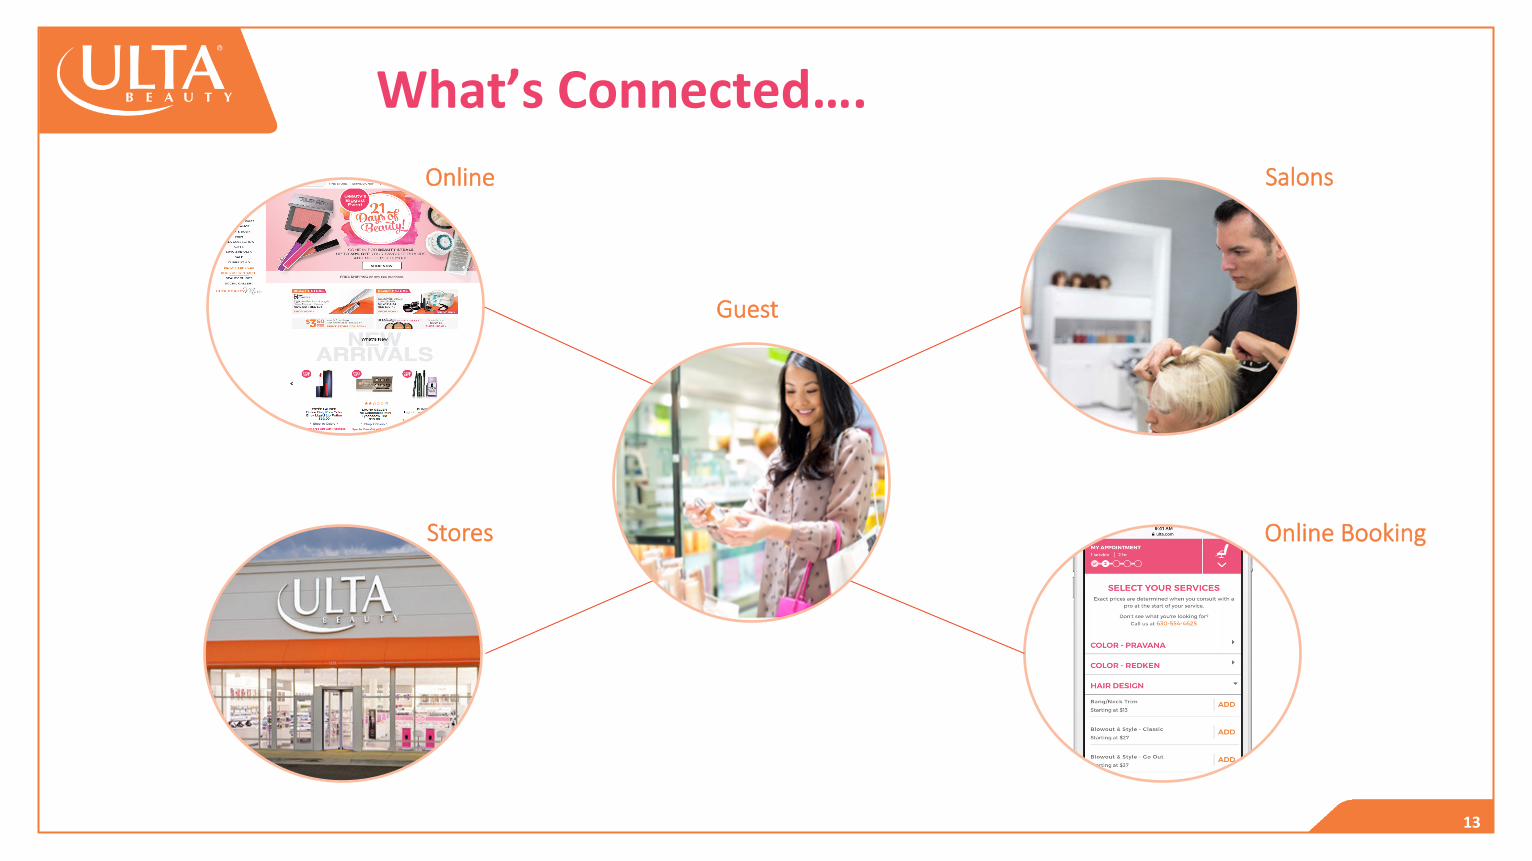
What’sConnected….Online Salons
Stores Online Booking
Guest
14
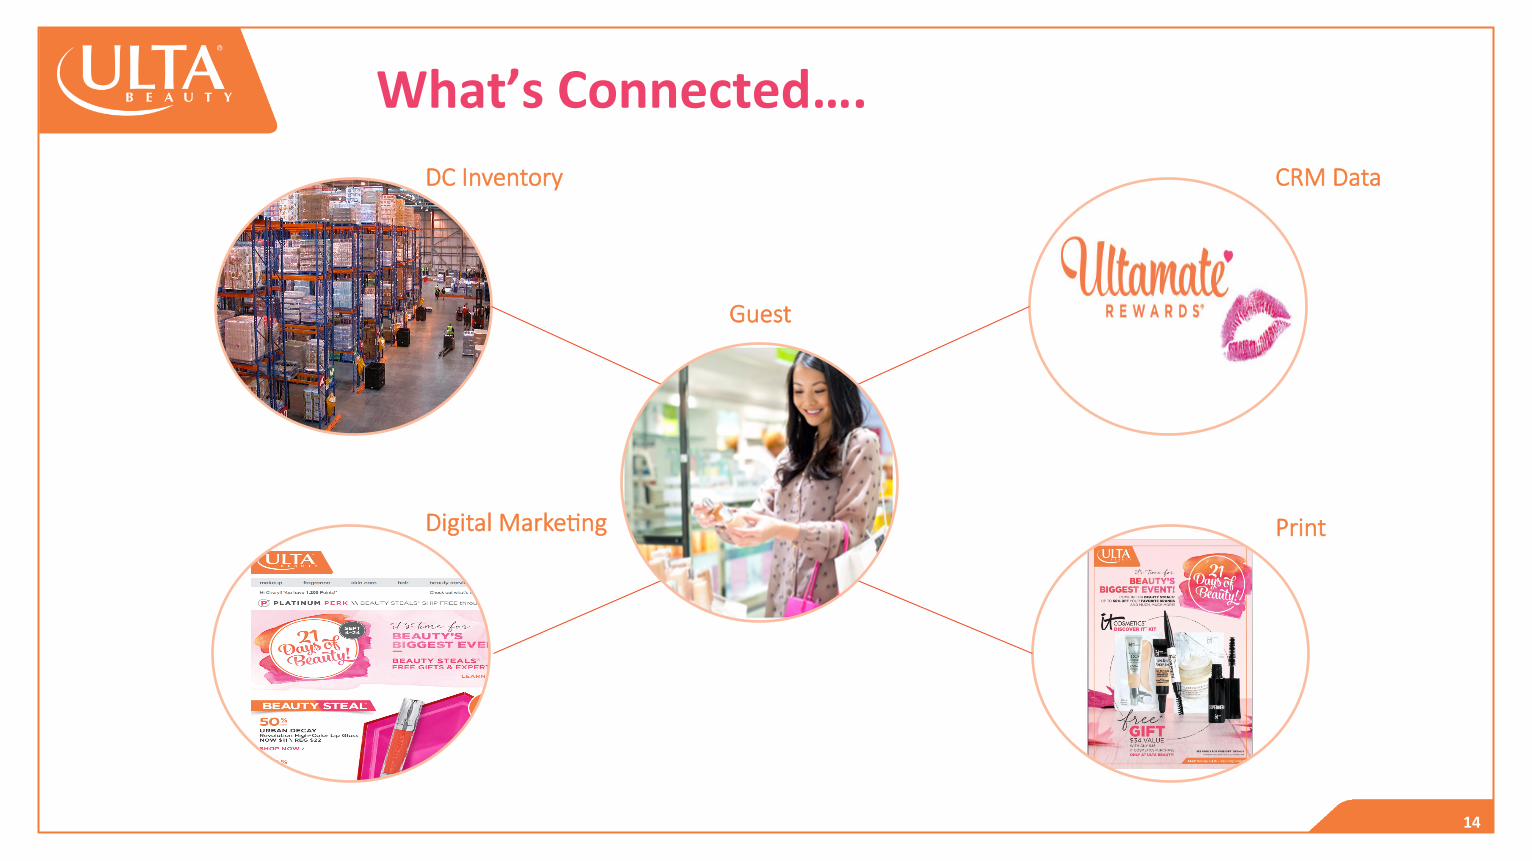
What’sConnected….DC Inventory
Digital Marke<ng
CRM Data
Guest

15
….Bringingittogether,MobileFirst!
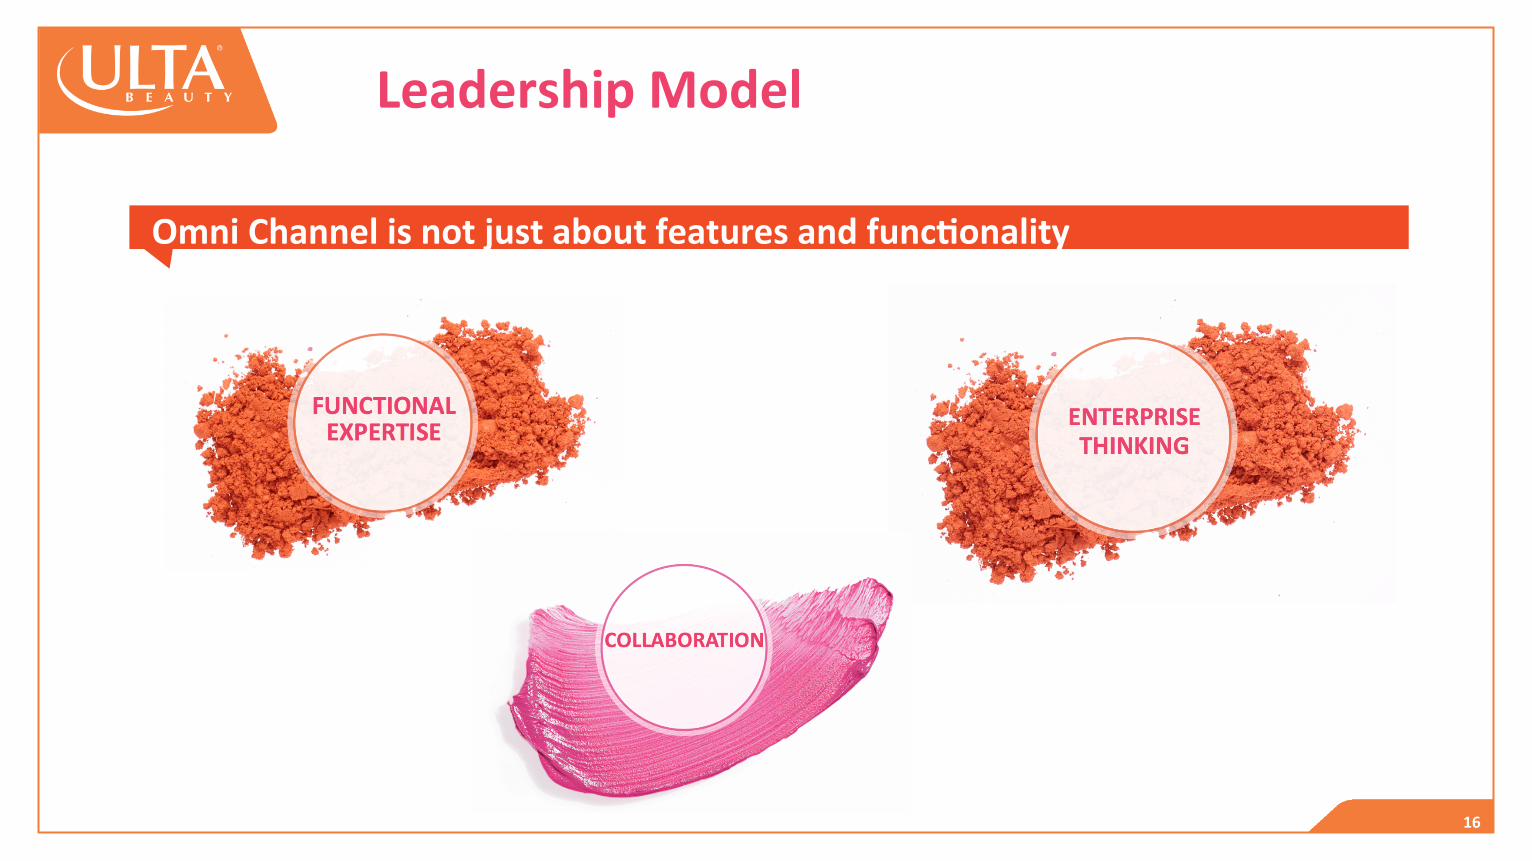
16
LeadershipModel
SUBHEADOmniChannelisnotjustaboutfeaturesandfuncOonality
17
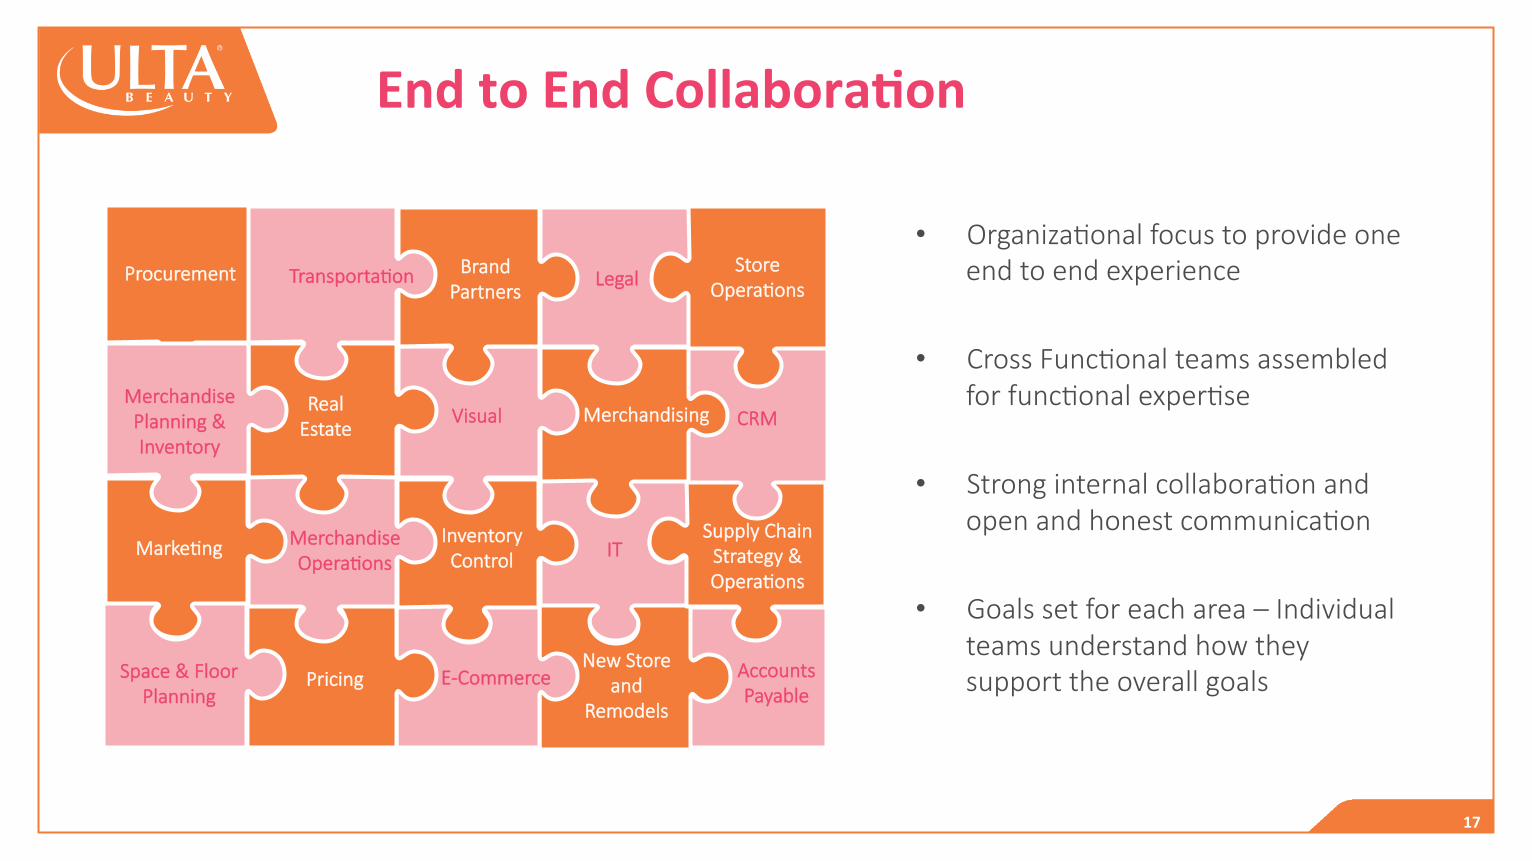
Procurement
EndtoEndCollaboraOon
• Organiza<onal focus to provide one end to end experience
• Cross Func<onal teams assembled for func<onal exper<se
• Strong internal collabora<on and open and honest communica<on
• Goals set for each area – Individual teams understand how they support the overall goals
IT
Accounts Payable
New Store and
Remodels
E-Commerce Pricing Space & Floor Planning
Inventory Control
Merchandise Opera<ons
Marke<ng Supply Chain
Strategy & Opera<ons
CRM Merchandising
Legal
Visual Real Estate
Merchandise Planning & Inventory
Brand Partners
Transporta<on Store Opera<ons

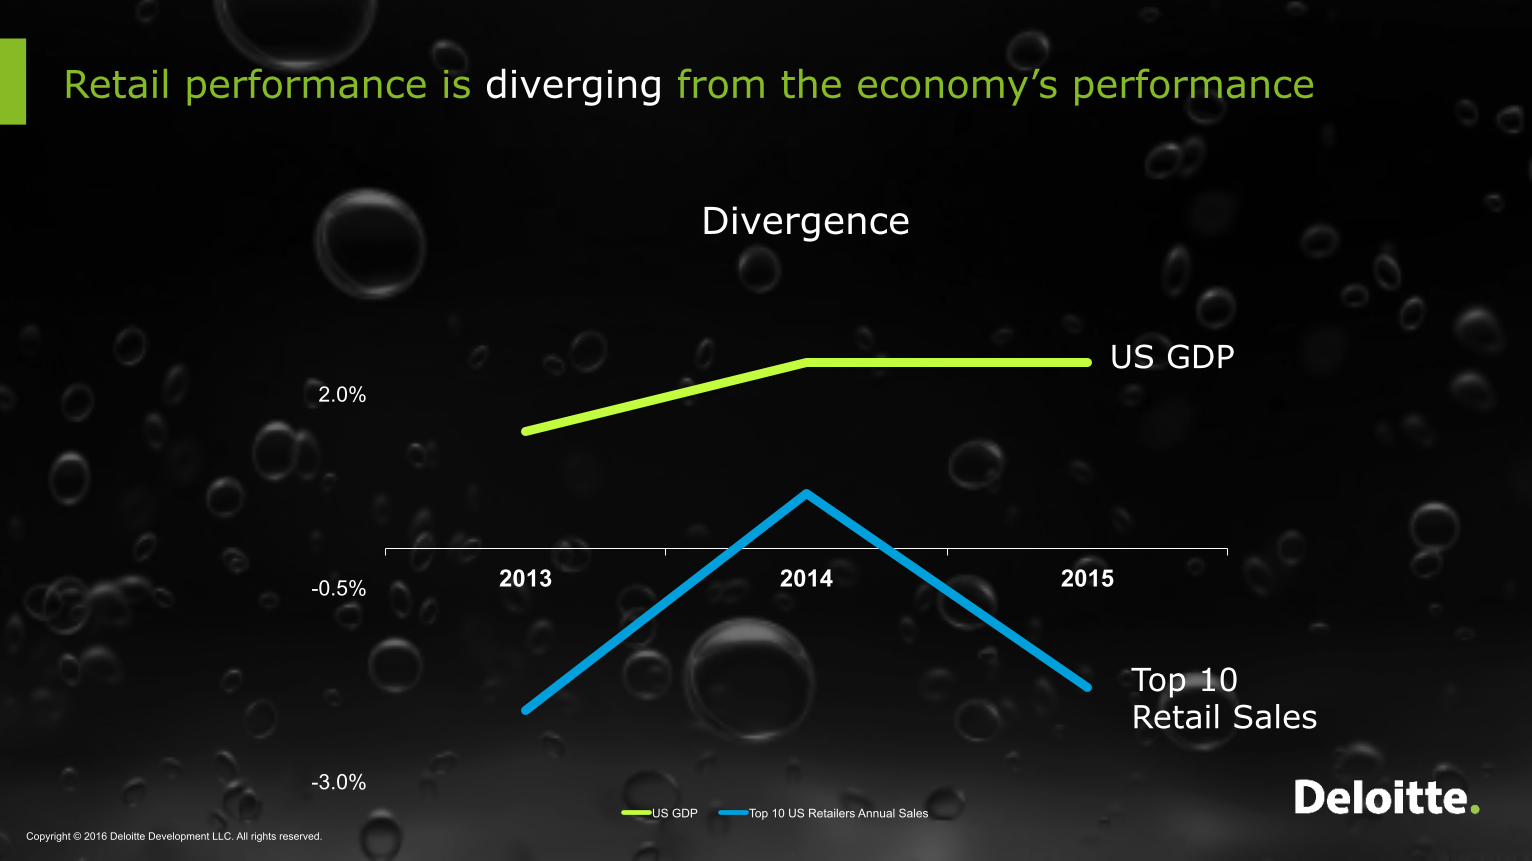
-3.0%
-0.5%
2.0%
2013 2014 2015
US GDP Top 10 US Retailers Annual Sales
Divergence
US GDP
Top 10 Retail Sales
Retail performance is diverging from the economy’s performance
Copyright © 2016 Deloitte Development LLC. All rights reserved.

And traffic to physical stores continues to plummet
Physical Store Traffic
-15%
-10%
-5%
0%
Apr '14 Jul '14 Oct '14 Jan '15 Apr '15*
Traffic Trend (Traffic)
Source: RetailNext, Retail Performance Pulse, Year-Over-Year reports (2015). Note: March/April spike due to movement of Spring Break and Easter holidays Copyright © 2016 Deloitte Development LLC. All rights reserved.
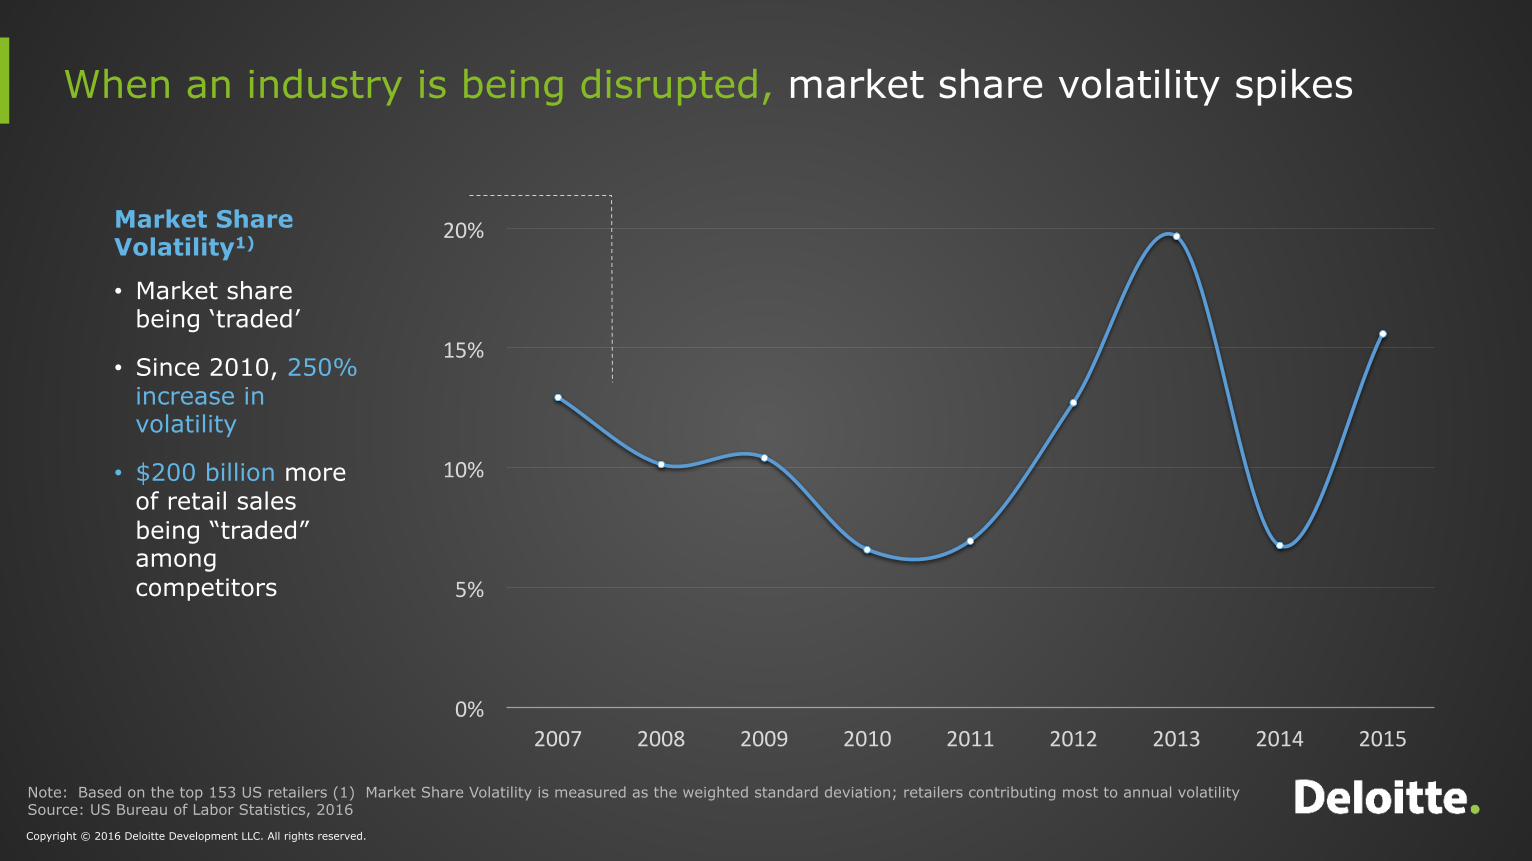
0%
5%
10%
15%
20%
2007 2008 2009 2010 2011 2012 2013 2014 2015
Note: Based on the top 153 US retailers (1) Market Share Volatility is measured as the weighted standard deviation; retailers contributing most to annual volatility Source: US Bureau of Labor Statistics, 2016
Market Share Volatility1)
• Market share being ‘traded’
• Since 2010, 250% increase in volatility
• $200 billion more of retail sales being “traded” among competitors
When an industry is being disrupted, market share volatility spikes
Copyright © 2016 Deloitte Development LLC. All rights reserved.
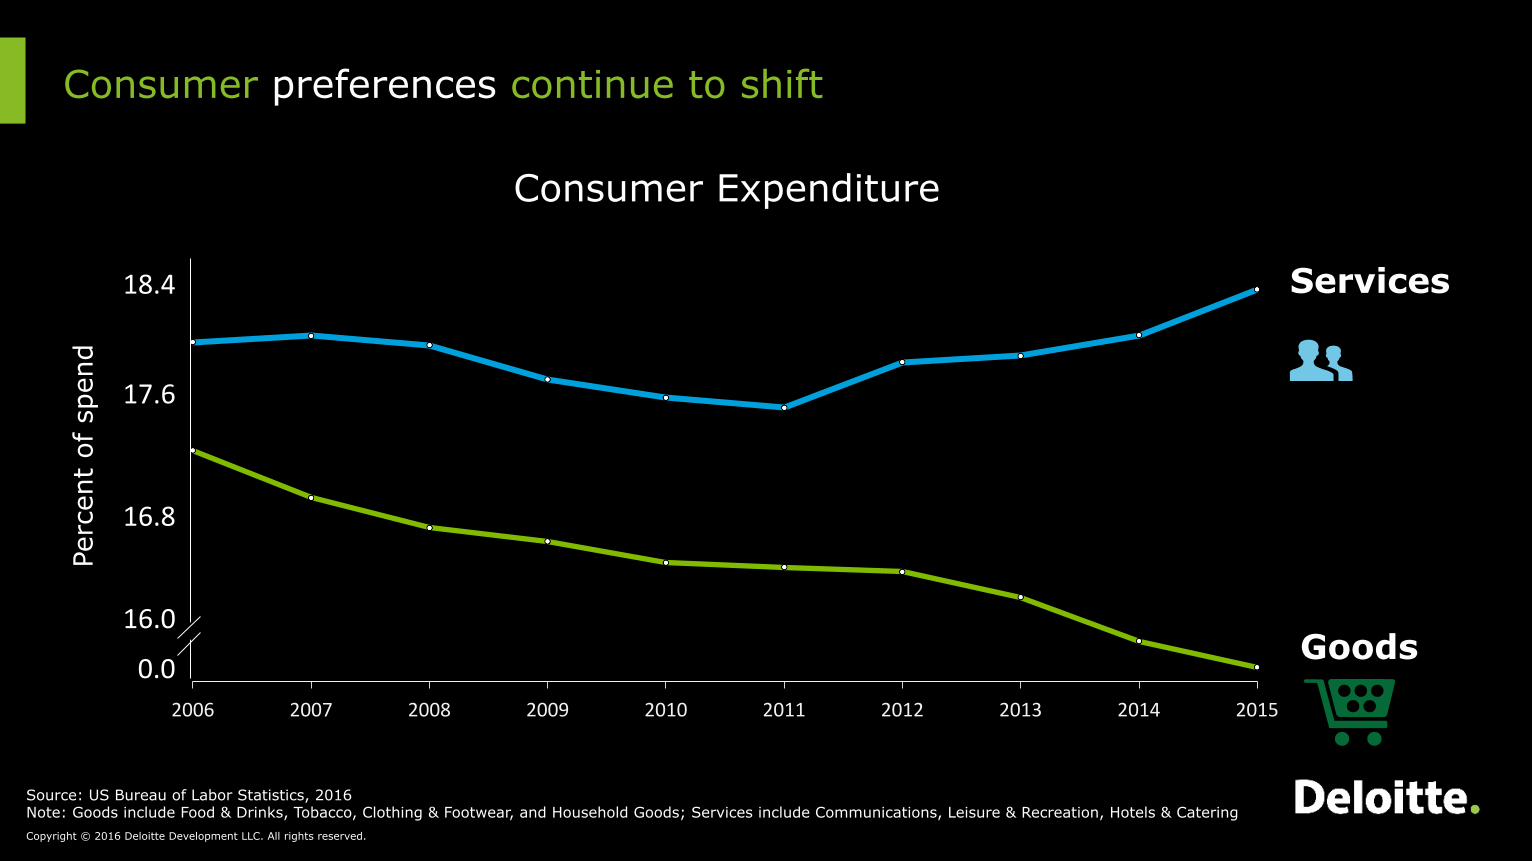
Consumer preferences continue to shift
2006 2007 2008 2009 2010 2011 2012 2013 2014 2015
0.0
17.6
16.0
16.8
18.4
Consumer Expenditure
Services
Goods
Source: US Bureau of Labor Statistics, 2016 Note: Goods include Food & Drinks, Tobacco, Clothing & Footwear, and Household Goods; Services include Communications, Leisure & Recreation, Hotels & Catering
Perc
ent
of s
pend
Copyright © 2016 Deloitte Development LLC. All rights reserved.
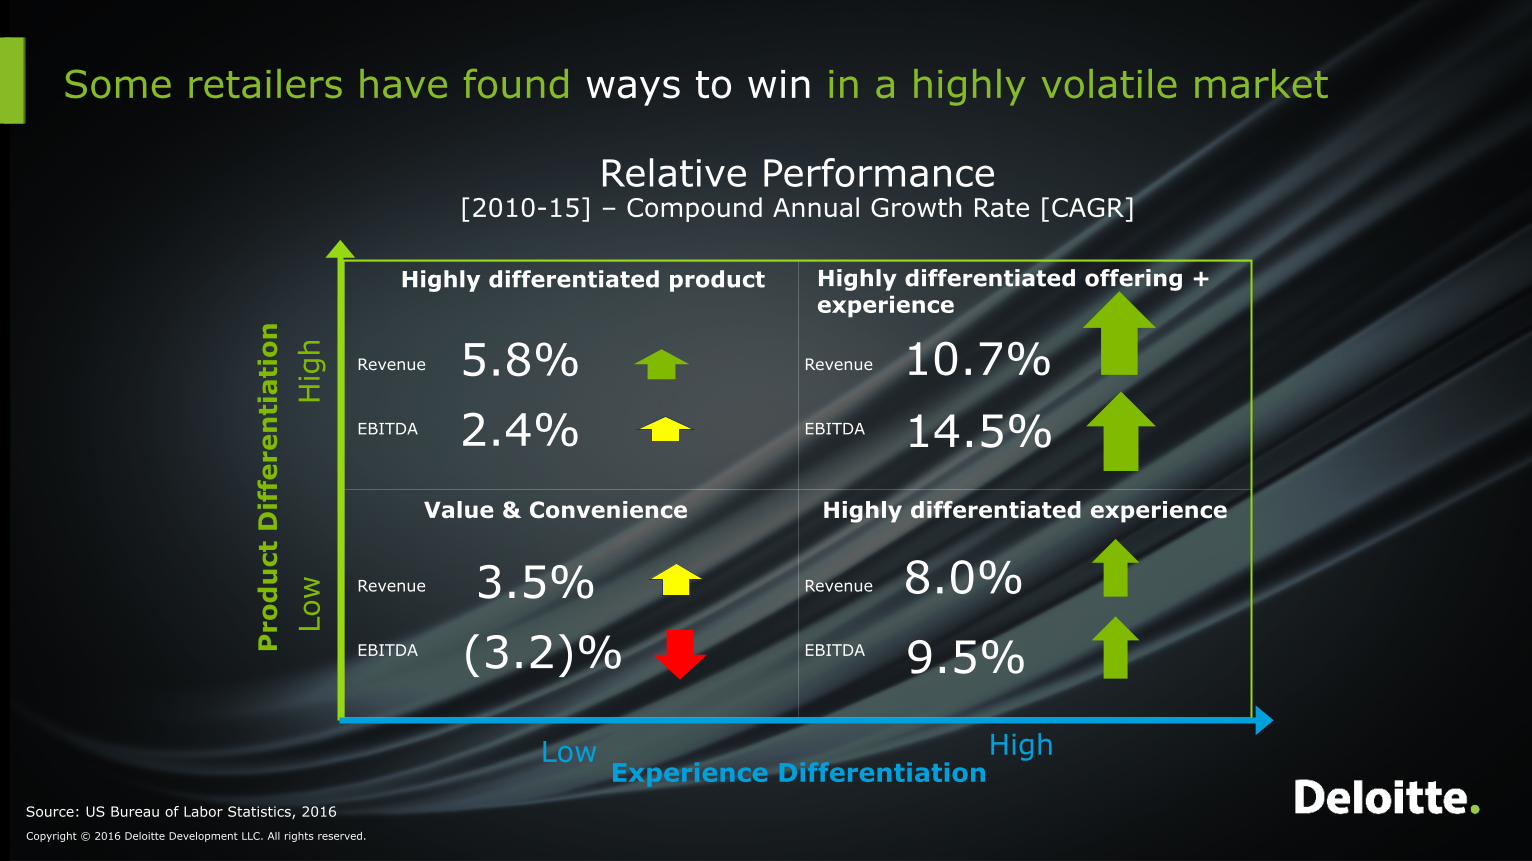
Some retailers have found ways to win in a highly volatile market
10.7%
Relative Performance [2010-15] – Compound Annual Growth Rate [CAGR]
Experience Differentiation
Pro
du
ct D
iffe
ren
tiat
ion
Low High
Low
H
igh
Value & Convenience
Highly differentiated product
Highly differentiated experience
Highly differentiated offering + experience
5.8%
3.5% 8.0%
Source: US Bureau of Labor Statistics, 2016
2.4% 14.5%
(3.2)% 9.5%
Revenue
EBITDA
Revenue
EBITDA
Revenue
EBITDA
Revenue
EBITDA
Copyright © 2016 Deloitte Development LLC. All rights reserved.
QuesOonsfortheSpeaker?
Goto:www.pollev.com/ultaretailortextultaretailto22333