Embed Size (px)
DESCRIPTION
بنام خدا. بیماری مزمن. همه کاستی ها یا انحراف ها از حالت عادی که یک یا چند تا از ویژگیهای زیر را داشته باشد: دائمی باشد. پس از آنها ناتوانی برجای بماند. به سبب تغییرات بیماری شناختی بازگشت ناپذیر ایجاد شده باشد. بازتوانی بیمار آموزش های ویژه لازم داشته باشد. - PowerPoint PPT Presentation
Citation preview

خدا بنام

یا یک که عادی حالت از ها انحراف یا ها کاستی همه: باشد داشته را زیر ویژگیهای از تا چند
•. باشد دائمی•. بماند برجای ناتوانی آنها از پسناپذیر • بازگشت شناختی بیماری تغییرات سبب به
. باشد شده ایجاد•. باشد داشته الزم ویژه های آموزش بیمار بازتوانیالزم • مراقبت یا مشاهده سرپرستی، زیادی مدت
. باشد داشته
مزمن بیماری

در - هم واگیر غیر و مزمن های بیماریحال در کشورهای در هم و پیشرفته کشورهای. دارند بیشتری اهمیت بزرگساالن بین در توسعه
روند - کشورها از بسیاری در ها بیماری این: دارند صعودی
عمر طول افزایش مردم رفتاری و زندگی الگوهای تغییر نوین های مراقبت پیدایش و پزشکی علم پیشرفت
پزشکی
بیان : مسئله

دخانیات 1. اشکال سایر و سیگار مصرف
الکلی 2. مشروبات به اعتیاد
خدمات 3. به دسترسی در ناتوانی یا نارساییپیشگیری برای بهداشتی
زندگی 4. سبک های دگرگونی
محیطی 5. زیست خطر شغلی،) عوامل خطراتهوا، ... ( و آب آلودگی
استرس 6. به مربوط عوامل
عوامل : خطر
What are DALYs?
• DALYs = Disability Adjusted Life Years • A common measurement unit for
morbidity and mortality• Facilitates comparisons of all types of
health outcomes
5
One
“One year lost to poor health.”
Disability Adjusted Life Year
The DALY: A Comparative Tool to Measure Health
6
How are DALYs constructed?
• A DALY is a health outcome measure with two main components– Quality of life reduced due to a disability– Lifetime lost due to premature mortality.
7
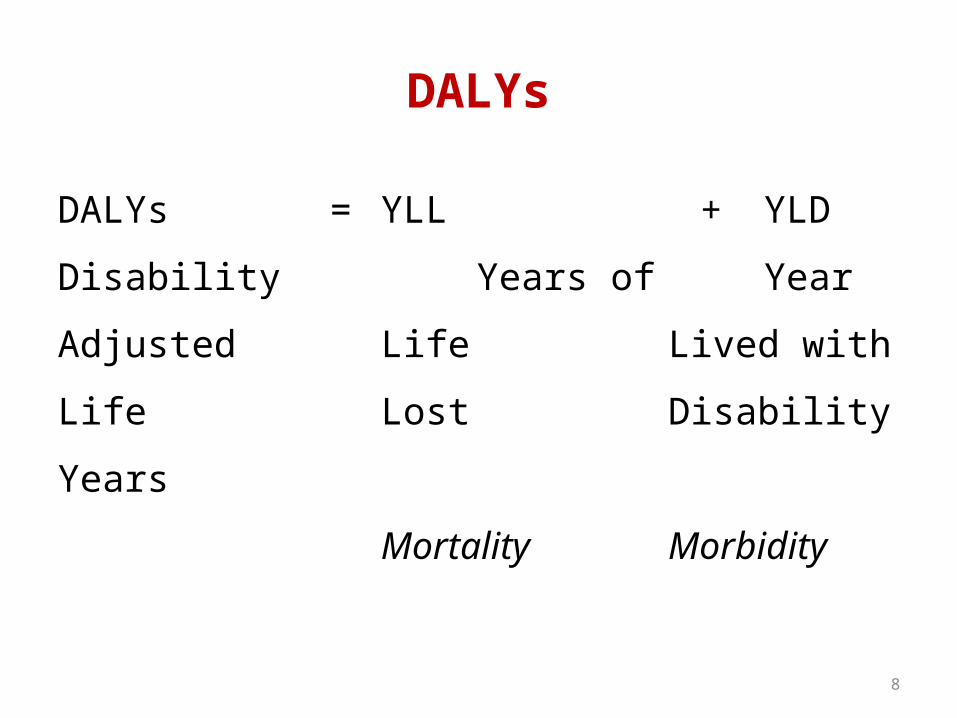
DALYs
DALYs = YLL + YLD
Disability Years of Year
Adjusted Life Lived with
Life Lost Disability
Years
Mortality Morbidity
8


Cardiovascular Chronic RespiratoryDisease Type 2 Diabetes Cancer
Chronic Diseases result in percent of deaths
452
EMR Adult Population

EMR/NCD RISK FACTORS
• Smoking 16-65%• Hypertension 12-35%• Diabetes 7-25%• Over weight-obesity 40-70%• Dyslipidemia 30-70%• Physical Inactivity 80-90%
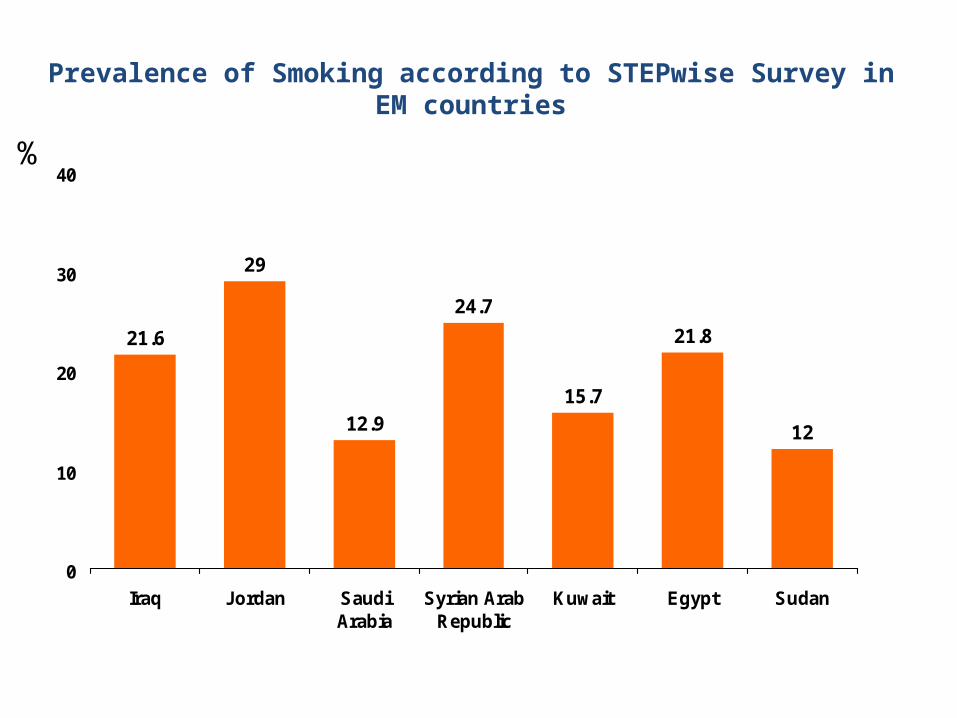
Prevalence of Smoking according to STEPwise Survey in EM countries
21.6
29
12.9
24.7
15.7
21.8
12
0
10
20
30
40
Iraq Jordan SaudiArabia
Syrian ArabRepublic
Kuwait Egypt Sudan
%
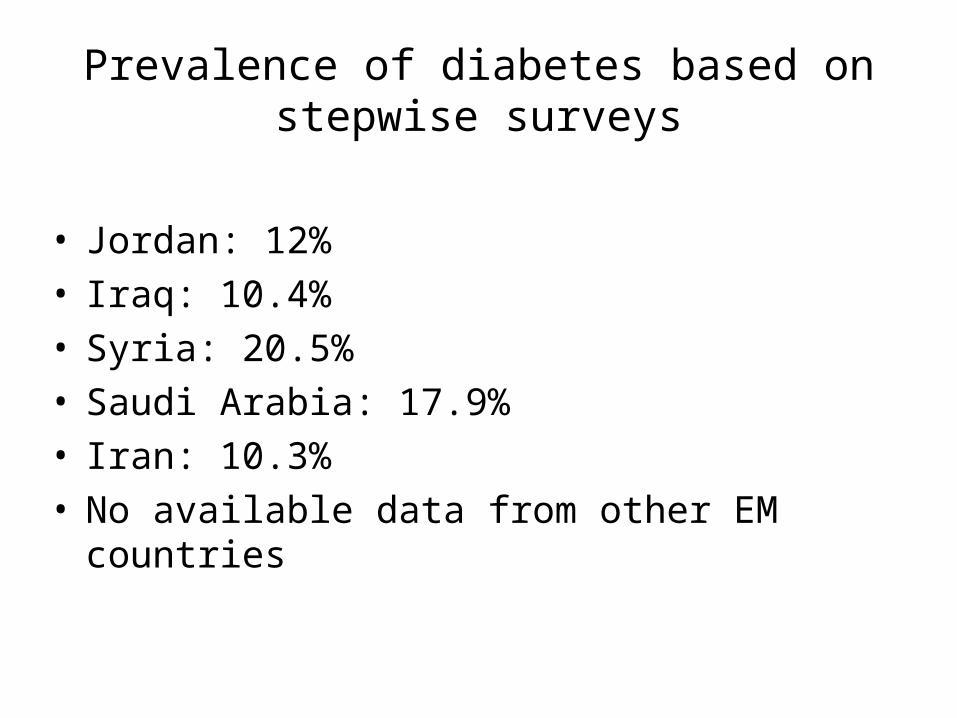
Prevalence of diabetes based on stepwise surveys
• Jordan: 12%• Iraq: 10.4%• Syria: 20.5%• Saudi Arabia: 17.9%• Iran: 10.3%• No available data from other EM countries
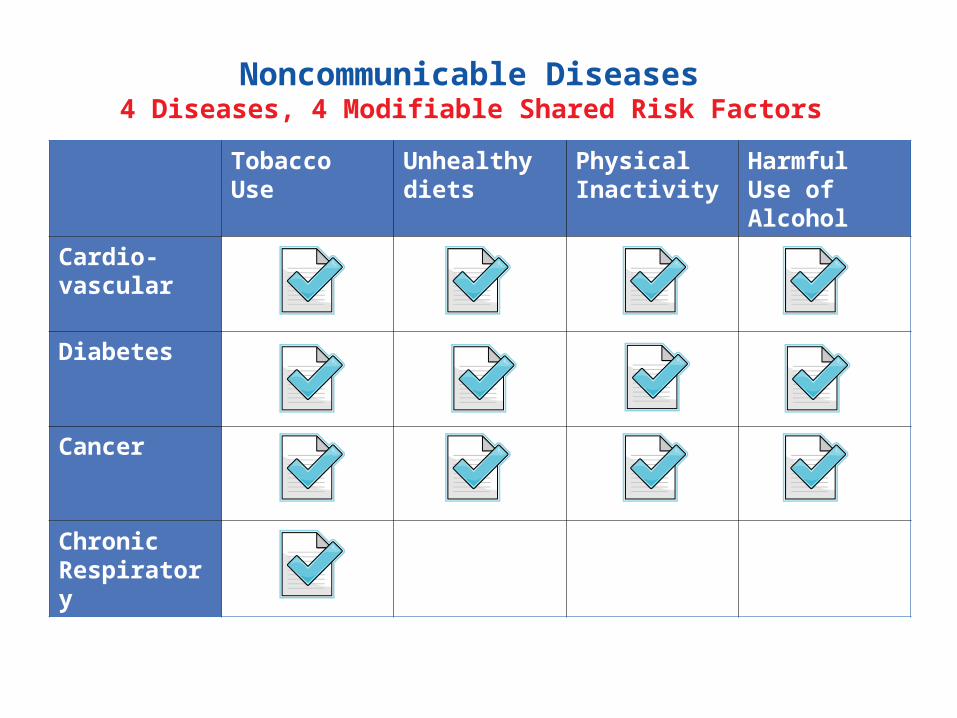
Noncommunicable Diseases 4 Diseases, 4 Modifiable Shared Risk Factors
TobaccoUse
Unhealthy diets
Physical Inactivity
HarmfulUse of Alcohol
Cardio-vascular
Diabetes
Cancer
ChronicRespiratory
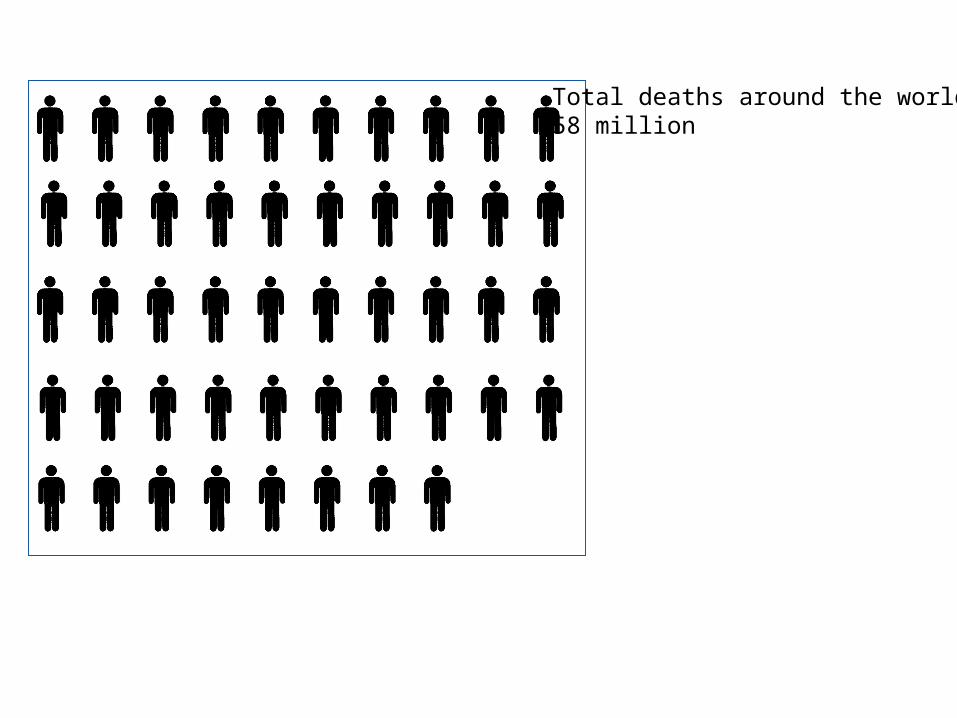
Total deaths around the world:58 million
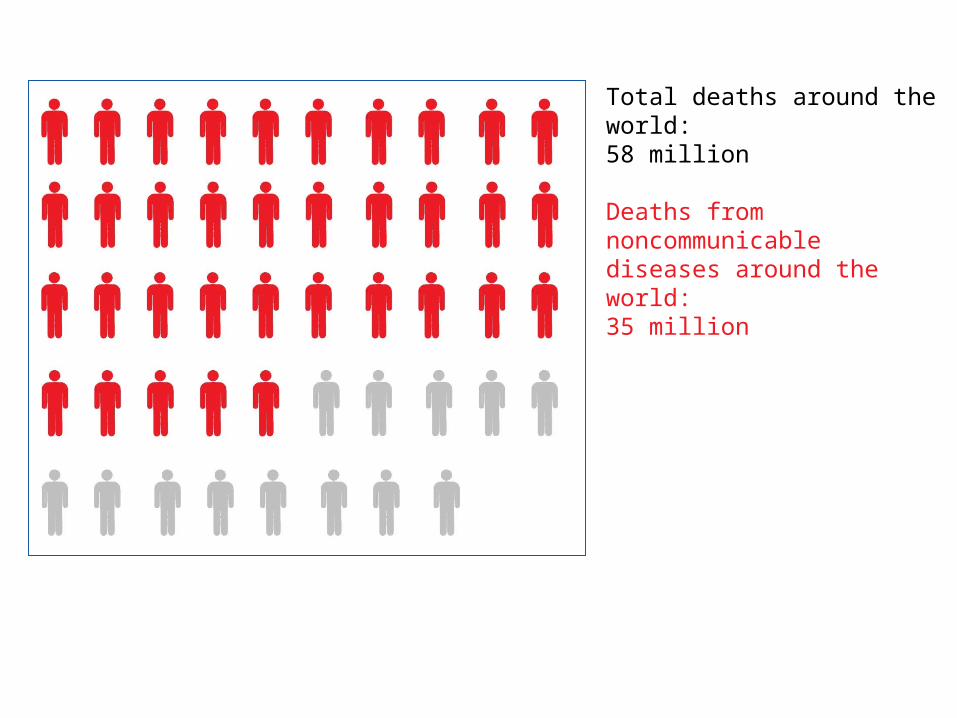
Total deaths around the world:58 million
Deaths from noncommunicable diseases around the world:35 million
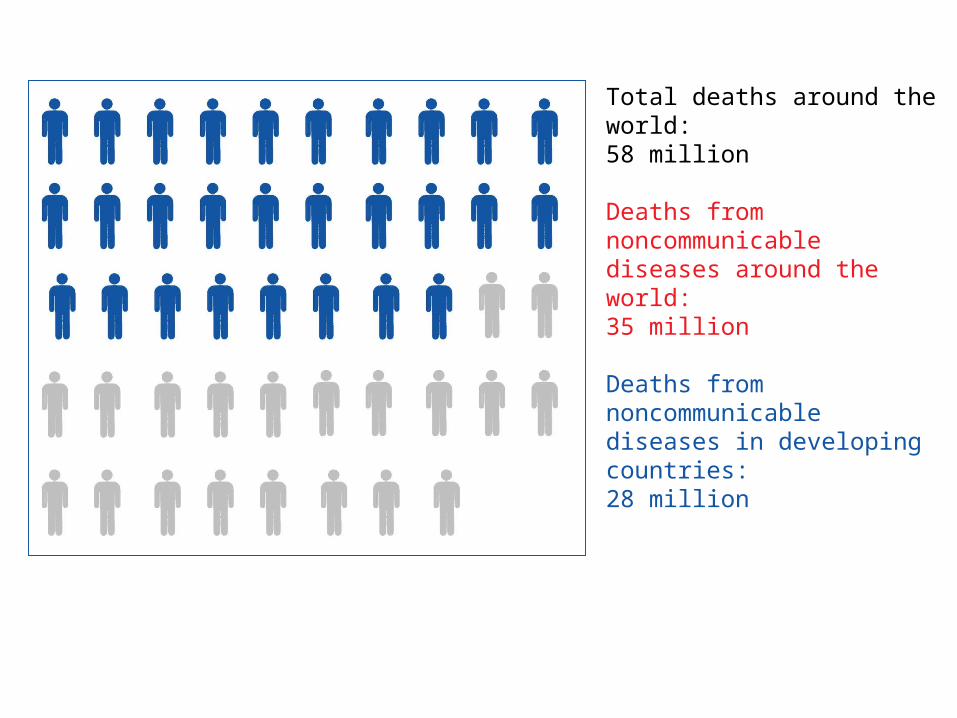
Total deaths around the world:58 million
Deaths from noncommunicable diseases around the world:35 million
Deaths from noncommunicable diseases in developing countries:28 million
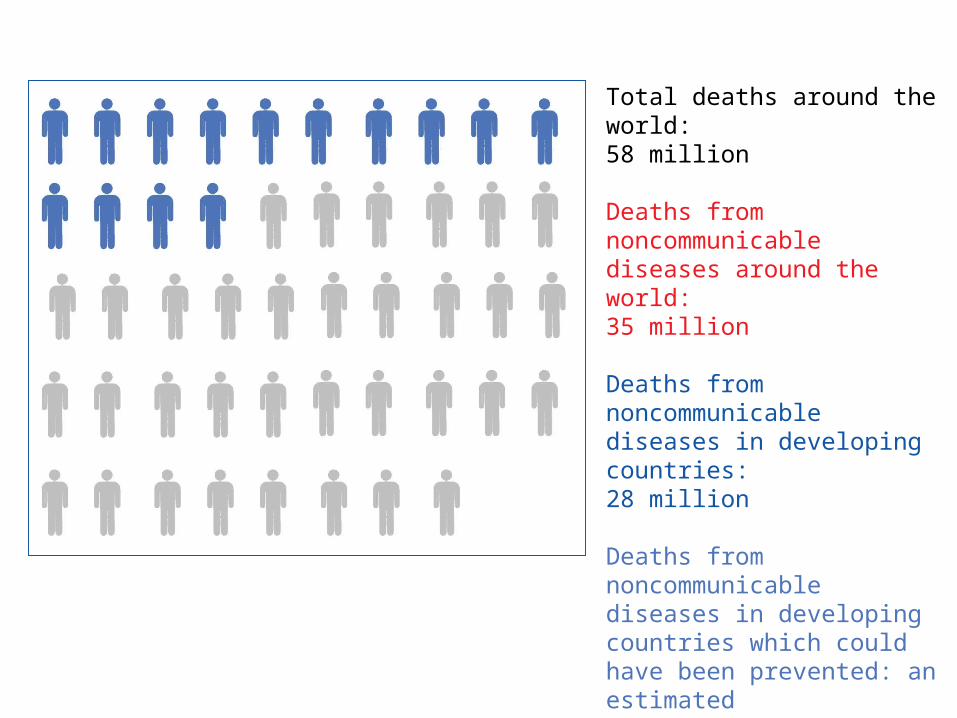
Total deaths around the world:58 million
Deaths from noncommunicable diseases around the world:35 million
Deaths from noncommunicable diseases in developing countries:28 million
Deaths from noncommunicable diseases in developing countries which could have been prevented: an estimated14 million
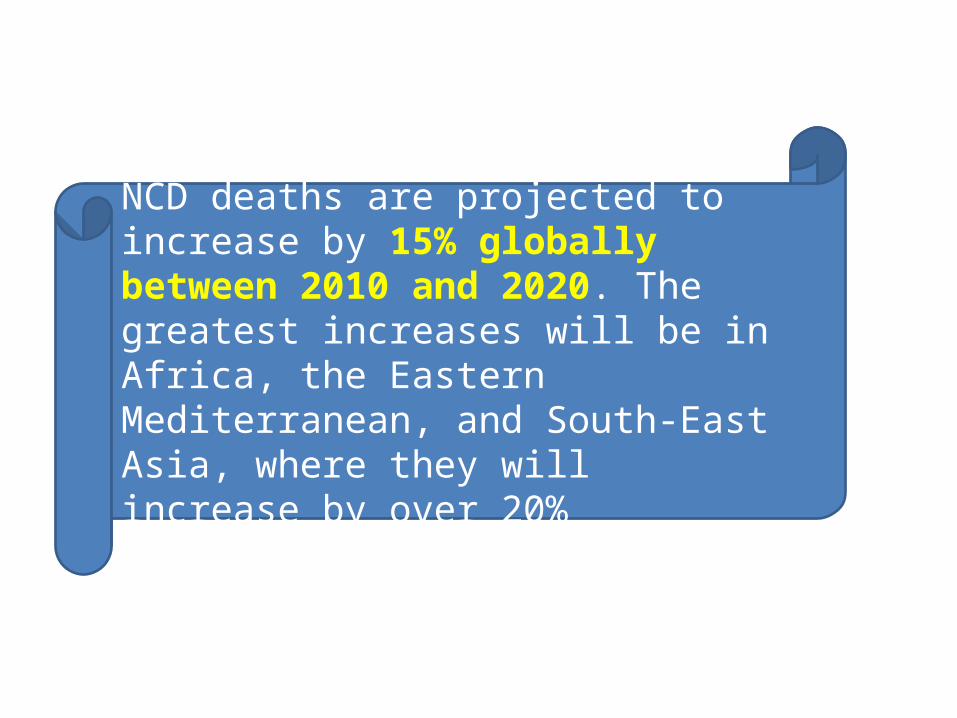
NCD deaths are projected to increase by 15% globally between 2010 and 2020. The greatest increases will be in Africa, the Eastern Mediterranean, and South-East Asia, where they will increase by over 20%
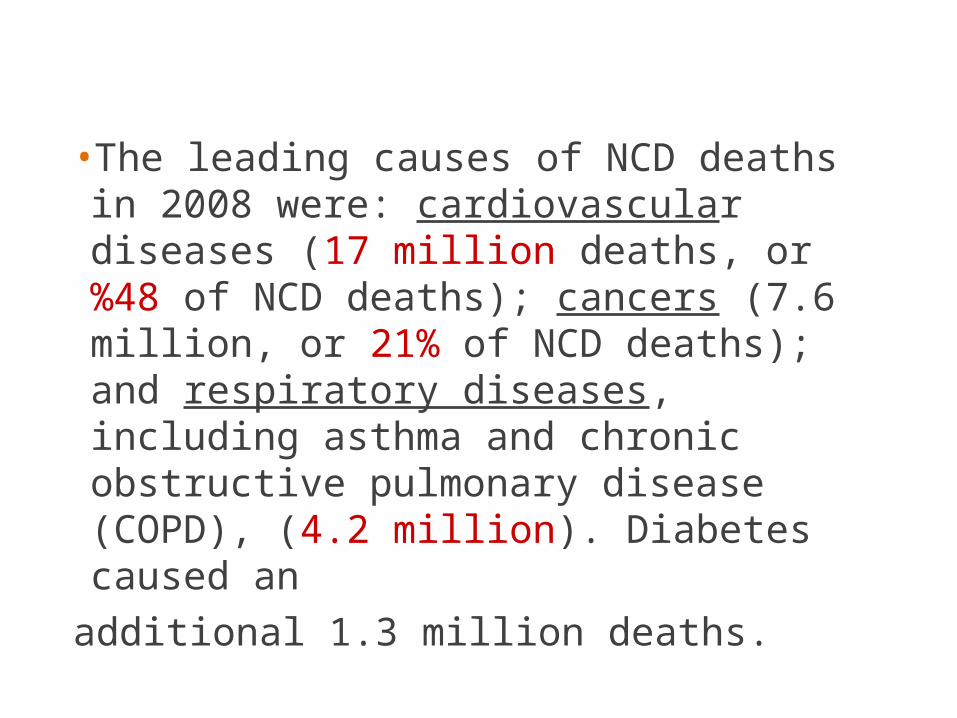
•The leading causes of NCD deaths in 2008 were: cardiovascular diseases (17 million deaths, or %48 of NCD deaths); cancers (7.6 million, or 21% of NCD deaths); and respiratory diseases, including asthma and chronic obstructive pulmonary disease (COPD), (4.2 million). Diabetes caused an
additional 1.3 million deaths.
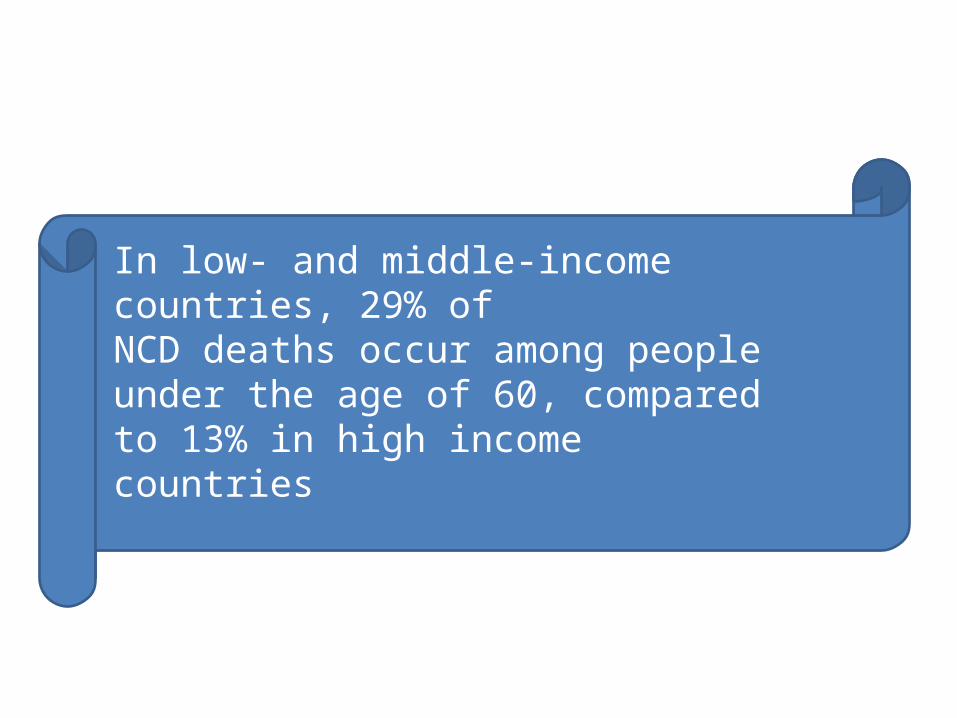
In low- and middle-income countries, 29% ofNCD deaths occur among people under the age of 60, compared to 13% in high incomecountries
Dr Z Farajzadegan
Risk factors
• Tobacco use,• Physical inactivity,• Unhealthy diet and• The harmful use of alcohol
Dr Z Farajzadegan
four key metabolic/physiological changes
• Raised blood pressure,• Overweight/obesity,• Hyperglycemia • Hyperlipidemia.
Dr Z Farajzadegan
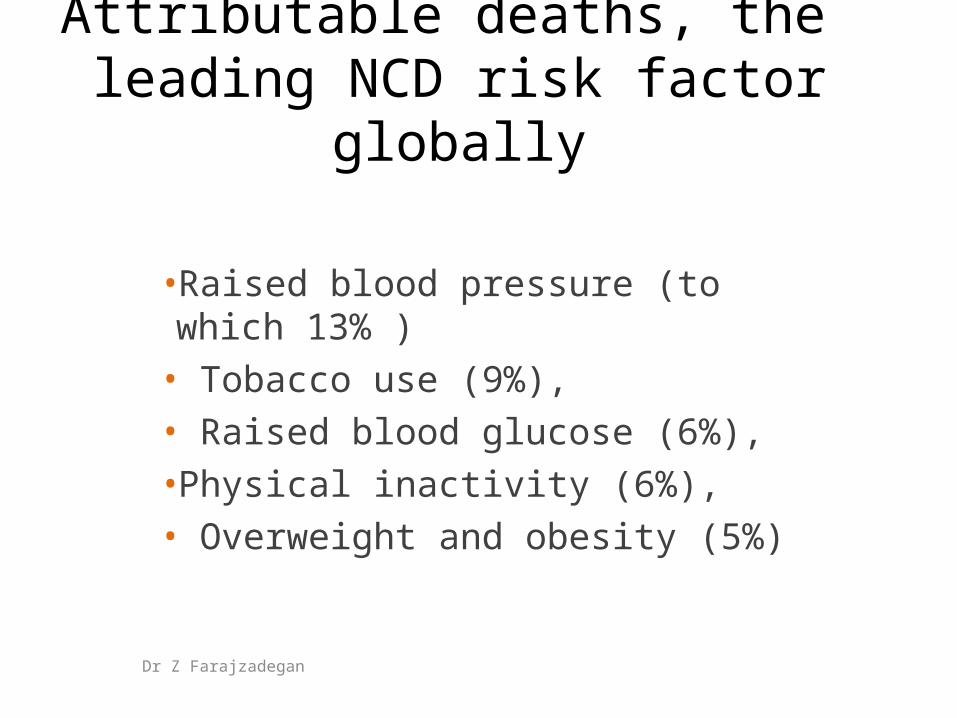
Attributable deaths, the leading NCD risk factor globally
•Raised blood pressure (to which 13% )
• Tobacco use (9%),• Raised blood glucose (6%), •Physical inactivity (6%), • Overweight and obesity (5%)
Dr Z Farajzadegan
Modifiable behavioral risk factors
• Tobacco• Insufficient physical activity• Harmful use of alcohol• Unhealthy diet
Dr Z Farajzadegan
If no serious action is taken, annual tobacco related deaths are projected to increase to 8 million by 2030, accounting for 10% of all deaths
Dr Z Farajzadegan
Insufficient physical activity
Approximately 3.2 million deaths each year are attributable to insufficient physical activity
Dr Z Farajzadegan
Raised blood pressure
• Worldwide, raised blood pressure is estimated to cause 7.5 million deaths, about 12.8% of the total
of all annual deaths .• This accounts for 57 million DALYs or 3.7% of total DALYs. • Raised blood pressure is a major risk factor for coronary
heart disease and ischemic as well as hemorrhagic stroke
Dr Z Farajzadegan
Overweight and obesity
• Worldwide, 2.8 million people die each year as a result of being overweight (including obesity) and an estimated 35.8 million (2.3%) of global DALYs are caused by overweight or obesity
Dr Z Farajzadegan
• There is increased risk of co-morbidities for BMIs in the range of 25.0 to 29.9 kg/m2,
• and moderate to severe risk of co-morbidities for a BMI greater than 30 kg/m2
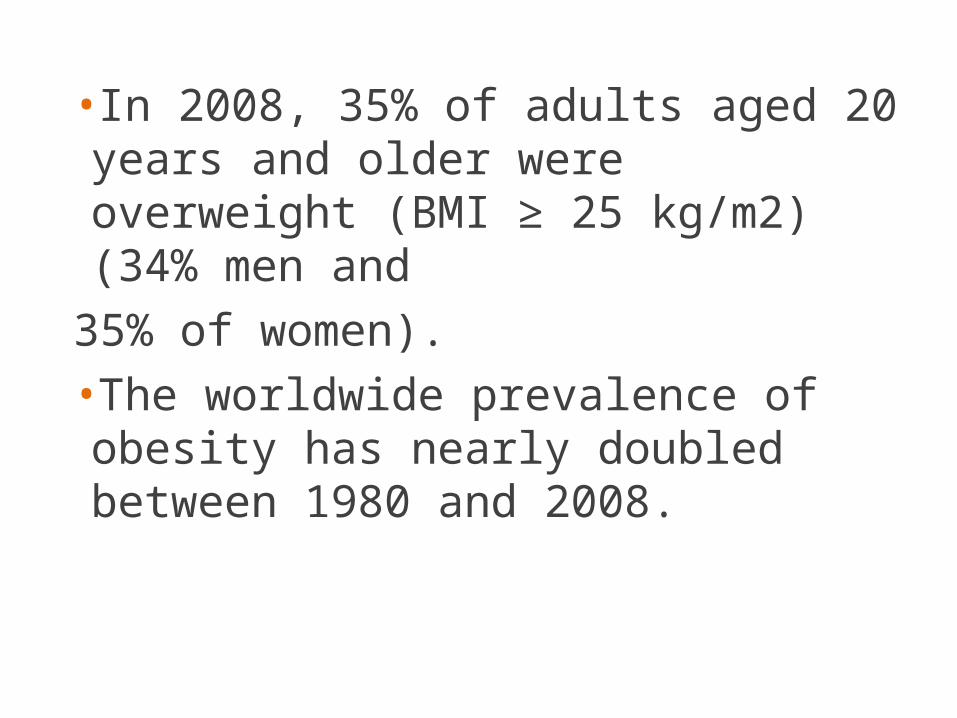
•In 2008, 35% of adults aged 20 years and older were overweight (BMI ≥ 25 kg/m2) (34% men and
35% of women). •The worldwide prevalence of obesity has nearly doubled between 1980 and 2008.
Dr Z Farajzadegan
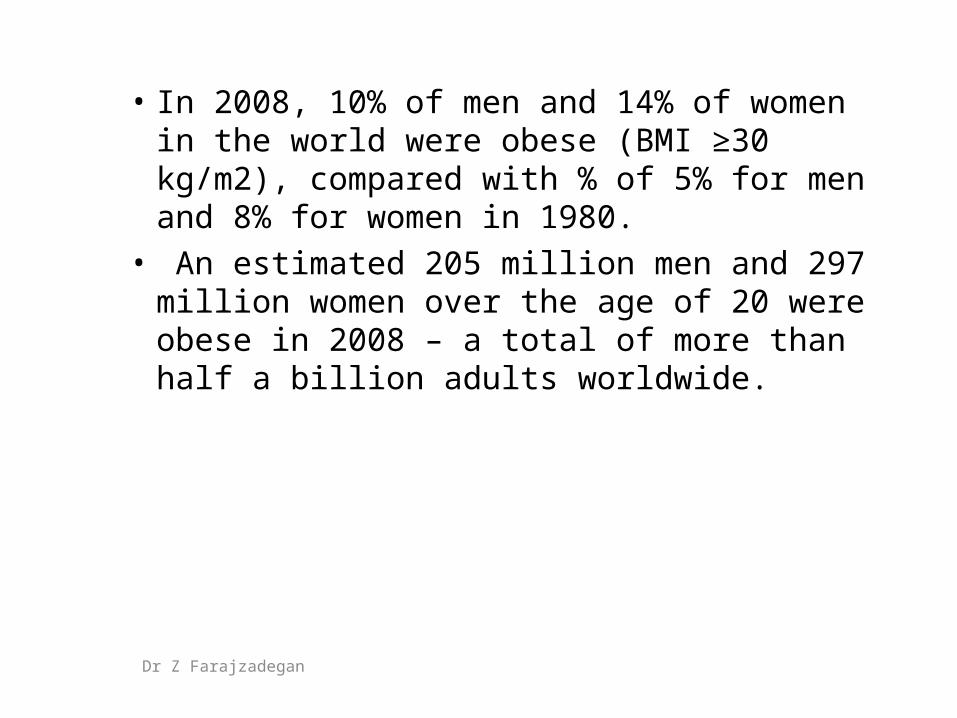
• In 2008, 10% of men and 14% of women in the world were obese (BMI ≥30 kg/m2), compared with % of 5% for men and 8% for women in 1980.
• An estimated 205 million men and 297 million women over the age of 20 were obese in 2008 – a total of more than half a billion adults worldwide.
Dr Z Farajzadegan
The fastest rise in overweight among infants
and young children is inlower-middle income countries
Dr Z Farajzadegan
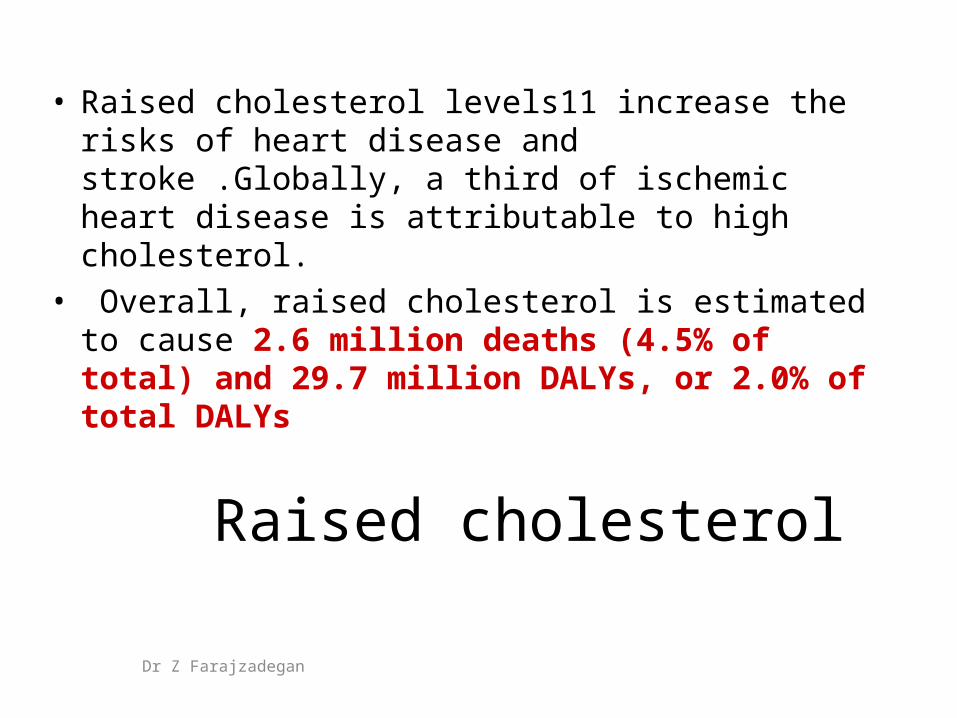
Raised cholesterol
• Raised cholesterol levels11 increase the risks of heart disease and stroke .Globally, a third of ischemic heart disease is attributable to high cholesterol.
• Overall, raised cholesterol is estimated to cause 2.6 million deaths (4.5% of total) and 29.7 million DALYs, or 2.0% of total DALYs
Dr Z Farajzadegan
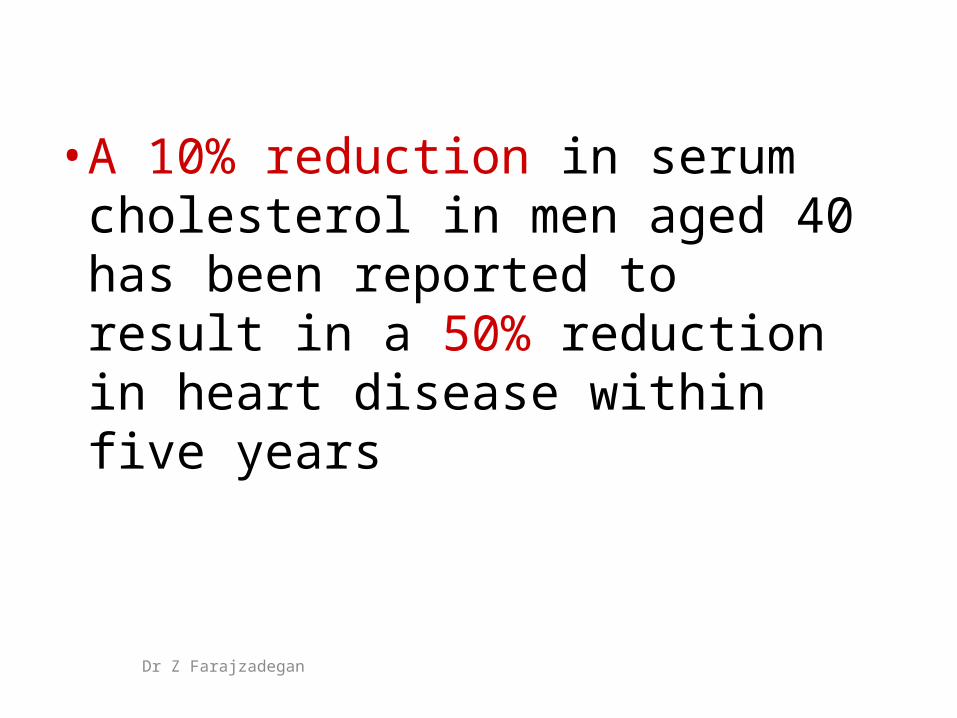
• A 10% reduction in serum cholesterol in men aged 40 has been reported to result in a 50% reduction in heart disease within five years
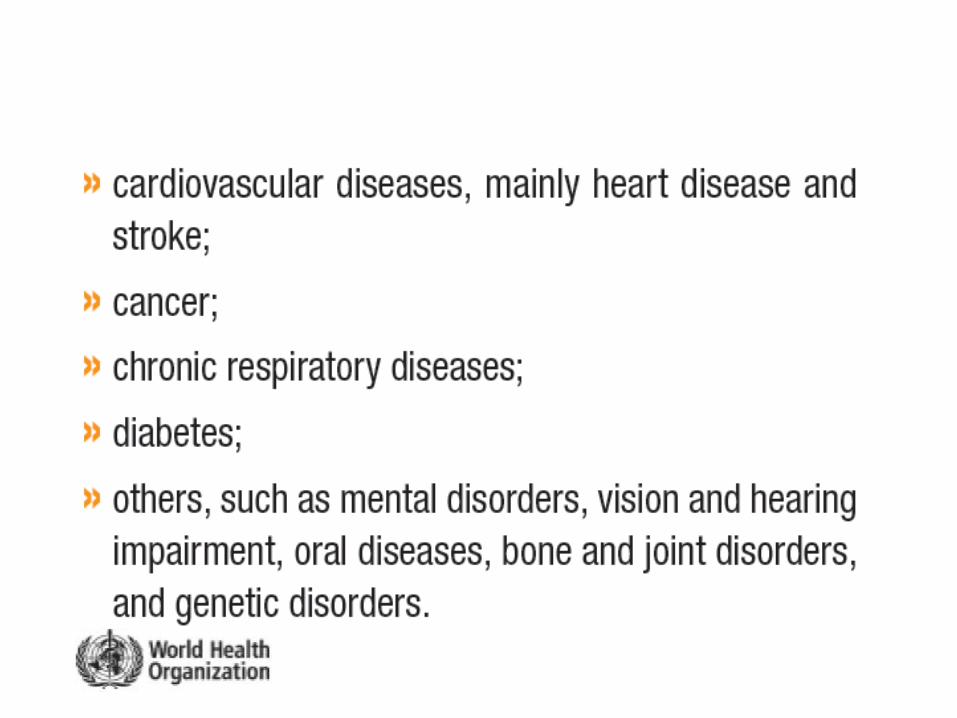
What are Chronic Diseases?


2005 2006-2015 (cumulative)
Geographical regions )WHO classification(
Total deaths
)millions(
NCD deaths
)millions(
NCD deaths
)millions(
Trend: Death from infectious
disease
Trend: Death from NCD
Africa 10.8 2.5 28 +6% +27%
Americas 6.2 4.8 53 -8% +17%
Eastern Mediterranean
4.3 2.2 25 -10% +25%
Europe 9.8 8.5 88 +7% +4%
South-East Asia 14.7 8.0 89 -16% +21%
Western Pacific 12.4 9.7 105 +1 +20%
Total 58.2 35.7 388 -3% +17%
Noncommunicable DiseasesDeath trends (2006-2015)
WHO projects that over the next 10 years, the largest increase in deaths from cardiovascular disease, cancer, respiratory disease and diabetes will occur in developing countries.
(WH
O Chronic D
isease Report, 2005)
39
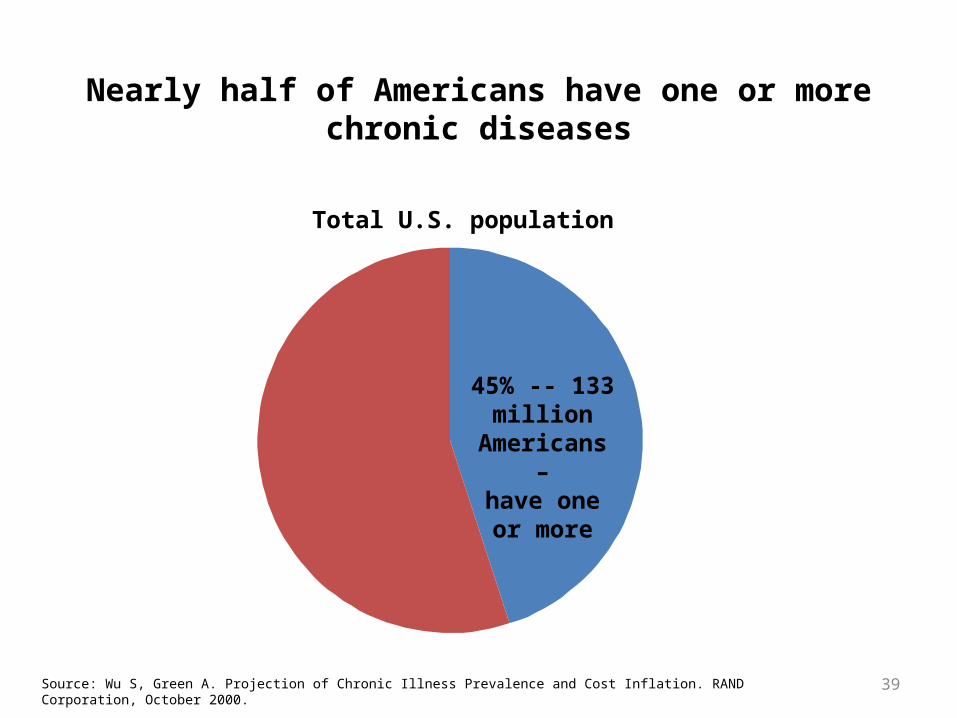
Nearly half of Americans have one or more chronic diseases
Total U.S. population
45% -- 133 million
Americans –have one or
more
Source: Wu S, Green A. Projection of Chronic Illness Prevalence and Cost Inflation. RAND Corporation, October 2000.
40
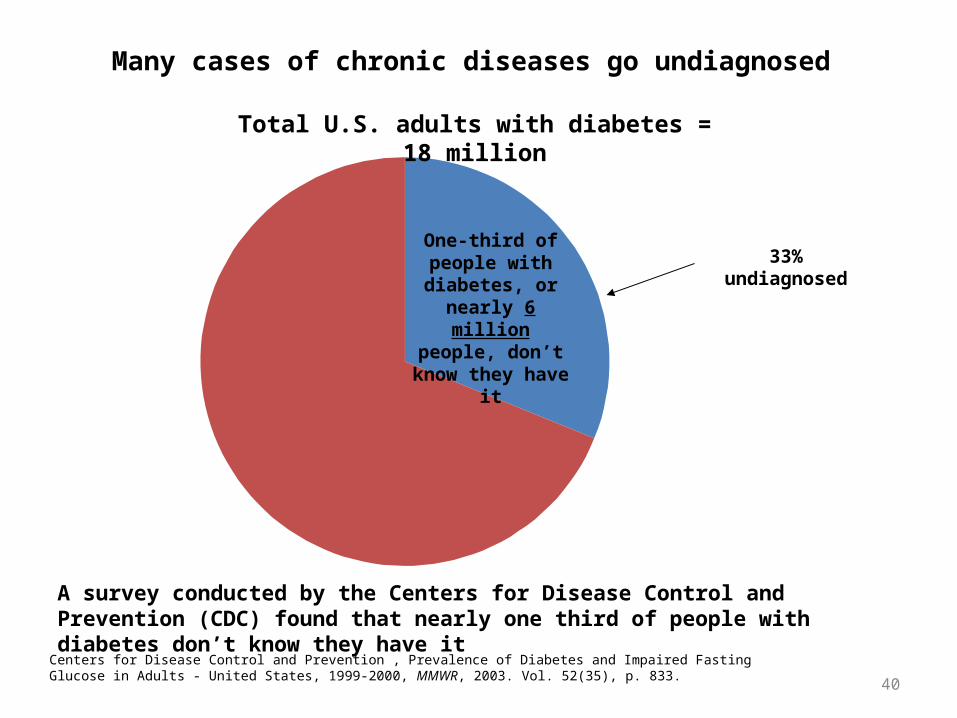
Centers for Disease Control and Prevention , Prevalence of Diabetes and Impaired Fasting Glucose in Adults - United States, 1999-2000, MMWR, 2003. Vol. 52(35), p. 833.
One-third of people with diabetes, or nearly 6 million
people, don’t know they have it
Many cases of chronic diseases go undiagnosed
Total U.S. adults with diabetes = 18 million
A survey conducted by the Centers for Disease Control and Prevention (CDC) found that nearly one third of people with diabetes don’t know they have it
33% undiagnosed

41
Other cases of chronic disease are diagnosed, but not well-controlled
Unaware, 24%
Aware, Not Treated, 11%
Controlled, 31%
Treated, Not Controlled, 34%
Source: Presentation by David Cutler. Alliance for Health Reform Novartis/NIHCM Briefing. March 28, 2008. Alliance for Health Reform Novartis/NIHCM Briefing. March 28, 2008. Original sources: NHANESOriginal sources: NHANES
Percent of U.S. adults with hypertension
42
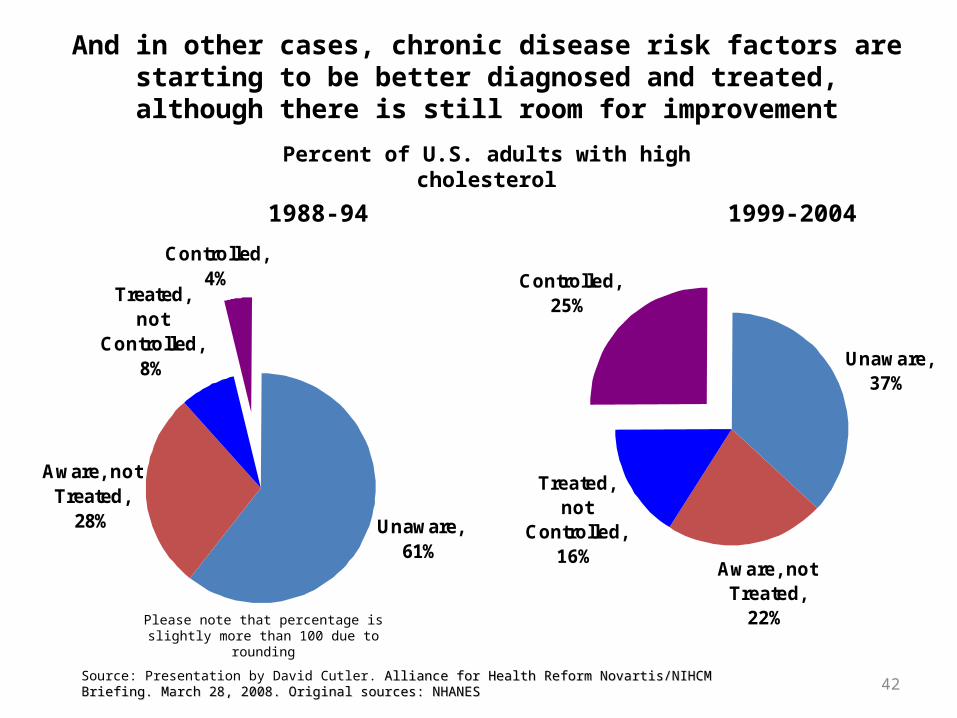
And in other cases, chronic disease risk factors are starting to be better diagnosed and treated, although
there is still room for improvement
Unaware, 61%
Aware, not Treated,
28%
Treated, not
Controlled, 8%
Controlled, 4%
Unaware, 37%
Aware, not Treated,
22%
Treated, not
Controlled, 16%
Controlled, 25%
1988-94 1999-2004
Source: Presentation by David Cutler. Alliance for Health Reform Novartis/NIHCM Briefing. March 28, 2008. Alliance for Health Reform Novartis/NIHCM Briefing. March 28, 2008. Original sources: NHANESOriginal sources: NHANES
Percent of U.S. adults with high cholesterol
Please note that percentage is slightly more than 100 due to rounding

43
The increase in childhood obesity is placing the next generation at great risk for developing chronic diseases
earlier in life
Children born in the U.S. in 2000
*childhood overweight and obesity
One third = portion of who will develop diabetes over
their lifetime, given current trends in the share who are
overweight or obese
Source: Laino C. One in three kids will develop diabetes. Web MD. June 16, 2003. Available at:http://www.webmd.com/content/article/66/79851.htm. Accessed July 31 ,2006.
44
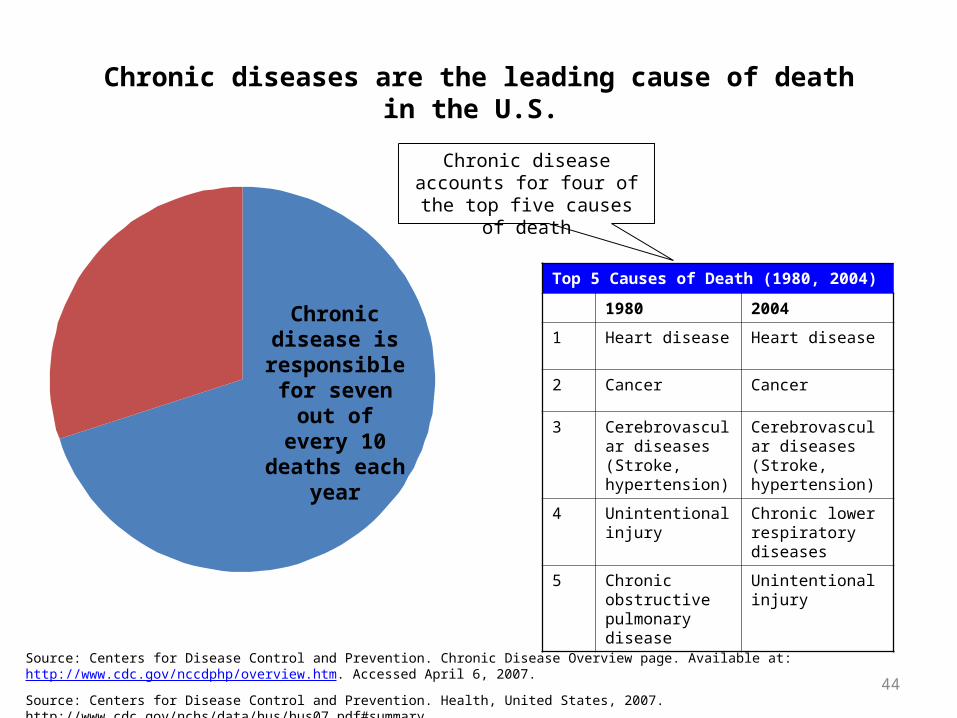
Chronic diseases are the leading cause of death in the U.S.
Chronic disease is responsible
for seven out of every 10 deaths
each year
Top 5 Causes of Death (1980, 2004)
1980 2004
1 Heart disease Heart disease
2 Cancer Cancer
3 Cerebrovascular diseases )Stroke, hypertension(
Cerebrovascular diseases )Stroke, hypertension(
4 Unintentional injury
Chronic lower respiratory diseases
5 Chronic obstructive pulmonary disease
Unintentional injury
Chronic disease accounts for four of the top five causes of
death
Source: Centers for Disease Control and Prevention. Chronic Disease Overview page. Available at: http://www.cdc.gov/nccdphp/overview.htm. Accessed April 6, 2007.
Source: Centers for Disease Control and Prevention. Health, United States, 2007. http://www.cdc.gov/nchs/data/hus/hus07.pdf#summary

45
Family caregivers are a critical support structure for Americans with chronic illnesses, and the U.S. health
care system
In any given year, more than 50 million Americans find themselves in a caregiving role
Family caregivers provide the vast
majority (80 percent) of all long-term care
services for those with a chronic illness or
disability
Almost one in five (17 percent) family caregivers provide 40
hours of care a week or more
Source: Thompson L., “Long-term care: Support for family caregivers [Issue Brief].” Washington, DC: Georgetown University,2004 and U.S. Agency for Healthcare Research and Quality. Long-Term Care Financing Project, Long-term Care Users Rangein Age and Most Do Not Live in Nursing Homes. November 8, 2000.
46
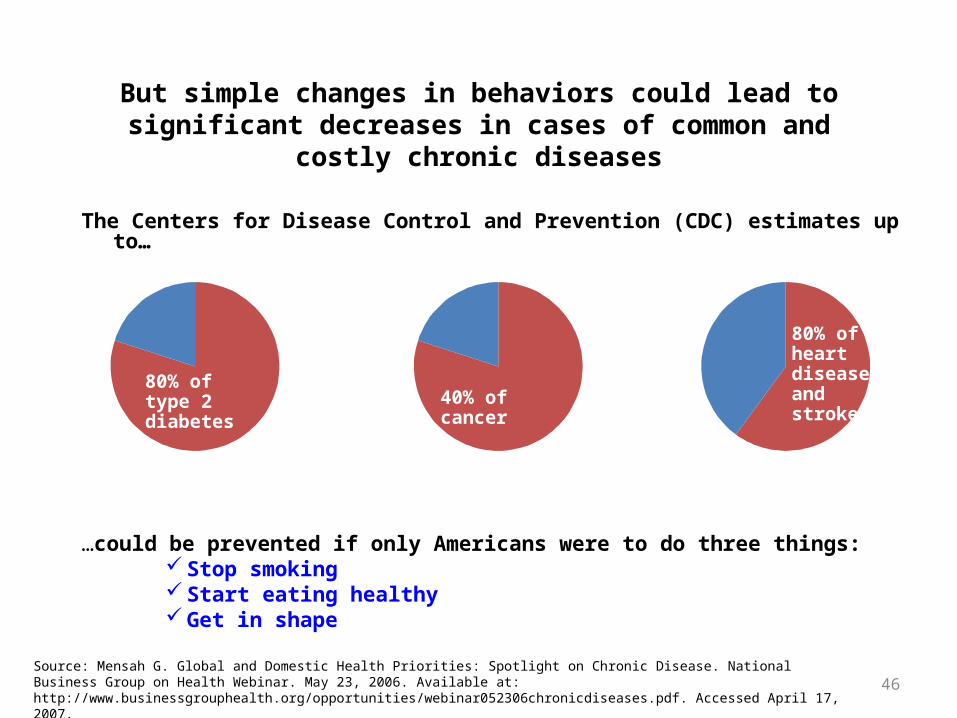
But simple changes in behaviors could lead to significant decreases in cases of common and costly
chronic diseases
The Centers for Disease Control and Prevention (CDC) estimates up to…
…could be prevented if only Americans were to do three things: Stop smoking Start eating healthy Get in shape
80% of type 2 diabetes 40% of cancer
80% of heart disease and stroke
Source: Mensah G. Global and Domestic Health Priorities: Spotlight on Chronic Disease. National Business Group on Health Webinar. May 23, 2006. Available at: http://www.businessgrouphealth.org/opportunities/webinar052306chronicdiseases.pdf. Accessed April 17, 2007.
47
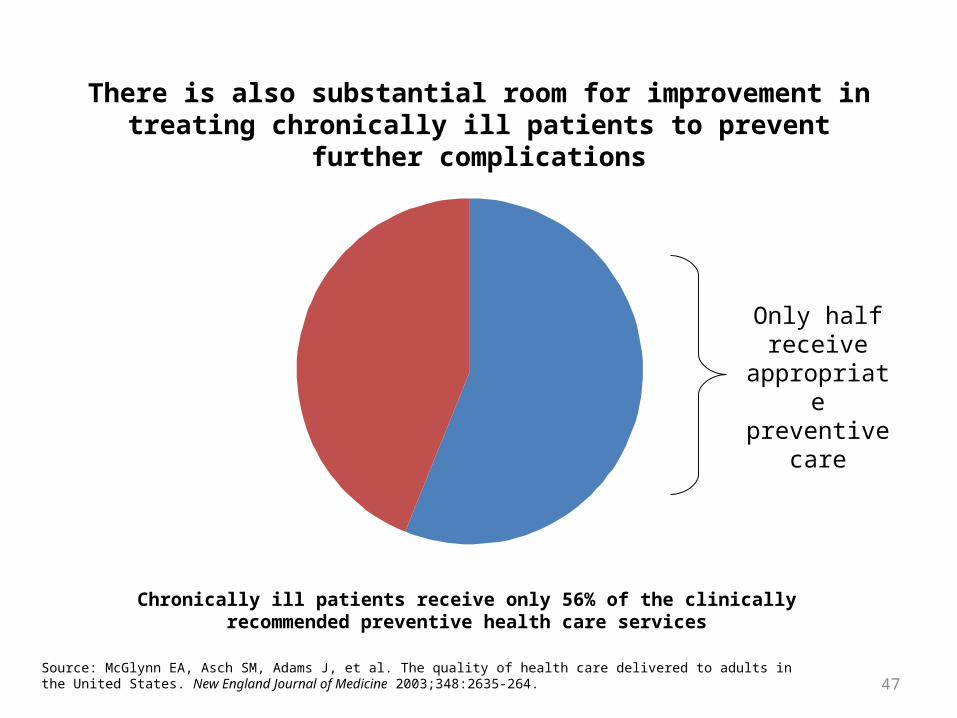
There is also substantial room for improvement in treating chronically ill patients to prevent further
complications
Chronically ill patients receive only 56% of the clinically recommended preventive health care services
Source: McGlynn EA, Asch SM, Adams J, et al. The quality of health care delivered to adults in the United States. New England Journal of Medicine 2003;348:2635-264.
Only half receive
appropriate preventive
care
48
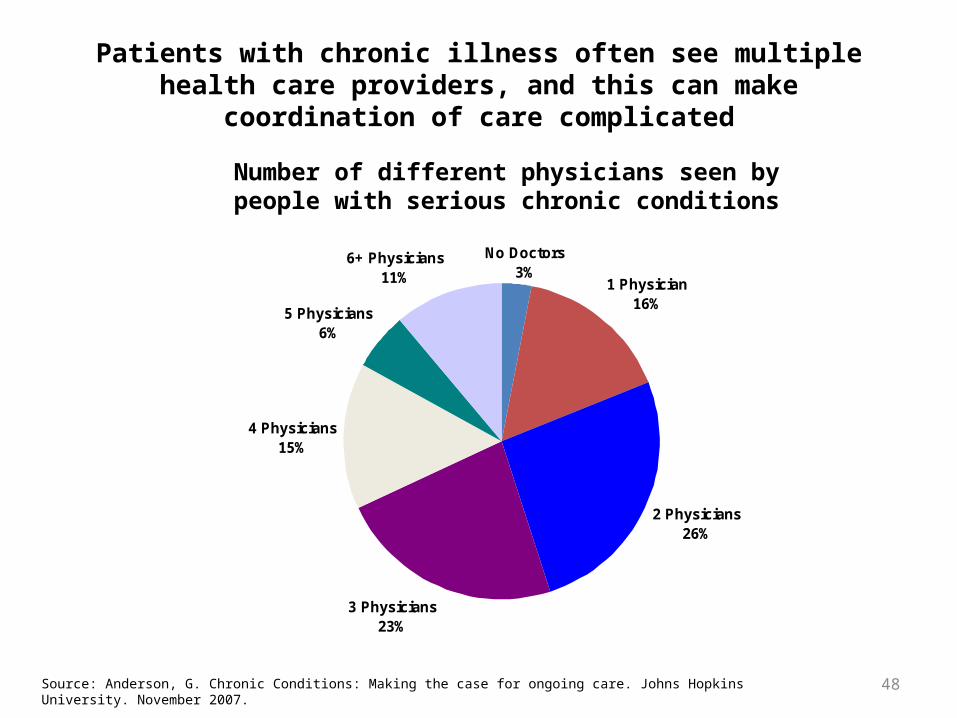
Patients with chronic illness often see multiple health care providers, and this can make
coordination of care complicated
1 Physician 16%
2 Physicians 26%
3 Physicians23%
4 Physicians15%
5 Physicians6%
6+ Physicians11%
No Doctors3%
Source: Anderson, G. Chronic Conditions: Making the case for ongoing care. Johns Hopkins University. November 2007.
Number of different physicians seen by people with serious chronic conditions

Prevalence of diabetes based on stepwise surveys
• Jordan: 12%• Iraq: 10.4%• Syria: 20.5%• Saudi Arabia: 17.9%• Iran: 10.3%• No available data from other EM countries
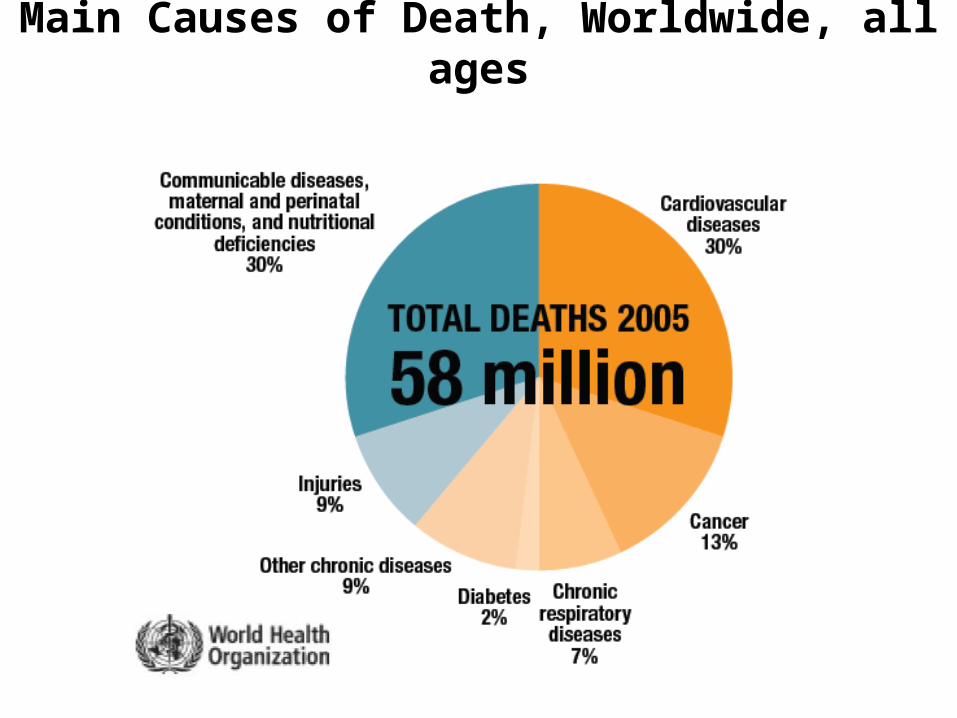
Main Causes of Death, Worldwide, all ages
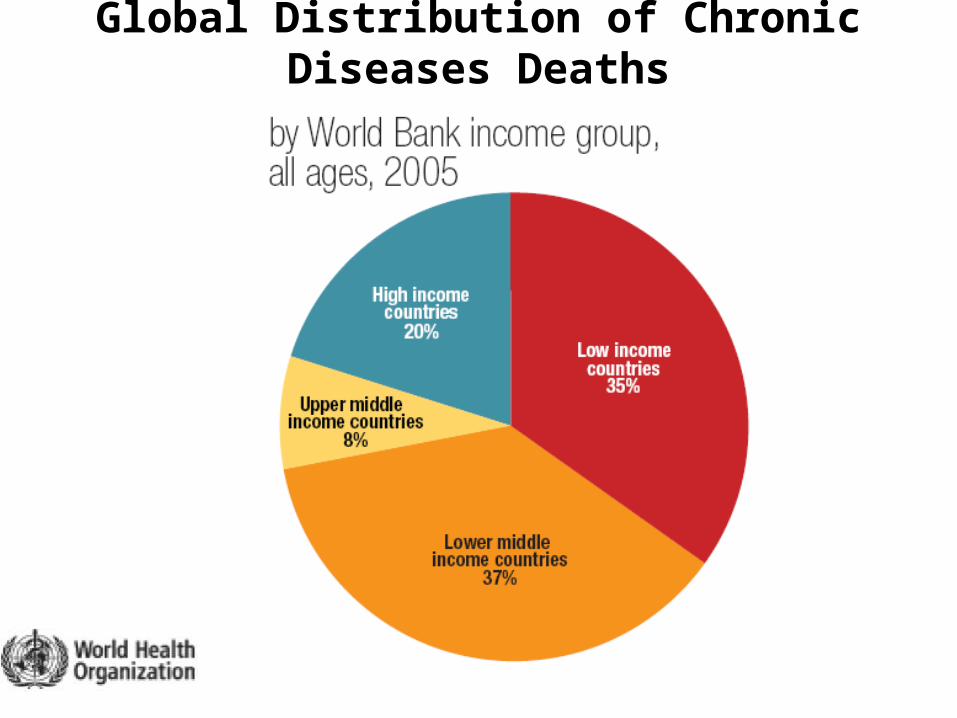
Global Distribution of Chronic Diseases Deaths
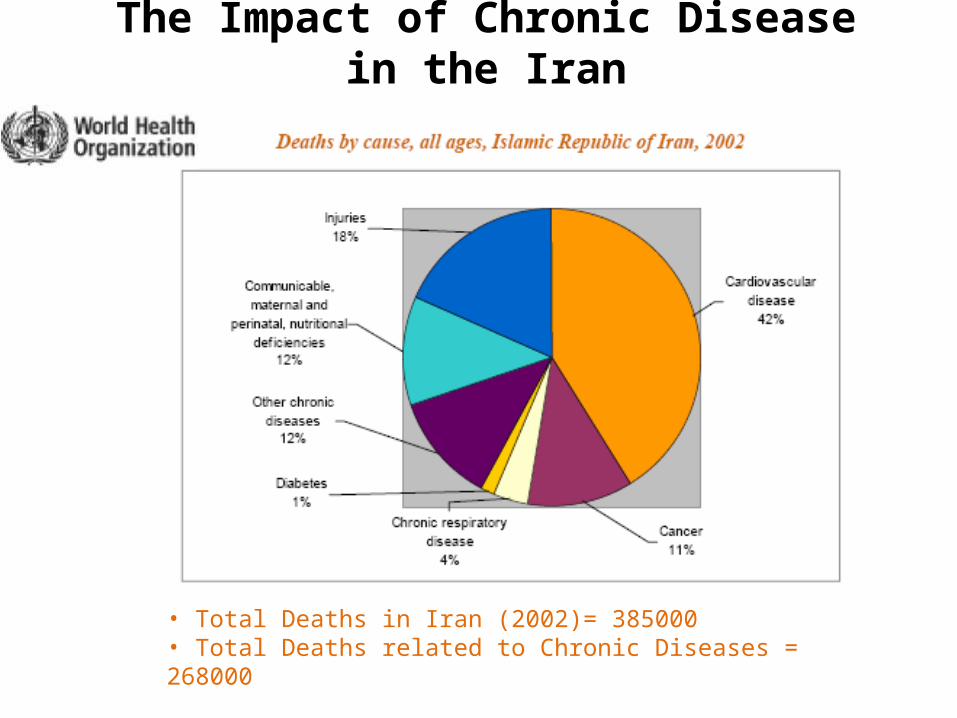
The Impact of Chronic Disease in the Iran
• Total Deaths in Iran (2002)= 385000• Total Deaths related to Chronic Diseases = 268000