Embed Size (px)
Citation preview
8/7/2019 business risk report
http://slidepdf.com/reader/full/-business-risk-report 1/8
01
01
Business Risk ReportA survey on nancial market risks for UK businesses
September 2010 | 3rd Edition
PRINT EXIT NEXT PAGE
8/7/2019 business risk report
http://slidepdf.com/reader/full/-business-risk-report 2/8
02
Business Risk Report | Sept 2010
Business condence appears to be improving which implies that
the economy is recovering at a moderate pace. Nevertheless,we feel that it is important to keep clients abreast with the latest
insight into UK companies’ approach to risk management.
This 3rd edition continues to focus on the impact of key asset
classes – interest rates, commodities, ination and FX – on UK
businesses. We have also broken our results down by industry to
provide an additional level of analysis.
Although the economic recovery is expected to continue,
companies remained cautious about hiring and capital
expenditure. Business owners were more concerned about the
impact on their business from interest rate volatility, ination and
commodity prices than six months ago. Yet, despite this anxiety,more than 80% of companies had no hedging strategies in place
to mitigate against nancial market risks.
This report also highlights that companies with larger turnover
(above £25m) tended to have more hedging strategies in place
for nancial market risks. This may reect the fact that larger
companies are more likely to be exposed to such risks or that the
potential benets from hedging outweigh the costs.
The main reasons cited by those companies that did not hedge
against nancial market risks was that it was considered that
the risks were either not applicable to their business or were not
considered by companies to be signicant enough. It is here that
our expertise can really add value in our role in exploring ideas
with you in risk mitigation. Building a trusted risk advisory capacity
for our customers is key for us so we can provide alternative
ideas for you in expert advice and tailored risk managementsolutions. Our aim is to help companies to better weigh the costs
versus the benets of hedging. In this way, companies can ensure
they are adequately covered against the risks that may threaten
the nancial performance of their businesses.
With this in mind, I hope the Business Risk Report serves as
a useful reminder about the importance of pro-active risk
management strategies and helps to ll any potential knowledge
gap that companies have.
Clare Francis
Managing Director andHead of Sales and Derivatives Structuring,
Lloyds Banking Group
Welcome to the third editionof our Business Risk Report,which gauges both theattitudes and hedgingapproaches of UK businessesto nancial market risks.
Contents
03 The overall picture
04 Businesses’ perception of risk
05 Analysis by industry sector
08 Contact us
Introduction
PRINT EXIT PREVIOUS PAGE NEXT PAGE
8/7/2019 business risk report
http://slidepdf.com/reader/full/-business-risk-report 3/8
03
Business Risk Report | Sept 2010
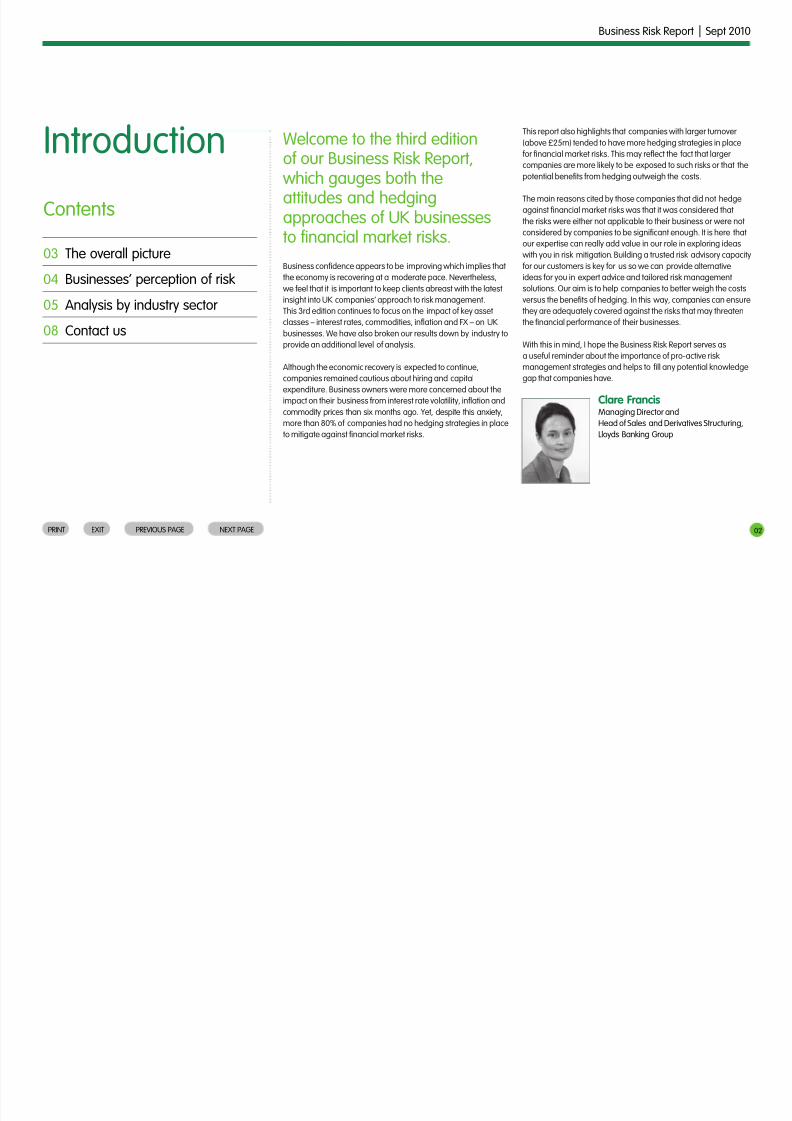
Business condence increased for the third consecutive survey, up 2 points to 18 and well
above the low of -32 at the end of 2008. However, it remains slightly below the long-term
average of 22, implying a relatively moderate pace of recovery.
Our business condence index is a forward-looking indicator, reecting expectations of sales
(turnover), order book levels and prots, which are anticipated to improve in the next six
months. The condence index correctly anticipated both the onset of the recession in mid-2008
and its exit at the end of 2009, and indicates that the recovery will continue in the second half
of this year, albeit at a relatively restrained pace.
The overall pictureOur business condence index suggests the economic recovery remains on track
Business condence index
0
-10
-20
-30
-40
40
30
20
10
50
2006 H1 2006 H2 2007 H1 2007 H2 2008 H1 2008 H2 2009 H1 2009 H2 2010 H1 2010 H2
Index Recession
Forward-looking business confidence index
Companies are beneting from strong external demand. In the rst half of the year,
the export sales balance rose to 20%, exceeding the total sales balance of 3%. Further
improvements are expected in the second half of the year.
A key takeaway from the latest survey is that companies
with greater exposure to external demand tended to be more positive about prospects than
those more reliant on domestic demand. Indeed, companies cited weak domestic demand
as the biggest threat to their business in the next six
months. Although the economic recovery is expected to continue, companies remained
cautious about hiring and capital expenditure.
Total sales
Export sales
% balance Recession
Total and export sales
0
-10
-20
-30
-40
40
30
20
10
50
2006 H1 2006 H2 2007 H1 2007 H2 2008 H1 2008 H2 2009 H1 2009 H2 2010 H1 2010 H2(e)
Companies benet from strong external sales
PRINT EXIT PREVIOUS PAGE NEXT PAGE
8/7/2019 business risk report
http://slidepdf.com/reader/full/-business-risk-report 4/8
04
Business Risk Report | Sept 2010
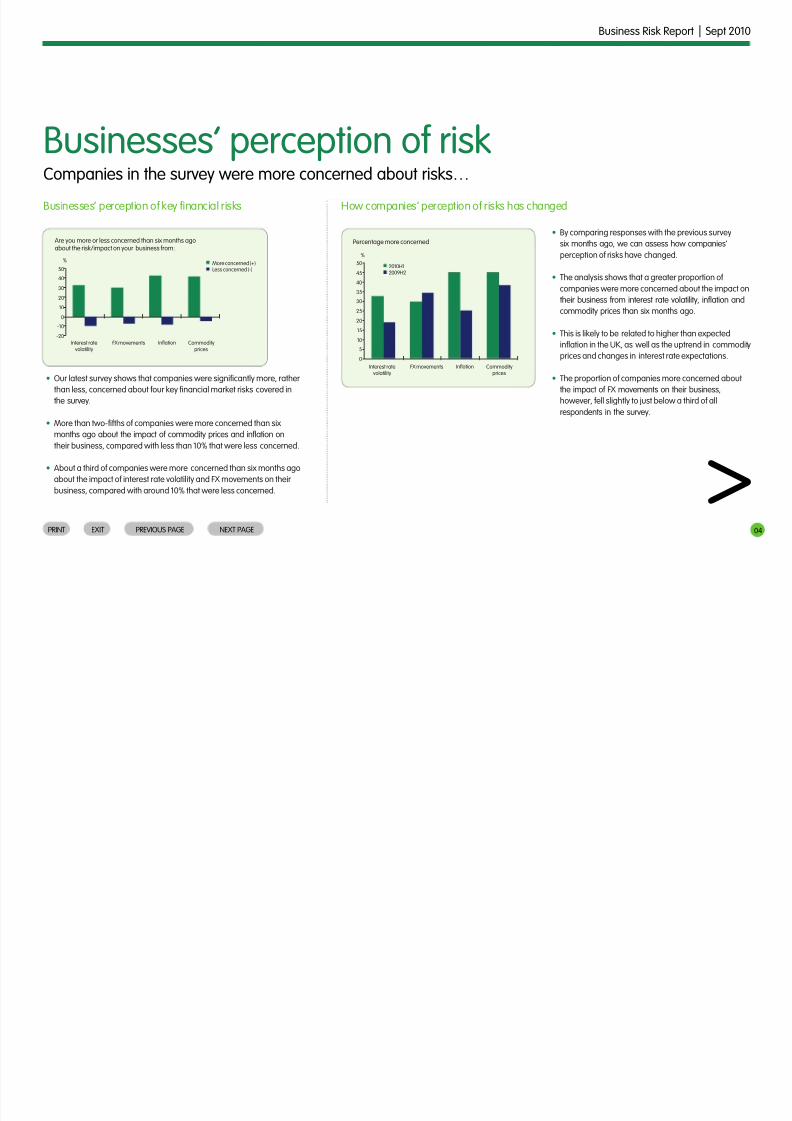
Companies in the survey were more concerned about risks…
Businesses’ perception of key nancial risks How companies’ perception of risks has changed
• Our latest survey shows that companies were signicantly more, rather
than less, concerned about four key nancial market risks covered in
the survey.
• More than two-fths of companies were more concerned than six
months ago about the impact of commodity prices and ination on
their business, compared with less than 10% that were less concerned.
• About a third of companies were more concerned than six months ago
about the impact of interest rate volatility and FX movements on their
business, compared with around 10% that were less concerned.
• By comparing responses with the previous survey
six months ago, we can assess how companies’
perception of risks have changed.
• The analysis shows that a greater proportion of companies were more concerned about the impact on
their business from interest rate volatility, ination and
commodity prices than six months ago.
• This is likely to be related to higher than expected
ination in the UK, as well as the uptrend in commodity
prices and changes in interest rate expectations.
• The proportion of companies more concerned about
the impact of FX movements on their business,
however, fell slightly to just below a third of all
respondents in the survey.
Businesses’ perception of risk
More concerned (+)Less concerned (-)
%
Are you more or less concerned than six months agoabout the risk/impact on your business from:
Interest ratevolatility
FX movements Inflation Commodityprices
0
-10
-20
40
30
20
10
502010H12009H2
%
Percentage more concerned
Interest ratevolatility
FX movements Inflation Commodityprices
10
5
0
30
25
20
15
35
40
45
50
>PRINT EXIT PREVIOUS PAGE NEXT PAGE
8/7/2019 business risk report
http://slidepdf.com/reader/full/-business-risk-report 5/8
05
Business Risk Report | Sept 2010
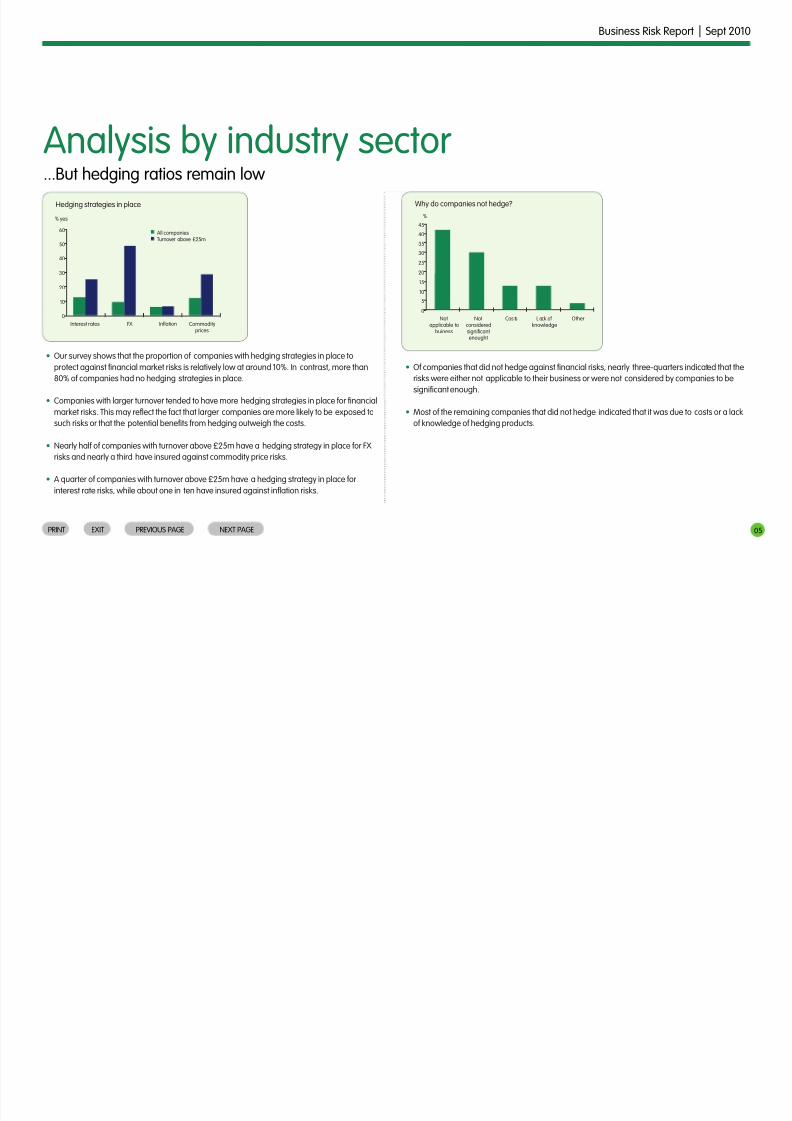
• Our survey shows that the proportion of companies with hedging strategies in place to
protect against nancial market risks is relatively low at around 10%. In contrast, more than
80% of companies had no hedging strategies in place.
• Companies with larger turnover tended to have more hedging strategies in place for nancial
market risks. This may reect the fact that larger companies are more likely to be exposed tosuch risks or that the potential benets from hedging outweigh the costs.
• Nearly half of companies with turnover above £25m have a hedging strategy in place for FX
risks and nearly a third have insured against commodity price risks.
• A quarter of companies with turnover above £25m have a hedging strategy in place for
interest rate risks, while about one in ten have insured against ination risks.
• Of companies that did not hedge against nancial risks, nearly three-quarters indicated that the
risks were either not applicable to their business or were not considered by companies to be
signicant enough.
• Most of the remaining companies that did not hedge indicated that it was due to costs or a lackof knowledge of hedging products.
All companiesTurnover above £25m
% yes
Hedging strategies in place
Interest rates FX Inflation Commodityprices
10
0
40
30
20
50
60
%
Why do companies not hedge?
Notapplicable to
buiness
Notconsideredsignificantenought
Cos ts L ack of knowledge
Other
10
5
0
30
25
20
15
35
40
45
...But hedging ratios remain lowAnalysis by industry sector
PRINT EXIT PREVIOUS PAGE NEXT PAGE
8/7/2019 business risk report
http://slidepdf.com/reader/full/-business-risk-report 6/8
06
Business Risk Report | Sept 2010
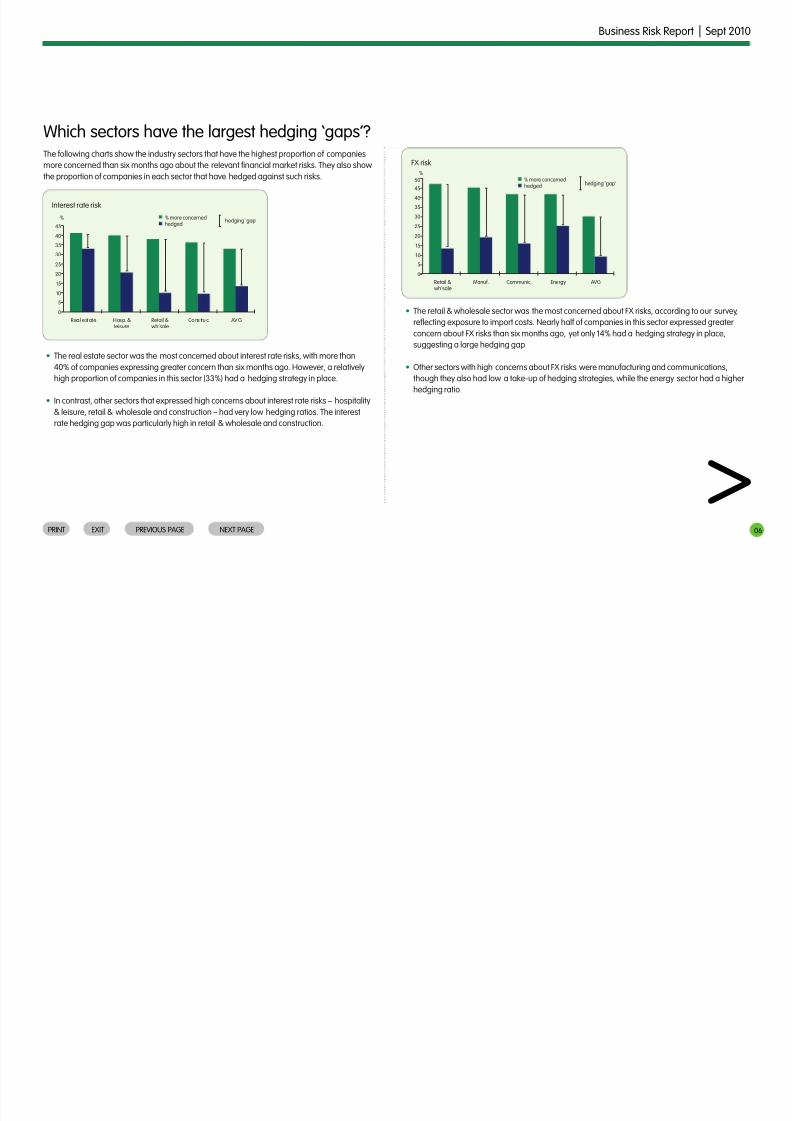
• The real estate sector was the most concerned about interest rate risks, with more than
40% of companies expressing greater concern than six months ago. However, a relatively
high proportion of companies in this sector (33%) had a hedging strategy in place.
• In contrast, other sectors that expressed high concerns about interest rate risks – hospitality
& leisure, retail & wholesale and construction – had very low hedging ratios. The interestrate hedging gap was particularly high in retail & wholesale and construction.
The following charts show the industry sectors that have the highest proportion of companies
more concerned than six months ago about the relevant nancial market risks. They also show
the proportion of companies in each sector that have hedged against such risks.
• The retail & wholesale sector was the most concerned about FX risks, according to our survey,
reecting exposure to import costs. Nearly half of companies in this sector expressed greater
concern about FX risks than six months ago, yet only 14% had a hedging strategy in place,
suggesting a large hedging gap.
• Other sectors with high concerns about FX risks were manufacturing and communications,
though they also had low a take-up of hedging strategies, while the energy sector had a higher
hedging ratio.
Which sectors have the largest hedging ‘gaps’?
>
%
Interest rate risk
Real estate Hosp. &leisure
Retail &wh’sale
Co ns tru c. AV G
10
5
0
30
25
2015
35
40
45
% more concernedhedged
hedging ‘gap’
%
FX risk
Retail &wh’sale
Manuf. Communic. Energy AVG
10
5
0
30
25
20
15
35
40
45
50 % more concernedhedged hedging ‘gap’
PRINT EXIT PREVIOUS PAGE NEXT PAGE
8/7/2019 business risk report
http://slidepdf.com/reader/full/-business-risk-report 7/8
07
Business Risk Report | Sept 2010
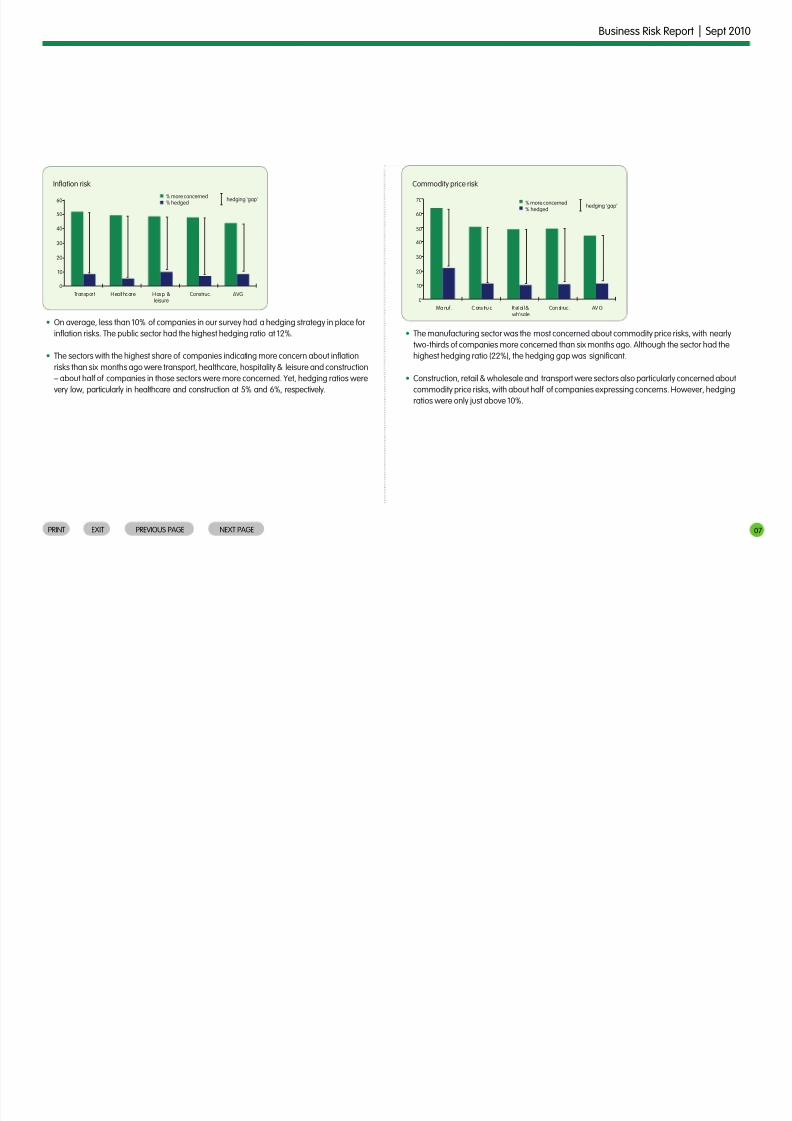
• On average, less than 10% of companies in our survey had a hedging strategy in place for
ination risks. The public sector had the highest hedging ratio at 12%.
• The sectors with the highest share of companies indicating more concern about ination
risks than six months ago were transport, healthcare, hospitality & leisure and construction
– about half of companies in those sectors were more concerned. Yet, hedging ratios were
very low, particularly in healthcare and construction at 5% and 6%, respectively.
• The manufacturing sector was the most concerned about commodity price risks, with nearly
two-thirds of companies more concerned than six months ago. Although the sector had the
highest hedging ratio (22%), the hedging gap was signicant.
• Construction, retail & wholesale and transport were sectors also particularly concerned about
commodity price risks, with about half of companies expressing concerns. However, hedging
ratios were only just above 10%.
Inflation risk
Transport Healthcare Hosp. &leisure
Construc. AVG
10
0
40
30
20
50
60% more concerned% hedged
hedging ‘gap’
Commodity price risk
Ma nuf . C ons tru c. R et ai l &wh’sale
Con st ruc . AV G
10
0
40
30
20
50
60
70% more concerned% hedged
hedging ‘gap’
PRINT EXIT PREVIOUS PAGE NEXT PAGE
8/7/2019 business risk report
http://slidepdf.com/reader/full/-business-risk-report 8/8
08
Business Risk Report | Sept 2010
About us Contact usLloyds TSB Corporate Markets’ Economic Research team
works in tandem with relationship and nancial markets
teams to provide analysis of issues impacting the economy
and business areas its customers operate in. The mission
of the team is to add value to customers, through superior
economic analysis and insightful research into nancial
markets and industrial sectors.
Our Financial Markets team provides solutions tobusinesses of varying size – from commercial through
to global corporations and nancial institutions. The
complexities of today’s volatile nancial markets mean
that businesses have an even greater need for a risk
management partner. Our Financial Markets experts take
a consultative approach and can provide you with a risk
strategy that includes FX, Ination, Interest Rates and
Commodity Solutions.
Sales and Derivatives Structuring
For information on how we can help you with yourrisk management strategies:
Kathryn Ball, Head of Large Corporate, Wholesale Markets
Email: [email protected]
Tel: 020 7158 1672
Matthew Lawrence, Head of Commercial, Wholesale Markets
Email: [email protected]
Tel: 020 7158 1661
Economic Research can be accessed online at:
lloydstsb.com/corporatemarkets
Business Risk Report is based on the responses of 2,386
companies surveyed via Lloyds TSB Commercial Business in Britain
June 2010 questionnaire.
Economic Research
More detailed analysis is availableon request from the author:
Hann-Ju Ho, Head of Sector Economics, Lloyds TSB Corporate
Markets Economic Research.
Email: [email protected]
Tel: 020 7158 1745
For additional copies of the Business Risk Report and queries:
Email: nancialmarketsdivision.economicresearch@
lloydsbanking.com
Lloyds TSB Corporate Markets is a trading name of Lloyds TSB Bank plc and Lloyds TSB Scotland plc. Lloyds TSB Bank plc. Registered Ofce: 25 Gresham Street,London EC2V 7HN. Registered in England and Wales no 2065. Lloyds TSB Scotland plc. Registered Ofce: Henry Duncan House, 120 George Street, Edinburgh EH2 4LHRegistered in Scotland no: 95237. Authorised and regulated by the Financial Services Authority.
Bank of the Year and Advisor of the year 2005, 2006, 2007, 2008, 2009 and 2010.
PRINT EXIT PREVIOUS PAGE