Embed Size (px)
Citation preview

c o n s o r t i u m
ALFA-GROUP
w w w . a l f a g r o u p . r u
w w w . a l f a g r o u p . o r g
A n n u a l R e p o r t
2 0 0 1


CONTENTS
S C S B D ......................
A G F H ..................................................................................
F R S D G......................................
A G’ I P .........................................................................
S B D ..................................................................................
A G’ C C ..................................................................................
A G’ P H ................................................................................
F S – Alfa Bank Group, AlfaInsurance............................................
O P – Tyumen Oil Company, SIDANCO Oil Company ......................
C T – Crown Resources AG, Alfa-Eco Group ............................
R T – Trade House Perekriostok ..............................................................
F P – United Food Company ..............................................................
T – Golden Telecom Inc, VimpelCom ....................................
S O C..............................................................................................
C I......................................................................................................
C F S G
R A ..........................................................................................
Alfa Group Consortium
Founded in , Alfa Group Consortium is one of Russia’s largest privatelyowned financial-industrial conglomerates with interests in oil, commodities trad-ing, commercial and investment banking, insurance, retail trade, food processing,and telecommunications. The Group typically focuses on value-oriented, longer-term opportunities, primarily in Russia and the CIS, but also invests in other mar-kets which form part of the Group's strategic business objectives.
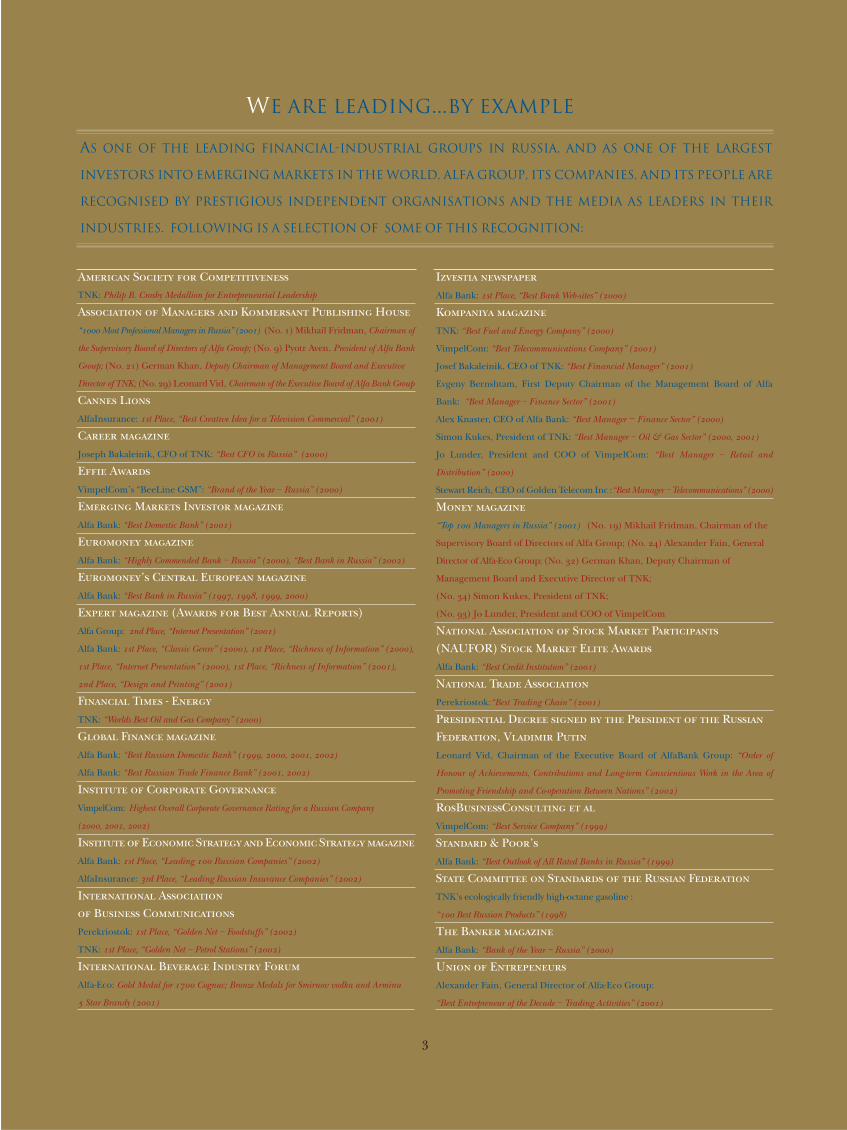
We ArE leading...by example
As one of the leading financial-industrial groups in Russia, and as one of the largest
investors into emerging markets in the world, Alfa Group, its companies, and its people are
recognised by prestigious independent organisations and the media as leaders in their
industries. Following is a selection of some of this recognition:
A S C TNK: Philip B. Crosby Medallion for Entrepreneurial Leadership
A M K P H “ Most Professional Managers in Russia” () (No. ) Mikhail Fridman, Chairman of
the Supervisory Board of Directors of Alfa Group; (No. ) Pyotr Aven, President of Alfa Bank
Group; (No. ) German Khan, Deputy Chairman of Management Board and Executive
Director of TNK; (No. ) Leonard Vid, Chairman of the Executive Board of Alfa Bank Group
C LAlfaInsurance: st Place, “Best Creative Idea for a Television Commercial” ()
C Joseph Bakaleinik, CFO of TNK: “Best CFO in Russia” ()
E A VimpelCom’s “BeeLine GSM”: “Brand of the Year – Russia” ()
E M I Alfa Bank: “Best Domestic Bank” ()
E Alfa Bank: “Highly Commended Bank – Russia” (), “Best Bank in Russia” ()
E’ C E Alfa Bank: “Best Bank in Russia” (, , , )
E (A B A R) Alfa Group: nd Place, “Internet Presentation” ()
Alfa Bank: st Place, “Classic Genre” (), st Place, “Richness of Information” (),
st Place, “Internet Presentation” (), st Place, “Richness of Information” (),
nd Place, “Design and Printing” ()
F T - E TNK: “Worlds Best Oil and Gas Company” ()
G F Alfa Bank: “Best Russian Domestic Bank” (, , , )
Alfa Bank: “Best Russian Trade Finance Bank” (, )
I C G VimpelCom: Highest Overall Corporate Governance Rating for a Russian Company
(, , )
I E S E S Alfa Bank: st Place, “Leading Russian Companies” ()
AlfaInsurance: rd Place, “Leading Russian Insurance Companies” ()
I A B CPerekriostok: st Place, “Golden Net – Foodstuffs” ()
TNK: st Place, “Golden Net – Petrol Stations” ()
I B I F Alfa-Eco: Gold Medal for Cognac; Bronze Medals for Smirnov vodka and Armina
Star Brandy ()
I Alfa Bank: st Place, “Best Bank Web-sites” ()
K TNK: “Best Fuel and Energy Company” ()
VimpelCom: “Best Telecommunications Company” ()
Josef Bakaleinik, CEO of TNK: “Best Financial Manager” ()
Evgeny Bernshtam, First Deputy Chairman of the Management Board of Alfa
Bank: “Best Manager – Finance Sector” ()
Alex Knaster, CEO of Alfa Bank: “Best Manager – Finance Sector” ()
Simon Kukes, President of TNK: “Best Manager – Oil & Gas Sector” (, )
Jo Lunder, President and COO of VimpelCom: “Best Manager – Retail and
Distribution” ()
Stewart Reich, CEO of Golden Telecom Inc :“Best Manager – Telecommunications” ()
M “Top Managers in Russia” () (No. ) Mikhail Fridman, Chairman of the
Supervisory Board of Directors of Alfa Group; (No. ) Alexander Fain, General
Director of Alfa-Eco Group; (No. ) German Khan, Deputy Chairman of
Management Board and Executive Director of TNK;
(No. ) Simon Kukes, President of TNK;
(No. ) Jo Lunder, President and COO of VimpelCom
N A S M P (NAUFOR) S M E A Alfa Bank: “Best Credit Institution” ()
N T A Perekriostok:“Best Trading Chain” ()
P D P RF, V P Leonard Vid, Chairman of the Executive Board of AlfaBank Group: “Order of
Honour of Achievements, Contributions and Long-term Conscientious Work in the Area of
Promoting Friendship and Co-operation Between Nations” ()
RBC VimpelCom: “Best Service Company” ()
S & P’ Alfa Bank: “Best Outlook of All Rated Banks in Russia” ()
S C S R F TNK’s ecologically friendly high-octane gasoline :
“ Best Russian Products” ()
T B Alfa Bank: “Bank of the Year – Russia” ()
U E Alexander Fain, General Director of Alfa-Eco Group:
“Best Entrepreneur of the Decade – Trading Activities” ()

STATEMENT BY THE CHAIRMAN OF THE SUPERVISORY BOARD OF DIRECTORSO ver the past year, the inevitable trend of Russia’s integration into the world
economy continued with increasing momentum. Russia and the west moved closer
together, finding common ground on various important issues. International sov-
ereign and corporate credit ratings continued to rise for well-run Russian compa-
nies providing them with increasing access to international capital markets and pri-
vate investment. In an uneven year for the world’s economies and stock markets,
Russia’s economy expanded and its stock markets thrived - with the exception of
the Chinese Shanghai B Index, Russia equities recorded the best US dollar return
of all emerging markets during 2001.
Alfa Group Consortium participated fully in these positive developments, with 2001
marking our second most profitable year ever with consolidated Group net profits of
US $797 million and correspondingly, our highest-ever consolidated Group sharehold-
ers’ equity of US $1.74 billion at 31 December 2001.
In the second half of 2001 we made our first significant investments into the “new
economy,” through the purchase of large stakes in US-listed Golden Telecom and
VimpelCom, on our belief that certain telecommunications shares in Russia, having
fallen in sympathy with battered world shares of technology and telecommunications
companies, offered compelling value. Although it’s early, and we expect a great deal of
value generation for the Group in the years to come, since making our initial invest-
ment a little more than one year ago, Golden Telecom’s ADR share price has risen by
18% and VimpelCom’s ADR share price has risen by 58% from our entry prices,
through the end of September 2002. In July 2002, we made further investment into
telecommunications by purchasing 16.2% of Kyivstar, Ukraine’s largest cellular com-
munication company, for US $66.5 million.
Despite tough world-wide credit conditions during the latter half of 2001 and through-
out 2002, improving fundamentals in our companies have helped us to attract longer
and more stable financing and investment. Notably, VimpelCom floated US $250 mil-
STATEMENT BY THE CHAIRMANOF THE SUPERVISORY BOARD
OF DIRECTORS
S T A T E M E N T B Y T H E C H A I R M A N O F T H E S U P E R V I S O R Y B O A R D O F D I R E C T O R S
lion in three year Eurobonds. Additionally, TNK and Alfa Bank are actively considering
possible medium-term Eurobond offerings.
Also, during 2002, we made two key sales of our investments – in September 2002 we
entered into agreements to sell the full interest in our food processing business, United
Food Company to a strategic investor for US $80 million and in April 2002 we further
strengthened our co-operation with British Petroleum through the sale of a 15% stake
in oil and gas company, SIDANCO for US $375 million.
On the belief that re-investment of our profits is the best and highest use of our capital,
we continued to re-invest large portions of profit back into all of our companies, pay-
ing out 12% of year 2000 net profits as dividends and a minimal amount of 2001 net
profits as dividends. In addition, we injected fresh capital into three of our businesses
during 2001 and 2002 – US $56.4 million into Alfa Bank, US $12.2 million into Alfa-Eco,
and committed to funding of US $30 million for Perekriostok.
As we move beyond 2002 it is clear to us that the consolidation of assets in the Russian
marketplace will continue with the increasing participation of foreign investors. It fol-
lows, that the ability to co-operate successfully with foreign partners will become an
increasingly critical factor in determining the future success of Russian financial-indus-
trial conglomerates. We believe that the strength and depth of the management at our
companies, our strong leadership position and reputation on the marketplace, our
demonstrated commitment to the highest levels of transparency and governance prin-
ciples, and our already extensive and successful co-operation with foreign partners
place us in an advantageous position to fully avail ourselves of the most interesting
opportunities which will present themselves.
I wish to express my personal appreciation to all of our clients and business partners
whose continued confidence and support are key to our growth and profitability.
I would also like to thank our employees whose professionalism, dedication and ability
to meet the tough challenges we set for them, have made us all proud.
Mikhail Fridman
8 October 2002
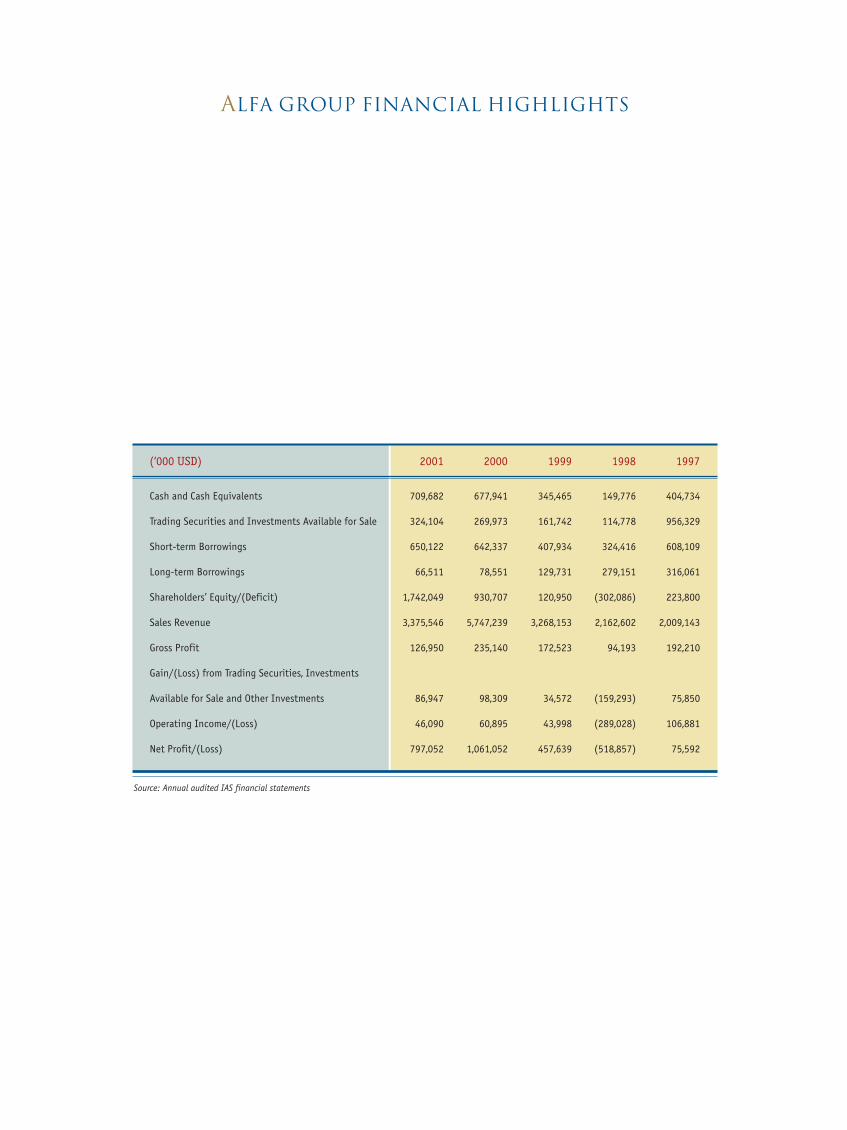
Cash and Cash Equivalents 709,682 677,941 345,465 149,776 404,734
Trading Securities and Investments Available for Sale 324,104 269,973 161,742 114,778 956,329
Short-term Borrowings 650,122 642,337 407,934 324,416 608,109
Long-term Borrowings 66,511 78,551 129,731 279,151 316,061
Shareholders’ Equity/(Deficit) 1,742,049 930,707 120,950 (302,086) 223,800
Sales Revenue 3,375,546 5,747,239 3,268,153 2,162,602 2,009,143
Gross Profit 126,950 235,140 172,523 94,193 192,210
Gain/(Loss) from Trading Securities, Investments
Available for Sale and Other Investments 86,947 98,309 34,572 (159,293) 75,850
Operating Income/(Loss) 46,090 60,895 43,998 (289,028) 106,881
Net Profit/(Loss) 797,052 1,061,052 457,639 (518,857) 75,592
(‘000 USD) 2001 2000 1999 1998 1997
ALFA GROUP FINANCIAL HIGHLIGHTS
Source: Annual audited IAS financial statements
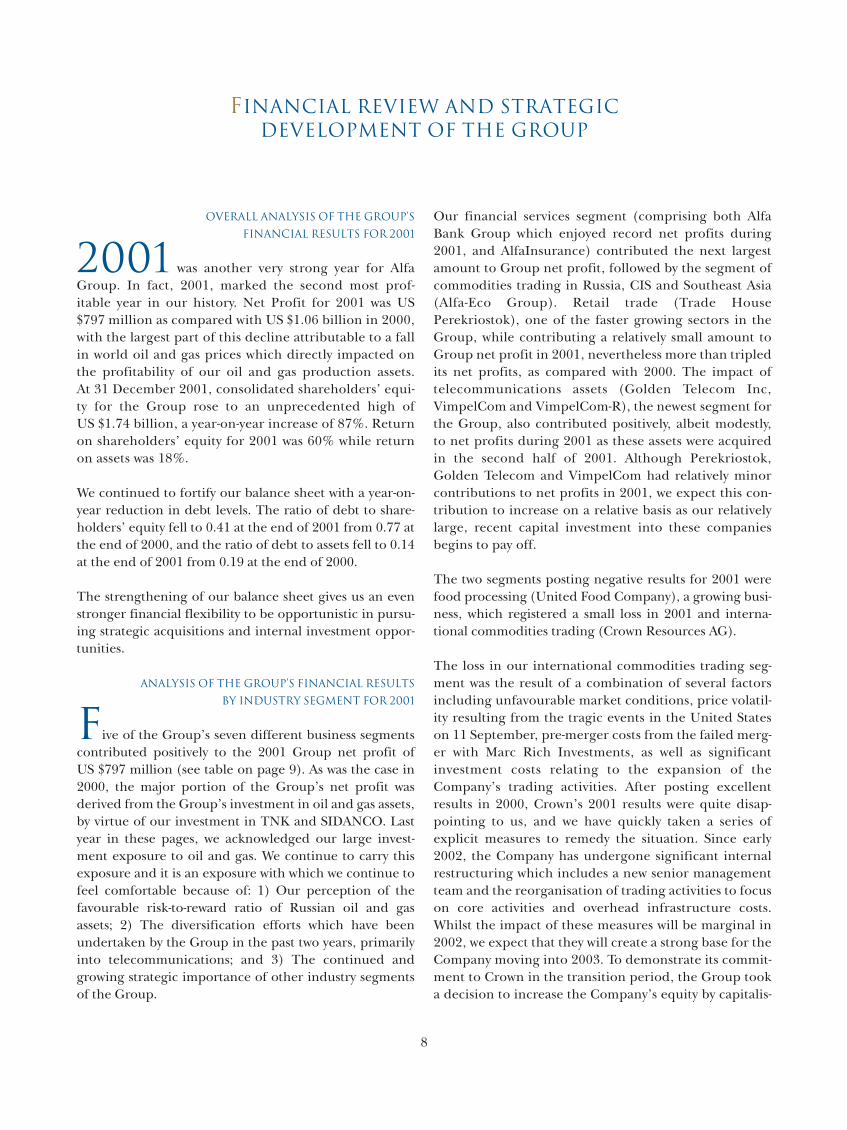
Overall Analysis of the Group’s
Financial Results for 2001
2001 was another very strong year for AlfaGroup. In fact, 2001, marked the second most prof-itable year in our history. Net Profit for 2001 was US$797 million as compared with US $1.06 billion in 2000,with the largest part of this decline attributable to a fallin world oil and gas prices which directly impacted onthe profitability of our oil and gas production assets.At 31 December 2001, consolidated shareholders’ equi-ty for the Group rose to an unprecedented high ofUS $1.74 billion, a year-on-year increase of 87%. Returnon shareholders’ equity for 2001 was 60% while returnon assets was 18%.
We continued to fortify our balance sheet with a year-on-year reduction in debt levels. The ratio of debt to share-holders’ equity fell to 0.41 at the end of 2001 from 0.77 atthe end of 2000, and the ratio of debt to assets fell to 0.14at the end of 2001 from 0.19 at the end of 2000.
The strengthening of our balance sheet gives us an evenstronger financial flexibility to be opportunistic in pursu-ing strategic acquisitions and internal investment oppor-tunities.
Analysis of the Group’s Financial Results
by Industry Segment for 2001
Five of the Group’s seven different business segmentscontributed positively to the 2001 Group net profit ofUS $797 million (see table on page 9). As was the case in2000, the major portion of the Group’s net profit wasderived from the Group’s investment in oil and gas assets,by virtue of our investment in TNK and SIDANCO. Lastyear in these pages, we acknowledged our large invest-ment exposure to oil and gas. We continue to carry thisexposure and it is an exposure with which we continue tofeel comfortable because of: 1) Our perception of thefavourable risk-to-reward ratio of Russian oil and gasassets; 2) The diversification efforts which have beenundertaken by the Group in the past two years, primarilyinto telecommunications; and 3) The continued andgrowing strategic importance of other industry segmentsof the Group.
Our financial services segment (comprising both AlfaBank Group which enjoyed record net profits during2001, and AlfaInsurance) contributed the next largestamount to Group net profit, followed by the segment ofcommodities trading in Russia, CIS and Southeast Asia(Alfa-Eco Group). Retail trade (Trade HousePerekriostok), one of the faster growing sectors in theGroup, while contributing a relatively small amount toGroup net profit in 2001, nevertheless more than tripledits net profits, as compared with 2000. The impact oftelecommunications assets (Golden Telecom Inc,VimpelCom and VimpelCom-R), the newest segment forthe Group, also contributed positively, albeit modestly,to net profits during 2001 as these assets were acquiredin the second half of 2001. Although Perekriostok,Golden Telecom and VimpelCom had relatively minorcontributions to net profits in 2001, we expect this con-tribution to increase on a relative basis as our relativelylarge, recent capital investment into these companiesbegins to pay off.
The two segments posting negative results for 2001 werefood processing (United Food Company), a growing busi-ness, which registered a small loss in 2001 and interna-tional commodities trading (Crown Resources AG).
The loss in our international commodities trading seg-ment was the result of a combination of several factorsincluding unfavourable market conditions, price volatil-ity resulting from the tragic events in the United Stateson 11 September, pre-merger costs from the failed merg-er with Marc Rich Investments, as well as significantinvestment costs relating to the expansion of theCompany’s trading activities. After posting excellentresults in 2000, Crown’s 2001 results were quite disap-pointing to us, and we have quickly taken a series ofexplicit measures to remedy the situation. Since early2002, the Company has undergone significant internalrestructuring which includes a new senior managementteam and the reorganisation of trading activities to focuson core activities and overhead infrastructure costs.Whilst the impact of these measures will be marginal in2002, we expect that they will create a strong base for theCompany moving into 2003. To demonstrate its commit-ment to Crown in the transition period, the Group tooka decision to increase the Company’s equity by capitalis-
FINANCIAL REVIEW AND STRATEGIC DEVELOPMENT OF THE GROUP
ing approximately USD $48 million of a subordinatedloan from the ultimate parent Company of the AlfaGroup.
Continued Development
of Our Existing Core Businesses
Given our confidence in the attractiveness of our exist-ing core investments, we have taken the view that re-invest-ment of a significant portion of the Group’s earnings is thehighest and best use of our capital. Of the US $1.85 billion
in net profit earned over the past two years virtually all hasbeen re-invested into the Group’s companies. In fact, onlyUS $133 million or 7% of the past two years’ combined netprofits has been paid out as dividends.
During 2001 and 2002, we injected fresh capital into ourcore businesses including: US $56.4 million equity contri-bution into Alfa Bank Group in order to further strength-en its balance sheet for expected continued growth in keylines of business including lending, the development of itsbranch network, and the expansion of its presence into the
United States and Netherlands; US $12.2 million into Alfa-Eco in order to partially fund various investment pro-grams; and committed to an equity investment of US $30million in order to fund Perekriostok’s aggressive super-market expansion program.
Throughout 2001 and H1 2002, TNK was been busy re-investing a large portion of its profits and debt financinginto its business and infrastructure including: US $100 mil-lion modernisation of the Ryazan refinery completed withthe assistance of ABB Lummus Global; contracting with
Parker Drilling in order to improve the effectiveness andoverall efficiency of drilling; the consolidation of a key sub-sidiary in Orenburg; and the hiring of several highly skilledprofessionals in the upstream side of their business. Othernotable achievements and strategic initiatives included anagreement to sell significant tonnage of crude oil to a sub-sidiary of British Petroleum (“BP”) over a ten year period,continued co-operation with Halliburton in order toimprove the efficiency of upstream production, and meas-urable progress in further integrating of TNK’s US $1.08 bil-lion investment in Onako Oil Company in 2000.
F I N A N C I A L R E V I E W A N D S T R A T E G I C D E V E L O P M E N T O F T H E G R O U P
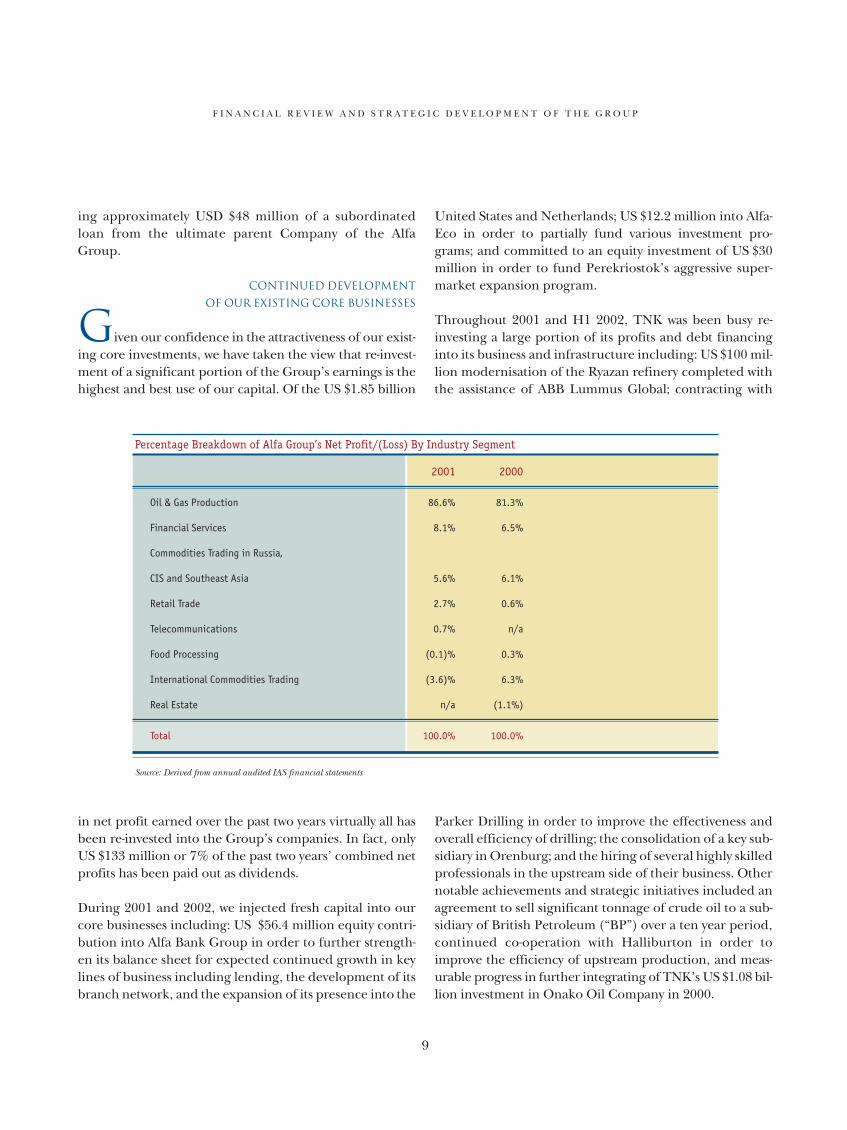
Oil & Gas Production 86.6% 81.3%
Financial Services 8.1% 6.5%
Commodities Trading in Russia,
CIS and Southeast Asia 5.6% 6.1%
Retail Trade 2.7% 0.6%
Telecommunications 0.7% n/a
Food Processing (0.1)% 0.3%
International Commodities Trading (3.6)% 6.3%
Real Estate n/a (1.1%)
Total 100.0% 100.0%
Source: Derived from annual audited IAS financial statements
2001 2000
Percentage Breakdown of Alfa Group’s Net Profit/(Loss) By Industry Segment
In June 2001, AlfaInsurance expanded its presence in theinsurance market by purchasing 98.1% of VESTA, one ofthe leading insurance companies in Russia, for US $6 mil-lion. Additionally, over the past 1.5 years, AlfaInsurancehas undertaken an aggressive expansion program andadvertising campaign which successfully leverages the“Alfa” name. Importantly, we have recently created andfilled a number of key management positions in anticipa-tion of the rapid growth in this industry.
Despite tough world-wide credit conditions VimpelComwas able to successfully access international debt marketsin April 2002, raising US $250 million in a three yearEurobond issue (yield 10.45%). Also, TNK and Alfa Bankare actively considering possible medium-term Eurobondofferings in the second half of 2002.
Disciplined InvestMENT Into New Businesses
During 2000 and 2001 the share prices ofRussian/CIS telecommunications companies fell in sym-pathy with stock prices of world technology and telecom-munications shares. Our belief that this fall in share priceswas not representative of the intrinsic value in these com-panies, coupled with our conviction that Russia/CIStelecommunications assets would experience tremendousgrowth over the next several years, convinced us thatassets in this sector represented a compelling value.
Our first investment into telecommunications wascompleted in March 2001 when we invested US $110million for a 43.8% stake of US-listed Golden TelecomInc, an integrated telecommunications and Internetcompany operating throughout Russia and the CIS. Weinvested alongside Baring Vostok Capital Partners,Capital International Inc, both investment managersof international private equity funds, and theEuropean Bank for Reconstruction and Development.Since our investment, through the end of September2002, Golden’s ADR share price has risen by 18%.Over the past 1.5 years, Golden has been busy pursuinga shareholder value enhancing strategy of optimisingits ownership in key operating subsidiaries for the pur-pose of consolidating tactical and strategic control. Inthis regard, Golden concluded a key deal in March2002 for the purchase of 50% of shares of Sovintel, aleading Russian telecommunications company, fromRostelecom, thereby raising Golden’s ownership inter-est to 100%.
In May 2001, Alfa-Eco Group completed a US $246.8 milliontransaction for a blocking voting stake (25% + 1 share) ofUS-listed VimpelCom and VimpelCom-Region, leadingproviders of wireless telecommunications services inMoscow and Russia’s regions. We invest alongside Telenor, aNorwegian telecommunications Group. Our investment isspecifically for the network build-out and infrastructuredevelopment in Russia’s regions. Since May 2001,VimpelCom-R has made notable progress expanding active-ly into Russia’s regions, having secured licenses to operatein Siberia, Volga River area, Central Russia, and theNorthern Caucuses, the rights to which cover 16 majorcities. VimpelCom’s ADR share price has risen by 58% sinceour initial investment through the end of September 2002.
In July 2002, we made further investment into telecommu-nications by purchasing 16.2% of Kyivstar for US $66.5 mil-lion. Kyivstar, having a subscriber base of more than 2.6 mil-lion users, is one of the largest cellular communicationsproviders in Ukraine. We believe that the Ukraine marketoffers strong growth opportunities as the rate of mobilepenetration is relatively low at 5.3% and expect the pene-tration rate to reach 16% by 2004.
Our three investments into Golden, VimpelCom andKyivstar make Alfa Group one of the most significant pri-vate investors into the telecommunications sector inRussia and CIS.
Apart from telecommunications, another major invest-ment in 2001 was made by Alfa-Eco Group, who togetherwith an equal joint-venture partner, acquired just under93% of Volga, the largest manufacturer of newsprint inRussia, for US $68.1 million.
Divestiture of Group Assets
and Other Transactions
From time to time, we take the decision to exit certainof our investments. As investors, divestiture allows us tofocus our resources and management attention on invest-ments of strategic relevance to the Group, and important-ly, realise profits from our efforts. We make these deci-sions, typically, for the following reasons:
• We no longer view the investment as strategic to theGroup;
• We have identified higher-return opportunities in otherindustry segments;
F I N A N C I A L R E V I E W A N D S T R A T E G I C D E V E L O P M E N T O F T H E G R O U P

F I N A N C I A L R E V I E W A N D S T R A T E G I C D E V E L O P M E N T O F T H E G R O U P
• We are able to exit our investment under terms which weconsider to be attractive
In mid-2001, after undertaking a critical review of the cur-rent competitive position of Alfa-Development, we took adecision that real estate investment and development wasnot strategic to the Group and should no longer form partof the Group’s core activities. Accordingly, it was decidedto liquidate Alfa-Development and transfer two of theuncompleted projects to Alfa Bank Group and sell theremaining project.
In August 2001 we reached a final, amicable settlementwith BP and other parties in the matters with respect toTNK-Nizhnevartovsk (formerly, Chernogorneft),SIDANCO’s main production subsidiary. TNK-Nizhnevartovsk was returned to SIDANCO and BP wasgiven day-to-day management control of SIDANCO for atleast a three year period. In April 2002, we furtherstrengthened our co-operation with BP through the saleof a 15% stake in SIDANCO for US $375 million, bringingBP’s total stake to 25% + 1 share. Together with our equaljoint venture partner, we control an approximate 57%stake in SIDANCO.
In April 2001, we merged our sugar business,Kubansakhar, with Intec Group’s sugar and grain busi-ness, creating United Food Company in order to takeadvantage of definite synergies between the companies.The merger gave us certain competitive advantages andunquestionably was a case where the whole was greaterthan the sum of the individual parts. In September 2002,after receiving multiple attractive offers for UFC fromstrategic investors and competitors, we took a decisionto sell our entire stake in UFC, by selling separately,
UFC’s sugar and the grain businesses to a private strate-gic investor for US $80 million.
Looking AHEAD
Moving beyond 2002, we see further consolidationof business in Russia and in the other emerging marketsin which we operate. To be sure, a good deal of this con-solidation will involve the participation of foreigninvestors. We have anticipated the current re-emergenceof foreign interest in Russia and the CIS and view co-operation with foreign investors as essential to thedevelopment of our companies and as a logical andattractive means of exiting our investments. It’s not acci-dental that our companies have a long history of co-operating extensively, and successfully with bothRussian and foreign partners.
There are three main factors which are responsible forour position on the marketplace today and we are certainthat these same three factors will continue to play an influ-ential role in our continued success:
• We are unyielding in our commitment to hiring the bestavailable professional talent;
• We steadfastly adhere to our investment philosophy(page 12-13);
• We have repeatedly demonstrated, through our actions,our strong commitment to the highest levels of trans-parency and governance principles.
Early indications suggest that 2002 promises to be anotherexcellent year. We remain confident in the long-term suc-cess of the Group and are making extensive preparationsto secure an even more successful future for the Group.
WE ARE OPPORTUNISTIC INVESTORS.
SIMPLY STATED, WE ARE VALUE-ORIENTED INVESTORS. IN EVALUATING ANY INVESTMENT
OPPORTUNITY, OUR INVESTMENT PHILOSOPHY IS DRIVEN BY THE OPPORTUNITY TO PUR-
CHASE ASSETS THAT, DUE TO PERCEIVED RISK, LOW LIQUIDITY, DISINTEREST OR A LACK OF
UNDERSTANDING ON THE PART OF MARKET PARTICIPANTS, ARE UNDERVALUED.
WE BELIEVE THE MOST ATTRACTIVE OPPORTUNITIES ARE IN WORLD EMERGING MARKETS.
MUCH OF OUR PAST SUCCESS HAS BEEN THE RESULT OF OUR INTIMATE KNOWLEDGE AND
UNDERSTANDING OF THE RUSSIAN AND CIS MARKETS. WE BELIEVE THERE ARE STILL SUBSTAN-
TIAL OPPORTUNITIES IN THESE EMERGING MARKETS AND THAT WE ARE WELL PLACED TO
TAKE FULL ADVANTAGE OF THEM.
WE ARE INTERESTED IN INVESTMENTS OVER WHICH WE CAN EXERCISE CONTROL.
WE MAKE INVESTMENTS ON THE BASIS THAT WE WILL HAVE EITHER MAJORITY OR JOINT CON-
TROL, THROUGH SHARE OWNERSHIP, BOARD REPRESENTATION, OR BOTH. NON-CONTROLLED
INVESTMENTS ARE NOT ATTRACTIVE TO US BECAUSE THE LACK OF CONTROL MAKES IT DIFFI-
CULT TO GUIDE THE DEVELOPMENT OF THESE COMPANIES AND MAXIMISE SHAREHOLDER
VALUE. JOINT CONTROL IS ACCEPTABLE IN CASES WHERE THE JOINT VENTURE PARTNER IS RELI-
ABLE AND BRINGS EXPERIENCE OR SKILLS THAT COMPLEMENT OUR OWN, OR SHARES FUNDING
OBLIGATIONS AND RISKS, WHICH DUE TO THEIR SIZE OR NATURE, WE WISH TO SHARE.
WE TYPICALLY TAKE A LONGER-TERM VIEW, IN ORDER TO REALISE THE FULL POTENTIAL
OF OUR INVESTMENTS.
THE LACK OF LIQUIDITY OF EMERGING MARKET ASSETS MAKES ANY EXIT STRATEGY TENU-
OUS. IN RUSSIA AND THE CIS IN PARTICULAR, THE LACK OF LIQUIDITY IS PERVASIVE, WHICH
WE HAVE REMAINED FAITHFUL TO A BASIC, YET SUCCESSFUL
INVESTMENT PHILOSOPHY WHICH HAS SERVED US WELL FOR MORE THAN
YEARS. WE CONTINUE TO BELIEVE THAT MUCH OF OUR FUTURE SUC-
CESS WILL BE ROOTED FIRMLY IN THIS INVESTMENT PHILOSOPHY:
ALFA GROUP’S INVESTMENT PHILOSOPHY

PLACES IT OUTSIDE OUR DIRECT CONTROL. UNLESS WE WISH TO SELL OUR ASSETS AT
EXTREMELY UNDERVALUED PRICES, WE MUST USE THIS TIME TO DEVELOP THESE ASSETS AND
GUIDE THE COMPANY TO CLOSE THE VALUE GAP. WHILE WE DO NOT PARTICULARLY WEL-
COME THE INFLEXIBILITY OF BEING WED TO AN INVESTMENT FOR THE LONGER TERM, WE
LOWER OUR RISKS BY SEEKING UNDERVALUED INVESTMENTS THAT PROVIDE AMPLE DOWN
SIDE PROTECTION AND, AS FAR AS POSSIBLE, INTERIM CASH FLOWS.
WE VIEW CO-OPERATION WITH FOREIGN INVESTORS AND THE ATTRACTION OF FOREIGN CAPITAL AS IMPORTANT
TO THE DEVELOPMENT OF OUR COMPANIES.
THE NEED TO ATTRACT FOREIGN INVESTMENT IS BECOMING INCREASINGLY CRITICAL.
FOREIGN INVESTORS PROVIDE NOT ONLY CAPITAL INVESTMENT, BUT ALSO THE EXPERTISE,
CREDIBILITY AND ADVANCEMENT OF REPUTATION WHICH IS NEEDED TO SUCCESSFULLY
DEVELOP AND REALISE THE FULL VALUE OF OUR INVESTMENTS. WE ARE FULLY AWARE THAT
THE FAILURE TO ATTRACT LONGER-TERM FOREIGN INVESTMENT WILL RESULT IN UNDER-
DEVELOPED ASSETS AND MISSED BUSINESS OPPORTUNITIES.
WE DO NOT CONSIDER OURSELVES EXPERTS IN MANAGING AND OPERATING
THE COMPANIES THAT WE OWN.
FIRST AND FOREMOST WE ARE INVESTORS, NOT BUSINESS MANAGERS –WE LEAVE THE DAY-TO-
DAY MANAGEMENT AND OPERATING DECISIONS OF OUR COMPANIES TO PROFESSIONAL, COM-
PETENT MANAGEMENT WITH INDUSTRY EXPERIENCE. OUR COMPANIES ARE INDEPENDENT
ENTITIES AND ARE GIVEN FAIRLY WIDE LATITUDE TO CONDUCT THEIR AFFAIRS. HOWEVER, WE
ACTIVELY ADVISE AND TAKE DECISIONS ON IMPORTANT STRATEGIC MATTERS THAT HAVE AN
IMPACT ON THE SHAREHOLDER VALUE OF OUR COMPANIES. WE ALSO CONTINUALLY EVALUATE
MANAGEMENT AND MEASURE THE FINANCIAL PERFORMANCE OF OUR INVESTMENTS.
WE ARE GUIDED BY THE PHILOSOPHY OF INVESTING IN ONLY THOSE COMPANIES THAT ARE LEADERS
IN THEIR RESPECTIVE FIELDS OF BUSINESS.
WE REQUIRE THOSE IN WHICH WE INVEST TO BE ONE OF THE TOP THREE IN THEIR BUSINESS
FIELD OR WITH A CLEAR POTENTIAL TO BECOME ONE OF THE TOP THREE WITHIN A REASON-
ABLE PERIOD. WHERE WE SEE THAT OUR INVESTMENTS ARE NOT MEETING THIS CRITERION,
WE TAKE ACTIVE MEASURES TO DIVEST AND FREE UP OUR FINANCIAL AND MANAGEMENT
RESOURCES FOR MORE EFFECTIVE INVESTMENTS.
A L F A G R O U P ’ S I N V E S T M E N T P H I L O S O P H Y
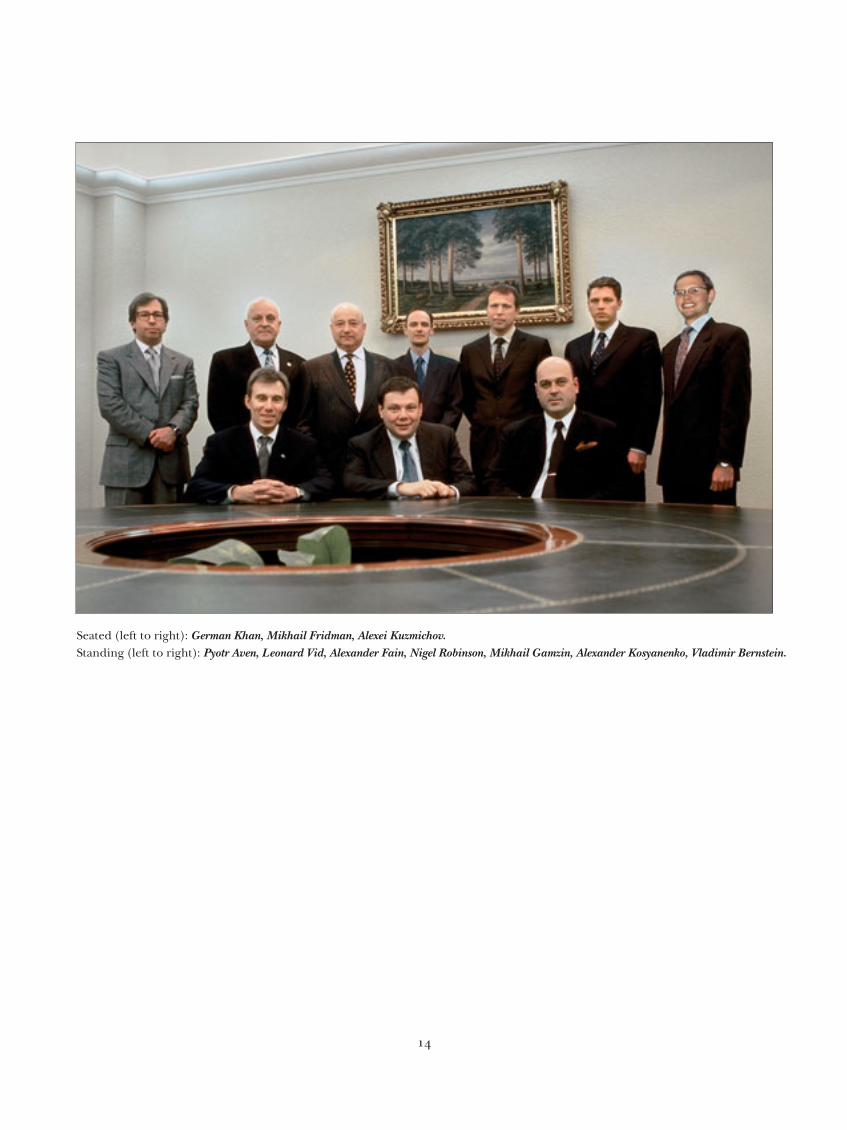
Seated (left to right): German Khan, Mikhail Fridman, Alexei Kuzmichov. Standing (left to right): Pyotr Aven, Leonard Vid, Alexander Fain, Nigel Robinson, Mikhail Gamzin, Alexander Kosyanenko, Vladimir Bernstein.

The Supervisory Board of Directors of Alfa Group guides and co-ordinates thestrategic development of Alfa Group and its companies. The Board, which meets twicea month, consists of a total of 10 senior executive and senior non-executive directorswho are primarily drawn from the main companies of the Group. These directors pro-vide different important insights into political, economic and industry developmentsin Russia and internationally.
The Supervisory Board considers the most important matters concerning the strategicdevelopment of the Group and the management of its businesses and serves as a con-duit for the senior management of the Group to share ideas and resolve issues in a co-ordinated manner. The most important issues include the clarification and develop-ment of the overall business strategy for the Group’s companies, the criticalevaluation of company performance, the formal review of significant transactionsbefore they are undertaken, and the establishment of strong mechanisms of corporategovernance and controls.
German KHAN . . . . . . . . . .Chairman of Management Board and Executive Director of TNK
Mikhail FRIDMAN . . . . . . . . .Chairman of the Supervisory Board of Alfa Group Consortium
Alexei KUZMICHOV . . . . . . . . . . . . . . . . . . .Chairman of the Board of Crown Resources AG
Pyotr AVEN . . . . . . . . . . . . . . . . . . . . . . . . . . . . . . . . . . . . . . . .President of Alfa Bank Group
Leonard VID . . . . . . . . . . . . . . . . . . . .Chairman of the Executive Board of Alfa Bank Group
Alexander FAIN . . . . . . . . . . . . . . . . . . . . . . . . . . . . . . . .General Director of Alfa-Eco Group
Nigel ROBINSON . . . .Director of Corporate Development, Finance and Control - Alfa Group
Mikhail GAMZIN . . .Member of the Board and Chief Executive Officer of United Food Company
Alexander KOSYANENKO . . . . . . . . . . .Chief Executive Officer of Trade House Perekriostok
Vladimir BERNSTEIN . . . . . . . .Director of Strategic and Investment Planning - Alfa Group
SUPERVISORY BOARD OF DIRECTORS

Since its establishment in May 1996, CTF Holdings Ltd(“CTF”), the ultimate holding company of the AlfaGroup, has effectively served as the Group’s corporatecentre. The corporate centre’s team of professional staffreports directly to the Supervisory Board of Directorsthrough the Director for Corporate Development,Finance & Control.
The Supervisory Board of Directors has vested theGroup’s corporate centre with wide-ranging responsibilityand authority to carry out numerous holding companyand corporate centre functions – some of which are tradi-tional and some of which have been specifically tailored totake into account the peculiarities of Russia and therequirements of the Group. Although the corporate cen-tre’s functions vary widely in scope, they can generally besummarised as:
• Decision-making and implementation support to theSupervisory Board of Directors;
• Direct assistance to the companies forming the Group; • Development and maintenance of strong formal mecha-
nisms of corporate and strategy development, invest-ment planning and control for the benefit of the com-panies forming the Group and for the Group as a whole.
More specifically, the primary functions of the Group’scorporate centre include setting Group wide accountingpolicy, the review and approval of quarterly companyaccounts prepared under International AccountingStandards, preparation of Group annual consolidated IASaccounts, and providing assistance to our companies inrecruiting qualified finance, accounting and other key per-sonnel. Responsibilities also extend to control over thedevelopment of an efficient Group-wide ownership struc-ture, the maintenance and enforcement of the Group’scorporate statute which defines and regulates decisionmaking within the Group, and improving all aspects ofoverall functioning of the effectiveness of our companies’Boards of Directors including the recruitment of qualifiedindependent, non-executive directors. Additionally, the
corporate centre is also responsible for other initiativesincluding the development of the Group’s corporate web-site, the production of the Group annual report as well asother public relations and marketing initiatives in co-oper-ation with the Group’s companies.
At the end of 2001, we created several new functions in thecorporate centre in the areas of business strategy, invest-ment planning, improvement of business processes, andthe critical review and development of IT strategy for theGroup and its companies. Some of the specific undertak-ings in these areas to date include the standardisation ofprocedures for analysis, modeling and presentation ofinvestment projects across all Group companies, theintroduction of protocols and procedures for investmentcommittees, and the critical evaluation of our companies’strategies. Also, IT related projects have included the crit-ical review and development of an effective, sustainableIT strategy at each company and for the Group as a whole,as well as the organisation and leading of the IT ExpertCommittee which effectively transfers IT expertise andknowledge between Group companies.
Well before it became fashionable, the Alfa Group recog-nised the importance of adopting western standards ofcorporate development and controls. In taking the longview, it became very clear to us that future shareholdervalue would be sacrificed if we did not act decisively andaggressively to develop strong governance mechanisms forthe Group.
We are proud of the progress that we have made since theformal establishment of our corporate centre, and aretoday reaping the benefits of our efforts. However we haveno illusions. We appreciate the realities and difficulties ofthe Russian marketplace and realise that the developmentof strong governance mechanisms for our Group is an evo-lutionary process. We are determined to meet this chal-lenge and realise our ambition of staying ahead of therequirements of the market and the expectations of ourstakeholders.
ALFA GROUP’S CORPORATE CENTRE

Alfa Group’s Principal Holdings
2001 was the eleventh year of Alfa Bank’s suc-cessful operation in the Russian and international finan-cial markets. Although years is not a long period whenjudged against the history of some international banks, itis nevertheless a noteworthy achievement in post-SovietRussia.
During and , Alfa Bank continued to receiveaccolades in the financial media both domestically andinternationally. Alfa Bank was nominated for a GoldenDiploma of the Financial Press Club for informationalopenness. Also, in , Global Finance, an influentialUS business journal, named Alfa Bank “Best Russian
Domestic Bank” for the fourth consecutive year and“Best Russian Trade Finance Bank” for the second con-secutive year.
During the leading international credit rating agen-cies (Moody’s, Standard & Poor’s, and Fitch IBCA)increased the Bank’s rating, some of them up to a levelclose to Russian sovereign ratings.
Financial Highlights
A lfa Bank’s net profits increased to US $. millionin , a .% increase on and total assets grew
FINANCIAL SERVICES
Alfa Bank
Founded in , Alfa Bank has developed rapidly to become Russia’s largest privately
owned bank. It provides a full range of banking services — comercial banking, investment
banking, asset management, securities trading, trade finance and leasing. The Bank has
the second largest branch network in Russia over nine time zones in Russia, Ukraine and
Kazakhstan, as well as subsidiaries in the United Kingdom, the United States and the
Netherlands.
www.alfabank.ru
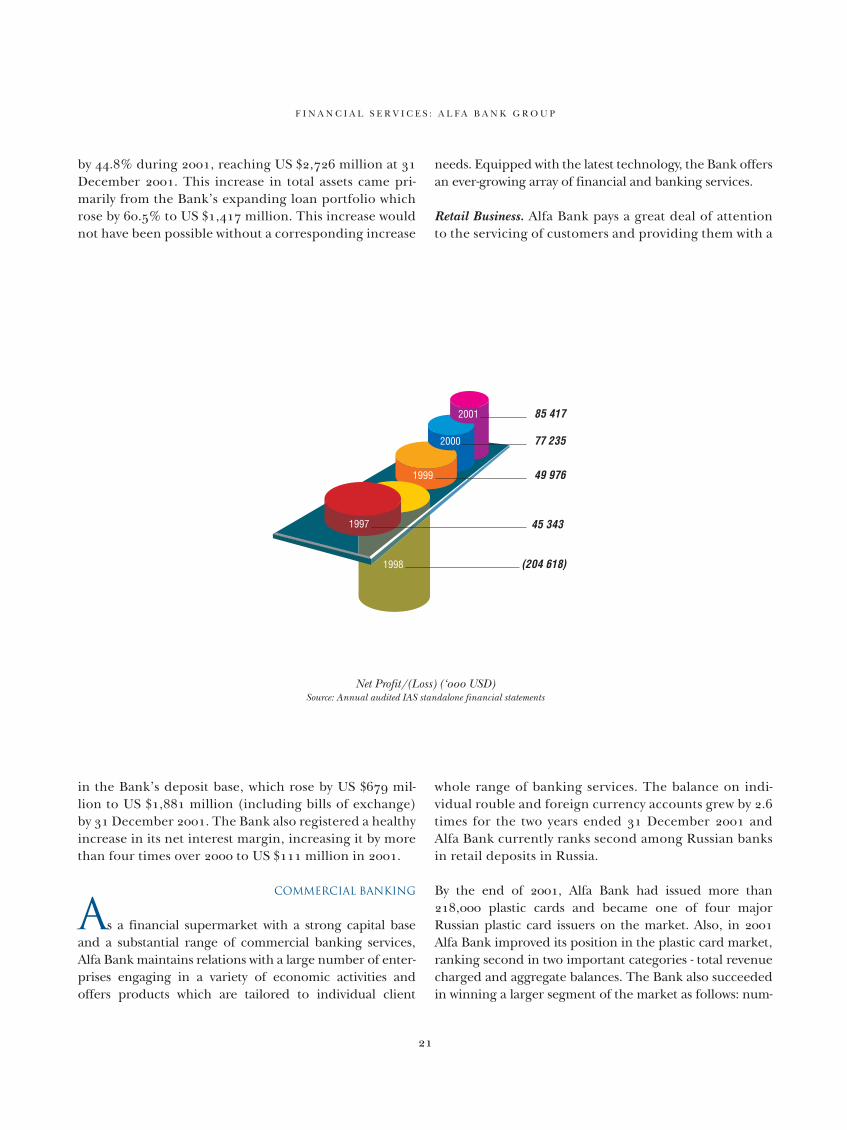
by .% during , reaching US $, million at December . This increase in total assets came pri-marily from the Bank’s expanding loan portfolio whichrose by .% to US $, million. This increase wouldnot have been possible without a corresponding increase
in the Bank’s deposit base, which rose by US $ mil-lion to US $, million (including bills of exchange)by December . The Bank also registered a healthyincrease in its net interest margin, increasing it by morethan four times over to US $ million in .
Commercial Banking
As a financial supermarket with a strong capital baseand a substantial range of commercial banking services,Alfa Bank maintains relations with a large number of enter-prises engaging in a variety of economic activities andoffers products which are tailored to individual client
needs. Equipped with the latest technology, the Bank offersan ever-growing array of financial and banking services.
Retail Business. Alfa Bank pays a great deal of attentionto the servicing of customers and providing them with a
whole range of banking services. The balance on indi-vidual rouble and foreign currency accounts grew by .times for the two years ended December andAlfa Bank currently ranks second among Russian banksin retail deposits in Russia.
By the end of , Alfa Bank had issued more than, plastic cards and became one of four majorRussian plastic card issuers on the market. Also, in Alfa Bank improved its position in the plastic card market,ranking second in two important categories - total revenuecharged and aggregate balances. The Bank also succeededin winning a larger segment of the market as follows: num-
F I N A N C I A L S E R V I C E S : A L F A B A N K G R O U P
Net Profit/(Loss) (‘ USD)Source: Annual audited IAS standalone financial statements

ber of international plastic cards (% market share); PayLater cards (%); revenue on issued cards (%); tradeoutlets (%); acquisition turnover (%). Importantly,this growth in market position was accompanied by a %increase in the profitability of Alfa Bank’s plastic card busi-ness during as compared to the year earlier period.
Significant attention to the retail segment of the bankingindustry is a main strategic focus of the Bank as it seeks towin back tremendous cash resources accumulated by indi-vidual savers.
Regional Network. In a number of Alfa Bank branch-es were set up across Russia including in Izhevsk,Voronezh, Yaroslavl and Sakhalin. Also, a representativeoffice was set up in Tatarstan, and eight new offices wereestablished in Moscow and other Russian regions.Currently, Alfa Bank’s branch network stretches fromSakhalin in the east to Kaliningrad in the west.
International Network. The Bank also has branches inKazakhstan and Ukraine as well as in the Netherlands,the latter being the only % privately owned Russian
commercial bank in Europe (Amsterdam Trade Bankor “ATB”), which holds a comprehensive bankinglicense. In , ATB intends to enlarge its productrange, through the implementation of the FontisElectronic Banking System, simultaneously with theinstallation of an additional Equation Clean PaymentsSystem. This will allow ATB to attract major corporateclients and correspondent banks for settlement andclearing services.
Alfa Bank branches also operate in London and NewYork. Alfa Securities (London), created in June cur-rently holds all of the required licenses of the UKFinancial Services Authority (“FSA”) and was the firstRussian financial company to obtain a FSA license, afterthe Russian financial crisis. saw the openingof an Alfa Bank representative office – Alfa CapitalMarkets (USA) Inc in New York. Alfa Capital Markets(USA) Inc has a NASD license for carrying out brokerageand dealer operations and specialises in operationsinvolving brokerage and trading in shares issued byRussian companies as well as providing corporatefinance services to its clients.
F I N A N C I A L S E R V I C E S : A L F A B A N K G R O U P
Alfa Bank’s Branch Network
Co-operation with Financial Institutions and Inter-BankOperations. During , the establishment of new andthe consolidation of existing correspondent relationswith major banks in Europe, the US, Japan, Asia, Africaand Latin America secured Alfa Bank the leading posi-tion among Russian non-government banks in clearingactivity.
In co-operation with its foreign partners Alfa Bank ren-ders a highly diversified range of top-notch services in theareas of project finance, syndicated lending related totrade financing, export credit operations, clearing, for-eign exchange and banknote services.
During , Alfa Bank obtained an unsecured syndicat-ed loan of US $ million from a consortium of leadingEuropean banks. This was the largest unsecured Russianfinancial institution risk syndicated in the internationalloan market since Russia’s financial crisis.
Loans. In , the extension of loans, bank guarantees andother credit related products was considerably intensifiedand enlarged due to a broader client base, and use of loan
facilities by newly opened branches and additional offices.As such, in income derived from lending activitymade the largest overall contribution to the Bank’s aggre-gate income. By December the Bank’s loan portfo-lio reached US $, million, a .% increase over .
An expanding and diversified client base has enabled theBank to spread the risk of its loan portfolio across differ-ent sectors of the economy. Specifically, the Bankincreased significantly, lending to manufacturing, con-struction, trade and commerce enterprises during .Despite the large increase in the Bank’s lending base, thecredit process at Alfa Bank continues to be based on astrict lending and risk management culture.
Currency Markets. For several years, Alfa Bank has enjoyeda leading position on the domestic and international for-eign exchange and money markets, including the marketsof the CIS. saw a further steady growth of the Bank’srevenues from currency operations in the Russian marketcaused by a sustainable increase in the volume of clientoperations, and by an increase in volume of Alfa Bank’soperations in the inter-bank market and MICEX. Today,
F I N A N C I A L S E R V I C E S : A L F A B A N K G R O U P
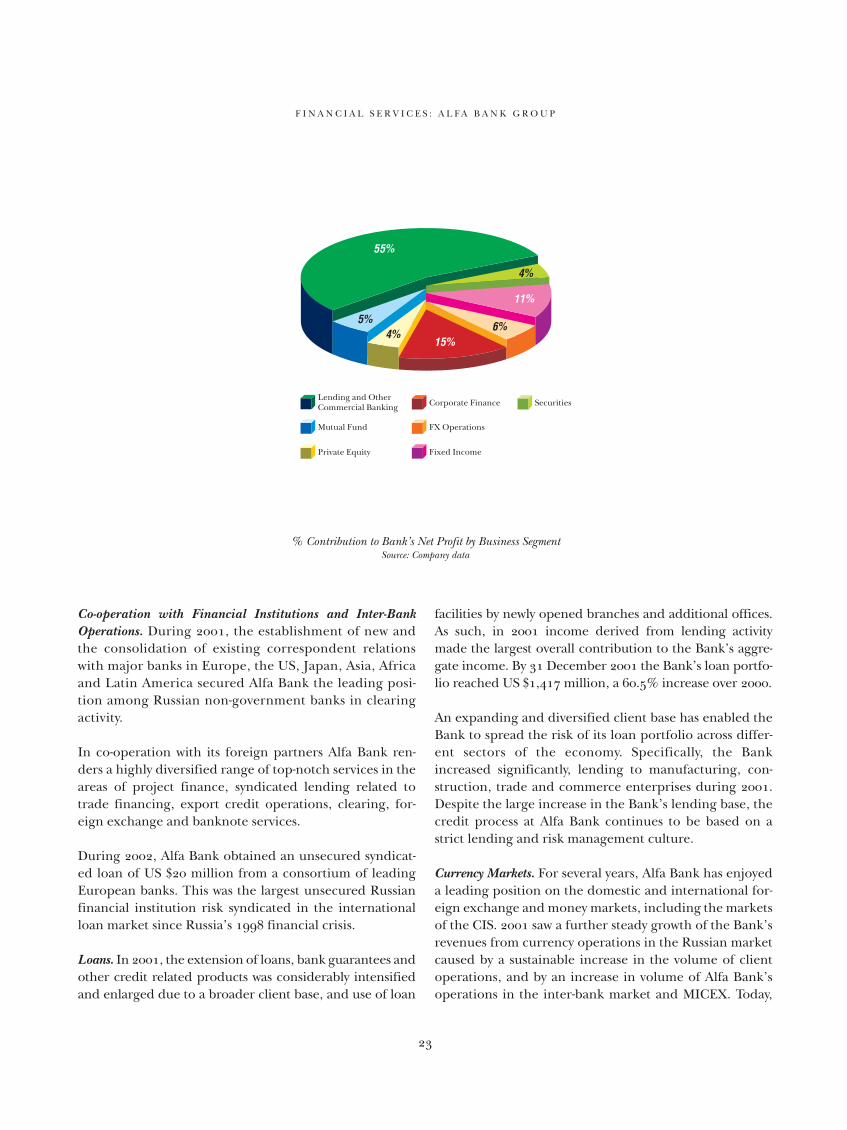
% Contribution to Bank’s Net Profit by Business SegmentSource: Company data
Alfa Bank’s controls between % and % of the marketfor RR/USD transactions.
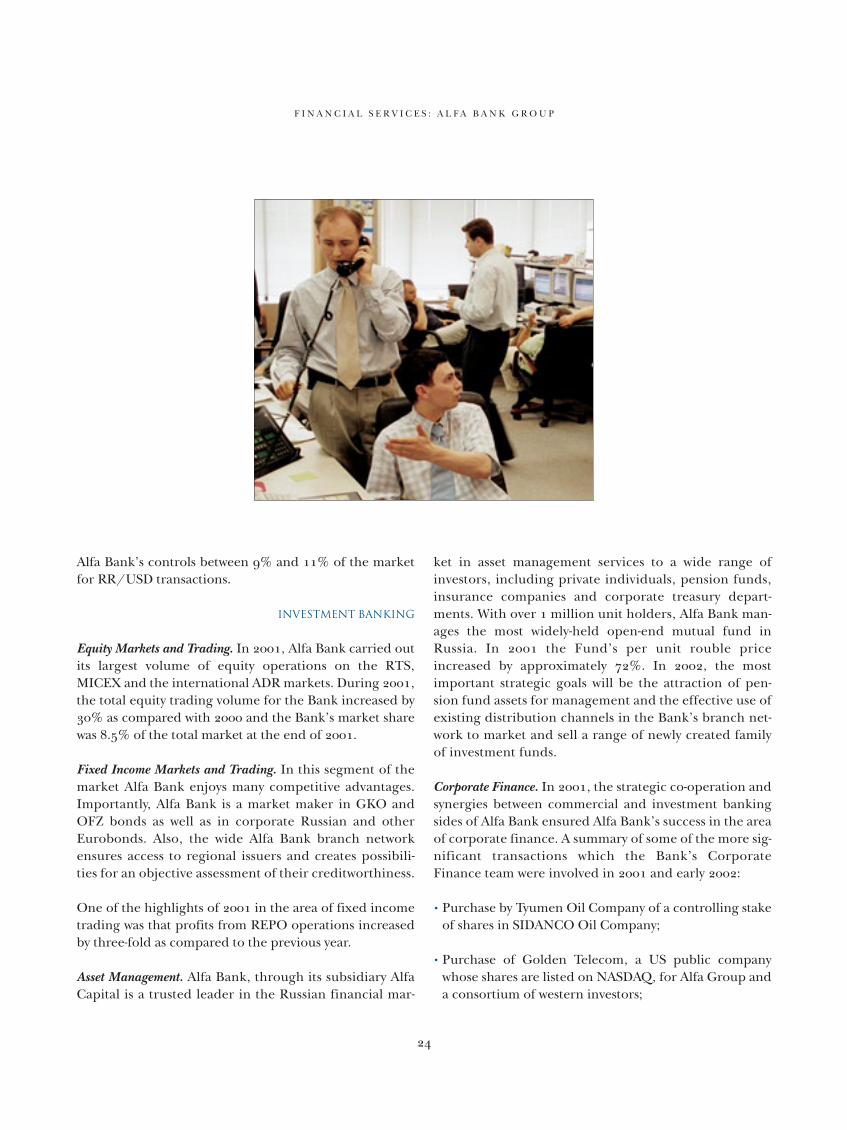
Investment Banking
Equity Markets and Trading. In , Alfa Bank carried outits largest volume of equity operations on the RTS,MICEX and the international ADR markets. During ,the total equity trading volume for the Bank increased by% as compared with and the Bank’s market sharewas .% of the total market at the end of .
Fixed Income Markets and Trading. In this segment of themarket Alfa Bank enjoys many competitive advantages.Importantly, Alfa Bank is a market maker in GKO andOFZ bonds as well as in corporate Russian and otherEurobonds. Also, the wide Alfa Bank branch networkensures access to regional issuers and creates possibili-ties for an objective assessment of their creditworthiness.
One of the highlights of in the area of fixed incometrading was that profits from REPO operations increasedby three-fold as compared to the previous year.
Asset Management. Alfa Bank, through its subsidiary AlfaCapital is a trusted leader in the Russian financial mar-
ket in asset management services to a wide range ofinvestors, including private individuals, pension funds,insurance companies and corporate treasury depart-ments. With over million unit holders, Alfa Bank man-ages the most widely-held open-end mutual fund inRussia. In the Fund’s per unit rouble priceincreased by approximately %. In , the mostimportant strategic goals will be the attraction of pen-sion fund assets for management and the effective use ofexisting distribution channels in the Bank’s branch net-work to market and sell a range of newly created familyof investment funds.
Corporate Finance. In , the strategic co-operation andsynergies between commercial and investment bankingsides of Alfa Bank ensured Alfa Bank’s success in the areaof corporate finance. A summary of some of the more sig-nificant transactions which the Bank’s CorporateFinance team were involved in and early :
• Purchase by Tyumen Oil Company of a controlling stakeof shares in SIDANCO Oil Company;
• Purchase of Golden Telecom, a US public companywhose shares are listed on NASDAQ, for Alfa Group anda consortium of western investors;
F I N A N C I A L S E R V I C E S : A L F A B A N K G R O U P
• Financial consultant to Svyazinvest subsidiaries withregard to the consolidation of the regional electroniccommunication operators in Siberia and Far East;
• Purchase by Alfa-Eco Group of a controlling block ofshares in Volga Pulp and Paper Mill, a major Russianproducer of newsprint paper;
• Acquisition of AO Milk Plant and AO Kiev City MilkPlant for Wimm-Bill-Dann, a large Russian dairy;
• Manager (with ING Barings acting as lead manager andglobal co-ordinator) on the New York Stock ExchangeUS ADS issue of Wimm-Bill-Dann
Strategy
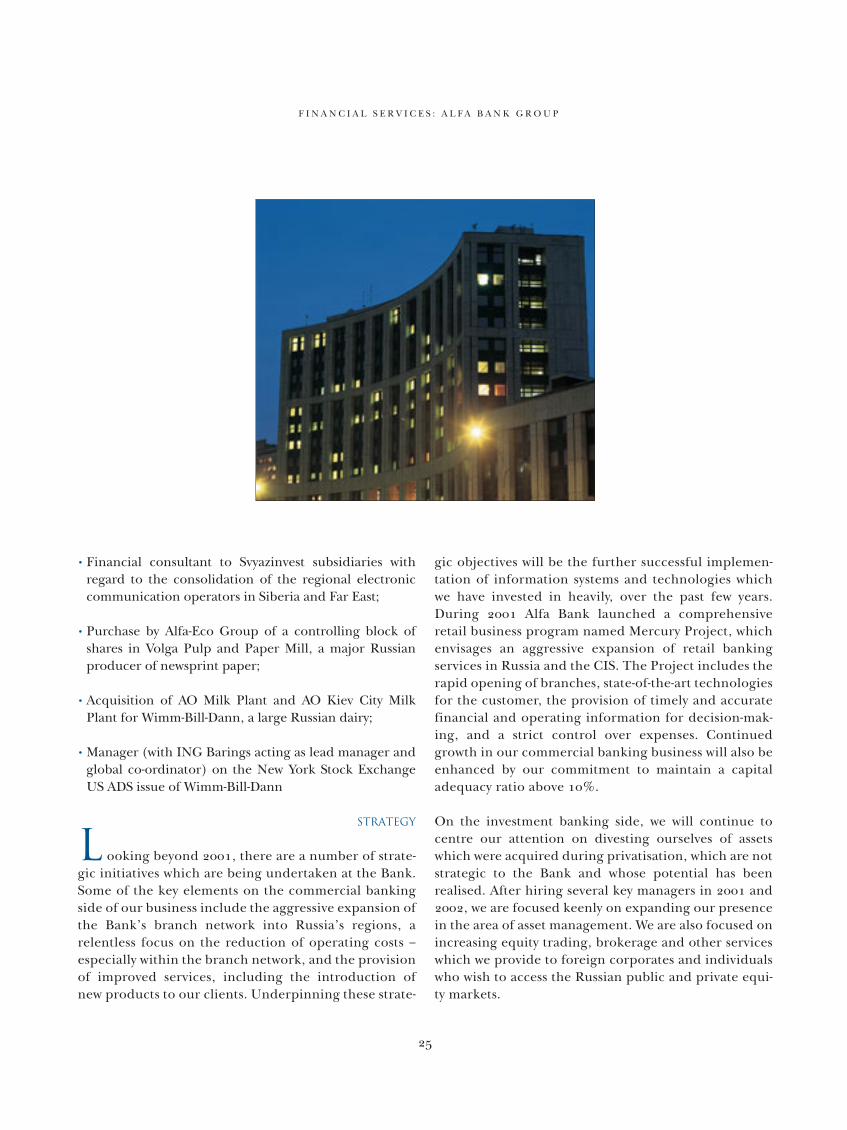
L ooking beyond , there are a number of strate-gic initiatives which are being undertaken at the Bank.Some of the key elements on the commercial bankingside of our business include the aggressive expansion ofthe Bank’s branch network into Russia’s regions, arelentless focus on the reduction of operating costs –especially within the branch network, and the provisionof improved services, including the introduction ofnew products to our clients. Underpinning these strate-
gic objectives will be the further successful implemen-tation of information systems and technologies whichwe have invested in heavily, over the past few years.During Alfa Bank launched a comprehensiveretail business program named Mercury Project, whichenvisages an aggressive expansion of retail bankingservices in Russia and the CIS. The Project includes therapid opening of branches, state-of-the-art technologiesfor the customer, the provision of timely and accuratefinancial and operating information for decision-mak-ing, and a strict control over expenses. Continuedgrowth in our commercial banking business will also beenhanced by our commitment to maintain a capitaladequacy ratio above %.
On the investment banking side, we will continue tocentre our attention on divesting ourselves of assetswhich were acquired during privatisation, which are notstrategic to the Bank and whose potential has beenrealised. After hiring several key managers in and, we are focused keenly on expanding our presencein the area of asset management. We are also focused onincreasing equity trading, brokerage and other serviceswhich we provide to foreign corporates and individualswho wish to access the Russian public and private equi-ty markets.
F I N A N C I A L S E R V I C E S : A L F A B A N K G R O U P
AlfaInsurance
AlfaInsurance Group is one of Russia’s largest insurers and offers a diversified portfolio
of insurance services including comprehensive business insurance protection as well as a
wide range of products for individuals. AlfaInsurance is consistently ranked as one of the
top five insurance companies and actively works across the whole of Russia and Ukraine.
www.alfastrah.ru
In September 2000, a new insurance unit was launchedwithin Alfa Group with the establishment of the market-oriented insurance company – Alfa Guaranty – whose aimwas to provide a range of comprehensive financial serv-ices to its customers. Since then, development of theinsurance business has been considered a strategic pri-ority of the Alfa Group. The business of the Groupdeveloped rapidly during 2001 when the holdingacquired the controlling interest of shares in EastEuropean Insurance Agency (“VESTA”) and the Ukraine-based Ostra Kiev. Beginning in September 2001, theentire insurance business of the Group was united undera single trademark – AlfaInsurance Group.
At the end of 2001, over 25,000 companies and more than80,000 individual customers entrusted the Company withprotection of their financial interests, which helped theCompany secure its place as the second largest companyin the Russian voluntary insurance market (by insurancepremiums collected).
Review of 2001
During 2001, AlfaInsurance expanded its presencein Russia’s regions considerably: the number of affiliatesrose from 38 to 43 and by the end of the year twelve affili-ates gained leading positions on local regional markets,
including St. Petersburg, Tyumen, Yekaterinburg,Novorossiysk, and Western Siberia.
In 2001, the Company’s total turnover was US $683.5 mil-lion, which was 3.2 times more than in 2000. The share ofproceeds from insurance premiums soared by 2.2 timesover the same period last year and accounted for approxi-mately 25% of the total increase of AlfaInsurance Group’sproceeds. At the end of 2001, the Company controlled7.4% of the Russian insurance market (as measured byinsurance premiums collected), an increase in marketshare of 4% as compared with end of 2000.
AlfaInsurance Group was the first Russian insurance com-pany to increase its share capital above the threshold of1 billion roubles and the Company’s share capital reachedUS $64 million in 2001. A substantial amount of share-holders’ equity as well as a reliable re-insurance programaimed at protecting the Company’s portfolio throughleading trans-national companies, such as Munich Re,General Cologne Re, Swiss Re, SCOR, and Lloyd’s ofLondon, enable the Company to undertake large finan-cial risks of its customers, almost without limitation.
Upon unification of three companies under one trade mark,AlfaInsurance Group was faced with a challenge to re-launchitself in the market as quickly as possible. Since September

F I N A N C I A L S E R V I C E S : A L F A I N S U R A N C E G R O U P
% of Market Share Controlled by AlfaInsurance (by insurance premiums)Source: Company data, Company analysis of market data
Mix of Risk Based Insurance Policies Written by AlfaInsurance – End of Source: Company data
2001, a full-scale promotion campaign that involved all avail-able media sources was launched. The opinion poll that fol-lowed confirmed the high efficiency of the campaign withbrand recognition among the target audience reaching 85%.The AlfaInsurance trademark has solidly positioned itselfwithin the top five insurance companies of the market.
Looking Ahead
We believe that in the next few years an “insuranceculture” in Russia will continue to steadily grow and will
support the development of the Russian insurance mar-ket. One of the main strategic tasks of AlfaInsurance willbe to capture a substantial amount of new business and inkey segments of the corporate and individual markets aswell as further strengthen the Company’s positions as amajor national player of the insurance community. Thisdevelopment strategy will be based on the ability to effec-tively utilise existing opportunities of the Company,regional expansion, optimization of business processes,reinforcement of the sales organisation and building onsynergies with Alfa Bank.

PROGRESSIVE
THINKING
OR
SEEKING PIONEERING
SOLUTIONS.
SOMETIMES STRIKING
AND UNCONVENTIONAL,
BUT ALWAYS EFFECTIVE
AND TIMELY
Tyumenskaya Neftianaya Kompaniya (“Tyumen OilCompany” or “TNK”) was formed as an open-type jointstock company by a government decree in August 1995. Atthat time, the Russian government was the largest ofTNK's shareholders.
In July 1997, 40% of the Company's shares were put up forprivatisation in an investment tender that was won byNovy Holdings (a company jointly owned and controlledby Alfa Group and Access Industries/Renova Group).Early in 1998, the new shareholders together bought a fur-ther 9% of TNK shares from private shareholders and anadditional 1.1% at a specialised auction, thus consolidat-ing a controlling block (50.1%) in TNK.
In December 1999, when the Russian government (rep-resented by the Federal Property Fund) put up theremaining 49.8% of TNK for privatisation, Alfa Groupand Access Industries/Renova Group again, jointly wonthe tender, bringing their total ownership in TNK to99.9%. In February 2001, after the completion of aninvestment program as per the terms of the tender, AlfaGroup and Access Industries/Renova Group gained
full control of the purchased shareholding, fully pri-vatising the company.
During December 2001, TNK, completed a single shareswap whereby minority shareholders voluntarilyswapped their ownership in TNK’s production sub-sidiaries for ownership in TNK and continuing through2002, TNK purchased shares in its production sub-sidiaries directly from existing shareholders. Currently,Alfa Group, together with Access Industries/RenovaGroup own approximately 97% of the outstandingshares of TNK.
Company Structure
TNK, together with its subsidiaries (includingONAKO Oil Company, 85% of which was purchased atend of 2000 for US $1.08 billion), is one of the largest ver-tically integrated oil companies in Russia, ranking secondin oil reserves and fourth in oil production. Its primaryoperations include the production and refining of crudeoil and gas, as well as distribution of oil and gas, premiumoil products and motor oils.
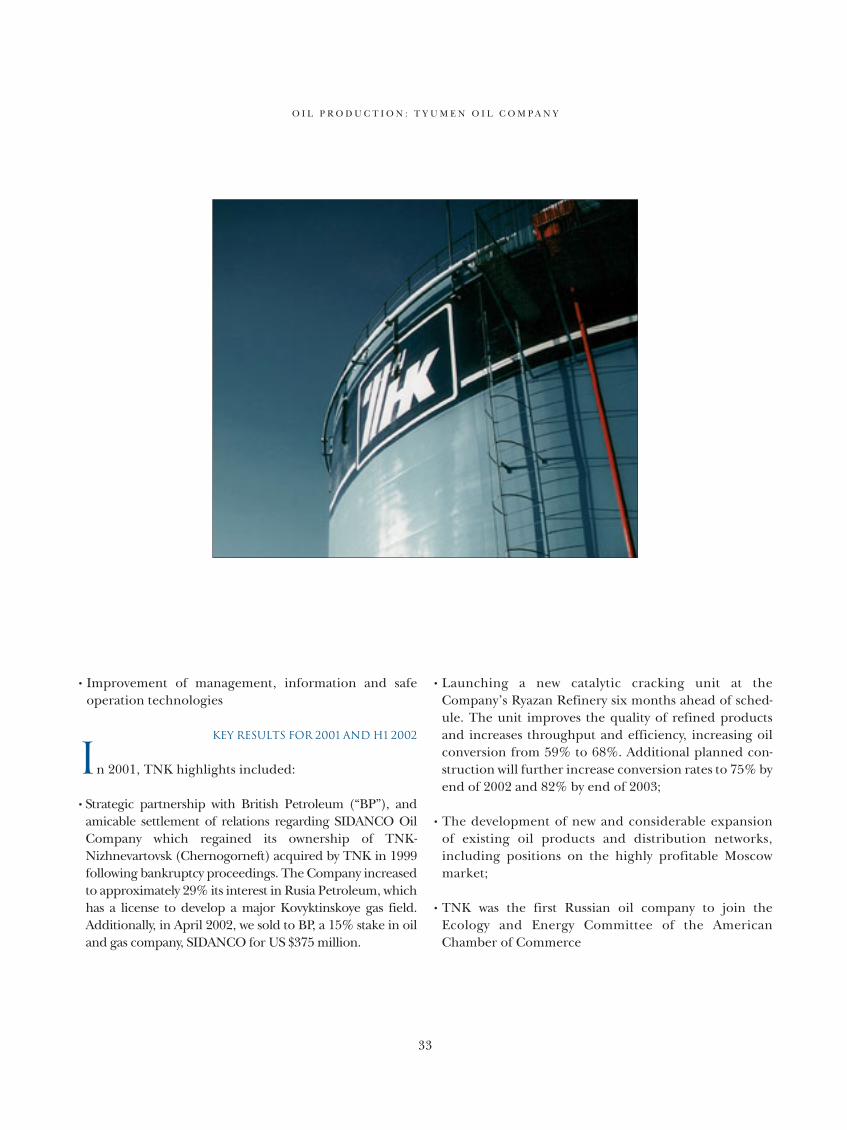
OIL production
Tyumen Oil Company
Established in , Tyumen Oil Company (“TNK”) together with its subsidiaries, is
today one of the largest vertically integrated oil and gas companies in Russia, ranking
fourth in oil production and second in oil reserves. TNK’s primary operations include
the production of crude oil and gas, refining, as well as the distribution and retail sale of
refined oil products.
www.tnk.ru

The Company includes four oil producers (Samotlor-neftegas, Nizhnevartovsk Oil and Gas ProductionCompany, Tyumenneftegas, and TNK-Nyagan), fiverefineries (Ryazan NPZ, Nizhnevartovsk NPO, Krasno-leninsky NPZ, Lisichansknefteorgsintez and Orsk-orgsintez); and five distribution and marketing enter-prises (Kaluganefteproduct, Karelnefteproduct, Tula-nefteproduct, Ryazannefteproduct and Kursknefte-product).
Exploration and Production
TNK's primary oil fields are located in the Tyumenregion of western Siberia, the largest region of hydrocar-bon reserves in Russia. The wells are highly productive,with high quality sweet crude oil with good physicochem-ical properties. Sweet crude commands a higher price,and is easier to manufacture into environmentally-friend-ly oil products without requiring investment in expensivede-sulfurisation equipment.
According to 2001 production results, TNK, togetherwith all its subsidiaries, currently produces 114.9 thou-
sand tonnes of oil per day, 42% of which is exported,while the remaining oil is delivered to its own refineriesand goes for free sale on the domestic market. TNK isone of the few national oil companies operating its pro-cessing facilities at full capacity. As of 1 January 2002,TNK's proven oil reserves based on international stan-dards were at 1.03 billion tonnes, and total reservesincluding proven, probable and possible, were estimatedat 2.17 billion tonnes.
Refining and Distribution
In 2001, the Company refined 20.9 million tonnes ofcrude and produced 10.7 million tonnes of light oil. TheRyazan Refinery is the primary refining unit for TNK’supstream operations. The location of Ryazan, in close prox-imity to the largest sales markets in Central Russia (includesMoscow), provides TNK with a strategic competitive advan-tage. TNK's management has been actively working toincrease Ryazan Refinery's outputs and to improve the qual-ity of its refined products. In 2001, the Ryazan Refineryrefined approximately 11.1 million tonnes, with 10.5 milliontonnes of oils and 572 thousand tonnes of petrol.
O I L P R O D U C T I O N : T Y U M E N O I L C O M P A N Y
TNK Volume of Crude Oil Production (' of barrels per day)Source: Company data

TNK owns and operates a network of retail petroleum sta-tions throughout Central Russia, in the Tyumen region,Karelia, Orenburg region and Ukraine. In addition toTNK-owned petroleum stations, from 1998, the Companyhas been successfully developing Russia's first unique job-ber network where jobbers, while being independent gasstation owners, have exclusive rights to sell TNK productsunder franchises. At the end of 2001, the total number ofTNK-owned and jobber gas stations was 969.
Strategy
The cornerstone of TNK's long-term corporate strategyis to increase its market value by maximising the economicbenefits of vertical integration, improving production effi-ciency, lowering costs, and reorienting production andsales towards competitive high value-added products.
The strategy developed to achieve this includes:
• Focusing corporate efforts on using vertical integrationbenefits and adding value by:
– Optimisation of oil and gas production and quality;– Higher technical and economic efficiency of refineries
including increasing the share of production of light oils;– Expansion and higher efficiency of retail sales in the
most attractive fuel market segments;– Greater capital efficiency in every part of the chain;
• Continued international development through joint ven-tures, mergers, affiliations and other strategic partnershipsincluding co-partnership in projects for the developmentof oil, oil products, and gas transportation infrastructure;
• Improvement of efficient organisational and manage-ment system based on encouraging “bottom-to-top” ini-tiatives and improvement of “top-to-bottom” control tothe international standards of corporate governance andoperating and financial transparency;
O I L P R O D U C T I O N : T Y U M E N O I L C O M P A N Y
TNK Presence in Russia and Ukraine
O I L P R O D U C T I O N : T Y U M E N O I L C O M P A N Y
• Improvement of management, information and safeoperation technologies
Key results for 2001 and H1 2002
In 2001, TNK highlights included:
• Strategic partnership with British Petroleum (“BP”), andamicable settlement of relations regarding SIDANCO OilCompany which regained its ownership of TNK-Nizhnevartovsk (Chernogorneft) acquired by TNK in 1999following bankruptcy proceedings. The Company increasedto approximately 29% its interest in Rusia Petroleum, whichhas a license to develop a major Kovyktinskoye gas field.Additionally, in April 2002, we sold to BP, a 15% stake in oiland gas company, SIDANCO for US $375 million.
• Launching a new catalytic cracking unit at theCompany’s Ryazan Refinery six months ahead of sched-ule. The unit improves the quality of refined productsand increases throughput and efficiency, increasing oilconversion from 59% to 68%. Additional planned con-struction will further increase conversion rates to 75% byend of 2002 and 82% by end of 2003;
• The development of new and considerable expansionof existing oil products and distribution networks,including positions on the highly profitable Moscowmarket;
• TNK was the first Russian oil company to join theEcology and Energy Committee of the AmericanChamber of Commerce
With 380,000 barrels per day production, SIDAN-CO Oil Company ranks amongst the ten largest oil and gasproducers in Russia, employing 29,000 people.SIDANCO’s upstream subsidiaries are currently develop-ing over 120 fields located in Udmurtia, Saratov Oblast(Volga Region), the Khanty-Mansiysk Autonomous Area(Tyumen Oblast), and Novosibirsk Oblast in westernSiberia.
The Alfa Group, together with its joint venture partnersAccess Industries / Renova Group, owns approximately57% of SIDANCO and invests alongside BritishPetroleum (“BP”), a 25% + 1 share shareholder, as well asother minority shareholders. Under the terms of theshareholders agreement, as a controlling shareholder,Alfa Group, Access Industries and Renova Group hasmajority Board representation, and BP has been grantedmanagement control of the Company for at least the nextthree years.
Company Structure
SIDANCO has five main production companies whichcomprise: TNK-Nizhnevartovsk (2001 production – 6.5 mil-lion tonnes) which also has a share in two joint venturesadding over 1.5 million tonnes in 2001, UdmurtNeft(2001 production – 4.98 million tonnes) VaryoganNefteGaz(2001 production – 2.99 million tonnes), SaratovNefteGaz(2001 production – 1.43 million tonnes), andNovosibirskNefteGaz (2001 production – 0.08 milliontonnes). In addition the Company owns Saratov Refinery,which in 2001 improved its depth of refining by 6.5%, pro-duced 3 million tonnes of oil products and increased gaso-line production by more than 50% as compared to2000 levels. The Refinery is working on an investmentproject to install a cracking unit to further boost the yieldof light products.
SIDANCO’S retail network comprises 149 service stations,located in the Saratov and Rostov regions, where theydominate their respective markets.
SIDANCO Oil Company
Established in , SIDANCO Oil Company together with its subsidiaries, is one of
Russia’s largest vertically integrated oil and gas companies, ranking among the top-ten in
oil production and th in oil reserves. SIDANCO’s primary operations include oil and gas
exploration, production and refining as well as oil and chemical products distribution.
www.sidanco.ru
Management
In late 1999, BP seconded a team of six senior managerswith vast experience in the petroleum industry to join theSIDANCO management team. Since that time, SIDANCO’smanagement team has grown stronger and is now supple-
mented by additional BP and Russian resource, particularlyin key operational positions. The management team hasbeen very successful in driving the strategic objectives of theCompany, including the integration of advanced Westernpractices in the context of best Russian experience.
Strategy
The central aim of SIDANCO is to maximise share-holder value. The Company has identified its corestrengths as hydrocarbon development and extractionand seeks to maximise its performance in every aspect ofthis activity. Necessarily, a cornerstone of this strategy is tofocus on operational excellence. This obviously requireschanging the way that SIDANCO does things and is cur-rently embarking on a major change initiative in order toachieve its goals. Operationally, the Company is in theprocess of changing its structure and processes with a
focus on performance units of core production assets.These units will be supported by other services, but wher-ever possible, the Company seeks to concentrate on itscore competencies. Non-core activity, including oil-fieldservices will be separated to eventually form a part of theoil service industry in Russia.
Other initiatives supporting operational excellenceinclude changing the management information systemsand processes to support greater transparency in the busi-ness. In view of its strategy, the Company focuses on suchimportant issues as health, safety and environment (HSE).A major initiative has commenced to assess and improveSIDANCO’s safety perfomance to world-class standadsusing the assistance of DuPont, a recognized world leaderin safety. In cooperation with IT Russia, a leader in envi-ronmental management, SIDANCO is implementing amonitoring and improvement system which is designed tocomply with ISO 14001.
This change process obviously impacts people. In SIDAN-CO, the combination of key BP resources and Russianexpertise is blended to make the change process workfrom inside. This blend of expertise is working to improveprocesses and achieve operational excellence.
O I L P R O D U C T I O N : S I D A N C O O I L C O M P A N Y
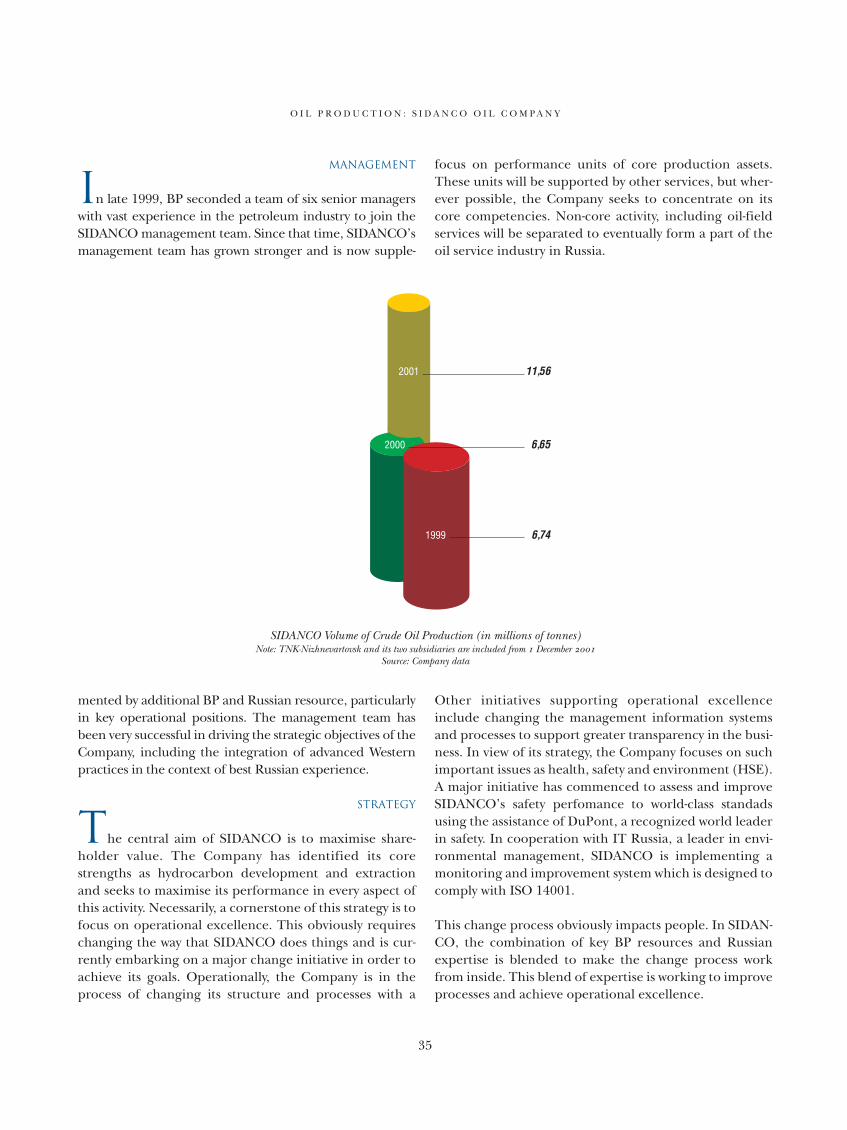
SIDANCO Volume of Crude Oil Production (in millions of tonnes)Note: TNK-Nizhnevartovsk and its two subsidiaries are included from December
Source: Company data
FORESIGHT
OR
THINKING
WHICH IS AHEAD OF ITS TIME.
THE OPENING OF NEW HORIZONS,
BY THOSE WHO TODAY THINK
ABOUT TOMORROW
CROWN RESOURCES AG
Founded in 1992 and based in Zug, Switzerland, withbranches in London and Gibraltar and representativeoffices in Moscow, Baghdad, Havana, Caracas andSingapore, Crown has more than 100 employees in itsworld-wide operations. Crown is actively involved in thetrading of physical goods with the territories of theCaribbean basin and Latin America, the Middle and FarEast, Africa, and Russia as well as other CIS countries.
Crude Oil and Oil Products
Through long-standing relationships with oil produc-ers, Crown’s crude oil and oil products department main-tained their significant presence as a major participant ininternational oil markets in 2001. The main providers ofoil are companies such as TNK and Bashneft (Russia),Somo (Iraq), and TotalFinaElf (France).
Crown trades a wide range of Russian and international-ly sourced oil products, including gasoline, kerosene,fuel oils, blend stocks and cycle oils, and for the last sev-eral years has placed particular emphasis on expandingits non-Russian oil products business.
Crown has established trading and credit lines with a num-ber of companies in order to participate in the derivative
markets and be able to conclude OTC deals as required forhedging. As a result, Crown’s access to international mar-kets and its ability to use various hedging techniques allowssignificant flexibility in negotiating terms and conditionswith its suppliers. These include various pricing mecha-nisms that add to Crown’s competitiveness in trading crudeoil and oil products. This also allows Crown to realise, infull, the trading potential offered by a stable supply baseand strong relationships with many customers world-wide.Among Crown’s customers are numerous state-owned andprivate companies, including: Somo, NIOC, PDVSA, BP,TotalFinaElf, Shell, ExxonMobil, Agip, and Cargill.
Metals
Having recently established offices in New York andNew Orleans, Crown initiated its metals trading businessduring the second half of 2001. Since that time theCompany has been actively trading in Europe, CIS, Asia,Australia, South America and the Middle East.
Crown is determined to cultivate the natural progressionof the Company into metals trading and believes that theCompany’s robust expertise and ability in the financialmarkets will allow for an acceleration of exponentialgrowth in the years to come. Already, Crown’s trading
COMMODITIES TRADING
Crown Resources AG
Founded in , Crown Resources AG is a major international commodities business
trading Russian and internationally sourced commodities – primarily oil and oil prod-
ucts and metals. Based in Zug, Switzerland, Crown has branches in London and Gibraltar
and representative offices in Moscow, Baghdad, Havana, Caracas and Singapore.
www.crownresourcesag.com
team has extensive experience in international finance,arbitrage, risk management, terminal markets, physicalproduction and consumption. Also, the Company is inte-grally involved in the supply chain by means of trade,investment and financial arrangements.
Crown’s current activities are focused on primary, second-ary, alloy, semi-fabricated products and scrap aluminum,and are currently in the process of introducing a copperdepartment. It is anticipated that other non-ferrous basemetals will follow.
Financing
Credit lines opened at major international banks,which exceeded US $1 billion at the end of 2001, allow theCompany to engage in a variety of trading activities basedon trade financing, including the pre-financing of rawmaterial suppliers, the financing of the production andprocessing of goods, the financing of the storage of com-modity stocks, and hedging. Banks with which theCompany co-operates include Raiffeisen Zentralbank,
Banque BNP Paribas, Natexis Banque, Societe GeneraleBanque and others.
A Year of Changes
The nature of the Company’s business changed during2001 in that much less reliance is being placed on sourcingdeals through Alfa Group companies as Crown continuesto develop its own independent base. These changes, com-bined with extremely difficult trading conditions following11 September 2001, have resulted in the Company review-ing all of its operations, with a view to restructuring.In early 2002, a comprehensive reorganisation was initiat-ed in order to adjust the overhead levels to fit this new pro-file. In addition, the Company wrote off one-time expens-es associated with the hiring of high level energy traderswho will be leading new initiatives through 2002 and sub-sequent years. Also a new management team was broughtinto the Company. To demonstrate its commitment toCrown in this transition period, the Alfa Group decided toincrease Crown’s equity by capitalising approximatelyUS $48 million of an Alfa Group subordinated loan.
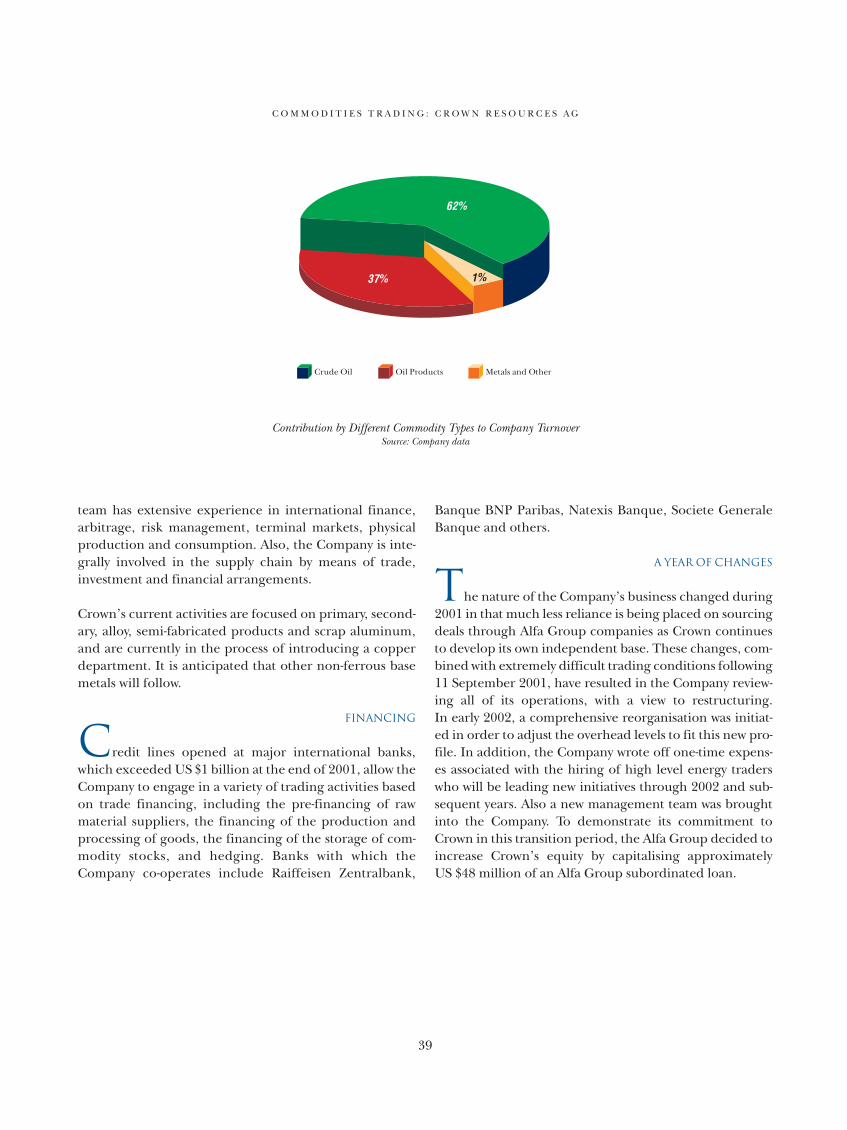
C O M M O D I T I E S T R A D I N G : C R O W N R E S O U R C E S A G
Contribution by Different Commodity Types to Company TurnoverSource: Company data
ALFA-ECO GROUP
In addition to being one of Russia’s leading tradingcompanies, in recent years, Alfa-Eco Group’s (“Alfa-Eco”or the “Group”) key focus has been on large-scale invest-ments in Russian industrial assets. Accordingly, one ofthe Group’s top priorities has been the acquisition ofpromising companies. Alfa-Eco places key managementpersonnel into these companies who introduce advancedmanagement, operating, and marketing practices andalso makes necessary capital investment in order to mod-ernise the companies. The desired result is to raise thevalue of the company by realising a significant increase inproduction output and strengthening of market position.
Energy
In 2001, the Group delivered approximately 11.5 mil-lion tonnes of crude oil and oil products to internationalmarkets, including exports made under the UN SecurityCouncil’s Oil-For-Food Programme for Iraq. Export deliv-eries of oil products from Russia in 2001 were more than473 thousand tonnes, while Russian domestic-marketsales were 485 thousand tonnes. In 2002, the Group’splans call for exporting approximately 9 million tonnes ofoil and oil products.
In 2001, Alfa-Eco continued the management of its95% owned stake of Sakhalin-based ZAO Petrosakh, avertically-integrated complete cycle oil companyinvolved in the exploration, production and export ofcrude oil, as well as the refining and sale of oil prod-ucts. Petrosakh is currently carrying out an explorationand drilling programme which will allow for produc-tion of more than 1 million tonnes of oil annually. TheCompany’s plans call for meeting fully Sakhalin’sdemand for oil products, as well as supplying oil prod-ucts to other regions of Russia’s Far East. Additionally,Petrosakh has obtained a license from the RussianFederation’s Ministry of Natural Resources for the geo-logical exploration of oil blocks in the Sakhalin-6coastal shelf zone, whose potential deposits are esti-mated at 200 million tonnes of oil (total potentialSakhalin-6 coastal shelf zone reserves are approximate-ly 1 billion tonnes).
Other Alfa-Eco activities in the energy sector include:
• Active participation in federally sponsored programmesfor the delivery of oil products, including fuel to theRussian armed forces and to Russia’s Far North;
• In 2001, Alfa-Eco continued its activities in the coal mar-ket delivering 497 thousand tonnes of coal to energy and
Alfa-Eco Group
Founded in as a trading company of the Alfa Group Consortium in Russia, Alfa-Eco
has built a large and diversified business in producing and trading a wide range of com-
modities and products both domestically and internationally including oil and oil prod-
ucts, coal, grain, meat, alcoholic beverages, pulp and paper products and others. Also,
Alfa-Eco has made a significant strategic investment into telecommunications assets.
www.alfaeco.ru
metallurgical enterprises. Significant growth in coalsales is expected in 2002.
Metals
Alfa-Eco has established a significant presence in theRussian metals industry and has developed an effectivemanagement structure for the metallurgical enterprisesthat it owns and manages. Enterprises in which Alfa-Ecohas management participation produced 9.7 milliontonnes of iron ore, 3.5 million tonnes of iron-ore con-centrate, 448.4 thousand tonnes of steel and 503.8 thou-sand tonnes of steel pipe in 2001.
In 2001, Alfa-Eco’s portfolio of investments in the industrychanged significantly as the Group finalised the sale of itsequity stake in Korshunovsky Mining and EnrichmentPlant. In addition, the disposal of a 50% stake in Volgograd’sKrasny Oktyabr Metallurgical Plant was carried out, and theNOSTA (Orsko-Khalilovsky Integrated Metals Plant,Orenburg Region) and Vtormet (Krasnoyarsk) investmentprogrammes were brought to successful completion.
The year 2001 also saw continued progress in the imple-mentation of a series of other investment programmes bythe Alfa-Eco Metallurgical Department. In particular,these included:
• The Sibelectrostal investment programme, aKrasnoyarsk-based metallurgical plant, which is aunique manufacturer of special and high-alloy steels.The bankruptcy proceedings were halted, the plant’sorder book was replenished and additional jobs werecreated, thus facilitating the hiring of highly qualifiedmanagement and staff specialists. Production volumetripled in the period November 2000 throughDecember 2001;
• The Taganrog Metallurgical Works (“Tagmet”), one ofRussia’s largest manufacturers of high-quality pipewith an annual production volume of 460 thousandtonnes and over 5,000 customers. By January 2002,Alfa-Eco’s equity interest in Tagmet increased from25.2% to 41.9%;
• The Amurmetal investment programme (Komsomolsk-on-Amur based metallurgical works), with an annual out-put 360 thousand tonnes of metal products, 85% ofwhich are exported, and annual revenues of US $60 mil-
lion. Alfa-Eco Group holds a 74.5% share of the votingstock in Amurmetal.
Telecommunications
In May 2001, Alfa-Eco acquired a blocking voting stake(25% + 1 share) in cellular communications providerVimpel-Communications (“VimpelCom”), and in itsregional subsidiary VimpelCom-R, which providemobile telephony services under the BeeLine trade-mark. The total amount of investment in this project byAlfa-Eco is US $246.8 million, making it the largest dealin the Russian telecom market in recent years. In theperiod from May through December 2001, VimpelCom’scapitalisation increased from US $806.6 million toUS $1.4 billion.
Alfa-Eco, together with other Alfa Group companies, alsoactively co-operates with international organisations suchas Intersputnik, which is one of the largest internationalspace organisations which carries out launches and run-ning of the largest group of civil sattelites and relatedequipment.
Pulp and Paper and Forest Products Industry
In early 2001, the Group gained significant influenceover Balakhninsky Pulp and Paper Mill (“Volga”), whichproduces one-third of all newsprint in Russia (2001 pro-duction was 542 thousand tonnes of paper). In 2001,Volga achieved year-on-year sales growth of 12%.
In the fourth quarter of 2001, Alfa-Eco increased its par-ticipation in the management of Kama Pulp and PaperMill (Perm Region). In early 2002, the plant’s operationswere stabilised, resulting in an increase in average month-ly paper output from below 5 thousand tonnes to 7.5 thou-sand tonnes. In the near future, the plant should reach amonthly production level not less than 9 thousand tonnesof paper.
The combined output of Volga and Kama Pulp and PaperMill accounts for approximately 40% of Russia’snewsprint production.
Since 2001, Alfa-Eco has been implementing a lumbertrading programme and, in the reporting year, theGroup’s share of round timber exports to Finlandreached 2% of the Finnish export market.
C O M M O D I T I E S T R A D I N G : A L F A - E C O G R O U P
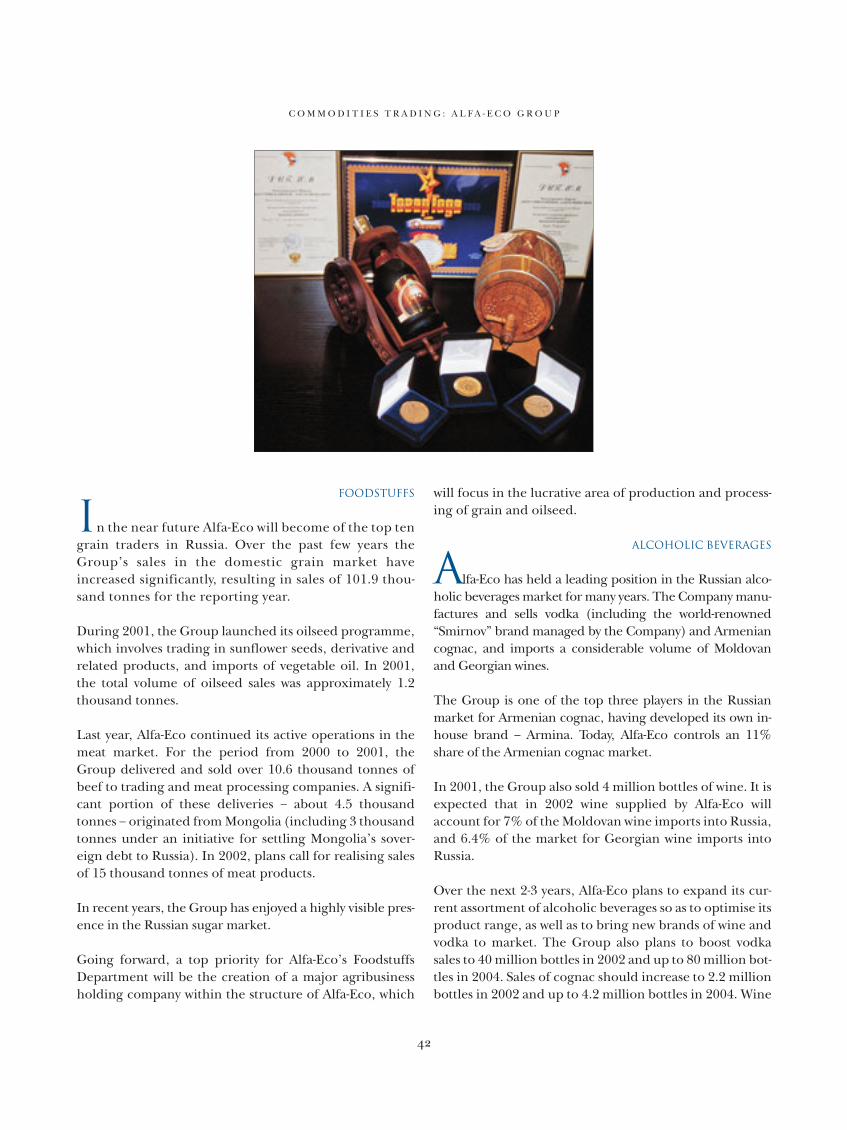
C O M M O D I T I E S T R A D I N G : A L F A - E C O G R O U P
Foodstuffs
In the near future Alfa-Eco will become of the top tengrain traders in Russia. Over the past few years theGroup’s sales in the domestic grain market haveincreased significantly, resulting in sales of 101.9 thou-sand tonnes for the reporting year.
During 2001, the Group launched its oilseed programme,which involves trading in sunflower seeds, derivative andrelated products, and imports of vegetable oil. In 2001,the total volume of oilseed sales was approximately 1.2thousand tonnes.
Last year, Alfa-Eco continued its active operations in themeat market. For the period from 2000 to 2001, theGroup delivered and sold over 10.6 thousand tonnes ofbeef to trading and meat processing companies. A signifi-cant portion of these deliveries – about 4.5 thousandtonnes – originated from Mongolia (including 3 thousandtonnes under an initiative for settling Mongolia’s sover-eign debt to Russia). In 2002, plans call for realising salesof 15 thousand tonnes of meat products.
In recent years, the Group has enjoyed a highly visible pres-ence in the Russian sugar market.
Going forward, a top priority for Alfa-Eco’s FoodstuffsDepartment will be the creation of a major agribusinessholding company within the structure of Alfa-Eco, which
will focus in the lucrative area of production and process-ing of grain and oilseed.
Alcoholic Beverages
Alfa-Eco has held a leading position in the Russian alco-holic beverages market for many years. The Company manu-factures and sells vodka (including the world-renowned“Smirnov” brand managed by the Company) and Armeniancognac, and imports a considerable volume of Moldovanand Georgian wines.
The Group is one of the top three players in the Russianmarket for Armenian cognac, having developed its own in-house brand – Armina. Today, Alfa-Eco controls an 11%share of the Armenian cognac market.
In 2001, the Group also sold 4 million bottles of wine. It isexpected that in 2002 wine supplied by Alfa-Eco willaccount for 7% of the Moldovan wine imports into Russia,and 6.4% of the market for Georgian wine imports intoRussia.
Over the next 2-3 years, Alfa-Eco plans to expand its cur-rent assortment of alcoholic beverages so as to optimise itsproduct range, as well as to bring new brands of wine andvodka to market. The Group also plans to boost vodkasales to 40 million bottles in 2002 and up to 80 million bot-tles in 2004. Sales of cognac should increase to 2.2 millionbottles in 2002 and up to 4.2 million bottles in 2004. Wine
sales are expected to grow to 11 million bottles in 2002and 23 million bottles in 2004.
Private Equity
Over the years Alfa-Eco has gained unique investmentexperience by executing a number of large-scale invest-ment programs with very positive results. Alfa-Eco’s successis driven by the competitive advantage it has due to a strongteam of trained investment managers, who efficiently runbusinesses across a number of industries, command a solidunderstanding of the Russian regional specifics, who canreact quickly and appropriately to the changing market-place and who can build mutually benificial relations withclients. This set of qualities allows the Company to identifythe high-potential projects and orchestrate sophisticatedtransactions for the Company and its partners.
Over the past three years the total investment in Alfa-Ecodeals has reached US $420 million while the average IRRhas exceeded 50%. The Company’s renewed strategy envi-sions significant investment in industrial production andservice sectors as a top priority. The Group has thus startedto actively raise funds for investment in promising Russianenterprises. A number of respected investors intend to runjoint projects with Alfa-Eco.
Financing
Alfa-Eco is an active participant in the Russian securitiesmarket. In 2001, the Group carried out placements of its ownbills of exchange with maturities ranging from 3 to 14 monthsworth a total of 820 million roubles (US $27 million). Alfa-Eco’s securities correspond to the highest investor require-ments. Numerous banks, investment firms, insurance com-panies and pension funds have included the Company’ssecurities in their investment portfolios.
In October 2001, Limited Liability Company Alfa-Eco M,together with Russia’s largest companies and banks, wasincluded in the National Association of Securities MarketParticipants list of reliable issuers of bills of exchange. During2001, the yield on Alfa-Eco’s bills of exchange declined by threepercentage points, indicating growing investor confidence.
In 2002, the Group intends to continue placing bills ofexchange in the open financial market without any reduc-tion in issue volume. Plans call for gradually decreasing theyield on bills of exchange, thus cutting loan servicing costs.
Alfa-Eco also intends to carry out a separate bond issuewith a maturity of 1 to 2 years for a total amount of 1 bil-lion roubles (US $33.2 million).
C O M M O D I T I E S T R A D I N G : A L F A - E C O G R O U P
DYNAMISM
OR
VITALITY. THE ENTHUSIASM
AND DETERMINATION
TO ACHIEVE ADVANTAGE
AND CONTINUOUSLY
PURSUE NEW GOALS

TRADE HOUSE PEREKRIOSTOK
History
Nowadays, it is impossible to imagine a modern citywithout well-developed retail trade, especially such a fastgrowing and densely populated city as Moscow. Yet, retailtrade and its related infrastructure only started to devel-op in Moscow some seven years ago.
Alfa Group, with its origins in trading, was well positionedto meet the demands for Western style shopping as a newmiddle class emerged from post-Soviet society eager andable to buy high quality goods. Alfa Group took a strategicdecision in 1994 to establish Trade House Perekriostok(“Perekriostok”). In 1996, soon after the start of opera-tions, the Company received important support fromworld-wide credit and financial institutions and continuesthis co-operation today.
Perekriostok opened the doors of its first supermarket inSeptember 1995. Today, only seven years later, the
Company owns and operates more than 40 modernsupermarkets and one hypermarket in Moscow and itsimmediate regions, operating under the trade names“Perekriostok” and “Perekriostok-Mini.” In the summerof 1998 Perekriostok opened its own distribution centreproviding significant and unprecedented cost and logis-tical advantages.
Today, Perekriostok is the largest supermarket chain inMoscow, with most stores offering shoppers more than18,000 products (SKUs) (more than 35,000 SKUs at thehypermarket) at competitive and affordable prices.
Concept & Strategy
The principal objective of Perekriostok is to providemiddle-income customers with good quality groceries atreasonable prices in a pleasant modern shopping envi-ronment where there is efficient and high-quality service.
From the very beginning Perekriostok has pursued a strat-egy of building and leasing stores in the suburban areas ofMoscow (Mitino, Zhoulebino, Otradnoe, Novo-Peredel-
RETAIL TRADE
Trade House Perekriostok
Founded in , Perekriostok, with more than modern supermarkets and one hyper-
market, is the largest supermarket chain in Moscow. Perekriostok’s , square metre
distribution centre provides significant cost and logistical advantages over its competitors.
As one of the first movers into the Russian retail sector, Perekriostok continues to expand
and strengthen its position on the Russian market and, today, is rightfully considered one
of the most competitive and efficient retail trade structures in Russia.
www.perekriostok.ru
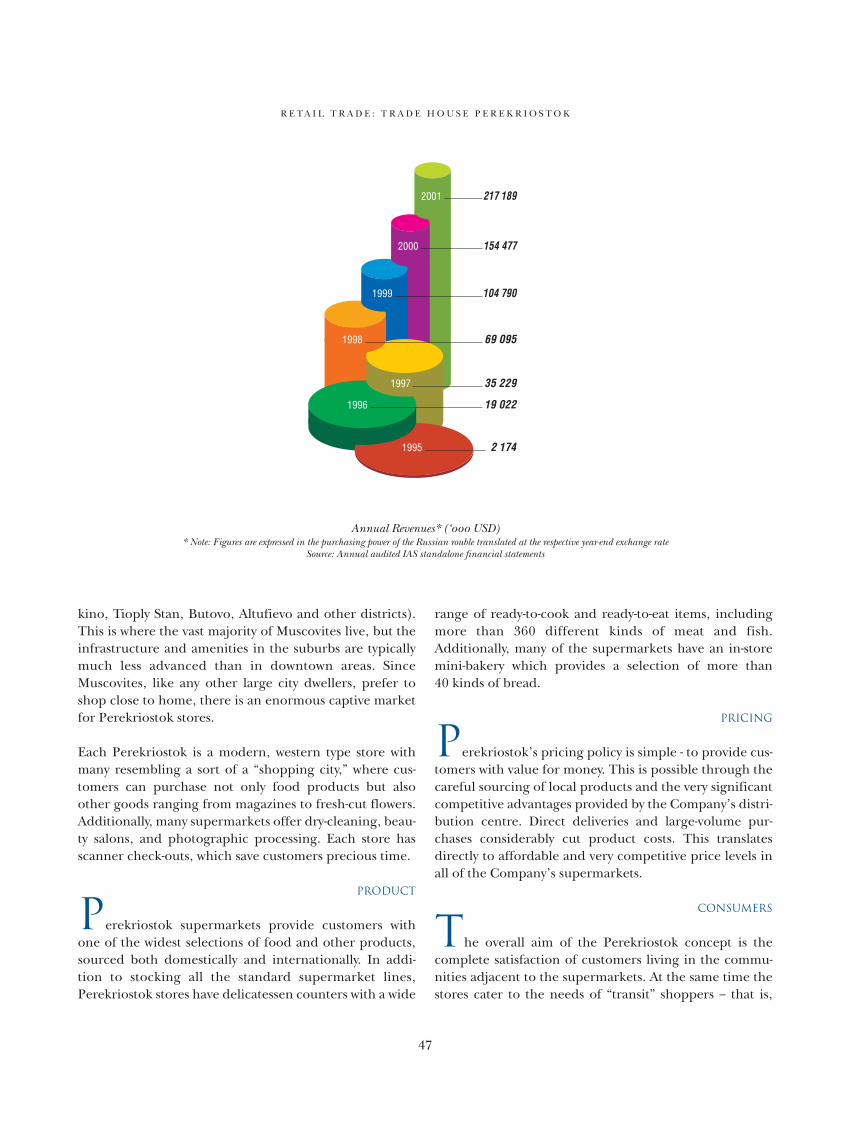
kino, Tioply Stan, Butovo, Altufievo and other districts).This is where the vast majority of Muscovites live, but theinfrastructure and amenities in the suburbs are typicallymuch less advanced than in downtown areas. SinceMuscovites, like any other large city dwellers, prefer toshop close to home, there is an enormous captive marketfor Perekriostok stores.
Each Perekriostok is a modern, western type store withmany resembling a sort of a “shopping city,” where cus-tomers can purchase not only food products but alsoother goods ranging from magazines to fresh-cut flowers.Additionally, many supermarkets offer dry-cleaning, beau-ty salons, and photographic processing. Each store hasscanner check-outs, which save customers precious time.
Product
Perekriostok supermarkets provide customers withone of the widest selections of food and other products,sourced both domestically and internationally. In addi-tion to stocking all the standard supermarket lines,Perekriostok stores have delicatessen counters with a wide
range of ready-to-cook and ready-to-eat items, includingmore than 360 different kinds of meat and fish.Additionally, many of the supermarkets have an in-storemini-bakery which provides a selection of more than40 kinds of bread.
Pricing
Perekriostok’s pricing policy is simple - to provide cus-tomers with value for money. This is possible through thecareful sourcing of local products and the very significantcompetitive advantages provided by the Company’s distri-bution centre. Direct deliveries and large-volume pur-chases considerably cut product costs. This translatesdirectly to affordable and very competitive price levels inall of the Company’s supermarkets.
Consumers
The overall aim of the Perekriostok concept is thecomplete satisfaction of customers living in the commu-nities adjacent to the supermarkets. At the same time thestores cater to the needs of “transit” shoppers – that is,
R E T A I L T R A D E : T R A D E H O U S E P E R E K R I O S T O K
Annual Revenues* (‘ USD)* Note: Figures are expressed in the purchasing power of the Russian rouble translated at the respective year-end exchange rate
Source: Annual audited IAS standalone financial statements

people who pass in their cars and decide to stop and pur-chase something. To accommodate this important seg-ment of shoppers, convenient parking areas have beencreated next to each store.
Regular market research helps to identify the needs anddesires of customers and is used to define product andpricing policies, and even store layout and design.
Personnel
Personnel are the cornerstone of any retail business,and this is particularly true in Russia, where the hiring andretaining of appropriate staff takes on an added signifi-cance. Since its inception, Perekriostok has sought to hirehigh-calibre personnel who not only have practical knowl-edge of the peculiarities of the Russian retail market butalso possess Western management skills. As there is a short-age of specialists who measure up to these demanding cri-
R E T A I L T R A D E : T R A D E H O U S E P E R E K R I O S T O K
Perekriostok Store Locations in Moscow and Moscow’s Regions
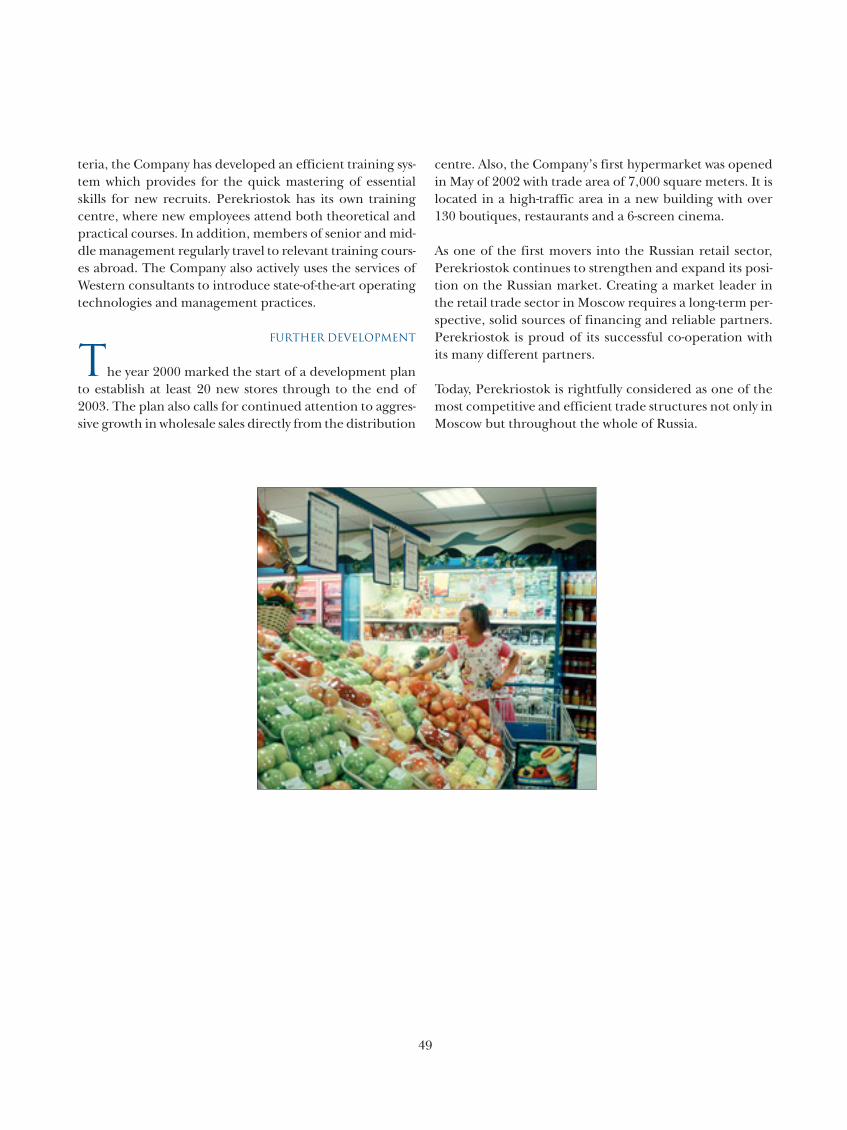
teria, the Company has developed an efficient training sys-tem which provides for the quick mastering of essentialskills for new recruits. Perekriostok has its own trainingcentre, where new employees attend both theoretical andpractical courses. In addition, members of senior and mid-dle management regularly travel to relevant training cours-es abroad. The Company also actively uses the services ofWestern consultants to introduce state-of-the-art operatingtechnologies and management practices.
Further Development
The year 2000 marked the start of a development planto establish at least 20 new stores through to the end of2003. The plan also calls for continued attention to aggres-sive growth in wholesale sales directly from the distribution
centre. Also, the Company’s first hypermarket was openedin May of 2002 with trade area of 7,000 square meters. It islocated in a high-traffic area in a new building with over130 boutiques, restaurants and a 6-screen cinema.
As one of the first movers into the Russian retail sector,Perekriostok continues to strengthen and expand its posi-tion on the Russian market. Creating a market leader inthe retail trade sector in Moscow requires a long-term per-spective, solid sources of financing and reliable partners.Perekriostok is proud of its successful co-operation withits many different partners.
Today, Perekriostok is rightfully considered as one of themost competitive and efficient trade structures not only inMoscow but throughout the whole of Russia.

POWER
OR
STRENGTH,
NOT ALWAYS VISIBLE,
WHICH ENABLES ONE
TO ACHIEVE MORE
AND TO REALISE
ONE'S POTENTIAL


UNITED FOOD COMPANY
In August 2000, Alfa Group merged its sugar business,Kubansakhar, with the sugar and grain businesses of theIntec Group. In December 2000, ZAO “ObyedinennayaProdovolstvennaya Kompaniya” was established to man-age the operations of the combined businesses of UnitedFood Company (collectively “UFC”).
Today, the main activities of UFC are the production,processing and wholesale trade in sugar and grain. UFCowns eight sugar plants, five of which are located in theKrasnodar region, two in the Orel region, and one inthe Belgorod region of Russia, and 10 grain silos, all inthe Krasnodar region. Favourable climatic conditionsand fertile soil make the Krasnodar, Belgorod and Orelregions ideal for the development of the sugar andgrain business.
Key Results for 2001
In 2001, UFC’s sugar plants produced 675,300 tonnesof refined sugar of which 155,500 tonnes were producedfrom sugar beet and 519,800 tonnes from raw cane sugar.
2001 production increased by approximately 4% as com-pared to 2000 and accounts for 10% of the market shareof total sugar production in Russia.
UFC’s grain business engages in the procurement andwholesale trade of grain (I, II and III grade wheat, corn,barley and sunflower seed) as well as the production offlour, seed corn, mixed fodder and vegetable oils. In2001, the Company procured 803,500 tonnes and distrib-uted 578,000 tonnes of grain.
One of the strategic tasks of the Company has been the estab-lishment of long-term relationships with companies engagedin sugar beet cultivation in the Krasnodar and Belgorodregions. UFC has been very successful in this goal by assistingfarmers to purchase the seed and fertiliser they need by pay-ing in advance for the sugar beet that they will grow. UFCincreased the volume of its processing of sugar beet into rawsugar by 26% over the past two years and is currently the sec-ond largest producer of sugar from sugar beet in the country.
With the introduction of sugar import quotas in 2001,UFC has managed to keep the capacity of overall rawsugar processing (from sugar beet and cane) at reasonablyhigh levels. Sugar is supplied to UFC’s plants under
FOOD PROCESSING
United Food Company
Founded originally as a sugar processing business in , United Food Company (“UFC”)
is today involved in the production, processing and wholesale trade of sugar and grain.
UFC owns and operates sugar plants and grain silos in the Krasnodar, Orel and Belgorod
regions of Russia and currently accounts for % of Russia’s total sugar production.
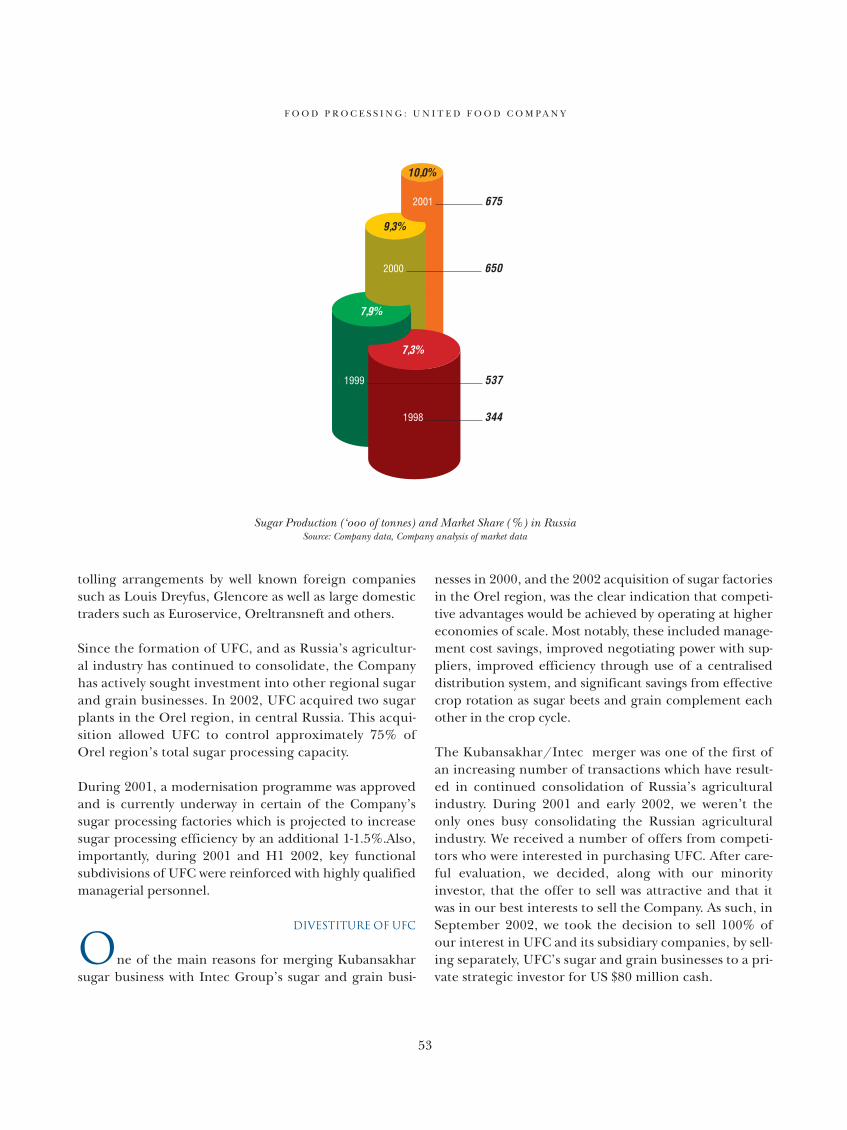
Sugar Production (‘ of tonnes) and Market Share (%) in RussiaSource: Company data, Company analysis of market data
F O O D P R O C E S S I N G : U N I T E D F O O D C O M P A N Y
tolling arrangements by well known foreign companiessuch as Louis Dreyfus, Glencore as well as large domestictraders such as Euroservice, Oreltransneft and others.
Since the formation of UFC, and as Russia’s agricultur-al industry has continued to consolidate, the Companyhas actively sought investment into other regional sugarand grain businesses. In 2002, UFC acquired two sugarplants in the Orel region, in central Russia. This acqui-sition allowed UFC to control approximately 75% ofOrel region’s total sugar processing capacity.
During 2001, a modernisation programme was approvedand is currently underway in certain of the Company’ssugar processing factories which is projected to increasesugar processing efficiency by an additional 1-1.5%.Also,importantly, during 2001 and H1 2002, key functionalsubdivisions of UFC were reinforced with highly qualifiedmanagerial personnel.
DIVESTITURE OF UFC
One of the main reasons for merging Kubansakharsugar business with Intec Group’s sugar and grain busi-
nesses in 2000, and the 2002 acquisition of sugar factoriesin the Orel region, was the clear indication that competi-tive advantages would be achieved by operating at highereconomies of scale. Most notably, these included manage-ment cost savings, improved negotiating power with sup-pliers, improved efficiency through use of a centraliseddistribution system, and significant savings from effectivecrop rotation as sugar beets and grain complement eachother in the crop cycle.
The Kubansakhar/Intec merger was one of the first ofan increasing number of transactions which have result-ed in continued consolidation of Russia’s agriculturalindustry. During 2001 and early 2002, we weren’t theonly ones busy consolidating the Russian agriculturalindustry. We received a number of offers from competi-tors who were interested in purchasing UFC. After care-ful evaluation, we decided, along with our minorityinvestor, that the offer to sell was attractive and that itwas in our best interests to sell the Company. As such, inSeptember 2002, we took the decision to sell 100% ofour interest in UFC and its subsidiary companies, by sell-ing separately, UFC’s sugar and grain businesses to a pri-vate strategic investor for US $80 million cash.
SAVVY
OR
THE COMBINATION OF INTELLECT,
SKILL, COMMON SENSE
AND CONFIDENCE.
BEING USED MOST EFFECTIVELY
TO BRING SUCCESS


GOLDEN TELECOM INC.
Alfa Group, a 41% shareholder in Golden Telecom,invests alongside the European Bank for Reconstructionand Development (11%), Russian national long-distanceoperator Rostelecom (15%), investment funds managedby Capital International Inc. (9%), and Baring VostokCapital Partners (10%) as well as other shareholders whohold approximately 14% of the Company’s stock.
Structure
Golden Telecom consists of three major operatingcompanies; TeleRoss, Sovintel and Golden TelecomUkraine, and conducts its business in Russia and theCIS through a network of affiliated or controlled struc-tures, i.e. regional branches and joint ventures. Themost significant branches are those in St. Petersburg,Khabarovsk, Irkutsk, Ufa, Arkhangelsk, andNovokuznetsk. The leading regional joint ventures aresituated in Nizhny Novgorod, Novosibirsk, Vladivostok,Tyumen, Krasnodar, Volgograd, Voronezh, and Samara.Through agents and distributors, the Company alsooperates in Azerbaijan, Belarus, Georgia andUzbekistan, and through its subsidiary in Kazakhstan.
Golden Telecom focuses on expansion of its main groupof services, including:
• Voice Services for Businesses. Using its local access overlaynetworks in Moscow, Kiev, St. Petersburg and NizhnyNovgorod, Golden Telecom provides a range of servicesincluding local exchange and access services, interna-tional and domestic long distance services;
• Data and Internet Services for Businesses. Using its fiberoptic and satellite-based networks, including 140 pointsof presence in Russia, Ukraine and other countries ofthe CIS, Golden Telecom provides data communica-tions and dedicated Internet services;
• Dial-up Internet Services. Golden Telecon is the leadingdial-up Internet services providor in Russia. The servicesare provided under the Russia-on-line (ROL) brand inmore than 50 cities of Russia as well as in the Ukraine,Kazakhstan and Uzbekistan.
Customers
Golden Telecom's customers include large, medium andsmall Russian companies, large transnational compa-nies, business centers, hotels, fixed line, mobile and pag-
TELECOMMUNICATIONS
Golden Telecom Inc
Founded in , Golden Telecom Inc is the largest independent provider of integrated
telecommunications services including local exchange and access services, international
and domestic long distance services and Internet access to businesses and other high-
usage customers and telecommunications operators in Moscow, Kiev, St. Petersburg, and
other major population centres in Russia and CIS countries. Its shares are traded in the
U.S. on the NASDAQ under the trading symbol “GLDN.”
www.goldentelecom.ru
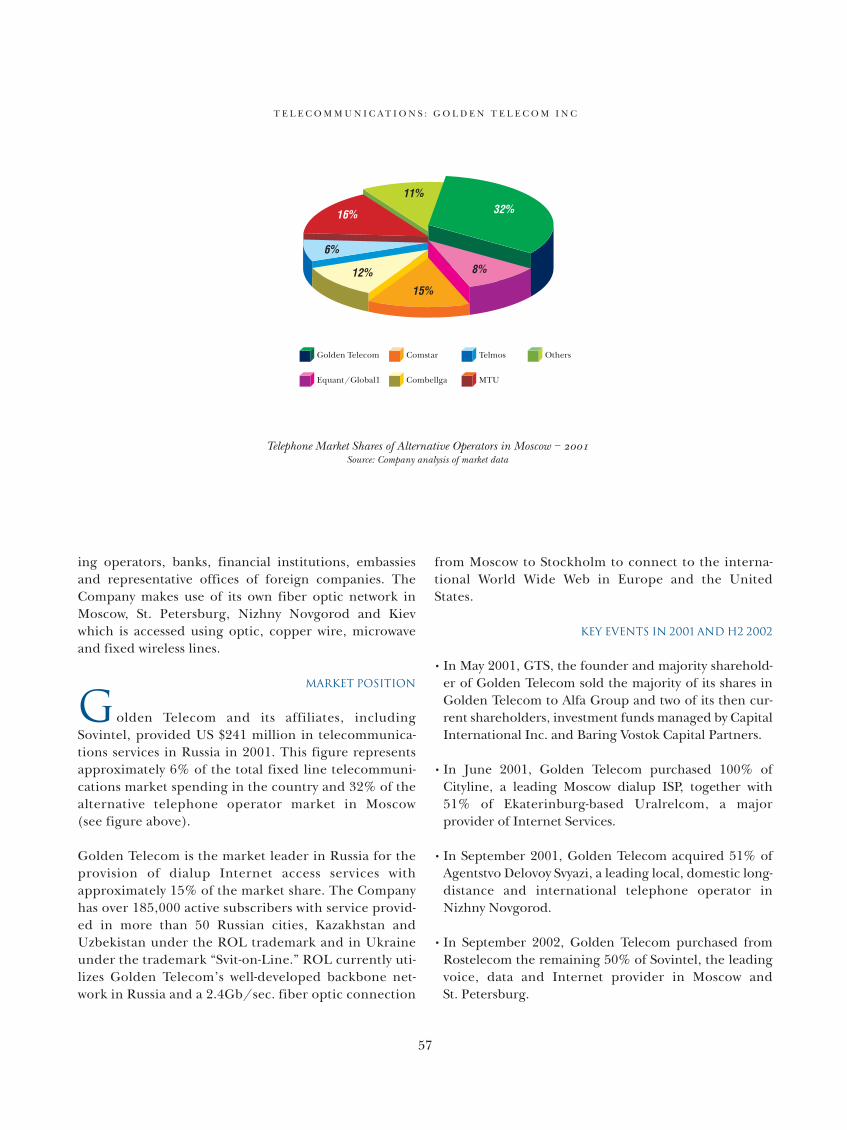
ing operators, banks, financial institutions, embassiesand representative offices of foreign companies. TheCompany makes use of its own fiber optic network inMoscow, St. Petersburg, Nizhny Novgorod and Kievwhich is accessed using optic, copper wire, microwaveand fixed wireless lines.
Market Position
Golden Telecom and its affiliates, includingSovintel, provided US $241 million in telecommunica-tions services in Russia in 2001. This figure representsapproximately 6% of the total fixed line telecommuni-cations market spending in the country and 32% of thealternative telephone operator market in Moscow(see figure above).
Golden Telecom is the market leader in Russia for theprovision of dialup Internet access services withapproximately 15% of the market share. The Companyhas over 185,000 active subscribers with service provid-ed in more than 50 Russian cities, Kazakhstan andUzbekistan under the ROL trademark and in Ukraineunder the trademark “Svit-on-Line.” ROL currently uti-lizes Golden Telecom’s well-developed backbone net-work in Russia and a 2.4Gb/sec. fiber optic connection
from Moscow to Stockholm to connect to the interna-tional World Wide Web in Europe and the UnitedStates.
Key Events in 2001 and H2 2002
• In May 2001, GTS, the founder and majority sharehold-er of Golden Telecom sold the majority of its shares inGolden Telecom to Alfa Group and two of its then cur-rent shareholders, investment funds managed by CapitalInternational Inc. and Baring Vostok Capital Partners.
• In June 2001, Golden Telecom purchased 100% ofCityline, a leading Moscow dialup ISP, together with51% of Ekaterinburg-based Uralrelcom, a majorprovider of Internet Services.
• In September 2001, Golden Telecom acquired 51% ofAgentstvo Delovoy Svyazi, a leading local, domestic long-distance and international telephone operator inNizhny Novgorod.
• In September 2002, Golden Telecom purchased fromRostelecom the remaining 50% of Sovintel, the leadingvoice, data and Internet provider in Moscow andSt. Petersburg.
T E L E C O M M U N I C A T I O N S : G O L D E N T E L E C O M I N C
Telephone Market Shares of Alternative Operators in Moscow – Source: Company analysis of market data
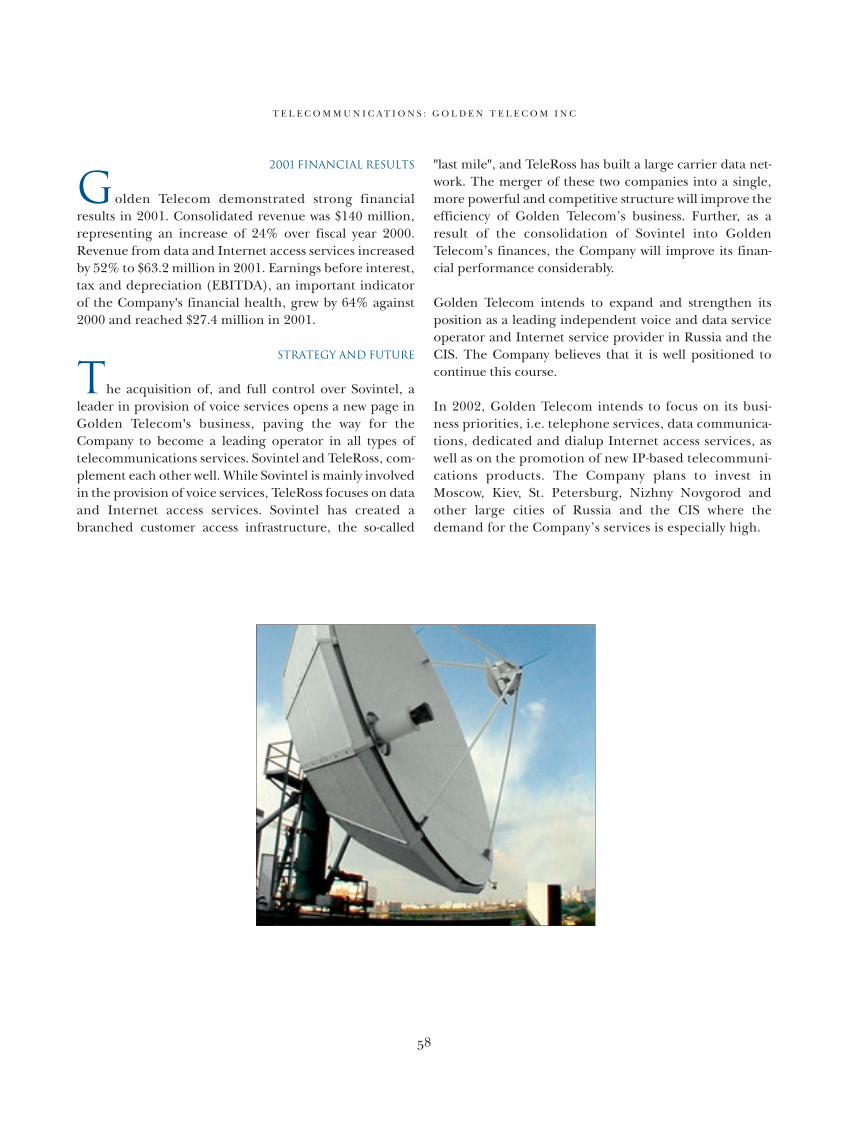
2001 Financial Results
Golden Telecom demonstrated strong financialresults in 2001. Consolidated revenue was $140 million,representing an increase of 24% over fiscal year 2000.Revenue from data and Internet access services increasedby 52% to $63.2 million in 2001. Earnings before interest,tax and depreciation (EBITDA), an important indicatorof the Company's financial health, grew by 64% against2000 and reached $27.4 million in 2001.
Strategy and Future
The acquisition of, and full control over Sovintel, aleader in provision of voice services opens a new page inGolden Telecom's business, paving the way for theCompany to become a leading operator in all types oftelecommunications services. Sovintel and TeleRoss, com-plement each other well. While Sovintel is mainly involvedin the provision of voice services, TeleRoss focuses on dataand Internet access services. Sovintel has created abranched customer access infrastructure, the so-called
"last mile", and TeleRoss has built a large carrier data net-work. The merger of these two companies into a single,more powerful and competitive structure will improve theefficiency of Golden Telecom’s business. Further, as aresult of the consolidation of Sovintel into GoldenTelecom’s finances, the Company will improve its finan-cial performance considerably.
Golden Telecom intends to expand and strengthen itsposition as a leading independent voice and data serviceoperator and Internet service provider in Russia and theCIS. The Company believes that it is well positioned tocontinue this course.
In 2002, Golden Telecom intends to focus on its busi-ness priorities, i.e. telephone services, data communica-tions, dedicated and dialup Internet access services, aswell as on the promotion of new IP-based telecommuni-cations products. The Company plans to invest inMoscow, Kiev, St. Petersburg, Nizhny Novgorod andother large cities of Russia and the CIS where thedemand for the Company’s services is especially high.
T E L E C O M M U N I C A T I O N S : G O L D E N T E L E C O M I N C
VIMPELCOM
Vimpel-Communications (“VimpelCom”) is a leadingRussian wireless telecommunications service companyand is the market leader in offering its subscribers the lat-est in technology and data services, including wireless"infotainment" services, location-based services, mobileportal and wireless Internet access through “BeeOnline.”
In addition to being the first Russian company to list its shareson the New York Stock Exchange (“NYSE”) in November1996, VimpelCom, in July 2000, was also the first Russiancompany to sell US SEC-registered convertible notes whichare also listed on the NYSE under the trading symbol “VIP 05”.
Alfa Group, invests into VimpelCom alongside Telenor,Norway’s leading telecommunications company as well asother shareholders.
Market Position
Since its inception, VimpelCom has played a key rolein the development of the Russian wireless telecommuni-
cations industry. The Company introduced two digital cel-lular communications standards and built the first dualband GSM-900/1800 cellular network. VimpelCom alsoled the development and emergence of the mass con-sumer market for wireless communications in Russia byintroducing a prepaid card solution.
Today, the Company’s license portfolio covers approximate-ly 70% of Russia’s population (100 million people), includ-ing the city of Moscow, Moscow region, Siberia, Volga Riverarea, Central Russia and the Northern Caucuses.
At the end of 2001, VimpelCom’s total subscriber base wasapproximately 2.11 million. By the end of 2001,VimpelCom reclaimed the lead in Moscow in gross salesand net subscriber additions and grew its subscriber basein the Moscow license area from 780 thousand atDecember 2000 to 1.91 million at December 2001.According to independent sources, the Company beganthe year with a market share in Moscow of 39.1% andended 2001 with a market share of 46.5%.
During 2001, Vimpelcom’s subscribers outside of Moscowincreased by almost 4 times during 2001 as the Company’s
VimpelCom
Founded in , Vimpel-Communications (“VimpelCom”) is one of the largest wireless
telecommunications service companies in Russia. It operates under the “Bee Line” family of
brand names, which are among the most recognised brands in Russia. VimpelCom’s licence
portfolio covers million people, approximately % of Russia’s population.
VimpelCom-R, a subsidiary of VimpelCom, was established and is aggressively expanding to
develop the Russian regional cellular telecommunications market. Its shares are traded in
the US on the NYSE under the trading symbol “VIP.”
www.beelinegsm.ru

national expansion gained momentum. VimpelCom-R,VimpelCom’s subsidiary dedicated to national develop-ment, launched 15 networks between September 2001and January 2002 in several key Russian cities such asNizhniy Novgorod, Novosibirsk, Kemerovo, Novo-kuznetsk, Rostov and Saratov.
2001 Financial Results
VimpelCom returned to profitability in the first quarterof 2001 and improved its financial performancethroughout the year. For the year 2001, VimpelComreported net revenues of US $422.6 million, a 54.2%increase from 2000; EBITDA reached US $148.5 mil-lion, a 185.5% increase from 2000; EBITDA margin was35.1%, compared to EBITDA margin of 19.0% in 2000;and net income was US $47.3 million, compared to a netloss of US $77.8 million in 2000.
The significant improvements in VimpelCom’s financialand operating results were achieved as a result of rapidsubscriber growth with an increasing effect of economies
of scale, efficient cost control, decreasing telecommuni-cations equipment costs, improved interconnect agree-ments with telephone line providers and lower acquisitioncosts per subscriber.
The Company’s total capital expenditures for 2001 wereapproximately US $238 million, with US $163 millionspent in the Moscow and Moscow region license areas.
Strategy for 2002 and Beyond
VimpelCom’s strategy aims at securing long-term prof-itable growth for the Company. In 2002, VimpelComplans a further strengthening of its position in Moscow,which is the biggest and most important market inRussia. VimpelCom is using a segmented marketapproach with dedicated focus on service quality andproduct innovation. Such an approach should enablethe Company to increase its market share in the corpo-rate and high-end user segments while maintaining itsleadership in the mass consumer segment. TheCompany is also focused on accelerating growth in the
T E L E C O M M U N I C A T I O N S : V I M P E L C O M
VimpelCom Subscriber Growth (# of customers) in MoscowSource: Company data
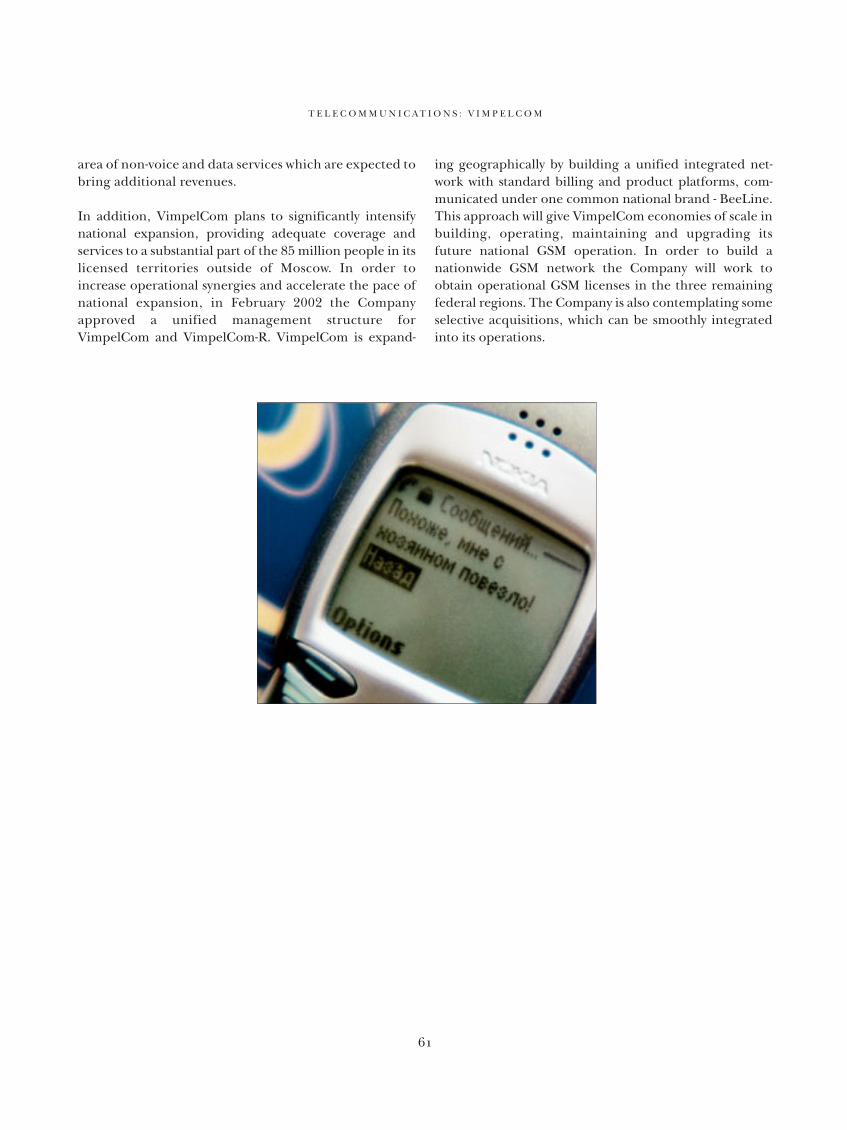
area of non-voice and data services which are expected tobring additional revenues.
In addition, VimpelCom plans to significantly intensifynational expansion, providing adequate coverage andservices to a substantial part of the 85 million people in itslicensed territories outside of Moscow. In order toincrease operational synergies and accelerate the pace ofnational expansion, in February 2002 the Companyapproved a unified management structure forVimpelCom and VimpelCom-R. VimpelCom is expand-
ing geographically by building a unified integrated net-work with standard billing and product platforms, com-municated under one common national brand - BeeLine.This approach will give VimpelCom economies of scale inbuilding, operating, maintaining and upgrading itsfuture national GSM operation. In order to build anationwide GSM network the Company will work toobtain operational GSM licenses in the three remainingfederal regions. The Company is also contemplating someselective acquisitions, which can be smoothly integratedinto its operations.
T E L E C O M M U N I C A T I O N S : V I M P E L C O M
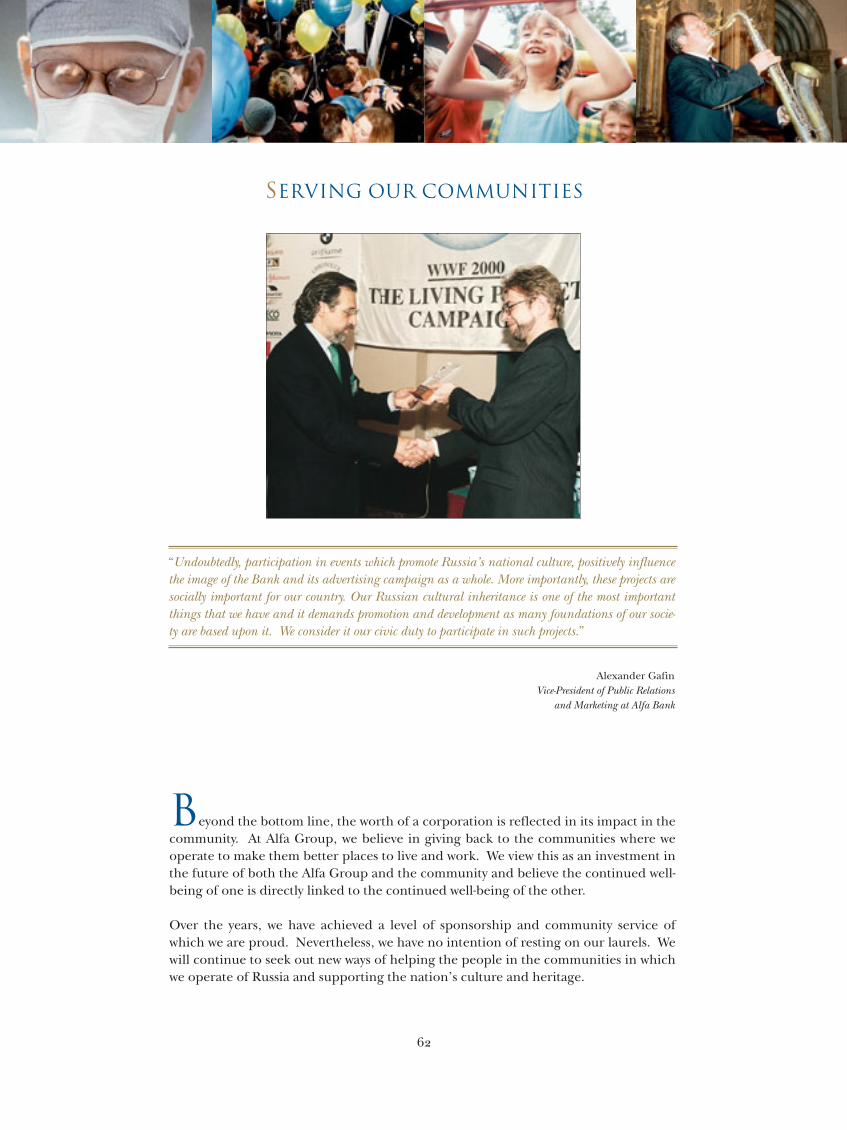
Beyond the bottom line, the worth of a corporation is reflected in its impact in thecommunity. At Alfa Group, we believe in giving back to the communities where weoperate to make them better places to live and work. We view this as an investment inthe future of both the Alfa Group and the community and believe the continued well-being of one is directly linked to the continued well-being of the other.
Over the years, we have achieved a level of sponsorship and community service ofwhich we are proud. Nevertheless, we have no intention of resting on our laurels. Wewill continue to seek out new ways of helping the people in the communities in whichwe operate of Russia and supporting the nation’s culture and heritage.
SERVING OUR COMMUNITIES
“Undoubtedly, participation in events which promote Russia’s national culture, positively influencethe image of the Bank and its advertising campaign as a whole. More importantly, these projects aresocially important for our country. Our Russian cultural inheritance is one of the most importantthings that we have and it demands promotion and development as many foundations of our socie-ty are based upon it. We consider it our civic duty to participate in such projects.”
Alexander GafinVice-President of Public Relations
and Marketing at Alfa Bank
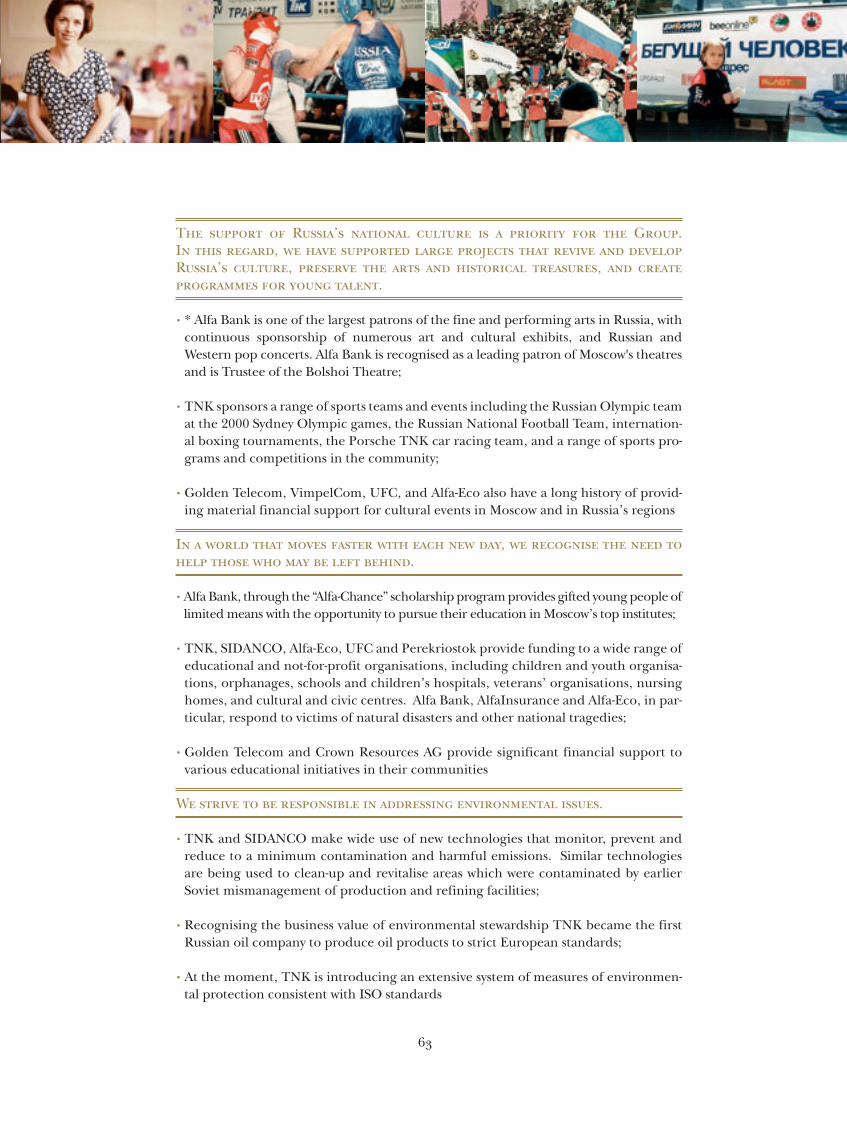
T R’ G.I , R’ , , .
• * Alfa Bank is one of the largest patrons of the fine and performing arts in Russia, withcontinuous sponsorship of numerous art and cultural exhibits, and Russian andWestern pop concerts. Alfa Bank is recognised as a leading patron of Moscow's theatresand is Trustee of the Bolshoi Theatre;
• TNK sponsors a range of sports teams and events including the Russian Olympic teamat the 2000 Sydney Olympic games, the Russian National Football Team, internation-al boxing tournaments, the Porsche TNK car racing team, and a range of sports pro-grams and competitions in the community;
• Golden Telecom, VimpelCom, UFC, and Alfa-Eco also have a long history of provid-ing material financial support for cultural events in Moscow and in Russia’s regions
I , .
• Alfa Bank, through the “Alfa-Chance” scholarship program provides gifted young people oflimited means with the opportunity to pursue their education in Moscow’s top institutes;
• TNK, SIDANCO, Alfa-Eco, UFC and Perekriostok provide funding to a wide range ofeducational and not-for-profit organisations, including children and youth organisa-tions, orphanages, schools and children’s hospitals, veterans’ organisations, nursinghomes, and cultural and civic centres. Alfa Bank, AlfaInsurance and Alfa-Eco, in par-ticular, respond to victims of natural disasters and other national tragedies;
• Golden Telecom and Crown Resources AG provide significant financial support tovarious educational initiatives in their communities
W .
• TNK and SIDANCO make wide use of new technologies that monitor, prevent andreduce to a minimum contamination and harmful emissions. Similar technologiesare being used to clean-up and revitalise areas which were contaminated by earlierSoviet mismanagement of production and refining facilities;
• Recognising the business value of environmental stewardship TNK became the firstRussian oil company to produce oil products to strict European standards;
• At the moment, TNK is introducing an extensive system of measures of environmen-tal protection consistent with ISO standards

CONTACT INFORMATION
GOLDEN TELECOM
President: Alexander VinogradovAddress: Krasnokazarmenaya Street, Moscow, , RussiaTel.: + () Fax: + () E-mail: [email protected]
UNITED FOOD COMPANY
Member of the Board of Directors and Chief Executive Officer: Mikhail GamzinAddress: Ordzhonikidzye Street, Krasnodar, , RussiaTel.: + () Fax: + () E-mail: [email protected]
TRADE HOUSE PEREKRIOSTOK
Chief Executive Officer: Alexander KosyanenkoAddress: O/S Paveltsevo, Mytishi District, Moscow region, ,RussiaTel.: + () Fax: + () E-mail: [email protected]
VIMPELCOM
Chief Executive Officer: Jo LunderVice President of International and Investor Relations: Valery GoldinAddress: th Marta Street, Moscow, , RussiaTel.: + () Fax: + () E-mail: [email protected]
CTF HOLDINGS LTD
Director: Franz WolfAddress: Irish Place, Suite , GibraltarTel.: () Fax: () E-mail: [email protected]
MOSCOW CONTACT INFORMATION:Director of Corporate Development, Finance & Control–Alfa Group: Nigel RobinsonDeputy Director of Corporate Development, Finance & Control–Alfa Group: David GouldAddress: Smolenskaya Square, Floor , Moscow, , RussiaTel.: + () Fax: + () E-mail: [email protected]
ALFA BANK GROUP
Chairman of the Board: Mikhail FridmanPresident: Pyotr AvenAddress: Mashi Poryvaevoy Street, Moscow, , RussiaTel.: + () , () Fax: + () E-mail: [email protected]
ALFAINSURANCE
Chief Executive Officer: Vladimir SkvortsovAddress: Mashi Poryvaevoy Street, Moscow, , RussiaTel.: + () Fax: + () E-mail: [email protected]
TYUMEN OIL COMPANY
President: Simon KukesAddress: Schipok Street, Building , Moscow, , RussiaTel.: + () Fax: + () E-mail: [email protected]
SIDANCO OIL COMPANY
President: Lawrence SmythAddress: Schepkina Street, Building a, Moscow, , RussiaTel.: + () Fax.: + () E-mail: [email protected]
CROWN RESOURCE AG
Chief Executive Officer: Steven RudofskyAddress: Cavendish Square, th Floor, London, WM HF, UKTel.: + () Fax: + () E-mail: [email protected]
ALFA-ECO GROUP
General Director: Alexander Fain Address: Novy Arbat Street, Moscow, , RussiaTel.: + () Fax: + () E-mail: [email protected]
ALFA GROUP
CONSOLIDATED FINANCIAL STATEMENTS AND REPORT OF THE AUDITORS
FOR THE YEAR ENDED 31 DECEMBER 2001

STATEMENT OF MANAGEMENT’S RESPONSIBILITIES
TO THE SHAREHOLDERS OF ALFA GROUP
. International convention requires that Management prepare consolidated financial statements which give a true and fair viewof the state of affairs of Alfa Group (“the Group”) at the end of each financial period and of the results, cash flows and changesin shareholders’ equity for each period. Management are responsible for ensuring that the Group keeps accounting recordswhich disclose, with reasonable accuracy, the financial position of each entity and which enable it to ensure that the consoli-dated financial statements comply with International Accounting Standards and that their statutory accounting reports complywith the applicable country’s laws and regulations. Furthermore, appropriate adjustments were made to such statutoryaccounts to present the accompanying consolidated financial statements in accordance with International AccountingStandards. Management also have a general responsibility for taking such steps as are reasonably possible to safeguard theassets of the Group and to prevent and detect fraud and other irregularities.
. Management considers that, in preparing the consolidated financial statements set out on pages to , the Group has usedappropriate and consistently applied accounting policies, which are supported by reasonable and prudent judgments andestimates and that appropriate International Accounting Standards have been followed.
For and on behalf of Management
Nigel J. Robinson October

REPORT OF THE AUDITORS
TO THE SHAREHOLDERS OF ALFA GROUP
. We have audited the accompanying consolidated balance sheet of Alfa Group (“the Group”), as defined in Note , at December and the related consolidated statements of income, of cash flows and of changes in shareholders’ equity forthe year then ended. These consolidated financial statements are the responsibility of the Group’s Management. Our respon-sibility is to express an opinion on these consolidated financial statements based on our audit.
. We conducted our audit in accordance with International Standards on Auditing. Those standards require that we plan andperform the audit to obtain reasonable assurance about whether the consolidated financial statements are free of materialmisstatement. An audit includes examining, on a test basis, evidence supporting the amounts and disclosures in the consoli-dated financial statements. An audit also includes assessing the accounting principles used and significant estimates made byManagement, as well as evaluating the overall consolidated financial statement presentation. We believe that our auditprovides a reasonable basis for our opinion.
. In our opinion, the consolidated financial statements present fairly, in all material respects, the consolidated financial posi-tion of the Group as at December and the consolidated results of its operations and its cash flows for the year thenended in accordance with International Accounting Standards.
Moscow, Russia October
ZAO PricewaterhouseCoopers Audit
Kosmodamianskaya Nab. 52, Bld. 5 115054 Moscow RussiaTelephone +7 (095) 967 6000Facsimile +7 (095) 967 6001

Note Restated
ASSETS
Non-current assetsProperty, plant and equipment . . . . . . . . . . . . . . . . . . . . . . . . . . . . . . . . . . . . . . . . . . . . . . . . . . . . 4 268,355 195,650 Investments available for sale . . . . . . . . . . . . . . . . . . . . . . . . . . . . . . . . . . . . . . . . . . . . . . . . . . . . . 5 139,339 100,168 Investment in joint ventures . . . . . . . . . . . . . . . . . . . . . . . . . . . . . . . . . . . . . . . . . . . . . . . . . . . . . . 6 1,653,192 1,069,187Investment in associated companies . . . . . . . . . . . . . . . . . . . . . . . . . . . . . . . . . . . . . . . . . . . . . . . 7 244,460 -Due from banks . . . . . . . . . . . . . . . . . . . . . . . . . . . . . . . . . . . . . . . . . . . . . . . . . . . . . . . . . . . . . . . . 8 4,524 158Loans and advances to customers . . . . . . . . . . . . . . . . . . . . . . . . . . . . . . . . . . . . . . . . . . . . . . . . . . 9 98,329 172,116Trade and other accounts receivable . . . . . . . . . . . . . . . . . . . . . . . . . . . . . . . . . . . . . . . . . . . . . . . 10 4,382 6,241Deferred income tax . . . . . . . . . . . . . . . . . . . . . . . . . . . . . . . . . . . . . . . . . . . . . . . . . . . . . . . . . . . . 19 2,094 383 Goodwill, net . . . . . . . . . . . . . . . . . . . . . . . . . . . . . . . . . . . . . . . . . . . . . . . . . . . . . . . . . . . . . . . . . . 21 (613) (517)
2,414,062 1,543,386
Current assetsInventories . . . . . . . . . . . . . . . . . . . . . . . . . . . . . . . . . . . . . . . . . . . . . . . . . . . . . . . . . . . . . . . . . . . . 11 98,774 104,546 Investments available for sale . . . . . . . . . . . . . . . . . . . . . . . . . . . . . . . . . . . . . . . . . . . . . . . . . . . . . 5 28,092 35,714 Trade and other accounts receivable . . . . . . . . . . . . . . . . . . . . . . . . . . . . . . . . . . . . . . . . . . . . . . . 10 444,816 544,166 Income tax assets . . . . . . . . . . . . . . . . . . . . . . . . . . . . . . . . . . . . . . . . . . . . . . . . . . . . . . . . . . . . . . . 403 - Loans and advances to customers . . . . . . . . . . . . . . . . . . . . . . . . . . . . . . . . . . . . . . . . . . . . . . . . . . 9 1,116,730 792,587 Trading securities . . . . . . . . . . . . . . . . . . . . . . . . . . . . . . . . . . . . . . . . . . . . . . . . . . . . . . . . . . . . . . 12 156,673 134,091 Due from banks . . . . . . . . . . . . . . . . . . . . . . . . . . . . . . . . . . . . . . . . . . . . . . . . . . . . . . . . . . . . . . . . 8 119,833 21,001 Cash and cash equivalents . . . . . . . . . . . . . . . . . . . . . . . . . . . . . . . . . . . . . . . . . . . . . . . . . . . . . . . . 13 709,682 677,941
2,675,003 2,310,046
Total assets . . . . . . . . . . . . . . . . . . . . . . . . . . . . . . . . . . . . . . . . . . . . . . . . . . . . . . . . . . . . . . . . . . . . 29 5,089,065 3,853,432
EQUITY AND LIABILITIES
Shareholders' equityShare capital . . . . . . . . . . . . . . . . . . . . . . . . . . . . . . . . . . . . . . . . . . . . . . . . . . . . . . . . . . . . . . . . . . . 14 17,872 17,872 Share premium . . . . . . . . . . . . . . . . . . . . . . . . . . . . . . . . . . . . . . . . . . . . . . . . . . . . . . . . . . . . . . . . . 14 10,102 10,102 Investments fair value reserve . . . . . . . . . . . . . . . . . . . . . . . . . . . . . . . . . . . . . . . . . . . . . . . . . . . . . 5 36,268 -Cumulative translation reserve . . . . . . . . . . . . . . . . . . . . . . . . . . . . . . . . . . . . . . . . . . . . . . . . . . . . (888) 6,350 Retained earnings . . . . . . . . . . . . . . . . . . . . . . . . . . . . . . . . . . . . . . . . . . . . . . . . . . . . . . . . . . . . . . . 1,678,695 896,383
1,742,049 930,707
Minority interests . . . . . . . . . . . . . . . . . . . . . . . . . . . . . . . . . . . . . . . . . . . . . . . . . . . . . . . . . . . . . . . 26 386,232 196,584
Non-current liabilitiesBorrowings . . . . . . . . . . . . . . . . . . . . . . . . . . . . . . . . . . . . . . . . . . . . . . . . . . . . . . . . . . . . . . . . . . . . 15 66,511 78,551 Amounts owed to depositors . . . . . . . . . . . . . . . . . . . . . . . . . . . . . . . . . . . . . . . . . . . . . . . . . . . . . . 16 3,852 45,752 Due to banks . . . . . . . . . . . . . . . . . . . . . . . . . . . . . . . . . . . . . . . . . . . . . . . . . . . . . . . . . . . . . . . . . . . 17 9,581 3,806 Accounts payable . . . . . . . . . . . . . . . . . . . . . . . . . . . . . . . . . . . . . . . . . . . . . . . . . . . . . . . . . . . . . . . 22 17,531 42,401 Provisions . . . . . . . . . . . . . . . . . . . . . . . . . . . . . . . . . . . . . . . . . . . . . . . . . . . . . . . . . . . . . . . . . . . . 18 23,737 67,574 Deferred income tax . . . . . . . . . . . . . . . . . . . . . . . . . . . . . . . . . . . . . . . . . . . . . . . . . . . . . . . . . . . . 19 26,563 81,428
147,775 319,512
Current liabilitiesBorrowings . . . . . . . . . . . . . . . . . . . . . . . . . . . . . . . . . . . . . . . . . . . . . . . . . . . . . . . . . . . . . . . . . . . . 15 650,122 642,337 Amounts owed to depositors . . . . . . . . . . . . . . . . . . . . . . . . . . . . . . . . . . . . . . . . . . . . . . . . . . . . . . 16 1,317,125 876,386 Due to banks . . . . . . . . . . . . . . . . . . . . . . . . . . . . . . . . . . . . . . . . . . . . . . . . . . . . . . . . . . . . . . . . . . . 17 330,696 177,355 Accounts payable . . . . . . . . . . . . . . . . . . . . . . . . . . . . . . . . . . . . . . . . . . . . . . . . . . . . . . . . . . . . . . . 22 509,057 702,516 Income tax liabilities . . . . . . . . . . . . . . . . . . . . . . . . . . . . . . . . . . . . . . . . . . . . . . . . . . . . . . . . . . . . 6,009 8,035
2,813,009 2,406,629
Total liabilities . . . . . . . . . . . . . . . . . . . . . . . . . . . . . . . . . . . . . . . . . . . . . . . . . . . . . . . . . . . . . . . . . 29 2,960,784 2,726,141
Total equity and liabilities . . . . . . . . . . . . . . . . . . . . . . . . . . . . . . . . . . . . . . . . . . . . . . . . . . . . . . . 5,089,065 3,853,432
Approved on behalf of Management
Nigel J. Robinson8 October 2002Notes 1 to 37 form an integral part of these consolidated financial statements
ALFA GROUP Consolidated balance sheet at December
(Expressed in thousand US dollars for presentational purposes only – see Note )

Note Restated
Sales . . . . . . . . . . . . . . . . . . . . . . . . . . . . . . . . . . . . . . . . . . . . . . . . . . . . . . . . . . . . . . . . . . . . . . . . . 29 3,375,546 5,747,239
Cost of goods sold . . . . . . . . . . . . . . . . . . . . . . . . . . . . . . . . . . . . . . . . . . . . . . . . . . . . . . . . . . . . . . 29 (3,248,596) (5,512,099)
Gross profit . . . . . . . . . . . . . . . . . . . . . . . . . . . . . . . . . . . . . . . . . . . . . . . . . . . . . . . . . . . . . . . . . . . . 126,950 235,140
Commission income on trading operations . . . . . . . . . . . . . . . . . . . . . . . . . . . . . . . . . . . . . . . . . 10,487 31,307
Net interest, fees and other income on banking activities . . . . . . . . . . . . . . . . . . . . . . . . . . . . . . 23 296,884 90,465
Gains less losses arising from trading securities . . . . . . . . . . . . . . . . . . . . . . . . . . . . . . . . . . . . . . 30,470 49,477
Gains less losses arising from investments available for sale . . . . . . . . . . . . . . . . . . . . . . . . . . . . 5 56,477 48,832
Provisions on operating items . . . . . . . . . . . . . . . . . . . . . . . . . . . . . . . . . . . . . . . . . . . . . . . . . . . . . 20 (2,957) (26,415)
Selling and distribution expenses . . . . . . . . . . . . . . . . . . . . . . . . . . . . . . . . . . . . . . . . . . . . . . . . . (33,611) (35,069)
General and administrative expenses . . . . . . . . . . . . . . . . . . . . . . . . . . . . . . . . . . . . . . . . . . . . . . . 24 (438,610) (332,842)
Operating income . . . . . . . . . . . . . . . . . . . . . . . . . . . . . . . . . . . . . . . . . . . . . . . . . . . . . . . . . . . . . . 46,090 60,895
Share of results of joint ventures (net) . . . . . . . . . . . . . . . . . . . . . . . . . . . . . . . . . . . . . . . . . . . . . . 6 803,961 1,083,239
Share of results of associated companies (net) . . . . . . . . . . . . . . . . . . . . . . . . . . . . . . . . . . . . . . . 7 6,256 -
Gains on debt transactions . . . . . . . . . . . . . . . . . . . . . . . . . . . . . . . . . . . . . . . . . . . . . . . . . . . . . . . - 15,481
Interest expense (net) . . . . . . . . . . . . . . . . . . . . . . . . . . . . . . . . . . . . . . . . . . . . . . . . . . . . . . . . . . . 25 (9,828) (9,609)
Net foreign exchange translation gains/(losses) . . . . . . . . . . . . . . . . . . . . . . . . . . . . . . . . . . . . . (12,186) 19,042
Monetary gains . . . . . . . . . . . . . . . . . . . . . . . . . . . . . . . . . . . . . . . . . . . . . . . . . . . . . . . . . . . . . . . . . 68,503 105,403
Other expenses (net) . . . . . . . . . . . . . . . . . . . . . . . . . . . . . . . . . . . . . . . . . . . . . . . . . . . . . . . . . . . . (2,284) (3,054)
Profit before income tax and minority interests . . . . . . . . . . . . . . . . . . . . . . . . . . . . . . . . . . . 29 900,512 1,271,397
Income tax credit/(charge) . . . . . . . . . . . . . . . . . . . . . . . . . . . . . . . . . . . . . . . . . . . . . . . . . . . . . . 19 61,142 (37,453)
Net profit after income tax and before minority interest . . . . . . . . . . . . . . . . . . . . . . . . . . . . 961,654 1,233,944
Minority interests . . . . . . . . . . . . . . . . . . . . . . . . . . . . . . . . . . . . . . . . . . . . . . . . . . . . . . . . . . . . . . . 26 (164,602) (172,892)
Net profit . . . . . . . . . . . . . . . . . . . . . . . . . . . . . . . . . . . . . . . . . . . . . . . . . . . . . . . . . . . . . . . . . . . . . 29 797,052 1,061,052
Notes 1 to 37 form an integral part of these consolidated financial statements.
ALFA GROUP Consolidated statement of income for the year ended December (Expressed in thousand US dollars for presentational purposes only – see Note )
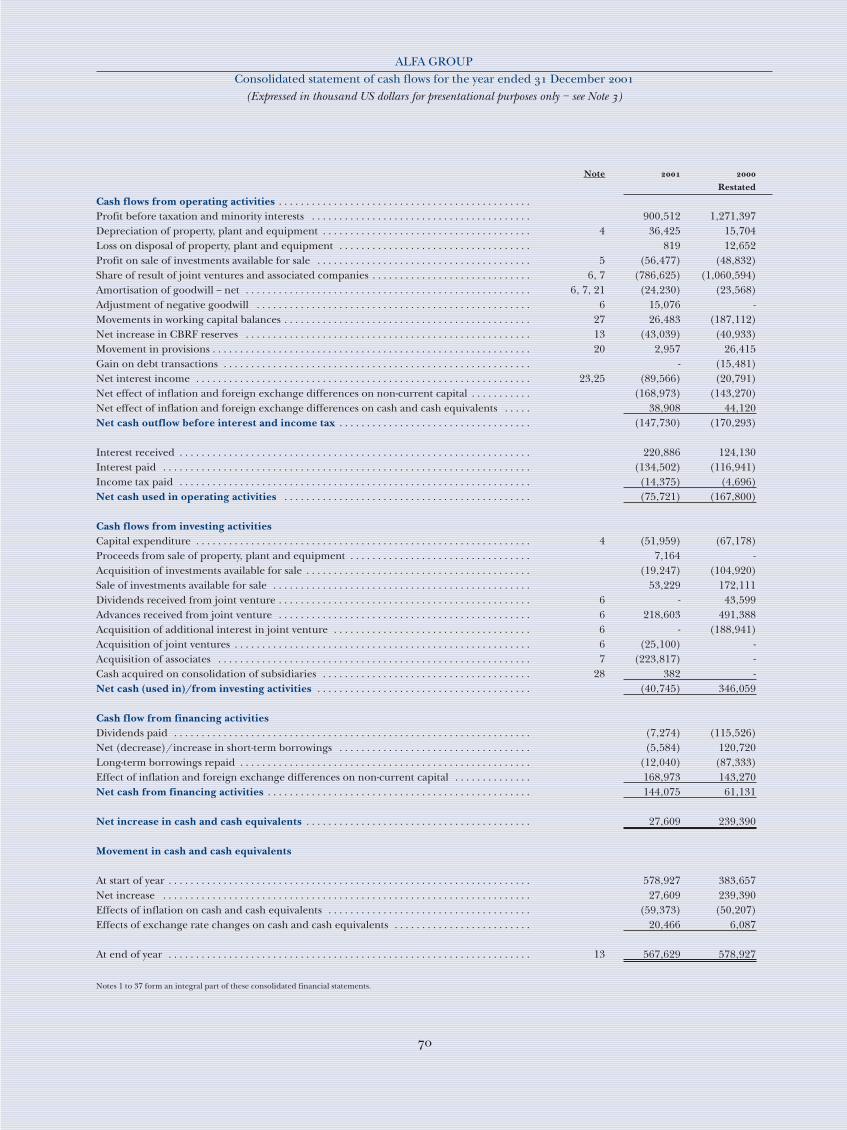
Note Restated
Cash flows from operating activities . . . . . . . . . . . . . . . . . . . . . . . . . . . . . . . . . . . . . . . . . . . . . .Profit before taxation and minority interests . . . . . . . . . . . . . . . . . . . . . . . . . . . . . . . . . . . . . . . . 900,512 1,271,397Depreciation of property, plant and equipment . . . . . . . . . . . . . . . . . . . . . . . . . . . . . . . . . . . . . . 4 36,425 15,704Loss on disposal of property, plant and equipment . . . . . . . . . . . . . . . . . . . . . . . . . . . . . . . . . . . 819 12,652Profit on sale of investments available for sale . . . . . . . . . . . . . . . . . . . . . . . . . . . . . . . . . . . . . . . 5 (56,477) (48,832)Share of result of joint ventures and associated companies . . . . . . . . . . . . . . . . . . . . . . . . . . . . . 6, 7 (786,625) (1,060,594)Amortisation of goodwill – net . . . . . . . . . . . . . . . . . . . . . . . . . . . . . . . . . . . . . . . . . . . . . . . . . . . . 6, 7, 21 (24,230) (23,568)Adjustment of negative goodwill . . . . . . . . . . . . . . . . . . . . . . . . . . . . . . . . . . . . . . . . . . . . . . . . . . 6 15,076 -Movements in working capital balances . . . . . . . . . . . . . . . . . . . . . . . . . . . . . . . . . . . . . . . . . . . . . 27 26,483 (187,112)Net increase in CBRF reserves . . . . . . . . . . . . . . . . . . . . . . . . . . . . . . . . . . . . . . . . . . . . . . . . . . . . 13 (43,039) (40,933)Movement in provisions . . . . . . . . . . . . . . . . . . . . . . . . . . . . . . . . . . . . . . . . . . . . . . . . . . . . . . . . . . 20 2,957 26,415Gain on debt transactions . . . . . . . . . . . . . . . . . . . . . . . . . . . . . . . . . . . . . . . . . . . . . . . . . . . . . . . . - (15,481)Net interest income . . . . . . . . . . . . . . . . . . . . . . . . . . . . . . . . . . . . . . . . . . . . . . . . . . . . . . . . . . . . . 23,25 (89,566) (20,791)Net effect of inflation and foreign exchange differences on non-current capital . . . . . . . . . . . (168,973) (143,270)Net effect of inflation and foreign exchange differences on cash and cash equivalents . . . . . 38,908 44,120Net cash outflow before interest and income tax . . . . . . . . . . . . . . . . . . . . . . . . . . . . . . . . . . . (147,730) (170,293)
Interest received . . . . . . . . . . . . . . . . . . . . . . . . . . . . . . . . . . . . . . . . . . . . . . . . . . . . . . . . . . . . . . . . 220,886 124,130Interest paid . . . . . . . . . . . . . . . . . . . . . . . . . . . . . . . . . . . . . . . . . . . . . . . . . . . . . . . . . . . . . . . . . . . (134,502) (116,941)Income tax paid . . . . . . . . . . . . . . . . . . . . . . . . . . . . . . . . . . . . . . . . . . . . . . . . . . . . . . . . . . . . . . . . (14,375) (4,696)Net cash used in operating activities . . . . . . . . . . . . . . . . . . . . . . . . . . . . . . . . . . . . . . . . . . . . . (75,721) (167,800)
Cash flows from investing activitiesCapital expenditure . . . . . . . . . . . . . . . . . . . . . . . . . . . . . . . . . . . . . . . . . . . . . . . . . . . . . . . . . . . . . 4 (51,959) (67,178)Proceeds from sale of property, plant and equipment . . . . . . . . . . . . . . . . . . . . . . . . . . . . . . . . . 7,164 -Acquisition of investments available for sale . . . . . . . . . . . . . . . . . . . . . . . . . . . . . . . . . . . . . . . . . (19,247) (104,920)Sale of investments available for sale . . . . . . . . . . . . . . . . . . . . . . . . . . . . . . . . . . . . . . . . . . . . . . . 53,229 172,111Dividends received from joint venture . . . . . . . . . . . . . . . . . . . . . . . . . . . . . . . . . . . . . . . . . . . . . . 6 - 43,599Advances received from joint venture . . . . . . . . . . . . . . . . . . . . . . . . . . . . . . . . . . . . . . . . . . . . . . 6 218,603 491,388Acquisition of additional interest in joint venture . . . . . . . . . . . . . . . . . . . . . . . . . . . . . . . . . . . . 6 - (188,941)Acquisition of joint ventures . . . . . . . . . . . . . . . . . . . . . . . . . . . . . . . . . . . . . . . . . . . . . . . . . . . . . . 6 (25,100) -Acquisition of associates . . . . . . . . . . . . . . . . . . . . . . . . . . . . . . . . . . . . . . . . . . . . . . . . . . . . . . . . . 7 (223,817) -Cash acquired on consolidation of subsidiaries . . . . . . . . . . . . . . . . . . . . . . . . . . . . . . . . . . . . . . 28 382 -Net cash (used in)/from investing activities . . . . . . . . . . . . . . . . . . . . . . . . . . . . . . . . . . . . . . . (40,745) 346,059
Cash flow from financing activitiesDividends paid . . . . . . . . . . . . . . . . . . . . . . . . . . . . . . . . . . . . . . . . . . . . . . . . . . . . . . . . . . . . . . . . . (7,274) (115,526)Net (decrease)/increase in short-term borrowings . . . . . . . . . . . . . . . . . . . . . . . . . . . . . . . . . . . (5,584) 120,720Long-term borrowings repaid . . . . . . . . . . . . . . . . . . . . . . . . . . . . . . . . . . . . . . . . . . . . . . . . . . . . . (12,040) (87,333)Effect of inflation and foreign exchange differences on non-current capital . . . . . . . . . . . . . . 168,973 143,270Net cash from financing activities . . . . . . . . . . . . . . . . . . . . . . . . . . . . . . . . . . . . . . . . . . . . . . . . 144,075 61,131
Net increase in cash and cash equivalents . . . . . . . . . . . . . . . . . . . . . . . . . . . . . . . . . . . . . . . . . 27,609 239,390
Movement in cash and cash equivalents
At start of year . . . . . . . . . . . . . . . . . . . . . . . . . . . . . . . . . . . . . . . . . . . . . . . . . . . . . . . . . . . . . . . . . . 578,927 383,657Net increase . . . . . . . . . . . . . . . . . . . . . . . . . . . . . . . . . . . . . . . . . . . . . . . . . . . . . . . . . . . . . . . . . . . 27,609 239,390Effects of inflation on cash and cash equivalents . . . . . . . . . . . . . . . . . . . . . . . . . . . . . . . . . . . . . (59,373) (50,207)Effects of exchange rate changes on cash and cash equivalents . . . . . . . . . . . . . . . . . . . . . . . . . 20,466 6,087
At end of year . . . . . . . . . . . . . . . . . . . . . . . . . . . . . . . . . . . . . . . . . . . . . . . . . . . . . . . . . . . . . . . . . . 13 567,629 578,927
Notes 1 to 37 form an integral part of these consolidated financial statements.
ALFA GROUP Consolidated statement of cash flows for the year ended December
(Expressed in thousand US dollars for presentational purposes only – see Note )
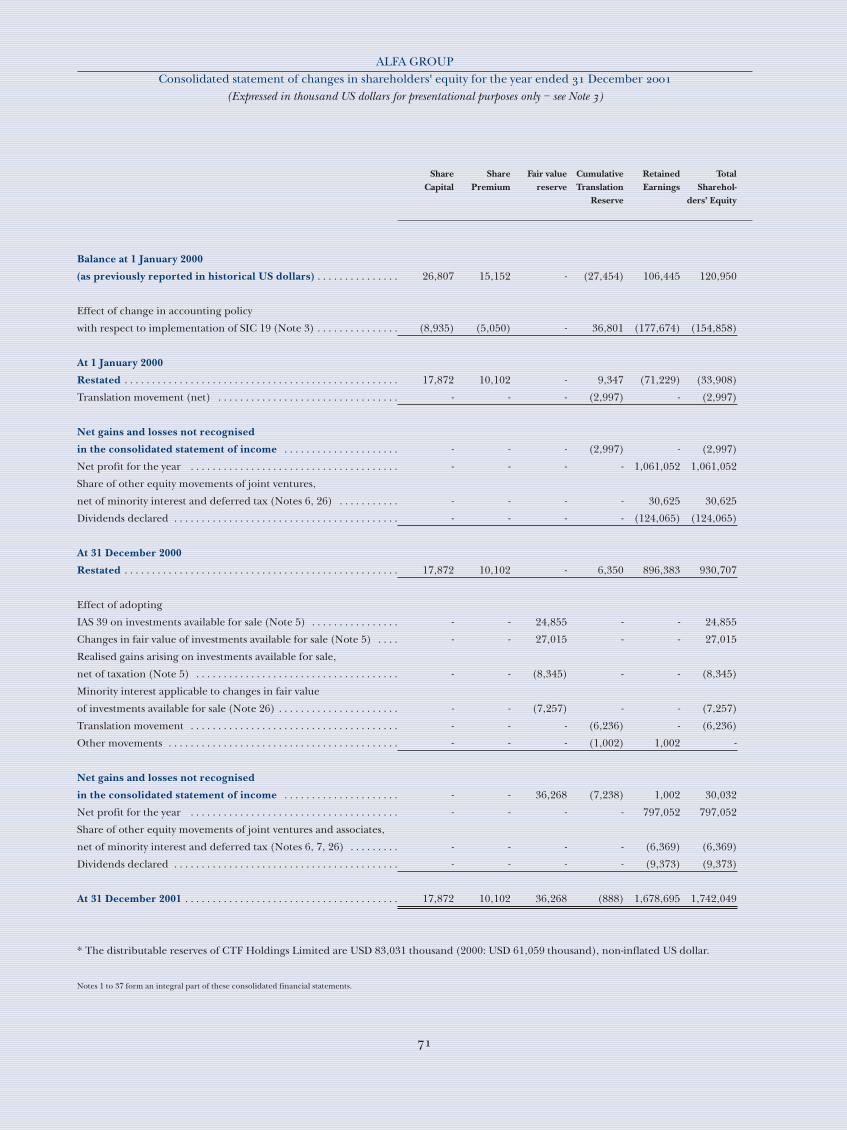
Share Share Fair value Cumulative Retained TotalCapital Premium reserve Translation Earnings Sharehol-
Reserve ders’ Equity
Balance at 1 January 2000
(as previously reported in historical US dollars) . . . . . . . . . . . . . . . 26,807 15,152 - (27,454) 106,445 120,950
Effect of change in accounting policy
with respect to implementation of SIC 19 (Note 3) . . . . . . . . . . . . . . . (8,935) (5,050) - 36,801 (177,674) (154,858)
At 1 January 2000
Restated . . . . . . . . . . . . . . . . . . . . . . . . . . . . . . . . . . . . . . . . . . . . . . . . . . 17,872 10,102 - 9,347 (71,229) (33,908)
Translation movement (net) . . . . . . . . . . . . . . . . . . . . . . . . . . . . . . . . . - - - (2,997) - (2,997)
Net gains and losses not recognised
in the consolidated statement of income . . . . . . . . . . . . . . . . . . . . . - - - (2,997) - (2,997)
Net profit for the year . . . . . . . . . . . . . . . . . . . . . . . . . . . . . . . . . . . . . . - - - - 1,061,052 1,061,052
Share of other equity movements of joint ventures,
net of minority interest and deferred tax (Notes 6, 26) . . . . . . . . . . . - - - - 30,625 30,625
Dividends declared . . . . . . . . . . . . . . . . . . . . . . . . . . . . . . . . . . . . . . . . . - - - - (124,065) (124,065)
At 31 December 2000
Restated . . . . . . . . . . . . . . . . . . . . . . . . . . . . . . . . . . . . . . . . . . . . . . . . . . 17,872 10,102 - 6,350 896,383 930,707
Effect of adopting
IAS 39 on investments available for sale (Note 5) . . . . . . . . . . . . . . . . - - 24,855 - - 24,855
Changes in fair value of investments available for sale (Note 5) . . . . - - 27,015 - - 27,015
Realised gains arising on investments available for sale,
net of taxation (Note 5) . . . . . . . . . . . . . . . . . . . . . . . . . . . . . . . . . . . . . - - (8,345) - - (8,345)
Minority interest applicable to changes in fair value
of investments available for sale (Note 26) . . . . . . . . . . . . . . . . . . . . . . - - (7,257) - - (7,257)
Translation movement . . . . . . . . . . . . . . . . . . . . . . . . . . . . . . . . . . . . . . - - - (6,236) - (6,236)
Other movements . . . . . . . . . . . . . . . . . . . . . . . . . . . . . . . . . . . . . . . . . . - - - (1,002) 1,002 -
Net gains and losses not recognised
in the consolidated statement of income . . . . . . . . . . . . . . . . . . . . . - - 36,268 (7,238) 1,002 30,032
Net profit for the year . . . . . . . . . . . . . . . . . . . . . . . . . . . . . . . . . . . . . . - - - - 797,052 797,052
Share of other equity movements of joint ventures and associates,
net of minority interest and deferred tax (Notes 6, 7, 26) . . . . . . . . . - - - - (6,369) (6,369)
Dividends declared . . . . . . . . . . . . . . . . . . . . . . . . . . . . . . . . . . . . . . . . . - - - - (9,373) (9,373)
At 31 December 2001 . . . . . . . . . . . . . . . . . . . . . . . . . . . . . . . . . . . . . . . 17,872 10,102 36,268 (888) 1,678,695 1,742,049
* The distributable reserves of CTF Holdings Limited are USD 83,031 thousand (2000: USD 61,059 thousand), non-inflated US dollar.
Notes 1 to 37 form an integral part of these consolidated financial statements.
ALFA GROUP Consolidated statement of changes in shareholders' equity for the year ended December
(Expressed in thousand US dollars for presentational purposes only – see Note )
1. PRINCIPAL ACTIVITIES OF THE ALFA GROUP
Alfa Group comprises the parent entity, CTF Holdings Limited, and its subsidiaries (the “CTFH Group”), together with entities inwhich the parent entity controls through shareholder agreements (hereinafter collectively – the “Alfa Group” or the “Group”).
The registered office of CTF Holdings Limited is Suite , Irish Place, Gibraltar.
The Group operates in the following business segments: financial services, international commodities, Russia, CIS and SoutheastAsia commodities, retail trade, food processing, oil and gas and telecommunications (see Note ).
Alfa Finance Holdings S.A. is registered in Luxembourg and with effect from March succeeded AB Holdings Limited(registered in Gibraltar) as the parent entity of Alfa Bank Group. Alfa Finance Holdings S.A. has restructured its businesses to forma financial subholding (under Alfa Bank Holdings Limited – formerly Alfa Capital Holdings (BVI) Limited), an industrialsubholding (under Alfa Petroleum Holdings Limited) and a telecommunications subholding (under Alfa Telecom Limited) thathas brought the legal structure more closely in line with the way in which Management manages the business. Alfa Bank HoldingsLimited, Alfa Petroleum Holdings Limited and Alfa Telecom Limited are wholly owned subsidiaries of Alfa Finance Holdings S.A.
Alfa Bank Holdings (BVI) Limited is the parent company of Alfa Bank, an open joint stock commercial bank. Alfa Bankis registered in the Russian Federation to carry out banking and foreign exchange activities and has operated under a fullbanking license issued by the Central Bank of the Russian Federation (“CBRF”) since . Alfa Bank operates in all sectors ofthe Russian financial markets including interbank and retail deposits, foreign exchange operations and debt and equity trading.In addition, a complete range of banking services is provided in Russian Roubles and foreign currencies to its clients. Alfa Bankhad branches within the Russian Federation at December . The activities of other companies in the financialsubholding include proprietary trading and brokerage activities, investment and merchant banking and asset management witha primary emphasis on securities within the Russian Federation and Ukraine.
Alfa Petroleum Holdings Limited, a BVI registered company, was established in May and replaced MedpointLimited as the holding company for the industrial assets of Alfa Finance Holdings S.A. in September . The principal under-lying assets in this subholding are TNK International Limited (“TNK”) and OAO Sidanco (“Sidanco”) (Note ).
Alfa Telecom Limited, a BVI registered company was established in March to hold the telecommunication assets ofAlfa Finance Holdings S.A. (Note ).
Crown Resources AG (“Crown Resources”) was registered in Zug, Switzerland on December . Its activities mainlyinvolve the trading of oil, oil products and metal sourced mainly from Russia and sold on international markets. Crown Resourcesis the main company in the Group’s international commodities segment following a restructuring in June .
Eco Holdings Limited (“Alfa Eco” and together with its subsidiaries the “Alfa Eco Group”), is registered in Gibraltar. The AlfaEco Group’s main activities include trading in raw materials (crude oil, oil products, metals, coal and industrial wood) andconsumer goods (such as meat, rice, grain, wine, vodka and cognac), in the Russian Federation, the CIS and Southeast Asia as wellas provision of agency services in the export of oil, oil products, newsprint and industrial wood. The Alfa Eco Group also holds theGroup’s interest in Vimpel-Communications and VimpelCom-Region (Note ) via Eco Telecom Limited, a company registered inGibraltar.
As opportunities arise the Alfa Eco Group also acquires interests in the equity, equity instruments or other securities of companieswith a strategic interest for the Alfa Eco Group. Depending upon the circumstances, the Alfa Eco Group may acquire a certaininterest for the purposes of managing and developing the business or holding the investment for resale.
ALFA GROUP Notes to the consolidated financial statements for the year ended December
(Expressed in thousand US dollars for presentational purposes only – see Note )
ZAO Trade House Perekriostok (“Perekriostok”), is registered in the Russian Federation. Perekriostok was established todevelop and manage a chain of supermarkets in Moscow and operates (: ) supermarkets and a distribution centre.Perekriostok is the main company in the Group's retail trade segment.
AC United Food Company (“UFC”), is registered in Cyprus and was created in April as a holding company for thepurpose of merging the Group's interest in Kubansakhar with Intec Group, a third party company with sugar factories and grainsilos. UFC operates in the Krasnodar, Belgorod and Orel regions of Russia in the areas of sugar processing, trading and distribu-tion and grain trading and storage. Subsequent to year-end the Group has entered into agreements to dispose of this segment(Note ).
2. OPERATING ENVIRONMENT OF THE GROUP
The majority of the Group’s operations are tied to the Russian market and accordingly the operating environment present in theRussian Federation, including the fluctuation of the Russian Rouble to the US dollar, is important to the overall operations of theGroup. The economy of the Russian Federation continues to display characteristics of an emerging market. These characteristicsinclude, but are not limited to, the existence of a currency that is not freely convertible outside of the country; a low level ofliquidity in the public and private debt and equity markets and relatively high inflation.
Additionally, the banking sector in the Russian Federation is particularly impacted by adverse currency fluctuations and economicconditions. Furthermore, the need for further developments in the bankruptcy laws, the absence of formalised procedures for theregistration and enforcement of collateral, and other legal and fiscal impediments contribute to the difficulties experienced bybanks currently operating in the Russian Federation. The political stabilization beginning in and continuing in has beena positive contributing factor for the further development of the political and legal environment.
The prospects for future economic stability in the Russian Federation are largely dependent upon the effectiveness of economicmeasures undertaken by the government, together with legal, regulatory and political developments, which are beyond theGroup’s control.
In addition, economic conditions continue to limit the volume of activity in the financial markets. Market quotations may not bereflective of the values for securities which would be determined in an efficient, active market involving willing buyers and willingsellers. Management has therefore used the best available information to determine their best estimate of fair values, where consid-ered necessary.
3. PRINCIPAL ACCOUNTING POLICIES
The principal accounting policies adopted in the preparation of these consolidated financial statements are set out below.
() Basis of preparationThe consolidated financial statements of the Group are prepared in accordance with, and comply with, International AccountingStandards (“IAS”) issued by the International Accounting Standards Committee. Subsidiaries, registered on the territory of theRussian Federation, maintain their accounting records in accordance with the Regulations on Accounting and Reporting in theRussian Federation in the national currency of the Russian Federation, the Russian Rouble (“RR”). These consolidated financialstatements have been prepared from those accounting records and adjusted as necessary in order to comply in all material respectswith IAS, based on the accounting policies set out below. Subsidiaries and dependent companies that are registered under the legis-lation of countries outside of the Russian Federation maintain financial statements, which are based upon IAS principles.
ALFA GROUP Notes to the consolidated financial statements for the year ended December
(Expressed in thousand US dollars for presentational purposes only – see Note )
The consolidated financial statements have been prepared using the historical cost convention, restated for the effects of inflation.Certain financial instruments are shown at fair value as disclosed in the accounting policies below.
The financial statements have been measured in Russian Roubles and adjusted for inflation in accordance with IAS “FinancialReporting in Hyperinflationary Economies (“IAS ”) so that all Russian Rouble amounts, including corresponding figures, areexpressed in terms of the purchasing power of the Russian Rouble at December . These financial statements have beenpresented in US dollars (“USD”) by translating the inflation adjusted Russian Rouble amounts as a matter of arithmetic computa-tion using the official rate of the Central Bank of the Russian Federation (the “CBRF”) at December of RR . to USD ,for both the current year and corresponding figures. The United States Dollar has been selected as the presentation currency ofthe Group as USD is the currency which Management of the Group uses to manage business risks and exposures, and measure theperformance of its businesses. The USD amounts should not be construed as a representation that the RR amounts have been orcould have been converted to USD at this rate.
Change in accounting policyAt January the Group changed its accounting policy with respect to the currency in which the consolidated financial state-ments are measured in order to comply with IASC Interpretation SIC , “Reporting Currency – Measurement and Presentationof Financial Statements under IAS and IAS ”. Previously, the Group used the USD for measuring certain subsidiaries in theseconsolidated financial statements, meaning that transactions in currencies other than USD were treated as transactions in foreigncurrencies. As mentioned above, the Group now uses Russian Roubles as its measurement currency for all subsidiaries where busi-ness activities are substantively located in the Russian Federation. In accordance with the benchmark treatment of IAS “Net Profitor Loss For the Period, Fundamental Errors and Changes in Accounting Policies”, the corresponding consolidated balance sheet,consolidated statement of income, consolidated statement of cash flows and consolidated statement of changes in shareholders’equity and related notes as of December have been restated in order to reflect adoption of this new accounting policy. Theapplication of this change in accounting policy resulted in a decrease in shareholders’ equity, as previously reported, at January in the amount of USD , thousand and at December in the amount of USD , thousand.
Management EstimatesThe preparation of consolidated financial statements require Management to make estimates and assumptions that affect thereported amounts of assets and liabilities and the reported amounts of revenues and operating costs during the reporting period. Themost significant estimates relate to the realisability of investments, realisability and depreciable lives of property, plant and equipment,allowances for doubtful accounts and provisions for deferred and current taxation. Actual results could differ from these estimates.
IAS As at January , the Group adopted IAS “Financial Instruments: Recognition and Measurement” (“IAS ”). The financialeffects of adopting IAS are reported in the consolidated statement of changes in shareholders’ equity. IAS has been appliedprospectively in accordance with the requirements of the Standard and therefore corresponding financial information has notbeen restated. Further information relating to the effect of the adoption of IAS is presented in the relevant accounting policiesand related disclosures.
() Measurement currencyThe Russian Rouble has been selected as the measurement currency of the Group as a majority of the Group’s transactions andoperations are carried out and measured in Russian Roubles.
The Group’s subsidiaries are considered foreign entities (operations not integral to those of the parent), as defined by IAS “TheEffects of Changes in Foreign Exchange Rates” (“IAS ”), as each of the individual businesses operate independently of theGroup. The measurement currency of the Group’s subsidiaries may be either RR or USD depending upon the location and natureof the activities of the particular business.
ALFA GROUP Notes to the consolidated financial statements for the year ended December
(Expressed in thousand US dollars for presentational purposes only – see Note )
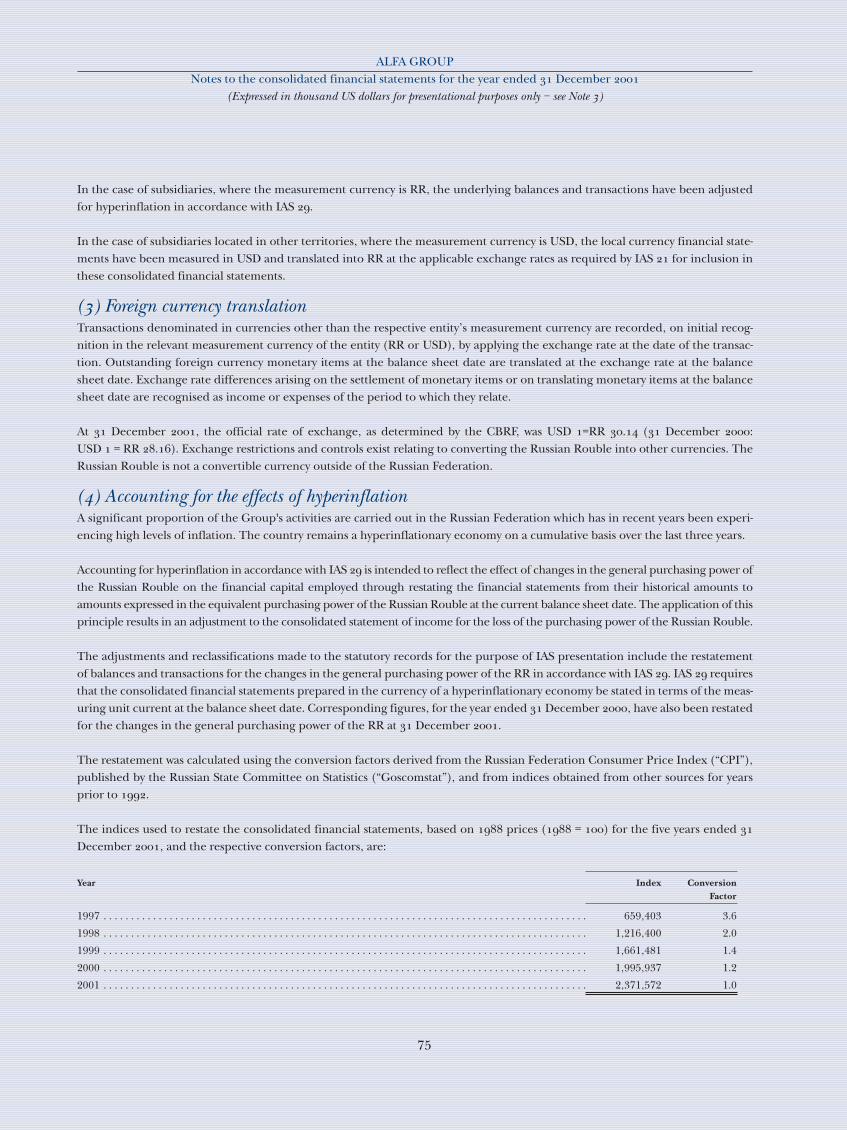
In the case of subsidiaries, where the measurement currency is RR, the underlying balances and transactions have been adjustedfor hyperinflation in accordance with IAS .
In the case of subsidiaries located in other territories, where the measurement currency is USD, the local currency financial state-ments have been measured in USD and translated into RR at the applicable exchange rates as required by IAS for inclusion inthese consolidated financial statements.
() Foreign currency translationTransactions denominated in currencies other than the respective entity’s measurement currency are recorded, on initial recog-nition in the relevant measurement currency of the entity (RR or USD), by applying the exchange rate at the date of the transac-tion. Outstanding foreign currency monetary items at the balance sheet date are translated at the exchange rate at the balancesheet date. Exchange rate differences arising on the settlement of monetary items or on translating monetary items at the balancesheet date are recognised as income or expenses of the period to which they relate.
At December , the official rate of exchange, as determined by the CBRF, was USD =RR . ( December :USD = RR .). Exchange restrictions and controls exist relating to converting the Russian Rouble into other currencies. TheRussian Rouble is not a convertible currency outside of the Russian Federation.
() Accounting for the effects of hyperinflationA significant proportion of the Group's activities are carried out in the Russian Federation which has in recent years been experi-encing high levels of inflation. The country remains a hyperinflationary economy on a cumulative basis over the last three years.
Accounting for hyperinflation in accordance with IAS is intended to reflect the effect of changes in the general purchasing power ofthe Russian Rouble on the financial capital employed through restating the financial statements from their historical amounts toamounts expressed in the equivalent purchasing power of the Russian Rouble at the current balance sheet date. The application of thisprinciple results in an adjustment to the consolidated statement of income for the loss of the purchasing power of the Russian Rouble.
The adjustments and reclassifications made to the statutory records for the purpose of IAS presentation include the restatementof balances and transactions for the changes in the general purchasing power of the RR in accordance with IAS . IAS requiresthat the consolidated financial statements prepared in the currency of a hyperinflationary economy be stated in terms of the meas-uring unit current at the balance sheet date. Corresponding figures, for the year ended December , have also been restatedfor the changes in the general purchasing power of the RR at December .
The restatement was calculated using the conversion factors derived from the Russian Federation Consumer Price Index (“CPI”),published by the Russian State Committee on Statistics (“Goscomstat”), and from indices obtained from other sources for yearsprior to .
The indices used to restate the consolidated financial statements, based on prices ( = ) for the five years ended December , and the respective conversion factors, are:
Year Index Conversion Factor
1997 . . . . . . . . . . . . . . . . . . . . . . . . . . . . . . . . . . . . . . . . . . . . . . . . . . . . . . . . . . . . . . . . . . . . . . . . . . . . . . . . . . . . . . . . 659,403 3.6
1998 . . . . . . . . . . . . . . . . . . . . . . . . . . . . . . . . . . . . . . . . . . . . . . . . . . . . . . . . . . . . . . . . . . . . . . . . . . . . . . . . . . . . . . . . 1,216,400 2.0
1999 . . . . . . . . . . . . . . . . . . . . . . . . . . . . . . . . . . . . . . . . . . . . . . . . . . . . . . . . . . . . . . . . . . . . . . . . . . . . . . . . . . . . . . . . 1,661,481 1.4
2000 . . . . . . . . . . . . . . . . . . . . . . . . . . . . . . . . . . . . . . . . . . . . . . . . . . . . . . . . . . . . . . . . . . . . . . . . . . . . . . . . . . . . . . . . 1,995,937 1.2
2001 . . . . . . . . . . . . . . . . . . . . . . . . . . . . . . . . . . . . . . . . . . . . . . . . . . . . . . . . . . . . . . . . . . . . . . . . . . . . . . . . . . . . . . . . 2,371,572 1.0
ALFA GROUP Notes to the consolidated financial statements for the year ended December
(Expressed in thousand US dollars for presentational purposes only – see Note )
These indices have been applied to the historical cost values of transactions and balances of subsidiaries, where the measurementcurrency is RR as follows:
• All comparative figures, including monetary assets and liabilities and other disclosures in respect of prior years, are restated byapplying the change in the index during the current year.
• All items of the consolidated income statement are restated by applying the change in the index from the date of the transac-tion to the balance sheet date.
• Monetary assets and liabilities at the latest balance sheet date are not restated because they are already expressed in terms of themonetary unit current at the balance sheet date.
• Non-monetary assets and liabilities are restated by applying the change in the index from the date of the transaction, or if appli-cable from the date of their initial valuation, to the latest balance sheet date, and are reduced to net realisable value, estimatedrecoverable value, or market value as necessary.
• The gain or loss on net monetary position, which shows the effects of holding net monetary assets and liabilities, is shown as aseparate item in the consolidated statement of income.
() Subsidiary undertakingsSubsidiary undertakings, which are those entities in which the Group has an interest of more than one half of the voting rights, orotherwise has power to exercise control over the operations, are consolidated. Subsidiaries are consolidated from the date onwhich control is transferred to the Group and are no longer consolidated from the date that control ceases. All intercompany trans-actions, balances and unrealised gains on transactions between group companies are eliminated; unrealised losses are also elimi-nated unless the cost cannot be recovered. Where necessary, accounting policies for subsidiaries have been changed to ensureconsistency with the policies adopted by the Group.
Minority interest at the balance sheet date represents the minority shareholders' portion of the pre-acquisition fair values of theidentifiable assets and liabilities of the subsidiary at the acquisition date, and the minorities' portion of movements in equity sincethe date of the combination. Minority interest is presented separately from liabilities and shareholders’ equity.
() Investments in joint ventures and associates Investments in joint ventures and associates are accounted for by the equity method as described below.
A joint venture is a contractual arrangement whereby two or more parties undertake an economic activity which is subject to joint control.
Associates are undertakings over which the Group generally has between % and % of the voting rights, or otherwise the Grouphas significant influence, but which it does not control.
Equity accounting involves recognising the Group’s share of the joint venture’s and associate’s profit or loss for the year in theconsolidated statement of income and other equity movements in the consolidated statement of equity. Unrealised gains on trans-actions between the Group and its joint ventures and associates are eliminated to the extent of the Group's interest in the jointventures and associates; unrealised losses are also eliminated unless the transaction provides evidence of an impairment of the assettransferred. Where necessary, accounting policies for joint ventures and associates have been changed to ensure consistency withthe policies adopted by the Group. The Group’s investment in joint ventures and associates is carried in the consolidated balancesheet at an amount that reflects its share of the net assets of the joint venture or associate and includes goodwill (net of accumu-lated amortisation) on acquisition.
ALFA GROUP Notes to the consolidated financial statements for the year ended December
(Expressed in thousand US dollars for presentational purposes only – see Note )
Equity accounting is discontinued when the carrying amount of the investment in a joint venture or an associate reaches zero,unless the Group has incurred obligations or guaranteed obligations in respect of the joint venture or the associates.
() Property, plant and equipmentProperty, plant and equipment are stated at cost, restated to the equivalent purchasing power of the Russian Rouble at December , less accumulated depreciation.
Depreciation is applied on a straight-line basis using the rates specified below, which approximate the estimated useful lives of therespective assets:
Buildings . . . . . . . . . . . . . . . . . . . . . . . . . . . . . . . . . . . . . . . . . . . . . . . . . . . . . . . . . . . . . . . . . . . . . . . . . . . . . . . . . . . . . . . . . . . . . . . . . 2-10 %
Plant, machinery and other equipment . . . . . . . . . . . . . . . . . . . . . . . . . . . . . . . . . . . . . . . . . . . . . . . . . . . . . . . . . . . . . . . . . . . . . . . . 9-20 %
Office and computer equipment . . . . . . . . . . . . . . . . . . . . . . . . . . . . . . . . . . . . . . . . . . . . . . . . . . . . . . . . . . . . . . . . . . . . . . . . . . . . . 14-33 %
Land and construction in progress are not depreciable items. Improvement costs, when incurred, are added to the carrying valueof the corresponding asset. Repairs and maintenance expenditure on property, plant and equipment incurred during the year ischarged to the consolidated statement of income.
Gains and losses on disposal of property, plant and equipment are determined by reference to their carrying amount and are takeninto account in determining operating income.
Interest costs on borrowings to finance the construction of property, plant and equipment are capitalised, during the period oftime that is required to complete and prepare the property for its intended use, as part of the cost of the asset, and depreciatedover the estimated useful life of the asset. No interest was capitalised during .
() Intangible assetsGoodwillGoodwill represents the excess of the cost of an acquisition over the fair value of the Group’s share of the net assets of the acquiredsubsidiary, joint venture or associated undertaking at the date of acquisition. Goodwill on the acquisition of joint venture and asso-ciated undertakings is included in investments in joint venture and associated undertakings. Goodwill is amortised using thestraight-line method over its estimated useful life up to years.
Negative goodwill represents the excess of the fair value of the Group’s share of the net assets acquired over the cost of acquisition.Negative goodwill is presented in the same balance sheet classification as goodwill. To the extent that negative goodwill relates toexpectations of future losses and expenses that are identified in the Group’s plan for the acquisition and can be measured reliably,but which do not represent identifiable liabilities, that portion of negative goodwill is recognised in the consolidated statement ofincome when the future losses and expenses are recognised. Any remaining negative goodwill, not exceeding the fair values of thenon-monetary assets acquired, is recognised in the consolidated statement of income over the remaining weighted average usefullife of depreciable and amortisable assets acquired; negative goodwill in excess of the fair values of those assets is recognised in theconsolidated statement of income immediately.
In the case of TNK and Sidanco the amortisation of goodwill is based on the estimated life of oil reserves.
Impairment of intangible assetsWhere an indication of impairment exists, the carrying amount of any intangible asset, including goodwill, is assessed and, whenimpaired, the asset is written down immediately to its recoverable amount.
ALFA GROUP Notes to the consolidated financial statements for the year ended December
(Expressed in thousand US dollars for presentational purposes only – see Note )
() Trading securitiesAt January the Group adopted IAS and classified all of its securities portfolio as “trading” securities. Trading securitiesare securities which were either acquired for generating a profit from short-term fluctuations in price or dealer’s margin, or aresecurities included in a portfolio in which a pattern of short-term holding exists.
Trading securities are initially recognised at cost (which includes transaction costs) and are subsequently re-measured at fair valuebased on their market value or after the application of various valuation methodologies, including Management's assessment as tothe future realisability of these securities. In determining market value, all trading securities are valued at the last trade price ifquoted on an exchange or, if traded over-the-counter, at the last bid price.
Changes in fair values are recorded within gains less losses arising from trading securities in the consolidated statement of incomein the period in which the change occurs. Coupon and interest income earned on trading securities are reflected in the statementof income as net interest, fees and other income on banking activities. Any trading gains or losses on trading securities are recordedin gains less losses arising from trading securities.
Because of the inherent risk of the securities market, security purchases and sales are recorded when the security transaction issettled.
Prior to the adoption of IAS , all securities were treated by the Group as part of its trading portfolio. Government securities andcorporate shares were carried at market value. The carrying values for other securities were derived either from market quotationsor from Management’s assessment of the future realisability of these securities. Certain securities, for which there was no readilyattainable market value or those securities for which Management had determined that the available quotation did not depict theirtrue market value, were fair valued by Management. Changes in market values were recorded within gains less losses arising fromtrading securities in the consolidated statement of income in the period in which the change occurred. Coupon and interestincome earned on trading securities was reflected in the consolidated statement of income as net interest, fees and other incomeon banking activities. The impact of adopting IAS was nil.
() Investments available for sale At January the Group adopted IAS and classified all its investments, except for investments in joint ventures and associ-ates, as available for sale. This classification includes investments, which Management intends to hold for an indefinite period oftime, which may be sold in response to needs for liquidity or changes in interest rates, exchange rates, or market prices.Management determines the appropriate classification of its investments at the time of purchase.
Investment securities available for sale are initially recognised at cost (which includes transaction costs) and subsequently remea-sured to fair value based on quoted bid prices. Certain investment securities available for sale for which there is no availableexternal independent quotation have been fair valued by Management. Fair value has been determined after the application ofvarious valuation methodologies, including Management's estimate of amounts to be realised on settlement. Unrealised gains andlosses arising from changes in the fair value of investment securities available for sale are recognised in the consolidated statementof changes in shareholders’ equity. When the investment securities available for sale are disposed of or impaired, the related accu-mulated fair value adjustments are included in the consolidated statement of income as gains less losses arising from investmentsecurities transactions. Coupon and interest earned on investment securities available for sale are reflected in the consolidatedstatement of income as net interest, fees and other income on banking activities.
Prior to adoption of IAS , all investments were carried at cost less provision for diminution in value, created in cases where the valueof an investment had declined, and Management believed that the decline was not temporary in nature. Income derived from invest-ments was accounted for on a cash basis. On disposal of an investment, the difference between the net disposal proceeds and thecarrying amount was charged or credited to income. The impact of adopting IAS was a credit to equity of USD , thousand.
ALFA GROUP Notes to the consolidated financial statements for the year ended December
(Expressed in thousand US dollars for presentational purposes only – see Note )
() Sale and repurchase agreements and lending of securities Sale and repurchase agreements (“repos”) are treated as secured financing transactions. Securities sold under sale and repurchaseagreements are included into trading securities or investment securities available for sale as appropriate. The correspondingliability is presented within due to banks or borrowings. Securities purchased under agreements to resell (“reverse repo”) arerecorded as loans and advances to banks or customers as appropriate. The difference between the sale and repurchase price istreated as interest and accrued over the life of repo agreements using the effective yield method.
Securities lent to counterparties are retained in the consolidated financial statements. Securities borrowed are not recognised inthe consolidated financial statements, unless these are sold to third parties, in which case the purchase and sale are recorded withingains less losses arising from trading securities in the consolidated statement of income. The obligation to return them is recordedat fair value as a trading liability.
() InventoriesInventories are stated at the lower of cost or net realisable value. The cost of commodities is determined on a weighted average costbasis. Cost comprises raw materials, other direct costs and related production overheads, and excludes interest expense.
() Accounts receivableTrade receivables are carried at original invoice amount less provision made for impairment of these receivables. Such provisionfor impairment of trade receivables is established if there is objective evidence that the Group will not be able to collect all amountsdue according to the original terms. The amount of the provision is the difference between the carrying amount and the recover-able amount, being the present value of expected cash flows, discounted at the effective rate of interest.
() Originated loans and advances to customers, provisions for loan impairment Loans and advances are originated by the Group by providing money directly to the borrower or to a sub-participation agent atdraw down and are categorised as loans and advances originated by the Group and are carried at amortised cost less provision forloan impairment. All loans and advances are recognised when cash is advanced to borrowers.
Originated loans from customers are recognised initially “at cost” net of transactions cost incurred. Subsequently, these are restatedat amortised cost and any difference between proceeds and a redemption value is recognised in consolidated statement of incomeover period of the borrowings using the effective yield method.
A credit risk provision for loan impairment is established if there is objective evidence that the Group will not be able to collect theamounts due. The amount of the provision is the difference between the carrying amount and estimated recoverable amount,calculated as the present value of expected cash flows, including amounts recoverable from guarantees and collateral, discountedbased on the instrument’s interest rate at inception.
The provision for loan impairment also covers losses where there is objective evidence that probable losses are present in compo-nents of the loan portfolio at the balance sheet date. These have been estimated based upon historical patterns of losses in eachcomponent, the credit ratings assigned to the borrowers and reflects the current economic environment in which the borrowersoperate.
When a loan is uncollectible, it is written off against the related provision for loan impairment. Such loans are written off after allthe necessary legal procedures have been completed and the amount of the loss has been determined. Recoveries of amounts previ-ously written off are treated as income.
If the amount of the provision for loan impairment subsequently decreases due to an event occurring after the write-down, therelease of the provision is credited to provision on operating items in the consolidated statement of income.
ALFA GROUP Notes to the consolidated financial statements for the year ended December
(Expressed in thousand US dollars for presentational purposes only – see Note )
Prior to the adoption of IAS , loans and advances were stated at the principal amounts outstanding net of provisions for losseson loans and advances. The impact of adopting IAS was nil.
() Cash and cash equivalentsCash and cash equivalents are items which can be converted into cash within a day. All short term interbank placements, beyondovernight deposits, are included in due from banks. Mandatory cash reserve balances with the CBRF have been excluded from cashand cash equivalents in the consolidated statement of cash flows, as these balances are not available to finance the Group’s day today operations.
() Other credit related commitments In the normal course of business, the Group enters into other credit related commitments including loan commitments, lettersof credit and guarantees. Specific provisions are raised against other credit related commitments when losses are consideredprobable.
() Derivative financial instrumentsDerivative financial instruments are used by the Group's companies (primarily by Alfa Bank Group and Crown Resources AG) forboth economic hedging and non-hedging (trading) purposes. Although derivative financial instruments are often used foreconomic hedging purposes, the Group does not make use of the elective hedge accounting rules under IAS .
Derivative financial instruments are initially recognised in the consolidated balance sheet at cost (including transaction costs) andsubsequently, are re-measured at fair value with the resulting gains or losses recognised immediately in the consolidated statementof income. Fair values are obtained from quoted market prices and if necessary from discounted cash flow or other models. Allderivatives are carried as assets when fair value is positive and as liabilities when fair value is negative. When the Group hascontracts to both buy and sell derivative financial instruments with the same counterparty, gains and losses have been offset. Theimpact of adopting IAS was nil.
Executory contracts, which represent open forward fixed price commodity purchase or sale contracts, are settled bydelivery of commodities to meet the Group’s expected purchase and sales requirements and are therefore outside the scopeof IAS . Unrealized losses on executory contracts resulting from adverse market price movements are provided for in theconsolidated statement of income. Unrealized gains on executory contracts are not recognized in the consolidated state-ment of income.
Alfa Bank uses derivative financial instruments, which include forward and spot transactions in foreign exchange markets,forwards, futures and options on securities and precious metals. All related gains and losses, including changes in fair value, arereflected in the consolidated statement of income in net interest, fees and other income on banking activities.
The August economic crisis and the subsequent legal uncertainty over derivative contracts have necessitated the Group tomodify its accounting policy with regards to domestic index forwards. Gains and losses on domestic index forwards have beencalculated applying the exchange rate on the contractual maturity date. Where settlements have been negotiated with counter-parties, the gain or loss has been recognised based on the settlement amounts. For contracts which have not been settled,Management has recognised the gain or loss at the amount at which they believe the contract could be settled. When the Grouphad contracts to both buy and sell foreign currencies with the same counterparty, the gains and losses have been offset.
Crown Resources uses derivative financial instruments which include commodities swap and futures contracts and firm commit-ments to fixed price forward purchases of oil, oil products, metals and other commodities. All related gains and losses,including changes in fair value, are reflected in the consolidated statement of income in cost of goods sold. The impact ofadopting IAS was nil.
ALFA GROUP Notes to the consolidated financial statements for the year ended December
(Expressed in thousand US dollars for presentational purposes only – see Note )

() Income and expense recognitionThe Group operates across a variety of business segments, which generate different types of income and expenses. Income andexpenses are recognised on an accrual basis as earned or incurred. The following are the principal types of income and expensesand how they are recognised:
- Sales are recognised upon transfer of title for goods in accordance with the terms of contracts or as services are provided as thisis the date that the risks and rewards of ownership are transferred to the customers. Sales are shown net of VAT, sales tax anddiscounts, and after eliminating sales within the Group. Commission income is recognised as earned, generally upon theperformance of commissionable activities or the agreement on its calculation by the customer, whichever is the latest.
- Cost of goods sold comprises the purchase price, transportation costs, financing costs, commissions relating to supply agree-ments and other related expenses;
- Interest income and expense are recognised in the consolidated statement of income on an accrual basis using the effectiveyield method. Interest income is not recognised when it is overdue or in situations when Management believes that it is notcollectible.
- Dividend income is recognised when the right to receive payment is established, usually on ex-dividend date;
- The income / expense resulting from the accretion / amortisation of the discount / premium resulting from bills of exchangeissued or held by the Group is accounted for as described in Note ().
- Operating expenses, including selling and distribution expenses and general and administrative expenses are recognised on anaccrual basis as incurred.
- Gains and losses arising as a result of Group's management of investments available for sale and entities over which Group exer-cises management control are included in the consolidated statement of income under gain on investments transactions whenrealised.
() Accounting for operating leases – where the Group is the lesseeLeases of assets under which all the risks and benefits of ownership are effectively retained by the lessor are classified as operatingleases. Lease expenses are charged to the consolidated statement of income on a straight-line basis over the period of the lease.
() Income taxesIncome taxes payable are provided for on the basis of estimates of the tax liability for the year, taking into consideration applicabletax rates and tax exemptions.
Deferred income tax assets and liabilities are calculated, using the liability method, in respect of temporary differences arisingbetween the tax base of assets and liabilities and their carrying values for financial reporting purposes. A deferred tax asset isrecorded only to the extent that it is probable that taxable profit will be available against which the deductible temporary differ-ences can be utilised. Deferred tax assets and liabilities are measured at tax rates that are expected to apply to the period in whichthe asset is realised or the liability is settled, based on tax rates which are enacted or substantially enacted at the balance sheet date.
Deferred income tax is provided on temporary differences arising on investments in subsidiaries, joint ventures and associates,except where the timing of the reversal of the temporary difference can be controlled and it is probable that the temporary differ-ence will not reverse in the foreseeable future.
ALFA GROUP Notes to the consolidated financial statements for the year ended December
(Expressed in thousand US dollars for presentational purposes only – see Note )
Deferred taxation, relating to the fair value remeasurement of investments available for sale which is charged or credited directlyto equity, is also charged or credited directly to equity and is subsequently recognised in the consolidated statement of incomewhen the gain or loss on the investments are realised.
The principal temporary differences arise on inventories, bad debt provisions, accruals and fair value adjustments caused by IAS .
() ProvisionsProvisions are recognised when the Group has a present legal or constructive obligation as a result of past events, it is probable thatan outflow of resources embodying economic benefits will be required to settle the obligation, and a reliable estimate of theamount of the obligation can be made.
() DividendsDividends declared by the Group are recognised as a liability and as a corresponding charge to equity in the year in which they areproposed and declared.
() Bills of exchangeBills of exchange issued by the Group to its customers, more commonly known as “veksels”, carry a fixed date of repayment. Thesemay be issued against cash deposits or as a payment instrument which the customer can discount in the over-the-counter secondarymarket. Bills of exchange issued by the Group are recognised initially at cost being their issue proceeds net of transaction costsincurred. Subsequently, bills of exchange issued are stated at amortised cost and any difference between net proceeds and theredemption value is recognised in the consolidated statement of income over the period of issuance using the effective yieldmethod.
Prior to adoption of IAS , bills of exchange issued by the Group were recorded at nominal value with the corresponding discountrecorded within other assets and amortised to the consolidated statement of income over the period of maturity of the bills ofexchange. The impact of adopting IAS was nil.
The Group also purchases bills of exchange from its customers or in the market. These bills of exchange are included in tradingsecurities, investments available for sale, originated loans and advances to customers, or in due from banks, depending on theirsubstance, and are subsequently re-measured and are accounted for in accordance with the accounting policies described abovefor those categories of assets.
() BorrowingsBorrowings are recognised initially at ‘cost’, being their issue proceeds net of transaction costs incurred. Subsequently, borrowingsare stated at amortised cost and any difference between net proceeds and the redemption value is recognised in the consolidatedstatement of income over the period of the borrowings using the effective yield method.
() Pension costsThe Group’s subsidiaries that are registered on the territory of the Russian Federation contribute to the Russian Federation’s statepension scheme in respect of its employees.
Crown Resources contributes to defined contribution plans to provide pension benefits for employees. Crown Resourcescontributes to these plans based upon a fixed percentage of employee compensation.
These contributions are expensed as incurred. The Group’s commitment ends with the payment of these contributions.
ALFA GROUP Notes to the consolidated financial statements for the year ended December
(Expressed in thousand US dollars for presentational purposes only – see Note )
() Share options Share options are granted to certain directors and managers of certain of the Group's companies.
To the extent that options are granted and are used as a mechanism for additional cash compensation, i.e. where put options areissued against call options, a compensation cost is recognized in the consolidated statement of income at the date of the grant andremeasured at each financial statement date.
To the extent that options are granted and are used as a mechanism for promoting longer-term ownership by directors andmanagers, i.e. where only call options are issued, no compensation cost is recognized. Instead, when the call options are exercised,the proceeds received net of any transaction costs are recorded as an adjustment to minority interest.
() ImpairmentThe Group makes an assessment whether there is any indication that an asset may be impaired at each balance sheet date. If anysuch indication exists, an estimate of the recoverable amount of the asset is made.
If the recoverable amount of an asset is less than its carrying amount the carrying amount of the asset is reduced to its recoverableamount. That reduction is an impairment loss.
() Fiduciary assetsAssets and liabilities held by the Group in its own name, but for the account of third parties, are not reported in the consolidatedbalance sheet. Commissions received from such business are included in net interest, fees and other income on banking activitiesin the consolidated statement of income.
() OffsettingFinancial assets and liabilities are offset and the net amount reported in the consolidated balance sheet only when there is a legallyenforceable right to offset the recognised amounts, and there is an intention to either settle on a net basis, or to realise the assetand settle the liability simultaneously.
() Segment reportingThe consolidated financial statements disclose information relating to the Group’s business and geographic segments. TheGroup’s primary reporting format comprises the business segments, whilst the secondary reporting format comprises thegeographical segments. Division into segments depends on such factors as the nature of items, types of activities performed by thissegment and relative independence of this segment. With regards to the secondary geographical segments, sales are based on thecountry in which the customer is located, while total assets and capital expenditures are based on where the assets are located.
ALFA GROUP Notes to the consolidated financial statements for the year ended December
(Expressed in thousand US dollars for presentational purposes only – see Note )
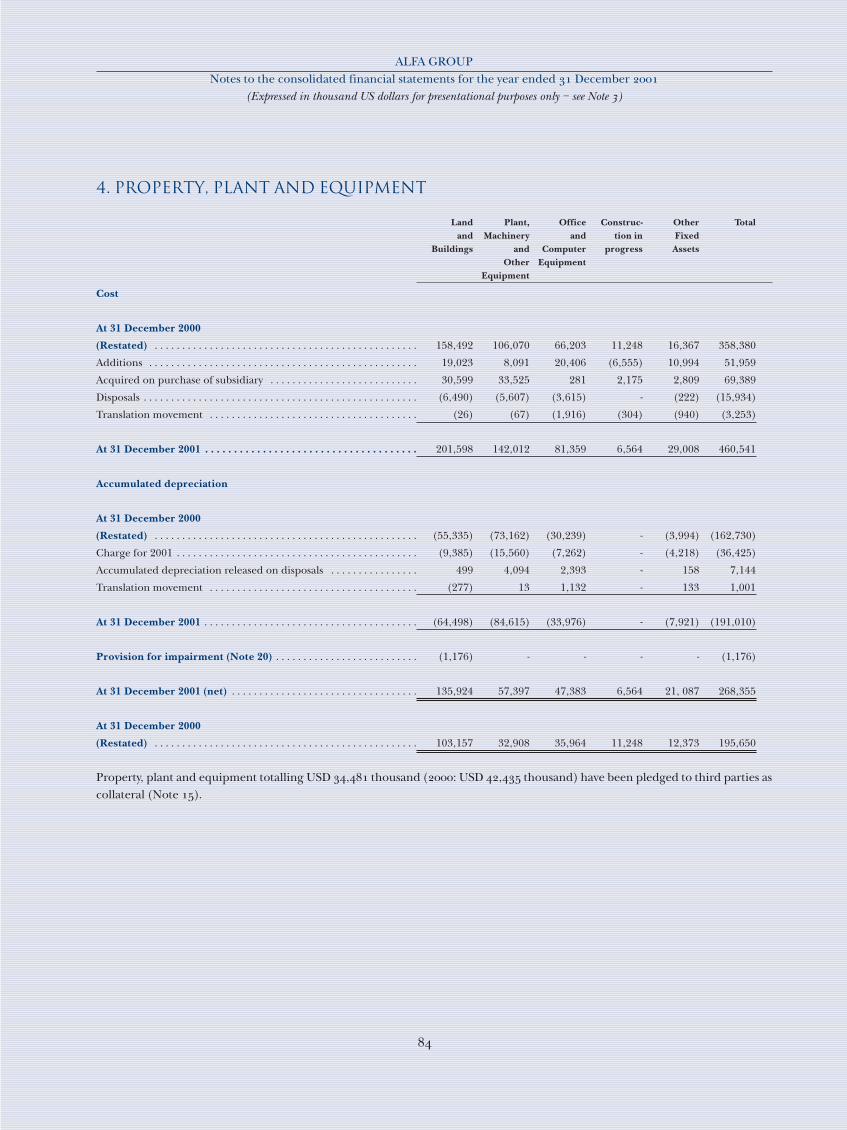
4. PROPERTY, PLANT AND EQUIPMENT
Land Plant, Office Construc- Other Totaland Machinery and tion in Fixed
Buildings and Computer progress AssetsOther Equipment
Equipment
Cost
At 31 December 2000
(Restated) . . . . . . . . . . . . . . . . . . . . . . . . . . . . . . . . . . . . . . . . . . . . . . . . 158,492 106,070 66,203 11,248 16,367 358,380
Additions . . . . . . . . . . . . . . . . . . . . . . . . . . . . . . . . . . . . . . . . . . . . . . . . . 19,023 8,091 20,406 (6,555) 10,994 51,959
Acquired on purchase of subsidiary . . . . . . . . . . . . . . . . . . . . . . . . . . . 30,599 33,525 281 2,175 2,809 69,389
Disposals . . . . . . . . . . . . . . . . . . . . . . . . . . . . . . . . . . . . . . . . . . . . . . . . . . (6,490) (5,607) (3,615) - (222) (15,934)
Translation movement . . . . . . . . . . . . . . . . . . . . . . . . . . . . . . . . . . . . . . (26) (67) (1,916) (304) (940) (3,253)
At 31 December 2001 . . . . . . . . . . . . . . . . . . . . . . . . . . . . . . . . . . . . . 201,598 142,012 81,359 6,564 29,008 460,541
Accumulated depreciation
At 31 December 2000
(Restated) . . . . . . . . . . . . . . . . . . . . . . . . . . . . . . . . . . . . . . . . . . . . . . . . (55,335) (73,162) (30,239) - (3,994) (162,730)
Charge for 2001 . . . . . . . . . . . . . . . . . . . . . . . . . . . . . . . . . . . . . . . . . . . . (9,385) (15,560) (7,262) - (4,218) (36,425)
Accumulated depreciation released on disposals . . . . . . . . . . . . . . . . 499 4,094 2,393 - 158 7,144
Translation movement . . . . . . . . . . . . . . . . . . . . . . . . . . . . . . . . . . . . . . (277) 13 1,132 - 133 1,001
At 31 December 2001 . . . . . . . . . . . . . . . . . . . . . . . . . . . . . . . . . . . . . . . (64,498) (84,615) (33,976) - (7,921) (191,010)
Provision for impairment (Note 20) . . . . . . . . . . . . . . . . . . . . . . . . . . (1,176) - - - - (1,176)
At 31 December 2001 (net) . . . . . . . . . . . . . . . . . . . . . . . . . . . . . . . . . . 135,924 57,397 47,383 6,564 21, 087 268,355
At 31 December 2000
(Restated) . . . . . . . . . . . . . . . . . . . . . . . . . . . . . . . . . . . . . . . . . . . . . . . . 103,157 32,908 35,964 11,248 12,373 195,650
Property, plant and equipment totalling USD , thousand (: USD , thousand) have been pledged to third parties ascollateral (Note ).
ALFA GROUP Notes to the consolidated financial statements for the year ended December
(Expressed in thousand US dollars for presentational purposes only – see Note )
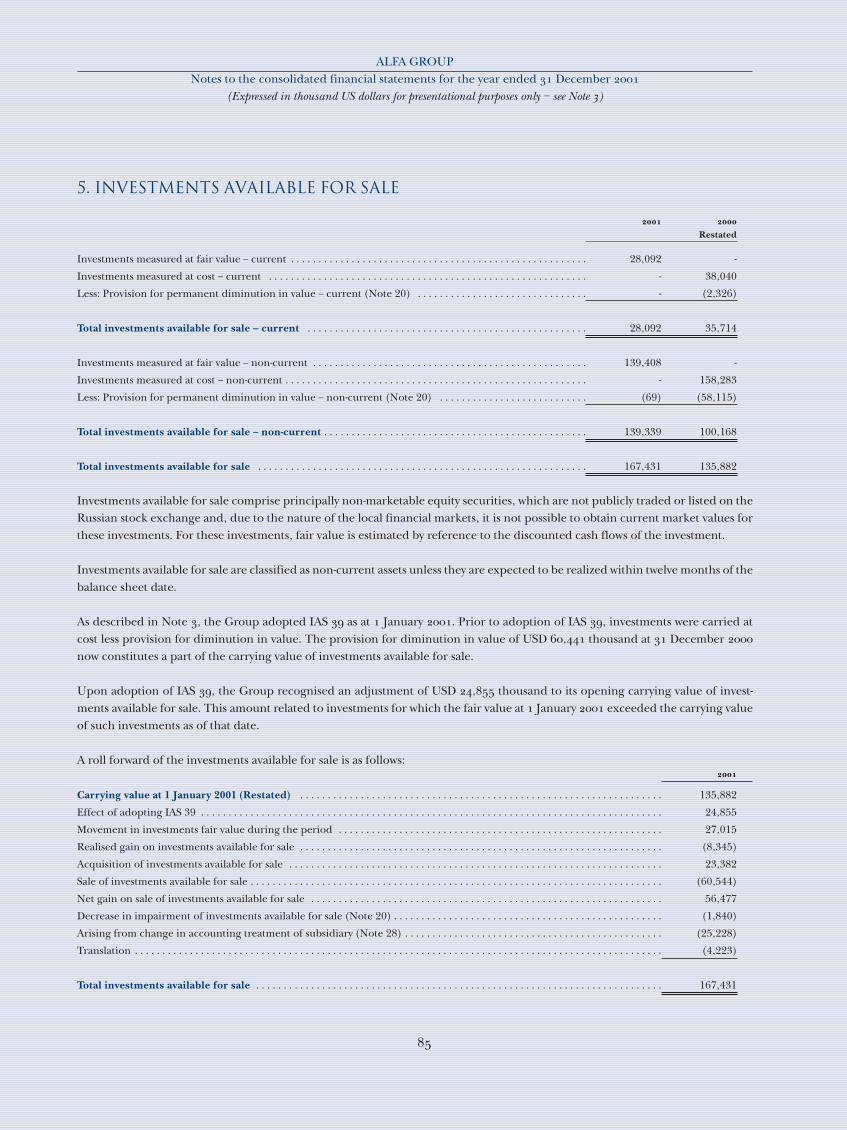
5. INVESTMENTS AVAILABLE FOR SALE
Restated
Investments measured at fair value – current . . . . . . . . . . . . . . . . . . . . . . . . . . . . . . . . . . . . . . . . . . . . . . . . . . . . . . 28,092 -
Investments measured at cost – current . . . . . . . . . . . . . . . . . . . . . . . . . . . . . . . . . . . . . . . . . . . . . . . . . . . . . . . . . . - 38,040
Less: Provision for permanent diminution in value – current (Note 20) . . . . . . . . . . . . . . . . . . . . . . . . . . . . . . . - (2,326)
Total investments available for sale – current . . . . . . . . . . . . . . . . . . . . . . . . . . . . . . . . . . . . . . . . . . . . . . . . . . . 28,092 35,714
Investments measured at fair value – non-current . . . . . . . . . . . . . . . . . . . . . . . . . . . . . . . . . . . . . . . . . . . . . . . . . . 139,408 -
Investments measured at cost – non-current . . . . . . . . . . . . . . . . . . . . . . . . . . . . . . . . . . . . . . . . . . . . . . . . . . . . . . . - 158,283
Less: Provision for permanent diminution in value – non-current (Note 20) . . . . . . . . . . . . . . . . . . . . . . . . . . . (69) (58,115)
Total investments available for sale – non-current . . . . . . . . . . . . . . . . . . . . . . . . . . . . . . . . . . . . . . . . . . . . . . . . 139,339 100,168
Total investments available for sale . . . . . . . . . . . . . . . . . . . . . . . . . . . . . . . . . . . . . . . . . . . . . . . . . . . . . . . . . . . . 167,431 135,882
Investments available for sale comprise principally non-marketable equity securities, which are not publicly traded or listed on theRussian stock exchange and, due to the nature of the local financial markets, it is not possible to obtain current market values forthese investments. For these investments, fair value is estimated by reference to the discounted cash flows of the investment.
Investments available for sale are classified as non-current assets unless they are expected to be realized within twelve months of thebalance sheet date.
As described in Note , the Group adopted IAS as at January . Prior to adoption of IAS , investments were carried atcost less provision for diminution in value. The provision for diminution in value of USD , thousand at December now constitutes a part of the carrying value of investments available for sale.
Upon adoption of IAS , the Group recognised an adjustment of USD , thousand to its opening carrying value of invest-ments available for sale. This amount related to investments for which the fair value at January exceeded the carrying valueof such investments as of that date.
A roll forward of the investments available for sale is as follows:
Carrying value at 1 January 2001 (Restated) . . . . . . . . . . . . . . . . . . . . . . . . . . . . . . . . . . . . . . . . . . . . . . . . . . . . . . . . . . . . . . . . . . 135,882
Effect of adopting IAS 39 . . . . . . . . . . . . . . . . . . . . . . . . . . . . . . . . . . . . . . . . . . . . . . . . . . . . . . . . . . . . . . . . . . . . . . . . . . . . . . . . . . . . 24,855
Movement in investments fair value during the period . . . . . . . . . . . . . . . . . . . . . . . . . . . . . . . . . . . . . . . . . . . . . . . . . . . . . . . . . . . 27,015
Realised gain on investments available for sale . . . . . . . . . . . . . . . . . . . . . . . . . . . . . . . . . . . . . . . . . . . . . . . . . . . . . . . . . . . . . . . . . . (8,345)
Acquisition of investments available for sale . . . . . . . . . . . . . . . . . . . . . . . . . . . . . . . . . . . . . . . . . . . . . . . . . . . . . . . . . . . . . . . . . . . . 23,382
Sale of investments available for sale . . . . . . . . . . . . . . . . . . . . . . . . . . . . . . . . . . . . . . . . . . . . . . . . . . . . . . . . . . . . . . . . . . . . . . . . . . . (60,544)
Net gain on sale of investments available for sale . . . . . . . . . . . . . . . . . . . . . . . . . . . . . . . . . . . . . . . . . . . . . . . . . . . . . . . . . . . . . . . . 56,477
Decrease in impairment of investments available for sale (Note 20) . . . . . . . . . . . . . . . . . . . . . . . . . . . . . . . . . . . . . . . . . . . . . . . . . (1,840)
Arising from change in accounting treatment of subsidiary (Note 28) . . . . . . . . . . . . . . . . . . . . . . . . . . . . . . . . . . . . . . . . . . . . . . . (25,228)
Translation . . . . . . . . . . . . . . . . . . . . . . . . . . . . . . . . . . . . . . . . . . . . . . . . . . . . . . . . . . . . . . . . . . . . . . . . . . . . . . . . . . . . . . . . . . . . . . . . (4,223)
Total investments available for sale . . . . . . . . . . . . . . . . . . . . . . . . . . . . . . . . . . . . . . . . . . . . . . . . . . . . . . . . . . . . . . . . . . . . . . . . . . 167,431
ALFA GROUP Notes to the consolidated financial statements for the year ended December
(Expressed in thousand US dollars for presentational purposes only – see Note )
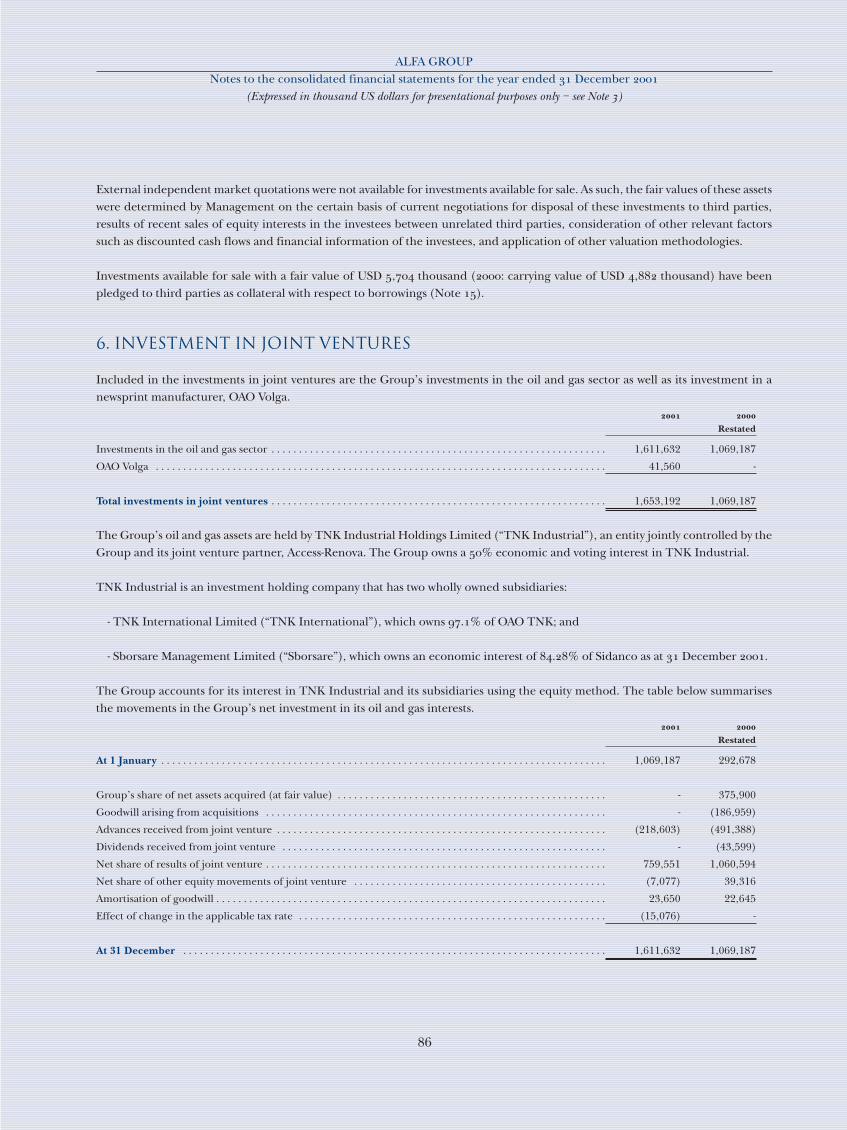
External independent market quotations were not available for investments available for sale. As such, the fair values of these assetswere determined by Management on the certain basis of current negotiations for disposal of these investments to third parties,results of recent sales of equity interests in the investees between unrelated third parties, consideration of other relevant factorssuch as discounted cash flows and financial information of the investees, and application of other valuation methodologies.
Investments available for sale with a fair value of USD , thousand (: carrying value of USD , thousand) have beenpledged to third parties as collateral with respect to borrowings (Note ).
6. INVESTMENT IN JOINT VENTURES
Included in the investments in joint ventures are the Group’s investments in the oil and gas sector as well as its investment in anewsprint manufacturer, OAO Volga.
Restated
Investments in the oil and gas sector . . . . . . . . . . . . . . . . . . . . . . . . . . . . . . . . . . . . . . . . . . . . . . . . . . . . . . . . . . . . . 1,611,632 1,069,187
OAO Volga . . . . . . . . . . . . . . . . . . . . . . . . . . . . . . . . . . . . . . . . . . . . . . . . . . . . . . . . . . . . . . . . . . . . . . . . . . . . . . . . . . 41,560 -
Total investments in joint ventures . . . . . . . . . . . . . . . . . . . . . . . . . . . . . . . . . . . . . . . . . . . . . . . . . . . . . . . . . . . . . 1,653,192 1,069,187
The Group’s oil and gas assets are held by TNK Industrial Holdings Limited (“TNK Industrial”), an entity jointly controlled by theGroup and its joint venture partner, Access-Renova. The Group owns a % economic and voting interest in TNK Industrial.
TNK Industrial is an investment holding company that has two wholly owned subsidiaries:
- TNK International Limited (“TNK International”), which owns .% of OAO TNK; and
- Sborsare Management Limited (“Sborsare”), which owns an economic interest of .% of Sidanco as at December .
The Group accounts for its interest in TNK Industrial and its subsidiaries using the equity method. The table below summarisesthe movements in the Group’s net investment in its oil and gas interests.
Restated
At 1 January . . . . . . . . . . . . . . . . . . . . . . . . . . . . . . . . . . . . . . . . . . . . . . . . . . . . . . . . . . . . . . . . . . . . . . . . . . . . . . . . . 1,069,187 292,678
Group’s share of net assets acquired (at fair value) . . . . . . . . . . . . . . . . . . . . . . . . . . . . . . . . . . . . . . . . . . . . . . . . . - 375,900
Goodwill arising from acquisitions . . . . . . . . . . . . . . . . . . . . . . . . . . . . . . . . . . . . . . . . . . . . . . . . . . . . . . . . . . . . . . - (186,959)
Advances received from joint venture . . . . . . . . . . . . . . . . . . . . . . . . . . . . . . . . . . . . . . . . . . . . . . . . . . . . . . . . . . . . (218,603) (491,388)
Dividends received from joint venture . . . . . . . . . . . . . . . . . . . . . . . . . . . . . . . . . . . . . . . . . . . . . . . . . . . . . . . . . . . - (43,599)
Net share of results of joint venture . . . . . . . . . . . . . . . . . . . . . . . . . . . . . . . . . . . . . . . . . . . . . . . . . . . . . . . . . . . . . . 759,551 1,060,594
Net share of other equity movements of joint venture . . . . . . . . . . . . . . . . . . . . . . . . . . . . . . . . . . . . . . . . . . . . . . (7,077) 39,316
Amortisation of goodwill . . . . . . . . . . . . . . . . . . . . . . . . . . . . . . . . . . . . . . . . . . . . . . . . . . . . . . . . . . . . . . . . . . . . . . . 23,650 22,645
Effect of change in the applicable tax rate . . . . . . . . . . . . . . . . . . . . . . . . . . . . . . . . . . . . . . . . . . . . . . . . . . . . . . . . (15,076) -
At 31 December . . . . . . . . . . . . . . . . . . . . . . . . . . . . . . . . . . . . . . . . . . . . . . . . . . . . . . . . . . . . . . . . . . . . . . . . . . . . . 1,611,632 1,069,187
ALFA GROUP Notes to the consolidated financial statements for the year ended December
(Expressed in thousand US dollars for presentational purposes only – see Note )
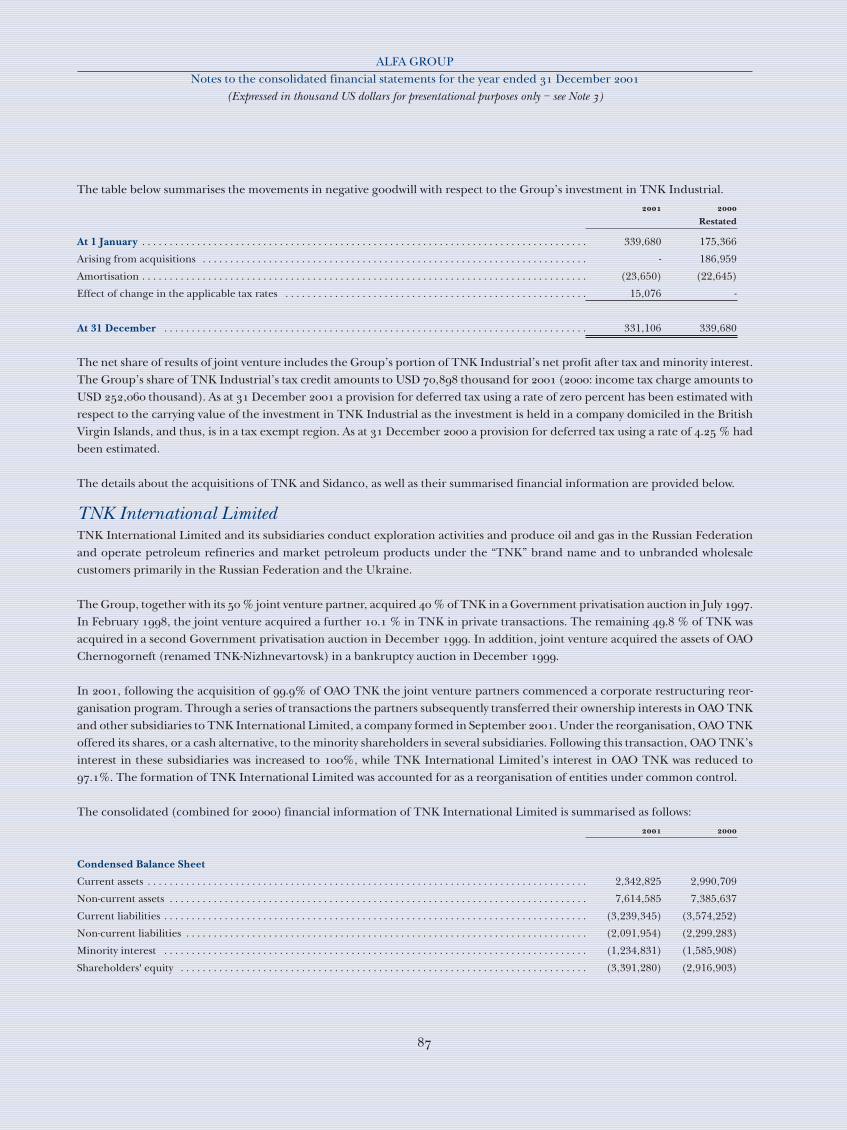
The table below summarises the movements in negative goodwill with respect to the Group’s investment in TNK Industrial.
Restated
At 1 January . . . . . . . . . . . . . . . . . . . . . . . . . . . . . . . . . . . . . . . . . . . . . . . . . . . . . . . . . . . . . . . . . . . . . . . . . . . . . . . . . 339,680 175,366
Arising from acquisitions . . . . . . . . . . . . . . . . . . . . . . . . . . . . . . . . . . . . . . . . . . . . . . . . . . . . . . . . . . . . . . . . . . . . . . - 186,959
Amortisation . . . . . . . . . . . . . . . . . . . . . . . . . . . . . . . . . . . . . . . . . . . . . . . . . . . . . . . . . . . . . . . . . . . . . . . . . . . . . . . . . (23,650) (22,645)
Effect of change in the applicable tax rates . . . . . . . . . . . . . . . . . . . . . . . . . . . . . . . . . . . . . . . . . . . . . . . . . . . . . . . 15,076 -
At 31 December . . . . . . . . . . . . . . . . . . . . . . . . . . . . . . . . . . . . . . . . . . . . . . . . . . . . . . . . . . . . . . . . . . . . . . . . . . . . . 331,106 339,680
The net share of results of joint venture includes the Group’s portion of TNK Industrial’s net profit after tax and minority interest.The Group’s share of TNK Industrial’s tax credit amounts to USD , thousand for (: income tax charge amounts toUSD , thousand). As at December a provision for deferred tax using a rate of zero percent has been estimated withrespect to the carrying value of the investment in TNK Industrial as the investment is held in a company domiciled in the BritishVirgin Islands, and thus, is in a tax exempt region. As at December a provision for deferred tax using a rate of . % hadbeen estimated.
The details about the acquisitions of TNK and Sidanco, as well as their summarised financial information are provided below.
TNK International LimitedTNK International Limited and its subsidiaries conduct exploration activities and produce oil and gas in the Russian Federationand operate petroleum refineries and market petroleum products under the “TNK” brand name and to unbranded wholesalecustomers primarily in the Russian Federation and the Ukraine.
The Group, together with its % joint venture partner, acquired % of TNK in a Government privatisation auction in July .In February , the joint venture acquired a further . % in TNK in private transactions. The remaining . % of TNK wasacquired in a second Government privatisation auction in December . In addition, joint venture acquired the assets of OAOChernogorneft (renamed TNK-Nizhnevartovsk) in a bankruptcy auction in December .
In , following the acquisition of .% of OAO TNK the joint venture partners commenced a corporate restructuring reor-ganisation program. Through a series of transactions the partners subsequently transferred their ownership interests in OAO TNKand other subsidiaries to TNK International Limited, a company formed in September . Under the reorganisation, OAO TNKoffered its shares, or a cash alternative, to the minority shareholders in several subsidiaries. Following this transaction, OAO TNK’sinterest in these subsidiaries was increased to %, while TNK International Limited’s interest in OAO TNK was reduced to.%. The formation of TNK International Limited was accounted for as a reorganisation of entities under common control.
The consolidated (combined for ) financial information of TNK International Limited is summarised as follows:
Condensed Balance Sheet
Current assets . . . . . . . . . . . . . . . . . . . . . . . . . . . . . . . . . . . . . . . . . . . . . . . . . . . . . . . . . . . . . . . . . . . . . . . . . . . . . . . . 2,342,825 2,990,709
Non-current assets . . . . . . . . . . . . . . . . . . . . . . . . . . . . . . . . . . . . . . . . . . . . . . . . . . . . . . . . . . . . . . . . . . . . . . . . . . . . 7,614,585 7,385,637
Current liabilities . . . . . . . . . . . . . . . . . . . . . . . . . . . . . . . . . . . . . . . . . . . . . . . . . . . . . . . . . . . . . . . . . . . . . . . . . . . . . (3,239,345) (3,574,252)
Non-current liabilities . . . . . . . . . . . . . . . . . . . . . . . . . . . . . . . . . . . . . . . . . . . . . . . . . . . . . . . . . . . . . . . . . . . . . . . . . (2,091,954) (2,299,283)
Minority interest . . . . . . . . . . . . . . . . . . . . . . . . . . . . . . . . . . . . . . . . . . . . . . . . . . . . . . . . . . . . . . . . . . . . . . . . . . . . . (1,234,831) (1,585,908)
Shareholders' equity . . . . . . . . . . . . . . . . . . . . . . . . . . . . . . . . . . . . . . . . . . . . . . . . . . . . . . . . . . . . . . . . . . . . . . . . . . (3,391,280) (2,916,903)
ALFA GROUP Notes to the consolidated financial statements for the year ended December
(Expressed in thousand US dollars for presentational purposes only – see Note )
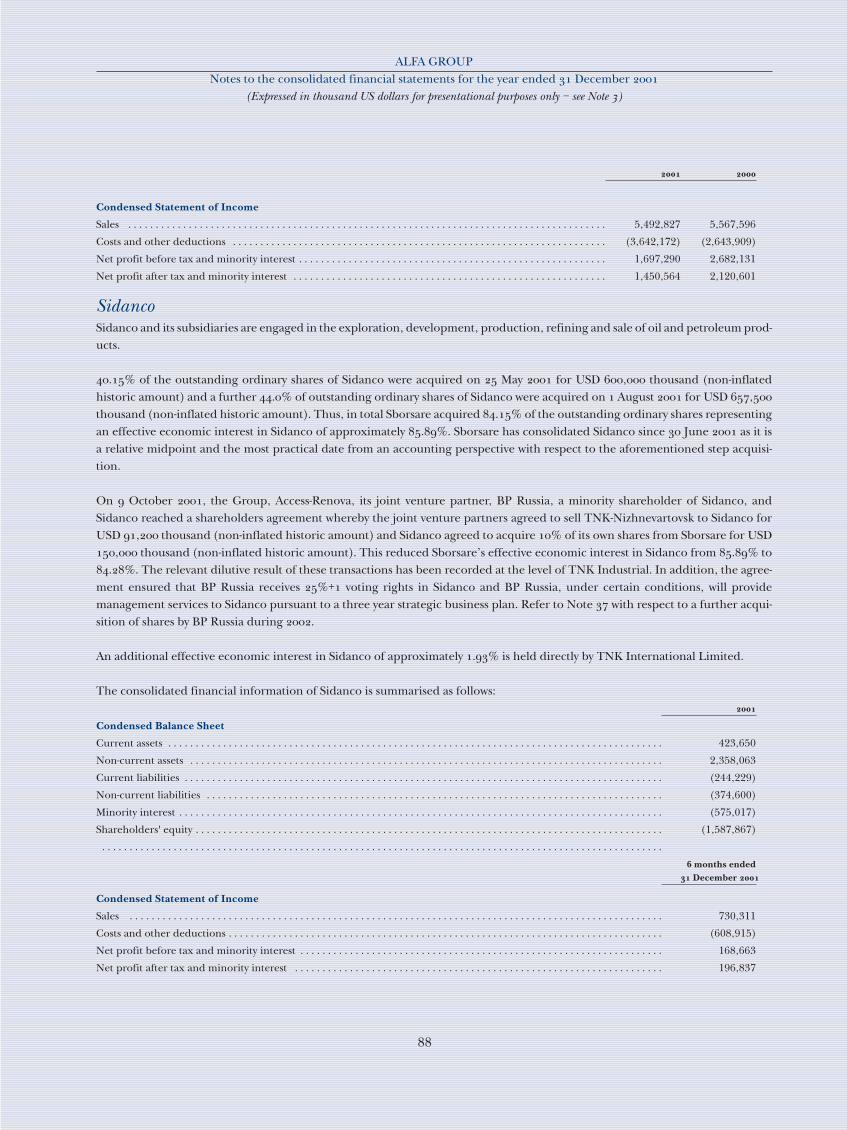
Condensed Statement of Income
Sales . . . . . . . . . . . . . . . . . . . . . . . . . . . . . . . . . . . . . . . . . . . . . . . . . . . . . . . . . . . . . . . . . . . . . . . . . . . . . . . . . . . . . . . 5,492,827 5,567,596
Costs and other deductions . . . . . . . . . . . . . . . . . . . . . . . . . . . . . . . . . . . . . . . . . . . . . . . . . . . . . . . . . . . . . . . . . . . . (3,642,172) (2,643,909)
Net profit before tax and minority interest . . . . . . . . . . . . . . . . . . . . . . . . . . . . . . . . . . . . . . . . . . . . . . . . . . . . . . . . 1,697,290 2,682,131
Net profit after tax and minority interest . . . . . . . . . . . . . . . . . . . . . . . . . . . . . . . . . . . . . . . . . . . . . . . . . . . . . . . . . 1,450,564 2,120,601
Sidanco Sidanco and its subsidiaries are engaged in the exploration, development, production, refining and sale of oil and petroleum prod-ucts.
.% of the outstanding ordinary shares of Sidanco were acquired on May for USD , thousand (non-inflatedhistoric amount) and a further .% of outstanding ordinary shares of Sidanco were acquired on August for USD ,thousand (non-inflated historic amount). Thus, in total Sborsare acquired .% of the outstanding ordinary shares representingan effective economic interest in Sidanco of approximately .%. Sborsare has consolidated Sidanco since June as it isa relative midpoint and the most practical date from an accounting perspective with respect to the aforementioned step acquisi-tion.
On October , the Group, Access-Renova, its joint venture partner, BP Russia, a minority shareholder of Sidanco, andSidanco reached a shareholders agreement whereby the joint venture partners agreed to sell TNK-Nizhnevartovsk to Sidanco forUSD , thousand (non-inflated historic amount) and Sidanco agreed to acquire % of its own shares from Sborsare for USD, thousand (non-inflated historic amount). This reduced Sborsare’s effective economic interest in Sidanco from .% to.%. The relevant dilutive result of these transactions has been recorded at the level of TNK Industrial. In addition, the agree-ment ensured that BP Russia receives %+ voting rights in Sidanco and BP Russia, under certain conditions, will providemanagement services to Sidanco pursuant to a three year strategic business plan. Refer to Note with respect to a further acqui-sition of shares by BP Russia during .
An additional effective economic interest in Sidanco of approximately .% is held directly by TNK International Limited.
The consolidated financial information of Sidanco is summarised as follows:
Condensed Balance Sheet
Current assets . . . . . . . . . . . . . . . . . . . . . . . . . . . . . . . . . . . . . . . . . . . . . . . . . . . . . . . . . . . . . . . . . . . . . . . . . . . . . . . . . . . . . . . . . . 423,650
Non-current assets . . . . . . . . . . . . . . . . . . . . . . . . . . . . . . . . . . . . . . . . . . . . . . . . . . . . . . . . . . . . . . . . . . . . . . . . . . . . . . . . . . . . . . 2,358,063
Current liabilities . . . . . . . . . . . . . . . . . . . . . . . . . . . . . . . . . . . . . . . . . . . . . . . . . . . . . . . . . . . . . . . . . . . . . . . . . . . . . . . . . . . . . . . (244,229)
Non-current liabilities . . . . . . . . . . . . . . . . . . . . . . . . . . . . . . . . . . . . . . . . . . . . . . . . . . . . . . . . . . . . . . . . . . . . . . . . . . . . . . . . . . . (374,600)
Minority interest . . . . . . . . . . . . . . . . . . . . . . . . . . . . . . . . . . . . . . . . . . . . . . . . . . . . . . . . . . . . . . . . . . . . . . . . . . . . . . . . . . . . . . . . (575,017)
Shareholders' equity . . . . . . . . . . . . . . . . . . . . . . . . . . . . . . . . . . . . . . . . . . . . . . . . . . . . . . . . . . . . . . . . . . . . . . . . . . . . . . . . . . . . . (1,587,867)
. . . . . . . . . . . . . . . . . . . . . . . . . . . . . . . . . . . . . . . . . . . . . . . . . . . . . . . . . . . . . . . . . . . . . . . . . . . . . . . . . . . . . . . . . . . . . . . . . . . . . .
months ended December
Condensed Statement of Income
Sales . . . . . . . . . . . . . . . . . . . . . . . . . . . . . . . . . . . . . . . . . . . . . . . . . . . . . . . . . . . . . . . . . . . . . . . . . . . . . . . . . . . . . . . . . . . . . . . . . 730,311
Costs and other deductions . . . . . . . . . . . . . . . . . . . . . . . . . . . . . . . . . . . . . . . . . . . . . . . . . . . . . . . . . . . . . . . . . . . . . . . . . . . . . . . (608,915)
Net profit before tax and minority interest . . . . . . . . . . . . . . . . . . . . . . . . . . . . . . . . . . . . . . . . . . . . . . . . . . . . . . . . . . . . . . . . . . 168,663
Net profit after tax and minority interest . . . . . . . . . . . . . . . . . . . . . . . . . . . . . . . . . . . . . . . . . . . . . . . . . . . . . . . . . . . . . . . . . . . 196,837
ALFA GROUP Notes to the consolidated financial statements for the year ended December
(Expressed in thousand US dollars for presentational purposes only – see Note )

OAO VolgaIn May , the Group acquired a .% interest in OAO Volga, a newsprint manufacturer, for a consideration of USD ,thousand. A joint venture partner acquired a similar interest.
At 1 January . . . . . . . . . . . . . . . . . . . . . . . . . . . . . . . . . . . . . . . . . . . . . . . . . . . . . . . . . . . . . . . . . . . . . . . . . . . . . . . . . . . . . . . . . . . -
Group’s share of net assets acquired (at fair value) . . . . . . . . . . . . . . . . . . . . . . . . . . . . . . . . . . . . . . . . . . . . . . . . . . . . . . . . . . . 34,877
Goodwill arising from acquisitions . . . . . . . . . . . . . . . . . . . . . . . . . . . . . . . . . . . . . . . . . . . . . . . . . . . . . . . . . . . . . . . . . . . . . . . . . (9,777)
Net share of results of joint venture . . . . . . . . . . . . . . . . . . . . . . . . . . . . . . . . . . . . . . . . . . . . . . . . . . . . . . . . . . . . . . . . . . . . . . . . 18,805
Amortisation of goodwill . . . . . . . . . . . . . . . . . . . . . . . . . . . . . . . . . . . . . . . . . . . . . . . . . . . . . . . . . . . . . . . . . . . . . . . . . . . . . . . . . 1,955
Distribution to shareholders . . . . . . . . . . . . . . . . . . . . . . . . . . . . . . . . . . . . . . . . . . . . . . . . . . . . . . . . . . . . . . . . . . . . . . . . . . . . . . (4,300)
At 31 December . . . . . . . . . . . . . . . . . . . . . . . . . . . . . . . . . . . . . . . . . . . . . . . . . . . . . . . . . . . . . . . . . . . . . . . . . . . . . . . . . . . . . . . . 41,560
The consolidated financial information on OAO Volga is summarised below (disclosed at %): December
Total assets . . . . . . . . . . . . . . . . . . . . . . . . . . . . . . . . . . . . . . . . . . . . . . . . . . . . . . . . . . . . . . . . . . . . . . . . . . . . . . . . . . . . . . . . . . . . . 210,123
Shareholders equity . . . . . . . . . . . . . . . . . . . . . . . . . . . . . . . . . . . . . . . . . . . . . . . . . . . . . . . . . . . . . . . . . . . . . . . . . . . . . . . . . . . . . (98,767)
Minority Interest . . . . . . . . . . . . . . . . . . . . . . . . . . . . . . . . . . . . . . . . . . . . . . . . . . . . . . . . . . . . . . . . . . . . . . . . . . . . . . . . . . . . . . . . (9,962)
months ended December
Sales . . . . . . . . . . . . . . . . . . . . . . . . . . . . . . . . . . . . . . . . . . . . . . . . . . . . . . . . . . . . . . . . . . . . . . . . . . . . . . . . . . . . . . . . . . . . . . . . . . 158,943
Profit before tax . . . . . . . . . . . . . . . . . . . . . . . . . . . . . . . . . . . . . . . . . . . . . . . . . . . . . . . . . . . . . . . . . . . . . . . . . . . . . . . . . . . . . . . . 34,430
7. INVESTMENT IN ASSOCIATED COMPANIES
The Group’s investments in associated companies include investments in the telecommunications sector. VimpelCom Golden
Group Telecom Total
Opening net amount . . . . . . . . . . . . . . . . . . . . . . . . . . . . . . . . . . . . . . . . . . . . . . . . . . . . . . . . . . . . - - -
Group’s share of net assets acquired
(at fair value) . . . . . . . . . . . . . . . . . . . . . . . . . . . . . . . . . . . . . . . . . . . . . . . . . . . . . . . . . . . . . . . . . . 90,402 96,548 186,950
Goodwill acquired . . . . . . . . . . . . . . . . . . . . . . . . . . . . . . . . . . . . . . . . . . . . . . . . . . . . . . . . . . . . . . 34,527 17,287 51,814
Share of results of associates . . . . . . . . . . . . . . . . . . . . . . . . . . . . . . . . . . . . . . . . . . . . . . . . . . . . . . 3,226 5,043 8,269
Net share of other equity movements . . . . . . . . . . . . . . . . . . . . . . . . . . . . . . . . . . . . . . . . . . . . . . - (560) (560)
Amortisation of goodwill . . . . . . . . . . . . . . . . . . . . . . . . . . . . . . . . . . . . . . . . . . . . . . . . . . . . . . . . (288) (1,725) (2,013)
Closing net amount . . . . . . . . . . . . . . . . . . . . . . . . . . . . . . . . . . . . . . . . . . . . . . . . . . . . . . . . . . . . 127,867 116,593 244,460
VimpelCom GroupIn November , a company controlled by the Group purchased a %+ voting stock in OAO Vimpel-Communications andZAO VimpelCom-Region (collectively referred to as VimpelCom Group) for a consideration of USD , thousand. The Grouppurchased ,, common shares (equivalent of ,, American Depositary Shares (“ADS”) at a purchase price of USD(original) . per share (USD (original) . per ADS) representing .% of common stock and convertible voting preferred
ALFA GROUP Notes to the consolidated financial statements for the year ended December
(Expressed in thousand US dollars for presentational purposes only – see Note )
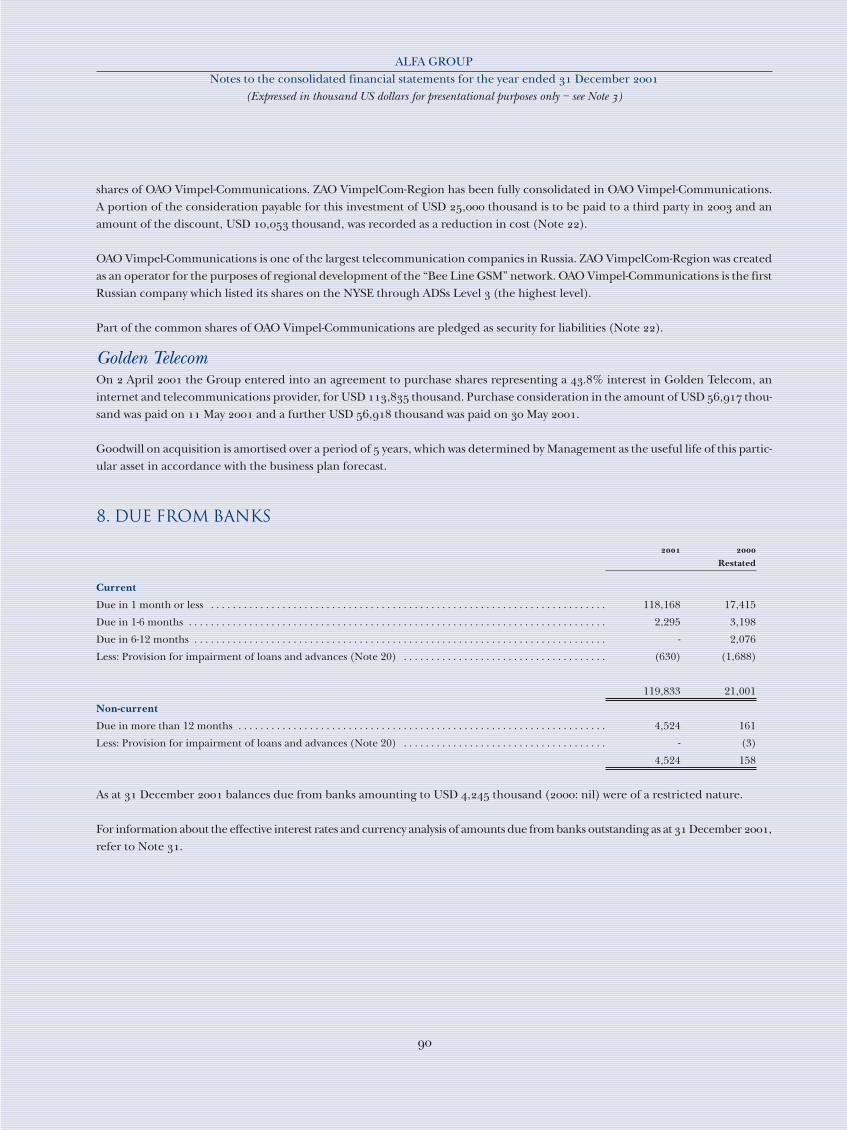
shares of OAO Vimpel-Communications. ZAO VimpelCom-Region has been fully consolidated in OAO Vimpel-Communications.A portion of the consideration payable for this investment of USD , thousand is to be paid to a third party in and anamount of the discount, USD , thousand, was recorded as a reduction in cost (Note ).
OAO Vimpel-Communications is one of the largest telecommunication companies in Russia. ZAO VimpelCom-Region was createdas an operator for the purposes of regional development of the “Bee Line GSM” network. OAO Vimpel-Communications is the firstRussian company which listed its shares on the NYSE through ADSs Level (the highest level).
Part of the common shares of OAO Vimpel-Communications are pledged as security for liabilities (Note ).
Golden TelecomOn April the Group entered into an agreement to purchase shares representing a .% interest in Golden Telecom, aninternet and telecommunications provider, for USD , thousand. Purchase consideration in the amount of USD , thou-sand was paid on May and a further USD , thousand was paid on May .
Goodwill on acquisition is amortised over a period of years, which was determined by Management as the useful life of this partic-ular asset in accordance with the business plan forecast.
8. DUE FROM BANKS
Restated
Current
Due in 1 month or less . . . . . . . . . . . . . . . . . . . . . . . . . . . . . . . . . . . . . . . . . . . . . . . . . . . . . . . . . . . . . . . . . . . . . . . . 118,168 17,415
Due in 1-6 months . . . . . . . . . . . . . . . . . . . . . . . . . . . . . . . . . . . . . . . . . . . . . . . . . . . . . . . . . . . . . . . . . . . . . . . . . . . . 2,295 3,198
Due in 6-12 months . . . . . . . . . . . . . . . . . . . . . . . . . . . . . . . . . . . . . . . . . . . . . . . . . . . . . . . . . . . . . . . . . . . . . . . . . . . - 2,076
Less: Provision for impairment of loans and advances (Note 20) . . . . . . . . . . . . . . . . . . . . . . . . . . . . . . . . . . . . . (630) (1,688)
119,833 21,001
Non-current
Due in more than 12 months . . . . . . . . . . . . . . . . . . . . . . . . . . . . . . . . . . . . . . . . . . . . . . . . . . . . . . . . . . . . . . . . . . . 4,524 161
Less: Provision for impairment of loans and advances (Note 20) . . . . . . . . . . . . . . . . . . . . . . . . . . . . . . . . . . . . . - (3)
4,524 158
As at December balances due from banks amounting to USD , thousand (: nil) were of a restricted nature.
For information about the effective interest rates and currency analysis of amounts due from banks outstanding as at December ,refer to Note .
ALFA GROUP Notes to the consolidated financial statements for the year ended December
(Expressed in thousand US dollars for presentational purposes only – see Note )
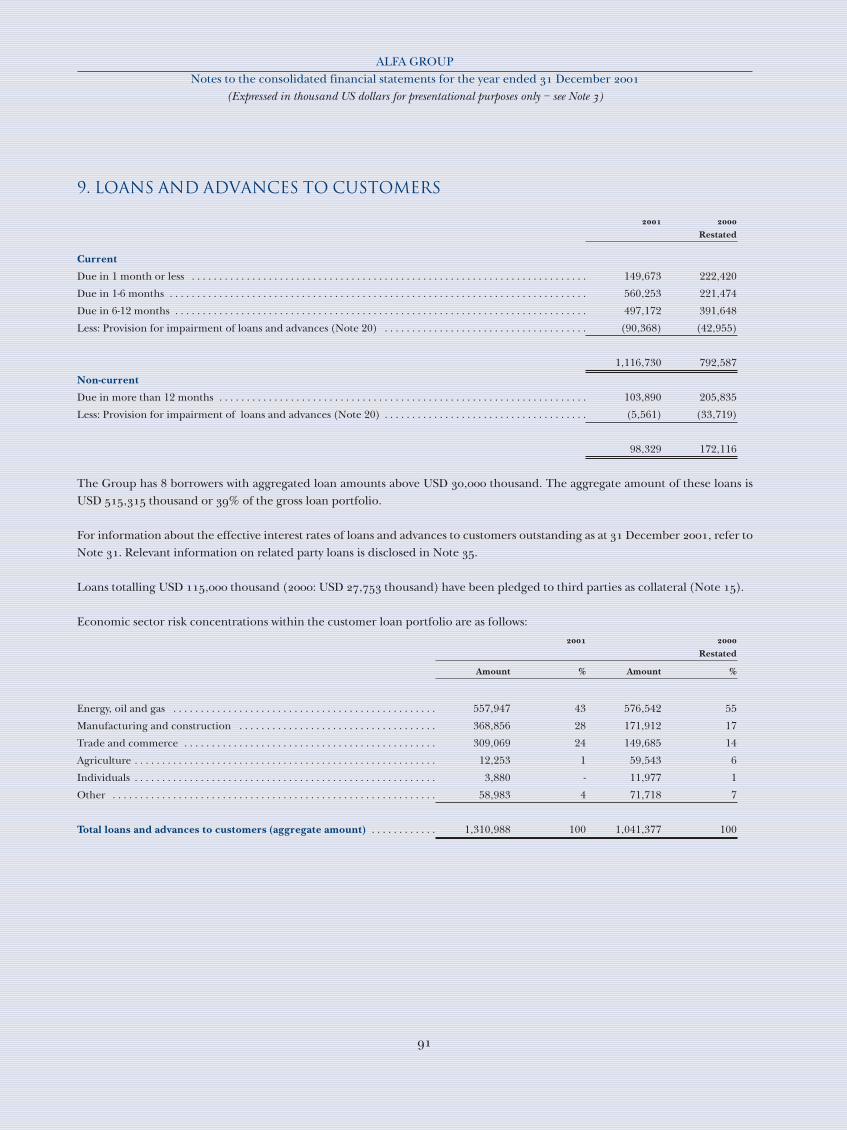
9. LOANS AND ADVANCES TO CUSTOMERS
Restated
Current
Due in 1 month or less . . . . . . . . . . . . . . . . . . . . . . . . . . . . . . . . . . . . . . . . . . . . . . . . . . . . . . . . . . . . . . . . . . . . . . . . 149,673 222,420
Due in 1-6 months . . . . . . . . . . . . . . . . . . . . . . . . . . . . . . . . . . . . . . . . . . . . . . . . . . . . . . . . . . . . . . . . . . . . . . . . . . . . 560,253 221,474
Due in 6-12 months . . . . . . . . . . . . . . . . . . . . . . . . . . . . . . . . . . . . . . . . . . . . . . . . . . . . . . . . . . . . . . . . . . . . . . . . . . . 497,172 391,648
Less: Provision for impairment of loans and advances (Note 20) . . . . . . . . . . . . . . . . . . . . . . . . . . . . . . . . . . . . . (90,368) (42,955)
1,116,730 792,587
Non-current
Due in more than 12 months . . . . . . . . . . . . . . . . . . . . . . . . . . . . . . . . . . . . . . . . . . . . . . . . . . . . . . . . . . . . . . . . . . . 103,890 205,835
Less: Provision for impairment of loans and advances (Note 20) . . . . . . . . . . . . . . . . . . . . . . . . . . . . . . . . . . . . . (5,561) (33,719)
98,329 172,116
The Group has borrowers with aggregated loan amounts above USD , thousand. The aggregate amount of these loans isUSD , thousand or % of the gross loan portfolio.
For information about the effective interest rates of loans and advances to customers outstanding as at December , refer toNote . Relevant information on related party loans is disclosed in Note .
Loans totalling USD , thousand (: USD , thousand) have been pledged to third parties as collateral (Note ).
Economic sector risk concentrations within the customer loan portfolio are as follows:
Restated
Amount % Amount %
Energy, oil and gas . . . . . . . . . . . . . . . . . . . . . . . . . . . . . . . . . . . . . . . . . . . . . . . . 557,947 43 576,542 55
Manufacturing and construction . . . . . . . . . . . . . . . . . . . . . . . . . . . . . . . . . . . . 368,856 28 171,912 17
Trade and commerce . . . . . . . . . . . . . . . . . . . . . . . . . . . . . . . . . . . . . . . . . . . . . . 309,069 24 149,685 14
Agriculture . . . . . . . . . . . . . . . . . . . . . . . . . . . . . . . . . . . . . . . . . . . . . . . . . . . . . . . 12,253 1 59,543 6
Individuals . . . . . . . . . . . . . . . . . . . . . . . . . . . . . . . . . . . . . . . . . . . . . . . . . . . . . . . 3,880 - 11,977 1
Other . . . . . . . . . . . . . . . . . . . . . . . . . . . . . . . . . . . . . . . . . . . . . . . . . . . . . . . . . . . 58,983 4 71,718 7
Total loans and advances to customers (aggregate amount) . . . . . . . . . . . . 1,310,988 100 1,041,377 100
ALFA GROUP Notes to the consolidated financial statements for the year ended December
(Expressed in thousand US dollars for presentational purposes only – see Note )
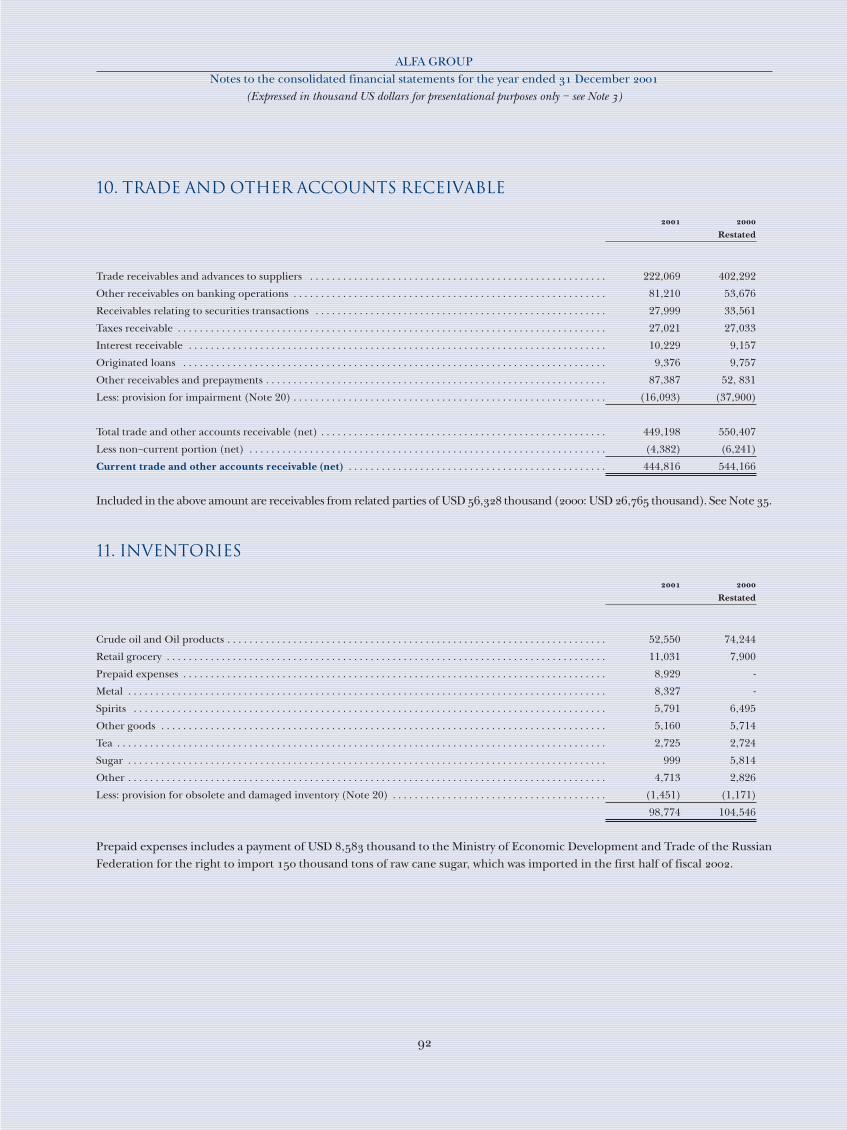
10. TRADE AND OTHER ACCOUNTS RECEIVABLE
Restated
Trade receivables and advances to suppliers . . . . . . . . . . . . . . . . . . . . . . . . . . . . . . . . . . . . . . . . . . . . . . . . . . . . . . 222,069 402,292
Other receivables on banking operations . . . . . . . . . . . . . . . . . . . . . . . . . . . . . . . . . . . . . . . . . . . . . . . . . . . . . . . . . 81,210 53,676
Receivables relating to securities transactions . . . . . . . . . . . . . . . . . . . . . . . . . . . . . . . . . . . . . . . . . . . . . . . . . . . . . 27,999 33,561
Taxes receivable . . . . . . . . . . . . . . . . . . . . . . . . . . . . . . . . . . . . . . . . . . . . . . . . . . . . . . . . . . . . . . . . . . . . . . . . . . . . . . 27,021 27,033
Interest receivable . . . . . . . . . . . . . . . . . . . . . . . . . . . . . . . . . . . . . . . . . . . . . . . . . . . . . . . . . . . . . . . . . . . . . . . . . . . . 10,229 9,157
Originated loans . . . . . . . . . . . . . . . . . . . . . . . . . . . . . . . . . . . . . . . . . . . . . . . . . . . . . . . . . . . . . . . . . . . . . . . . . . . . . 9,376 9,757
Other receivables and prepayments . . . . . . . . . . . . . . . . . . . . . . . . . . . . . . . . . . . . . . . . . . . . . . . . . . . . . . . . . . . . . . 87,387 52, 831
Less: provision for impairment (Note 20) . . . . . . . . . . . . . . . . . . . . . . . . . . . . . . . . . . . . . . . . . . . . . . . . . . . . . . . . . (16,093) (37,900)
Total trade and other accounts receivable (net) . . . . . . . . . . . . . . . . . . . . . . . . . . . . . . . . . . . . . . . . . . . . . . . . . . . . 449,198 550,407
Less non–current portion (net) . . . . . . . . . . . . . . . . . . . . . . . . . . . . . . . . . . . . . . . . . . . . . . . . . . . . . . . . . . . . . . . . . (4,382) (6,241)
Current trade and other accounts receivable (net) . . . . . . . . . . . . . . . . . . . . . . . . . . . . . . . . . . . . . . . . . . . . . . . 444,816 544,166
Included in the above amount are receivables from related parties of USD , thousand (: USD , thousand). See Note .
11. INVENTORIES
Restated
Crude oil and Oil products . . . . . . . . . . . . . . . . . . . . . . . . . . . . . . . . . . . . . . . . . . . . . . . . . . . . . . . . . . . . . . . . . . . . . 52,550 74,244
Retail grocery . . . . . . . . . . . . . . . . . . . . . . . . . . . . . . . . . . . . . . . . . . . . . . . . . . . . . . . . . . . . . . . . . . . . . . . . . . . . . . . . 11,031 7,900
Prepaid expenses . . . . . . . . . . . . . . . . . . . . . . . . . . . . . . . . . . . . . . . . . . . . . . . . . . . . . . . . . . . . . . . . . . . . . . . . . . . . . 8,929 -
Metal . . . . . . . . . . . . . . . . . . . . . . . . . . . . . . . . . . . . . . . . . . . . . . . . . . . . . . . . . . . . . . . . . . . . . . . . . . . . . . . . . . . . . . . 8,327 -
Spirits . . . . . . . . . . . . . . . . . . . . . . . . . . . . . . . . . . . . . . . . . . . . . . . . . . . . . . . . . . . . . . . . . . . . . . . . . . . . . . . . . . . . . . 5,791 6,495
Other goods . . . . . . . . . . . . . . . . . . . . . . . . . . . . . . . . . . . . . . . . . . . . . . . . . . . . . . . . . . . . . . . . . . . . . . . . . . . . . . . . . 5,160 5,714
Tea . . . . . . . . . . . . . . . . . . . . . . . . . . . . . . . . . . . . . . . . . . . . . . . . . . . . . . . . . . . . . . . . . . . . . . . . . . . . . . . . . . . . . . . . . 2,725 2,724
Sugar . . . . . . . . . . . . . . . . . . . . . . . . . . . . . . . . . . . . . . . . . . . . . . . . . . . . . . . . . . . . . . . . . . . . . . . . . . . . . . . . . . . . . . . 999 5,814
Other . . . . . . . . . . . . . . . . . . . . . . . . . . . . . . . . . . . . . . . . . . . . . . . . . . . . . . . . . . . . . . . . . . . . . . . . . . . . . . . . . . . . . . . 4,713 2,826
Less: provision for obsolete and damaged inventory (Note 20) . . . . . . . . . . . . . . . . . . . . . . . . . . . . . . . . . . . . . . . (1,451) (1,171)
98,774 104,546
Prepaid expenses includes a payment of USD , thousand to the Ministry of Economic Development and Trade of the RussianFederation for the right to import thousand tons of raw cane sugar, which was imported in the first half of fiscal .
ALFA GROUP Notes to the consolidated financial statements for the year ended December
(Expressed in thousand US dollars for presentational purposes only – see Note )
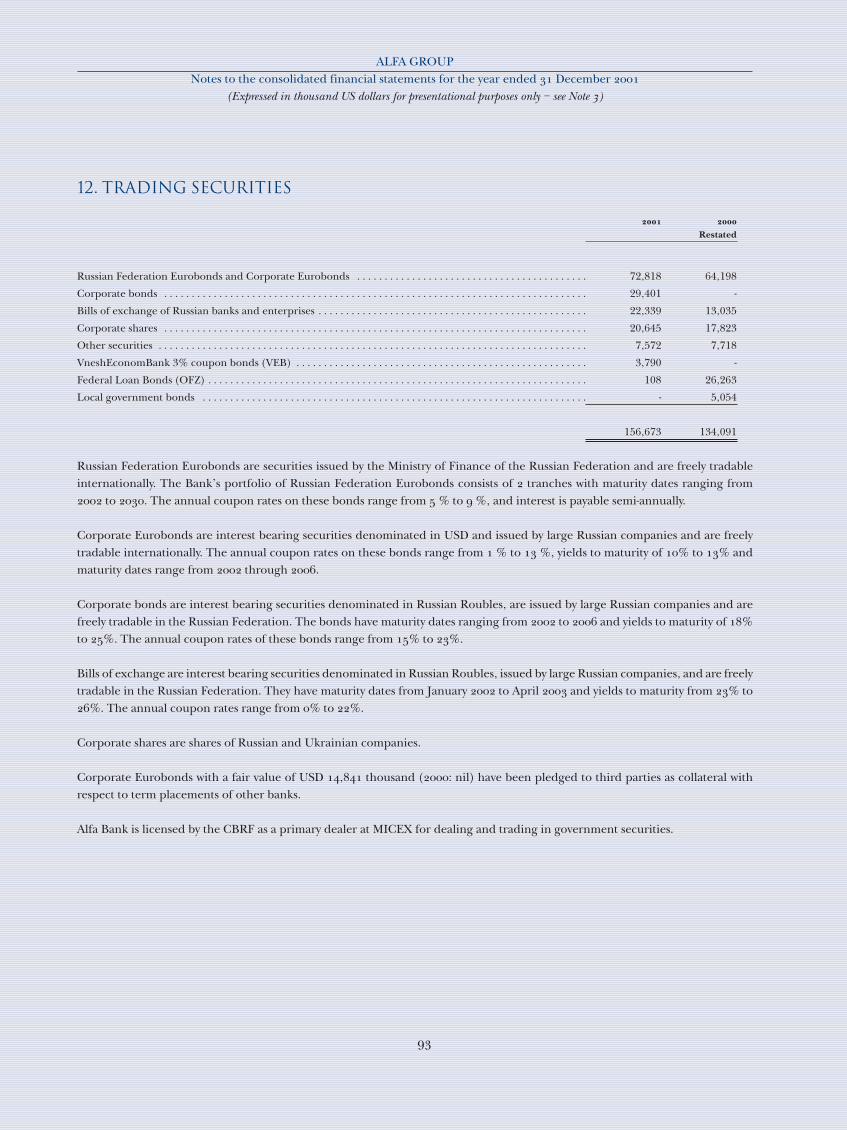
12. TRADING SECURITIES
Restated
Russian Federation Eurobonds and Corporate Eurobonds . . . . . . . . . . . . . . . . . . . . . . . . . . . . . . . . . . . . . . . . . . 72,818 64,198
Corporate bonds . . . . . . . . . . . . . . . . . . . . . . . . . . . . . . . . . . . . . . . . . . . . . . . . . . . . . . . . . . . . . . . . . . . . . . . . . . . . . 29,401 -
Bills of exchange of Russian banks and enterprises . . . . . . . . . . . . . . . . . . . . . . . . . . . . . . . . . . . . . . . . . . . . . . . . . 22,339 13,035
Corporate shares . . . . . . . . . . . . . . . . . . . . . . . . . . . . . . . . . . . . . . . . . . . . . . . . . . . . . . . . . . . . . . . . . . . . . . . . . . . . . 20,645 17,823
Other securities . . . . . . . . . . . . . . . . . . . . . . . . . . . . . . . . . . . . . . . . . . . . . . . . . . . . . . . . . . . . . . . . . . . . . . . . . . . . . . 7,572 7,718
VneshEconomBank 3% coupon bonds (VEB) . . . . . . . . . . . . . . . . . . . . . . . . . . . . . . . . . . . . . . . . . . . . . . . . . . . . . 3,790 -
Federal Loan Bonds (OFZ) . . . . . . . . . . . . . . . . . . . . . . . . . . . . . . . . . . . . . . . . . . . . . . . . . . . . . . . . . . . . . . . . . . . . . 108 26,263
Local government bonds . . . . . . . . . . . . . . . . . . . . . . . . . . . . . . . . . . . . . . . . . . . . . . . . . . . . . . . . . . . . . . . . . . . . . . - 5,054
156,673 134,091
Russian Federation Eurobonds are securities issued by the Ministry of Finance of the Russian Federation and are freely tradableinternationally. The Bank’s portfolio of Russian Federation Eurobonds consists of tranches with maturity dates ranging from to . The annual coupon rates on these bonds range from % to %, and interest is payable semi-annually.
Corporate Eurobonds are interest bearing securities denominated in USD and issued by large Russian companies and are freelytradable internationally. The annual coupon rates on these bonds range from % to %, yields to maturity of % to % andmaturity dates range from through .
Corporate bonds are interest bearing securities denominated in Russian Roubles, are issued by large Russian companies and arefreely tradable in the Russian Federation. The bonds have maturity dates ranging from to and yields to maturity of %to %. The annual coupon rates of these bonds range from % to %.
Bills of exchange are interest bearing securities denominated in Russian Roubles, issued by large Russian companies, and are freelytradable in the Russian Federation. They have maturity dates from January to April and yields to maturity from % to%. The annual coupon rates range from % to %.
Corporate shares are shares of Russian and Ukrainian companies.
Corporate Eurobonds with a fair value of USD , thousand (: nil) have been pledged to third parties as collateral withrespect to term placements of other banks.
Alfa Bank is licensed by the CBRF as a primary dealer at MICEX for dealing and trading in government securities.
ALFA GROUP Notes to the consolidated financial statements for the year ended December
(Expressed in thousand US dollars for presentational purposes only – see Note )
13. CASH AND CASH EQUIVALENTS
Restated
Cash in hand and in bank current, correspondent and deposit accounts . . . . . . . . . . . . . . . . . . . . . . . . . . . . . . . 351,100 468,308
Cash and balances with Central Bank of the Russian Federation . . . . . . . . . . . . . . . . . . . . . . . . . . . . . . . . . . . . . . 350,673 206,363
Other liquid assets . . . . . . . . . . . . . . . . . . . . . . . . . . . . . . . . . . . . . . . . . . . . . . . . . . . . . . . . . . . . . . . . . . . . . . . . . . . . 7,909 3,270
709,682 677,941
Less: mandatory reserves with CBRF . . . . . . . . . . . . . . . . . . . . . . . . . . . . . . . . . . . . . . . . . . . . . . . . . . . . . . . . . . . . . (142,053) (99,014)
Net cash and cash equivalents . . . . . . . . . . . . . . . . . . . . . . . . . . . . . . . . . . . . . . . . . . . . . . . . . . . . . . . . . . . . . . . . . 567,629 578,927
The balances with the Central Bank of the Russian Federation include USD , thousand (: USD , thousand) ofmandatory reserves for Alfa Bank. These amounts have been excluded from cash and cash equivalents in the consolidated state-ment of cash flows.
Included in the amounts above are USD , thousand (: USD , thousand) of cash held as collateral and not avail-able for use by the Group.
Interest rates on cash and cash equivalents are disclosed in Note .
14. SHARE CAPITAL AND SHARE PREMIUM
The authorised, issued and fully paid share capital of CTF Holdings Limited consists of , ordinary shares of GBP . each.
In accordance with the statutes of CTF Holdings Limited, the share premium represents GBP (USD .) for each of the, new shares issued in .
The carrying value of issued share capital and share premium, after giving effect to IAS , are USD , thousand andUSD , thousand, respectively.
In the Group declared dividends of USD , thousand (: USD , thousand).
As at December certain members of Management of the Group are the holders of call options which expire on January and October . Under the terms of the call option agreements, the holders may purchase .% and .% of the outstandingshares of Alfa Finance Holdings S.A. for USD , thousand and USD , thousand, respectively. At the same time the membersof Management are also holders of put options which expire on January (.%) and January (.%). Under theterms of the put option agreements, the holders may require Alfa Finance Holdings S.A. to repurchase .% of Alfa FinanceHoldings S.A. shares acquired by exercising the aforementioned call options for a consideration equal to % of the pro-rataamount of the audited consolidated shareholders’ equity of Alfa Finance Holdings S.A. as at December .
For the call option covered by corresponding put options the estimated difference between the price of the call option and theproceeds to be received under the put option has been treated as compensation expense and is included in the consolidated state-ment of income within general and administrative expenses (refer to Note ).
ALFA GROUP Notes to the consolidated financial statements for the year ended December
(Expressed in thousand US dollars for presentational purposes only – see Note )
In addition, as at December a member of Management of the Group is the holder of a call option which was issued inDecember and which expires on December . Under the terms of the option agreement, the holder may purchase sucha number of the outstanding shares of Alfa Finance Holdings S.A. which when valued on the basis of the audited consolidatedshareholders’ equity of Alfa Finance Holdings S.A. as at December would be equal to % of the audited consolidated share-holders’ equity of TNK Industrial Holdings Limited as at December . The purchase price per share is to be based upon theaudited consolidated shareholders’ equity of Alfa Finance Holdings S.A. as at December .
For the call options above that are not covered by put options, there has been no charge to the consolidated statement of income.
15. BORROWINGS
Restated
Bills of exchange . . . . . . . . . . . . . . . . . . . . . . . . . . . . . . . . . . . . . . . . . . . . . . . . . . . . . . . . . . . . . . . . . . . . . . . . . . . . . 439,396 325,002
Loans from financial institutions . . . . . . . . . . . . . . . . . . . . . . . . . . . . . . . . . . . . . . . . . . . . . . . . . . . . . . . . . . . . . . . . 212,710 313,846
Loans from non-financial institutions . . . . . . . . . . . . . . . . . . . . . . . . . . . . . . . . . . . . . . . . . . . . . . . . . . . . . . . . . . . . 11,887 842
Other borrowings . . . . . . . . . . . . . . . . . . . . . . . . . . . . . . . . . . . . . . . . . . . . . . . . . . . . . . . . . . . . . . . . . . . . . . . . . . . . . 52,640 81,198
Total borrowings . . . . . . . . . . . . . . . . . . . . . . . . . . . . . . . . . . . . . . . . . . . . . . . . . . . . . . . . . . . . . . . . . . . . . . . . . . . . . 716,633 720,888
Less non-current portion . . . . . . . . . . . . . . . . . . . . . . . . . . . . . . . . . . . . . . . . . . . . . . . . . . . . . . . . . . . . . . . . . . . . . . (66,511) (78,551)
Total current borrowings . . . . . . . . . . . . . . . . . . . . . . . . . . . . . . . . . . . . . . . . . . . . . . . . . . . . . . . . . . . . . . . . . . . . . 650,122 642,337
ALFA GROUP Notes to the consolidated financial statements for the year ended December
(Expressed in thousand US dollars for presentational purposes only – see Note )
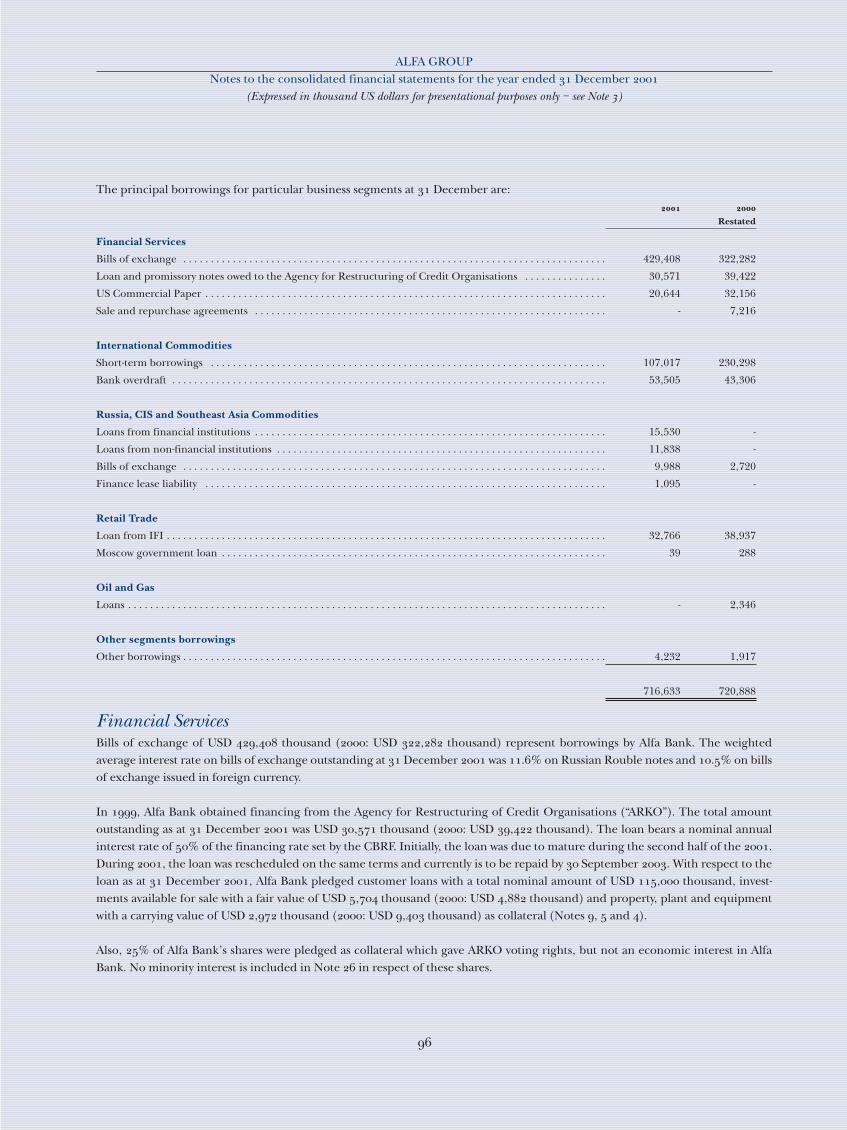
The principal borrowings for particular business segments at December are:
Restated
Financial Services
Bills of exchange . . . . . . . . . . . . . . . . . . . . . . . . . . . . . . . . . . . . . . . . . . . . . . . . . . . . . . . . . . . . . . . . . . . . . . . . . . . . . 429,408 322,282
Loan and promissory notes owed to the Agency for Restructuring of Credit Organisations . . . . . . . . . . . . . . . 30,571 39,422
US Commercial Paper . . . . . . . . . . . . . . . . . . . . . . . . . . . . . . . . . . . . . . . . . . . . . . . . . . . . . . . . . . . . . . . . . . . . . . . . . 20,644 32,156
Sale and repurchase agreements . . . . . . . . . . . . . . . . . . . . . . . . . . . . . . . . . . . . . . . . . . . . . . . . . . . . . . . . . . . . . . . . - 7,216
International Commodities
Short-term borrowings . . . . . . . . . . . . . . . . . . . . . . . . . . . . . . . . . . . . . . . . . . . . . . . . . . . . . . . . . . . . . . . . . . . . . . . . 107,017 230,298
Bank overdraft . . . . . . . . . . . . . . . . . . . . . . . . . . . . . . . . . . . . . . . . . . . . . . . . . . . . . . . . . . . . . . . . . . . . . . . . . . . . . . . 53,505 43,306
Russia, CIS and Southeast Asia Commodities
Loans from financial institutions . . . . . . . . . . . . . . . . . . . . . . . . . . . . . . . . . . . . . . . . . . . . . . . . . . . . . . . . . . . . . . . . 15,530 -
Loans from non-financial institutions . . . . . . . . . . . . . . . . . . . . . . . . . . . . . . . . . . . . . . . . . . . . . . . . . . . . . . . . . . . . 11,838 -
Bills of exchange . . . . . . . . . . . . . . . . . . . . . . . . . . . . . . . . . . . . . . . . . . . . . . . . . . . . . . . . . . . . . . . . . . . . . . . . . . . . . 9,988 2,720
Finance lease liability . . . . . . . . . . . . . . . . . . . . . . . . . . . . . . . . . . . . . . . . . . . . . . . . . . . . . . . . . . . . . . . . . . . . . . . . . 1,095 -
Retail Trade
Loan from IFI . . . . . . . . . . . . . . . . . . . . . . . . . . . . . . . . . . . . . . . . . . . . . . . . . . . . . . . . . . . . . . . . . . . . . . . . . . . . . . . . 32,766 38,937
Moscow government loan . . . . . . . . . . . . . . . . . . . . . . . . . . . . . . . . . . . . . . . . . . . . . . . . . . . . . . . . . . . . . . . . . . . . . . 39 288
Oil and Gas
Loans . . . . . . . . . . . . . . . . . . . . . . . . . . . . . . . . . . . . . . . . . . . . . . . . . . . . . . . . . . . . . . . . . . . . . . . . . . . . . . . . . . . . . . . - 2,346
Other segments borrowings
Other borrowings . . . . . . . . . . . . . . . . . . . . . . . . . . . . . . . . . . . . . . . . . . . . . . . . . . . . . . . . . . . . . . . . . . . . . . . . . . . . . 4,232 1,917
716,633 720,888
Financial ServicesBills of exchange of USD , thousand (: USD , thousand) represent borrowings by Alfa Bank. The weightedaverage interest rate on bills of exchange outstanding at December was .% on Russian Rouble notes and .% on billsof exchange issued in foreign currency.
In , Alfa Bank obtained financing from the Agency for Restructuring of Credit Organisations (“ARKO”). The total amountoutstanding as at December was USD , thousand (: USD , thousand). The loan bears a nominal annualinterest rate of % of the financing rate set by the CBRF. Initially, the loan was due to mature during the second half of the .During , the loan was rescheduled on the same terms and currently is to be repaid by September . With respect to theloan as at December , Alfa Bank pledged customer loans with a total nominal amount of USD , thousand, invest-ments available for sale with a fair value of USD , thousand (: USD , thousand) and property, plant and equipmentwith a carrying value of USD , thousand (: USD , thousand) as collateral (Notes , and ).
Also, % of Alfa Bank’s shares were pledged as collateral which gave ARKO voting rights, but not an economic interest in AlfaBank. No minority interest is included in Note in respect of these shares.
ALFA GROUP Notes to the consolidated financial statements for the year ended December
(Expressed in thousand US dollars for presentational purposes only – see Note )
Alfa Bank obtained a term loan in the form of US Commercial Paper Notes in the amount of USD , thousand with a matu-rity date of October . Alfa Bank was unable to comply with its obligation to reimburse the issuing banks in a timely manner.In July , Alfa Bank and the issuing banks signed a Reimbursement Agreement whereby Alfa Bank paid USD , thousandof principal and USD , thousand of accrued interest on the date of signing the Reimbursement Agreement. The remainingprincipal amount is to be paid via scheduled repayments until December . The first repayment took place on September.
In addition, from the date of the Reimbursement Agreement until December , Alfa Bank capitalised additional accruedinterest. From January , interest is to be paid on a quarterly basis at a rate of LIBOR plus .%. As at December , theoutstanding principal balance of US Commercial Paper Notes was USD , thousand (: USD , thousand) and capi-talised interest amounted to USD , thousand (: USD , thousand).
During , the Alfa Bank Group purchased USD , thousand carrying value of its US Commercial Paper Notes for a consid-eration of USD , thousand. As Alfa Bank has the intention to retire this portion of the US Commercial Paper Notes, Alfa Bankhas recognised a gain of USD , thousand as at December , which is reflected in gains on debt transactions.
During Alfa Bank purchased certain of its Euro Medium Term Notes which has been accounted for as a retirement of debtwith a gain of USD thousand during also included within gains on debt transactions.
International CommoditiesAs at December , Crown Resources had facilities of USD ,, thousand (: USD ,, thousand) with majorwestern banks, which can be used in either the form of letters of credit, guarantees or pre-financing loans for the purchase of crudeoil, oil products and sugar. The facilities require Crown Resources to provide appropriate security as and when they are used.Security is provided in the form of various liquid assets of Crown Resources. USD , thousand (: USD , thousand)of the facilities were used at December by way of bank credit as noted above and letters of credit issued (Note ). Interestrates on these borrowings are from LIBOR plus .% to plus .% (: LIBOR plus .% to plus .%).
Russia, CIS and Southeast Asia CommoditiesLoans from financial institutions are denominated in USD are secured by provisions of the rights on export of crude oil to CrownResources in accordance with an agreement and rights on purchase of crude oil from ZAO Petrosakh. The loans bear interestLIBOR plus % per annum.
Loans from non-financial institutions are denominated in USD, unsecured and bear interest at rates from % to %.
Bills of exchange were issued by the Alfa Eco Group pursuant to a program to raise funds for operational purposes. The notes areunsecured, Russian Rouble denominated, and bear interest at the rate of % to % per annum and mature in to months.
Retail TradeAn International Financing Institution (“IFI”) holds a fixed charge over certain property, plant and equipment of Perekriostok asa security over a loan facility provided to Perekriostok. The net book value of property, plant and equipment, over which the secu-rity is held, is USD , thousand (: USD , thousand). As at December , the amount of the loan outstandingis USD , thousand (: USD , thousand). The IFI loan carries an interest rate of LIBOR plus %.
In August , Perekriostok signed an agreement to restructure the loan with the IFI following default on the loan repayment inApril . Under the agreement, the loan repayment has been extended to January . Perekriostok is required to extendthe period for security provided to conform to the extended loan term. As at the date of this report Perekriostok has not completed
ALFA GROUP Notes to the consolidated financial statements for the year ended December
(Expressed in thousand US dollars for presentational purposes only – see Note )

extension of certain security and is accordingly in a technical default of the IFI loan agreement. The IFI has confirmed that theywill not initiate a default as long as Perekriostok complies with all other terms and conditions of the IFI loan agreement.
Restated
Maturity of non-current borrowings
2002 . . . . . . . . . . . . . . . . . . . . . . . . . . . . . . . . . . . . . . . . . . . . . . . . . . . . . . . . . . . . . . . . . . . . . . . . . . . . . . . . . . . . . . . . - 21,363
2003 . . . . . . . . . . . . . . . . . . . . . . . . . . . . . . . . . . . . . . . . . . . . . . . . . . . . . . . . . . . . . . . . . . . . . . . . . . . . . . . . . . . . . . . . 42,580 24,743
2004 . . . . . . . . . . . . . . . . . . . . . . . . . . . . . . . . . . . . . . . . . . . . . . . . . . . . . . . . . . . . . . . . . . . . . . . . . . . . . . . . . . . . . . . . 8,414 9,355
2005 . . . . . . . . . . . . . . . . . . . . . . . . . . . . . . . . . . . . . . . . . . . . . . . . . . . . . . . . . . . . . . . . . . . . . . . . . . . . . . . . . . . . . . . . 8,289 9,216
2006 . . . . . . . . . . . . . . . . . . . . . . . . . . . . . . . . . . . . . . . . . . . . . . . . . . . . . . . . . . . . . . . . . . . . . . . . . . . . . . . . . . . . . . . . 7,228 8,294
Thereafter . . . . . . . . . . . . . . . . . . . . . . . . . . . . . . . . . . . . . . . . . . . . . . . . . . . . . . . . . . . . . . . . . . . . . . . . . . . . . . . . . . . - 5,580
Total non-current borrowings . . . . . . . . . . . . . . . . . . . . . . . . . . . . . . . . . . . . . . . . . . . . . . . . . . . . . . . . . . . . . . . . . 66,511 78,551
16. AMOUNTS OWED TO DEPOSITORS
Restated
Demand deposits . . . . . . . . . . . . . . . . . . . . . . . . . . . . . . . . . . . . . . . . . . . . . . . . . . . . . . . . . . . . . . . . . . . . . . . . . . . . . 1,067,799 767,749
Due in 1-6 months . . . . . . . . . . . . . . . . . . . . . . . . . . . . . . . . . . . . . . . . . . . . . . . . . . . . . . . . . . . . . . . . . . . . . . . . . . . . 196,270 71,749
Due in 6-12 months . . . . . . . . . . . . . . . . . . . . . . . . . . . . . . . . . . . . . . . . . . . . . . . . . . . . . . . . . . . . . . . . . . . . . . . . . . . 53,056 36,888
Due in more than 12 months . . . . . . . . . . . . . . . . . . . . . . . . . . . . . . . . . . . . . . . . . . . . . . . . . . . . . . . . . . . . . . . . . . . 3,852 45,752
Total amount owed to depositors . . . . . . . . . . . . . . . . . . . . . . . . . . . . . . . . . . . . . . . . . . . . . . . . . . . . . . . . . . . . . . 1,320,977 922,138
Less non-current portion . . . . . . . . . . . . . . . . . . . . . . . . . . . . . . . . . . . . . . . . . . . . . . . . . . . . . . . . . . . . . . . . . . . . . . (3,852) (45,752)
Total amount owed to depositors – current portion . . . . . . . . . . . . . . . . . . . . . . . . . . . . . . . . . . . . . . . . . . . . . . 1,317,125 876,386
For information about the effective rates and currency analysis of amounts owed to depositors outstanding at December ,refer to Note . Refer to Note for information on related parties.
Included in amounts owed to depositors are deposits of USD , thousand (: USD , thousand) held as collateral forirrevocable commitments under import letters of credit and deposits of USD thousand (: nil) held as collateral for irrev-ocable commitments under export letters of credit (Note ).
ALFA GROUP Notes to the consolidated financial statements for the year ended December
(Expressed in thousand US dollars for presentational purposes only – see Note )
Economic sector concentrations within amounts owed to depositors are as follows:
Restated
Amount % Amount %
Individuals . . . . . . . . . . . . . . . . . . . . . . . . . . . . . . . . . . . . . . . . . . . . . . . . . . . . . . . . . . . . . . . . . . . . . 484,559 37 200,004 22
Energy, oil and gas . . . . . . . . . . . . . . . . . . . . . . . . . . . . . . . . . . . . . . . . . . . . . . . . . . . . . . . . . . . . . . 271,405 21 208,864 23
Manufacturing and construction . . . . . . . . . . . . . . . . . . . . . . . . . . . . . . . . . . . . . . . . . . . . . . . . . . 183,576 14 148,228 16
Finance and investment companies . . . . . . . . . . . . . . . . . . . . . . . . . . . . . . . . . . . . . . . . . . . . . . . . 143,437 11 132,033 14
Government bodies and municipals . . . . . . . . . . . . . . . . . . . . . . . . . . . . . . . . . . . . . . . . . . . . . . . 67,183 5 45,665 5
Trade and commerce . . . . . . . . . . . . . . . . . . . . . . . . . . . . . . . . . . . . . . . . . . . . . . . . . . . . . . . . . . . . 46,736 3 141,818 15
Agriculture . . . . . . . . . . . . . . . . . . . . . . . . . . . . . . . . . . . . . . . . . . . . . . . . . . . . . . . . . . . . . . . . . . . . 23,292 2 6,956 1
Other . . . . . . . . . . . . . . . . . . . . . . . . . . . . . . . . . . . . . . . . . . . . . . . . . . . . . . . . . . . . . . . . . . . . . . . . . 100,789 7 38,570 4
1,320,977 100 922,138 100
17. DUE TO BANKS
Restated
Demand deposits . . . . . . . . . . . . . . . . . . . . . . . . . . . . . . . . . . . . . . . . . . . . . . . . . . . . . . . . . . . . . . . . . . . . . . . . . . . . . 293,119 167,340
Due in 1-6 months . . . . . . . . . . . . . . . . . . . . . . . . . . . . . . . . . . . . . . . . . . . . . . . . . . . . . . . . . . . . . . . . . . . . . . . . . . . . 6,185 9,944
Due in 6-12 months . . . . . . . . . . . . . . . . . . . . . . . . . . . . . . . . . . . . . . . . . . . . . . . . . . . . . . . . . . . . . . . . . . . . . . . . . . . 31,392 71
Due in more than12 months . . . . . . . . . . . . . . . . . . . . . . . . . . . . . . . . . . . . . . . . . . . . . . . . . . . . . . . . . . . . . . . . . . . . 9,581 3,806
Total due to banks . . . . . . . . . . . . . . . . . . . . . . . . . . . . . . . . . . . . . . . . . . . . . . . . . . . . . . . . . . . . . . . . . . . . . . . . . . . 340,277 181,161
Less non-current portion . . . . . . . . . . . . . . . . . . . . . . . . . . . . . . . . . . . . . . . . . . . . . . . . . . . . . . . . . . . . . . . . . . . . . . (9,581) (3,806)
Total due to banks – current portion . . . . . . . . . . . . . . . . . . . . . . . . . . . . . . . . . . . . . . . . . . . . . . . . . . . . . . . . . . . 330,696 177,355
For information about the effective interest rates and currency analysis of amounts due to banks outstanding at December ,refer to Note .
18. PROVISIONS
Restated
Obligations under derivative financial instruments (Note 32) . . . . . . . . . . . . . . . . . . . . . . . . . . . . . . . . . . . . . . . . - 36,765
Provision for credit related commitments (Note 32) . . . . . . . . . . . . . . . . . . . . . . . . . . . . . . . . . . . . . . . . . . . . . . . . 3,937 9,929
Other provisions . . . . . . . . . . . . . . . . . . . . . . . . . . . . . . . . . . . . . . . . . . . . . . . . . . . . . . . . . . . . . . . . . . . . . . . . . . . . . 19,800 20,880
23,737 67,574
ALFA GROUP Notes to the consolidated financial statements for the year ended December
(Expressed in thousand US dollars for presentational purposes only – see Note )
19. INCOME TAX
Restated
Current tax charge . . . . . . . . . . . . . . . . . . . . . . . . . . . . . . . . . . . . . . . . . . . . . . . . . . . . . . . . . . . . . . . . . . . . . . . . . . . . 9,915 8,742
Withholding tax on dividends . . . . . . . . . . . . . . . . . . . . . . . . . . . . . . . . . . . . . . . . . . . . . . . . . . . . . . . . . . . . . . . . . . - 6,422
Deferred taxation movement due to:
• Origination and reversal of temporary differences . . . . . . . . . . . . . . . . . . . . . . . . . . . . . . . . . . . . . . . . . . . . . . . . (11,748) 9,145
• Effect of (reduction)/increase in tax rate . . . . . . . . . . . . . . . . . . . . . . . . . . . . . . . . . . . . . . . . . . . . . . . . . . . . . . . (59,309) 13,144
Income tax (credit)/charge . . . . . . . . . . . . . . . . . . . . . . . . . . . . . . . . . . . . . . . . . . . . . . . . . . . . . . . . . . . . . . . . . . . (61,142) 37,453
Net profit before taxation for financial reporting purposes is reconciled to tax expense as follows:
Restated
Profit before taxation . . . . . . . . . . . . . . . . . . . . . . . . . . . . . . . . . . . . . . . . . . . . . . . . . . . . . . . . . . . . . . . . . . . . . . . . . 900,512 1,271,397
Theoretical tax at applicable statutory rate . . . . . . . . . . . . . . . . . . . . . . . . . . . . . . . . . . . . . . . . . . . . . . . . . . . . . . . . 58,208 92,384
Tax effect of items which are not deductible or assessable for taxation purposes:
• Income taxed at different tax rates . . . . . . . . . . . . . . . . . . . . . . . . . . . . . . . . . . . . . . . . . . . . . . . . . . . . . . . . . . . . . (14,047) (27,990)
• Statutory tax concessions . . . . . . . . . . . . . . . . . . . . . . . . . . . . . . . . . . . . . . . . . . . . . . . . . . . . . . . . . . . . . . . . . . . . . (38,033) (84,499)
• Non-deductible expenses . . . . . . . . . . . . . . . . . . . . . . . . . . . . . . . . . . . . . . . . . . . . . . . . . . . . . . . . . . . . . . . . . . . . . 37,713 70,496
• Movement in loss carry forward . . . . . . . . . . . . . . . . . . . . . . . . . . . . . . . . . . . . . . . . . . . . . . . . . . . . . . . . . . . . . . . . 3,325 2,558
• Non-temporary elements of monetary loss . . . . . . . . . . . . . . . . . . . . . . . . . . . . . . . . . . . . . . . . . . . . . . . . . . . . . . (5,766) (1,681)
• Inflation effect on deferred tax balance at the beginning of year . . . . . . . . . . . . . . . . . . . . . . . . . . . . . . . . . . . . (16,005) (5,983)
Effect of change in statutory tax rate on deferred tax balances . . . . . . . . . . . . . . . . . . . . . . . . . . . . . . . . . . . . . . . (59,309) 12,567
Non-recognized net deferred tax asset movement . . . . . . . . . . . . . . . . . . . . . . . . . . . . . . . . . . . . . . . . . . . . . . . . . (4,728) (6,608)
Withholding tax on dividends . . . . . . . . . . . . . . . . . . . . . . . . . . . . . . . . . . . . . . . . . . . . . . . . . . . . . . . . . . . . . . . . . . - 6,422
Other IAS adjustments that have a non-temporary nature . . . . . . . . . . . . . . . . . . . . . . . . . . . . . . . . . . . . . . . . . . . (22,500) (20,213)
Income tax (credit)/charge for the year . . . . . . . . . . . . . . . . . . . . . . . . . . . . . . . . . . . . . . . . . . . . . . . . . . . . . . . . (61,142) 37,453
Deferred income taxDifferences between IAS and statutory taxation and reporting regulations give rise to certain temporary differences between thecarrying value of certain assets and liabilities for financial reporting purposes and for income tax purposes.
An analysis of the temporary differences and calculations of deferred income tax was performed individually for each companyincluded in the consolidated financial statements. To determine the tax effect, tax rates effective on the date of the financial state-ments were used, taking into consideration the type of activity and each company’s status (% for trading activity; % for agencyactivities; % for banking activities; and %-% for oil and gas sector and other offshore companies). For companies engaged inseveral types of activities, the tax was calculated on the basis of the main type of activities. Thus, the theoretical tax at the applicablestatutory rates calculated above is an aggregation of the aforementioned tax rate. The difference between the tax charge calculatedat the standard profit tax rate for main activities and the weighted average rate is shown as “Income taxed at different tax rates” inthe reconciliation above.
ALFA GROUP Notes to the consolidated financial statements for the year ended December
(Expressed in thousand US dollars for presentational purposes only – see Note )

A % income tax rate has been enacted in August for trading, agency and banking activities, which becomes effective startingfrom January . As this tax rate was not enacted or substantively enacted at December , the effect of the change in taxrate on net deferred tax liabilities is recognised in these consolidated financial statements for the year ended December .
In the consolidated balance sheet, deferred tax assets and deferred tax liabilities are disclosed on a net basis (deferred tax assetsare offset against deferred tax liabilities of the same taxable entities). As the Group does not have a legally enforceable right to set-off current tax assets against current tax liabilities, deferred tax assets and deferred tax liabilities relating to income taxes levied bythe same taxation authorities are presented separately in this note.
Tax losses can generally be used to offset future taxable profits over the subsequent years. The maximum offset in any one yearis limited to % of the total taxable profit of the year. Based on Management’s estimates, tax losses have been recognised to theextent they will reverse against the temporary deferred tax liabilities.
At December , a net deferred tax asset in the amount of USD thousand (: USD , thousand) was not recordedas Management believed it was not probable that sufficient taxable profit would be available to allow the benefit of the deferred taxasset to be utilised.
Investments available for sale are held and disposed of, primarily by consolidated subsidiaries of the Group operating in tax-freejurisdictions. Therefore, the net fair value gains arising on investments available for sale recognised directly in the consolidatedstatement of changes in shareholders' equity had no impact on the deferred tax position of the Group.
ALFA GROUP Notes to the consolidated financial statements for the year ended December
(Expressed in thousand US dollars for presentational purposes only – see Note )
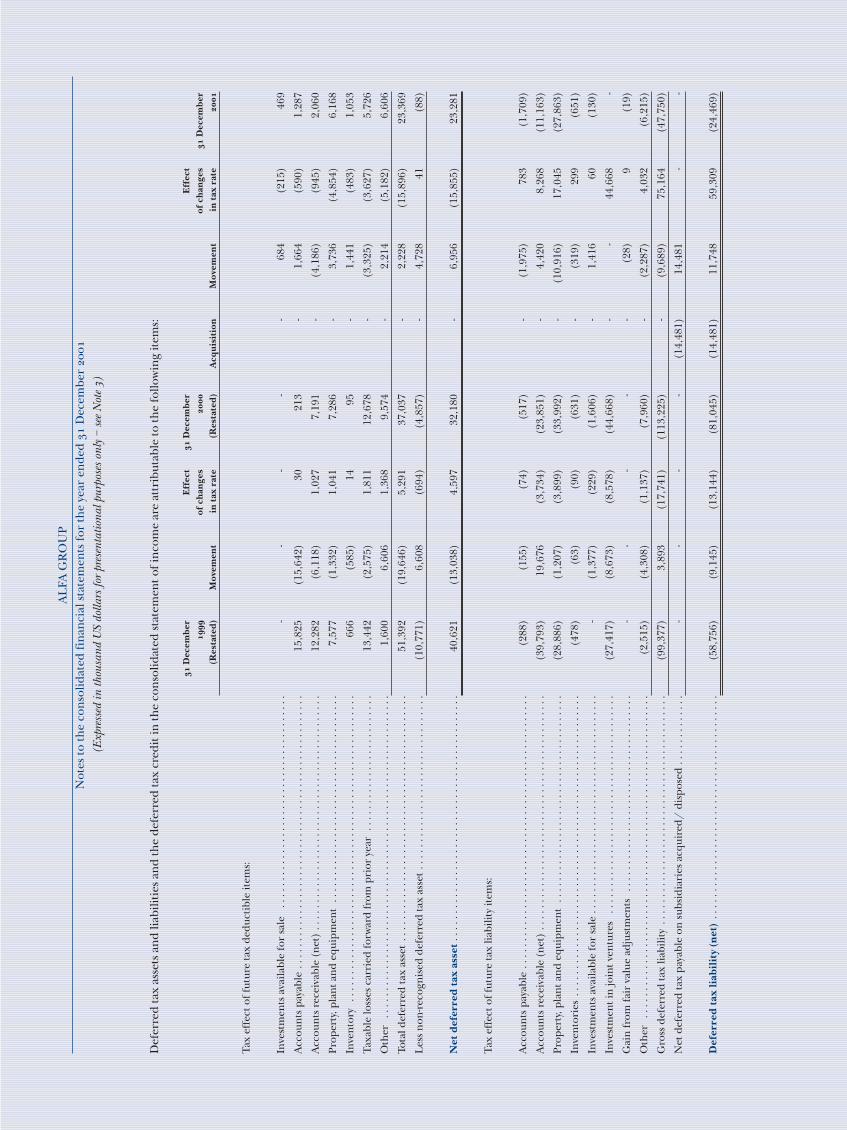
AL
FA G
RO
UP
N
otes
to th
e co
nso
lidat
ed fi
nan
cial
sta
tem
ents
for
the
year
en
ded
Dec
embe
r
(Exp
ress
ed in
thou
sand
US
dolla
rs fo
r pr
esen
tatio
nal p
urpo
ses
only
– s
ee N
ote
)
Def
erre
d ta
x as
sets
an
d lia
bilit
ies
and
the
defe
rred
tax
cred
it in
the
con
solid
ated
sta
tem
ent o
f in
com
e ar
e at
trib
utab
le to
the
follo
win
g it
ems:
D
ecem
ber
Eff
ect
D
ecem
ber
Eff
ect
of
ch
ange
s
of
ch
ange
s
Dec
emb
er(R
esta
ted
)M
ovem
ent
in t
ax r
ate
(Res
tate
d)
Acq
uis
itio
nM
ovem
ent
in t
ax r
ate
Tax
effe
ct o
f fut
ure
tax
ded
ucti
ble
item
s:
Inve
stm
ents
ava
ilabl
e fo
r sa
le
. . .
. . .
. . .
. . .
. . .
. . .
. . .
. . .
. . .
. . .
. . .
. . .
. . .
--
--
-68
4(2
15)
469
Acc
oun
ts p
ayab
le .
. . .
. . .
. . .
. . .
. . .
. . .
. . .
. . .
. . .
. . .
. . .
. . .
. . .
. . .
. . .
. . .
.15
,825
(15,
642)
3021
3 -
1,66
4(5
90)
1,28
7
Acc
oun
ts r
ecei
vabl
e (n
et)
. . .
. . .
. . .
. . .
. . .
. . .
. . .
. . .
. . .
. . .
. . .
. . .
. . .
. . .
.12
,282
(6,1
18)
1,02
77,
191
-(4
,186
)(9
45)
2,06
0
Pro
pert
y, p
lan
t an
d e
quip
men
t .
. . .
. . .
. . .
. . .
. . .
. . .
. . .
. . .
. . .
. . .
. . .
. . .
.7,
577
(1,3
32)
1,04
17,
286
-3,
736
(4,8
54)
6,16
8
Inve
nto
ry .
. . .
. . .
. . .
. . .
. . .
. . .
. . .
. . .
. . .
. . .
. . .
. . .
. . .
. . .
. . .
. . .
. . .
. . .
.66
6(5
85)
1495
-
1,44
1(4
83)
1,05
3
Taxa
ble
loss
es c
arri
ed fo
rwar
d fr
om p
rior
yea
r .
. . .
. . .
. . .
. . .
. . .
. . .
. . .
. . .
13,4
42(2
,575
)1,
811
12,6
78
-(3
,325
)(3
,627
)5,
726
Oth
er .
. . .
. . .
. . .
. . .
. . .
. . .
. . .
. . .
. . .
. . .
. . .
. . .
. . .
. . .
. . .
. . .
. . .
. . .
. . .
.1,
600
6,60
61,
368
9,57
4 -
2,21
4(5
,182
)6,
606
Tota
l def
erre
d ta
x as
set
. . .
. . .
. . .
. . .
. . .
. . .
. . .
. . .
. . .
. . .
. . .
. . .
. . .
. . .
. . .
51,3
92(1
9,64
6)5,
291
37,0
37-
2,22
8(1
5,89
6)23
,369
Les
s n
on-r
ecog
nis
ed d
efer
red
tax
asse
t . .
. . .
. . .
. . .
. . .
. . .
. . .
. . .
. . .
. . .
. . .
(10,
771)
6,60
8(6
94)
(4,8
57)
-4,
728
41(8
8)
Net
def
erre
d t
ax a
sset
. . .
. . .
. . .
. . .
. . .
. . .
. . .
. . .
. . .
. . .
. . .
. . .
. . .
. . .
. . .
40,6
21(1
3,03
8)4,
597
32,1
80
-6,
956
(15,
855)
23,2
81
Tax
effe
ct o
f fut
ure
tax
liabi
lity
item
s:
Acc
oun
ts p
ayab
le .
. . .
. . .
. . .
. . .
. . .
. . .
. . .
. . .
. . .
. . .
. . .
. . .
. . .
. . .
. . .
. . .
.(2
88)
(155
)(7
4)(5
17)
-(1
,975
)78
3(1
,709
)
Acc
oun
ts r
ecei
vabl
e (n
et)
. . .
. . .
. . .
. . .
. . .
. . .
. . .
. . .
. . .
. . .
. . .
. . .
. . .
. . .
.(3
9,79
3)19
,676
(3,7
34)
(23,
851)
-
4,42
08,
268
(11,
163)
Pro
pert
y, p
lan
t an
d e
quip
men
t .
. . .
. . .
. . .
. . .
. . .
. . .
. . .
. . .
. . .
. . .
. . .
. . .
.(2
8,88
6)(1
,207
)(3
,899
)(3
3,99
2)
-(1
0,91
6)17
,045
(27,
863)
Inve
nto
ries
. . .
. . .
. . .
. . .
. . .
. . .
. . .
. . .
. . .
. . .
. . .
. . .
. . .
. . .
. . .
. . .
. . .
. . .
.(4
78)
(63)
(90)
(631
) -
(319
)29
9(6
51)
Inve
stm
ents
ava
ilabl
e fo
r sa
le .
. . .
. . .
. . .
. . .
. . .
. . .
. . .
. . .
. . .
. . .
. . .
. . .
. . .
-(1
,377
)(2
29)
(1,6
06)
-1,
416
60(1
30)
Inve
stm
ent i
n jo
int v
entu
res
. . .
. . .
. . .
. . .
. . .
. . .
. . .
. . .
. . .
. . .
. . .
. . .
. . .
.(2
7,41
7)(8
,673
)(8
,578
)(4
4,66
8)
--
44,6
68-
Gai
n fr
om fa
ir v
alue
ad
just
men
ts .
. . .
. . .
. . .
. . .
. . .
. . .
. . .
. . .
. . .
. . .
. . .
. .-
--
--
(28)
9(1
9)
Oth
er .
. . .
. . .
. . .
. . .
. . .
. . .
. . .
. . .
. . .
. . .
. . .
. . .
. . .
. . .
. . .
. . .
. . .
. . .
. . .
.(2
,515
)(4
,308
)(1
,137
)(7
,960
) -
(2,2
87)
4,03
2(6
,215
)
Gro
ss d
efer
red
tax
liabi
lity
. . .
. . .
. . .
. . .
. . .
. . .
. . .
. . .
. . .
. . .
. . .
. . .
. . .
. . .
(99,
377)
3,89
3(1
7,74
1)(1
13,2
25)
-(9
,689
)75
,164
(47,
750)
Net
def
erre
d ta
x pa
yabl
e on
sub
sid
iari
es a
cqui
red
/ d
ispo
sed
. . .
. . .
. . .
. . .
.-
--
-(1
4,48
1)14
,481
--
Def
erre
d t
ax li
abil
ity
(net
) . .
. . .
. . .
. . .
. . .
. . .
. . .
. . .
. . .
. . .
. . .
. . .
. . .
. . .
(58,
756)
(9,1
45)
(13,
144)
(81,
045)
(14,
481)
11,7
4859
,309
(24,
469)
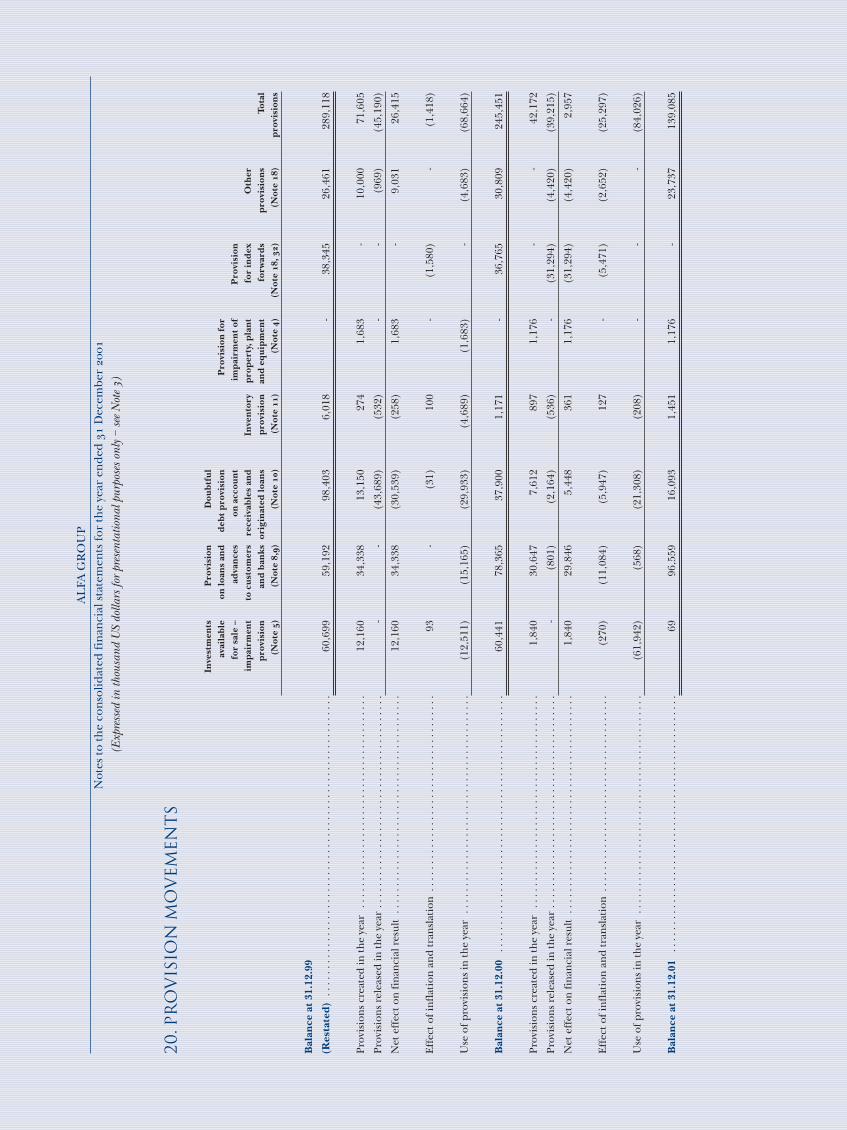
AL
FA G
RO
UP
N
otes
to th
e co
nso
lidat
ed fi
nan
cial
sta
tem
ents
for
the
year
en
ded
Dec
embe
r
(Exp
ress
ed in
thou
sand
US
dolla
rs fo
r pr
esen
tatio
nal p
urpo
ses
only
– s
ee N
ote
)
20. P
RO
VIS
ION
MO
VE
ME
NT
S
Inve
stm
ents
Pro
visi
onD
oub
tfu
lav
aila
ble
on lo
ans
and
deb
t p
rovi
sion
Pro
visi
on f
orfo
r sa
le –
ad
van
ces
on a
ccou
nt
imp
airm
ent
of
Pro
visi
onim
pai
rmen
tto
cu
stom
ers
rece
ivab
les
and
Inve
nto
ryp
rop
erty
, pla
nt
for
ind
exO
ther
pro
visi
onan
d b
anks
orig
inat
ed lo
ans
pro
visi
onan
d e
qu
ipm
ent
forw
ard
sp
rovi
sion
sTo
tal
(Not
e )
(Not
e ,
)(N
ote
)
(Not
e
)(N
ote
)(N
ote
,
)(N
ote
)
pro
visi
ons
Bal
ance
at
31.1
2.99
(Res
tate
d)
. . .
. . .
. . .
. . .
. . .
. . .
. . .
. . .
. . .
. . .
. . .
. . .
. . .
. . .
. . .
. . .
. . .
. . .
.60
,699
59
,192
98
,403
6,
018
-38
,345
26
,461
28
9,11
8
Pro
visi
ons
crea
ted
in th
e ye
ar .
. . .
. . .
. . .
. . .
. . .
. . .
. . .
. . .
. . .
. . .
. . .
. . .
. .12
,160
34
,338
13
,150
27
4 1,
683
-10
,000
71
,605
Pro
visi
ons
rele
ased
in th
e ye
ar .
. . .
. . .
. . .
. . .
. . .
. . .
. . .
. . .
. . .
. . .
. . .
. . .
. .-
-(4
3,68
9)
(532
) -
-(9
69)
(45,
190)
Net
eff
ect o
n fi
nan
cial
res
ult
. . .
. . .
. . .
. . .
. . .
. . .
. . .
. . .
. . .
. . .
. . .
. . .
. . .
.12
,160
34,3
38
(30,
539)
(2
58)
1,68
3 -
9,03
1 26
,415
Eff
ect o
f in
flat
ion
an
d tr
ansl
atio
n .
. . .
. . .
. . .
. . .
. . .
. . .
. . .
. . .
. . .
. . .
. . .
. .93
-(3
1)
100
-(1
,580
) -
(1,4
18)
Use
of p
rovi
sion
s in
the
year
. . .
. . .
. . .
. . .
. . .
. . .
. . .
. . .
. . .
. . .
. . .
. . .
. . .
.(1
2,51
1)
(15,
165)
(2
9,93
3)
(4,6
89)
(1,6
83)
-(4
,683
) (6
8,66
4)
Bal
ance
at
31.1
2.00
. . .
. . .
. . .
. . .
. . .
. . .
. . .
. . .
. . .
. . .
. . .
. . .
. . .
. . .
. . .
. .
60,4
41
78,3
65
37,9
00
1,17
1 -
36,7
65
30,8
09
245,
451
Pro
visi
ons
crea
ted
in th
e ye
ar .
. . .
. . .
. . .
. . .
. . .
. . .
. . .
. . .
. . .
. . .
. . .
. . .
. .1,
840
30,6
477,
612
897
1,17
6-
-42
,172
Pro
visi
ons
rele
ased
in th
e ye
ar .
. . .
. . .
. . .
. . .
. . .
. . .
. . .
. . .
. . .
. . .
. . .
. . .
. .-
(801
)(2
,164
)(5
36)
-(3
1,29
4)(4
,420
)(3
9,21
5)
Net
eff
ect o
n fi
nan
cial
res
ult
. . .
. . .
. . .
. . .
. . .
. . .
. . .
. . .
. . .
. . .
. . .
. . .
. . .
.1,
840
29,8
465,
448
361
1,17
6(3
1,29
4)(4
,420
)2,
957
Eff
ect o
f in
flat
ion
an
d tr
ansl
atio
n .
. . .
. . .
. . .
. . .
. . .
. . .
. . .
. . .
. . .
. . .
. . .
. .(2
70)
(11,
084)
(5,9
47)
127
-(5
,471
)(2
,652
)(2
5,29
7)
Use
of p
rovi
sion
s in
the
year
. . .
. . .
. . .
. . .
. . .
. . .
. . .
. . .
. . .
. . .
. . .
. . .
. . .
.(6
1,94
2)(5
68)
(21,
308)
(208
)-
--
(84,
026)
Bal
ance
at
31.1
2.01
. . .
. . .
. . .
. . .
. . .
. . .
. . .
. . .
. . .
. . .
. . .
. . .
. . .
. . .
. . .
. .
6996
,559
16,0
931,
451
1,17
6-
23,7
3713
9,08
5

ALFA GROUP Notes to the consolidated financial statements for the year ended December
(Expressed in thousand US dollars for presentational purposes only – see Note )
21. GOODWILL
Restated
Negative goodwill
At 1 January . . . . . . . . . . . . . . . . . . . . . . . . . . . . . . . . . . . . . . . . . . . . . . . . . . . . . . . . . . . . . . . . . . . . . . . . . . . . . . . . . 903 3,920
Arising from acquisition/ disposal of subsidiaries . . . . . . . . . . . . . . . . . . . . . . . . . . . . . . . . . . . . . . . . . . . . . . . . . 546 (1,704)
Change in percentage of ownership . . . . . . . . . . . . . . . . . . . . . . . . . . . . . . . . . . . . . . . . . . . . . . . . . . . . . . . . . . . . . 5,853 -
Amortisation . . . . . . . . . . . . . . . . . . . . . . . . . . . . . . . . . . . . . . . . . . . . . . . . . . . . . . . . . . . . . . . . . . . . . . . . . . . . . . . . . (1,567) (1,313)
At 31 December . . . . . . . . . . . . . . . . . . . . . . . . . . . . . . . . . . . . . . . . . . . . . . . . . . . . . . . . . . . . . . . . . . . . . . . . . . . . . . 5,735 903
Positive goodwill
At 1 January . . . . . . . . . . . . . . . . . . . . . . . . . . . . . . . . . . . . . . . . . . . . . . . . . . . . . . . . . . . . . . . . . . . . . . . . . . . . . . . . . 386 1,559
Arising from acquisition/ disposal of subsidiaries (Note 28) . . . . . . . . . . . . . . . . . . . . . . . . . . . . . . . . . . . . . . . . . 6,028 (783)
Change in percentage of ownership . . . . . . . . . . . . . . . . . . . . . . . . . . . . . . . . . . . . . . . . . . . . . . . . . . . . . . . . . . . . . (363) -
Amortisation . . . . . . . . . . . . . . . . . . . . . . . . . . . . . . . . . . . . . . . . . . . . . . . . . . . . . . . . . . . . . . . . . . . . . . . . . . . . . . . . . (929) (390)
At 31 December . . . . . . . . . . . . . . . . . . . . . . . . . . . . . . . . . . . . . . . . . . . . . . . . . . . . . . . . . . . . . . . . . . . . . . . . . . . . . . 5,122 386
22 ACCOUNTS PAYABLE
Restated
Trade payables and advances from customers . . . . . . . . . . . . . . . . . . . . . . . . . . . . . . . . . . . . . . . . . . . . . . . . . . . . . 145,527 364,558
Accrued compensation expense . . . . . . . . . . . . . . . . . . . . . . . . . . . . . . . . . . . . . . . . . . . . . . . . . . . . . . . . . . . . . . . . . 160,568 91,875
Accounts payable relating to securities transactions . . . . . . . . . . . . . . . . . . . . . . . . . . . . . . . . . . . . . . . . . . . . . . . . 34,955 38,902
Amounts owed to customers . . . . . . . . . . . . . . . . . . . . . . . . . . . . . . . . . . . . . . . . . . . . . . . . . . . . . . . . . . . . . . . . . . . . 34,883 74,878
Other taxes . . . . . . . . . . . . . . . . . . . . . . . . . . . . . . . . . . . . . . . . . . . . . . . . . . . . . . . . . . . . . . . . . . . . . . . . . . . . . . . . . . 13,661 15,281
Settlements on foreign operations . . . . . . . . . . . . . . . . . . . . . . . . . . . . . . . . . . . . . . . . . . . . . . . . . . . . . . . . . . . . . . . 8,782 7,021
Accrued interest expense . . . . . . . . . . . . . . . . . . . . . . . . . . . . . . . . . . . . . . . . . . . . . . . . . . . . . . . . . . . . . . . . . . . . . . 2,216 10,927
Deferred income . . . . . . . . . . . . . . . . . . . . . . . . . . . . . . . . . . . . . . . . . . . . . . . . . . . . . . . . . . . . . . . . . . . . . . . . . . . . . 807 1,758
Other payables and accrued expenses . . . . . . . . . . . . . . . . . . . . . . . . . . . . . . . . . . . . . . . . . . . . . . . . . . . . . . . . . . . . 125,189 139,717
Total accounts payable . . . . . . . . . . . . . . . . . . . . . . . . . . . . . . . . . . . . . . . . . . . . . . . . . . . . . . . . . . . . . . . . . . . . . . . . 526,588 744,917
Less non-current portion . . . . . . . . . . . . . . . . . . . . . . . . . . . . . . . . . . . . . . . . . . . . . . . . . . . . . . . . . . . . . . . . . . . . . . (17,531) (42,401)
Total accounts payable – current portion . . . . . . . . . . . . . . . . . . . . . . . . . . . . . . . . . . . . . . . . . . . . . . . . . . . . . . . 509,057 702,516
Included in the above amount are payables to related parties amounting to USD , thousand (: USD , thousand)(Note ).
Included in non-current accounts payable is an amount of USD , thousand representing part of the consideration paid forthe acquisition of shares in OAO Vimpel-Communications, payable to a third party. The amount is denominated in USD, securedby . million of common shares of OAO Vimpel-Communications, non interest bearing and is payable not earlier than . The
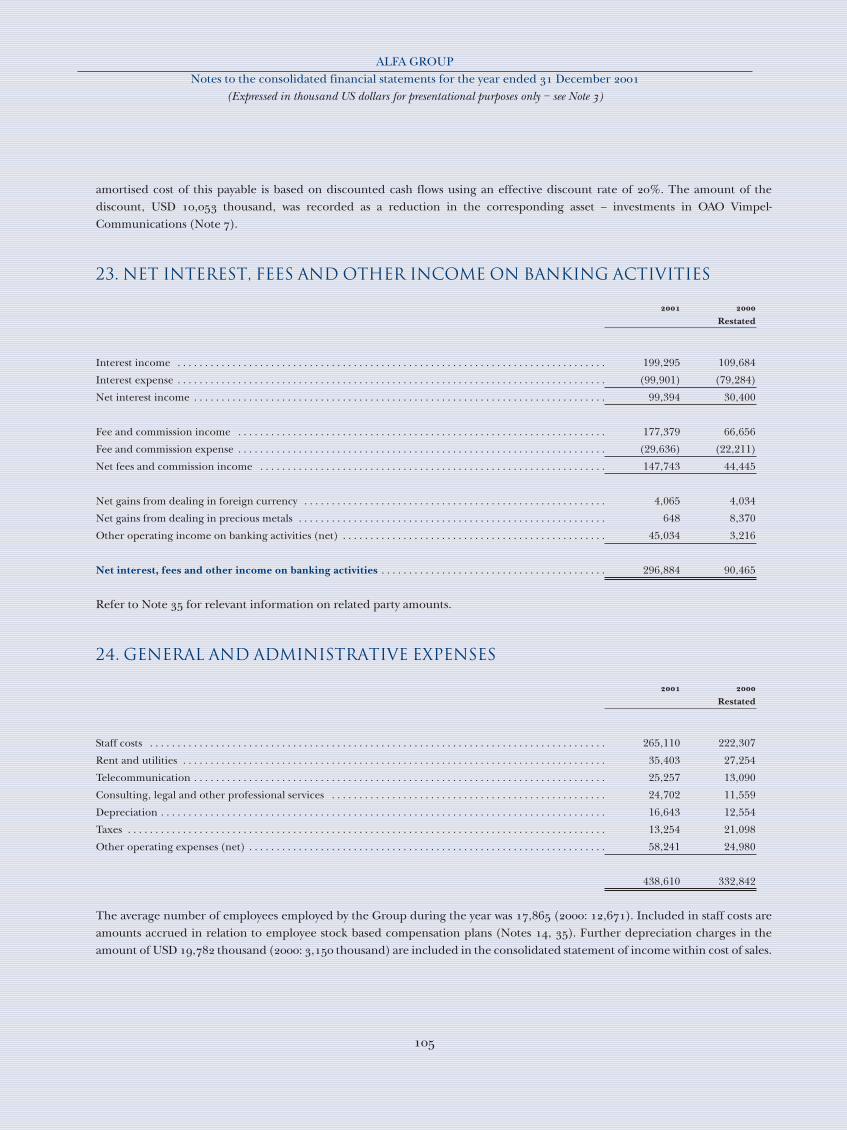
ALFA GROUP Notes to the consolidated financial statements for the year ended December
(Expressed in thousand US dollars for presentational purposes only – see Note )
amortised cost of this payable is based on discounted cash flows using an effective discount rate of %. The amount of thediscount, USD , thousand, was recorded as a reduction in the corresponding asset – investments in OAO Vimpel-Communications (Note ).
23. NET INTEREST, FEES AND OTHER INCOME ON BANKING ACTIVITIES
Restated
Interest income . . . . . . . . . . . . . . . . . . . . . . . . . . . . . . . . . . . . . . . . . . . . . . . . . . . . . . . . . . . . . . . . . . . . . . . . . . . . . . 199,295 109,684
Interest expense . . . . . . . . . . . . . . . . . . . . . . . . . . . . . . . . . . . . . . . . . . . . . . . . . . . . . . . . . . . . . . . . . . . . . . . . . . . . . . (99,901) (79,284)
Net interest income . . . . . . . . . . . . . . . . . . . . . . . . . . . . . . . . . . . . . . . . . . . . . . . . . . . . . . . . . . . . . . . . . . . . . . . . . . . 99,394 30,400
Fee and commission income . . . . . . . . . . . . . . . . . . . . . . . . . . . . . . . . . . . . . . . . . . . . . . . . . . . . . . . . . . . . . . . . . . . 177,379 66,656
Fee and commission expense . . . . . . . . . . . . . . . . . . . . . . . . . . . . . . . . . . . . . . . . . . . . . . . . . . . . . . . . . . . . . . . . . . . (29,636) (22,211)
Net fees and commission income . . . . . . . . . . . . . . . . . . . . . . . . . . . . . . . . . . . . . . . . . . . . . . . . . . . . . . . . . . . . . . . 147,743 44,445
Net gains from dealing in foreign currency . . . . . . . . . . . . . . . . . . . . . . . . . . . . . . . . . . . . . . . . . . . . . . . . . . . . . . . 4,065 4,034
Net gains from dealing in precious metals . . . . . . . . . . . . . . . . . . . . . . . . . . . . . . . . . . . . . . . . . . . . . . . . . . . . . . . . 648 8,370
Other operating income on banking activities (net) . . . . . . . . . . . . . . . . . . . . . . . . . . . . . . . . . . . . . . . . . . . . . . . . 45,034 3,216
Net interest, fees and other income on banking activities . . . . . . . . . . . . . . . . . . . . . . . . . . . . . . . . . . . . . . . . . 296,884 90,465
Refer to Note for relevant information on related party amounts.
24. GENERAL AND ADMINISTRATIVE EXPENSES
Restated
Staff costs . . . . . . . . . . . . . . . . . . . . . . . . . . . . . . . . . . . . . . . . . . . . . . . . . . . . . . . . . . . . . . . . . . . . . . . . . . . . . . . . . . . 265,110 222,307
Rent and utilities . . . . . . . . . . . . . . . . . . . . . . . . . . . . . . . . . . . . . . . . . . . . . . . . . . . . . . . . . . . . . . . . . . . . . . . . . . . . . 35,403 27,254
Telecommunication . . . . . . . . . . . . . . . . . . . . . . . . . . . . . . . . . . . . . . . . . . . . . . . . . . . . . . . . . . . . . . . . . . . . . . . . . . . 25,257 13,090
Consulting, legal and other professional services . . . . . . . . . . . . . . . . . . . . . . . . . . . . . . . . . . . . . . . . . . . . . . . . . . 24,702 11,559
Depreciation . . . . . . . . . . . . . . . . . . . . . . . . . . . . . . . . . . . . . . . . . . . . . . . . . . . . . . . . . . . . . . . . . . . . . . . . . . . . . . . . . 16,643 12,554
Taxes . . . . . . . . . . . . . . . . . . . . . . . . . . . . . . . . . . . . . . . . . . . . . . . . . . . . . . . . . . . . . . . . . . . . . . . . . . . . . . . . . . . . . . . 13,254 21,098
Other operating expenses (net) . . . . . . . . . . . . . . . . . . . . . . . . . . . . . . . . . . . . . . . . . . . . . . . . . . . . . . . . . . . . . . . . . 58,241 24,980
438,610 332,842
The average number of employees employed by the Group during the year was , (: ,). Included in staff costs areamounts accrued in relation to employee stock based compensation plans (Notes , ). Further depreciation charges in theamount of USD , thousand (: , thousand) are included in the consolidated statement of income within cost of sales.
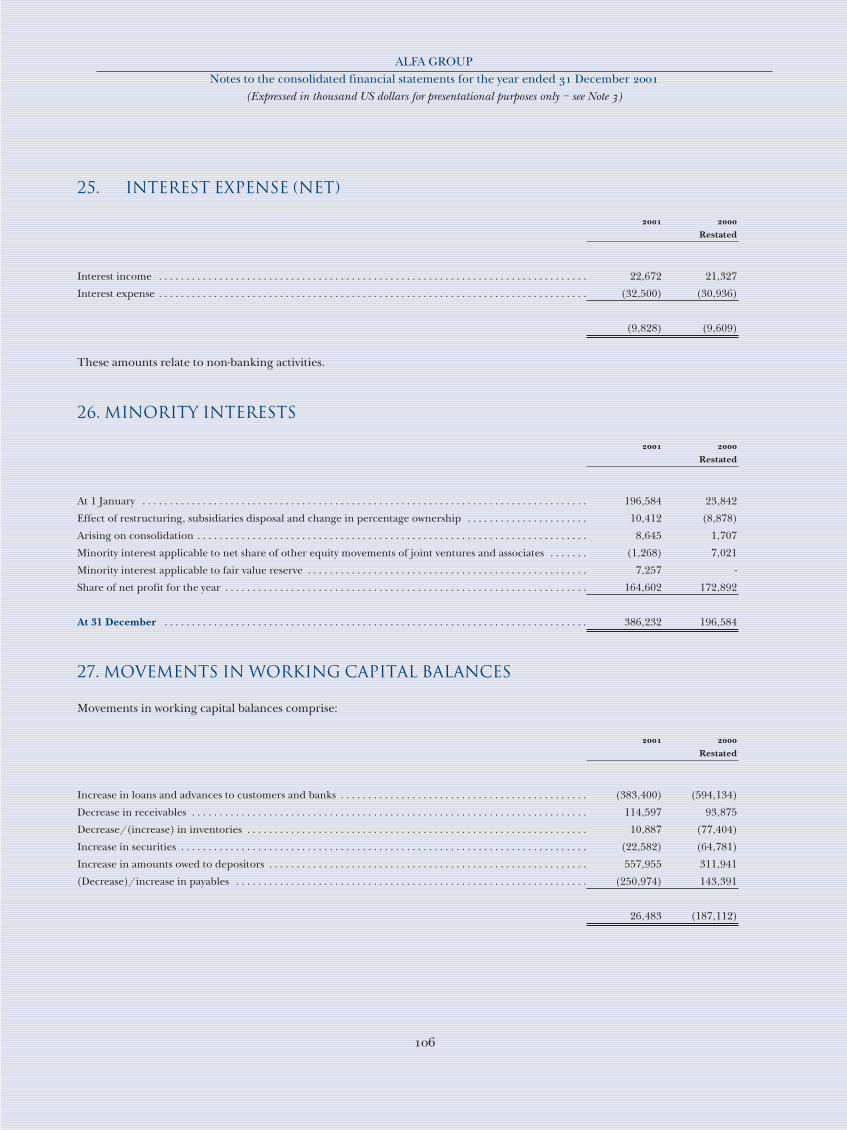
ALFA GROUP Notes to the consolidated financial statements for the year ended December
(Expressed in thousand US dollars for presentational purposes only – see Note )
25. INTEREST EXPENSE (NET)
Restated
Interest income . . . . . . . . . . . . . . . . . . . . . . . . . . . . . . . . . . . . . . . . . . . . . . . . . . . . . . . . . . . . . . . . . . . . . . . . . . . . . . 22,672 21,327
Interest expense . . . . . . . . . . . . . . . . . . . . . . . . . . . . . . . . . . . . . . . . . . . . . . . . . . . . . . . . . . . . . . . . . . . . . . . . . . . . . . (32,500) (30,936)
(9,828) (9,609)
These amounts relate to non-banking activities.
26. MINORITY INTERESTS
Restated
At 1 January . . . . . . . . . . . . . . . . . . . . . . . . . . . . . . . . . . . . . . . . . . . . . . . . . . . . . . . . . . . . . . . . . . . . . . . . . . . . . . . . . 196,584 23,842
Effect of restructuring, subsidiaries disposal and change in percentage ownership . . . . . . . . . . . . . . . . . . . . . . 10,412 (8,878)
Arising on consolidation . . . . . . . . . . . . . . . . . . . . . . . . . . . . . . . . . . . . . . . . . . . . . . . . . . . . . . . . . . . . . . . . . . . . . . . 8,645 1,707
Minority interest applicable to net share of other equity movements of joint ventures and associates . . . . . . . (1,268) 7,021
Minority interest applicable to fair value reserve . . . . . . . . . . . . . . . . . . . . . . . . . . . . . . . . . . . . . . . . . . . . . . . . . . . 7,257 -
Share of net profit for the year . . . . . . . . . . . . . . . . . . . . . . . . . . . . . . . . . . . . . . . . . . . . . . . . . . . . . . . . . . . . . . . . . . 164,602 172,892
At 31 December . . . . . . . . . . . . . . . . . . . . . . . . . . . . . . . . . . . . . . . . . . . . . . . . . . . . . . . . . . . . . . . . . . . . . . . . . . . . . 386,232 196,584
27. MOVEMENTS IN WORKING CAPITAL BALANCES
Movements in working capital balances comprise:
Restated
Increase in loans and advances to customers and banks . . . . . . . . . . . . . . . . . . . . . . . . . . . . . . . . . . . . . . . . . . . . . (383,400) (594,134)
Decrease in receivables . . . . . . . . . . . . . . . . . . . . . . . . . . . . . . . . . . . . . . . . . . . . . . . . . . . . . . . . . . . . . . . . . . . . . . . . 114,597 93,875
Decrease/(increase) in inventories . . . . . . . . . . . . . . . . . . . . . . . . . . . . . . . . . . . . . . . . . . . . . . . . . . . . . . . . . . . . . . 10,887 (77,404)
Increase in securities . . . . . . . . . . . . . . . . . . . . . . . . . . . . . . . . . . . . . . . . . . . . . . . . . . . . . . . . . . . . . . . . . . . . . . . . . . (22,582) (64,781)
Increase in amounts owed to depositors . . . . . . . . . . . . . . . . . . . . . . . . . . . . . . . . . . . . . . . . . . . . . . . . . . . . . . . . . . 557,955 311,941
(Decrease)/increase in payables . . . . . . . . . . . . . . . . . . . . . . . . . . . . . . . . . . . . . . . . . . . . . . . . . . . . . . . . . . . . . . . . (250,974) 143,391
26,483 (187,112)

ALFA GROUP Notes to the consolidated financial statements for the year ended December
(Expressed in thousand US dollars for presentational purposes only – see Note )
28. ACQUISITIONS/FORMATION AND DISPOSAL OF SUBSIDIARIES
PetrosakhIn August , the Group acquired a % interest in Nimir Petroleum Petrosakh Limited, which owns % of ZAO Petrosakhfor a consideration of USD , thousand. Subsequently, through negotiations, total consideration was reduced to USD ,thousand. In , this investment was accounted for as a short-term investment available for sale (Note ). In , Management’sintentions with respect to this investment changed due to improved business opportunities. Accordingly, the results of thecompany are consolidated in the Group’s consolidated financial statements. The Group has also recognised in its consoli-dated financial statements the profits of the company acquired in the amount of USD , thousand for the period from September to December and the respective goodwill which was calculated as a difference between the acquisition costand the fair value of net assets acquired. Goodwill is amortised over a period of years, which has been determined byManagement as the useful life of this asset.
As a result of this acquisition USD , thousand of revenues and USD , thousand of net profits are recognised in the consol-idated financial statements for the period from September to December . As at December , assets and liabil-ities of the company acquired amounted to USD , thousand and USD , thousand, respectively.
Details of net assets acquired and goodwill are as follows:
Total purchase consideration . . . . . . . . . . . . . . . . . . . . . . . . . . . . . . . . . . . . . . . . . . . . . . . . . . . . . . . . . . . . . . . . . . . . . . . . . . . . . . . . . 20,062
Fair value of assets and liabilities at acquisition date . . . . . . . . . . . . . . . . . . . . . . . . . . . . . . . . . . . . . . . . . . . . . . . . . . . . . . . . . . . . . (17,063)
Goodwill (Note 21) . . . . . . . . . . . . . . . . . . . . . . . . . . . . . . . . . . . . . . . . . . . . . . . . . . . . . . . . . . . . . . . . . . . . . . . . . . . . . . . . . . . . . . . . . 2,999
The assets and liabilities arising from the acquisition are as follows:
Cash and cash equivalents . . . . . . . . . . . . . . . . . . . . . . . . . . . . . . . . . . . . . . . . . . . . . . . . . . . . . . . . . . . . . . . . . . . . . . . . . . . . . . . . . . . 246
Property, plant and equipment . . . . . . . . . . . . . . . . . . . . . . . . . . . . . . . . . . . . . . . . . . . . . . . . . . . . . . . . . . . . . . . . . . . . . . . . . . . . . . . 32,138
Inventories . . . . . . . . . . . . . . . . . . . . . . . . . . . . . . . . . . . . . . . . . . . . . . . . . . . . . . . . . . . . . . . . . . . . . . . . . . . . . . . . . . . . . . . . . . . . . . . . 4,194
Receivables . . . . . . . . . . . . . . . . . . . . . . . . . . . . . . . . . . . . . . . . . . . . . . . . . . . . . . . . . . . . . . . . . . . . . . . . . . . . . . . . . . . . . . . . . . . . . . . . 10,323
Payables . . . . . . . . . . . . . . . . . . . . . . . . . . . . . . . . . . . . . . . . . . . . . . . . . . . . . . . . . . . . . . . . . . . . . . . . . . . . . . . . . . . . . . . . . . . . . . . . . . (3,352)
Borrowings . . . . . . . . . . . . . . . . . . . . . . . . . . . . . . . . . . . . . . . . . . . . . . . . . . . . . . . . . . . . . . . . . . . . . . . . . . . . . . . . . . . . . . . . . . . . . . . . (13,369)
Net deferred tax liability . . . . . . . . . . . . . . . . . . . . . . . . . . . . . . . . . . . . . . . . . . . . . . . . . . . . . . . . . . . . . . . . . . . . . . . . . . . . . . . . . . . . (7,951)
Fair value of net assets acquired . . . . . . . . . . . . . . . . . . . . . . . . . . . . . . . . . . . . . . . . . . . . . . . . . . . . . . . . . . . . . . . . . . . . . . . . . . . . . . 22,229
Effect of consolidation of non-consolidated subsidiary . . . . . . . . . . . . . . . . . . . . . . . . . . . . . . . . . . . . . . . . . . . . . . . . . . . . . . . . . . . (5,166)
Goodwill . . . . . . . . . . . . . . . . . . . . . . . . . . . . . . . . . . . . . . . . . . . . . . . . . . . . . . . . . . . . . . . . . . . . . . . . . . . . . . . . . . . . . . . . . . . . . . . . . 2,999
Total purchase consideration . . . . . . . . . . . . . . . . . . . . . . . . . . . . . . . . . . . . . . . . . . . . . . . . . . . . . . . . . . . . . . . . . . . . . . . . . . . . . . . . . 20,062
Less:
Cash and cash equivalents in subsidiary acquired . . . . . . . . . . . . . . . . . . . . . . . . . . . . . . . . . . . . . . . . . . . . . . . . . . . . . . . . . . . . . . . . (246)
Cash outflow on acquisition . . . . . . . . . . . . . . . . . . . . . . . . . . . . . . . . . . . . . . . . . . . . . . . . . . . . . . . . . . . . . . . . . . . . . . . . . . . . . . . . . 19,816
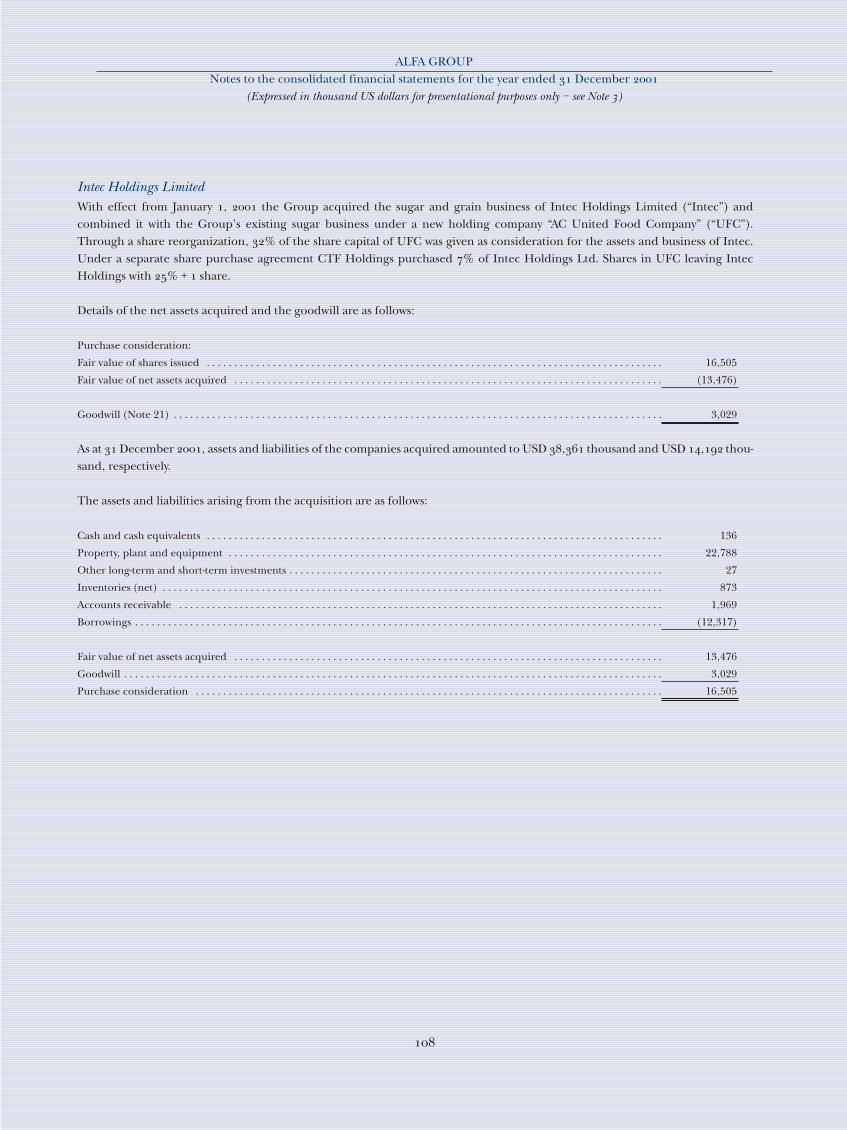
ALFA GROUP Notes to the consolidated financial statements for the year ended December
(Expressed in thousand US dollars for presentational purposes only – see Note )
Intec Holdings LimitedWith effect from January , the Group acquired the sugar and grain business of Intec Holdings Limited (“Intec”) andcombined it with the Group’s existing sugar business under a new holding company “AC United Food Company” (“UFC”).Through a share reorganization, % of the share capital of UFC was given as consideration for the assets and business of Intec.Under a separate share purchase agreement CTF Holdings purchased % of Intec Holdings Ltd. Shares in UFC leaving IntecHoldings with % + share.
Details of the net assets acquired and the goodwill are as follows:
Purchase consideration:
Fair value of shares issued . . . . . . . . . . . . . . . . . . . . . . . . . . . . . . . . . . . . . . . . . . . . . . . . . . . . . . . . . . . . . . . . . . . . . . . . . . . . . . . . . . . 16,505
Fair value of net assets acquired . . . . . . . . . . . . . . . . . . . . . . . . . . . . . . . . . . . . . . . . . . . . . . . . . . . . . . . . . . . . . . . . . . . . . . . . . . . . . . (13,476)
Goodwill (Note 21) . . . . . . . . . . . . . . . . . . . . . . . . . . . . . . . . . . . . . . . . . . . . . . . . . . . . . . . . . . . . . . . . . . . . . . . . . . . . . . . . . . . . . . . . . 3,029
As at December , assets and liabilities of the companies acquired amounted to USD , thousand and USD , thou-sand, respectively.
The assets and liabilities arising from the acquisition are as follows:
Cash and cash equivalents . . . . . . . . . . . . . . . . . . . . . . . . . . . . . . . . . . . . . . . . . . . . . . . . . . . . . . . . . . . . . . . . . . . . . . . . . . . . . . . . . . . 136
Property, plant and equipment . . . . . . . . . . . . . . . . . . . . . . . . . . . . . . . . . . . . . . . . . . . . . . . . . . . . . . . . . . . . . . . . . . . . . . . . . . . . . . . 22,788
Other long-term and short-term investments . . . . . . . . . . . . . . . . . . . . . . . . . . . . . . . . . . . . . . . . . . . . . . . . . . . . . . . . . . . . . . . . . . . . 27
Inventories (net) . . . . . . . . . . . . . . . . . . . . . . . . . . . . . . . . . . . . . . . . . . . . . . . . . . . . . . . . . . . . . . . . . . . . . . . . . . . . . . . . . . . . . . . . . . . 873
Accounts receivable . . . . . . . . . . . . . . . . . . . . . . . . . . . . . . . . . . . . . . . . . . . . . . . . . . . . . . . . . . . . . . . . . . . . . . . . . . . . . . . . . . . . . . . . 1,969
Borrowings . . . . . . . . . . . . . . . . . . . . . . . . . . . . . . . . . . . . . . . . . . . . . . . . . . . . . . . . . . . . . . . . . . . . . . . . . . . . . . . . . . . . . . . . . . . . . . . . (12,317)
Fair value of net assets acquired . . . . . . . . . . . . . . . . . . . . . . . . . . . . . . . . . . . . . . . . . . . . . . . . . . . . . . . . . . . . . . . . . . . . . . . . . . . . . . 13,476
Goodwill . . . . . . . . . . . . . . . . . . . . . . . . . . . . . . . . . . . . . . . . . . . . . . . . . . . . . . . . . . . . . . . . . . . . . . . . . . . . . . . . . . . . . . . . . . . . . . . . . . 3,029
Purchase consideration . . . . . . . . . . . . . . . . . . . . . . . . . . . . . . . . . . . . . . . . . . . . . . . . . . . . . . . . . . . . . . . . . . . . . . . . . . . . . . . . . . . . . 16,505
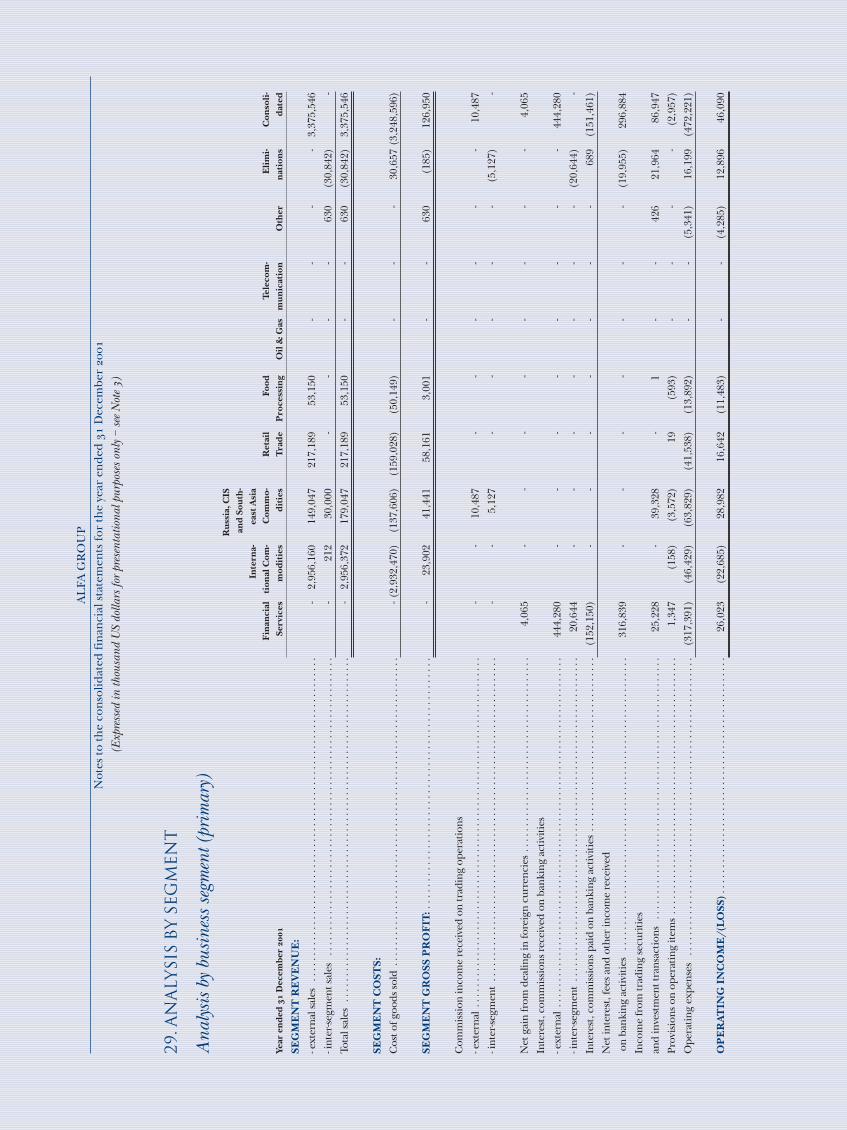
29. A
NA
LYSI
S B
Y S
EG
ME
NT
Ana
lysi
s by
bus
ines
s se
gmen
t (pr
imar
y)R
uss
ia, C
ISan
d S
outh
-In
tern
a-ea
st A
sia
Fin
anci
alti
onal
Com
-C
omm
o-R
etai
lFo
odTe
leco
m-
Eli
mi-
Con
soli
-Ye
ar e
nd
ed
D
ecem
ber
Se
rvic
esm
odit
ies
dit
ies
Tra
de
Pro
cess
ing
Oil
& G
asm
un
icat
ion
Oth
ern
atio
ns
dat
ed
SEG
ME
NT
RE
VE
NU
E:
- ext
erna
l sal
es .
. . .
. . .
. . .
. . .
. . .
. . .
. . .
. . .
. . .
. . .
. . .
. . .
. . .
. . .
. . .
. . .
. . .
. . .
. . .
. . .
. .-
2,95
6,16
014
9,04
721
7,18
953
,150
--
--
3,37
5,54
6
- int
er-se
gmen
t sal
es .
. . .
. . .
. . .
. . .
. . .
. . .
. . .
. . .
. . .
. . .
. . .
. . .
. . .
. . .
. . .
. . .
. . .
. . .
. . .
-21
230
,000
--
--
630
(30,
842)
-
Tota
l sal
es .
. . .
. . .
. . .
. . .
. . .
. . .
. . .
. . .
. . .
. . .
. . .
. . .
. . .
. . .
. . .
. . .
. . .
. . .
. . .
. . .
. . .
. . .
-2,
956,
372
179,
047
217,
189
53,1
50-
-63
0(3
0,84
2)3,
375,
546
SEG
ME
NT
CO
STS:
Cos
t of g
oods
sold
. . .
. . .
. . .
. . .
. . .
. . .
. . .
. . .
. . .
. . .
. . .
. . .
. . .
. . .
. . .
. . .
. . .
. . .
. . .
. . .
-(2,
932,
470)
(137
,606
)(1
59,0
28)
(50,
149)
--
-30
,657
(3,2
48,5
96)
SEG
ME
NT
GR
OSS
PR
OF
IT: .
. . .
. . .
. . .
. . .
. . .
. . .
. . .
. . .
. . .
. . .
. . .
. . .
. . .
. . .
. . .
-23
,902
41,4
4158
,161
3,00
1-
-63
0(1
85)
126,
950
Com
mis
sion
inco
me
rece
ived
on
trad
ing
oper
atio
ns
- ext
erna
l . .
. . .
. . .
. . .
. . .
. . .
. . .
. . .
. . .
. . .
. . .
. . .
. . .
. . .
. . .
. . .
. . .
. . .
. . .
. . .
. . .
. . .
. . .
--
10,4
87-
--
--
-10
,487
- int
er-se
gmen
t . .
. . .
. . .
. . .
. . .
. . .
. . .
. . .
. . .
. . .
. . .
. . .
. . .
. . .
. . .
. . .
. . .
. . .
. . .
. . .
. . .
.-
-5,
127
--
--
-(5
,127
)-
Net
gai
n fr
om d
ealin
g in
fore
ign
curr
enci
es .
. . .
. . .
. . .
. . .
. . .
. . .
. . .
. . .
. . .
. . .
. . .
. . .
.4,
065
--
--
--
--
4,06
5
Inte
rest
, com
mis
sion
s rec
eive
d on
ban
king
act
iviti
es
- ext
erna
l . .
. . .
. . .
. . .
. . .
. . .
. . .
. . .
. . .
. . .
. . .
. . .
. . .
. . .
. . .
. . .
. . .
. . .
. . .
. . .
. . .
. . .
. . .
444,
280
--
--
--
--
444,
280
- int
er-se
gmen
t . .
. . .
. . .
. . .
. . .
. . .
. . .
. . .
. . .
. . .
. . .
. . .
. . .
. . .
. . .
. . .
. . .
. . .
. . .
. . .
. . .
.20
,644
--
--
--
-(2
0,64
4)-
Inte
rest
, com
mis
sion
s pai
d on
ban
king
act
iviti
es .
. . .
. . .
. . .
. . .
. . .
. . .
. . .
. . .
. . .
. . .
. . .
(152
,150
)-
--
--
--
689
(151
,461
)
Net
inte
rest
, fee
s and
oth
er in
com
e re
ceiv
ed
on b
anki
ng a
ctiv
ities
. . .
. . .
. . .
. . .
. . .
. . .
. . .
. . .
. . .
. . .
. . .
. . .
. . .
. . .
. . .
. . .
. . .
. . .
. . .
316,
839
--
--
--
-(1
9,95
5)29
6,88
4
Inco
me
from
trad
ing
secu
ritie
s
and
inve
stm
ent t
rans
actio
ns .
. . .
. . .
. . .
. . .
. . .
. . .
. . .
. . .
. . .
. . .
. . .
. . .
. . .
. . .
. . .
. . .
. .25
,228
-39
,328
-1
--
426
21,9
6486
,947
Prov
isio
ns o
n op
erat
ing
item
s . .
. . .
. . .
. . .
. . .
. . .
. . .
. . .
. . .
. . .
. . .
. . .
. . .
. . .
. . .
. . .
. . .
1,34
7(1
58)
(3,5
72)
19(5
93)
--
--
(2,9
57)
Ope
ratin
g ex
pens
es .
. . .
. . .
. . .
. . .
. . .
. . .
. . .
. . .
. . .
. . .
. . .
. . .
. . .
. . .
. . .
. . .
. . .
. . .
. . .
(317
,391
)(4
6,42
9)(6
3,82
9)(4
1,53
8)(1
3,89
2)-
-(5
,341
)16
,199
(472
,221
)
OP
ER
AT
ING
IN
CO
ME
/(L
OSS
) . .
. . .
. . .
. . .
. . .
. . .
. . .
. . .
. . .
. . .
. . .
. . .
. . .
. . .
. . .
. .26
,023
(22,
685)
28,9
8216
,642
(11,
483)
--
(4,2
85)
12,8
9646
,090
AL
FA G
RO
UP
N
otes
to th
e co
nso
lidat
ed fi
nan
cial
sta
tem
ents
for
the
year
en
ded
Dec
embe
r
(Exp
ress
ed in
thou
sand
US
dolla
rs fo
r pr
esen
tatio
nal p
urpo
ses
only
– s
ee N
ote
)
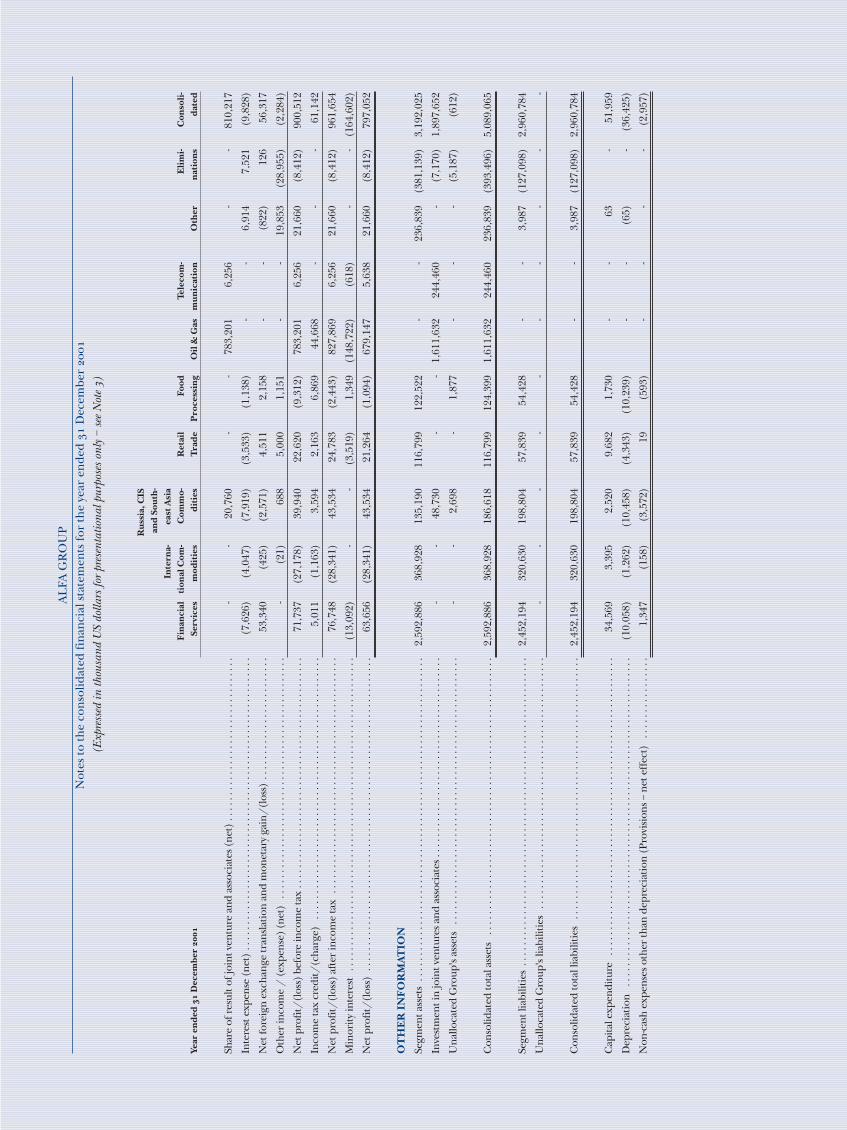
AL
FA G
RO
UP
N
otes
to th
e co
nso
lidat
ed fi
nan
cial
sta
tem
ents
for
the
year
en
ded
Dec
embe
r
(Exp
ress
ed in
thou
sand
US
dolla
rs fo
r pr
esen
tatio
nal p
urpo
ses
only
– s
ee N
ote
)
Ru
ssia
, CIS
and
Sou
th-
Inte
rna-
east
Asi
aF
inan
cial
tion
al C
om-
Com
mo-
Ret
ail
Food
Tele
com
-E
lim
i-C
onso
li-
Year
en
ded
Dec
embe
r
Serv
ices
mod
itie
sd
itie
sT
rad
eP
roce
ssin
gO
il &
Gas
mu
nic
atio
nO
ther
nat
ion
sd
ated
Shar
e of
res
ult o
f joi
nt v
entu
re a
nd a
ssoc
iate
s (ne
t) .
. . .
. . .
. . .
. . .
. . .
. . .
. . .
. . .
. . .
. . .
.-
-20
,760
--
783,
201
6,25
6-
-81
0,21
7
Inte
rest
exp
ense
(ne
t) .
. . .
. . .
. . .
. . .
. . .
. . .
. . .
. . .
. . .
. . .
. . .
. . .
. . .
. . .
. . .
. . .
. . .
. . .
. .(7
,626
)(4
,047
)(7
,919
)(3
,533
)(1
,138
)-
-6,
914
7,52
1(9
,828
)
Net
fore
ign
exch
ange
tran
slat
ion
and
mon
etar
y ga
in/
(los
s) .
. . .
. . .
. . .
. . .
. . .
. . .
. . .
. .53
,340
(425
)(2
,571
)4,
511
2,15
8-
-(8
22)
126
56,3
17
Oth
er in
com
e /
(ex
pens
e) (
net)
. . .
. . .
. . .
. . .
. . .
. . .
. . .
. . .
. . .
. . .
. . .
. . .
. . .
. . .
. . .
. .
-(2
1)68
85,
000
1,15
1-
-19
,853
(28,
955)
(2,2
84)
Net
pro
fit/
(los
s) b
efor
e in
com
e ta
x . .
. . .
. . .
. . .
. . .
. . .
. . .
. . .
. . .
. . .
. . .
. . .
. . .
. . .
. . .
.71
,737
(27,
178)
39,9
4022
,620
(9,3
12)
783,
201
6,25
621
,660
(8,4
12)
900,
512
Inco
me
tax
cred
it/(c
harg
e) .
. . .
. . .
. . .
. . .
. . .
. . .
. . .
. . .
. . .
. . .
. . .
. . .
. . .
. . .
. . .
. . .
. .5,
011
(1,1
63)
3,59
42,
163
6,86
944
,668
--
-61
,142
Net
pro
fit/
(los
s) a
fter
inco
me
tax
. . .
. . .
. . .
. . .
. . .
. . .
. . .
. . .
. . .
. . .
. . .
. . .
. . .
. . .
. . .
.76
,748
(28,
341)
43,5
3424
,783
(2,4
43)
827,
869
6,25
621
,660
(8,4
12)
961,
654
Min
ority
inte
rest
. . .
. . .
. . .
. . .
. . .
. . .
. . .
. . .
. . .
. . .
. . .
. . .
. . .
. . .
. . .
. . .
. . .
. . .
. . .
. . .
.(1
3,09
2)-
-(3
,519
)1,
349
(148
,722
)(6
18)
--
(164
,602
)
Net
pro
fit/
(los
s) .
. . .
. . .
. . .
. . .
. . .
. . .
. . .
. . .
. . .
. . .
. . .
. . .
. . .
. . .
. . .
. . .
. . .
. . .
. . .
. . .
63,6
56(2
8,34
1)43
,534
21,2
64(1
,094
)67
9,14
75,
638
21,6
60(8
,412
)79
7,05
2
OT
HE
R I
NF
OR
MA
TIO
N
Segm
ent a
sset
s . .
. . .
. . .
. . .
. . .
. . .
. . .
. . .
. . .
. . .
. . .
. . .
. . .
. . .
. . .
. . .
. . .
. . .
. . .
. . .
. . .
.2,
592,
886
368,
928
135,
190
116,
799
122,
522
--
236,
839
(381
,139
)3,
192,
025
Inve
stm
ent i
n jo
int v
entu
res a
nd a
ssoc
iate
s . .
. . .
. . .
. . .
. . .
. . .
. . .
. . .
. . .
. . .
. . .
. . .
. . .
.-
-48
,730
--
1,61
1,63
224
4,46
0-
(7,1
70)
1,89
7,65
2
Una
lloca
ted
Gro
up's
asse
ts .
. . .
. . .
. . .
. . .
. . .
. . .
. . .
. . .
. . .
. . .
. . .
. . .
. . .
. . .
. . .
. . .
. . .
--
2,69
8-
1,87
7-
--
(5,1
87)
(612
)
Con
solid
ated
tota
l ass
ets
. . .
. . .
. . .
. . .
. . .
. . .
. . .
. . .
. . .
. . .
. . .
. . .
. . .
. . .
. . .
. . .
. . .
. . .
2,59
2,88
636
8,92
818
6,61
811
6,79
912
4,39
91,
611,
632
244,
460
236,
839
(393
,496
)5,
089,
065
Segm
ent l
iabi
litie
s . .
. . .
. . .
. . .
. . .
. . .
. . .
. . .
. . .
. . .
. . .
. . .
. . .
. . .
. . .
. . .
. . .
. . .
. . .
. . .
.2,
452,
194
320,
630
198,
804
57,8
3954
,428
--
3,98
7(1
27,0
98)
2,96
0,78
4
Una
lloca
ted
Gro
up's
liabi
litie
s .
. . .
. . .
. . .
. . .
. . .
. . .
. . .
. . .
. . .
. . .
. . .
. . .
. . .
. . .
. . .
. . .
--
--
--
--
--
Con
solid
ated
tota
l lia
bilit
ies
. . .
. . .
. . .
. . .
. . .
. . .
. . .
. . .
. . .
. . .
. . .
. . .
. . .
. . .
. . .
. . .
. . .
2,45
2,19
432
0,63
019
8,80
457
,839
54,4
28-
-3,
987
(127
,098
)2,
960,
784
Cap
ital e
xpen
ditu
re .
. . .
. . .
. . .
. . .
. . .
. . .
. . .
. . .
. . .
. . .
. . .
. . .
. . .
. . .
. . .
. . .
. . .
. . .
. . .
34,5
693,
395
2,52
09,
682
1,73
0-
-63
-51
,959
Dep
reci
atio
n .
. . .
. . .
. . .
. . .
. . .
. . .
. . .
. . .
. . .
. . .
. . .
. . .
. . .
. . .
. . .
. . .
. . .
. . .
. . .
. . .
. . .
(10,
058)
(1,2
62)
(10,
458)
(4,3
43)
(10,
239)
--
(65)
-(3
6,42
5)
Non
-cas
h ex
pens
es o
ther
than
dep
reci
atio
n (P
rovi
sion
s – n
et e
ffec
t) .
. . .
. . .
. . .
. . .
. . .
1,34
7(1
58)
(3,5
72)
19(5
93)
--
--
(2,9
57)
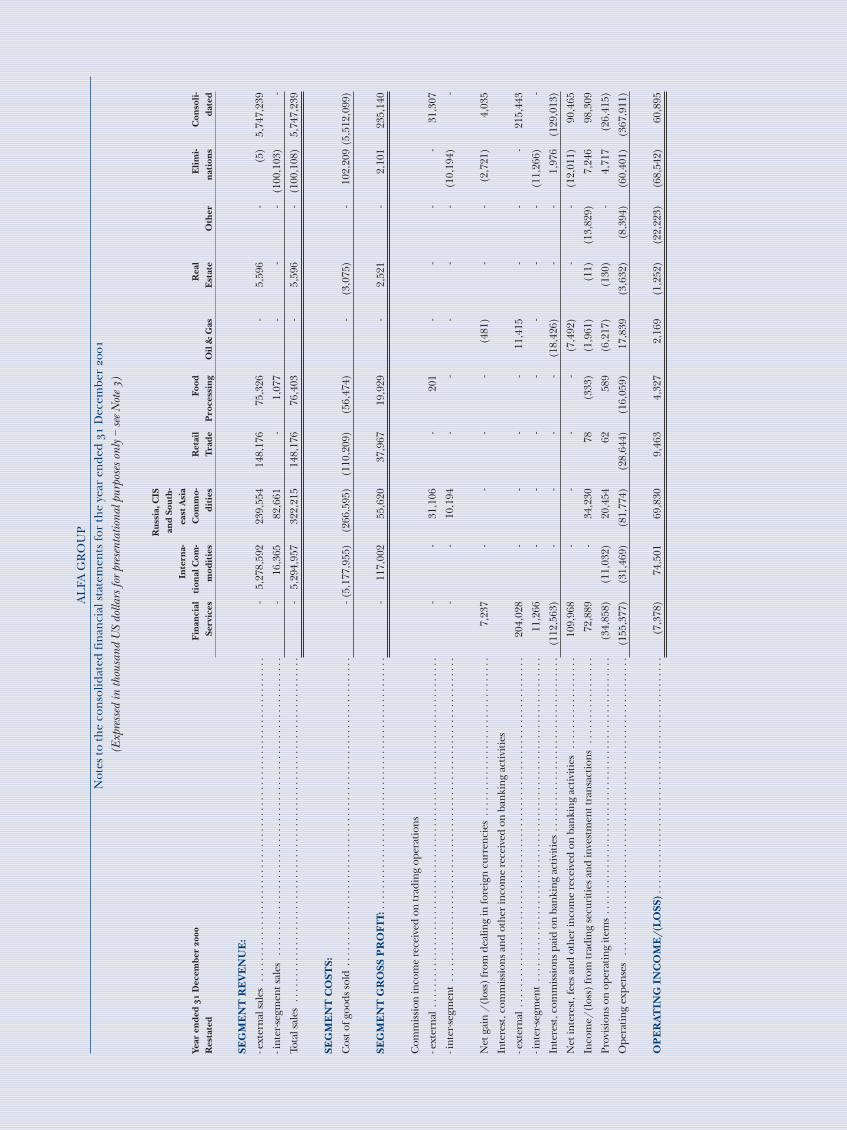
AL
FA G
RO
UP
N
otes
to th
e co
nso
lidat
ed fi
nan
cial
sta
tem
ents
for
the
year
en
ded
Dec
embe
r
(Exp
ress
ed in
thou
sand
US
dolla
rs fo
r pr
esen
tatio
nal p
urpo
ses
only
– s
ee N
ote
)
Ru
ssia
, CIS
and
Sou
th-
Inte
rna-
east
Asi
aYe
ar e
nd
ed
D
ecem
ber
Fin
anci
alti
onal
Com
-C
omm
o-R
etai
lFo
odR
eal
Eli
mi-
Con
soli
-R
esta
ted
Serv
ices
mod
itie
sd
itie
sT
rad
eP
roce
ssin
gO
il &
Gas
Est
ate
Oth
ern
atio
ns
dat
ed
SEG
ME
NT
RE
VE
NU
E:
- ext
erna
l sal
es .
. . .
. . .
. . .
. . .
. . .
. . .
. . .
. . .
. . .
. . .
. . .
. . .
. . .
. . .
. . .
. . .
. . .
. . .
. . .
. . .
. .-
5,27
8,59
223
9,55
4 14
8,17
6 75
,326
-
5,59
6 -
(5)
5,74
7,23
9
- int
er-se
gmen
t sal
es .
. . .
. . .
. . .
. . .
. . .
. . .
. . .
. . .
. . .
. . .
. . .
. . .
. . .
. . .
. . .
. . .
. . .
. . .
. . .
-16
,365
82,6
61
-1,
077
--
-(1
00,1
03)
-
Tota
l sal
es .
. . .
. . .
. . .
. . .
. . .
. . .
. . .
. . .
. . .
. . .
. . .
. . .
. . .
. . .
. . .
. . .
. . .
. . .
. . .
. . .
. . .
. . .
-5,
294,
957
322,
215
148,
176
76,4
03
-5,
596
-(1
00,1
08)
5,74
7,23
9
SEG
ME
NT
CO
STS:
Cos
t of g
oods
sold
. . .
. . .
. . .
. . .
. . .
. . .
. . .
. . .
. . .
. . .
. . .
. . .
. . .
. . .
. . .
. . .
. . .
. . .
. . .
. . .
-(5,
177,
955)
(266
,595
) (1
10,2
09)
(56,
474)
-
(3,0
75)
-10
2,20
9 (5
,512
,099
)
SEG
ME
NT
GR
OSS
PR
OF
IT: .
. . .
. . .
. . .
. . .
. . .
. . .
. . .
. . .
. . .
. . .
. . .
. . .
. . .
. . .
. . .
. . .
-11
7,00
255
,620
37
,967
19
,929
-
2,52
1 -
2,10
1 23
5,14
0
Com
mis
sion
inco
me
rece
ived
on
trad
ing
oper
atio
ns
- ext
erna
l . .
. . .
. . .
. . .
. . .
. . .
. . .
. . .
. . .
. . .
. . .
. . .
. . .
. . .
. . .
. . .
. . .
. . .
. . .
. . .
. . .
. . .
. . .
--
31,1
06
-20
1 -
--
-31
,307
- int
er-se
gmen
t . .
. . .
. . .
. . .
. . .
. . .
. . .
. . .
. . .
. . .
. . .
. . .
. . .
. . .
. . .
. . .
. . .
. . .
. . .
. . .
. . .
.-
-10
,194
-
--
--
(10,
194)
-
Net
gai
n /
(los
s) fr
om d
ealin
g in
fore
ign
curr
enci
es .
. . .
. . .
. . .
. . .
. . .
. . .
. . .
. . .
. . .
. . .
7,23
7 -
--
-(4
81)
--
(2,7
21)
4,03
5
Inte
rest
, com
mis
sion
s and
oth
er in
com
e re
ceiv
ed o
n ba
nkin
g ac
tiviti
es
- ext
erna
l . .
. . .
. . .
. . .
. . .
. . .
. . .
. . .
. . .
. . .
. . .
. . .
. . .
. . .
. . .
. . .
. . .
. . .
. . .
. . .
. . .
. . .
. . .
204,
028
--
--
11,4
15
--
-21
5,44
3
- int
er-se
gmen
t . .
. . .
. . .
. . .
. . .
. . .
. . .
. . .
. . .
. . .
. . .
. . .
. . .
. . .
. . .
. . .
. . .
. . .
. . .
. . .
. . .
.11
,266
-
--
--
--
(11,
266)
-
Inte
rest
, com
mis
sion
s pai
d on
ban
king
act
iviti
es .
. . .
. . .
. . .
. . .
. . .
. . .
. . .
. . .
. . .
. . .
. . .
(112
,563
) -
--
-(1
8,42
6)
--
1,97
6 (1
29,0
13)
Net
inte
rest
, fee
s and
oth
er in
com
e re
ceiv
ed o
n ba
nkin
g ac
tiviti
es .
. . .
. . .
. . .
. . .
. . .
. .10
9,96
8 -
--
-(7
,492
) -
-(1
2,01
1)
90,4
65
Inco
me/
(los
s) fr
om tr
adin
g se
curi
ties a
nd in
vest
men
t tra
nsac
tions
. . .
. . .
. . .
. . .
. . .
. .
72,8
89
-34
,230
78
(3
33)
(1,9
61)
(11)
(1
3,82
9)
7,24
6 98
,309
Prov
isio
ns o
n op
erat
ing
item
s . .
. . .
. . .
. . .
. . .
. . .
. . .
. . .
. . .
. . .
. . .
. . .
. . .
. . .
. . .
. . .
. . .
(34,
858)
(1
1,03
2)
20,4
54
62
589
(6,2
17)
(130
) -
4,71
7 (2
6,41
5)
Ope
ratin
g ex
pens
es .
. . .
. . .
. . .
. . .
. . .
. . .
. . .
. . .
. . .
. . .
. . .
. . .
. . .
. . .
. . .
. . .
. . .
. . .
. . .
(155
,377
) (3
1,46
9)(8
1,77
4)
(28,
644)
(1
6,05
9)
17,8
39(3
,632
) (8
,394
) (6
0,40
1)
(367
,911
)
OP
ER
AT
ING
IN
CO
ME
/(L
OSS
) . .
. . .
. . .
. . .
. . .
. . .
. . .
. . .
. . .
. . .
. . .
. . .
. . .
. . .
. . .
. .(7
,378
) 74
,501
69
,830
9,
463
4,32
7 2,
169
(1,2
52)
(22,
223)
(6
8,54
2)
60,8
95

AL
FA G
RO
UP
N
otes
to th
e co
nso
lidat
ed fi
nan
cial
sta
tem
ents
for
the
year
en
ded
Dec
embe
r
(Exp
ress
ed in
thou
sand
US
dolla
rs fo
r pr
esen
tatio
nal p
urpo
ses
only
– s
ee N
ote
)
Ru
ssia
, CIS
and
Sou
th-
Inte
rna-
east
Asi
aYe
ar e
nd
ed
D
ecem
ber
Fin
anci
alti
onal
Com
-C
omm
o-R
etai
lFo
odR
eal
Eli
mi-
Con
soli
-R
esta
ted
Serv
ices
mod
itie
sd
itie
sT
rad
eP
roce
ssin
gO
il &
Gas
Est
ate
Oth
ern
atio
ns
dat
ed
Shar
e of
res
ult o
f joi
nt v
entu
re (
net)
. . .
. . .
. . .
. . .
. . .
. . .
. . .
. . .
. . .
. . .
. . .
. . .
. . .
. . .
. .
--
--
-1,
083,
239
--
-1,
083,
239
Gai
n on
deb
t tra
nsac
tions
. . .
. . .
. . .
. . .
. . .
. . .
. . .
. . .
. . .
. . .
. . .
. . .
. . .
. . .
. . .
. . .
. . .
. .
15,4
81
--
--
--
--
15,4
81
Inte
rest
exp
ense
(ne
t) .
. . .
. . .
. . .
. . .
. . .
. . .
. . .
. . .
. . .
. . .
. . .
. . .
. . .
. . .
. . .
. . .
. . .
. . .
. .(7
,617
) 30
41,
162
(5,3
16)
(953
) -
(85)
4,
555
(1,6
59)
(9,6
09)
Net
fore
ign
exch
ange
tran
slat
ion
and
mon
etar
y ga
in/
(los
s) .
. . .
. . .
. . .
. . .
. . .
. . .
. . .
. .87
,135
(5
40)
(1,5
76)
7,18
0 (1
,815
) 18
,577
(11,
246)
(3
3)
26,7
63
124,
445
Oth
er in
com
e /
(ex
pens
e) (
net)
. . .
. . .
. . .
. . .
. . .
. . .
. . .
. . .
. . .
. . .
. . .
. . .
. . .
. . .
. . .
. .
-(5
54)
(80)
(2
,258
) 4,
169
1,05
9 22
1 4,
705
(10,
316)
(3
,054
)
Net
pro
fit/
(los
s) b
efor
e in
com
e ta
x . .
. . .
. . .
. . .
. . .
. . .
. . .
. . .
. . .
. . .
. . .
. . .
. . .
. . .
. . .
.87
,621
73
,711
69
,336
9,
069
5,72
8 1,
105,
044
(12,
362)
(1
2,99
6)
(53,
754)
1,
271,
397
Inco
me
tax
char
ge .
. . .
. . .
. . .
. . .
. . .
. . .
. . .
. . .
. . .
. . .
. . .
. . .
. . .
. . .
. . .
. . .
. . .
. . .
. . .
. .(1
,848
) (2
,205
)(2
08)
(2,6
61)
(1,8
13)
(28,
428)
(290
) -
-(3
7,45
3)
Net
pro
fit/
(los
s) a
fter
inco
me
tax
. . .
. . .
. . .
. . .
. . .
. . .
. . .
. . .
. . .
. . .
. . .
. . .
. . .
. . .
. . .
.85
,773
71
,506
69
,128
6,
408
3,91
5 1,
076,
616
(12,
652)
(1
2,99
6)
(53,
754)
1,
233,
944
Min
ority
inte
rest
. . .
. . .
. . .
. . .
. . .
. . .
. . .
. . .
. . .
. . .
. . .
. . .
. . .
. . .
. . .
. . .
. . .
. . .
. . .
. . .
.(1
2,82
0)
--
--
(160
,920
)-
-84
8 (1
72,8
92)
Net
pro
fit/
(los
s) .
. . .
. . .
. . .
. . .
. . .
. . .
. . .
. . .
. . .
. . .
. . .
. . .
. . .
. . .
. . .
. . .
. . .
. . .
. . .
. . .
72,9
5371
,506
69
,128
6,
408
3,91
591
5,69
6(1
2,65
2)
(12,
996)
(5
2,90
6)
1,06
1,05
2
OT
HE
R I
NF
OR
MA
TIO
N
Segm
ent a
sset
s . .
. . .
. . .
. . .
. . .
. . .
. . .
. . .
. . .
. . .
. . .
. . .
. . .
. . .
. . .
. . .
. . .
. . .
. . .
. . .
. . .
.2,
102,
658
660,
663
233,
275
97,5
29
76,2
52
36,3
99
36,8
49
347,
182
(806
,045
) 2,
784,
762
Inve
stm
ent i
n jo
int v
entu
res
. . .
. . .
. . .
. . .
. . .
. . .
. . .
. . .
. . .
. . .
. . .
. . .
. . .
. . .
. . .
. . .
. . .
--
–-
-1,
069,
187
--
-1,
069,
187
Una
lloca
ted
Gro
up's
asse
ts .
. . .
. . .
. . .
. . .
. . .
. . .
. . .
. . .
. . .
. . .
. . .
. . .
. . .
. . .
. . .
. . .
. . .
--
--
--
--
(517
) (5
17)
Con
solid
ated
tota
l ass
ets
. . .
. . .
. . .
. . .
. . .
. . .
. . .
. . .
. . .
. . .
. . .
. . .
. . .
. . .
. . .
. . .
. . .
. . .
2,10
2,65
8 66
0,66
323
3,27
5 97
,529
76
,252
1,
105,
586
36,8
49
347,
182
(806
,562
) 3,
853,
432
Segm
ent l
iabi
litie
s . .
. . .
. . .
. . .
. . .
. . .
. . .
. . .
. . .
. . .
. . .
. . .
. . .
. . .
. . .
. . .
. . .
. . .
. . .
. . .
.2,
145,
571
584,
025
168,
680
68,3
98
31,4
83
38,5
43
40,5
82
15,3
07
(366
,448
) 2,
726,
141
Una
lloca
ted
Gro
up's
liabi
litie
s .
. . .
. . .
. . .
. . .
. . .
. . .
. . .
. . .
. . .
. . .
. . .
. . .
. . .
. . .
. . .
. . .
--
--
--
--
--
Con
solid
ated
tota
l lia
bilit
ies
. . .
. . .
. . .
. . .
. . .
. . .
. . .
. . .
. . .
. . .
. . .
. . .
. . .
. . .
. . .
. . .
. . .
2,14
5,57
1 58
4,02
5 16
8,68
0 68
,398
31
,483
38
,543
40,5
82
15,3
07
(366
,448
) 2,
726,
141
Cap
ital e
xpen
ditu
re .
. . .
. . .
. . .
. . .
. . .
. . .
. . .
. . .
. . .
. . .
. . .
. . .
. . .
. . .
. . .
. . .
. . .
. . .
. . .
49,8
17
4,02
01,
241
5,42
0 5,
897
-26
2 80
-
66,7
37
Dep
reci
atio
n .
. . .
. . .
. . .
. . .
. . .
. . .
. . .
. . .
. . .
. . .
. . .
. . .
. . .
. . .
. . .
. . .
. . .
. . .
. . .
. . .
. . .
(7,5
40)
(209
)(8
12)
(3,4
98)
(3,4
20)
-(2
4)
(177
) -
(15,
680)
Non
-cas
h ex
pens
es o
ther
than
dep
reci
atio
n (P
rovi
sion
s – n
et e
ffec
t) .
. . .
. . .
. . .
. . .
. . .
(34,
858)
(1
1,03
2)
20,4
54
62
589
(6,2
17)
(130
) -
4,71
7 (2
6,41
5)
ALFA GROUP Notes to the consolidated financial statements for the year ended December
(Expressed in thousand US dollars for presentational purposes only – see Note )
Analysis by geographical segmentThe majority of the Group’s assets are located in the Russian Federation. However, % of total revenue, mainly related to the inter-national commodities business, is located outside the Russian Federation. Revenue can be broken down as follows:
The Netherlands . . . . . . . . . . . . . . . . . . . . . . . . . . . . . . . . . . . . . . . . . . . . . . . . . . . . . . . . . . . . . . . . . . . . . . . . . . . . . . . . . . . . . . . . 847,201
Germany . . . . . . . . . . . . . . . . . . . . . . . . . . . . . . . . . . . . . . . . . . . . . . . . . . . . . . . . . . . . . . . . . . . . . . . . . . . . . . . . . . . . . . . . . . . . . . 752,798
Russian Federation . . . . . . . . . . . . . . . . . . . . . . . . . . . . . . . . . . . . . . . . . . . . . . . . . . . . . . . . . . . . . . . . . . . . . . . . . . . . . . . . . . . . . . 532,062
Italy . . . . . . . . . . . . . . . . . . . . . . . . . . . . . . . . . . . . . . . . . . . . . . . . . . . . . . . . . . . . . . . . . . . . . . . . . . . . . . . . . . . . . . . . . . . . . . . . . . 350,561
Baltic Sea countries . . . . . . . . . . . . . . . . . . . . . . . . . . . . . . . . . . . . . . . . . . . . . . . . . . . . . . . . . . . . . . . . . . . . . . . . . . . . . . . . . . . . . 261,618
Other countries of EU . . . . . . . . . . . . . . . . . . . . . . . . . . . . . . . . . . . . . . . . . . . . . . . . . . . . . . . . . . . . . . . . . . . . . . . . . . . . . . . . . . . 161,184
South-East Asia . . . . . . . . . . . . . . . . . . . . . . . . . . . . . . . . . . . . . . . . . . . . . . . . . . . . . . . . . . . . . . . . . . . . . . . . . . . . . . . . . . . . . . . . . 149,350
Other regions . . . . . . . . . . . . . . . . . . . . . . . . . . . . . . . . . . . . . . . . . . . . . . . . . . . . . . . . . . . . . . . . . . . . . . . . . . . . . . . . . . . . . . . . . . 133,566
The rest of Europe . . . . . . . . . . . . . . . . . . . . . . . . . . . . . . . . . . . . . . . . . . . . . . . . . . . . . . . . . . . . . . . . . . . . . . . . . . . . . . . . . . . . . . 76,190
Ukraine . . . . . . . . . . . . . . . . . . . . . . . . . . . . . . . . . . . . . . . . . . . . . . . . . . . . . . . . . . . . . . . . . . . . . . . . . . . . . . . . . . . . . . . . . . . . . . . 56,302
Other Eastern European countries . . . . . . . . . . . . . . . . . . . . . . . . . . . . . . . . . . . . . . . . . . . . . . . . . . . . . . . . . . . . . . . . . . . . . . . . . 34,948
USA . . . . . . . . . . . . . . . . . . . . . . . . . . . . . . . . . . . . . . . . . . . . . . . . . . . . . . . . . . . . . . . . . . . . . . . . . . . . . . . . . . . . . . . . . . . . . . . . . . 19,766
3,375,546
30. FAIR VALUE OF FINANCIAL INSTRUMENTSFair value is the amount at which a financial instrument could be exchanged in a current transaction between willing parties, otherthan in a forced sale or liquidation, and is best evidenced by a quoted market price.
The estimated fair values of financial instruments have been determined by the Group using available market information, whereit exists, and appropriate valuation methodologies. However, judgement is necessarily required to interpret market data to deter-mine the estimated fair value. As described in more detail in Note , the Russian Federation has shown signs of an emergingmarket and has experienced a significant decline in the volume of activity in its financial markets. While Management has usedavailable market information in estimating the fair value of financial instruments, the market information may not be fully reflec-tive of the value that could be realised in the current circumstances.
Management has estimated that the fair value of certain balance sheet instruments is not materially different than their recordedvalues. These balance sheet instruments include cash, nostros and term deposits, placements with banks and other financial insti-tutions, trading securities, investments available for sale, loans and advances to customers, due from and due to banks, trade andother accounts receivable, deposits from customers, bills of exchange, and other short-term assets and liabilities which are of acontractual nature. Management believes that the carrying amount of these particular financial assets and liabilities approximatestheir fair value; partially due to the fact that it is practice to renegotiate interest rates to reflect current market conditions (refer toNote ). The fair value of derivative contracts is shown in Note .
As set out in Note , external independent market quotations were not available for certain investments available for sale. The fairvalues of these assets were determined by Management on the basis of current negotiations for disposal of these investments to thirdparties, results of recent sales of equity interest in the investees between unrelated third parties, consideration of other relevantfactors such as discounted cash flows and financial information of the investees and application of other valuation methodologies.
The fair values of investments in joint ventures and associated companies, share capital, premises and equipment, and other assetsand liabilities which are not of a contractual nature are not calculated as they are not considered financial instruments under IAS, “Financial Instruments: Disclosure and Presentation”.
ALFA GROUP Notes to the consolidated financial statements for the year ended December
(Expressed in thousand US dollars for presentational purposes only – see Note )
31. RISK MANAGEMENTFinancial risk factors. The Group's activities expose it to a variety of financial risks including changes in market prices forfinancial instruments, fluctuations in interest rates, fluctuating exchange rates, and credit risk. The Group's companies’ individualrisk management programmes focus on the unpredictable nature of financial markets and seek to minimise potential adverseeffects on financial performance. Certain of the Group's companies use financial instruments, derivatives and other means toeconomically hedge certain exposures.
Interest rate risk. The Group is exposed to interest rate price risk, principally through Alfa Bank, as a result of lending andadvances to customers and banks at fixed interest rates, in amounts and for periods which differ from those of deposits and otherborrowings at fixed interest rates. In practice, interest rates are generally fixed on a short-term basis normally at three-month inter-vals. Also, interest rates, which are contractually fixed on both assets and liabilities, are often renegotiated to reflect current marketconditions.
Other parts of the Group have a modest exposure to interest rate risk, principally as a result of borrowings and other credit relatedcommitments which are largely at floating interest rates with relatively short maturities or interest reset dates.
The table below summarises the effective average interest rates, by major currencies, for monetary financial instrumentsoutstanding at the respective year end. The analyses have been prepared for the various financial instruments using year endcontractual rates.
OtherRUR USD EURO currencies
Due from banks . . . . . . . . . . . . . . . . . . . . . . . . . . . . . . . . . . . . . . . . . . . . . . . . . . . 13% 2% 8% 6.8%
Loans and advances to customers . . . . . . . . . . . . . . . . . . . . . . . . . . . . . . . . . . . . 21.1% 15.2% 12.5% 14%
Trading securities . . . . . . . . . . . . . . . . . . . . . . . . . . . . . . . . . . . . . . . . . . . . . . . . . 22.7% 10.8% - -
Cash and cash equivalents . . . . . . . . . . . . . . . . . . . . . . . . . . . . . . . . . . . . . . . . . . 23% 4-6% 7% 6.8%
Borrowings . . . . . . . . . . . . . . . . . . . . . . . . . . . . . . . . . . . . . . . . . . . . . . . . . . . . . . . 11.6% 5-10.5% 5.8% -
Amount owed to depositors . . . . . . . . . . . . . . . . . . . . . . . . . . . . . . . . . . . . . . . . . 13.2% 9.5% - 10%
Due to banks . . . . . . . . . . . . . . . . . . . . . . . . . . . . . . . . . . . . . . . . . . . . . . . . . . . . . 9.6% 6% 5.2% 7.3%
Liquidity risk. Liquidity risk is defined as risk when maturity of assets and liabilities does not match. The matching and/orcontrolled mismatching of the maturities and interest rates of assets and liabilities is fundamental to the liquidity of the Group. Itis unusual, at any given time, to be completely matched since business transacted is often of an uncertain term and of differenttypes. An unmatched position potentially enhances profitability, but can also increase the risk of losses. The maturities of assets andliabilities and the ability to replace, at an acceptable cost, interest-bearing liabilities as they mature, are important factors inassessing the liquidity of the Group and its exposure to changes in interest and exchange rates.

ALFA GROUP Notes to the consolidated financial statements for the year ended December
(Expressed in thousand US dollars for presentational purposes only – see Note )
The liquidity position of the Group at December is set out below:
Demandand less From From More
than to to than No stated month months months year maturity Total
Property, plant and equipment . . . . . . . . . . . . . . . . . . . . . . . . . . . . . . . - - - - 268,355 268,355
Investments available for sale . . . . . . . . . . . . . . . . . . . . . . . . . . . . . . . . . - 73 28,019 1,968 137,371 167,431
Investments in joint ventures . . . . . . . . . . . . . . . . . . . . . . . . . . . . . . . . - - - - 1,653,192 1,653,192
Investments in associates . . . . . . . . . . . . . . . . . . . . . . . . . . . . . . . . . . . . - - - - 244,460 244,460
Due from banks . . . . . . . . . . . . . . . . . . . . . . . . . . . . . . . . . . . . . . . . . . . . 117,538 2,295 - 279 4,245 124,357
Loans and advances to customers . . . . . . . . . . . . . . . . . . . . . . . . . . . . . 146,717 445,682 524,331 66,514 31,815 1,215,059
Income tax . . . . . . . . . . . . . . . . . . . . . . . . . . . . . . . . . . . . . . . . . . . . . . . . 13 189 201 2,094 - 2,497
Goodwill, net . . . . . . . . . . . . . . . . . . . . . . . . . . . . . . . . . . . . . . . . . . . . . . - - - - (613) (613)
Inventories . . . . . . . . . . . . . . . . . . . . . . . . . . . . . . . . . . . . . . . . . . . . . . . . 41,289 25,355 32,130 - - 98,774
Trading securities . . . . . . . . . . . . . . . . . . . . . . . . . . . . . . . . . . . . . . . . . . 156,673 - - - - 156,673
Trade and other receivables . . . . . . . . . . . . . . . . . . . . . . . . . . . . . . . . . . 188,538 113,242 143,036 4,382 - 449,198
Cash and cash equivalents . . . . . . . . . . . . . . . . . . . . . . . . . . . . . . . . . . . 706,536 3,146 - - - 709,682
Total assets . . . . . . . . . . . . . . . . . . . . . . . . . . . . . . . . . . . . . . . . . . . . . . . 1,357,304 589,982 727,717 75,237 2,338,825 5,089,065
Borrowings . . . . . . . . . . . . . . . . . . . . . . . . . . . . . . . . . . . . . . . . . . . . . . . . 349,562 235,670 64,890 66,511 - 716,633
Amount owed to depositors . . . . . . . . . . . . . . . . . . . . . . . . . . . . . . . . . . 1,068,534 195,534 53,057 3,852 - 1,320,977
Due to banks . . . . . . . . . . . . . . . . . . . . . . . . . . . . . . . . . . . . . . . . . . . . . . 293,119 6,185 31,392 9,581 - 340,277
Accounts payable and provisions . . . . . . . . . . . . . . . . . . . . . . . . . . . . . . 166,241 194,236 148,580 24,491 16,777 550,325
Income tax . . . . . . . . . . . . . . . . . . . . . . . . . . . . . . . . . . . . . . . . . . . . . . . . 94 5,915 - 7,316 19,247 32,572
Total liabilities . . . . . . . . . . . . . . . . . . . . . . . . . . . . . . . . . . . . . . . . . . . . 1,877,550 637,540 297,919 111,751 36,024 2,960,784
Net liquidity gap . . . . . . . . . . . . . . . . . . . . . . . . . . . . . . . . . . . . . . . . . . (520,246) (47,558) 429,798 (36,514) 2,302,801 2,128,281
Cumulative liquidity gap at 31 December 2001 . . . . . . . . . . . . . . . . (520,246) (567,804) (138,006) (174,520) 2,128,281 -
At December , the Group has negative working capital in the amount of USD , thousand (: USD , thou-sand). This is mainly due to borrowings and amounts owed to depositors. Management believes that in spite of a substantial portionof deposits from customers being on demand, diversification of these deposits by number and type of depositors, and the pastexperience of the Group would indicate that these deposits provide a long-term and stable source of funding for the Group.
The Group is exposed to the effects of fluctuations in the prevailing levels of market interest rates on its financial position and cashflows. Interest margins may increase as a result of such changes, but also may reduce or create losses in the event that unexpectedmovements arise. The Group’s interest rate sensitivity analysis based on the re-pricing of the Group’s assets and liabilities does notdiffer significantly from the maturity analysis disclosed in the table above.
Market risk. The Group takes on exposure to market risks. Market risks arise from open positions in interest rate, currency andequity products, all of which are exposed to general and specific market movements. The Board of Directors of each company inthe Group sets limits on the value of risk that may be accepted, which is monitored on a daily basis. However, the use of thisapproach does not prevent losses outside of these limits in the event of more significant market movements.
ALFA GROUP Notes to the consolidated financial statements for the year ended December
(Expressed in thousand US dollars for presentational purposes only – see Note )
Credit risk. The Group is exposed to credit risk, which is the risk that a counterparty will be unable to pay amounts in full whendue. The two principal types of credit risk result from lending to banks and other customers and from sale of products and serv-ices on credit.
Alfa Bank is the principal company in the Group, which is engaged in lending. In order to manage credit risk, Alfa Bank structuresthe levels of credit risk it undertakes by placing limits on the amount of risk accepted in relation to one borrower, or groups ofborrowers, and to geographical and industry segments. Such risks are monitored on a continual basis and subject to an annual ormore frequent review. Limits on the level of credit risk by product, borrower and industry sector are approved quarterly by AlfaBank’s Board of Directors. Exposure to credit risk is managed through regular analysis of the ability of borrowers and potentialborrowers to meet interest and capital repayment obligations and by changing these lending limits where appropriate. Exposureto credit risk is also managed, in part, by obtaining collateral and corporate and personal guarantees.
Through credit sales, all of the Group's companies are exposed to credit risk, which is managed accordingly. Each of the Group'scompanies has policies in place to ensure that sales of products and services are made to customers with an appropriate credithistory. Derivative counterparties and cash transactions are limited to high credit quality financial institutions and counterparties.
The Group’s maximum exposure to credit risk is primarily reflected in the carrying amounts of financial assets on the consolidatedbalance sheet. The impact of possible netting of assets and liabilities to reduce potential credit exposure is not significant.
Credit risk for off-balance sheet financial instruments is defined as the possibility of sustaining a loss because any other party to afinancial instrument fails to perform in accordance with the term of the contract. The Group uses the same credit policies inmaking conditional obligations as it does for on-balance sheet financial instruments through established credit approvals, riskcontrol limits and monitoring procedures.
Currency risk. The Group operates internationally, and is exposed to currency risk, the risk that the value of financial and otherassets and income and expense items will fluctuate due to changes in foreign exchange rates. Whenever possible, the Group, throughits companies, tries to limit its currency exposure by matching balance sheet, and revenue and expense items in the relevant currency.
ALFA GROUP Notes to the consolidated financial statements for the year ended December
(Expressed in thousand US dollars for presentational purposes only – see Note )
At period end, the Group had balances in US dollars, Russian Roubles, EURO and other currencies as follows:
OtherRUR USD EURO currencies Total
Property, plant and equipment . . . . . . . . . . . . . . . . . . . . . . . . 252,432 - - 15,923 268,355
Investments available for sale . . . . . . . . . . . . . . . . . . . . . . . . . . 46,741 119,862 - 828 167,431
Investments in joint ventures . . . . . . . . . . . . . . . . . . . . . . . . . . 1,653,192 - - - 1,653,192
Investments in associates . . . . . . . . . . . . . . . . . . . . . . . . . . . . . 244,460 - - - 244,460
Due from banks . . . . . . . . . . . . . . . . . . . . . . . . . . . . . . . . . . . . . 11,685 98,653 12,527 1,492 124,357
Loans and advances to customers . . . . . . . . . . . . . . . . . . . . . . 395,994 781,687 27,674 9,704 1,215,059
Income tax . . . . . . . . . . . . . . . . . . . . . . . . . . . . . . . . . . . . . . . . . 2,497 - - - 2,497
Goodwill, net . . . . . . . . . . . . . . . . . . . . . . . . . . . . . . . . . . . . . . . (613) - - - (613)
Inventories . . . . . . . . . . . . . . . . . . . . . . . . . . . . . . . . . . . . . . . . . 28,441 66,309 - 4,024 98,774
Trading securities . . . . . . . . . . . . . . . . . . . . . . . . . . . . . . . . . . . 51,523 103,173 - 1,977 156,673
Trade and other receivables . . . . . . . . . . . . . . . . . . . . . . . . . . . 67,375 339,116 7,329 35,378 449,198
Cash and cash equivalents . . . . . . . . . . . . . . . . . . . . . . . . . . . . 401,014 246,226 39,076 23,366 709,682
Total assets . . . . . . . . . . . . . . . . . . . . . . . . . . . . . . . . . . . . . . . . . 3,154,741 1,755,026 86,606 92,692 5,089,065
Borrowings . . . . . . . . . . . . . . . . . . . . . . . . . . . . . . . . . . . . . . . . . 168,959 536,200 6,902 4,572 716,633
Amount owed to depositors . . . . . . . . . . . . . . . . . . . . . . . . . . . 614,551 665,464 24,378 16,584 1,320,977
Due to banks . . . . . . . . . . . . . . . . . . . . . . . . . . . . . . . . . . . . . . . . 141,958 182,452 13,418 2,449 340,277
Accounts payable and provisions . . . . . . . . . . . . . . . . . . . . . . . 98,796 414,116 23,264 14,149 550,325
Income tax . . . . . . . . . . . . . . . . . . . . . . . . . . . . . . . . . . . . . . . . . 17,530 506 - 14,536 32,572
Total liabilities . . . . . . . . . . . . . . . . . . . . . . . . . . . . . . . . . . . . . 1,041,794 1,798,738 67,962 52,290 2,960,784
Net currency position at 31 December 2001 . . . . . . . . . . . . 2,112,947 (43,712) 18,644 40,402 2,128,281
32. COMMITMENTS AND DERIVATIVE FINANCIAL INSTRUMENTS
Capital commitmentsAs at December the Group had capital commitments in respect of new computer systems totalling USD , thousand(: USD , thousand).
Contractual commitmentsUnder the terms of the transaction with Vimpel-Communications, the Group has a commitment to invest an amount of USD, thousand of equity directly into ZAO VimpelCom-Region in two equal tranches, in November and November .

ALFA GROUP Notes to the consolidated financial statements for the year ended December
(Expressed in thousand US dollars for presentational purposes only – see Note )
Credit related commitments
Restated
Letters of credit . . . . . . . . . . . . . . . . . . . . . . . . . . . . . . . . . . . . . . . . . . . . . . . . . . . . . . . . . . . . . . . . . . . . . . . . . . . . . . 263,577 243,269
Letters of indemnity . . . . . . . . . . . . . . . . . . . . . . . . . . . . . . . . . . . . . . . . . . . . . . . . . . . . . . . . . . . . . . . . . . . . . . . . . . 213,322 416,462
Guarantees issued . . . . . . . . . . . . . . . . . . . . . . . . . . . . . . . . . . . . . . . . . . . . . . . . . . . . . . . . . . . . . . . . . . . . . . . . . . . . 739,477 249,239
1,216,376 908,970
The total outstanding contractual amount of guarantees, letters of credit, and letters of indemnity does not necessarily representfuture cash requirements, as they may expire or terminate without being funded.
Management evaluated the likelihood of possible losses arising from credit related commitments and concluded that a provisionof USD , thousand (Note ) was necessary as at December (: USD , thousand).
Letters of CreditCommitments under letters of credit at December in the amount of USD , thousand (: USD , thousand)mainly relate to the purchase of crude oil, oil products and metals from major international commodity companies and additionalstandby letters of credit and letters of guarantee opened in favour of counterparties providing derivatives (refer to Note ). Alsoincluded in letters of credit are export letters of credit in the amount of USD , thousand (: USD , thousand) inwhich the Group bears no risk. Import letters of credit in the amount of USD , thousand (: USD , thousand) areusually fully collateralised and accordingly the Group assumes minimal risk.
Letters of IndemnityLetters of indemnity in the amount of USD , thousand (: USD , thousand) have been issued with respect to salesof crude oil, oil products and metals, and also to the pre-financing of crude oil, oil products and metal purchases. Managementdoes not consider that any losses will be incurred in respect of these indemnities and accordingly no provision has been establishedagainst the contingencies as at December .
Guarantees IssuedIn May Alfa Bank entered into a performance guarantee in which it partially guaranteed TNK's payment of USD ,thousand in respect of TNK's acquisition of .% of Sidanco. In August Alfa Bank entered into an additional performanceguarantee in which it partially guaranteed TNK's payment of USD , thousand in respect of TNK's acquisition of % ofSidanco (Refer to Note ). Both performance guarantees are made jointly and severally with other related parties and themaximum liability of the Group is limited to an aggregate calculated RR amount equivalent to % of Alfa Bank's statutory capital(two separate guarantees, each equivalent to % of Alfa Bank's statutory capital on each transaction). At December , %of Alfa Bank's statutory capital amounted to approximately USD , thousand and this amount is included within guaranteesissued at December . All payments in respect of the acquisition of % of Sidanco were completed by TNK by the end ofFebruary and the guarantee related to this transaction was terminated.
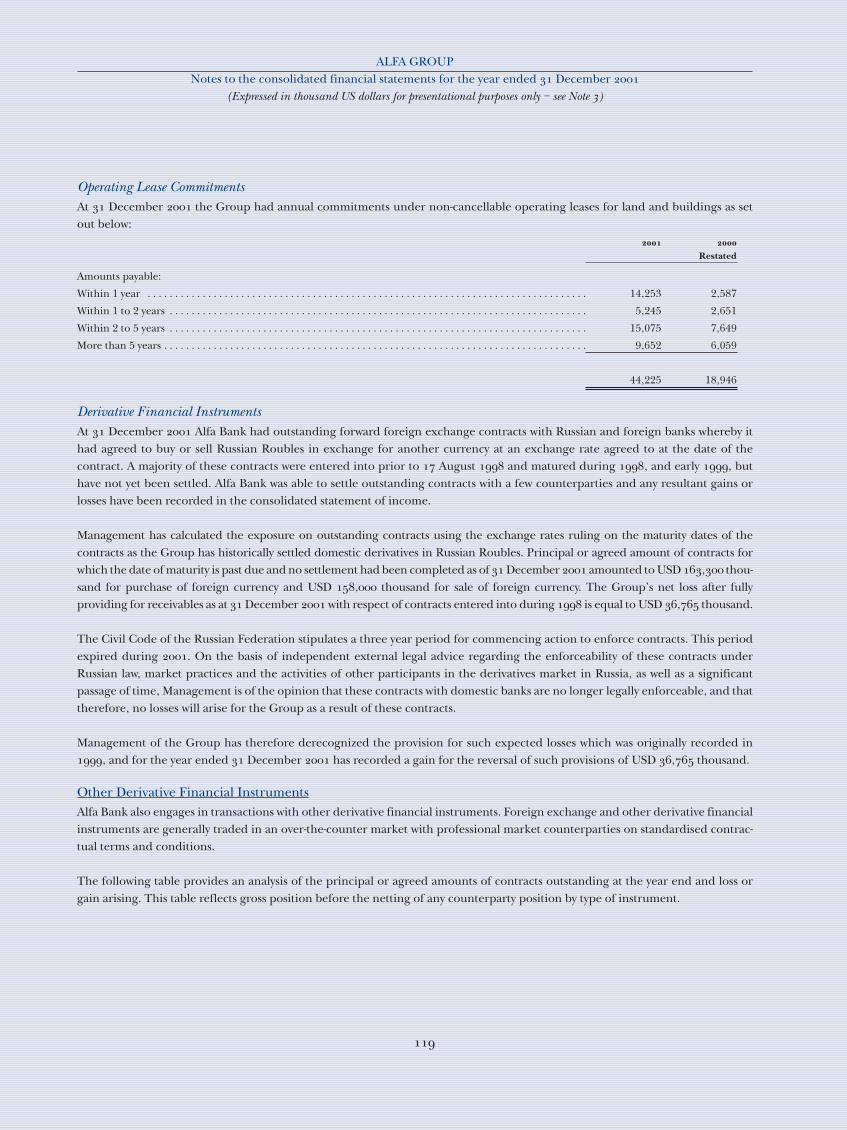
ALFA GROUP Notes to the consolidated financial statements for the year ended December
(Expressed in thousand US dollars for presentational purposes only – see Note )
Operating Lease CommitmentsAt December the Group had annual commitments under non-cancellable operating leases for land and buildings as setout below:
Restated
Amounts payable:
Within 1 year . . . . . . . . . . . . . . . . . . . . . . . . . . . . . . . . . . . . . . . . . . . . . . . . . . . . . . . . . . . . . . . . . . . . . . . . . . . . . . . . 14,253 2,587
Within 1 to 2 years . . . . . . . . . . . . . . . . . . . . . . . . . . . . . . . . . . . . . . . . . . . . . . . . . . . . . . . . . . . . . . . . . . . . . . . . . . . . 5,245 2,651
Within 2 to 5 years . . . . . . . . . . . . . . . . . . . . . . . . . . . . . . . . . . . . . . . . . . . . . . . . . . . . . . . . . . . . . . . . . . . . . . . . . . . . 15,075 7,649
More than 5 years . . . . . . . . . . . . . . . . . . . . . . . . . . . . . . . . . . . . . . . . . . . . . . . . . . . . . . . . . . . . . . . . . . . . . . . . . . . . . 9,652 6,059
44,225 18,946
Derivative Financial InstrumentsAt December Alfa Bank had outstanding forward foreign exchange contracts with Russian and foreign banks whereby ithad agreed to buy or sell Russian Roubles in exchange for another currency at an exchange rate agreed to at the date of thecontract. A majority of these contracts were entered into prior to August and matured during , and early , buthave not yet been settled. Alfa Bank was able to settle outstanding contracts with a few counterparties and any resultant gains orlosses have been recorded in the consolidated statement of income.
Management has calculated the exposure on outstanding contracts using the exchange rates ruling on the maturity dates of thecontracts as the Group has historically settled domestic derivatives in Russian Roubles. Principal or agreed amount of contracts forwhich the date of maturity is past due and no settlement had been completed as of December amounted to USD , thou-sand for purchase of foreign currency and USD , thousand for sale of foreign currency. The Group’s net loss after fullyproviding for receivables as at December with respect of contracts entered into during is equal to USD , thousand.
The Civil Code of the Russian Federation stipulates a three year period for commencing action to enforce contracts. This periodexpired during . On the basis of independent external legal advice regarding the enforceability of these contracts underRussian law, market practices and the activities of other participants in the derivatives market in Russia, as well as a significantpassage of time, Management is of the opinion that these contracts with domestic banks are no longer legally enforceable, and thattherefore, no losses will arise for the Group as a result of these contracts.
Management of the Group has therefore derecognized the provision for such expected losses which was originally recorded in, and for the year ended December has recorded a gain for the reversal of such provisions of USD , thousand.
Other Derivative Financial InstrumentsAlfa Bank also engages in transactions with other derivative financial instruments. Foreign exchange and other derivative financialinstruments are generally traded in an over-the-counter market with professional market counterparties on standardised contrac-tual terms and conditions.
The following table provides an analysis of the principal or agreed amounts of contracts outstanding at the year end and loss orgain arising. This table reflects gross position before the netting of any counterparty position by type of instrument.
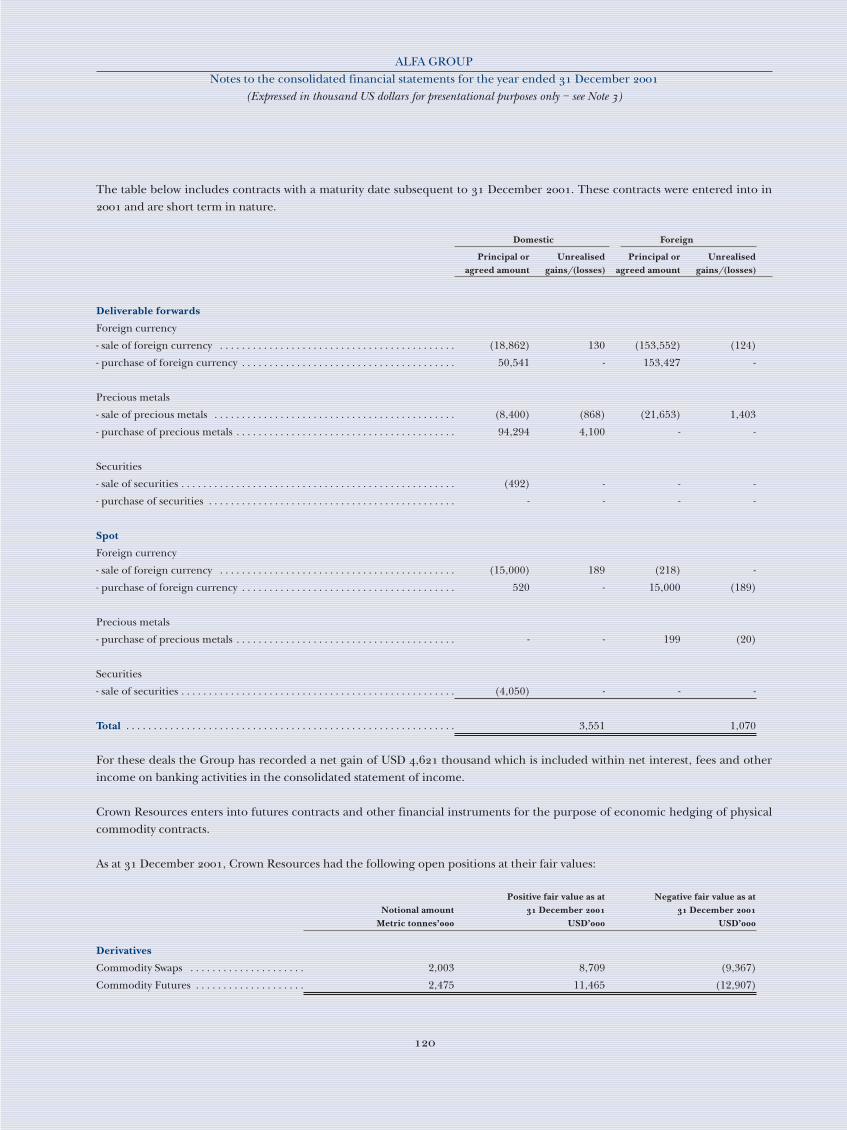
ALFA GROUP Notes to the consolidated financial statements for the year ended December
(Expressed in thousand US dollars for presentational purposes only – see Note )
The table below includes contracts with a maturity date subsequent to December . These contracts were entered into in and are short term in nature.
Domestic Foreign
Principal or Unrealised Principal or Unrealisedagreed amount gains/(losses) agreed amount gains/(losses)
Deliverable forwards
Foreign currency
- sale of foreign currency . . . . . . . . . . . . . . . . . . . . . . . . . . . . . . . . . . . . . . . . . . . (18,862) 130 (153,552) (124)
- purchase of foreign currency . . . . . . . . . . . . . . . . . . . . . . . . . . . . . . . . . . . . . . . 50,541 - 153,427 -
Precious metals
- sale of precious metals . . . . . . . . . . . . . . . . . . . . . . . . . . . . . . . . . . . . . . . . . . . . (8,400) (868) (21,653) 1,403
- purchase of precious metals . . . . . . . . . . . . . . . . . . . . . . . . . . . . . . . . . . . . . . . . 94,294 4,100 - -
Securities
- sale of securities . . . . . . . . . . . . . . . . . . . . . . . . . . . . . . . . . . . . . . . . . . . . . . . . . . (492) - - -
- purchase of securities . . . . . . . . . . . . . . . . . . . . . . . . . . . . . . . . . . . . . . . . . . . . . - - - -
Spot
Foreign currency
- sale of foreign currency . . . . . . . . . . . . . . . . . . . . . . . . . . . . . . . . . . . . . . . . . . . (15,000) 189 (218) -
- purchase of foreign currency . . . . . . . . . . . . . . . . . . . . . . . . . . . . . . . . . . . . . . . 520 - 15,000 (189)
Precious metals
- purchase of precious metals . . . . . . . . . . . . . . . . . . . . . . . . . . . . . . . . . . . . . . . . - - 199 (20)
Securities
- sale of securities . . . . . . . . . . . . . . . . . . . . . . . . . . . . . . . . . . . . . . . . . . . . . . . . . . (4,050) - - -
Total . . . . . . . . . . . . . . . . . . . . . . . . . . . . . . . . . . . . . . . . . . . . . . . . . . . . . . . . . . . . 3,551 1,070
For these deals the Group has recorded a net gain of USD , thousand which is included within net interest, fees and otherincome on banking activities in the consolidated statement of income.
Crown Resources enters into futures contracts and other financial instruments for the purpose of economic hedging of physicalcommodity contracts.
As at December , Crown Resources had the following open positions at their fair values:
Positive fair value as at Negative fair value as atNotional amount December December
Metric tonnes’ USD’ USD’
Derivatives
Commodity Swaps . . . . . . . . . . . . . . . . . . . . . 2,003 8,709 (9,367)
Commodity Futures . . . . . . . . . . . . . . . . . . . . 2,475 11,465 (12,907)
ALFA GROUP Notes to the consolidated financial statements for the year ended December
(Expressed in thousand US dollars for presentational purposes only – see Note )
All of the above derivative contracts have maturities ranging from January to January .
33. CONTINGENT LIABILITIES
Legal proceedingsFrom time to time and in the normal course of business, claims against the Group are received from customers and other parties.Management is of the opinion that no material unaccrued losses will be incurred and accordingly no provision has been made inthese consolidated financial statements.
In February Norex Petroleum Limited, a Cypriot company, filed a lawsuit against various entities of Alfa Group and certainother defendants in the United States District Court for the Southern District of New York over the ownership of a company whichis currently owned within the TNK Industrial structure. The Group believes that it has substantial defenses to jurisdiction andvenue in the United States, and it intends to file a comprehensive motion to dismiss the complaint. Management believes that theallegations in the complaint are without merit and intends to vigorously defend this action.
Taxation Russian tax legislation is subject to varying interpretations and constant changes, which may be retroactive. Further, the interpre-tation of tax legislation by tax authorities as applied to the transactions and activity of the Group may not coincide with that ofManagement. As a result, transactions may be challenged by tax authorities and the Group may be assessed additional taxes, penal-ties and interest, which can be significant.
Current Russian tax legislation is principally based on the formal manner in which transactions are documented and the under-lying accounting treatment as prescribed by Russian Accounting Rules. Accordingly, there are opportunities for companies tostructure transactions so as to take advantage of opportunities in the Russian tax legislation to restructure income and expenses inorder to reduce the overall effective tax rate. The consolidated statement of income as presented in these consolidated financialstatements includes reclassifications to reflect the underlying economic substance of those transactions. The effect of these reclas-sifications does not have an effect on the Group’s profit before taxation or the tax charge recognised in these consolidated finan-cial statements.
In addition, transfer pricing legislation, which was introduced from January in Russia, provides the possibility for taxauthorities to make transfer pricing adjustments and impose additional tax liabilities in respect to all controlled transactions,provided that the transaction price differs from the market price by more than %. Controlled transactions include transactionswith related parties, and transactions with unrelated parties if the price differs on similar transactions with two different counter-parties by more than %. There is currently no formal guidance as to how these rules should be applied in practice.
Management regularly reviews the Group’s taxation compliance with applicable legislation, laws and decrees and current inter-pretations published by the authorities in the various jurisdictions in which the Group has operations. From time to time poten-tial exposures are identified and at any point in time a number of open matters may exist. Management believes that adequateprovision has been made for all material liabilities. Tax years remain open to review by the Russian tax authorities for three yearsand up to six years in other jurisdictions.
InsuranceThe Group is subject to political, legislative, fiscal and regulatory developments and risks, which are not covered by insurance. Noprovisions for self-insurance are included in these consolidated financial statements and the occurrence of significant losses andimpairments associated with facilities could have a material effect on the Group’s operations.
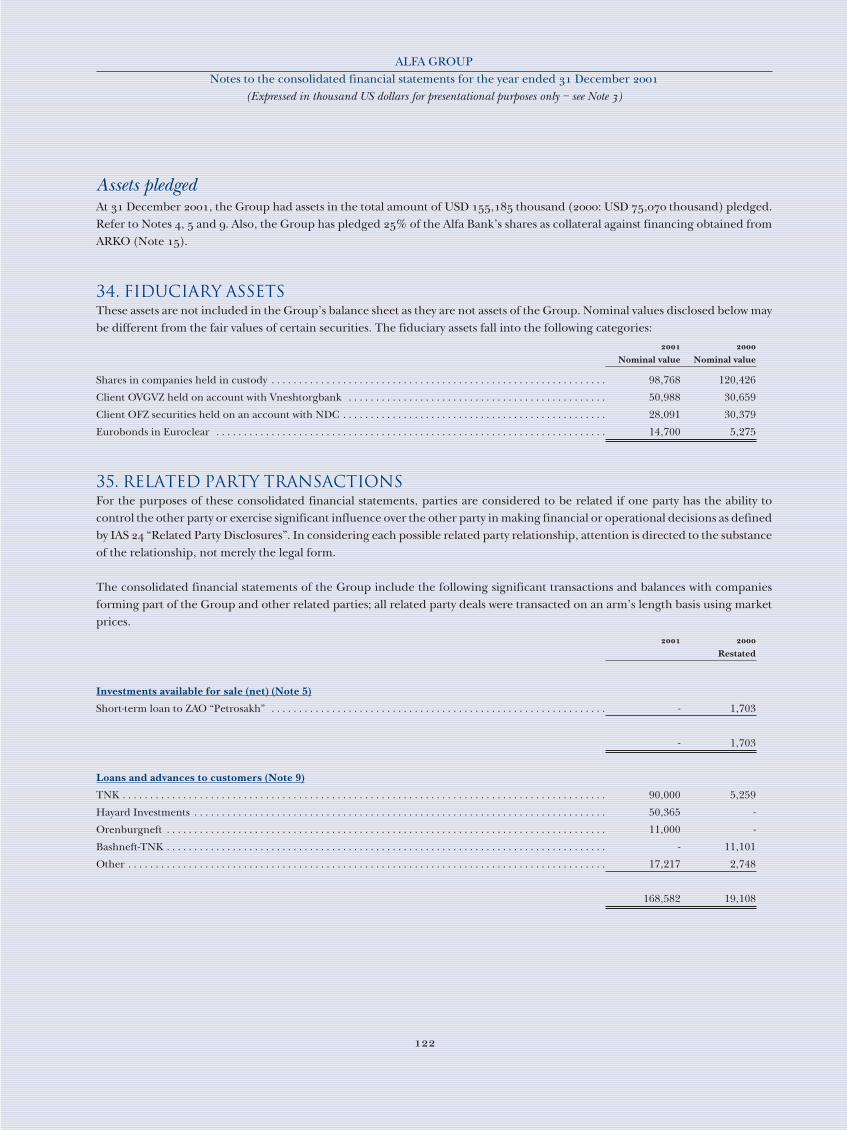
ALFA GROUP Notes to the consolidated financial statements for the year ended December
(Expressed in thousand US dollars for presentational purposes only – see Note )
Assets pledged At December , the Group had assets in the total amount of USD , thousand (: USD , thousand) pledged.Refer to Notes , and . Also, the Group has pledged % of the Alfa Bank’s shares as collateral against financing obtained fromARKO (Note ).
34. FIDUCIARY ASSETSThese assets are not included in the Group’s balance sheet as they are not assets of the Group. Nominal values disclosed below maybe different from the fair values of certain securities. The fiduciary assets fall into the following categories:
Nominal value Nominal value
Shares in companies held in custody . . . . . . . . . . . . . . . . . . . . . . . . . . . . . . . . . . . . . . . . . . . . . . . . . . . . . . . . . . . . . 98,768 120,426
Client OVGVZ held on account with Vneshtorgbank . . . . . . . . . . . . . . . . . . . . . . . . . . . . . . . . . . . . . . . . . . . . . . . 50,988 30,659
Client OFZ securities held on an account with NDC . . . . . . . . . . . . . . . . . . . . . . . . . . . . . . . . . . . . . . . . . . . . . . . . 28,091 30,379
Eurobonds in Euroclear . . . . . . . . . . . . . . . . . . . . . . . . . . . . . . . . . . . . . . . . . . . . . . . . . . . . . . . . . . . . . . . . . . . . . . . 14,700 5,275
35. RELATED PARTY TRANSACTIONS For the purposes of these consolidated financial statements, parties are considered to be related if one party has the ability tocontrol the other party or exercise significant influence over the other party in making financial or operational decisions as definedby IAS “Related Party Disclosures”. In considering each possible related party relationship, attention is directed to the substanceof the relationship, not merely the legal form.
The consolidated financial statements of the Group include the following significant transactions and balances with companiesforming part of the Group and other related parties; all related party deals were transacted on an arm’s length basis using marketprices.
Restated
Investments available for sale (net) (Note 5)
Short-term loan to ZAO “Petrosakh” . . . . . . . . . . . . . . . . . . . . . . . . . . . . . . . . . . . . . . . . . . . . . . . . . . . . . . . . . . . . . - 1,703
- 1,703
Loans and advances to customers (Note 9)
TNK . . . . . . . . . . . . . . . . . . . . . . . . . . . . . . . . . . . . . . . . . . . . . . . . . . . . . . . . . . . . . . . . . . . . . . . . . . . . . . . . . . . . . . . . 90,000 5,259
Hayard Investments . . . . . . . . . . . . . . . . . . . . . . . . . . . . . . . . . . . . . . . . . . . . . . . . . . . . . . . . . . . . . . . . . . . . . . . . . . . 50,365 -
Orenburgneft . . . . . . . . . . . . . . . . . . . . . . . . . . . . . . . . . . . . . . . . . . . . . . . . . . . . . . . . . . . . . . . . . . . . . . . . . . . . . . . . 11,000 -
Bashneft-TNK . . . . . . . . . . . . . . . . . . . . . . . . . . . . . . . . . . . . . . . . . . . . . . . . . . . . . . . . . . . . . . . . . . . . . . . . . . . . . . . . - 11,101
Other . . . . . . . . . . . . . . . . . . . . . . . . . . . . . . . . . . . . . . . . . . . . . . . . . . . . . . . . . . . . . . . . . . . . . . . . . . . . . . . . . . . . . . . 17,217 2,748
168,582 19,108
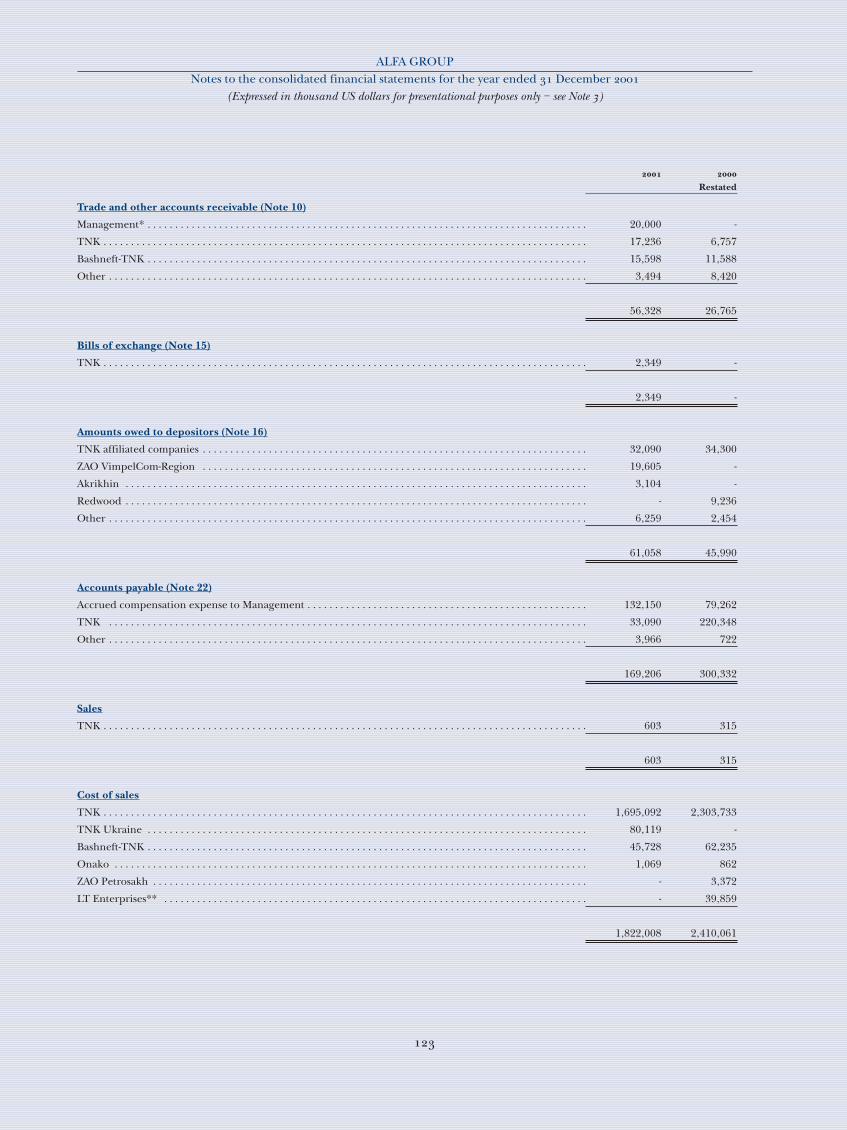
ALFA GROUP Notes to the consolidated financial statements for the year ended December
(Expressed in thousand US dollars for presentational purposes only – see Note )
Restated
Trade and other accounts receivable (Note 10)
Management* . . . . . . . . . . . . . . . . . . . . . . . . . . . . . . . . . . . . . . . . . . . . . . . . . . . . . . . . . . . . . . . . . . . . . . . . . . . . . . . . 20,000 -
TNK . . . . . . . . . . . . . . . . . . . . . . . . . . . . . . . . . . . . . . . . . . . . . . . . . . . . . . . . . . . . . . . . . . . . . . . . . . . . . . . . . . . . . . . . 17,236 6,757
Bashneft-TNK . . . . . . . . . . . . . . . . . . . . . . . . . . . . . . . . . . . . . . . . . . . . . . . . . . . . . . . . . . . . . . . . . . . . . . . . . . . . . . . . 15,598 11,588
Other . . . . . . . . . . . . . . . . . . . . . . . . . . . . . . . . . . . . . . . . . . . . . . . . . . . . . . . . . . . . . . . . . . . . . . . . . . . . . . . . . . . . . . . 3,494 8,420
56,328 26,765
Bills of exchange (Note 15)
TNK . . . . . . . . . . . . . . . . . . . . . . . . . . . . . . . . . . . . . . . . . . . . . . . . . . . . . . . . . . . . . . . . . . . . . . . . . . . . . . . . . . . . . . . . 2,349 -
2,349 -
Amounts owed to depositors (Note 16)
TNK affiliated companies . . . . . . . . . . . . . . . . . . . . . . . . . . . . . . . . . . . . . . . . . . . . . . . . . . . . . . . . . . . . . . . . . . . . . . 32,090 34,300
ZAO VimpelCom-Region . . . . . . . . . . . . . . . . . . . . . . . . . . . . . . . . . . . . . . . . . . . . . . . . . . . . . . . . . . . . . . . . . . . . . . 19,605 -
Akrikhin . . . . . . . . . . . . . . . . . . . . . . . . . . . . . . . . . . . . . . . . . . . . . . . . . . . . . . . . . . . . . . . . . . . . . . . . . . . . . . . . . . . . 3,104 -
Redwood . . . . . . . . . . . . . . . . . . . . . . . . . . . . . . . . . . . . . . . . . . . . . . . . . . . . . . . . . . . . . . . . . . . . . . . . . . . . . . . . . . . . - 9,236
Other . . . . . . . . . . . . . . . . . . . . . . . . . . . . . . . . . . . . . . . . . . . . . . . . . . . . . . . . . . . . . . . . . . . . . . . . . . . . . . . . . . . . . . . 6,259 2,454
61,058 45,990
Accounts payable (Note 22)
Accrued compensation expense to Management . . . . . . . . . . . . . . . . . . . . . . . . . . . . . . . . . . . . . . . . . . . . . . . . . . . 132,150 79,262
TNK . . . . . . . . . . . . . . . . . . . . . . . . . . . . . . . . . . . . . . . . . . . . . . . . . . . . . . . . . . . . . . . . . . . . . . . . . . . . . . . . . . . . . . . 33,090 220,348
Other . . . . . . . . . . . . . . . . . . . . . . . . . . . . . . . . . . . . . . . . . . . . . . . . . . . . . . . . . . . . . . . . . . . . . . . . . . . . . . . . . . . . . . . 3,966 722
169,206 300,332
Sales
TNK . . . . . . . . . . . . . . . . . . . . . . . . . . . . . . . . . . . . . . . . . . . . . . . . . . . . . . . . . . . . . . . . . . . . . . . . . . . . . . . . . . . . . . . . 603 315
603 315
Cost of sales
TNK . . . . . . . . . . . . . . . . . . . . . . . . . . . . . . . . . . . . . . . . . . . . . . . . . . . . . . . . . . . . . . . . . . . . . . . . . . . . . . . . . . . . . . . . 1,695,092 2,303,733
TNK Ukraine . . . . . . . . . . . . . . . . . . . . . . . . . . . . . . . . . . . . . . . . . . . . . . . . . . . . . . . . . . . . . . . . . . . . . . . . . . . . . . . . 80,119 -
Bashneft-TNK . . . . . . . . . . . . . . . . . . . . . . . . . . . . . . . . . . . . . . . . . . . . . . . . . . . . . . . . . . . . . . . . . . . . . . . . . . . . . . . . 45,728 62,235
Onako . . . . . . . . . . . . . . . . . . . . . . . . . . . . . . . . . . . . . . . . . . . . . . . . . . . . . . . . . . . . . . . . . . . . . . . . . . . . . . . . . . . . . . 1,069 862
ZAO Petrosakh . . . . . . . . . . . . . . . . . . . . . . . . . . . . . . . . . . . . . . . . . . . . . . . . . . . . . . . . . . . . . . . . . . . . . . . . . . . . . . . - 3,372
LT Enterprises** . . . . . . . . . . . . . . . . . . . . . . . . . . . . . . . . . . . . . . . . . . . . . . . . . . . . . . . . . . . . . . . . . . . . . . . . . . . . . - 39,859
1,822,008 2,410,061
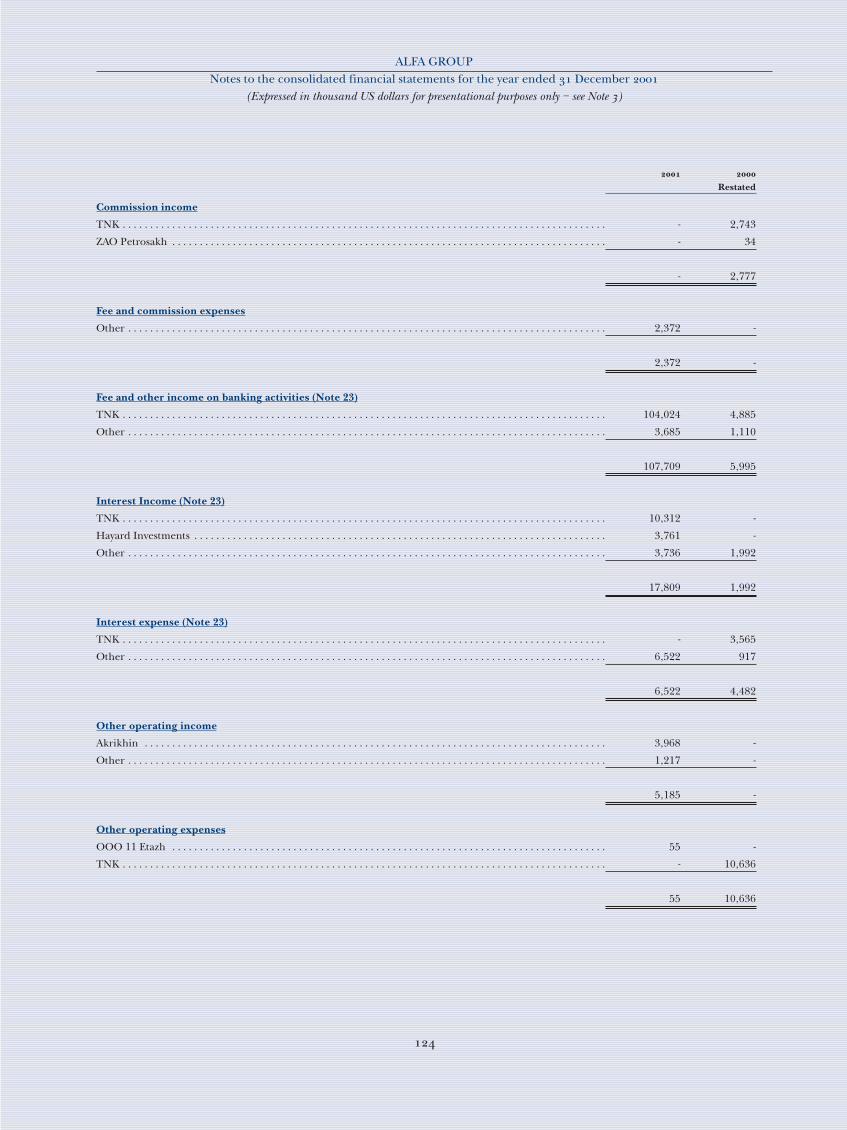
ALFA GROUP Notes to the consolidated financial statements for the year ended December
(Expressed in thousand US dollars for presentational purposes only – see Note )
Restated
Commission income
TNK . . . . . . . . . . . . . . . . . . . . . . . . . . . . . . . . . . . . . . . . . . . . . . . . . . . . . . . . . . . . . . . . . . . . . . . . . . . . . . . . . . . . . . . . - 2,743
ZAO Petrosakh . . . . . . . . . . . . . . . . . . . . . . . . . . . . . . . . . . . . . . . . . . . . . . . . . . . . . . . . . . . . . . . . . . . . . . . . . . . . . . . - 34
- 2,777
Fee and commission expenses
Other . . . . . . . . . . . . . . . . . . . . . . . . . . . . . . . . . . . . . . . . . . . . . . . . . . . . . . . . . . . . . . . . . . . . . . . . . . . . . . . . . . . . . . . 2,372 -
2,372 -
Fee and other income on banking activities (Note 23)
TNK . . . . . . . . . . . . . . . . . . . . . . . . . . . . . . . . . . . . . . . . . . . . . . . . . . . . . . . . . . . . . . . . . . . . . . . . . . . . . . . . . . . . . . . . 104,024 4,885
Other . . . . . . . . . . . . . . . . . . . . . . . . . . . . . . . . . . . . . . . . . . . . . . . . . . . . . . . . . . . . . . . . . . . . . . . . . . . . . . . . . . . . . . . 3,685 1,110
107,709 5,995
Interest Income (Note 23)
TNK . . . . . . . . . . . . . . . . . . . . . . . . . . . . . . . . . . . . . . . . . . . . . . . . . . . . . . . . . . . . . . . . . . . . . . . . . . . . . . . . . . . . . . . . 10,312 -
Hayard Investments . . . . . . . . . . . . . . . . . . . . . . . . . . . . . . . . . . . . . . . . . . . . . . . . . . . . . . . . . . . . . . . . . . . . . . . . . . . 3,761 -
Other . . . . . . . . . . . . . . . . . . . . . . . . . . . . . . . . . . . . . . . . . . . . . . . . . . . . . . . . . . . . . . . . . . . . . . . . . . . . . . . . . . . . . . . 3,736 1,992
17,809 1,992
Interest expense (Note 23)
TNK . . . . . . . . . . . . . . . . . . . . . . . . . . . . . . . . . . . . . . . . . . . . . . . . . . . . . . . . . . . . . . . . . . . . . . . . . . . . . . . . . . . . . . . . - 3,565
Other . . . . . . . . . . . . . . . . . . . . . . . . . . . . . . . . . . . . . . . . . . . . . . . . . . . . . . . . . . . . . . . . . . . . . . . . . . . . . . . . . . . . . . . 6,522 917
6,522 4,482
Other operating income
Akrikhin . . . . . . . . . . . . . . . . . . . . . . . . . . . . . . . . . . . . . . . . . . . . . . . . . . . . . . . . . . . . . . . . . . . . . . . . . . . . . . . . . . . . 3,968 -
Other . . . . . . . . . . . . . . . . . . . . . . . . . . . . . . . . . . . . . . . . . . . . . . . . . . . . . . . . . . . . . . . . . . . . . . . . . . . . . . . . . . . . . . . 1,217 -
5,185 -
Other operating expenses
OOO 11 Etazh . . . . . . . . . . . . . . . . . . . . . . . . . . . . . . . . . . . . . . . . . . . . . . . . . . . . . . . . . . . . . . . . . . . . . . . . . . . . . . . 55 -
TNK . . . . . . . . . . . . . . . . . . . . . . . . . . . . . . . . . . . . . . . . . . . . . . . . . . . . . . . . . . . . . . . . . . . . . . . . . . . . . . . . . . . . . . . . - 10,636
55 10,636

ALFA GROUP Notes to the consolidated financial statements for the year ended December
(Expressed in thousand US dollars for presentational purposes only – see Note )
Restated
Letters of credit issued
TNK . . . . . . . . . . . . . . . . . . . . . . . . . . . . . . . . . . . . . . . . . . . . . . . . . . . . . . . . . . . . . . . . . . . . . . . . . . . . . . . . . . . . . . . . 1,226 455
TNK Nizhnevartovsk . . . . . . . . . . . . . . . . . . . . . . . . . . . . . . . . . . . . . . . . . . . . . . . . . . . . . . . . . . . . . . . . . . . . . . . . . . - 3,936
1,226 4,391
Guarantees
Alfa-Leasing . . . . . . . . . . . . . . . . . . . . . . . . . . . . . . . . . . . . . . . . . . . . . . . . . . . . . . . . . . . . . . . . . . . . . . . . . . . . . . . . . - 2,148
TNK . . . . . . . . . . . . . . . . . . . . . . . . . . . . . . . . . . . . . . . . . . . . . . . . . . . . . . . . . . . . . . . . . . . . . . . . . . . . . . . . . . . . . . . . 369,696 517
Hayard Investments . . . . . . . . . . . . . . . . . . . . . . . . . . . . . . . . . . . . . . . . . . . . . . . . . . . . . . . . . . . . . . . . . . . . . . . . . . . 41,880 -
Siracuse . . . . . . . . . . . . . . . . . . . . . . . . . . . . . . . . . . . . . . . . . . . . . . . . . . . . . . . . . . . . . . . . . . . . . . . . . . . . . . . . . . . . . 8,525 -
Akrikhin . . . . . . . . . . . . . . . . . . . . . . . . . . . . . . . . . . . . . . . . . . . . . . . . . . . . . . . . . . . . . . . . . . . . . . . . . . . . . . . . . . . . 248 -
420,349 2,665
* A short-term loan bearing interest at % was granted in to key management personnel of Alfa Bank.
** In , as part of the oil purchases from TNK, the Group was required to pay a fixed rate per ton commission to related par-ties of the Group. This amount is included within cost of sales in the consolidated statement of income.
The remuneration of Directors and key management personnel, including pension contributions, and discretionary compensa-tion amounts to USD , thousand (: USD , thousand) and is included in general and administrative expenses. Inaddition, during an amount of USD , thousand (: USD , thousand) has been accrued in respect of manage-ment option compensation plans (refer to Notes and ).
36. PRINCIPAL SUBSIDIARY, ASSOCIATE AND JOINT VENTURE UNDERTAKINGS
Country of incorporation ShareFinancial Services
Alfa Finance Holdings S.A. . . . . . . . . . . . . . . . . . . . . . . . . . . . . . . . . . . . . . . . . . . . . . . . . . . . . . . . . . . . . . . . . . . . . . Luxemburg 81.36%
Alfa Bank Holdings Ltd. . . . . . . . . . . . . . . . . . . . . . . . . . . . . . . . . . . . . . . . . . . . . . . . . . . . . . . . . . . . . . . . . . . . . . . . BVI 81.36%
OAO Alfa Bank . . . . . . . . . . . . . . . . . . . . . . . . . . . . . . . . . . . . . . . . . . . . . . . . . . . . . . . . . . . . . . . . . . . . . . . . . . . . . . Russia 81.36%
Alfa Capital Investments Ltd. . . . . . . . . . . . . . . . . . . . . . . . . . . . . . . . . . . . . . . . . . . . . . . . . . . . . . . . . . . . . . . . . . . . BVI 81.36%
International Commodities
Crown Resources AG. . . . . . . . . . . . . . . . . . . . . . . . . . . . . . . . . . . . . . . . . . . . . . . . . . . . . . . . . . . . . . . . . . . . . . . . . . Switzerland 100%
Crown Commodities Ltd. . . . . . . . . . . . . . . . . . . . . . . . . . . . . . . . . . . . . . . . . . . . . . . . . . . . . . . . . . . . . . . . . . . . . . . UK 100%
Crown Trade Ltd. . . . . . . . . . . . . . . . . . . . . . . . . . . . . . . . . . . . . . . . . . . . . . . . . . . . . . . . . . . . . . . . . . . . . . . . . . . . . . Isle of Man 100%
Russia, CIS and Southeast Asia Commodities
Eco Holdings Ltd. . . . . . . . . . . . . . . . . . . . . . . . . . . . . . . . . . . . . . . . . . . . . . . . . . . . . . . . . . . . . . . . . . . . . . . . . . . . . Gibraltar 100%
OOO Alfa Eco . . . . . . . . . . . . . . . . . . . . . . . . . . . . . . . . . . . . . . . . . . . . . . . . . . . . . . . . . . . . . . . . . . . . . . . . . . . . . . . Russia 99.99%
OOO Alfa Eco M . . . . . . . . . . . . . . . . . . . . . . . . . . . . . . . . . . . . . . . . . . . . . . . . . . . . . . . . . . . . . . . . . . . . . . . . . . . . . Russia 100%
Westvector Ltd. . . . . . . . . . . . . . . . . . . . . . . . . . . . . . . . . . . . . . . . . . . . . . . . . . . . . . . . . . . . . . . . . . . . . . . . . . . . . . . . BVI 100%

ALFA GROUP Notes to the consolidated financial statements for the year ended December
(Expressed in thousand US dollars for presentational purposes only – see Note )
ZAO Petrosakh . . . . . . . . . . . . . . . . . . . . . . . . . . . . . . . . . . . . . . . . . . . . . . . . . . . . . . . . . . . . . . . . . . . . . . . . . . . . . . . Russia 95%
OAO Volga . . . . . . . . . . . . . . . . . . . . . . . . . . . . . . . . . . . . . . . . . . . . . . . . . . . . . . . . . . . . . . . . . . . . . . . . . . . . . . . . . . Russia 46.49%
Retail Trade
ZAO TD Perekriostok . . . . . . . . . . . . . . . . . . . . . . . . . . . . . . . . . . . . . . . . . . . . . . . . . . . . . . . . . . . . . . . . . . . . . . . . . Russia 82.82%
OOO Perekriostok 2000 . . . . . . . . . . . . . . . . . . . . . . . . . . . . . . . . . . . . . . . . . . . . . . . . . . . . . . . . . . . . . . . . . . . . . . . Russia 82.82%
Perekriostok Holdings Ltd. . . . . . . . . . . . . . . . . . . . . . . . . . . . . . . . . . . . . . . . . . . . . . . . . . . . . . . . . . . . . . . . . . . . . . Gibraltar 82.82%
Food Processing
AC United Food Company Limited . . . . . . . . . . . . . . . . . . . . . . . . . . . . . . . . . . . . . . . . . . . . . . . . . . . . . . . . . . . . . . Cyprus 75%
Kubansugar Holdings Ltd. . . . . . . . . . . . . . . . . . . . . . . . . . . . . . . . . . . . . . . . . . . . . . . . . . . . . . . . . . . . . . . . . . . . . . Gibraltar 100%
Agrosugar Holdings Ltd. . . . . . . . . . . . . . . . . . . . . . . . . . . . . . . . . . . . . . . . . . . . . . . . . . . . . . . . . . . . . . . . . . . . . . . . Gibraltar 100%
ZAO Ob’yedenyonnaya Prodovolstvennaya Kompania . . . . . . . . . . . . . . . . . . . . . . . . . . . . . . . . . . . . . . . . . . . . . . Russia 75%
Crown Tea Holdings Ltd. . . . . . . . . . . . . . . . . . . . . . . . . . . . . . . . . . . . . . . . . . . . . . . . . . . . . . . . . . . . . . . . . . . . . . . Gibraltar 100%
Vinorum Holdings Ltd. . . . . . . . . . . . . . . . . . . . . . . . . . . . . . . . . . . . . . . . . . . . . . . . . . . . . . . . . . . . . . . . . . . . . . . . Gibraltar 100%
Oil and Gas
TNK Industrial Holdings Ltd.* . . . . . . . . . . . . . . . . . . . . . . . . . . . . . . . . . . . . . . . . . . . . . . . . . . . . . . . . . . . . . . . . . BVI 50%
Telecommunications
Alfa Telecom Ltd. . . . . . . . . . . . . . . . . . . . . . . . . . . . . . . . . . . . . . . . . . . . . . . . . . . . . . . . . . . . . . . . . . . . . . . . . . . . . . BVI 100%
Golden Telecom Inc.* . . . . . . . . . . . . . . . . . . . . . . . . . . . . . . . . . . . . . . . . . . . . . . . . . . . . . . . . . . . . . . . . . . . . . . . . .United States of America 43.8%
Eco Telecom Ltd. . . . . . . . . . . . . . . . . . . . . . . . . . . . . . . . . . . . . . . . . . . . . . . . . . . . . . . . . . . . . . . . . . . . . . . . . . . . . . Gibraltar 100%
OAO Vimpel-Communications** . . . . . . . . . . . . . . . . . . . . . . . . . . . . . . . . . . . . . . . . . . . . . . . . . . . . . . . . . . . . . . . . Russia 13.05%
Other
CTF Holdings Ltd. . . . . . . . . . . . . . . . . . . . . . . . . . . . . . . . . . . . . . . . . . . . . . . . . . . . . . . . . . . . . . . . . . . . . . . . . . . . . Gibraltar 100%
Estate Project Holdings Ltd. . . . . . . . . . . . . . . . . . . . . . . . . . . . . . . . . . . . . . . . . . . . . . . . . . . . . . . . . . . . . . . . . . . . . Gibraltar 100%
CTF Consultancy Ltd. . . . . . . . . . . . . . . . . . . . . . . . . . . . . . . . . . . . . . . . . . . . . . . . . . . . . . . . . . . . . . . . . . . . . . . . . Gibraltar 100%
* The effective interest that is consolidated is less due to minority interest at the level of Alfa Finance Holdings S.A.
** The interest is equal to ownership in common shares (Note ).
37. SUBSEQUENT EVENTS
Eco Holdings LimitedAs at January Management of the Alfa Eco Group acquired ordinary shares of Eco Holdings Limited (representing% of the outstanding shares) for an amount of USD , thousand.
In July , the shareholders of Alfa Eco Group contributed USD , thousand into the share capital of Eco Holdings.
In July , the Alfa Eco Group acquired a % interest in OAO TsBK Kama, a pulp and paper factory, for consideration of USD, thousand.
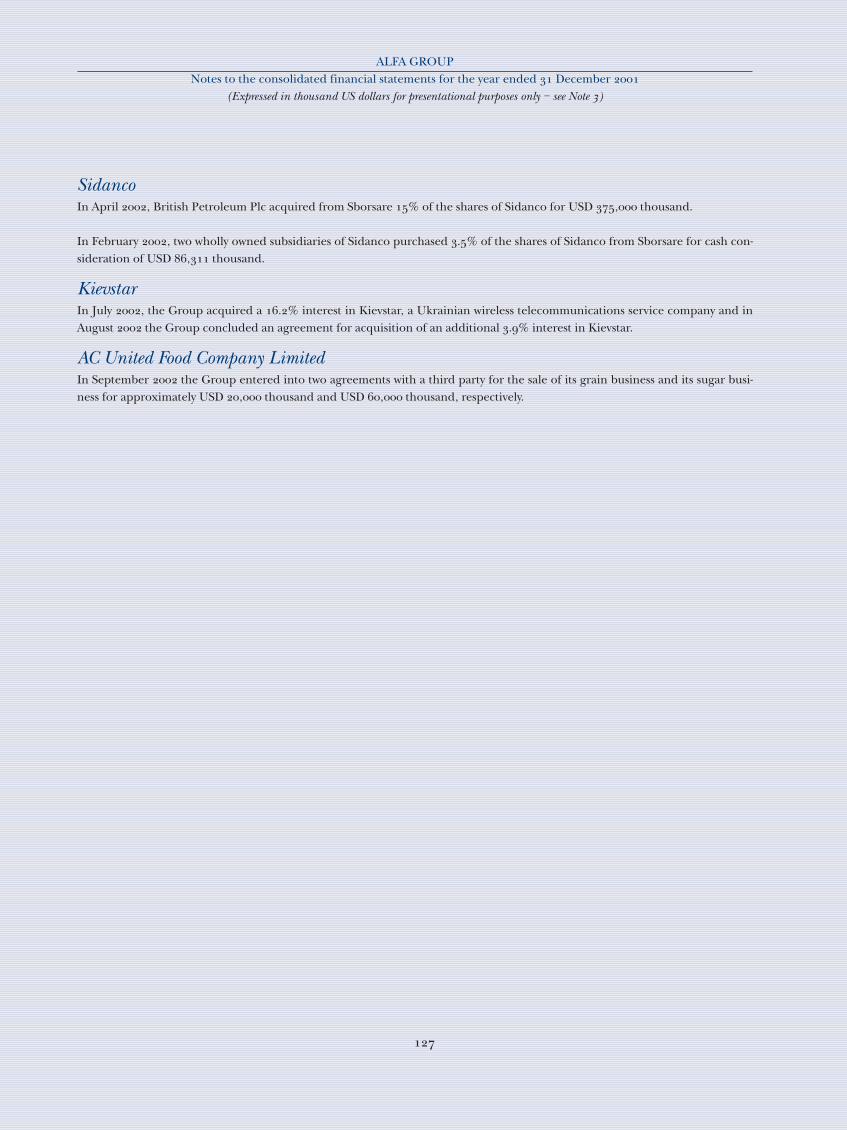
SidancoIn April , British Petroleum Plc acquired from Sborsare % of the shares of Sidanco for USD , thousand.
In February , two wholly owned subsidiaries of Sidanco purchased .% of the shares of Sidanco from Sborsare for cash con-sideration of USD , thousand.
KievstarIn July , the Group acquired a .% interest in Kievstar, a Ukrainian wireless telecommunications service company and inAugust the Group concluded an agreement for acquisition of an additional .% interest in Kievstar.
AC United Food Company LimitedIn September the Group entered into two agreements with a third party for the sale of its grain business and its sugar busi-ness for approximately USD , thousand and USD , thousand, respectively.
ALFA GROUP Notes to the consolidated financial statements for the year ended December
(Expressed in thousand US dollars for presentational purposes only – see Note )

Des
ign
Ag
eyTo
mes
h