Embed Size (px)
Citation preview
Annual Report 2014

1. Contents
3
PharmaMar · Annual Report 2014
Letter from the Chairman
Company Directors
Auditors’ report
ANNUAL ACCOUNTS
Balance sheet
Statement of income
Statement of changes in net equity
Cash Flow statement
Annual accounts
DIRECTORS’ REPORT
4
8
10
14
16
18
19
20
21
70
índice
4
Dear shareholder,
2014 was a decisive year for the company’s growth and for its roadmap to strengthen its value in the global oncology market. The progress and milestones attained this year continue to lay the foundation for the structural changes that will enable us to increase profit and maintain our commitment to discovering new drugs.
This will be an important year for all of us at PharmaMar, and it is my pleasure to share with you the good results obtained in 2014 and the goals we achieved thanks to strong execution by everyone at PharmaMar. Human potential is the lifeblood of this company, and this year we saw how investment in innovation and a culture of excellence are bearing fruit, with the development of novel molecules and the strong positioning of our business in the oncology space. Our commitment to innovation remains a fundamental pillar of our business. R&D spending totalled 42 million euro in 2014, accounting for 45% of gross revenues, and we worked with external collaborators to promote the exchange of knowledge and the rapid advancement of projects that contribute to patient care.
As a result, Grupo Zeltia received the University-Business Award for ongoing cooperation between companies and academic institutions, given our collaboration with faculty in the search
Letter from the CHAIRMAN
We continue to expand our foothold, investing in innovation
5
PharmaMar · Annual Report 2014
for new treatments. Additionally, PharmaMar was again rated “excellent” in the PROFARMA programme, which promotes scientific research, development and technological innovation in Spain’s pharmaceutical industry. Last year, we received the Madrid Healthcare Silver Plaque from the President of the Madrid Regional Government in recognition of our pioneering biotechnology programme to discover new marine-based drugs. That award also recognised PharmaMar’s position as a job creator, employing more than 350 highly-qualified professionals from over 15 countries. In line with our commitment to research and responsibility, PharmaMar adopted the recent Nagoya Protocol to continue to share technology and expertise with those countries where we conduct sea expeditions in search of new anti-tumour compounds. We therefore continue to achieve our goals with integrity while respecting the biological diversity of the oceans and the sustainable use of organisms.
PharmaMar’s unique approach of researching new marine-based cancer drugs continues to make progress in the area of gynaecological tumours and soft-tissue sarcoma. Late-stage clinical development is also advancing in other indications, including lung cancer and blood tumours such as multiple myeloma. These new indications reflect our capacity to contribute new treatments for illnesses that are in need of alternative therapies, and our ability to identify new challenges and market opportunities. This focus on innovation, together with our strategy of growth through alliances, was validated once again in 2014 by the agreement with Chugai Pharma Marketing for the sale of our drug Aplidin® (plitidepsin) for multiple myeloma in eight European countries, except Spain, Italy, Switzerland, Portugal, Poland and the Czech Republic, and the Scandinavian countries, where we have a very strong sales network. This reement connects us with a company that has experience in haematological tumours, and will benefit the launch of Aplidin® (plitidepsin). We made considerable progress during the year on the strength of our capacity and experience in marketing drugs for solid tumours. In 2014, PharmaMar acquired its first marketing license, to distribute Politrate® (leuprorelin acetate)—a prostate cancer drug manufactured by Spanish company GP Pharm—in Italy, expanding our sales network and diversifying our oncology product portfolio. This strategy is perfectly aligned with the goal of strengthening our international foothold, an area in which we continue to work diligently. Our subsidiary based in Paris commenced sales activity. The French team will initially have 14 people (including sales staff and medical experts) and will enable us to sign new agreements that will help us grow and strengthen our position in the oncology market.
In this framework of internationalisation and development, it is important to highlight a major milestone in the successful track record of Yondelis®. Not only did gross sales of our drug worldwide increase by 8% year-on-year, but we also achieved more approvals worldwide. And, even more importantly, we expect Yondelis® to be approved for soft-tissue sarcoma in the US in 2015 based on the application to market the drug filed by Janssen Products LP, our partner in that country, which was granted priority review status by the FDA. Approval will represent a turning point for the company, as our drug would become available in the world’s largest oncology market, which accounts for 45% of the total. In 2014, the NCCN (National Comprehensive Cancer Network) Clinical Practice Guidelines in Oncology recommended the inclusion of patients with a type of soft-tissue sarcoma in clinical trials with Yondelis® in view of data demonstrating the efficacy of the drug in that indication. Given the global influence of those guidelines, the inclusion of Yondelis® following its approval could further strengthen the use of our drug in clinical practice for this type of tumour. Also, Taiho Pharmaceutical, our partner in Japan, filed a request to market Yondelis® for soft-tissue sarcoma with the Japanese regulatory authorities. The trial with Japanese patients, which was presented at the 2014 ASCO (American Society of Clinical Oncology) Annual Meeting, yielded very good results, which could lead to approval in Japan in 2015 as well. Japan is another major oncology market, accounting for 12% of the world total. These two approvals would represent a milestone for our first drug and further confirm its value as anti-tumour therapy.
We remain focused on investigating drugs for relapsed ovarian cancer, which is the fifth leading cause of cancer death in women, and we plan on strengthening our position as a leader in this area of research. A new trial that continues to recruit patients in Italy is studying how to position Yondelis® in sequential therapy in between platinum-based treatments, and to demonstrate its usefulness in increasing survival, which would be extremely important in clinical practice. Our partner
6
for Yondelis® in the US continues to recruit women with this illness for a registration trial. We also recently announced the preliminary results of the Phase II trial with our new compound PM01183 in women with platinum-resistant or refractory ovarian cancer, which indicated an improvement in overall survival compared with the drug topotecan. This year we will launch a registration trial with PM01183 to treat this type of tumour, which will enable us to maintain our strong position in this pathology and to contribute to the therapeutic armamentarium against this type of cancer.
With the development of our most promising candidate, PM01183, which was recently rated a potential blockbuster drug by two investment firms, we have been able to demonstrate potential in combination against another tumour type—small cell lung cancer—which poses a challenge for society and remains an unmet medical need. The data obtained in a Phase II trial encouraged the company to start a registration trial in patients with this type of cancer and prepare a strategy to launch PM01183 worldwide in the medium term. The FDA approved our proposal on the drug production process in 2014, which validates our capacity to meet future demands. Although still at a very early stage, we expect PM01183 to yield interesting results in two other very common types of cancer: breast cancer with BRCA1 and BRCA2 mutations, and non-small cell lung cancer. Strengthening our position in these indications would represent outstanding progress for PM01183 and for PharmaMar.
The company remains committed to innovation-based medicine and, to that end, we are reinforcing our strategy of identifying first-in-class marine-based drugs with a programme for elucidating the mechanism of action of Yondelis®, PM01183 and Aplidin®. With this strategy, PharmaMar harnesses its expertise in the biology of the illness and the molecular and pharmacological properties of its drugs to optimise treatments, develop targeted therapies, identify those patients that can benefit the most and improve their quality of life. We continue to participate in international oncology conferences, where we demonstrate our capacity to advance basic research. Our contribution to applied research has led to more than 20 clinical trials, which were presented at leading international conferences such as ASCO and ESMO (European Society of Medical Oncology), two of the most important clinical oncology events. At the latter, which was held in Madrid in 2014, we played a key role with the presentation of several trials, including one that was recently published in The Lancet Oncology, with notable implications for the routine clinical use of Yondelis® in patients with soft-tissue sarcoma. This international presence strengthened our position among innovative biopharmaceutical companies and enhanced our interest in and ability to cooperate with research groups around the world.
Last year was a positive one for PharmaMar, and thanks to the hard work by all the company’s people, we obtained gross revenues of 93 million euro, an increase of 8% with respect to 2013. With new expeditions planned in 2015, we expect to continue to enrich our product portfolio with new candidates. In 2014, we saw how our commitment to conjugated antibodies, a therapeutic strategy targeting the tumour with a powerful marine-based anti-cancer drug, is providing proof of concept in preclinical and animal models. Our tireless team of marine scientists and our experienced researchers once again laid the foundation for the rest of the PharmaMar team, contributing to improvements in the health of patients.
Last, but not least, I would like to outline the process approved by the Board of Directors by which PharmaMar will absorb Zeltia in 2015. The merger decision is based on the future outlook for the companies and on trends in the oncology business. The strategy is to focus our efforts on a single goal—the development of cancer drugs—so as to compete with the large biopharmaceutical companies. The objective of being able to market our future products at global level and to strengthen our business in the US—the core market in biotechnology—requires restructuring the companies. This is simply a small step that will place us in an even stronger position in the global oncology market, and enable us to continue to prosper at all levels. The goals of this initiative include establishing ourselves as a productive, competitive company with a unique business model in the pharmaceutical industry, and continuing to grow as a responsible company and as an example of the unstinting hard work of all of our employees and collaborators.

7
PharmaMar · Annual Report 2014
I encourage everyone whose contribution enabled us to exceed our expectations in 2014 to continue to work together for the future of PharmaMar, and to look ahead with enthusiasm. We will continue to collaborate, inside and outside the lab, to overcome setbacks, frustration and competition with perseverance, creativity and professionalism. The Board of Directors of PharmaMar and I would like to thank our employees for their hard work; thanks to them, we continued to be successful in 2014 and can seize new opportunities that arise.
José María Fernández Sousa-Faro
Chairman

2. Company Directors
9
PharmaMar · Annual Report 2014
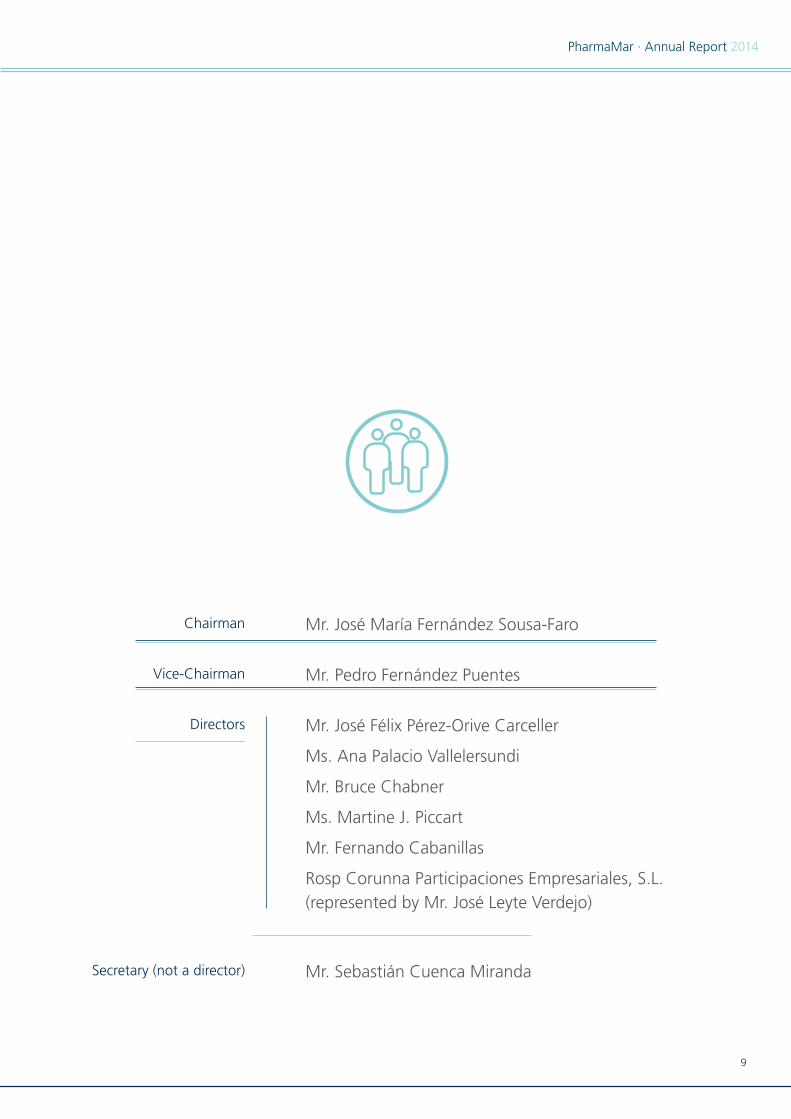
Chairman
Vice-Chairman
Directors
Secretary (not a director)
Mr. José María Fernández Sousa-Faro
Mr. Pedro Fernández Puentes
Mr. José Félix Pérez-Orive Carceller
Ms. Ana Palacio Vallelersundi
Mr. Bruce Chabner
Ms. Martine J. Piccart
Mr. Fernando Cabanillas
Rosp Corunna Participaciones Empresariales, S.L.(represented by Mr. José Leyte Verdejo)
Mr. Sebastián Cuenca Miranda
Administradores de la Sociedad
3. Auditors’ Report 2014
11
PharmaMar · Annual Report 2014
Auditors’ Report 2014Pharma Mar, S.A. Sociedad Unipersonal
3. Auditors’ Report 2014
INDEPENDENT AUDITORS’ REPORT ON FINANCIAL STATEMENTS
To the shareholders of Pharma Mar, S.A.U.:
We have audited the accompanying financial statements of Pharma Mar, S.A.U., consisting of the balance sheet as of 31 December 2014 and the statement of income, the statement of changes in equity, the cash flow statement and the notes to the financial statements for the year then ended.
Directors’ responsibility in connection with the financial statements
The directors are responsible for authorizing the accompanying financial statements such as to give a true and fair view of the equity, financial position and results of Pharma Mar, S.A.U. in accordance with the financial reporting regulatory framework that is applicable to the undertaking in Spain, which is identified in the accompanying note 2, and the internal control that they deem necessary to enable the financial statements to be drawn up free of material inaccuracies due to fraud or error.
Auditor’s responsibility
Our responsibility is to express an opinion on the accompanying financial statements based on our audit. We performed our audit in accordance with the regulations governing auditing in Spain. Those regulations requires us to fulfil ethics requirements and to plan and execute the audit in order to obtain reasonable assurance that the financial statements are free of material inaccuracies.
An audit requires the application of procedures to obtain audit evidence in connection with the amounts and the information disclosed in the financial statements. The procedures selected depend on the auditor’s judgement, including an assessment of the risks of material inaccuracies in the financial statements as a result of fraud or error. When performing that risk assessment, the auditor considers the internal control that is germane to the authorization of the financial statements by the undertaking in order to design the audit procedures that are appropriate to the circumstances, and not to express an opinion on the efficacy of the company’s internal controls. An audit also includes an assessment of the appropriateness of the accounting policies that are applied and of the reasonableness of the accounting estimates made by management, as well as an evaluation of the presentation of the financial statements taken as a whole.
We consider that the audit evidence that we obtained provides a sufficient and appropriate basis for our audit opinion.

Opinion
In our opinion, the accompanying financial statements give, in all material respects, a true and fair view of the equity and financial position of Pharma Mar, S.A.U. as of 31 December 2014 and the results of its operations and cash flows in the year then ended, in accordance with the applicable financial reporting regulatory framework and, in particular, with the accounting principles and standards contained therein.
Information about other legal and regulatory requirements
The accompanying directors’ report for 2014 contains such explanations on the state of the affairs of Pharma Mar, S.A.U., the performance of its business and other matters as the directors consider appropriate and does not form an integral part of the financial statements. We verified that the financial information contained in that directors’ report is consistent with the 2014 financial statements. Our work as auditors is limited to checking the directors’ report with the scope set out in this paragraph and it does not include the review of information not derived from the company’s accounting records.
PricewaterhouseCoopers Auditores, S.L.Luis Sánchez Quintana
25 March 2015
4. Annual Accounts

15
PharmaMar · Annual Report 2014
Annual Accounts 2014Pharma Mar, S.A. Sociedad Unipersonal
4. Annual Accounts
16
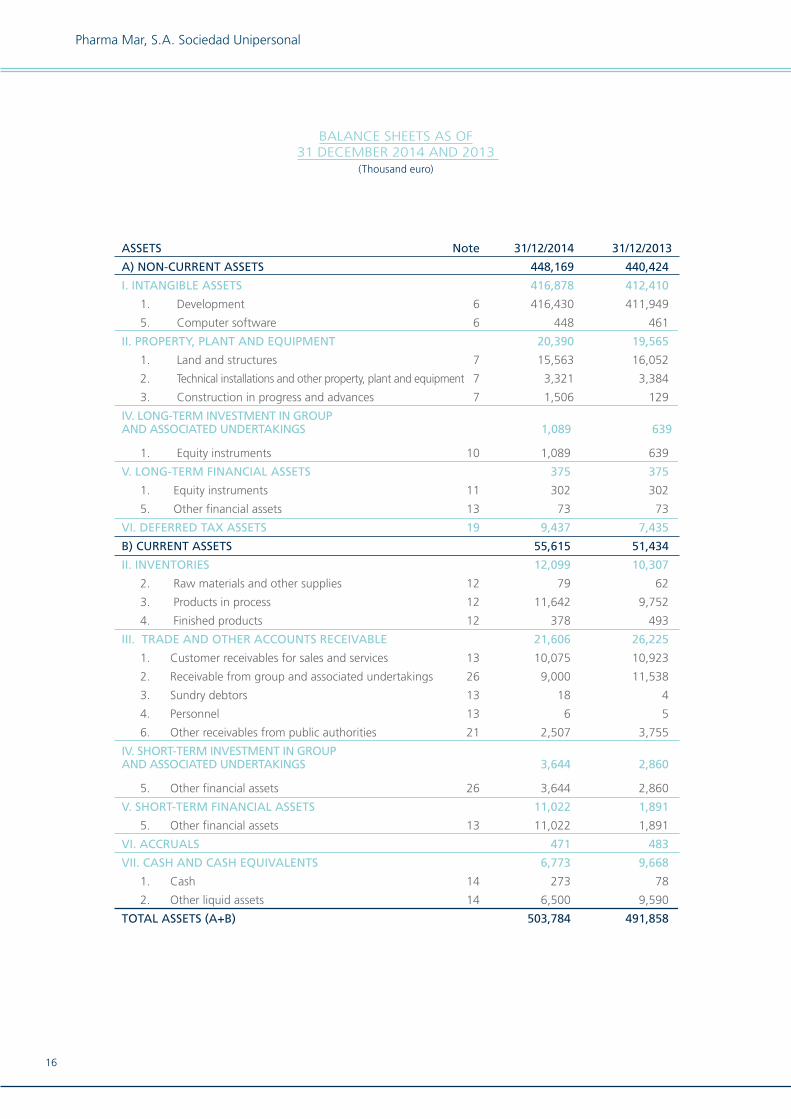
BALANCE SHEETS AS OF 31 DECEMBER 2014 AND 2013
(Thousand euro)
ASSETS Note 31/12/2014 31/12/2013
A) NON-CURRENT ASSETS 448,169 440,424
I. INTANGIBLE ASSETS 416,878 412,410
1. Development 6 416,430 411,949
5. Computer software 6 448 461
II. PROPERTY, PLANT AND EQUIPMENT 20,390 19,565
1. Land and structures 7 15,563 16,052
2. Technical installations and other property, plant and equipment 7 3,321 3,384
3. Construction in progress and advances 7 1,506 129
IV. LONG-TERM INVESTMENT IN GROUP AND ASSOCIATED UNDERTAKINGS 1,089 639
1. Equity instruments 10 1,089 639
V. LONG-TERM FINANCIAL ASSETS 375 375
1. Equity instruments 11 302 302
5. Other financial assets 13 73 73
VI. DEFERRED TAX ASSETS 19 9,437 7,435
B) CURRENT ASSETS 55,615 51,434
II. INVENTORIES 12,099 10,307
2. Raw materials and other supplies 12 79 62
3. Products in process 12 11,642 9,752
4. Finished products 12 378 493
III. TRADE AND OTHER ACCOUNTS RECEIVABLE 21,606 26,225
1. Customer receivables for sales and services 13 10,075 10,923
2. Receivable from group and associated undertakings 26 9,000 11,538
3. Sundry debtors 13 18 4
4. Personnel 13 6 5
6. Other receivables from public authorities 21 2,507 3,755
IV. SHORT-TERM INVESTMENT IN GROUP AND ASSOCIATED UNDERTAKINGS 3,644 2,860
5. Other financial assets 26 3,644 2,860
V. SHORT-TERM FINANCIAL ASSETS 11,022 1,891
5. Other financial assets 13 11,022 1,891
VI. ACCRUALS 471 483
VII. CASH AND CASH EQUIVALENTS 6,773 9,668
1. Cash 14 273 78
2. Other liquid assets 14 6,500 9,590
TOTAL ASSETS (A+B) 503,784 491,858
Pharma Mar, S.A. Sociedad Unipersonal
17
PharmaMar · Annual Report 2014
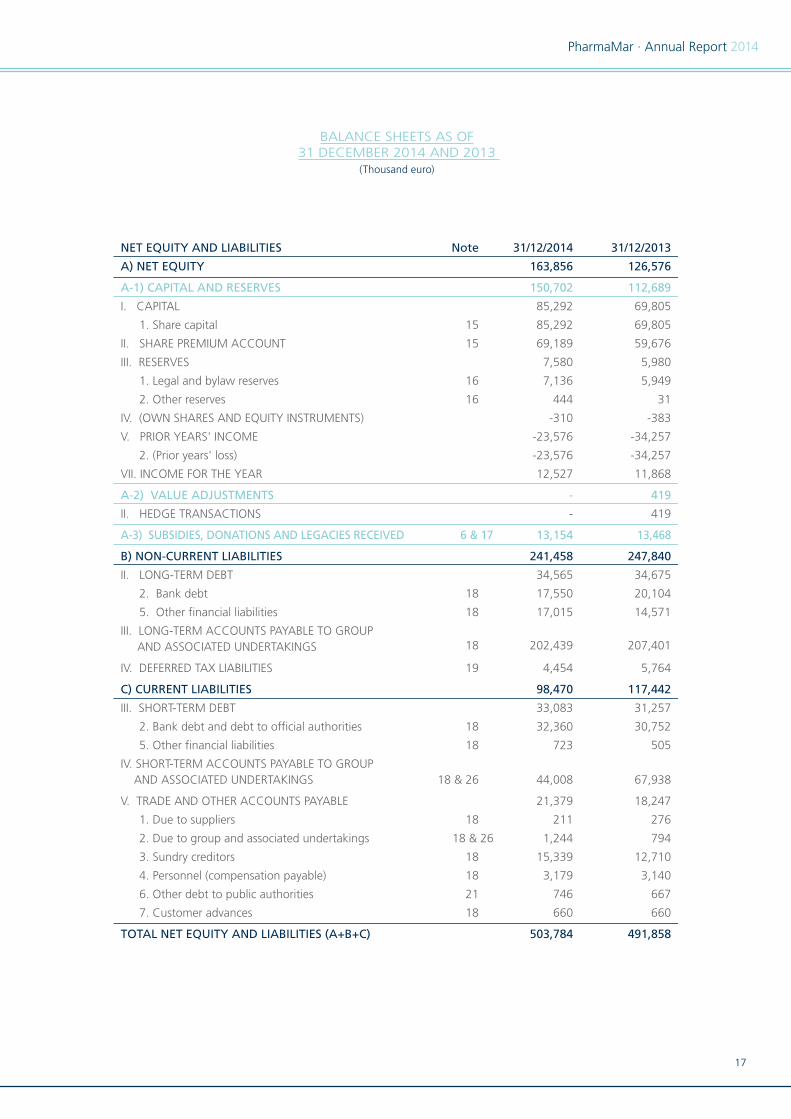
BALANCE SHEETS AS OF 31 DECEMBER 2014 AND 2013
(Thousand euro)
NET EQUITY AND LIABILITIES Note 31/12/2014 31/12/2013
A) NET EQUITY 163,856 126,576
A-1) CAPITAL AND RESERVES 150,702 112,689
I. CAPITAL 85,292 69,805
1. Share capital 15 85,292 69,805
II. SHARE PREMIUM ACCOUNT 15 69,189 59,676
III. RESERVES 7,580 5,980
1. Legal and bylaw reserves 16 7,136 5,949
2. Other reserves 16 444 31
IV. (OWN SHARES AND EQUITY INSTRUMENTS) -310 -383
V. PRIOR YEARS' INCOME -23,576 -34,257
2. (Prior years' loss) -23,576 -34,257
VII. INCOME FOR THE YEAR 12,527 11,868
A-2) VALUE ADJUSTMENTS - 419
II. HEDGE TRANSACTIONS - 419
A-3) SUBSIDIES, DONATIONS AND LEGACIES RECEIVED 6 & 17 13,154 13,468
B) NON-CURRENT LIABILITIES 241,458 247,840
II. LONG-TERM DEBT 34,565 34,675
2. Bank debt 18 17,550 20,104
5. Other financial liabilities 18 17,015 14,571
III. LONG-TERM ACCOUNTS PAYABLE TO GROUP
AND ASSOCIATED UNDERTAKINGS 18 202,439 207,401
IV. DEFERRED TAX LIABILITIES 19 4,454 5,764
C) CURRENT LIABILITIES 98,470 117,442
III. SHORT-TERM DEBT 33,083 31,257
2. Bank debt and debt to official authorities 18 32,360 30,752
5. Other financial liabilities 18 723 505
IV. SHORT-TERM ACCOUNTS PAYABLE TO GROUP AND ASSOCIATED UNDERTAKINGS 18 & 26 44,008 67,938
V. TRADE AND OTHER ACCOUNTS PAYABLE 21,379 18,247
1. Due to suppliers 18 211 276
2. Due to group and associated undertakings 18 & 26 1,244 794
3. Sundry creditors 18 15,339 12,710
4. Personnel (compensation payable) 18 3,179 3,140
6. Other debt to public authorities 21 746 667
7. Customer advances 18 660 660
TOTAL NET EQUITY AND LIABILITIES (A+B+C) 503,784 491,858
18
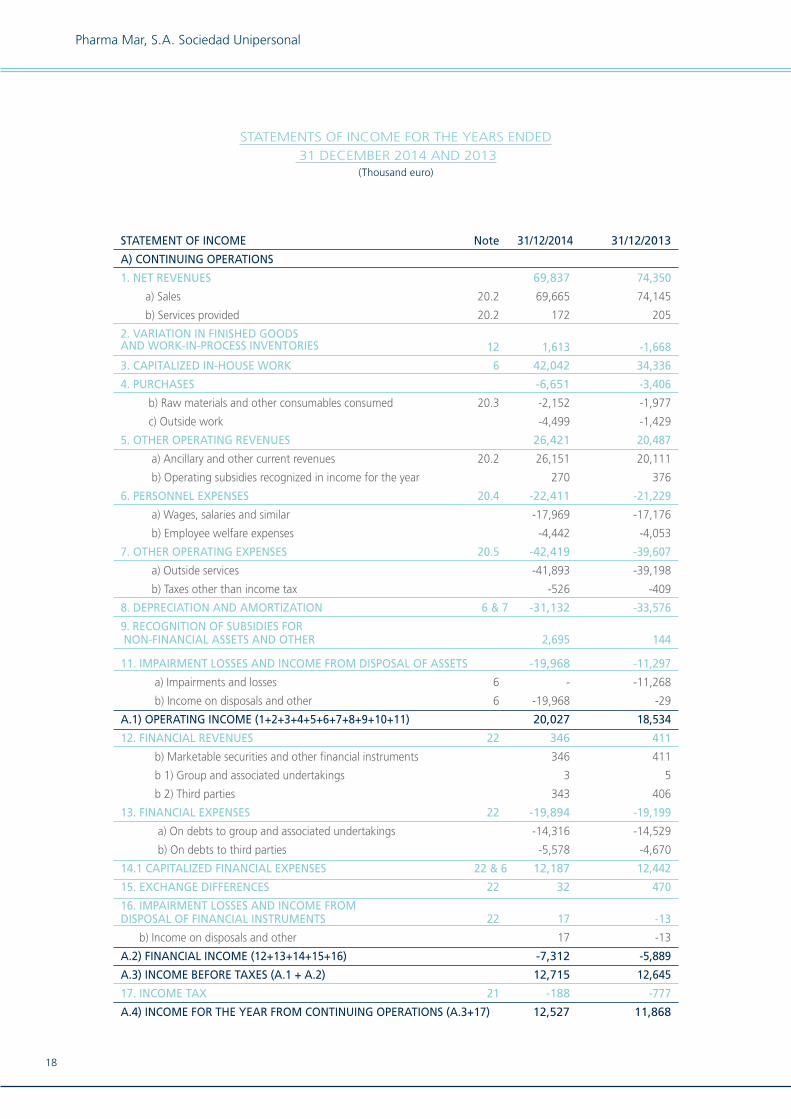
STATEMENT OF INCOME Note 31/12/2014 31/12/2013
A) CONTINUING OPERATIONS
1. NET REVENUES 69,837 74,350
a) Sales 20.2 69,665 74,145
b) Services provided 20.2 172 205
2. VARIATION IN FINISHED GOODS AND WORK-IN-PROCESS INVENTORIES 12 1,613 -1,668
3. CAPITALIZED IN-HOUSE WORK 6 42,042 34,336
4. PURCHASES -6,651 -3,406
b) Raw materials and other consumables consumed 20.3 -2,152 -1,977
c) Outside work -4,499 -1,429
5. OTHER OPERATING REVENUES 26,421 20,487
a) Ancillary and other current revenues 20.2 26,151 20,111
b) Operating subsidies recognized in income for the year 270 376
6. PERSONNEL EXPENSES 20.4 -22,411 -21,229
a) Wages, salaries and similar -17,969 -17,176
b) Employee welfare expenses -4,442 -4,053
7. OTHER OPERATING EXPENSES 20.5 -42,419 -39,607
a) Outside services -41,893 -39,198
b) Taxes other than income tax -526 -409
8. DEPRECIATION AND AMORTIZATION 6 & 7 -31,132 -33,576
9. RECOGNITION OF SUBSIDIES FOR NON-FINANCIAL ASSETS AND OTHER 2,695 144
11. IMPAIRMENT LOSSES AND INCOME FROM DISPOSAL OF ASSETS -19,968 -11,297
a) Impairments and losses 6 - -11,268
b) Income on disposals and other 6 -19,968 -29
A.1) OPERATING INCOME (1+2+3+4+5+6+7+8+9+10+11) 20,027 18,534
12. FINANCIAL REVENUES 22 346 411
b) Marketable securities and other financial instruments 346 411
b 1) Group and associated undertakings 3 5
b 2) Third parties 343 406
13. FINANCIAL EXPENSES 22 -19,894 -19,199
a) On debts to group and associated undertakings -14,316 -14,529
b) On debts to third parties -5,578 -4,670
14.1 CAPITALIZED FINANCIAL EXPENSES 22 & 6 12,187 12,442
15. EXCHANGE DIFFERENCES 22 32 470
16. IMPAIRMENT LOSSES AND INCOME FROM DISPOSAL OF FINANCIAL INSTRUMENTS 22 17 -13
b) Income on disposals and other 17 -13
A.2) FINANCIAL INCOME (12+13+14+15+16) -7,312 -5,889
A.3) INCOME BEFORE TAXES (A.1 + A.2) 12,715 12,645
17. INCOME TAX 21 -188 -777
A.4) INCOME FOR THE YEAR FROM CONTINUING OPERATIONS (A.3+17) 12,527 11,868
STATEMENTS OF INCOME FOR THE YEARS ENDED 31 DECEMBER 2014 AND 2013
(Thousand euro)
Pharma Mar, S.A. Sociedad Unipersonal
19
PharmaMar · Annual Report 2014
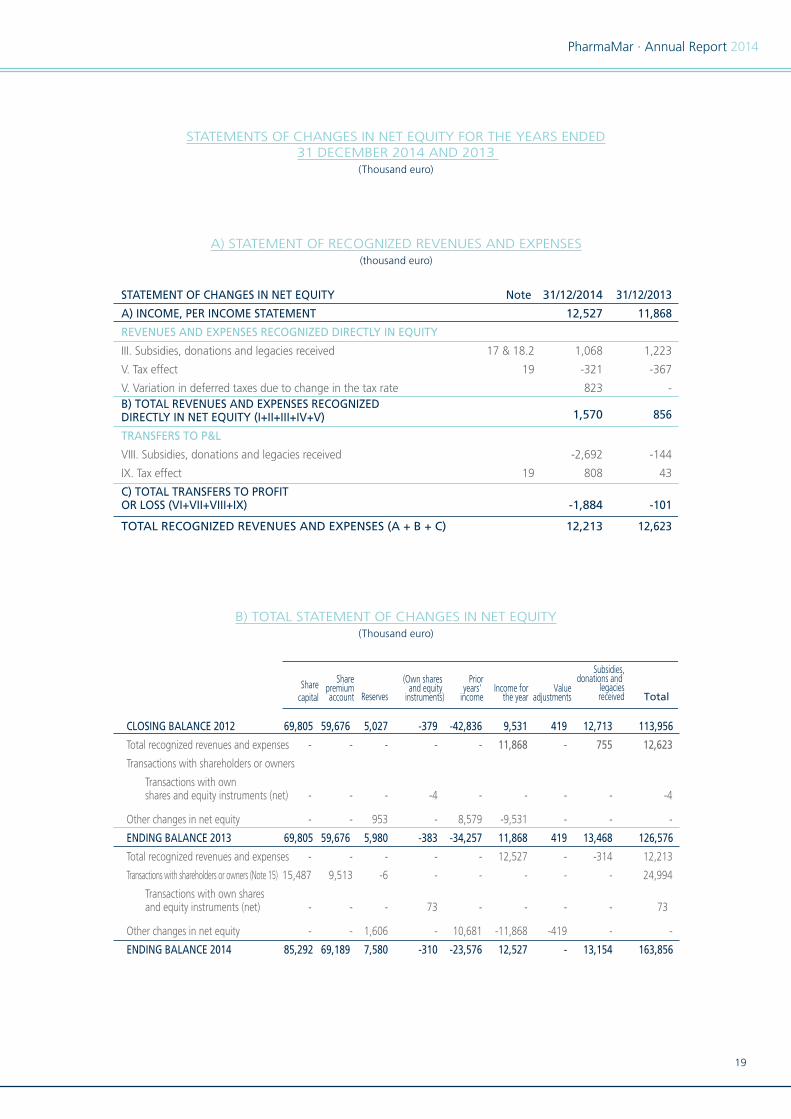
B) TOTAL STATEMENT OF CHANGES IN NET EQUITY(Thousand euro)
A) STATEMENT OF RECOGNIZED REVENUES AND EXPENSES(thousand euro)
STATEMENTS OF CHANGES IN NET EQUITY FOR THE YEARS ENDED31 DECEMBER 2014 AND 2013
(Thousand euro)
STATEMENT OF CHANGES IN NET EQUITY Note 31/12/2014 31/12/2013
A) INCOME, PER INCOME STATEMENT 12,527 11,868
REVENUES AND EXPENSES RECOGNIZED DIRECTLY IN EQUITY
III. Subsidies, donations and legacies received 17 & 18.2 1,068 1,223
V. Tax effect 19 -321 -367
V. Variation in deferred taxes due to change in the tax rate 823 -B) TOTAL REVENUES AND EXPENSES RECOGNIZEDDIRECTLY IN NET EQUITY (I+II+III+IV+V) 1,570 856
TRANSFERS TO P&L
VIII. Subsidies, donations and legacies received -2,692 -144
IX. Tax effect 19 808 43
C) TOTAL TRANSFERS TO PROFIT OR LOSS (VI+VII+VIII+IX) -1,884 -101
TOTAL RECOGNIZED REVENUES AND EXPENSES (A + B + C) 12,213 12,623
Sharecapital
Sharepremiumaccount Reserves
(Own shares and equity
instruments)
Prioryears'
incomeIncome for
the yearValue
adjustments
Subsidies,donations and
legaciesreceived Total
CLOSING BALANCE 2012 69,805 59,676 5,027 -379 -42,836 9,531 419 12,713 113,956
Total recognized revenues and expenses - - - - - 11,868 - 755 12,623
Transactions with shareholders or owners
Transactions with own shares and equity instruments (net) - - - -4 - - - - -4
Other changes in net equity - - 953 - 8,579 -9,531 - - -
ENDING BALANCE 2013 69,805 59,676 5,980 -383 -34,257 11,868 419 13,468 126,576
Total recognized revenues and expenses - - - - - 12,527 - -314 12,213
Transactions with shareholders or owners (Note 15) 15,487 9,513 -6 - - - - - 24,994
Transactions with own shares and equity instruments (net) - - - 73 - - - - 73
Other changes in net equity - - 1,606 - 10,681 -11,868 -419 - -
ENDING BALANCE 2014 85,292 69,189 7,580 -310 -23,576 12,527 - 13,154 163,856
20
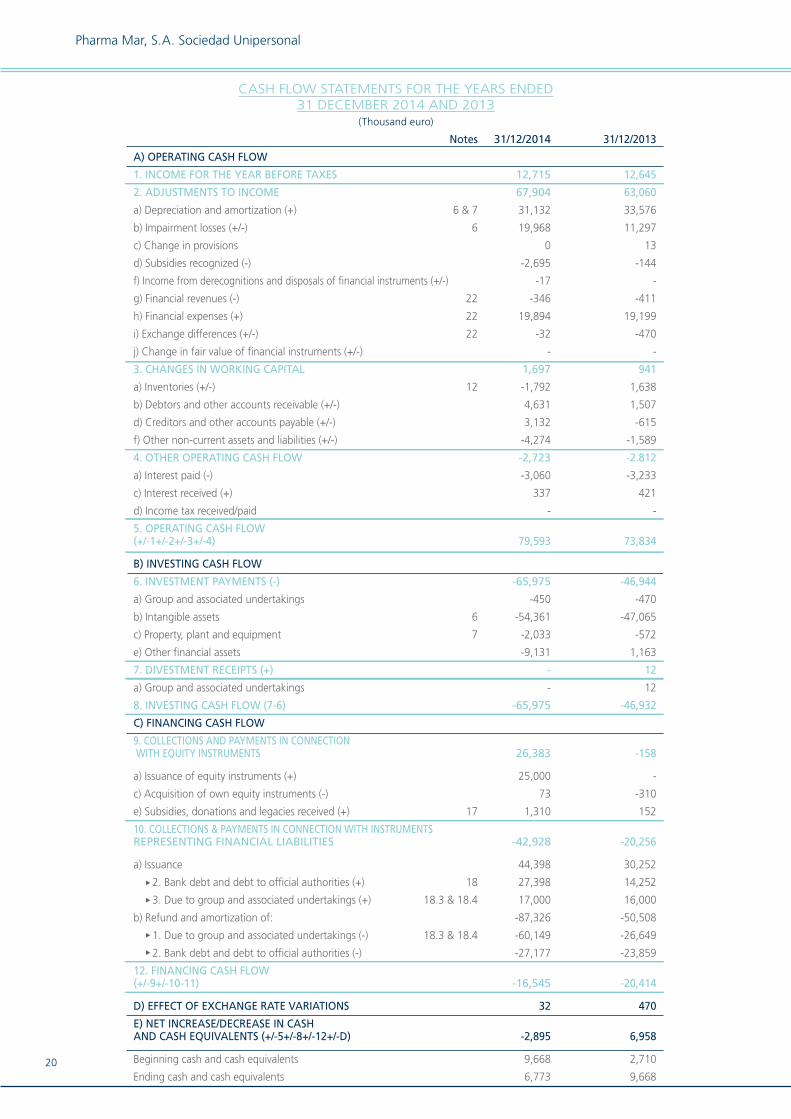
Notes 31/12/2014 31/12/2013
A) OPERATING CASH FLOW
1. INCOME FOR THE YEAR BEFORE TAXES 12,715 12,645
2. ADJUSTMENTS TO INCOME 67,904 63,060
a) Depreciation and amortization (+) 6 & 7 31,132 33,576
b) Impairment losses (+/-) 6 19,968 11,297
c) Change in provisions 0 13
d) Subsidies recognized (-) -2,695 -144
f) Income from derecognitions and disposals of financial instruments (+/-) -17 -
g) Financial revenues (-) 22 -346 -411
h) Financial expenses (+) 22 19,894 19,199
i) Exchange differences (+/-) 22 -32 -470
j) Change in fair value of financial instruments (+/-) - -
3. CHANGES IN WORKING CAPITAL 1,697 941
a) Inventories (+/-) 12 -1,792 1,638
b) Debtors and other accounts receivable (+/-) 4,631 1,507
d) Creditors and other accounts payable (+/-) 3,132 -615
f) Other non-current assets and liabilities (+/-) -4,274 -1,589
4. OTHER OPERATING CASH FLOW -2,723 -2.812
a) Interest paid (-) -3,060 -3,233
c) Interest received (+) 337 421
d) Income tax received/paid - -
5. OPERATING CASH FLOW (+/-1+/-2+/-3+/-4) 79,593 73,834
B) INVESTING CASH FLOW
6. INVESTMENT PAYMENTS (-) -65,975 -46,944
a) Group and associated undertakings -450 -470
b) Intangible assets 6 -54,361 -47,065
c) Property, plant and equipment 7 -2,033 -572
e) Other financial assets -9,131 1,163
7. DIVESTMENT RECEIPTS (+) - 12
a) Group and associated undertakings - 12
8. INVESTING CASH FLOW (7-6) -65,975 -46,932
C) FINANCING CASH FLOW
9. COLLECTIONS AND PAYMENTS IN CONNECTION WITH EQUITY INSTRUMENTS 26,383 -158
a) Issuance of equity instruments (+) 25,000 -
c) Acquisition of own equity instruments (-) 73 -310
e) Subsidies, donations and legacies received (+) 17 1,310 152
10. COLLECTIONS & PAYMENTS IN CONNECTION WITH INSTRUMENTSREPRESENTING FINANCIAL LIABILITIES -42,928 -20,256
a) Issuance 44,398 30,252
2. Bank debt and debt to official authorities (+) 18 27,398 14,252
3. Due to group and associated undertakings (+) 18.3 & 18.4 17,000 16,000
b) Refund and amortization of: -87,326 -50,508
1. Due to group and associated undertakings (-) 18.3 & 18.4 -60,149 -26,649
2. Bank debt and debt to official authorities (-) -27,177 -23,859
12. FINANCING CASH FLOW (+/-9+/-10-11) -16,545 -20,414
D) EFFECT OF EXCHANGE RATE VARIATIONS 32 470
E) NET INCREASE/DECREASE IN CASH AND CASH EQUIVALENTS (+/-5+/-8+/-12+/-D) -2,895 6,958
Beginning cash and cash equivalents 9,668 2,710
Ending cash and cash equivalents 6,773 9,668
CASH FLOW STATEMENTS FOR THE YEARS ENDED31 DECEMBER 2014 AND 2013
(Thousand euro)
Pharma Mar, S.A. Sociedad Unipersonal

21
PharmaMar · Annual Report 2014
1. COMPANY BUSINESS
Pharma Mar, S.A. (Sociedad Unipersonal) (“PharmaMar” or the “Company”) was incorporated on 30 April 1986 as a limited company (sociedad anónima) for an indefinite period. Its registered offices are at Avenida de los Reyes nº 1 (Pol. Industrial La Mina – Norte), Colmenar Viejo (Madrid).
The main activity of PharmaMar is research, development and marketing of bio-active principles, particularly those of marine origin, for application in human medicine, especially in the antitumour, antiviral and immunomodulation fields and the area of tropical diseases.
On 20 September 2007, PharmaMar received authorization from the European Commission to sell its first compound, Yondelis®, to treat soft tissue sarcoma; commercial sales began in the last quarter of 2007.
On 2 November 2009, the European Commission granted authorization for PharmaMar to commercialize Yondelis® (trabectedin) in combination with pegylated liposomal doxorubicin to treat relapsed platinum-sensitive ovarian cancer in the 27 EU countries plus Norway, Iceland and Liechtenstein. The first sales for this therapeutic use were made at the end of 2009.
At year-end, the company had not begun to sell its other products, which are all in the research and development phase.
The Company is part of the Zeltia Group, whose direct controlling company is Zeltia, S.A., with registered offices in Vigo (Pontevedra) at Calle Príncipe 24.
2. BASIS OF PRESENTATION
2.1 TRUE AND FAIR VIEW
The financial statements were prepared from the Company’s accounting records and are presented in accordance with the current mercantile legislation and the rules established in Spain’s General Accounting Plan approved by Royal Decree 1514/2007, as amended by Royal Decree 1159/2010, (GAP 2007) in order to present a true and fair view of the equity, financial position and income of the Company and the veracity of the cash flows set out in the cash flow statement.
The figures in the documents comprising these financial statements (balance sheet, income statement, statement of changes in net equity, cash flow statement and these notes to financial statements) are expressed in thousand euro.
The Company’s Directors consider that the 2014 financial statements, which were authorized on 16 March 2015, will be approved without changes by the Shareholders’ Meeting.
2.2 CRITICAL ASPECTS OF MEASURING AND ESTIMATING UNCERTAINTY
The preparation of the financial statements requires the Company to use certain estimates and judgements in connection with the future that are evaluated continuously and are based on past experience and other factors, including expectations about future events that are considered to be reasonable in the circumstances.
22
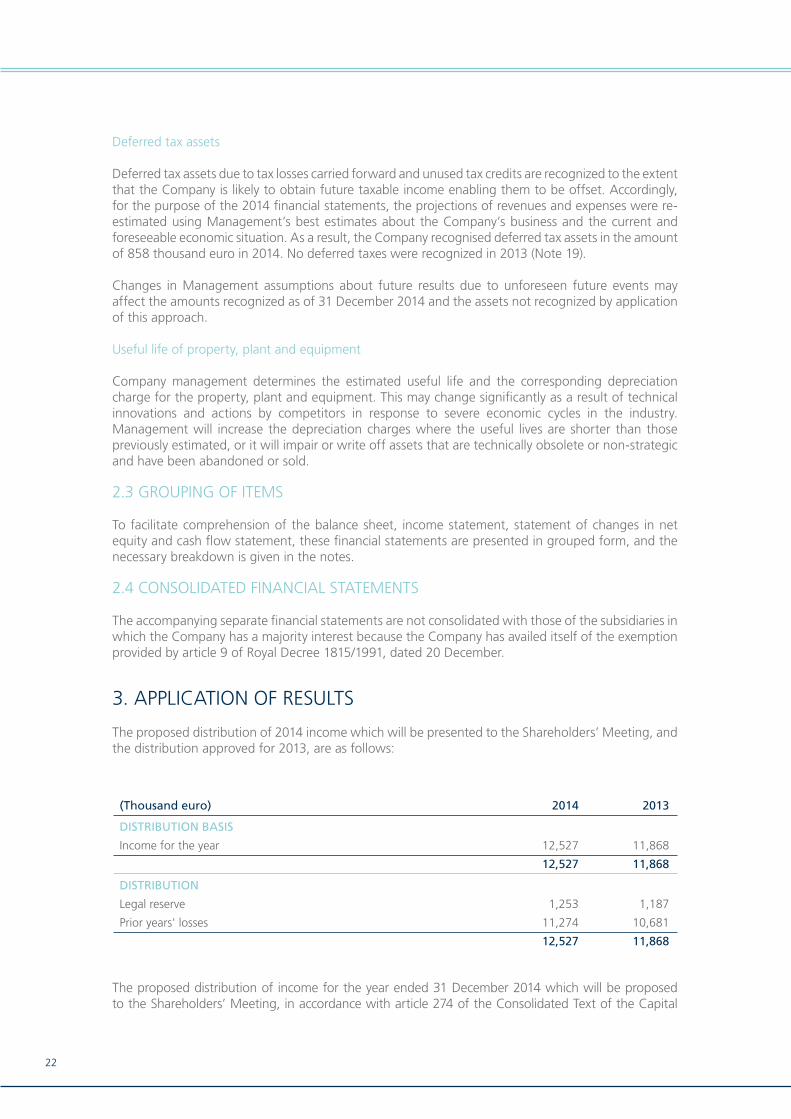
Deferred tax assets
Deferred tax assets due to tax losses carried forward and unused tax credits are recognized to the extent that the Company is likely to obtain future taxable income enabling them to be offset. Accordingly, for the purpose of the 2014 financial statements, the projections of revenues and expenses were re-estimated using Management’s best estimates about the Company’s business and the current and foreseeable economic situation. As a result, the Company recognised deferred tax assets in the amount of 858 thousand euro in 2014. No deferred taxes were recognized in 2013 (Note 19).
Changes in Management assumptions about future results due to unforeseen future events may affect the amounts recognized as of 31 December 2014 and the assets not recognized by application of this approach.
Useful life of property, plant and equipment
Company management determines the estimated useful life and the corresponding depreciation charge for the property, plant and equipment. This may change significantly as a result of technical innovations and actions by competitors in response to severe economic cycles in the industry. Management will increase the depreciation charges where the useful lives are shorter than those previously estimated, or it will impair or write off assets that are technically obsolete or non-strategic and have been abandoned or sold.
2.3 GROUPING OF ITEMS
To facilitate comprehension of the balance sheet, income statement, statement of changes in net equity and cash flow statement, these financial statements are presented in grouped form, and the necessary breakdown is given in the notes.
2.4 CONSOLIDATED FINANCIAL STATEMENTS
The accompanying separate financial statements are not consolidated with those of the subsidiaries in which the Company has a majority interest because the Company has availed itself of the exemption provided by article 9 of Royal Decree 1815/1991, dated 20 December.
3. APPLICATION OF RESULTS
The proposed distribution of 2014 income which will be presented to the Shareholders’ Meeting, and the distribution approved for 2013, are as follows:
The proposed distribution of income for the year ended 31 December 2014 which will be proposed to the Shareholders’ Meeting, in accordance with article 274 of the Consolidated Text of the Capital
(Thousand euro) 2014 2013
DISTRIBUTION BASIS
Income for the year 12,527 11,868
12,527 11,868
DISTRIBUTION
Legal reserve 1,253 1,187
Prior years' losses 11,274 10,681
12,527 11,868
23
PharmaMar · Annual Report 2014
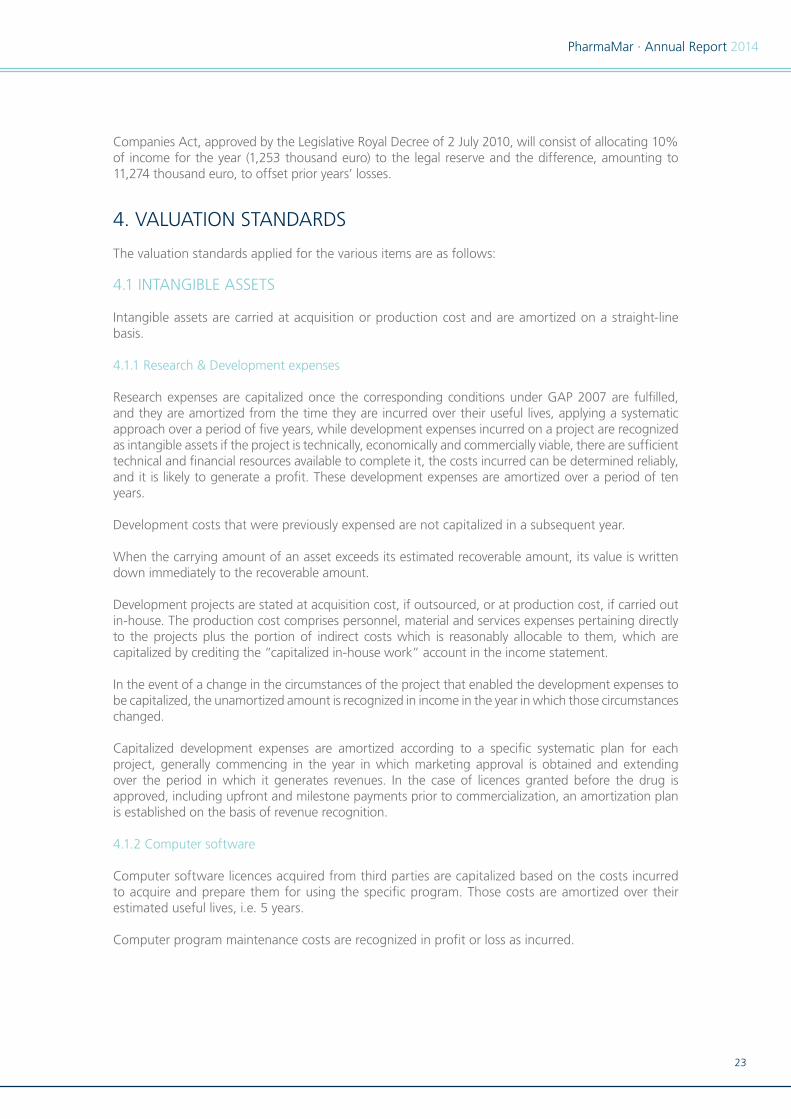
Companies Act, approved by the Legislative Royal Decree of 2 July 2010, will consist of allocating 10% of income for the year (1,253 thousand euro) to the legal reserve and the difference, amounting to 11,274 thousand euro, to offset prior years’ losses.
4. VALUATION STANDARDS
The valuation standards applied for the various items are as follows:
4.1 INTANGIBLE ASSETS
Intangible assets are carried at acquisition or production cost and are amortized on a straight-line basis.
4.1.1 Research & Development expenses
Research expenses are capitalized once the corresponding conditions under GAP 2007 are fulfilled, and they are amortized from the time they are incurred over their useful lives, applying a systematic approach over a period of five years, while development expenses incurred on a project are recognized as intangible assets if the project is technically, economically and commercially viable, there are sufficient technical and financial resources available to complete it, the costs incurred can be determined reliably, and it is likely to generate a profit. These development expenses are amortized over a period of ten years.
Development costs that were previously expensed are not capitalized in a subsequent year.
When the carrying amount of an asset exceeds its estimated recoverable amount, its value is written down immediately to the recoverable amount.
Development projects are stated at acquisition cost, if outsourced, or at production cost, if carried out in-house. The production cost comprises personnel, material and services expenses pertaining directly to the projects plus the portion of indirect costs which is reasonably allocable to them, which are capitalized by crediting the “capitalized in-house work” account in the income statement.
In the event of a change in the circumstances of the project that enabled the development expenses to be capitalized, the unamortized amount is recognized in income in the year in which those circumstances changed.
Capitalized development expenses are amortized according to a specific systematic plan for each project, generally commencing in the year in which marketing approval is obtained and extending over the period in which it generates revenues. In the case of licences granted before the drug is approved, including upfront and milestone payments prior to commercialization, an amortization plan is established on the basis of revenue recognition.
4.1.2 Computer software
Computer software licences acquired from third parties are capitalized based on the costs incurred to acquire and prepare them for using the specific program. Those costs are amortized over their estimated useful lives, i.e. 5 years.
Computer program maintenance costs are recognized in profit or loss as incurred.

24
4.2 PROPERTY, PLANT AND EQUIPMENT
Property, plant and equipment are recognized at acquisition or production cost. Property, plant and equipment are presented on the balance sheet at cost value less the accumulated amount of depreciation and impairment adjustments.
The amount of capitalized in-house work on property, plant and equipment is calculated as the sum of the acquisition costs of consumables and the direct and indirect costs allocable to those assets.
The costs of expanding, modernizing or improving property, plant and equipment are capitalized solely when they increase the assets’ capacity or productivity or extend their useful life, provided that it is possible to ascertain or estimate the carrying amount of the items that are retired from inventory due to being replaced.
The cost of major repairs is capitalized and depreciated over their estimated useful lives, whereas recurring maintenance costs are recognized in profit or loss in the year in which they are incurred.
Apart from land, which is not depreciated, depreciation of property, plant and equipment is taken systematically on a straight-line basis over the asset’s useful life, having regard to actual loss of functionality and usability. The estimated useful lives are as follows:
The residual value and the useful life of an asset is measured, and adjusted if necessary, at each balance sheet date.
When the carrying amount of an asset exceeds its estimated recoverable amount, its value is written down immediately to the recoverable amount.
Losses and gains on the disposal of property, plant and equipment are calculated by comparing the revenue from the sale with the carrying amount, and are recognized in profit or loss.
4.3 INTEREST EXPENSES
Financial expenses directly attributable to the acquisition or construction of fixed assets that require more than one year to be ready for use are capitalized up until the point when the asset is ready for use.
4.4 IMPAIRMENT OF NON-FINANCIAL ASSETS
Amortizable assets are measured for impairment whenever any event or change in circumstances indicates that the carrying amount may not be recoverable.
An impairment loss is recognized for the amount by which the carrying amount exceeds the recoverable amount, the latter being understood to mean the lower of the fair value less the selling cost or the value in use.
Year %
Buildings and structures 30 3.33
Technical installations and machinery 10 10
Vehicles 7 14
Furniture and fixtures 10 10
Computer hardware 7 14
25
PharmaMar · Annual Report 2014
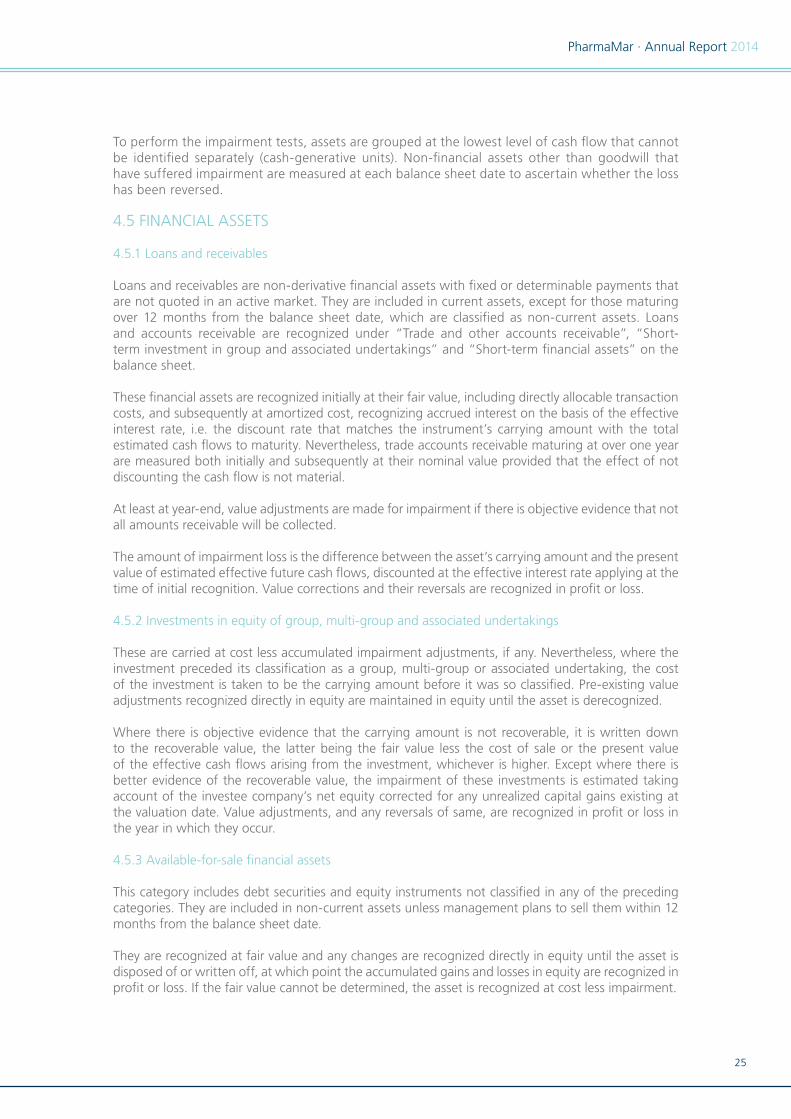
To perform the impairment tests, assets are grouped at the lowest level of cash flow that cannot be identified separately (cash-generative units). Non-financial assets other than goodwill that have suffered impairment are measured at each balance sheet date to ascertain whether the loss has been reversed.
4.5 FINANCIAL ASSETS
4.5.1 Loans and receivables
Loans and receivables are non-derivative financial assets with fixed or determinable payments that are not quoted in an active market. They are included in current assets, except for those maturing over 12 months from the balance sheet date, which are classified as non-current assets. Loans and accounts receivable are recognized under “Trade and other accounts receivable”, “Short-term investment in group and associated undertakings” and “Short-term financial assets” on the balance sheet.
These financial assets are recognized initially at their fair value, including directly allocable transaction costs, and subsequently at amortized cost, recognizing accrued interest on the basis of the effective interest rate, i.e. the discount rate that matches the instrument’s carrying amount with the total estimated cash flows to maturity. Nevertheless, trade accounts receivable maturing at over one year are measured both initially and subsequently at their nominal value provided that the effect of not discounting the cash flow is not material.
At least at year-end, value adjustments are made for impairment if there is objective evidence that not all amounts receivable will be collected.
The amount of impairment loss is the difference between the asset’s carrying amount and the present value of estimated effective future cash flows, discounted at the effective interest rate applying at the time of initial recognition. Value corrections and their reversals are recognized in profit or loss.
4.5.2 Investments in equity of group, multi-group and associated undertakings
These are carried at cost less accumulated impairment adjustments, if any. Nevertheless, where the investment preceded its classification as a group, multi-group or associated undertaking, the cost of the investment is taken to be the carrying amount before it was so classified. Pre-existing value adjustments recognized directly in equity are maintained in equity until the asset is derecognized.
Where there is objective evidence that the carrying amount is not recoverable, it is written down to the recoverable value, the latter being the fair value less the cost of sale or the present value of the effective cash flows arising from the investment, whichever is higher. Except where there is better evidence of the recoverable value, the impairment of these investments is estimated taking account of the investee company’s net equity corrected for any unrealized capital gains existing at the valuation date. Value adjustments, and any reversals of same, are recognized in profit or loss in the year in which they occur.
4.5.3 Available-for-sale financial assets
This category includes debt securities and equity instruments not classified in any of the preceding categories. They are included in non-current assets unless management plans to sell them within 12 months from the balance sheet date.
They are recognized at fair value and any changes are recognized directly in equity until the asset is disposed of or written off, at which point the accumulated gains and losses in equity are recognized in profit or loss. If the fair value cannot be determined, the asset is recognized at cost less impairment.
26
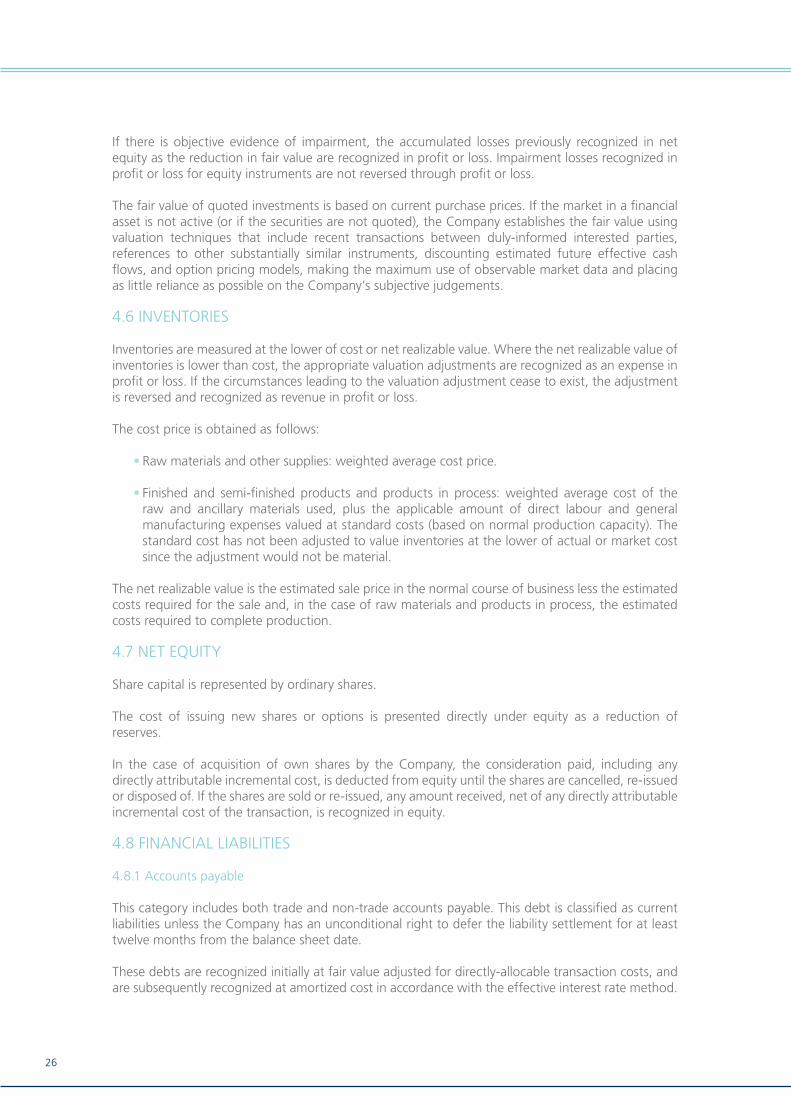
If there is objective evidence of impairment, the accumulated losses previously recognized in net equity as the reduction in fair value are recognized in profit or loss. Impairment losses recognized in profit or loss for equity instruments are not reversed through profit or loss.
The fair value of quoted investments is based on current purchase prices. If the market in a financial asset is not active (or if the securities are not quoted), the Company establishes the fair value using valuation techniques that include recent transactions between duly-informed interested parties, references to other substantially similar instruments, discounting estimated future effective cash flows, and option pricing models, making the maximum use of observable market data and placing as little reliance as possible on the Company’s subjective judgements.
4.6 INVENTORIES
Inventories are measured at the lower of cost or net realizable value. Where the net realizable value of inventories is lower than cost, the appropriate valuation adjustments are recognized as an expense in profit or loss. If the circumstances leading to the valuation adjustment cease to exist, the adjustment is reversed and recognized as revenue in profit or loss.
The cost price is obtained as follows:
Raw materials and other supplies: weighted average cost price.•
Finished and semi-finished products and products in process: weighted average cost of the •raw and ancillary materials used, plus the applicable amount of direct labour and general manufacturing expenses valued at standard costs (based on normal production capacity). The standard cost has not been adjusted to value inventories at the lower of actual or market cost since the adjustment would not be material.
The net realizable value is the estimated sale price in the normal course of business less the estimated costs required for the sale and, in the case of raw materials and products in process, the estimated costs required to complete production.
4.7 NET EQUITY
Share capital is represented by ordinary shares.
The cost of issuing new shares or options is presented directly under equity as a reduction of reserves.
In the case of acquisition of own shares by the Company, the consideration paid, including any directly attributable incremental cost, is deducted from equity until the shares are cancelled, re-issued or disposed of. If the shares are sold or re-issued, any amount received, net of any directly attributable incremental cost of the transaction, is recognized in equity.
4.8 FINANCIAL LIABILITIES
4.8.1 Accounts payable
This category includes both trade and non-trade accounts payable. This debt is classified as current liabilities unless the Company has an unconditional right to defer the liability settlement for at least twelve months from the balance sheet date.
These debts are recognized initially at fair value adjusted for directly-allocable transaction costs, and are subsequently recognized at amortized cost in accordance with the effective interest rate method.
27
PharmaMar · Annual Report 2014
The effective interest rate is the discount rate that matches the carrying amount of the instrument with the projected flow of future payments up to the liability’s maturity.
Nevertheless, trade accounts payable maturing at over one year which do not have a contractual interest rate are measured, both initially and subsequently, at their nominal value provided that the effect of not discounting the cash flows is not material.
If existing debts are renegotiated, no material changes are considered to exist if the new lender is the same as the initial lender and the present value of the cash flows, including net fees, does not differ by more than 10% from the present value of the outstanding cash flows payable on the original liability calculated using the same method.
4.9 SUBSIDIES RECEIVED
Repayable subsidies are recognized as liabilities until the conditions rendering them non-repayable are met; non-repayable subsidies are recognized as revenues directly in net equity and are recognized as revenue on a systematic, rational basis in line with the expenses arising from the subsidy. Non-repayable subsidies from shareholders are recognized directly in net equity.
For these purposes, a subsidy is considered to be non-repayable when there is an individual agreement to grant the subsidy, all the conditions established for granting it have been fulfilled, and there are no reasonable doubts that it will be collected.
Monetary subsidies are recognized at the fair value of the amount granted and non-monetary subsidies at the fair value of the received asset, at the time of recognition in both cases.
Non-repayable subsidies related to the acquisition of intangible assets, property, plant and equipment and investment property are recognized in profit or loss in proportion to the depreciation/amortization of the related assets or when the asset is disposed of, impaired or derecognized.
Non-repayable subsidies related to specific expenses are recognized in profit or loss in the year in which the corresponding expenses accrue, and those granted to offset an operating deficit are recognized in the year in which they are granted, except where they are allocated to offset operating deficits in future years, in which case they are recognized in those years.
Additionally, implicit interest on zero-rate loans from the Ministry of Industry to finance research and development activities is recognized as a non-refundable subsidy in equity. These subsidies are recognized in profit or loss in proportion to depreciation of the corresponding assets.
4.10 CURRENT AND DEFERRED TAXES
The income tax expense (revenue) is the amount accruing under this heading in the year and comprises the expense (revenue) for current and deferred taxes.
The expense (revenue) for current and deferred taxes is recognized in profit or loss. Nevertheless, the tax effect of items that are recognized directly in equity is recognized in equity.
Current tax assets and liabilities are recognized for the amount expected to be paid to, or recovered from, the tax authorities, in accordance with the legislation enacted or substantially enacted at year-end.
Deferred taxes are measured, in accordance with the liability method, based on the timing differences arising between the tax base of the assets and liabilities and their carrying amounts. However, deferred taxes arising from the initial recognition of an asset or liability in a transaction other than

28
a business combination that does not affect the accounting result or the tax base at the time of recognition are not recognized. The deferred tax is determined by applying the tax regulations and rates enacted or substantially enacted on the balance sheet date and which are expected to apply when the corresponding deferred tax asset is realized or the deferred tax liability is settled.
Deferred tax liabilities are recognized insofar as it is probable that there will be future taxable income to offset timing differences.
4.11 EMPLOYEE BENEFITS
4.11.1 Share-based compensation
The company operates a share-based compensation plan. On the one hand, the Company recognizes employee services received in exchange for shares or stock options as an expense at the time of obtainment, and it also recognizes the corresponding increase in net equity. The total amount that is expensed over the vesting period is determined by reference to the fair value of the shares or options granted.
Under the existing plans, the Company decides that executives and employees designated for this purpose receive from their employer, free of charge, the previously-established amount in shares and/or options, and it also establishes a multiplier coefficient, based on each beneficiary’s performance, which is applied to the amount of shares that the employee purchases. The vesting period is four years for the plans for 2011 and thereafter, counted from the date of delivery of the shares.
The delivery of shares is subject to a condition subsequent which is understood to be met in the event of voluntary severance or fair dismissal of the beneficiary. In the event of cessation of employment due to any other cause, the shares are deemed to have vested. The shares over which the condition subsequent exists are only those that should have remained under lock-up for four years.
4.11.2 Termination indemnities
Termination indemnities are paid to employees as a result of the Company’s decision to terminate the employment contract before the normal retirement age or when the employee agrees to resign in exchange for those benefits.
The Company recognizes these benefits when it has demonstrably decided to terminate the employees in accordance with an irrevocable formal detailed plan or to provide termination indemnities as a result of an offer to encourage voluntary retirement. Benefits that are not to be paid in the twelve months following the balance sheet date are discounted to their present value.
4.12 PROVISIONS AND CONTINGENT LIABILITIES
4.12.1 Provisions and contingent liabilities
Provisions for environmental restoration, restructuring costs and litigation are recognized when the Company has a present obligation, either legal or implicit, as a result of past events, an outflow of funds is likely to be necessary in the future to settle the obligation, and the amount can be estimated reliably. Restructuring provisions include lease cancellation penalties and employee termination indemnities. No provisions are recognized for future operating losses.
Provisions are calculated at the present value of the disbursement expected to be needed to settle the obligation, using a pre-tax rate that reflects current market measurements of the time value of money and the specific risks attached to the obligation. Adjustments due to updating the provision are recognized as a financial expense as they accrue.
29
PharmaMar · Annual Report 2014
Provisions maturing at one year or less that do not have a material financial effect are not discounted.
When part of the disbursement required to settle the provision is expected to be paid by a third party, the reimbursement is recognized as a separate asset provided that its collection is practically assured.
Obligations arising as a result of past events whose materialization is conditional upon the occurrence or non-occurrence of one or more future events outside the Company’s control are treated as contingent liabilities. Those contingent liabilities are not recognized in the accounts but are disclosed in detail in the notes to financial statements (Note 23).
Under “Other provisions”, the Company recognizes the provision for the estimated amount which it must pay as a result of possible litigation whose final outcome is unknown at the date of authorizing the financial statements.
4.12.2 Environment
The elements included in the Company’s assets for the purpose of long-term use in its activity and whose main objective is to minimize environmental impact and to protect and improve the environment are recognized as property, plant and equipment at their acquisition price or cost of production and are depreciated over their estimated useful life on the basis of the rates described for similar property, plant and equipment.
Environmental expenses arising from the aforementioned activities are treated as operating expenses in the year in which they accrue and as extraordinary expenses when they fall outside the Company’s normal activity.
An environmental provision is recognized for expenses arising in the year or previous years or when, at year-end, they are likely or certain but the exact amount and date have not been determined. A provision is also recognized for environmental actions due to the Company’s legal or contractual obligations and to commitments made to prevent or undo environmental damage.
4.13 RECOGNITION OF REVENUES
Revenues are recognized for the fair value of the consideration receivable and they represent amounts receivable for goods delivered and services provided in the ordinary course of the Company’s business, less returns, rebates, discounts and Value Added Tax.
The Company recognizes revenues when their amount can be measured reliably, the future economic benefits are likely to flow to the Company and the specific conditions for each activity are met, as detailed below. It is considered that the amount of revenues cannot be measured reliably until all the contingencies related to the sale have been resolved. The Company bases its estimates on past results, having regard to the type of customer, the type of transaction and the specific terms of each agreement.
4.13.1 Revenues from the sale of pharmaceutical products
The Company began commercialization of the product Yondelis® in the European Union in the fourth quarter of 2007. The Company has established a specialized regional sales structure to commercialize Yondelis® which covers the European Union and the Scandinavian countries that are not members of the EU, by entering into agreements with prestigious European organizations.
In certain Western European markets, PharmaMar has its own sales network in cooperation with Innovex (Quintiles Group) and a logistics agreement for product distribution in that market with UK company IDIS. The product becomes the property of the distributor once it is shipped from the
30
warehouse to hospitals, and it is at that time, in accordance with the established conditions, that the Company invoices the logistics operator and recognizes the sale, since that is the point at which the significant risks and benefits inherent to ownership of the goods are transferred, as the goods are on consignment at the distributor’s UK warehouse up to that point.
On 1 November 2009, PharmaMar began commercialising Yondelis® in Spain directly to hospitals using its own sales network.
In the rest of Europe, promotional and commercial distribution agreements have been signed with Swedish Orphan Biovitrium International for the Nordic countries and Eastern Europe, and with Genesis Pharma for Greece and Cyprus. In this model, the sale occurs once the product is shipped from the Company’s warehouse in Spain to the two distributors, since that is the point at which the significant risks and benefits inherent to ownership of the goods are transferred.
PharmaMar began selling Yondelis® in Switzerland via subsidiary PharmaMar AG in June 2010, in Portugal via distributor Movianto in May 2011, in Italy via subsidiary Pharma Mar S.r.l. in February 2013, and in Germany via subsidiary Pharma Mar GmbH in August 2014.
Prices and, where appropriate, reimbursement prices for our product are established by each country’s health authorities. The price obtained for Yondelis® is similar in all the countries where it is being sold.
Since it is a pharmaceutical product that requires special handling conditions, it is Company policy not to accept returns.
4.13.2 Revenues derived from the contract signed with Janssen Products LP
In 2001, the Company signed a licensing and co-development agreement with Ortho Biotech Products L.P. (OBP), a subsidiary of US group Johnson & Johnson. That agreement includes certain payments to PharmaMar, including an upfront payment and certain milestone payments connected with the development of Yondelis®.
In 2014, the Company recognized 1,250 thousand dollars in revenues under the agreement referred to in the preceding paragraph since it attained the milestone consisting of the presentation to the US Food and Drug Administration (FDA) of an application to market Yondelis® for treating certain patients with soft tissue sarcoma (Note 20.2).
In 2011, the Company signed another cooperation agreement with Janssen Products LP by virtue of which the initial payment was recognized as a revenue in the year, since it was a milestone that was not linked to future performance. Subsequent receipts correspond to the attainment of specific milestones linked to the development of Yondelis® and will be treated as revenues when they are attained (Note 20.2).
4.13.3 Revenues under the contract signed with Chugai Pharmaceutical Co., Ltd.
In 2014, the Company and Chugai Pharmaceutical Co., Ltd. signed an agreement to market Aplidin® in eight European countries, as a result of which the upfront payment envisaged in the contract was recognized as revenues in the year since it was linked to the conclusion of the Phase III trial in multiple myeloma and, consequently, directly related to the number of patients enrolled in that trial to date (Note 20.2).
Any subsequent receipts will be linked to the attainment of specific milestones linked to the development of Aplidin® and other regulatory and commercial goals and will be recognized as revenues when they are attained.

31
PharmaMar · Annual Report 2014
4.13.4 Revenues under the contract signed with Taiho Pharmaceutical Co.
In 2009, PharmaMar signed a licensing agreement with Taiho Pharmaceutical Co. for the development and marketing of Yondelis® in the Japanese market. Upon receipt of the agreement, PharmaMar collected an upfront payment of 1 billion yen. The agreement envisages additional payments by Taiho for attaining milestones in the development and marketing of Yondelis®, and the payment of royalties to PharmaMar for sales made by Taiho once authorisation is obtained to market the drug in Japan. In January 2015, Taiho filed an application with the Japanese regulator (PMDA) for authorisation to commercialize Yondelis® for the treatment of several soft tissue sarcoma subtypes (Note 29).
4.13.5 Royalties
Royalties received from sales in countries outside of the European Union are recognized on an accrual basis.
4.13.6 Interest revenues
Interest revenues are recognized using the effective interest rate method. Where an account receivable is impaired, the Company writes the carrying amount down to the recoverable value, discounting estimated future cash flows at the instrument’s original effective interest rate, and carries the discount as a reduction in interest revenues. Interest revenues on loans that have suffered impairment are recognized using the effective interest rate method.
4.14 LEASES
When the company is the lessee, leases where the lessor retains a substantial part of the risks and benefits of ownership are classified as operating leases. Operating lease payments (net of any incentive received from the lessor) are recognized in profit or loss on a straight-line basis over the lease term.
4.15 FOREIGN CURRENCY TRANSACTIONS
4.15.1 Functional and presentation currency
The Company’s financial statements are presented in euro, which is the Company’s functional and presentation currency.
4.15.2 Transactions and balances
Foreign currency transactions are translated to the functional currency at the exchange rates ruling on the transaction date. Exchange gains or losses arising on the settlement of those transactions and on translating monetary assets and liabilities denominated in foreign currency at the year-end exchange rate are recognized in profit or loss, except when deferred in net equity as a qualifying cash flow hedge or qualifying net investment hedge.
Changes in the fair value of available-for-sale financial assets denominated in foreign currency are analysed as the exchange differences resulting from changes in the amortized cost of the instrument and other changes in the security’s carrying amount. Exchange differences are recognized in profit or loss and other changes to the carrying amount are recognized in net equity.
Exchange differences on non-monetary items, such as equity instruments at fair value through profit or loss, are presented as part of that gain or loss in fair value. Exchange differences on non-monetary items, such as available-for-sale equity instruments, are included in net equity.
32
4.16 RELATED-PARTY TRANSACTIONS
Related-party transactions are generally recognized initially at fair value. If the agreed price differs from fair value, the difference is recognized on the basis of the economic reality of the transaction. Subsequent measurements are performed in accordance with the corresponding regulations.
4.17 NON-RECOURSE FACTORING
The Company derecognizes financial assets when it assigns the rights to the cash flows of the financial asset and has transferred substantially all the risks and rewards inherent to ownership, such as factoring of trade accounts receivable in which the company does not retain any credit or default risk.
5. RISK POLICY AND MANAGEMENT
5.1 FINANCIAL RISK FACTORS
The Company’s activities are subject to a number of financial risks: market risk (including exchange rate risk, interest rate risk and price risk), credit risk, and liquidity risk. The Company’s overall risk management programme focuses on the uncertainty of the financial markets and tries to minimise the potential adverse effects on the Company’s returns.
Risk management is controlled by the Company’s Finance Department, which identifies, evaluates and hedges financial risks in accordance with the overall policies of Grupo Zeltia and those approved by the Board of Directors.
Grupo Zeltia establishes written guidelines for overall risk management and for specific areas such as exchange rate risks, interest rate risks, liquidity risks, the use of derivatives and non-derivatives, and investment of surplus liquidity.
5.1.1 Market risk
5.1.1.1 Price risk
The Company’s long-term financial investments are securities of biopharmaceutical companies. The volume of investment in this type of asset is not material in the context of the Company’s operations; accordingly, the related price risk is very low.
5.1.1.2 Exchange rate risk
The Company operates internationally and, therefore, is exposed to exchange rate risk on transactions in foreign currencies, particularly the US dollar. Exchange rate risks arise from future commercial transactions, recognized assets and liabilities, and net investments in foreign operations.
Transactions denominated in currencies other than the euro, basically in US dollars, Swiss francs and pounds sterling, amounted to approximately 28,510 thousand euro in the year ended 31 December 2014 (25,790 thousand euro in 2013) (Note 20). The main transaction in foreign currency in 2014 and 2013 was the revenue from the Johnson & Johnson Group (25 million dollars in each year). The increase in transactions with respect to 2013 is due fundamentally to receipt of one of the milestone payments under the cooperation agreement signed in 2001 with Johnson & Johnson (Note 4.13.2).
Management does not consider it necessary to establish any policy for hedging the foreign currency risk vs. the functional currency.
33
PharmaMar · Annual Report 2014
5.1.1.3 Interest rate risk on cash flows and fair values
The Company has interest rate risk on the cash flows related to long-term debt at floating rates. Nevertheless, a sizeable part of the debt is in the form of repayable advances that are not subject to interest rate risk.
The Company’s interest rate risk arises on long-term debt. Floating-rate debt exposes the Company to interest rate risk. Additionally, fixed-rate debt exposes the Group to interest rate risk on the fair value. It is Company policy for as much of its debt as possible to be due to official authorities.
The Company analyses its exposure to interest rate risk dynamically. It simulates a number of scenarios considering refinancing, roll-overs, alternative financing and hedging. Based on those scenarios, the Company calculates the effect on income of a given variation in interest rates. In a given simulation, it assumes the same change in interest rates in all currencies.
The scenarios are applied only to the largest interest-bearing liabilities.
5.1.2 Credit risk
Credit risk is managed in groups. Credit risk arises from cash and cash equivalents arranged with banks and financial institutions, and from customer balances.
The banks and financial institutions with which the Company works generally have independent ratings. Where customers have an independent rating, that rating is used; otherwise, the Company assesses the risk based on the customer’s financial position, past experience and other factors. Where there is no doubt about a customer’s solvency, no credit limits are set.
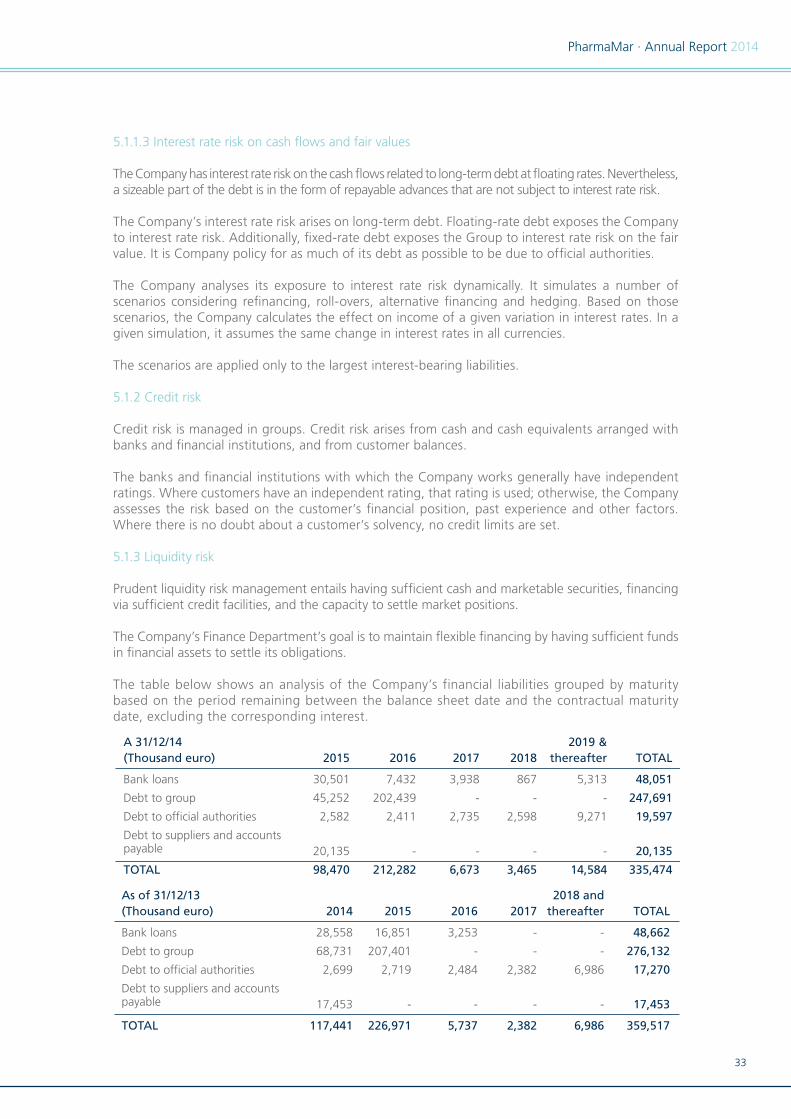
5.1.3 Liquidity risk
Prudent liquidity risk management entails having sufficient cash and marketable securities, financing via sufficient credit facilities, and the capacity to settle market positions.
The Company’s Finance Department’s goal is to maintain flexible financing by having sufficient funds in financial assets to settle its obligations.
The table below shows an analysis of the Company’s financial liabilities grouped by maturity based on the period remaining between the balance sheet date and the contractual maturity date, excluding the corresponding interest.
A 31/12/14 2019 & (Thousand euro) 2015 2016 2017 2018 thereafter TOTAL
Bank loans 30,501 7,432 3,938 867 5,313 48,051
Debt to group 45,252 202,439 - - - 247,691
Debt to official authorities 2,582 2,411 2,735 2,598 9,271 19,597
Debt to suppliers and accounts payable 20,135 - - - - 20,135
TOTAL 98,470 212,282 6,673 3,465 14,584 335,474
As of 31/12/13 2018 and (Thousand euro) 2014 2015 2016 2017 thereafter TOTAL
Bank loans 28,558 16,851 3,253 - - 48,662
Debt to group 68,731 207,401 - - - 276,132
Debt to official authorities 2,699 2,719 2,484 2,382 6,986 17,270
Debt to suppliers and accountspayable 17,453 - - - - 17,453
TOTAL 117,441 226,971 5,737 2,382 6,986 359,517

34
5.2 FAIR VALUE ESTIMATES
The fair value of financial instruments that are traded in an active market (e.g. securities held for trading and available for sale) is based on the market prices on the balance sheet date. The market price used for financial assets is the current bid price.
The fair value of financial instruments that are not traded in an active market is determined by using measurement techniques. The Company uses a variety of methods and makes assumptions based on the market conditions at each balance sheet date. Listed market prices or agent quotations are used for long-term debt. To determine the fair value of the other financial instruments, other techniques are used, such as discounting estimated cash flow. The fair value of forward exchange rate contracts is determined by using the exchange rates quoted in the market on the balance sheet date.
The carrying amount of trade accounts payable and receivable is assumed to approximate to their fair value. The fair value for the purposes of presenting the financial information is estimated by discounting the contractual future cash flow at the current market interest rate available to the Company for similar financial instruments.
The fair value of repayable advances that are interest-free or at a subsidized interest rate is determined by applying, to the repayments to be made, the yield curve in force on the date of receipt of the advance plus the spread normally paid by the Company on loans.
For the purposes of presenting the financial information, the fair value was calculated at year-end by applying the existing yield curve, plus the corresponding spread, to the outstanding payments.
The fair value of floating-rate loans is assumed to coincide with the carrying amount.
6. INTANGIBLE ASSETS
The breakdown and changes in the “Intangible Assets” account as of 31 December 2014 and 2013 are as follows:
2014
(Thousand euro) DevelopmentComputersoftware Other assets TOTAL
Cost
BALANCE AS OF 01.01.2014 610,229 1,904 195 612,328
Recognitions 54,228 133 - 54,361
Transfers - - - -
Derecognitions -31,236 - -195 -31,431
BALANCE AS OF 31.12.2014 633,221 2,037 - 635,258
Accumulated depreciation and amortization
BALANCE AS OF 01.01.2014 -198,280 -1,443 -195 -199,918
Provisions -29,778 -146 - -29,924
Derecognitions - - 195 195
Write-offs 11,267 - - 11,267
BALANCE AS OF 31.12.2014 -216,791 -1,589 - -218,380
NET CARRYING AMOUNT AS OF 31.12.2014 416,430 448 - 416,878

35
PharmaMar · Annual Report 2014
6.1 RESEARCH AND DEVELOPMENT
Capitalized research and development expenses relate to the following projects:
In the fourth quarter of 2014, the Company derecognised certain compounds whose carrying amount was 19,968 thousand euro as of the date of derecognition. Although the results were still positive at that date, it was decided to discontinue the research for strategic reasons.
In 2013, the Company derecognised certain compounds amounting to 11,268 thousand euro, since the specific research programmes in those compounds had not yielded favourable results. In 2014, the Company derecognised those compounds and their corresponding impairment with no impact on the profit and loss account.
In 2012, the Company amortized a part of the expenses capitalized for the compound Irvalec® in the amount of 17,076 thousand euro, after notifying the National Securities Market Commission of its intention to suspend development of that compound for all therapeutic uses except for the oesophageal cancer subtype. In 2014, it amortized 1,927 thousand euro (1,927 thousand euro in 2013).
In 2014 and 2013, the Company amortized 4,675 thousand euro and 8,817 thousand euro for platinum-sensitive relapsed ovarian cancer and soft tissue sarcoma, respectively; the amortization calendar for both indications is 10 years. Other amortizations in 2014 associated with Yondelis® amounted to 1,985 thousand euro (1,277 thousand euro in 2013).
2013
(Thousand euro) DevelopmentComputersoftware Other assets TOTAL
Cost
BALANCE AS OF 01.01.2013 563,451 2,110 195 565,756
Recognitions 46,778 287 - 47,065
Transfers - -105 - -105
Derecognitions - -388 - -388
BALANCE AS OF 31.12.2013 610,229 1,904 195 612,328
Accumulated depreciation and amortization
BALANCE AS OF 01.01.2013 -154,879 -1,683 -195 -156,756
Provisions -32,133 -148 - -32,281
Derecognitions - 388 - 388
Impairment -11,268 - - -11,268
BALANCE AS OF 31.12.2013 -198,280 -1,443 -195 -199,918
NET CARRYING AMOUNT AS OF 31.12.2013 411,949 461 - 412,410
2014 2013
PROJECT(Thousand euro) Cost
Accum.Depr. Impairment Net
Performed in-house
Antitumour 628,994 -212,564 - 416,430 606,003 -182,786 -11,268 411,949
Antimalarial 2,774 -2,774 - - 2,774 -2,774 - -
Immunosuppressors 858 -858 - - 858 -858 - -
Antiviral 595 -595 - - 595 -595 - -
TOTAL 633,221 -216,791 - 416,430 610,230 -187,013 -11,268 411.949
CostAccum.
Depr. Impairment Net
36
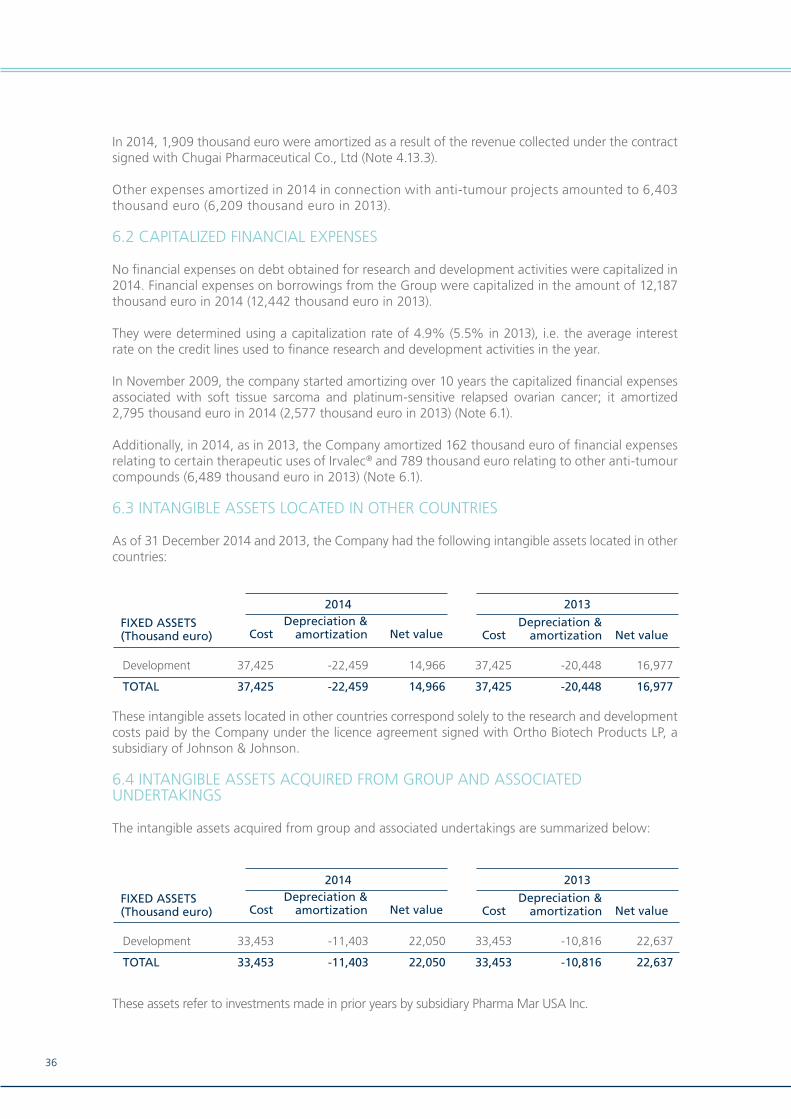
In 2014, 1,909 thousand euro were amortized as a result of the revenue collected under the contract signed with Chugai Pharmaceutical Co., Ltd (Note 4.13.3).
Other expenses amortized in 2014 in connection with anti-tumour projects amounted to 6,403 thousand euro (6,209 thousand euro in 2013).
6.2 CAPITALIZED FINANCIAL EXPENSES
No financial expenses on debt obtained for research and development activities were capitalized in 2014. Financial expenses on borrowings from the Group were capitalized in the amount of 12,187 thousand euro in 2014 (12,442 thousand euro in 2013).
They were determined using a capitalization rate of 4.9% (5.5% in 2013), i.e. the average interest rate on the credit lines used to finance research and development activities in the year.
In November 2009, the company started amortizing over 10 years the capitalized financial expenses associated with soft tissue sarcoma and platinum-sensitive relapsed ovarian cancer; it amortized 2,795 thousand euro in 2014 (2,577 thousand euro in 2013) (Note 6.1).
Additionally, in 2014, as in 2013, the Company amortized 162 thousand euro of financial expenses relating to certain therapeutic uses of Irvalec® and 789 thousand euro relating to other anti-tumour compounds (6,489 thousand euro in 2013) (Note 6.1).
6.3 INTANGIBLE ASSETS LOCATED IN OTHER COUNTRIES
As of 31 December 2014 and 2013, the Company had the following intangible assets located in other countries:
These intangible assets located in other countries correspond solely to the research and development costs paid by the Company under the licence agreement signed with Ortho Biotech Products LP, a subsidiary of Johnson & Johnson.
6.4 INTANGIBLE ASSETS ACQUIRED FROM GROUP AND ASSOCIATED UNDERTAKINGS
The intangible assets acquired from group and associated undertakings are summarized below:
These assets refer to investments made in prior years by subsidiary Pharma Mar USA Inc.
20132014
FIXED ASSETS(Thousand euro) Cost Net value
Depreciation &amortization Cost Net value
Depreciation &amortization
Development 37,425 -22,459 14,966 37,425 -20,448 16,977
TOTAL 37,425 -22,459 14,966 37,425 -20,448 16,977
20132014
FIXED ASSETS(Thousand euro) Cost Net value
Depreciation &amortization Cost Net value
Depreciation &amortization
Development 33,453 -11,403 22,050 33,453 -10,816 22,637
TOTAL 33,453 -11,403 22,050 33,453 -10,816 22,637
37
PharmaMar · Annual Report 2014
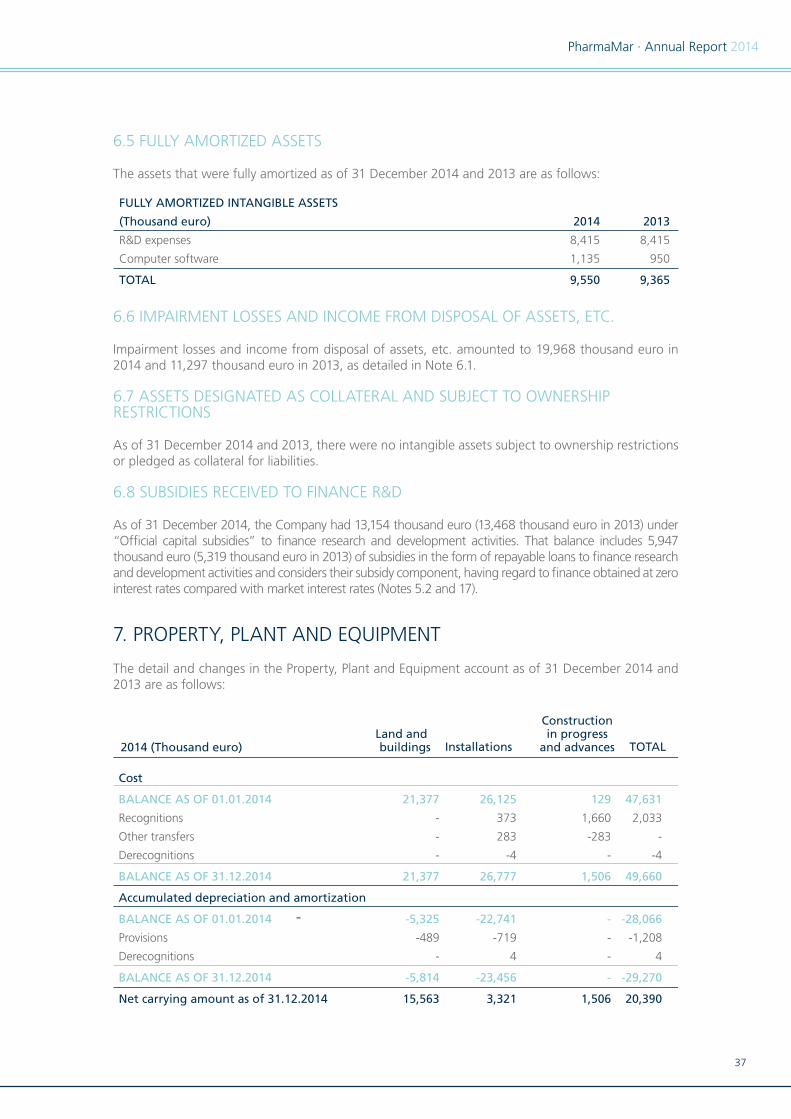
6.5 FULLY AMORTIZED ASSETS
The assets that were fully amortized as of 31 December 2014 and 2013 are as follows:
6.6 IMPAIRMENT LOSSES AND INCOME FROM DISPOSAL OF ASSETS, ETC.
Impairment losses and income from disposal of assets, etc. amounted to 19,968 thousand euro in 2014 and 11,297 thousand euro in 2013, as detailed in Note 6.1.
6.7 ASSETS DESIGNATED AS COLLATERAL AND SUBJECT TO OWNERSHIP RESTRICTIONS
As of 31 December 2014 and 2013, there were no intangible assets subject to ownership restrictions or pledged as collateral for liabilities.
6.8 SUBSIDIES RECEIVED TO FINANCE R&D
As of 31 December 2014, the Company had 13,154 thousand euro (13,468 thousand euro in 2013) under “Official capital subsidies” to finance research and development activities. That balance includes 5,947 thousand euro (5,319 thousand euro in 2013) of subsidies in the form of repayable loans to finance research and development activities and considers their subsidy component, having regard to finance obtained at zero interest rates compared with market interest rates (Notes 5.2 and 17).
7. PROPERTY, PLANT AND EQUIPMENT
The detail and changes in the Property, Plant and Equipment account as of 31 December 2014 and 2013 are as follows:
FULLY AMORTIZED INTANGIBLE ASSETS
(Thousand euro) 2014 2013
R&D expenses 8,415 8,415
Computer software 1,135 950
TOTAL 9,550 9,365
2014 (Thousand euro)Land and buildings Installations
Constructionin progress
and advances TOTAL
Cost
BALANCE AS OF 01.01.2014 21,377 26,125 129 47,631
Recognitions - 373 1,660 2,033
Other transfers - 283 -283 -
Derecognitions - -4 - -4
BALANCE AS OF 31.12.2014 21,377 26,777 1,506 49,660
Accumulated depreciation and amortization
BALANCE AS OF 01.01.2014 -5,325 -22,741 - -28,066
Provisions -489 -719 - -1,208
Derecognitions - 4 - 4
BALANCE AS OF 31.12.2014 -5,814 -23,456 - -29,270
Net carrying amount as of 31.12.2014 15,563 3,321 1,506 20,390

38
As of 31 December 2014, the net carrying amount of land and structures was 6,699 thousand euro and 8,864 thousand euro, respectively (6,699 thousand euro and 9,353 thousand euro, respectively, in 2013).
The main recognition in 2014 was the construction of a fermentation chamber which had not been completed at year-end.
7.1 IMPAIRMENT LOSSES
No impairment losses on any property, plant and equipment items were recognized or reversed in 2014 and 2013.
7.2 ASSETS ACQUIRED FROM GROUP AND ASSOCIATED UNDERTAKINGS
No assets were acquired from group or associated companies in 2014 or 2013.
7.3 FULLY DEPRECIATED ASSETS
As of 31 December 2014, the Company was using assets with a carrying amount of 20,038 thousand euro which had been fully depreciated (19,357 thousand euro as of 31 December 2013).
7.4 PROPERTY, PLANT AND EQUIPMENT PLEDGED AS COLLATERAL
The Company’s building in Colmenar Viejo is mortgaged to secure the repayment of certain loans obtained from financial institutions. The mortgage loan maturing in September 2015 was rolled over into a new mortgage loan maturing in June 2024.
The detail of mortgaged assets and their relation to the loan transactions is as follows (in thousand euro):
2013 (Thousand euro)Land andbuildings Installations
Constructionin progress
and advances TOTAL
Cost
BALANCE AS OF 01.01.2013 21,377 25,505 96 46,978
Recognitions - 392 180 572
Other transfers - 249 -147 102
Derecognitions - -21 - -21
BALANCE AS OF 31.12.2013 21,377 26,125 129 47,631
Accumulated depreciation and amortization
BALANCE AS OF 01.01.2013 -4,836 -21,956 - -26,792
Provisions -489 -820 - -1,309
Derecognitions - 35 - 35
BALANCE AS OF 31.12.2013 -5,325 -22,741 - -28,066
Net carrying amount as of 31.12.2013 16,052 3,384 129 19,565
LOCATION(Thousand euro)
LOCATION(Thousand euro)
Av. de los Reyes nº 1Colmenar Viejo (Madrid)
Amount outstanding
31/12/13
Amount outstanding
31/12/14
8,617
2,608Av. de los Reyes nº 1Colmenar Viejo (Madrid)
Net value31/12/14
Net value31/12/13
11,184
11,673
Amount ofloan
Amount ofloan
9,000
12,600
Maturity
June 2024
September
2015
Maturity
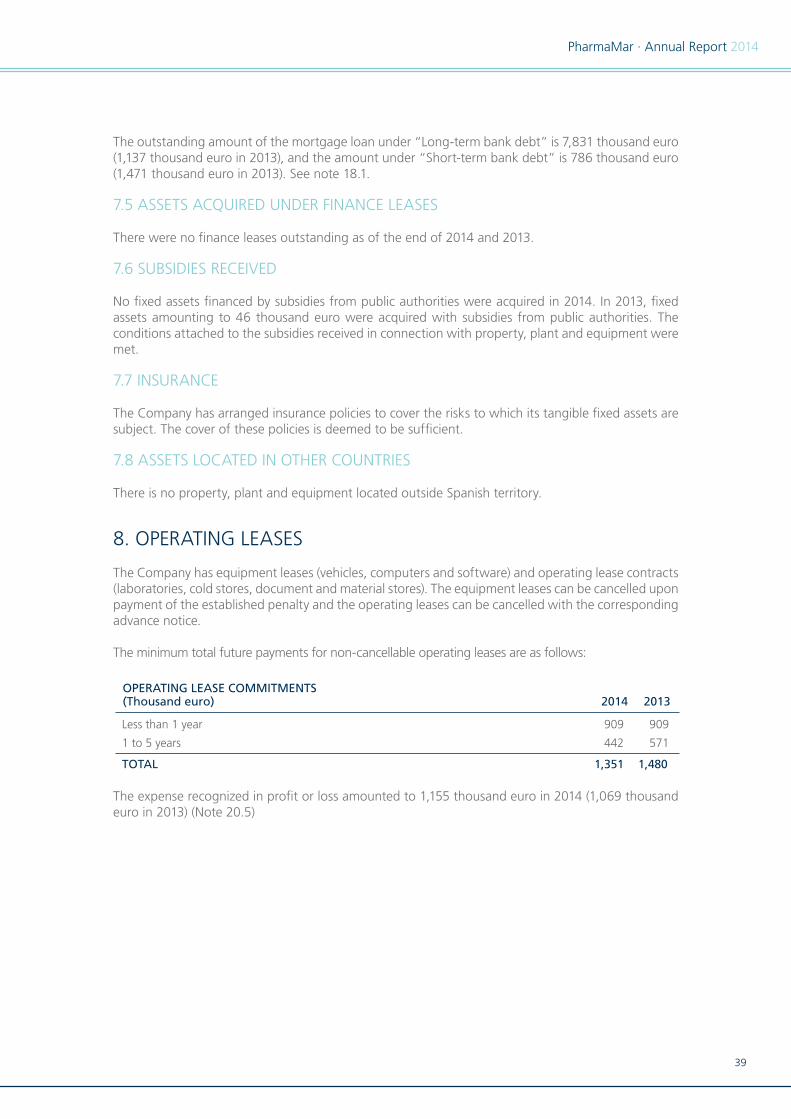
39
PharmaMar · Annual Report 2014
The outstanding amount of the mortgage loan under “Long-term bank debt” is 7,831 thousand euro (1,137 thousand euro in 2013), and the amount under “Short-term bank debt” is 786 thousand euro (1,471 thousand euro in 2013). See note 18.1.
7.5 ASSETS ACQUIRED UNDER FINANCE LEASES
There were no finance leases outstanding as of the end of 2014 and 2013.
7.6 SUBSIDIES RECEIVED
No fixed assets financed by subsidies from public authorities were acquired in 2014. In 2013, fixed assets amounting to 46 thousand euro were acquired with subsidies from public authorities. The conditions attached to the subsidies received in connection with property, plant and equipment were met.
7.7 INSURANCE
The Company has arranged insurance policies to cover the risks to which its tangible fixed assets are subject. The cover of these policies is deemed to be sufficient.
7.8 ASSETS LOCATED IN OTHER COUNTRIES
There is no property, plant and equipment located outside Spanish territory.
8. OPERATING LEASES
The Company has equipment leases (vehicles, computers and software) and operating lease contracts (laboratories, cold stores, document and material stores). The equipment leases can be cancelled upon payment of the established penalty and the operating leases can be cancelled with the corresponding advance notice.
The minimum total future payments for non-cancellable operating leases are as follows:
The expense recognized in profit or loss amounted to 1,155 thousand euro in 2014 (1,069 thousand euro in 2013) (Note 20.5)
2014 2013OPERATING LEASE COMMITMENTS
(Thousand euro)
Less than 1 year 909 909
1 to 5 years 442 571
TOTAL 1,351 1,480
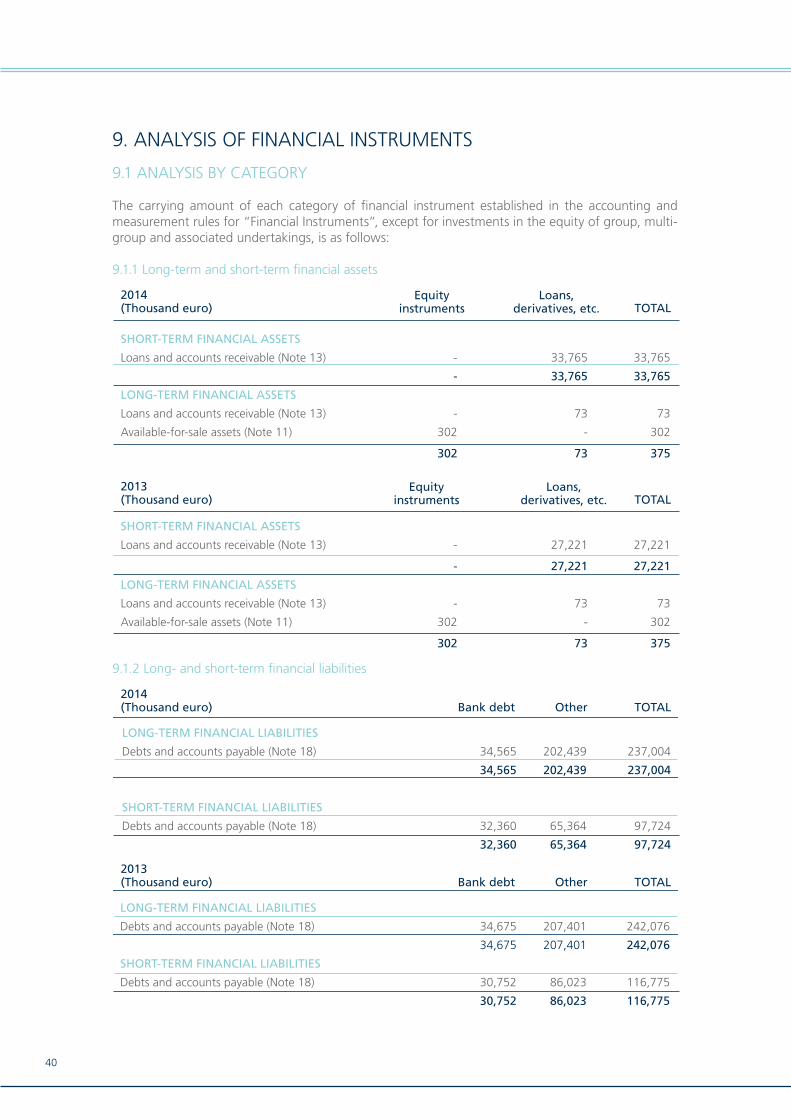
40
9. ANALYSIS OF FINANCIAL INSTRUMENTS
9.1 ANALYSIS BY CATEGORY
The carrying amount of each category of financial instrument established in the accounting and measurement rules for “Financial Instruments”, except for investments in the equity of group, multi-group and associated undertakings, is as follows:
9.1.1 Long-term and short-term financial assets
9.1.2 Long- and short-term financial liabilities
2014(Thousand euro) TOTAL
Equityinstruments
Loans,derivatives, etc.
SHORT-TERM FINANCIAL ASSETS
Loans and accounts receivable (Note 13) - 33,765 33,765
- 33,765 33,765
LONG-TERM FINANCIAL ASSETS
Loans and accounts receivable (Note 13) - 73 73
Available-for-sale assets (Note 11) 302 - 302
302 73 375
2013(Thousand euro) TOTAL
Equityinstruments
Loans,derivatives, etc.
SHORT-TERM FINANCIAL ASSETS
Loans and accounts receivable (Note 13) - 27,221 27,221
- 27,221 27,221
LONG-TERM FINANCIAL ASSETS
Loans and accounts receivable (Note 13) - 73 73
Available-for-sale assets (Note 11) 302 - 302
302 73 375
2014(Thousand euro) TOTALBank debt Other
LONG-TERM FINANCIAL LIABILITIES
Debts and accounts payable (Note 18) 34,565 202,439 237,004
34,565 202,439 237,004
SHORT-TERM FINANCIAL LIABILITIES
Debts and accounts payable (Note 18) 32,360 65,364 97,724
32,360 65,364 97,724
2013(Thousand euro) TOTALBank debt Other
LONG-TERM FINANCIAL LIABILITIES
Debts and accounts payable (Note 18) 34,675 207,401 242,076
34,675 207,401 242,076
SHORT-TERM FINANCIAL LIABILITIES
Debts and accounts payable (Note 18) 30,752 86,023 116,775
30,752 86,023 116,775
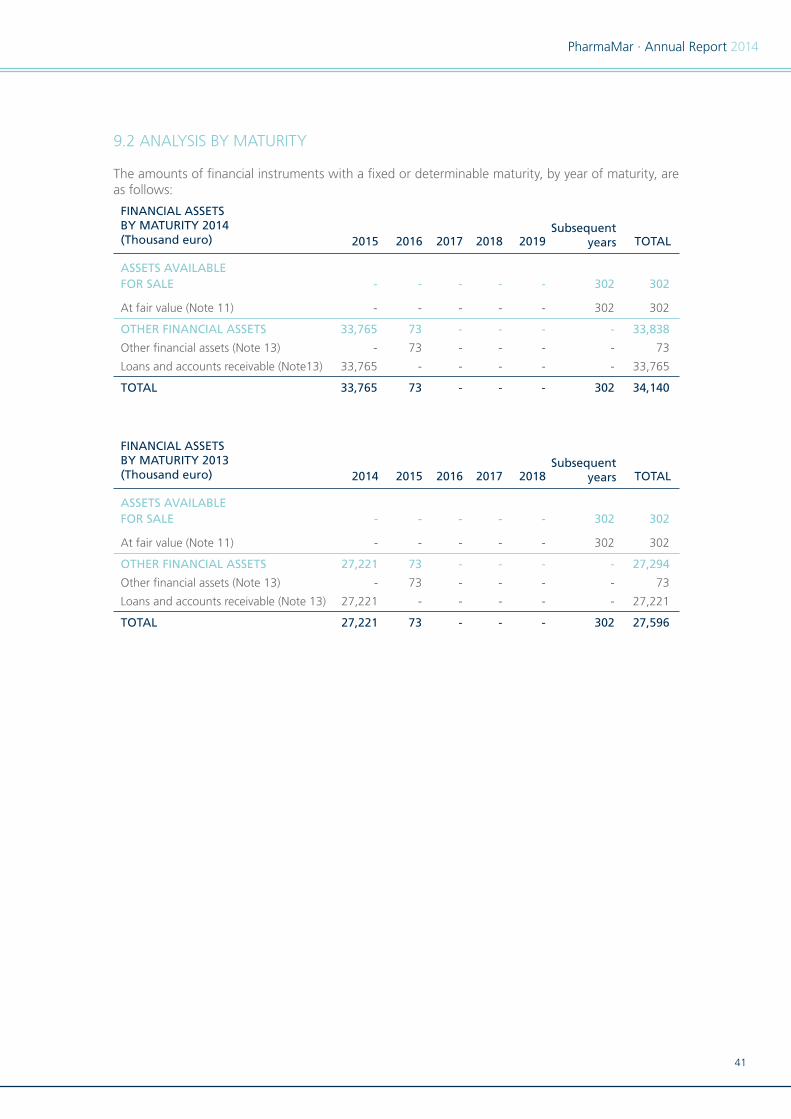
41
PharmaMar · Annual Report 2014
9.2 ANALYSIS BY MATURITY
The amounts of financial instruments with a fixed or determinable maturity, by year of maturity, are as follows:
FINANCIAL ASSETSBY MATURITY 2013(Thousand euro) 2016 2017 2018
Subsequentyears TOTAL20152014
ASSETS AVAILABLEFOR SALE - - - - - 302 302
At fair value (Note 11) - - - - - 302 302
OTHER FINANCIAL ASSETS 27,221 73 - - - - 27,294
Other financial assets (Note 13) - 73 - - - - 73
Loans and accounts receivable (Note 13) 27,221 - - - - - 27,221
TOTAL 27,221 73 - - - 302 27,596
FINANCIAL ASSETSBY MATURITY 2014(Thousand euro) 2017 2018 2019
Subsequentyears TOTAL20162015
ASSETS AVAILABLEFOR SALE - - - - - 302 302
At fair value (Note 11) - - - - - 302 302
OTHER FINANCIAL ASSETS 33,765 73 - - - - 33,838
Other financial assets (Note 13) - 73 - - - - 73
Loans and accounts receivable (Note13) 33,765 - - - - - 33,765
TOTAL 33,765 73 - - - 302 34,140
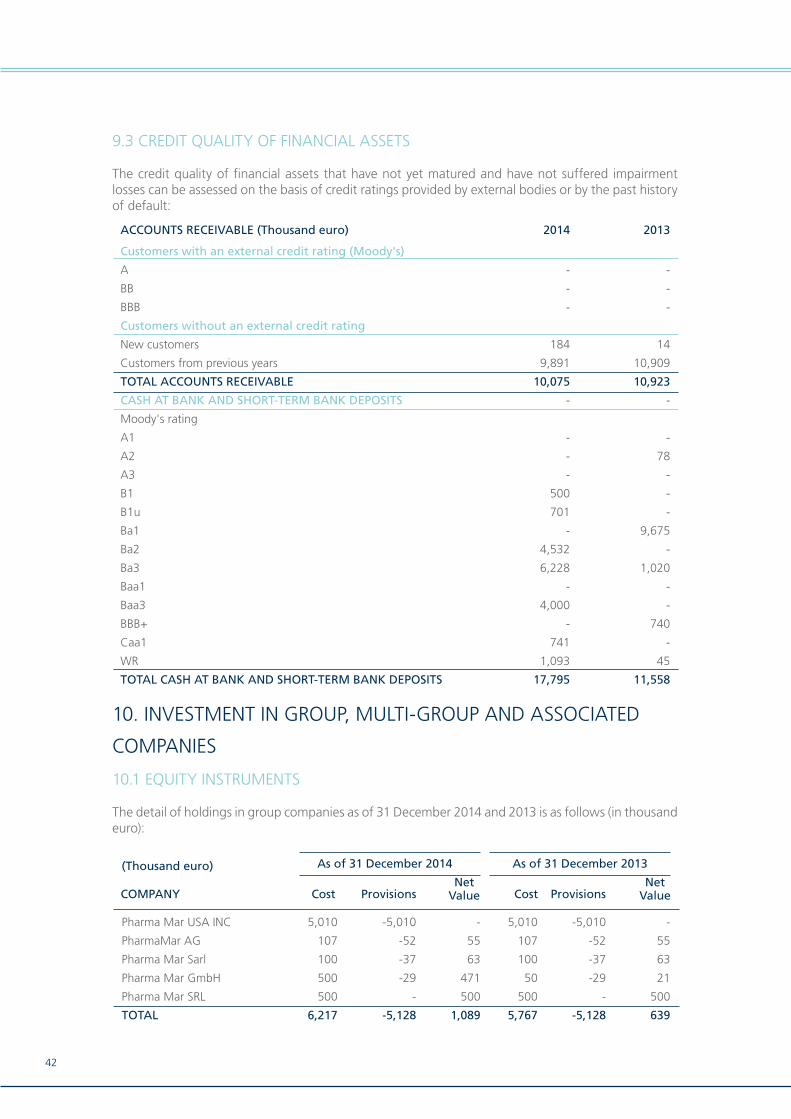
42
9.3 CREDIT QUALITY OF FINANCIAL ASSETS
The credit quality of financial assets that have not yet matured and have not suffered impairment losses can be assessed on the basis of credit ratings provided by external bodies or by the past history of default:
10. INVESTMENT IN GROUP, MULTI-GROUP AND ASSOCIATED
COMPANIES
10.1 EQUITY INSTRUMENTS
The detail of holdings in group companies as of 31 December 2014 and 2013 is as follows (in thousand euro):
ACCOUNTS RECEIVABLE (Thousand euro) 2014 2013
Customers with an external credit rating (Moody's)
A - -
BB - -
BBB - -
Customers without an external credit rating
New customers 184 14
Customers from previous years 9,891 10,909
TOTAL ACCOUNTS RECEIVABLE 10,075 10,923
CASH AT BANK AND SHORT-TERM BANK DEPOSITS - -
Moody's rating
A1 - -
A2 - 78
A3 - -
B1 500 -
B1u 701 -
Ba1 - 9,675
Ba2 4,532 -
Ba3 6,228 1,020
Baa1 - -
Baa3 4,000 -
BBB+ - 740
Caa1 741 -
WR 1,093 45
TOTAL CASH AT BANK AND SHORT-TERM BANK DEPOSITS 17,795 11,558
As of 31 December 2014 As of 31 December 2013
CostNet
ValueProvisions ProvisionsNet
ValueCostCOMPANY
(Thousand euro)
Pharma Mar USA INC 5,010 -5,010 - 5,010 -5,010 -
PharmaMar AG 107 -52 55 107 -52 55
Pharma Mar Sarl 100 -37 63 100 -37 63
Pharma Mar GmbH 500 -29 471 50 -29 21
Pharma Mar SRL 500 - 500 500 - 500
TOTAL 6,217 -5,128 1,089 5,767 -5,128 639
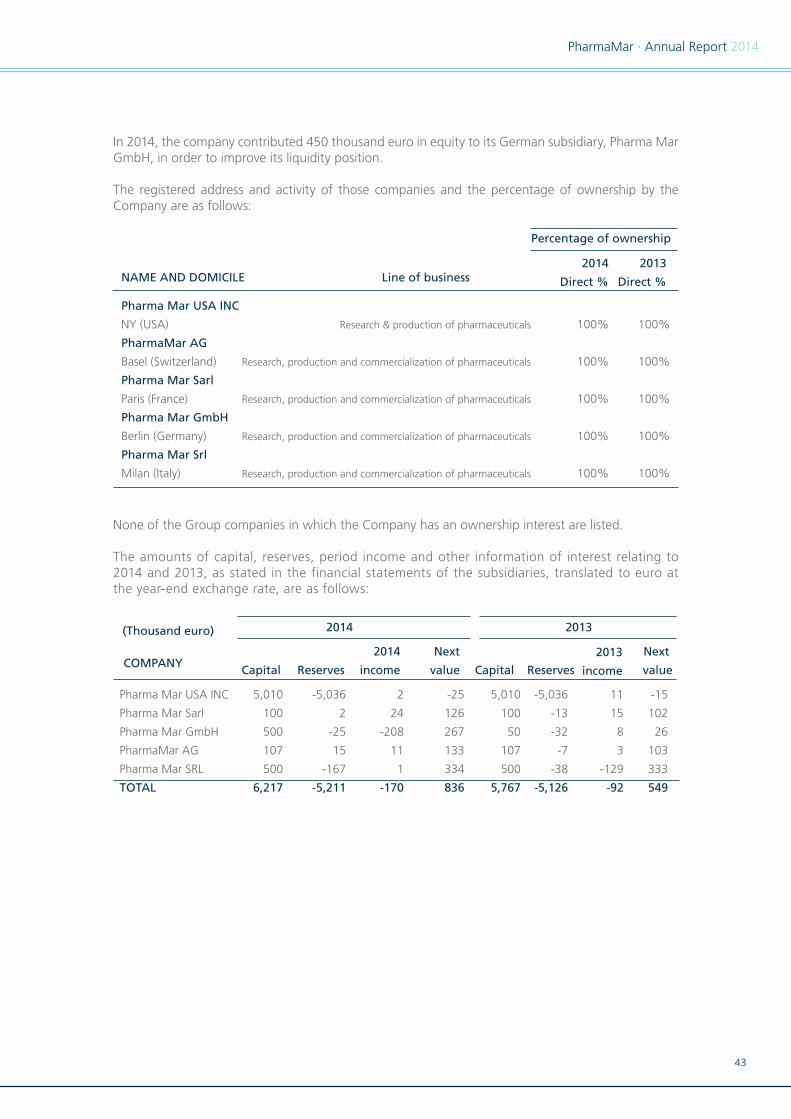
43
PharmaMar · Annual Report 2014
In 2014, the company contributed 450 thousand euro in equity to its German subsidiary, Pharma Mar GmbH, in order to improve its liquidity position.
The registered address and activity of those companies and the percentage of ownership by the Company are as follows:
None of the Group companies in which the Company has an ownership interest are listed.
The amounts of capital, reserves, period income and other information of interest relating to 2014 and 2013, as stated in the financial statements of the subsidiaries, translated to euro at the year-end exchange rate, are as follows:
Percentage of ownership
NAME AND DOMICILE2014
Direct %
2013
Direct %Line of business
Pharma Mar USA INC
NY (USA) Research & production of pharmaceuticals 100% 100%
PharmaMar AG
Basel (Switzerland) Research, production and commercialization of pharmaceuticals 100% 100%
Pharma Mar Sarl
Paris (France) Research, production and commercialization of pharmaceuticals 100% 100%
Pharma Mar GmbH
Berlin (Germany) Research, production and commercialization of pharmaceuticals 100% 100%
Pharma Mar Srl
Milan (Italy) Research, production and commercialization of pharmaceuticals 100% 100%
2014 2013
COMPANYCapital
2014
incomeReserves
Next
value Capital
2013
incomeReserves
Next
value
(Thousand euro)
Pharma Mar USA INC 5,010 -5,036 2 -25 5,010 -5,036 11 -15
Pharma Mar Sarl 100 2 24 126 100 -13 15 102
Pharma Mar GmbH 500 -25 -208 267 50 -32 8 26
PharmaMar AG 107 15 11 133 107 -7 3 103
Pharma Mar SRL 500 -167 1 334 500 -38 -129 333
TOTAL 6,217 -5,211 -170 836 5,767 -5,126 -92 549
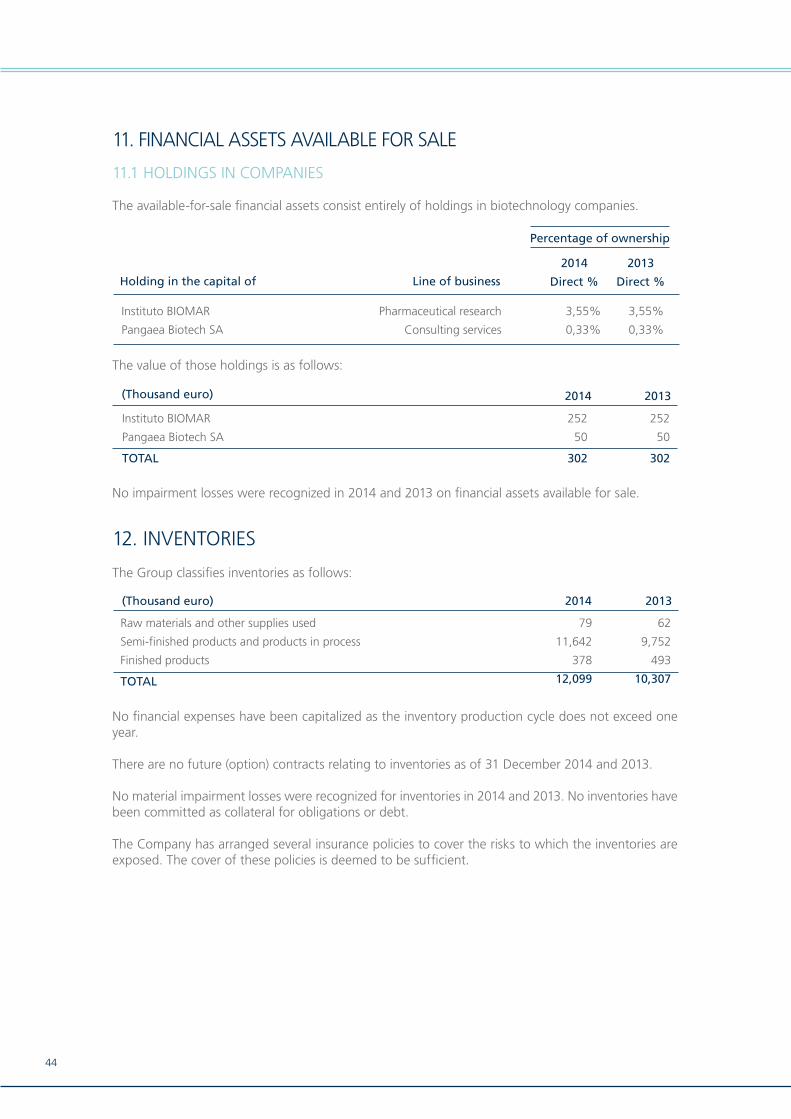
44
11. FINANCIAL ASSETS AVAILABLE FOR SALE
11.1 HOLDINGS IN COMPANIES
The available-for-sale financial assets consist entirely of holdings in biotechnology companies.
The value of those holdings is as follows:
No impairment losses were recognized in 2014 and 2013 on financial assets available for sale.
12. INVENTORIES
The Group classifies inventories as follows:
No financial expenses have been capitalized as the inventory production cycle does not exceed one year.
There are no future (option) contracts relating to inventories as of 31 December 2014 and 2013.
No material impairment losses were recognized for inventories in 2014 and 2013. No inventories have been committed as collateral for obligations or debt.
The Company has arranged several insurance policies to cover the risks to which the inventories are exposed. The cover of these policies is deemed to be sufficient.
Percentage of ownership
Holding in the capital of
2014
Direct %
2013
Direct %Line of business
Instituto BIOMAR Pharmaceutical research 3,55% 3,55%
Pangaea Biotech SA Consulting services 0,33% 0,33%
(Thousand euro) 2014 2013
Raw materials and other supplies used 79 62
Semi-finished products and products in process 11,642 9,752
Finished products 378 493
TOTAL 12,099 10,307
2014 2013(Thousand euro)
Instituto BIOMAR 252 252
Pangaea Biotech SA 50 50
TOTAL 302 302

45
PharmaMar · Annual Report 2014
13. LOANS AND ACCOUNTS RECEIVABLE
Loans and accounts receivable are classified as follows:
Long-term deposits and guarantees as of 31 December 2014 and 31 December 2013 include mainly the deposit for the lease of a 216 square metre laboratory in the Tres Cantos Technology Park (Madrid).
The detail of customer balances by age is as follows:
Past-due receivables have not been impaired and the Company expects to recover the total amount due plus any default interest that it claims.
The 389 thousand euro (1,030 thousand euro in 2013) correspond mainly to the provision recognized in previous years by virtue of the risk sharing agreement signed with the Italian Medicines Agency (AIFA) and the provision for the discounts applicable in Germany under German law.
As of 31 December 2014, accounts receivable from public authorities totalled 6,143 thousand euro (6,493 thousand euro in 2013).
(Thousand euro) 2014 2013
LONG-TERM LOANS AND ACCOUNTS RECEIVABLE 73 73
Long-term deposits and guarantees provided (Note 9) 73 73
SHORT-TERM LOANS AND ACCOUNTS RECEIVABLE 33,765 27,221
Customer receivables (Note 9) 10,075 10,923
Customer receivables from group and associated undertakings (Note26) 9,000 11,538
Short-term investment in group and associated undertakings (Note26) 3,644 2,860
Sundry debtors 18 4
Personnel 6 5
Short-term deposits 11,006 1,879
Long-term deposits and guarantees provided 16 12
TOTAL 33,838 27,294
(Thousand euro) 2014 2013
CURRENT BALANCES 5,418 7,096
BALANCES PAST-DUE BUT NOT PROVISIONED 5,046 4,857
Up to 3 months 2,229 964
3-6 months 615 517
Over 6 months 2,202 3,376
BALANCES PAST-DUE AND PROVISIONED
Over 6 months - -
Under 6 months - -
TOTAL CUSTOMER RECEIVABLES 10,464 11,953Provisions -389 -1,030
TOTAL NET CUSTOMER RECEIVABLES 10,075 10,923
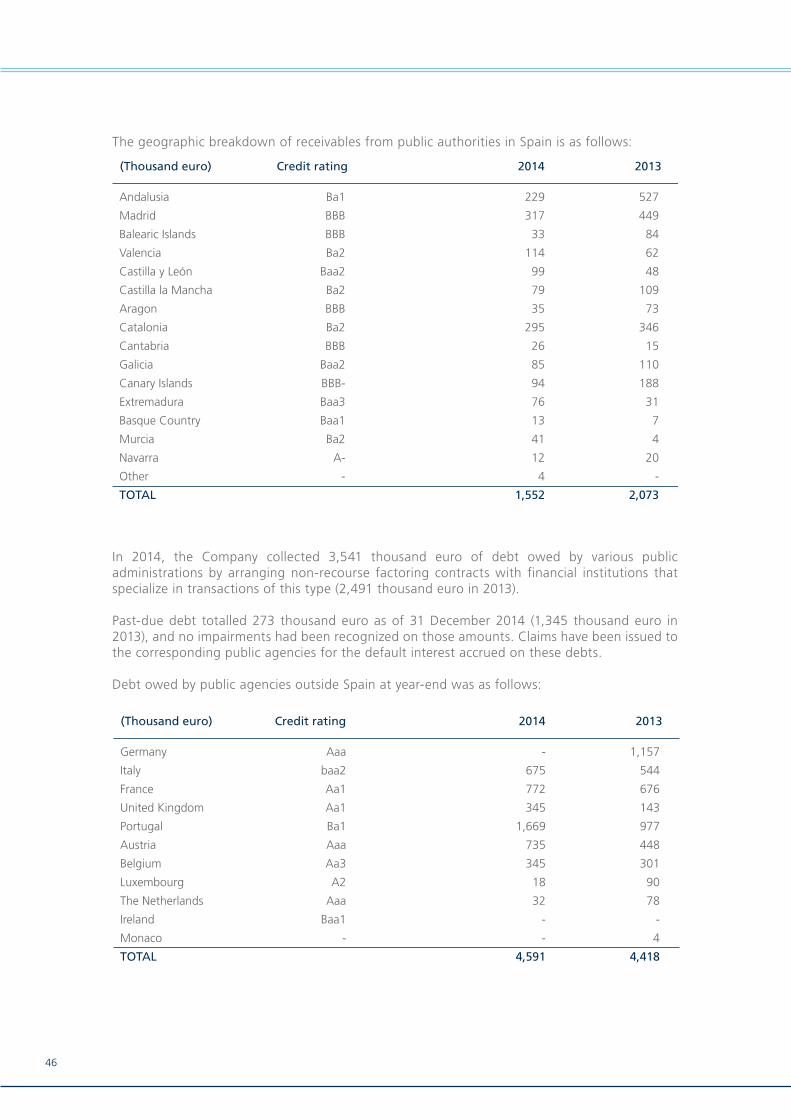
46
The geographic breakdown of receivables from public authorities in Spain is as follows:
In 2014, the Company collected 3,541 thousand euro of debt owed by various public administrations by arranging non-recourse factoring contracts with financial institutions that specialize in transactions of this type (2,491 thousand euro in 2013).
Past-due debt totalled 273 thousand euro as of 31 December 2014 (1,345 thousand euro in 2013), and no impairments had been recognized on those amounts. Claims have been issued to the corresponding public agencies for the default interest accrued on these debts.
Debt owed by public agencies outside Spain at year-end was as follows:
(Thousand euro) Credit rating 20132014
Andalusia Ba1 229 527
Madrid BBB 317 449
Balearic Islands BBB 33 84
Valencia Ba2 114 62
Castilla y León Baa2 99 48
Castilla la Mancha Ba2 79 109
Aragon BBB 35 73
Catalonia Ba2 295 346
Cantabria BBB 26 15
Galicia Baa2 85 110
Canary Islands BBB- 94 188
Extremadura Baa3 76 31
Basque Country Baa1 13 7
Murcia Ba2 41 4
Navarra A- 12 20
Other - 4 -
TOTAL 1,552 2,073
(Thousand euro) Credit rating 20132014
Germany Aaa - 1,157
Italy baa2 675 544
France Aa1 772 676
United Kingdom Aa1 345 143
Portugal Ba1 1,669 977
Austria Aaa 735 448
Belgium Aa3 345 301
Luxembourg A2 18 90
The Netherlands Aaa 32 78
Ireland Baa1 - -
Monaco - - 4
TOTAL 4,591 4,418
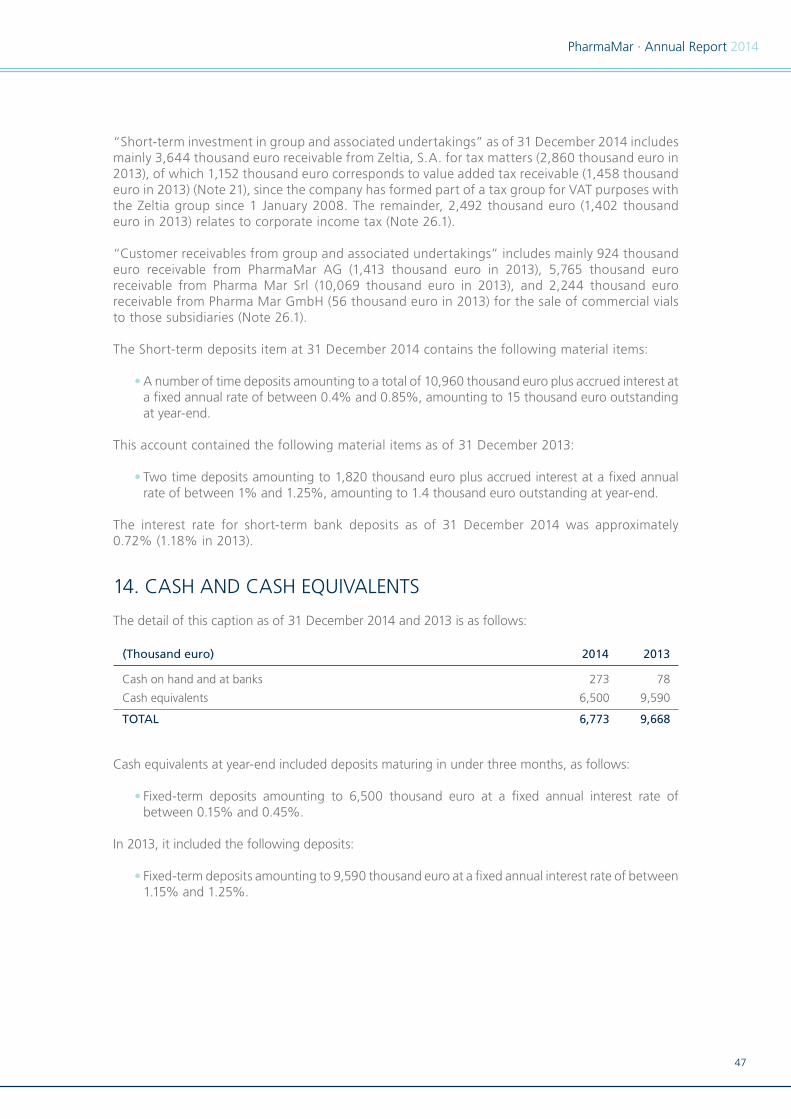
47
PharmaMar · Annual Report 2014
“Short-term investment in group and associated undertakings” as of 31 December 2014 includes mainly 3,644 thousand euro receivable from Zeltia, S.A. for tax matters (2,860 thousand euro in 2013), of which 1,152 thousand euro corresponds to value added tax receivable (1,458 thousand euro in 2013) (Note 21), since the company has formed part of a tax group for VAT purposes with the Zeltia group since 1 January 2008. The remainder, 2,492 thousand euro (1,402 thousand euro in 2013) relates to corporate income tax (Note 26.1).
“Customer receivables from group and associated undertakings” includes mainly 924 thousand euro receivable from PharmaMar AG (1,413 thousand euro in 2013), 5,765 thousand euro receivable from Pharma Mar Srl (10,069 thousand euro in 2013), and 2,244 thousand euro receivable from Pharma Mar GmbH (56 thousand euro in 2013) for the sale of commercial vials to those subsidiaries (Note 26.1).
The Short-term deposits item at 31 December 2014 contains the following material items:
A number of time deposits amounting to a total of 10,960 thousand euro plus accrued interest at •a fixed annual rate of between 0.4% and 0.85%, amounting to 15 thousand euro outstanding at year-end.
This account contained the following material items as of 31 December 2013:
Two time deposits amounting to 1,820 thousand euro plus accrued interest at a fixed annual •rate of between 1% and 1.25%, amounting to 1.4 thousand euro outstanding at year-end.
The interest rate for short-term bank deposits as of 31 December 2014 was approximately 0.72% (1.18% in 2013).
14. CASH AND CASH EQUIVALENTS
The detail of this caption as of 31 December 2014 and 2013 is as follows:
Cash equivalents at year-end included deposits maturing in under three months, as follows:
Fixed-term deposits amounting to 6,500 thousand euro at a fixed annual interest rate of •between 0.15% and 0.45%.
In 2013, it included the following deposits:
Fixed-term deposits amounting to 9,590 thousand euro at a fixed annual interest rate of between •1.15% and 1.25%.
(Thousand euro) 2014 2013
Cash on hand and at banks 273 78
Cash equivalents 6,500 9,590
TOTAL 6,773 9,668
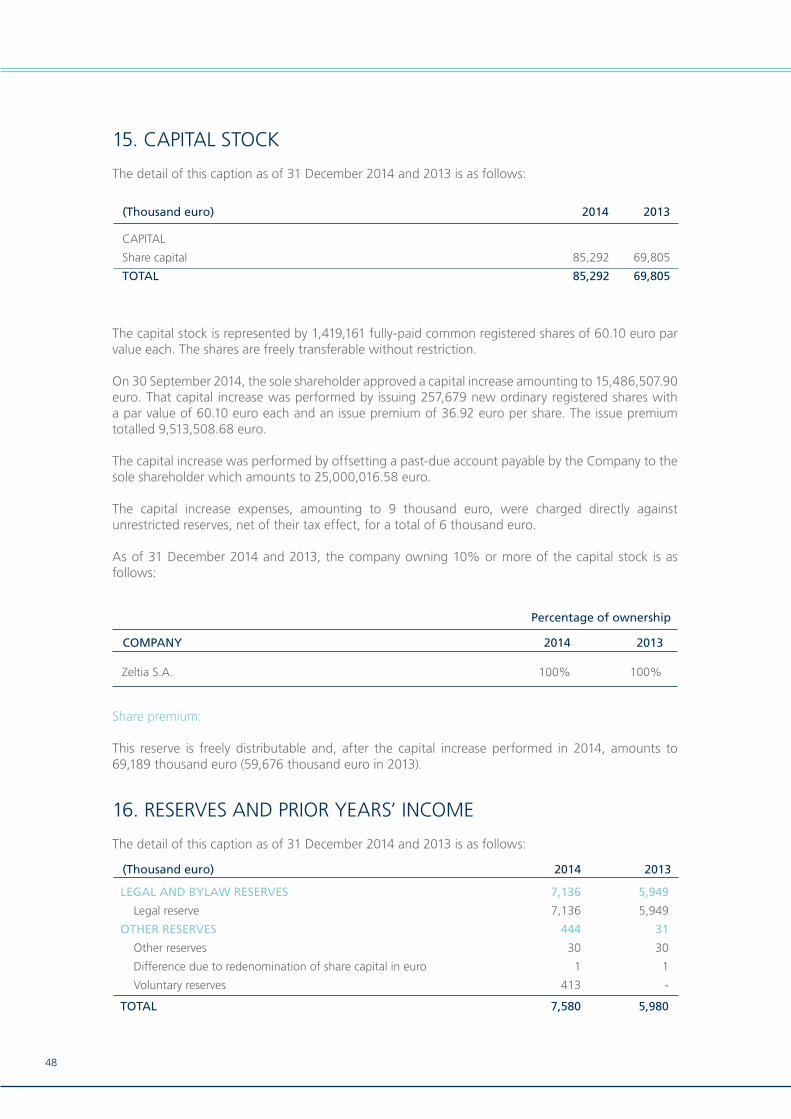
48
15. CAPITAL STOCK
The detail of this caption as of 31 December 2014 and 2013 is as follows:
The capital stock is represented by 1,419,161 fully-paid common registered shares of 60.10 euro par value each. The shares are freely transferable without restriction.
On 30 September 2014, the sole shareholder approved a capital increase amounting to 15,486,507.90 euro. That capital increase was performed by issuing 257,679 new ordinary registered shares with a par value of 60.10 euro each and an issue premium of 36.92 euro per share. The issue premium totalled 9,513,508.68 euro.
The capital increase was performed by offsetting a past-due account payable by the Company to the sole shareholder which amounts to 25,000,016.58 euro.
The capital increase expenses, amounting to 9 thousand euro, were charged directly against unrestricted reserves, net of their tax effect, for a total of 6 thousand euro.
As of 31 December 2014 and 2013, the company owning 10% or more of the capital stock is as follows:
Share premium:
This reserve is freely distributable and, after the capital increase performed in 2014, amounts to 69,189 thousand euro (59,676 thousand euro in 2013).
16. RESERVES AND PRIOR YEARS’ INCOME
The detail of this caption as of 31 December 2014 and 2013 is as follows:
(Thousand euro) 2014 2013
CAPITAL
Share capital 85,292 69,805
TOTAL 85,292 69,805
Percentage of ownership
COMPANY 2014 2013
Zeltia S.A. 100% 100%
(Thousand euro) 2014 2013
LEGAL AND BYLAW RESERVES 7,136 5,949
Legal reserve 7,136 5,949
OTHER RESERVES 444 31
Other reserves 30 30
Difference due to redenomination of share capital in euro 1 1
Voluntary reserves 413 -
TOTAL 7,580 5,980
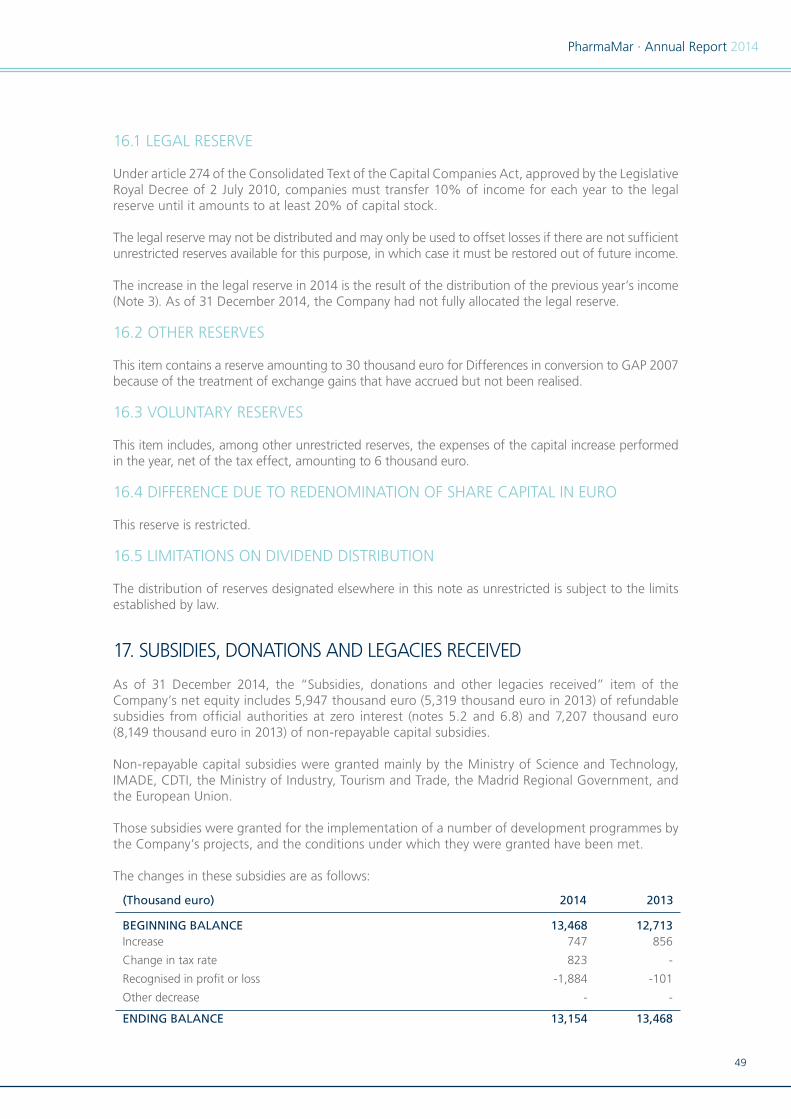
49
PharmaMar · Annual Report 2014
16.1 LEGAL RESERVE
Under article 274 of the Consolidated Text of the Capital Companies Act, approved by the Legislative Royal Decree of 2 July 2010, companies must transfer 10% of income for each year to the legal reserve until it amounts to at least 20% of capital stock.
The legal reserve may not be distributed and may only be used to offset losses if there are not sufficient unrestricted reserves available for this purpose, in which case it must be restored out of future income.
The increase in the legal reserve in 2014 is the result of the distribution of the previous year’s income (Note 3). As of 31 December 2014, the Company had not fully allocated the legal reserve.
16.2 OTHER RESERVES
This item contains a reserve amounting to 30 thousand euro for Differences in conversion to GAP 2007 because of the treatment of exchange gains that have accrued but not been realised.
16.3 VOLUNTARY RESERVES
This item includes, among other unrestricted reserves, the expenses of the capital increase performed in the year, net of the tax effect, amounting to 6 thousand euro.
16.4 DIFFERENCE DUE TO REDENOMINATION OF SHARE CAPITAL IN EURO
This reserve is restricted.
16.5 LIMITATIONS ON DIVIDEND DISTRIBUTION
The distribution of reserves designated elsewhere in this note as unrestricted is subject to the limits established by law.
17. SUBSIDIES, DONATIONS AND LEGACIES RECEIVED
As of 31 December 2014, the “Subsidies, donations and other legacies received” item of the Company’s net equity includes 5,947 thousand euro (5,319 thousand euro in 2013) of refundable subsidies from official authorities at zero interest (notes 5.2 and 6.8) and 7,207 thousand euro (8,149 thousand euro in 2013) of non-repayable capital subsidies.
Non-repayable capital subsidies were granted mainly by the Ministry of Science and Technology, IMADE, CDTI, the Ministry of Industry, Tourism and Trade, the Madrid Regional Government, and the European Union.
Those subsidies were granted for the implementation of a number of development programmes by the Company’s projects, and the conditions under which they were granted have been met.
The changes in these subsidies are as follows:
(Thousand euro) 2014 2013
BEGINNING BALANCE 13,468 12,713Increase 747 856
Change in tax rate 823 -
Recognised in profit or loss -1,884 -101
Other decrease - -
ENDING BALANCE 13,154 13,468
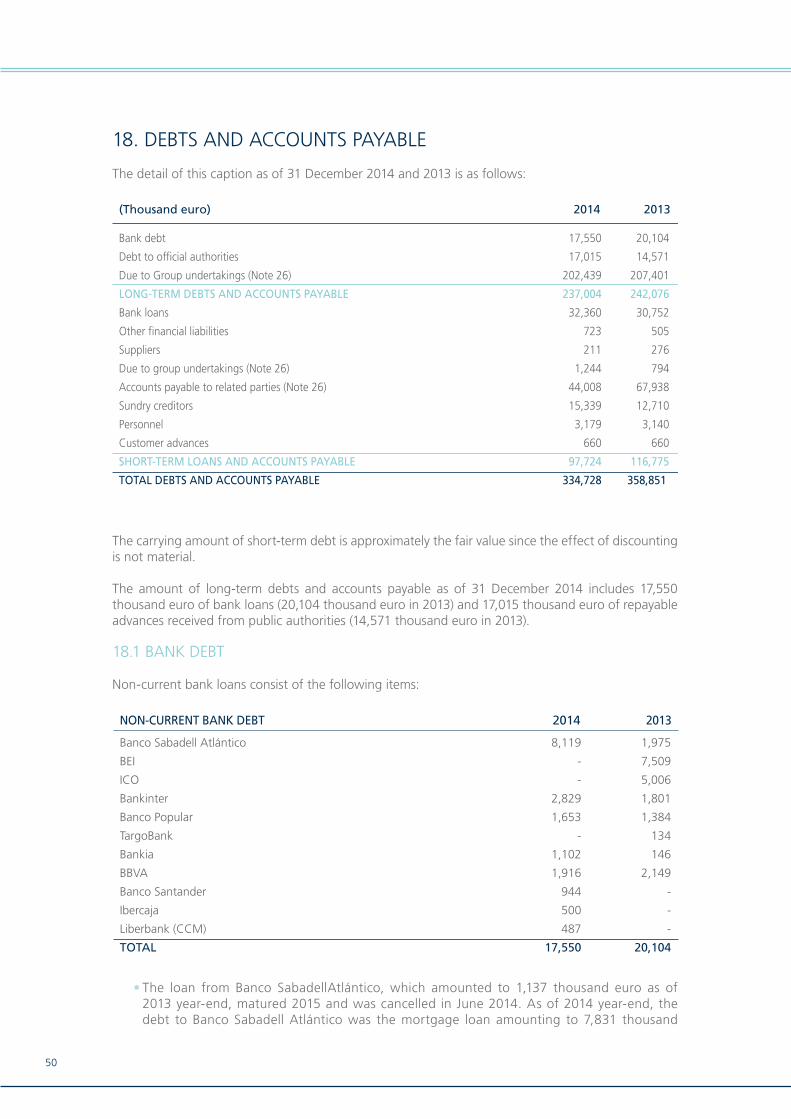
50
18. DEBTS AND ACCOUNTS PAYABLE
The detail of this caption as of 31 December 2014 and 2013 is as follows:
The carrying amount of short-term debt is approximately the fair value since the effect of discounting is not material.
The amount of long-term debts and accounts payable as of 31 December 2014 includes 17,550 thousand euro of bank loans (20,104 thousand euro in 2013) and 17,015 thousand euro of repayable advances received from public authorities (14,571 thousand euro in 2013).
18.1 BANK DEBT
Non-current bank loans consist of the following items:
The loan from Banco SabadellAtlántico, which amounted to 1,137 thousand euro as of •2013 year-end, matured 2015 and was cancelled in June 2014. As of 2014 year-end, the debt to Banco Sabadell Atlántico was the mortgage loan amounting to 7,831 thousand
(Thousand euro) 2014 2013
Bank debt 17,550 20,104
Debt to official authorities 17,015 14,571
Due to Group undertakings (Note 26) 202,439 207,401
LONG-TERM DEBTS AND ACCOUNTS PAYABLE 237,004 242,076
Bank loans 32,360 30,752
Other financial liabilities 723 505
Suppliers 211 276
Due to group undertakings (Note 26) 1,244 794
Accounts payable to related parties (Note 26) 44,008 67,938
Sundry creditors 15,339 12,710
Personnel 3,179 3,140
Customer advances 660 660
SHORT-TERM LOANS AND ACCOUNTS PAYABLE 97,724 116,775
TOTAL DEBTS AND ACCOUNTS PAYABLE 334,728 358,851
20132014NON-CURRENT BANK DEBT
Banco Sabadell Atlántico 8,119 1,975
BEI - 7,509
ICO - 5,006
Bankinter 2,829 1,801
Banco Popular 1,653 1,384
TargoBank - 134
Bankia 1,102 146
BBVA 1,916 2,149
Banco Santander 944 -
Ibercaja 500 -
Liberbank (CCM) 487 -
TOTAL 17,550 20,104
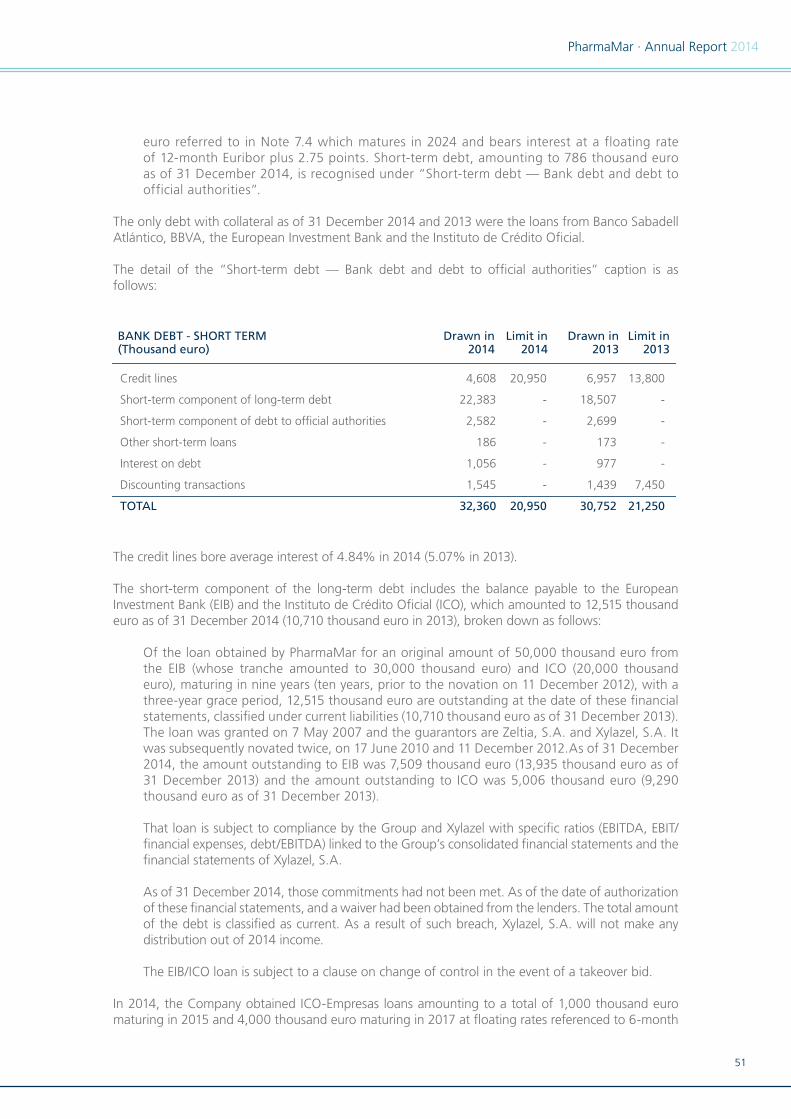
51
PharmaMar · Annual Report 2014
euro referred to in Note 7.4 which matures in 2024 and bears interest at a floating rate of 12-month Euribor plus 2.75 points. Short-term debt, amounting to 786 thousand euro as of 31 December 2014, is recognised under “Short-term debt — Bank debt and debt to official authorities”.
The only debt with collateral as of 31 December 2014 and 2013 were the loans from Banco Sabadell Atlántico, BBVA, the European Investment Bank and the Instituto de Crédito Oficial.
The detail of the “Short-term debt — Bank debt and debt to official authorities” caption is as follows:
The credit lines bore average interest of 4.84% in 2014 (5.07% in 2013).
The short-term component of the long-term debt includes the balance payable to the European Investment Bank (EIB) and the Instituto de Crédito Oficial (ICO), which amounted to 12,515 thousand euro as of 31 December 2014 (10,710 thousand euro in 2013), broken down as follows:
Of the loan obtained by PharmaMar for an original amount of 50,000 thousand euro from the EIB (whose tranche amounted to 30,000 thousand euro) and ICO (20,000 thousand euro), maturing in nine years (ten years, prior to the novation on 11 December 2012), with a three-year grace period, 12,515 thousand euro are outstanding at the date of these financial statements, classified under current liabilities (10,710 thousand euro as of 31 December 2013). The loan was granted on 7 May 2007 and the guarantors are Zeltia, S.A. and Xylazel, S.A. It was subsequently novated twice, on 17 June 2010 and 11 December 2012.As of 31 December 2014, the amount outstanding to EIB was 7,509 thousand euro (13,935 thousand euro as of 31 December 2013) and the amount outstanding to ICO was 5,006 thousand euro (9,290 thousand euro as of 31 December 2013).
That loan is subject to compliance by the Group and Xylazel with specific ratios (EBITDA, EBIT/financial expenses, debt/EBITDA) linked to the Group’s consolidated financial statements and the financial statements of Xylazel, S.A.
As of 31 December 2014, those commitments had not been met. As of the date of authorization of these financial statements, and a waiver had been obtained from the lenders. The total amount of the debt is classified as current. As a result of such breach, Xylazel, S.A. will not make any distribution out of 2014 income.
The EIB/ICO loan is subject to a clause on change of control in the event of a takeover bid.
In 2014, the Company obtained ICO-Empresas loans amounting to a total of 1,000 thousand euro maturing in 2015 and 4,000 thousand euro maturing in 2017 at floating rates referenced to 6-month
BANK DEBT - SHORT TERM(Thousand euro)
Limit in2014
Drawn in2014
Limit in2013
Drawn in2013
Credit lines 4,608 20,950 6,957 13,800
Short-term component of long-term debt 22,383 - 18,507 -
Short-term component of debt to official authorities 2,582 - 2,699 -
Other short-term loans 186 - 173 -
Interest on debt 1,056 - 977 -
Discounting transactions 1,545 - 1,439 7,450
TOTAL 32,360 20,950 30,752 21,250
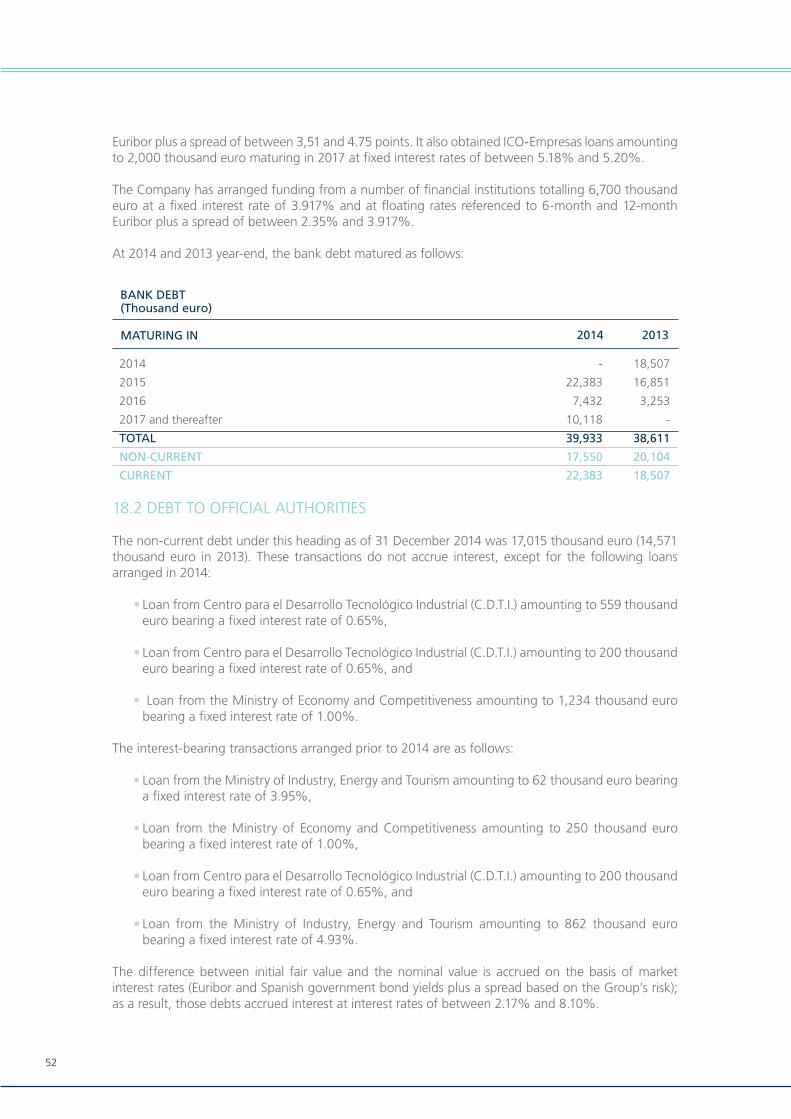
52
Euribor plus a spread of between 3,51 and 4.75 points. It also obtained ICO-Empresas loans amounting to 2,000 thousand euro maturing in 2017 at fixed interest rates of between 5.18% and 5.20%.
The Company has arranged funding from a number of financial institutions totalling 6,700 thousand euro at a fixed interest rate of 3.917% and at floating rates referenced to 6-month and 12-month Euribor plus a spread of between 2.35% and 3.917%.
At 2014 and 2013 year-end, the bank debt matured as follows:
18.2 DEBT TO OFFICIAL AUTHORITIES
The non-current debt under this heading as of 31 December 2014 was 17,015 thousand euro (14,571 thousand euro in 2013). These transactions do not accrue interest, except for the following loans arranged in 2014:
Loan from Centro para el Desarrollo Tecnológico Industrial (C.D.T.I.) amounting to 559 thousand •euro bearing a fixed interest rate of 0.65%,
Loan from Centro para el Desarrollo Tecnológico Industrial (C.D.T.I.) amounting to 200 thousand •euro bearing a fixed interest rate of 0.65%, and
Loan from the Ministry of Economy and Competitiveness amounting to 1,234 thousand euro •bearing a fixed interest rate of 1.00%.
The interest-bearing transactions arranged prior to 2014 are as follows:
Loan from the Ministry of Industry, Energy and Tourism amounting to 62 thousand euro bearing •a fixed interest rate of 3.95%,
Loan from the Ministry of Economy and Competitiveness amounting to 250 thousand euro •bearing a fixed interest rate of 1.00%,
Loan from Centro para el Desarrollo Tecnológico Industrial (C.D.T.I.) amounting to 200 thousand •euro bearing a fixed interest rate of 0.65%, and
Loan from the Ministry of Industry, Energy and Tourism amounting to 862 thousand euro •bearing a fixed interest rate of 4.93%.
The difference between initial fair value and the nominal value is accrued on the basis of market interest rates (Euribor and Spanish government bond yields plus a spread based on the Group’s risk); as a result, those debts accrued interest at interest rates of between 2.17% and 8.10%.
MATURING IN 2014 2013
BANK DEBT(Thousand euro)
2014 - 18,507
2015 22,383 16,851
2016 7,432 3,253
2017 and thereafter 10,118 -
TOTAL 39,933 38,611
NON-CURRENT 17,550 20,104
CURRENT 22,383 18,507
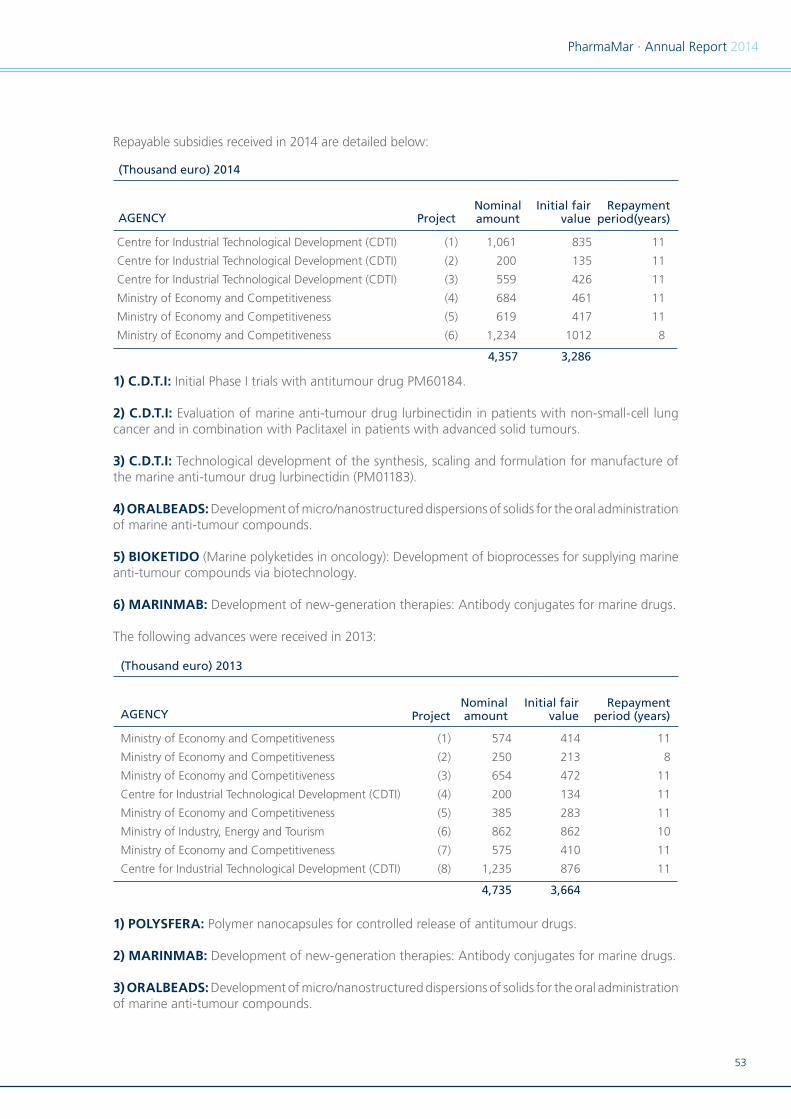
53
PharmaMar · Annual Report 2014
Repayable subsidies received in 2014 are detailed below:
1) C.D.T.I: Initial Phase I trials with antitumour drug PM60184.
2) C.D.T.I: Evaluation of marine anti-tumour drug lurbinectidin in patients with non-small-cell lung cancer and in combination with Paclitaxel in patients with advanced solid tumours.
3) C.D.T.I: Technological development of the synthesis, scaling and formulation for manufacture of the marine anti-tumour drug lurbinectidin (PM01183).
4) ORALBEADS: Development of micro/nanostructured dispersions of solids for the oral administration of marine anti-tumour compounds.
5) BIOKETIDO (Marine polyketides in oncology): Development of bioprocesses for supplying marine anti-tumour compounds via biotechnology.
6) MARINMAB: Development of new-generation therapies: Antibody conjugates for marine drugs.
The following advances were received in 2013:
1) POLYSFERA: Polymer nanocapsules for controlled release of antitumour drugs.
2) MARINMAB: Development of new-generation therapies: Antibody conjugates for marine drugs.
3) ORALBEADS: Development of micro/nanostructured dispersions of solids for the oral administration of marine anti-tumour compounds.
AGENCY
(Thousand euro) 2014
NominalamountProject
Repaymentperiod(years)
Initial fairvalue
Centre for Industrial Technological Development (CDTI) (1) 1,061 835 11
Centre for Industrial Technological Development (CDTI) (2) 200 135 11
Centre for Industrial Technological Development (CDTI) (3) 559 426 11
Ministry of Economy and Competitiveness (4) 684 461 11
Ministry of Economy and Competitiveness (5) 619 417 11
Ministry of Economy and Competitiveness (6) 1,234 1012 8
4,357 3,286
AGENCY
(Thousand euro) 2013
Nominal amountProject
Repaymentperiod (years)
Initial fairvalue
Ministry of Economy and Competitiveness (1) 574 414 11
Ministry of Economy and Competitiveness (2) 250 213 8
Ministry of Economy and Competitiveness (3) 654 472 11
Centre for Industrial Technological Development (CDTI) (4) 200 134 11
Ministry of Economy and Competitiveness (5) 385 283 11
Ministry of Industry, Energy and Tourism (6) 862 862 10
Ministry of Economy and Competitiveness (7) 575 410 11
Centre for Industrial Technological Development (CDTI) (8) 1,235 876 11
4,735 3,664
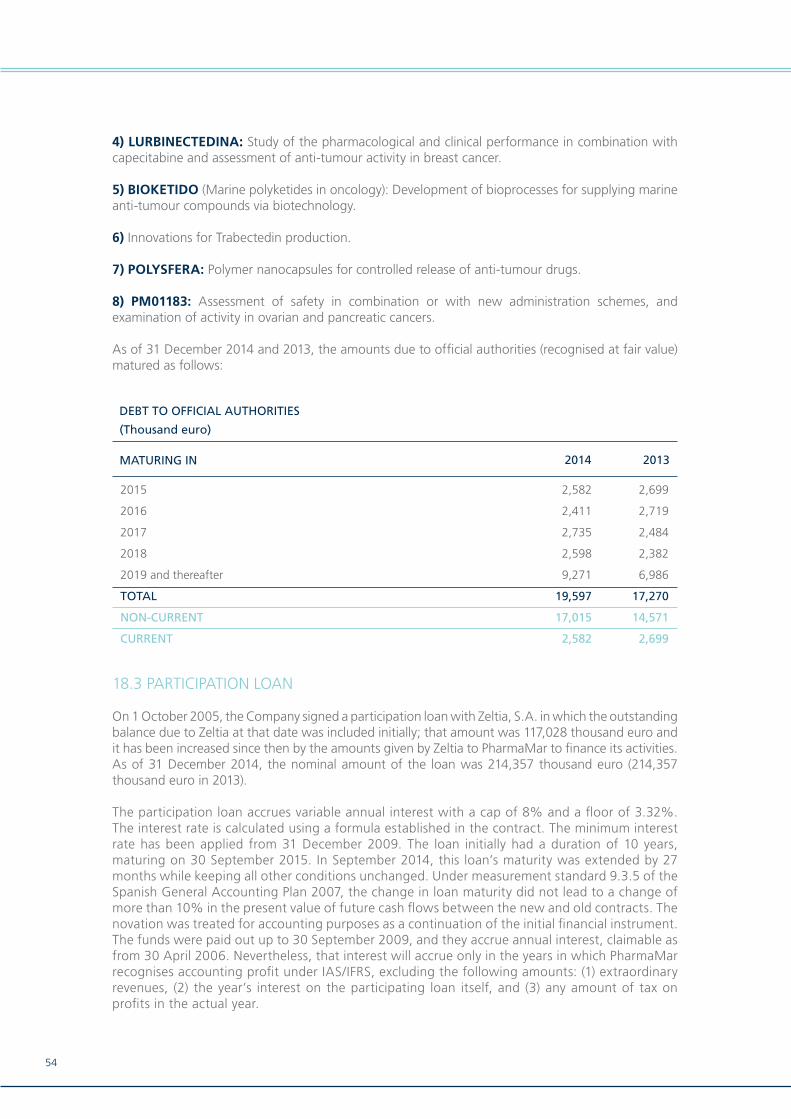
54
4) LURBINECTEDINA: Study of the pharmacological and clinical performance in combination with capecitabine and assessment of anti-tumour activity in breast cancer.
5) BIOKETIDO (Marine polyketides in oncology): Development of bioprocesses for supplying marine anti-tumour compounds via biotechnology.
6) Innovations for Trabectedin production.
7) POLYSFERA: Polymer nanocapsules for controlled release of anti-tumour drugs.
8) PM01183: Assessment of safety in combination or with new administration schemes, and examination of activity in ovarian and pancreatic cancers.
As of 31 December 2014 and 2013, the amounts due to official authorities (recognised at fair value) matured as follows:
18.3 PARTICIPATION LOAN
On 1 October 2005, the Company signed a participation loan with Zeltia, S.A. in which the outstanding balance due to Zeltia at that date was included initially; that amount was 117,028 thousand euro and it has been increased since then by the amounts given by Zeltia to PharmaMar to finance its activities. As of 31 December 2014, the nominal amount of the loan was 214,357 thousand euro (214,357 thousand euro in 2013).
The participation loan accrues variable annual interest with a cap of 8% and a floor of 3.32%. The interest rate is calculated using a formula established in the contract. The minimum interest rate has been applied from 31 December 2009. The loan initially had a duration of 10 years, maturing on 30 September 2015. In September 2014, this loan’s maturity was extended by 27 months while keeping all other conditions unchanged. Under measurement standard 9.3.5 of the Spanish General Accounting Plan 2007, the change in loan maturity did not lead to a change of more than 10% in the present value of future cash flows between the new and old contracts. The novation was treated for accounting purposes as a continuation of the initial financial instrument. The funds were paid out up to 30 September 2009, and they accrue annual interest, claimable as from 30 April 2006. Nevertheless, that interest will accrue only in the years in which PharmaMar recognises accounting profit under IAS/IFRS, excluding the following amounts: (1) extraordinary revenues, (2) the year’s interest on the participating loan itself, and (3) any amount of tax on profits in the actual year.
MATURING IN 2014 2013
DEBT TO OFFICIAL AUTHORITIES
(Thousand euro)
2015 2,582 2,699
2016 2,411 2,719
2017 2,735 2,484
2018 2,598 2,382
2019 and thereafter 9,271 6,986
TOTAL 19,597 17,270
NON-CURRENT 17,015 14,571
CURRENT 2,582 2,699

55
PharmaMar · Annual Report 2014
At the date the participation loan was granted, it was estimated that the loan was being remunerated at market rates, i.e. the fair value of the loan did not differ materially from its nominal value.
Financial instruments are recognised at fair value. Under measurement standard 4.5.1, financial assets are initially recognised at fair value and subsequently at amortised cost.
To calculate the amortised cost, the Company considered the contributions which, at the loan grant date, it estimated would be made under that contract in accordance with the Company’s financial needs. The contributions to date do not differ substantially from management’s estimates made in 2005.
The effective interest rate used to calculate the amortised cost was calculated considering the Company’s arm’s-length funding cost at the date of the loan for a financial instrument of similar duration (the estimate was 5.43%).
As a result of discounting projected interest at the effective interest rate and adjusting the loan to amortised cost, the loan was worth 219,588 thousand euro as of 31 December 2014, of which 202,439 thousand euro were recognised as long term and 17,149 thousand euro as short term (207,400 thousand euro as long term in 2013). The Company recognised 12,187 thousand euro in financial expenses in 2014 (12,442 thousand euro in 2013). That calculation method is coherent with the opinion issued by Spain’s Accounting and Audit Institute (ICAC) and published in its official gazette (BOICAC 78).
18.4 OTHER LOANS FROM GROUP COMPANIES
On 31 October 2009, the Company signed a loan from Zeltia, S.A. against which 20,330 thousand euro had been drawn as of 31 December 2014 (46,330 thousand euro in 2013). In 2014, the Company received contributions amounting to 17,000 thousand euro, repaid 18,000 thousand euro and used 25,000 thousand euro for the capital increase referred to in note 15.
The unpaid accrued interest on this loan amounted to 6,529 thousand euro as of 31 December 2014 (4,459 thousand euro in 2013).
The applicable interest rate is 6.18% (5.48% in 2013); consequently, since it is remunerated on an arm’s-length basis, its carrying amount is approximately the same as its fair value.
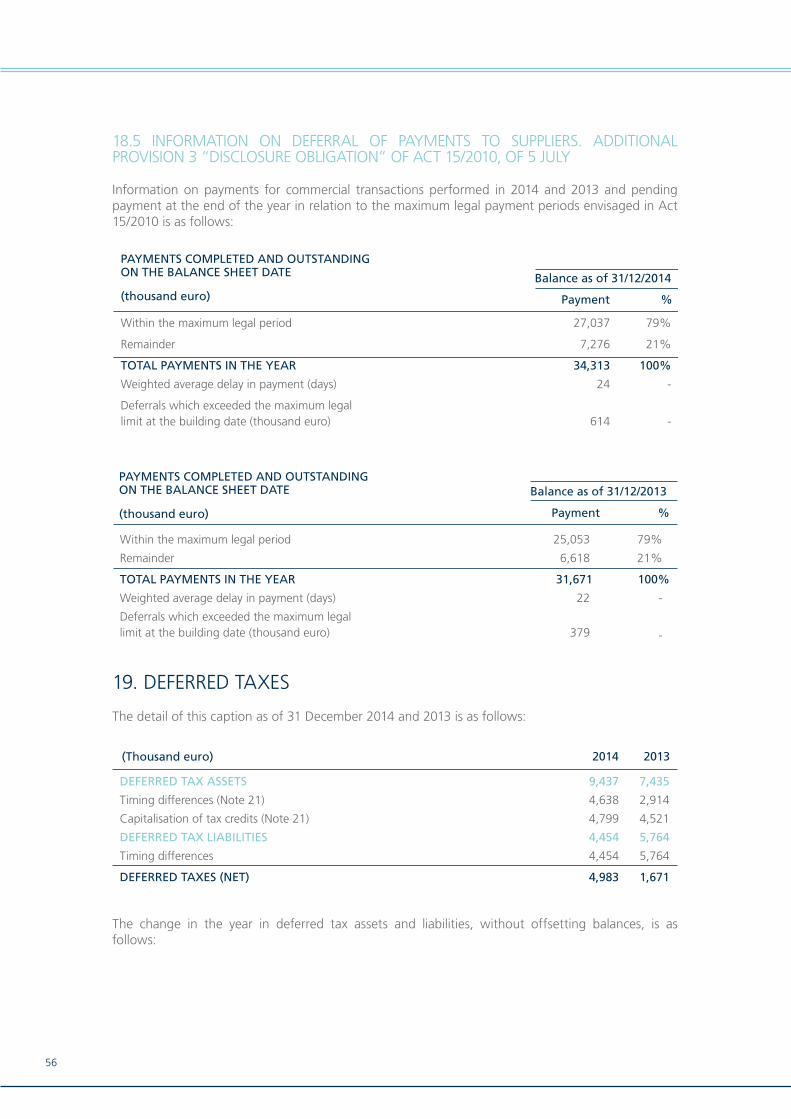
56
18.5 INFORMATION ON DEFERRAL OF PAYMENTS TO SUPPLIERS. ADDITIONAL PROVISION 3 “DISCLOSURE OBLIGATION” OF ACT 15/2010, OF 5 JULY
Information on payments for commercial transactions performed in 2014 and 2013 and pending payment at the end of the year in relation to the maximum legal payment periods envisaged in Act 15/2010 is as follows:
19. DEFERRED TAXES
The detail of this caption as of 31 December 2014 and 2013 is as follows:
The change in the year in deferred tax assets and liabilities, without offsetting balances, is as follows:
PAYMENTS COMPLETED AND OUTSTANDING ON THE BALANCE SHEET DATE
(thousand euro)
Balance as of 31/12/2013
Payment %
Within the maximum legal period 25,053 79%
Remainder 6,618 21%
TOTAL PAYMENTS IN THE YEAR 31,671 100%
Weighted average delay in payment (days) 22 -
Deferrals which exceeded the maximum legal limit at the building date (thousand euro) 379 -
PAYMENTS COMPLETED AND OUTSTANDING ON THE BALANCE SHEET DATE
(thousand euro)
Balance as of 31/12/2014
Payment %
Within the maximum legal period 27,037 79%
Remainder 7,276 21%
TOTAL PAYMENTS IN THE YEAR 34,313 100%
Weighted average delay in payment (days) 24 -
Deferrals which exceeded the maximum legal limit at the building date (thousand euro) 614 -
(Thousand euro) 2014 2013
DEFERRED TAX ASSETS 9,437 7,435
Timing differences (Note 21) 4,638 2,914
Capitalisation of tax credits (Note 21) 4,799 4,521
DEFERRED TAX LIABILITIES 4,454 5,764
Timing differences 4,454 5,764
DEFERRED TAXES (NET) 4,983 1,671

57
PharmaMar · Annual Report 2014
Deferred taxes charged to equity in the year are as follows:
Deferred tax assets due to tax losses carried forward are recognised to the extent that the Company is likely to obtain future taxable income enabling them to be offset. Deferred tax assets amounting to 858 thousand euro were recognized in 2014. No deferred tax assets were recognized in 2013 (Note 2.2).
As of 31 December 2014, the tax credits earned by the Company for use in future years were as follows:
Of those tax credits, the Company capitalized 858 thousand euro in 2014 (Note 2.2).
As shown in the table above, the Company offset tax losses in 2014 and in 2013.
DEFERRED TAX LIABILITIES
(Thousand euro) TOTALSubsidies, donations and
legacies received
BALANCE AS OF 31 DECEMBER 2012 5,440 5,440
Charge (credit) to profit or loss -43 -43
Charge to equity 367 367
BALANCE AS OF 31 DECEMBER 2013 5,764 5,764
Charge (credit) to profit or loss -808 -808
Charge to equity -502 -502
BALANCE AS OF 31 DECEMBER 2014 4,454 4,454
DEFERRED TAX ASSETS
(Thousand euro) TOTALProvisions
BALANCE AS OF 31 DECEMBER 2012 5,164 5,164
Charge (credit) to profit or loss 2,271 2,271
BALANCE AS OF 31 DECEMBER 2013 7,435 7,435
Charge (credit) to profit or loss 2,002 2,002
BALANCE AS OF 31 DECEMBER 2014 9,437 9,437
(Thousand euro) 2014 2013
Subsidies, donations and legacies received -502 367
TOTAL -502 367
Year Year Used in
2014
Amount of tax credit as of 31/12/2013
Unused as of
31/12/20142007 3,722 -994 2,728 2025
2008 2,170 - 2,170 2026
2012 2,464 - 2,464 2030
TOTAL 8,356 -994 7,362
(Thousand euro)
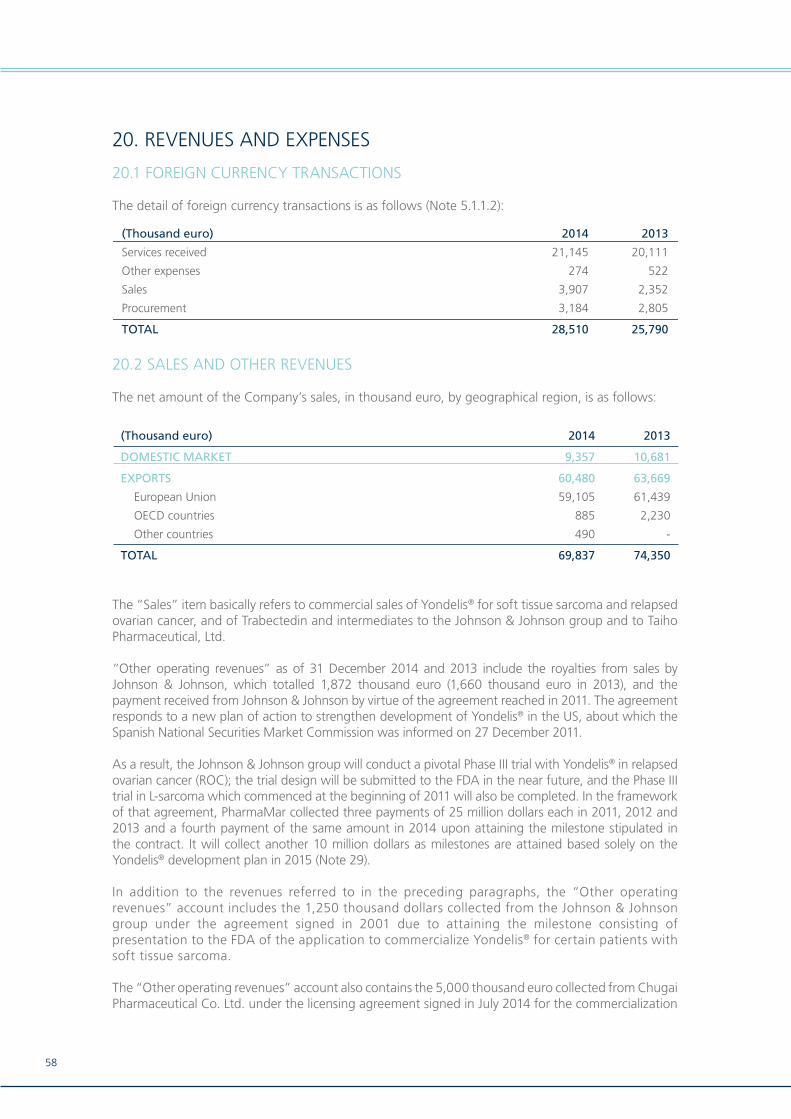
58
20. REVENUES AND EXPENSES
20.1 FOREIGN CURRENCY TRANSACTIONS
The detail of foreign currency transactions is as follows (Note 5.1.1.2):
20.2 SALES AND OTHER REVENUES
The net amount of the Company’s sales, in thousand euro, by geographical region, is as follows:
The “Sales” item basically refers to commercial sales of Yondelis® for soft tissue sarcoma and relapsed ovarian cancer, and of Trabectedin and intermediates to the Johnson & Johnson group and to Taiho Pharmaceutical, Ltd.
“Other operating revenues” as of 31 December 2014 and 2013 include the royalties from sales by Johnson & Johnson, which totalled 1,872 thousand euro (1,660 thousand euro in 2013), and the payment received from Johnson & Johnson by virtue of the agreement reached in 2011. The agreement responds to a new plan of action to strengthen development of Yondelis® in the US, about which the Spanish National Securities Market Commission was informed on 27 December 2011.
As a result, the Johnson & Johnson group will conduct a pivotal Phase III trial with Yondelis® in relapsed ovarian cancer (ROC); the trial design will be submitted to the FDA in the near future, and the Phase III trial in L-sarcoma which commenced at the beginning of 2011 will also be completed. In the framework of that agreement, PharmaMar collected three payments of 25 million dollars each in 2011, 2012 and 2013 and a fourth payment of the same amount in 2014 upon attaining the milestone stipulated in the contract. It will collect another 10 million dollars as milestones are attained based solely on the Yondelis® development plan in 2015 (Note 29).
In addition to the revenues referred to in the preceding paragraphs, the “Other operating revenues” account includes the 1,250 thousand dollars collected from the Johnson & Johnson group under the agreement signed in 2001 due to attaining the milestone consisting of presentation to the FDA of the application to commercialize Yondelis® for certain patients with soft tissue sarcoma.
The “Other operating revenues” account also contains the 5,000 thousand euro collected from Chugai Pharmaceutical Co. Ltd. under the licensing agreement signed in July 2014 for the commercialization
(Thousand euro) 2014 2013
Services received 21,145 20,111
Other expenses 274 522
Sales 3,907 2,352
Procurement 3,184 2,805
TOTAL 28,510 25,790
(Thousand euro) 2014 2013
DOMESTIC MARKET 9,357 10,681
EXPORTS 60,480 63,669
European Union 59,105 61,439
OECD countries 885 2,230
Other countries 490 -
TOTAL 69,837 74,350
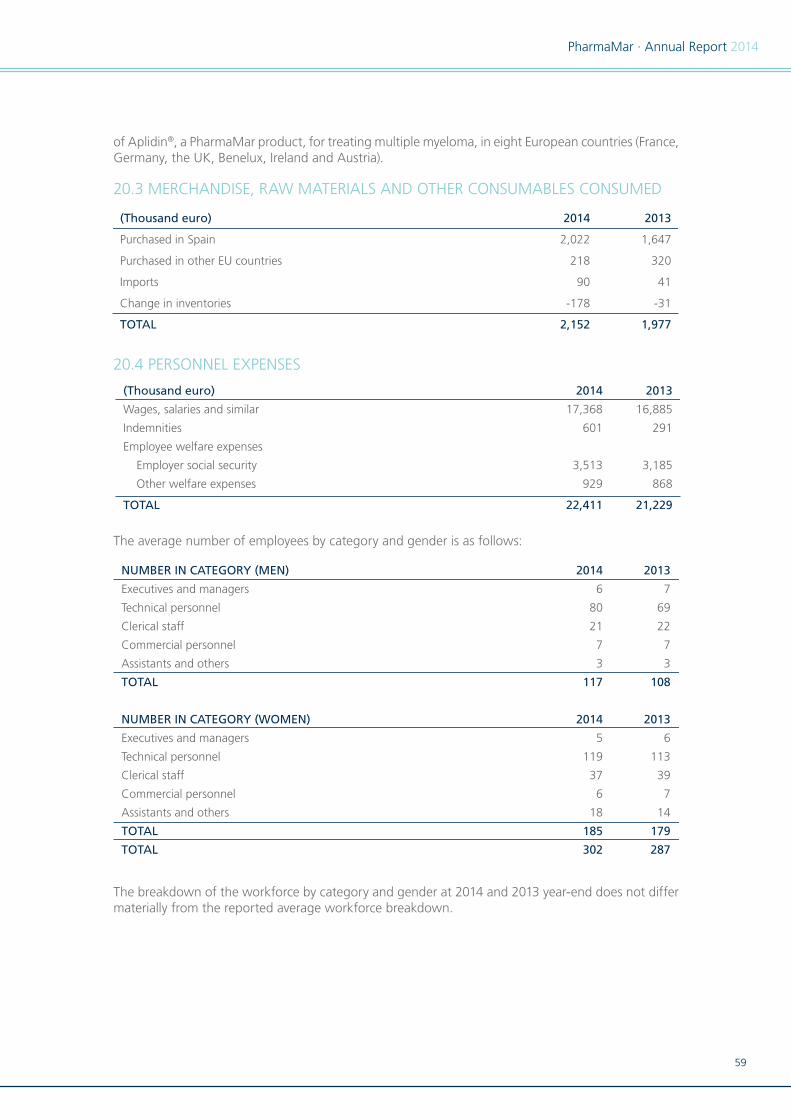
59
PharmaMar · Annual Report 2014
of Aplidin®, a PharmaMar product, for treating multiple myeloma, in eight European countries (France, Germany, the UK, Benelux, Ireland and Austria).
20.3 MERCHANDISE, RAW MATERIALS AND OTHER CONSUMABLES CONSUMED
20.4 PERSONNEL EXPENSES
The average number of employees by category and gender is as follows:
The breakdown of the workforce by category and gender at 2014 and 2013 year-end does not differ materially from the reported average workforce breakdown.
(Thousand euro) 2014 2013
Purchased in Spain 2,022 1,647
Purchased in other EU countries 218 320
Imports 90 41
Change in inventories -178 -31
TOTAL 2,152 1,977
(Thousand euro) 2014 2013
Wages, salaries and similar 17,368 16,885
Indemnities 601 291
Employee welfare expenses
Employer social security 3,513 3,185
Other welfare expenses 929 868
TOTAL 22,411 21,229
NUMBER IN CATEGORY (MEN) 2014 2013
Executives and managers 6 7
Technical personnel 80 69
Clerical staff 21 22
Commercial personnel 7 7
Assistants and others 3 3
TOTAL 117 108
NUMBER IN CATEGORY (WOMEN) 2014 2013
Executives and managers 5 6
Technical personnel 119 113
Clerical staff 37 39
Commercial personnel 6 7
Assistants and others 18 14
TOTAL 185 179
TOTAL 302 287

60
20.5 OUTSIDE SERVICES
The detail of this caption as of 31 December 2014 and 2013 is as follows:
21. INCOME TAX AND TAX SITUATION
The balances with public authorities as of 31 December 2014 and 2013 are as follows:
Since 2002, the Company has filed tax returns as part of the consolidated taxation group headed by Zeltia, S.A. As a result, in the “Short-term investment in group and associated undertakings” account (Note 13), the Company reports the balances resulting from the settlement of corporate income tax and value added tax under this special tax regime.
The “Other balances with public authorities” account as of 31 December 2014 and 2013 mainly refers to withholdings on the royalty revenues and on the payments collected from the Johnson & Johnson group under the agreements signed in 2001 and 2011.
(Thousand euro) 2014 2013
Research & Development expenses 15,902 10,125
Leases and fees 1,155 1,069
Repairs and upkeep 1,541 1,345
Independent professional services 4,513 5,127
Transport 514 575
Insurance premiums 330 426
Advertising and public relations 11,981 13,887
Utilities 850 922
Other services 5,107 5,722
Other taxes 526 409
TOTAL 42,419 39,607
2014 2013
(Thousand euro) Payable Receivable Payable Receivable
Personal income tax - 378 - 353
Social security - 368 - 314
Other balances with public authorities 2,507 - 3,755 -
TOTAL 2,507 746 3,755 667

61
PharmaMar · Annual Report 2014
The reconciliation of net revenues and expenses in the year to the income tax base is as follows:
The current income tax expense is the result of multiplying the taxable base by 30%:
(Thousand euro) Income
Statements
Revenues and expenses recognised
directly in equity
DecreaseIncreaseDecreaseIncrease
2014
Corporate income tax 188 - - -
Permanent differences - -12,985 1,068 -2,702
Timing differences:
Arising in the year 8,555 - - -
Arising in prior years - - - -
TAX BASE 8,285
Tax losses carried forward (Note 19) -994
TAXABLE INCOME 7,291 -1,634
BALANCE OF REVENUES AND EXPENSES IN THE YEAR 12,527
(Thousand euro) Income
Statements
Revenues and expenses recognised
directly in equity
DecreaseIncreaseDecreaseIncrease
2013
Corporate income tax 777 - - -
Permanent differences - -10,055 1,222 -144
Timing differences:
Arising in the year 9,603 - - -
Arising in prior years - -510 - -
TAX BASE 11,683 Tax losses carried forward
TAXABLE INCOME 11,683 1,078
BALANCE OF REVENUES AND EXPENSES IN THE YEAR 11,868
(Thousand euro) 2014 2013
Current tax -81 3,505
Deferred tax -855 -2,728
Change in tax rate 1,124 -
TOTAL TAX EXPENSE 188 777

62
Since 2009, the Company has availed itself of article 23 of the Corporate Income Tax Act, under which revenues from the assignment of rights to use or exploit patents, drawings, models, plans, or secret formulas or procedures, rights on information relating to industrial, commercial or scientific experience are decreased for corporate income tax purposes.
The permanent differences in 2014 and 2013 relate mainly to the 25 million dollars collected from Johnson & Johnson in both years, and the royalties collected from Johnson & Johnson under the licensing agreement for marketing Yondelis®, and those relating to the agreement with Chugai Pharmaceutical Co., Ltd (Note 20.2). Royalties totalled 1,872 thousand euro in 2014 (1,660 thousand euro in 2013).
In 2014, the company recognised a net account receivable from the consolidated group amounting to 1,090 thousand euro under the “Short-term accounts receivable from group and associated undertakings” caption (1,401 in thousand euro 2013 under “Short-term accounts payable to group and associated undertakings”), which is 30% of taxable income less tax withholdings and prepayments. In 2014, the Company applied 1,432 thousand euro in tax credits against corporate income tax (1,935 thousand euro in 2013).
The timing differences in 2014 are due to the amount of depreciation that is not tax-deductible under the tax measures implemented in 2013 and to the Company’s employee stock ownership plan.
Under Act 27/2014, of 27 November, on Corporate Income Tax, and as a result of the changes in the tax rates, an expense item amounting to 1,124 thousand euro was recognized as of 31 December 2014 which reduced the amount of deferred taxes.
As of 31 December 2014, the unused tax credits earned by the Company, mainly for R&D, were as follows (in thousand euro):
Year YearUsed in
2014Amount of tax credit as
31/12/2014Unused as of
31/12/2014
2014 (Thousand euro)
1999 2,149 - 2,149 2017
2000 4,478 - 4,478 2018
2001 4,890 - 4,890 2019
2002 12,096 - 12,096 2020
2003 13,023 - 13,023 2021
2004 9,400 - 9,400 2022
2005 10,565 - 10,565 2023
2006 10,251 - 10,251 2024
2007 9,477 - 9,477 2025
2008 10,059 - 10,059 2026
2009 8,625 - 8,625 2027
2010 8,211 - 8,211 2028
2011 7,980 - 7,980 2029
2012 6,915 - 6,915 2030
2013 9,076 - 9,076 2031
2014 11,403 - 11,403 2032
TOTAL 138,598 138,598

63
PharmaMar · Annual Report 2014
The Company has 2011, 2012, 2013 and 2014 open for review for all applicable taxes including corporate income tax.
As a result, inter alia, of possible differing interpretations of the current tax legislation, additional liabilities might arise as a result of a tax audit. However, the Company’s directors consider that such liabilities, if any, would not materially affect the financial statements.
In 2014, the Company offset corporate income tax losses amounting to 994 thousand euro (Note 19).
Because certain transactions are treated differently for corporate income tax purposes and in the preparation of these financial statements, the taxable base for the year differs from the book result. The deferred or prepaid taxes arise from the recognition of revenues and expenses in different periods under current tax regulations and for the purpose of preparing the financial statements.
22. FINANCIAL INCOME
22.1 FINANCIAL INCOME
The detail of the financial income is as follows:
As a result of the participation loan arranged with Zeltia (Note 18.3), 12,187 thousand euro (12,442 thousand euro in 2013) in financial expenses were recognised under debts to group and associated undertakings, calculated in accordance with the loan’s internal rate of return since inception and market prices, applied to the present value of the loan.
22.2 IMPAIRMENT LOSSES AND INCOME FROM DISPOSAL OF FINANCIAL INSTRUMENTS
(Thousand euro) 20132014
FINANCIAL REVENUES 346 411
From third parties 346 411
FINANCIAL EXPENSES -19,894 -19,199
On debts to group and associated undertakings -14,316 -14,529
On debts to third parties -5,578 -4,670
CAPITALISED FINANCIAL EXPENSES 12,187 12,442
EXCHANGE DIFFERENCES 32 470
IMPAIRMENT AND INCOME FROM DISPOSAL OF FINANCIAL INSTRUMENTS 17 -13Income from disposals and other 17 -13
FINANCIAL INCOME -7,312 -5,889
(Thousand euro) 2014 2013
INCOME FROM DISPOSALS AND OTHER:
Income from disposals and other 17 -13
17 -13
64
23. CONTINGENCIES
23.1 CONTINGENT LIABILITIES
The Company does not have contingent liabilities.
24. COMMITMENTS
24.1 PURCHASE AND SALE COMMITMENTS
The Company has sale commitments to Johnson & Johnson and Taiho Pharmaceutical Co., Ltd. amounting to 6.398 thousand euro and 1,066 thousand euro, respectively, in 2015.
24.2 OPERATING LEASE COMMITMENTS
The minimum future payments for non-cancellable operating leases as of 31 December 2014 and 2013 are detailed in Note 8.
25. DIRECTOR AND SENIOR MANAGEMENT REMUNERATION
25.1 DIRECTOR REMUNERATION
Directors’ remuneration totalled 425 thousand euro in 2014 (395 thousand euro in 2013). No advances or loans have been granted to members of the Board of Directors and there are no pension or life insurance obligations to them.
25.2 SENIOR MANAGEMENT REMUNERATION AND LOANS
Senior management, i.e. general managers and similar who report directly to the Company’s governing bodies, collected 476 thousand euro in remuneration in 2014 (404 thousand euro in 2013).
25.3 DIRECTORS’ DUTY OF LOYALTY
In connection with the duty to avoid conflicts of interest with the Company, during the year the members of the Board of Directors fulfilled their obligations under article 228 of the Consolidated Text of the Capital Companies Act. Additionally, both they and their related parties abstained from incurring in the cases of conflict of interest set out in article 229 of that Act, apart from cases where the appropriate authorization was obtained.
26. OTHER TRANSACTIONS WITH RELATED PARTIES
26.1 BALANCES WITH GROUP COMPANIES
The detail of accounts payable to and receivable from group undertakings as of 31 December 2014 and 2013 is as follows:
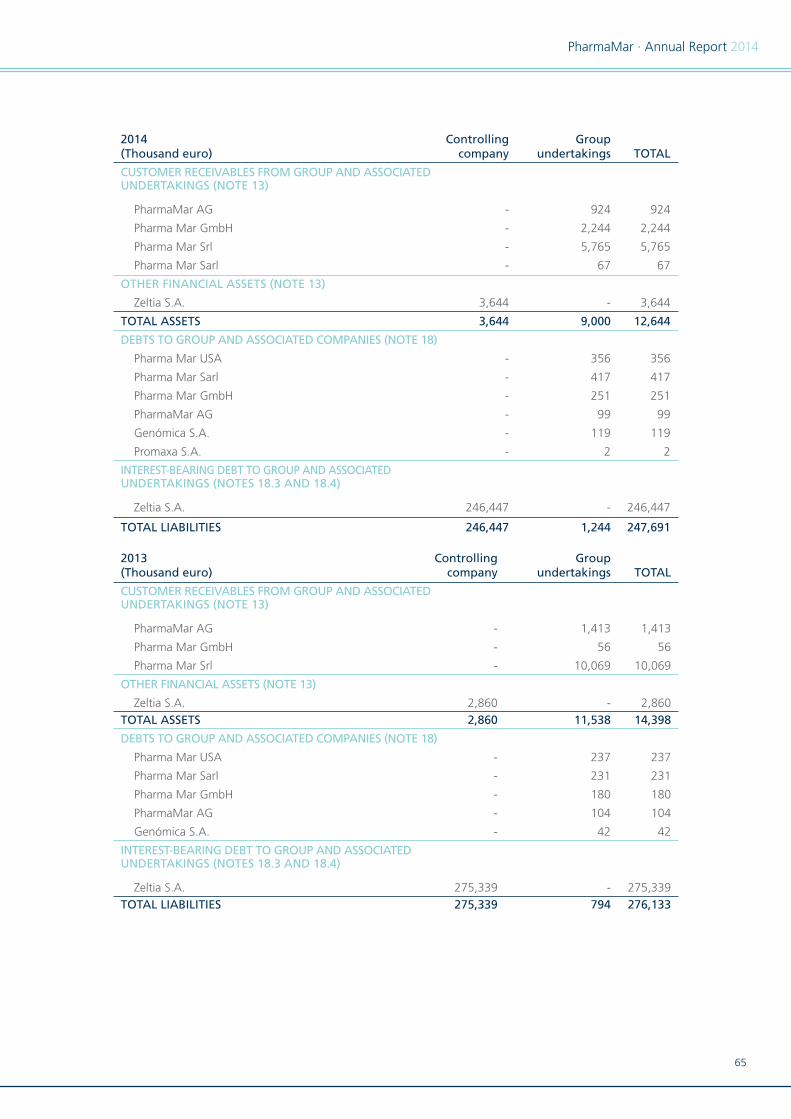
65
PharmaMar · Annual Report 2014
2013 Controlling Group(Thousand euro) company undertakings TOTAL
CUSTOMER RECEIVABLES FROM GROUP AND ASSOCIATED UNDERTAKINGS (NOTE 13)
PharmaMar AG - 1,413 1,413
Pharma Mar GmbH - 56 56
Pharma Mar Srl - 10,069 10,069
OTHER FINANCIAL ASSETS (NOTE 13)
Zeltia S.A. 2,860 - 2,860
TOTAL ASSETS 2,860 11,538 14,398
DEBTS TO GROUP AND ASSOCIATED COMPANIES (NOTE 18)
Pharma Mar USA - 237 237
Pharma Mar Sarl - 231 231
Pharma Mar GmbH - 180 180
PharmaMar AG - 104 104
Genómica S.A. - 42 42
INTEREST-BEARING DEBT TO GROUP AND ASSOCIATED UNDERTAKINGS (NOTES 18.3 AND 18.4)
Zeltia S.A. 275,339 - 275,339
TOTAL LIABILITIES 275,339 794 276,133
2014 Controlling Group(Thousand euro) company undertakings TOTAL
CUSTOMER RECEIVABLES FROM GROUP AND ASSOCIATEDUNDERTAKINGS (NOTE 13)
PharmaMar AG - 924 924
Pharma Mar GmbH - 2,244 2,244
Pharma Mar Srl - 5,765 5,765
Pharma Mar Sarl - 67 67
OTHER FINANCIAL ASSETS (NOTE 13)
Zeltia S.A. 3,644 - 3,644
TOTAL ASSETS 3,644 9,000 12,644
DEBTS TO GROUP AND ASSOCIATED COMPANIES (NOTE 18)
Pharma Mar USA - 356 356
Pharma Mar Sarl - 417 417
Pharma Mar GmbH - 251 251
PharmaMar AG - 99 99
Genómica S.A. - 119 119
Promaxa S.A. - 2 2
INTEREST-BEARING DEBT TO GROUP AND ASSOCIATEDUNDERTAKINGS (NOTES 18.3 AND 18.4)
Zeltia S.A. 246,447 - 246,447
TOTAL LIABILITIES 246,447 1,244 247,691
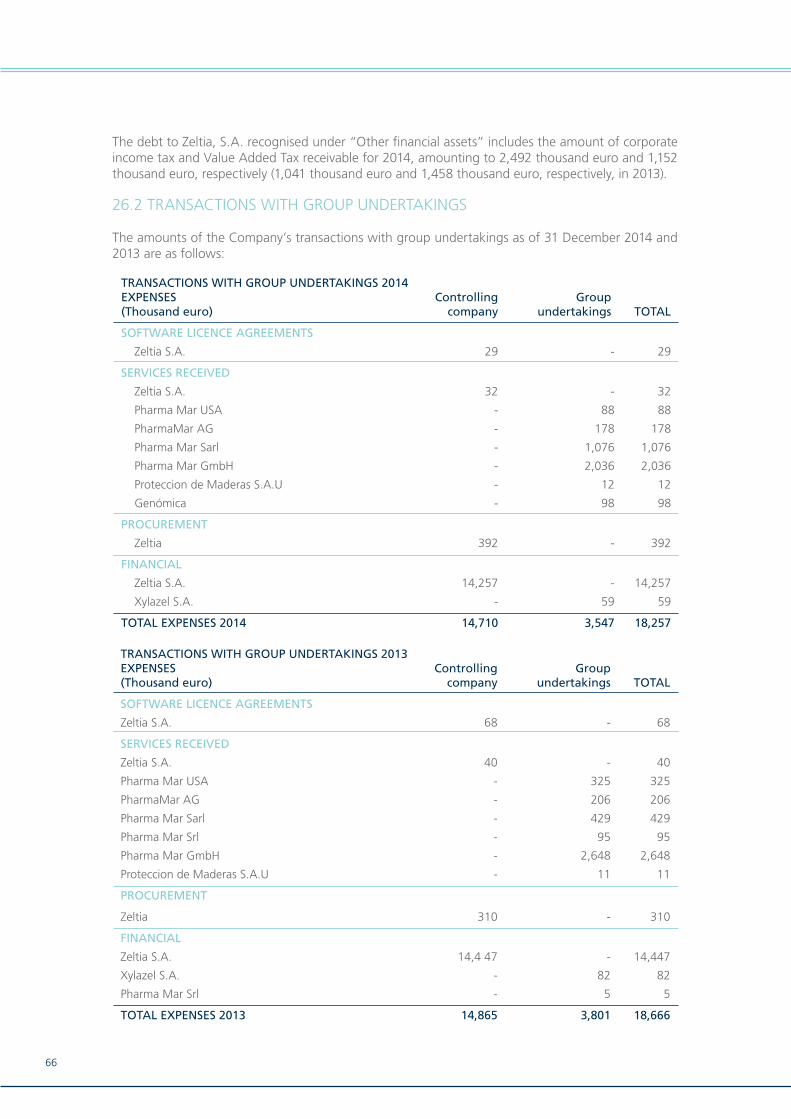
66
The debt to Zeltia, S.A. recognised under “Other financial assets” includes the amount of corporate income tax and Value Added Tax receivable for 2014, amounting to 2,492 thousand euro and 1,152 thousand euro, respectively (1,041 thousand euro and 1,458 thousand euro, respectively, in 2013).
26.2 TRANSACTIONS WITH GROUP UNDERTAKINGS
The amounts of the Company’s transactions with group undertakings as of 31 December 2014 and 2013 are as follows:
TRANSACTIONS WITH GROUP UNDERTAKINGS 2014EXPENSES Controlling Group(Thousand euro) company undertakings TOTAL
SOFTWARE LICENCE AGREEMENTS
Zeltia S.A. 29 - 29
SERVICES RECEIVED
Zeltia S.A. 32 - 32
Pharma Mar USA - 88 88
PharmaMar AG - 178 178
Pharma Mar Sarl - 1,076 1,076
Pharma Mar GmbH - 2,036 2,036
Proteccion de Maderas S.A.U - 12 12
Genómica - 98 98
PROCUREMENT
Zeltia 392 - 392
FINANCIAL
Zeltia S.A. 14,257 - 14,257
Xylazel S.A. - 59 59
TOTAL EXPENSES 2014 14,710 3,547 18,257
TRANSACTIONS WITH GROUP UNDERTAKINGS 2013EXPENSES Controlling Group(Thousand euro) company undertakings TOTAL
SOFTWARE LICENCE AGREEMENTS
Zeltia S.A. 68 - 68
SERVICES RECEIVED
Zeltia S.A. 40 - 40
Pharma Mar USA - 325 325
PharmaMar AG - 206 206
Pharma Mar Sarl - 429 429
Pharma Mar Srl - 95 95
Pharma Mar GmbH - 2,648 2,648
Proteccion de Maderas S.A.U - 11 11
PROCUREMENT
Zeltia 310 - 310
FINANCIAL
Zeltia S.A. 14,4 47 - 14,447
Xylazel S.A. - 82 82
Pharma Mar Srl - 5 5
TOTAL EXPENSES 2013 14,865 3,801 18,666
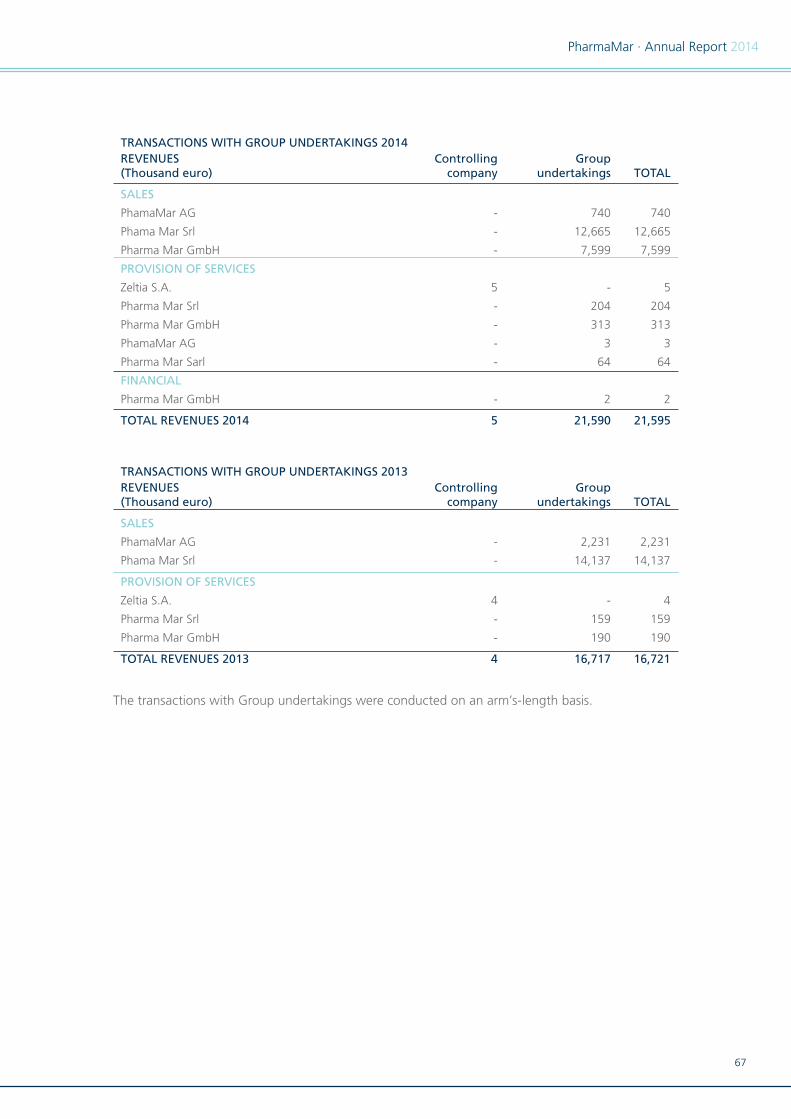
67
PharmaMar · Annual Report 2014
The transactions with Group undertakings were conducted on an arm’s-length basis.
TRANSACTIONS WITH GROUP UNDERTAKINGS 2014REVENUES Controlling Group(Thousand euro) company undertakings TOTAL
SALES
PhamaMar AG - 740 740
Phama Mar Srl - 12,665 12,665
Pharma Mar GmbH - 7,599 7,599
PROVISION OF SERVICES
Zeltia S.A. 5 - 5
Pharma Mar Srl - 204 204
Pharma Mar GmbH - 313 313
PhamaMar AG - 3 3
Pharma Mar Sarl - 64 64
FINANCIAL
Pharma Mar GmbH - 2 2
TOTAL REVENUES 2014 5 21,590 21,595
TRANSACTIONS WITH GROUP UNDERTAKINGS 2013REVENUES Controlling Group(Thousand euro) company undertakings TOTAL
SALES
PhamaMar AG - 2,231 2,231
Phama Mar Srl - 14,137 14,137
PROVISION OF SERVICES
Zeltia S.A. 4 - 4
Pharma Mar Srl - 159 159
Pharma Mar GmbH - 190 190
TOTAL REVENUES 2013 4 16,717 16,721

68
27. SURETIES AND GUARANTEES
The sureties and guarantees provided by banks for subsidies and advances received by the Company from public authorities as of 31 December 2014 and 2013 are as follows:
28. ENVIRONMENT
In 2014, the Company invested 10 thousand euro in environmental matters (33 thousand euro in 2013).
The most significant installations that the Company has at present include:
Atmospheric emissions: To control and clean emissions, the Company has scrubbers for gas •from fume cupboards, absolute particle filters in the production area, and particle filters in the R&D department.
Industrial discharges: the Company installed a network that separates industrial water, two •tanks to homogenise discharges, and a discharge valve, pursuant to the Madrid Region Law 10/93.
Waste: the Company has built two special rooms to store waste prior to removal and disposal.•
Environmental protection and improvement expenses amounted to 42 thousand euro in 2014 (53 thousand euro in 2013) and relate mainly to waste disposal by third parties.
The Company is not aware of any significant environmental contingencies as a result of its activities.
29. SUBSEQUENT EVENTS
On 1 December 2014, Zeltia, the sole shareholder of Pharma Mar, S.A., announced that its Board of Directors had approved a strategy that envisages merging Zeltia, S.A. with Pharma Mar, S.A. This would be the first step in the strategy approved by the Board, after which the resulting company would apply for a listing in the US market.
2014 2013
Payment Payment
Banco Sabadell-Atlántico 5,530 5,064
Commerzbank 751 958
Novagalicia Banco 3,583 4,354
Banco Pastor 211 369
Catalinya Caixa 261 285
Unicaja - 36
Banco Santander 62 -
Banca Cívica (La Caixa) 398 464
Banco Popular 1,324 1,324
Banco Caixa Geral 890 -
Caja Rural de Jaen 825 -
TOTAL 13,835 12,854
FINANCIAL INSTITUTION(Thousand euro)
69
PharmaMar · Annual Report 2014
On 26 February 2015, the Board of Directors of Zeltia, S.A. resolved to commence the legal paperwork for the merger process whereby Pharma Mar, S.A. would absorb Zeltia, S.A. If the process is completed, Pharma Mar, S.A. would acquire, by universal succession, the equity of Zeltia, S.A., which in turn would be extinguished, and each shareholder of Zeltia, S.A. would receive the proportionate number of shares of Pharma Mar, S.A. to which he/she is entitled, and an application would be filed to list the shares, as announced previously.
In the framework of the licensing contract for the development and marketing of Yondelis® signed by Pharma Mar, S.A. and Taiho Pharmaceutical Ltd. in March 2009, on 4 February 2015, Pharma Mar, S.A. collected from Taiho a payment of 200 million yen as a result of the presentation by Taiho to PMDA (the Japanese regulator) in January of the application for authorization to market Yondelis® (trabectedin) for the treatment of several subtypes of soft tissue sarcoma.
On 5 February 2015, the Company collected a fifth payment of 10 million dollars in the framework of the agreement with the Johnson & Johnson group for attainment of milestones in the Yondelis® development plan.
In February, the Company rolled over credit lines amounting to 2,000 thousand euro in total.
On 6 January 2015, the Spanish tax authorities notified the company of plans to commence a partial tax audit of consolidated corporate income tax for the years 2010 to 2012, which would be confined to examining revenues from certain intangible assets reported by PharmaMar. On 20 January 2015, the company applied to the tax authorities for the partial tax audit to be converted into a general tax audit. On the date that these financial statements were authorised, the tax audit is at a very early stage and it is impossible to make any estimate of the outcome. However, the Company’s Directors do not believe that the inspection will lead to additional liabilities or that the amount of assets recognised will decline significantly.
Between year-end and the drafting of these financial statements, no significant events occurred that affect the content of these financial statements and there were no other events of significance.
30. AUDITORS’ FEES
In 2014, PricewaterhouseCoopers Auditores, S.L. accrued 55 thousand euro, excluding VAT (55 thousand euro in 2013, excluding VAT), in auditors’ fees and 13.5 thousand euro for additional work (8 thousand euro in 2013); no other amount was paid to any company in the same group of companies as the auditor or to any company related to the auditor through joint ownership, management or control.

70
5. Directors’ Report
71
PharmaMar · Annual Report 2014
5. Directors’ ReportDirectors’ Report 2014
Pharma Mar, S.A. Sociedad Unipersonal
72
Directors’ report
In 2014, PharmaMar continued to grow and strengthen its position, in both the pharmaceutical space and in the research and development of marine-based cancer products.
Once again, PharmaMar was the Spanish company with the greatest R&D and innovation spending, to which it allocates more than 45% of gross revenues, 7% more than in 2013.
PharmaMar also remains a leader in developing marine-based anti-tumour compounds as it continues active clinical development of its compounds: Yondelis®, Aplidin®, PM01183 and PM060184.
In the pharmaceutical space, gross sales of Yondelis® increased by 8% year-on-year in 2014, despite the adverse economic environment.
In December 2014, the Board of Directors of Zeltia, S.A. announced a strategy through which, in an initial stage, Zeltia would merge with PharmaMar, the company through which it implements its main business strategy, followed by a second phase in which the resulting company would be listed on the US market.
On 26 February 2015, the Board of Directors of Zeltia, S.A. resolved to commence the legal process to merge Zeltia, S.A. into Pharma Mar, S.A. If that process is completed, Pharma Mar, S.A. will acquire Zeltia, S.A.’s equity by universal succession; the latter will cease to exist and each of its shareholders will receive the proportionate number of shares of Pharma Mar, S.A. to which they are entitled at the time of the merger; and those shares will be listed.
SALES AND MARKETING
Yondelis® is currently approved in 77 countries for soft tissue sarcoma and in 70 countries for platin-sensitive ovarian cancer in combination with PLD; 31 of those countries are in the European Economic Area (EEA).
Sales of Yondelis® provided PharmaMar with 93.3 million euro in gross revenues in 2014, i.e. an increase of more than 8% with respect to 2013.
In previous years, PharmaMar expanded its international footprint by opening subsidiaries in Italy and Germany. As part of its ongoing internationalisation, on 15 December 2014, PharmaMar opened an office in Paris via its subsidiary PharmaMar, Sarl, with a team of 13 people.
On 1 July, Pharma Mar, Srl, the company’s Italian subsidiary, signed a licensing agreement with Spanish company GP Pharm, S.A. for the distribution in Italy of Politrate®, which is approved for prostate cancer in 23 European Union countries.
That same month, PharmaMar signed a licensing agreement with Chugai Pharma Marketing Ltd., a wholly-owned subsidiary of Chugai Pharmaceuticals Co. Ltd., to market Aplidin® to treat multiple myeloma in eight European countries: France, Germany, the UK, Benelux, Ireland and Austria. After signing this agreement, PharmaMar received an initial payment of 5 million euro and, if specific milestones are achieved in compound development and other regulatory and commercial objectives are attained, it could receive additional payments totalling more than 30 million euro.
Agreements of this type further the company’s in-licensing and out-licensing strategy.
The company continued to receive royalties from Johnson & Johnson for sales outside Europe, which amounted to 1,872 thousand euro in 2014. This amount will increase considerably in 2015, once Yondelis® receives authorisation in the US for soft tissue sarcoma, as Johnson & Johnson presented the application for marketing authorisation to the FDA in November and it was granted Priority Review status in February 2015.
73
PharmaMar · Annual Report 2014
Additionally, our partner Taiho Pharmaceutical Co. Ltd., which is responsible for developing Yondelis® in Japan, filed an application to market Yondelis® for soft tissue sarcoma in Japan in January 2015. That application, too, has been granted Priority Review status.
In January 2014, the company received the fourth 25 million dollar milestone payment under the agreement with Janssen Products LP, our partner in the US, with which a new plan of action was agreed to strengthen the development of Yondelis® there. Under this agreement, PharmaMar collected 100 million dollars in the last four years and another 10 million dollars in February 2015.
PIPELINE OF PRODUCTS UNDERGOING CLINICAL DEVELOPMENT
The main events in the clinical development of our compounds are detailed below:
Yondelis• ®
Soft-tissue sarcoma
Recruitment continued in 2014 for the Phase II trial at Japan’s National Cancer Centre, sponsored by our partner Taiho Pharmaceutical Co. Ltd., with a view to allowing access to Yondelis® on a compassionate use basis.
Observational and post-authorisation trials with Yondelis® in collaboration with various European cooperative groups advanced as expected in 2014. Recruitment for three trials concluded, and six new trials in this indication commenced in the year.
Ovarian cancer
Enrolment continued on schedule for the pivotal clinical trial in ovarian cancer in the US, sponsored by Janssen. This trial will lay the foundation for registration in the US and other countries where Yondelis® does not yet have approval.
With respect to the observational and post-authorisation trials with Yondelis®, recruitment for five clinical trials continued to advance very satisfactorily.
Other indications
The Mario Negri Institute for Pharmacological Research, in cooperation with the Department of Medical Oncology at San Gerardo Hospital (Monza, Italy), continued with the ATREUS Phase II trial to evaluate the activity and safety of Yondelis® in malignant pleural mesothelioma (MPM).
Aplidin• ®
Recruitment proceeded apace for the pivotal trial with Aplidin® in combination with dexametasone in multiple myeloma, adding 100 more patients in 2014. Recruitment is expected to conclude in 1Q 2015 and, if the trial results are positive, this will be followed by final analysis of the data and presentation of the registration dossier.
Recruitment commenced in June for a combination trial with Aplidin® and bortezomib in patients with multiple myeloma with a view to determining the recommended dose and allowing for Aplidin® to be used in earlier stages of the illness.
The mass balance trial, which is essential for obtaining information on the metabolism and elimination of Aplidin® for the registration dossier, will begin in the first quarter of 2015 after all of the complex components of this type of trial had been prepared in 2014.
74
These three trials are part of the clinical development process, which aims to obtain the necessary information to support the use of Aplidin® in various phases of treatment of multiple myeloma.
pM01183•
Monitoring of survival data from the Phase II trial in resistant/refractory ovarian cancer concluded in 2014. Following the excellent results obtained, which were presented orally at the annual meeting of the American Society of Clinical Oncology (ASCO), held from 30 May to 3 June in Chicago, a pivotal Phase III trial will commence in this indication in the first half of 2015. This trial will evaluate PM01183 as monotherapy vs. a control arm with topotecan or liposomal doxorubicin.
The interim analysis for the Phase II clinical trial in patients with advanced breast cancer selected on the basis of the presence of mutations, known or otherwise, of the BRCA 1 or 2 genes (hereditary cancer), concluded in 2014. Recruitment will continue until 53 patients are included in the branch of patients with mutations of the BRCA 1 or 2 genes, as established in the protocol, and the registration strategy is being prepared in this indication. The data from this trial were presented at the Breast Cancer Symposium, held in December in San Antonio (Texas).
Recruitment is continuing on schedule for the Phase II randomised trial in patients with non-small cell lung cancer. This trial commenced after good efficacy results were obtained in the Phase I trial in combination with gemcitabine. In 2015, PharmaMar is planning an international registration trial in small-cell lung cancer, following the excellent results obtained in the Phase I trial in combination with doxorubicin, where patients with SCLC undergoing second-line treatment obtained a tumour response rate of 70%, including 10% complete tumour responses.
As regards the Phase I combination trials, recruitment continues for the combinations with doxorubicin, capecitabine, paclitaxel and cisplatin.
pM060184•
The clinical trial conducted in the US and Spain found the optimal dose for future Phase II trials. Recruitment continues for another trial, in France and Spain, with a view to confirming the recommended dose and evaluating the drug’s activity in various indications.
A Phase I trial with PM060184 combined with gemcitabine has commenced at two centres, in Spain and the United States. This trial stems from the excellent results obtained with the combination in preclinical trials.
OTHER SIGNIFICANT EVENTS
As in previous years, PharmaMar was rated “Excellent” by PROFARMA, the Spanish government programme to promote competitiveness in the pharmaceutical industry.
We built a fermentation plant at our facilities in Colmenar Viejo with a view to achieving greater flexibility and security in the supply of our drugs.
• seArch for new MArine sAMples
The search for new marine samples was particularly intense in 2014. PharmaMar added more than 10,000 new samples to its collection of micro- and macro-organisms, which now holds over 159,000, assuring its world-leading position in the discovery and development of new drugs of marine origin.
• pAtent portfolio
By the end of 2014, the company had 1,346 patent applications on file, 1,197 of which had been granted and 149 were pending. They represent a total of 47 families of patents, each protecting a specific invention.
75
PharmaMar · Annual Report 2014
finAnciAl inforMAtion•
A total of 42 million euro of R&D expenses were capitalised in 2014, 22% more than in 2013. Income after tax amounted to 12,527 thousand euro in 2014.
In 2014, PharmaMar acquired 16,252 shares of its parent company, Zeltia, S.A., and sold the same number of shares. These acquisitions were a result of the Zeltia Group employee stock ownership plans.
FINANCIAL RISKS
The Company’s activities are subject to a number of financial risks: market risk (including exchange rate risk, interest rate risk and price risk), credit risk, and liquidity risk. The Company’s overall risk management programme focuses on the uncertainty of the financial markets and tries to minimise the potential adverse effects on the Company’s returns.
Risk management is controlled by the Company’s Finance Department, which identifies, evaluates and hedges financial risks in accordance with the overall policies of the Zeltia group and those approved by the Board of Directors. The Zeltia group establishes written guidelines for overall risk management and for specific areas such as exchange rate risk, interest rate risk, liquidity risk, the use of derivatives and non-derivatives, and investment of surplus liquidity.
Price risk, which is concentrated in the Group’s investments in biopharmaceutical companies, is negligible given the small size of those investments.
Transactions in currencies other than the euro, primarily US dollars, Swiss francs and pounds sterling, amounted to 28,510 thousand euro in 2014; the largest transaction in the year was the receipt of 25 million dollars from Janssen Products LP. Management does not consider it necessary to establish any policy for hedging the foreign currency risk vs. the functional currency.
Part of the company’s debt is from official authorities in the form of repayable advances, which are not subject to interest rate risk. It is Company policy for as much of its debt as possible to be due to official authorities. Nevertheless, the Company actively analyses its exposure to interest rate risk. It simulates a number of scenarios considering refinancing, roll-overs, alternative financing and hedging. Based on those scenarios, the Company calculates the effect on income of a given variation in interest rates. Each simulation assumes the same change in interest rates in all currencies. The scenarios are applied only to the largest interest-bearing liability positions.
As regards credit risk, the banks and financial institutions with which the Company works generally have independent ratings. As for customer-related credit risk, where they have an independent rating, that rating is used; otherwise, the Company assesses the risk based on the customer’s financial position, past experience and other factors. Where there is no doubt about a customer’s solvency, no credit limits are set.
Regarding liquidity risk, the goal of the Company’s Finance Department is to maintain flexible financing by having sufficient funds in the form of financial assets to settle its obligations.