Embed Size (px)
Citation preview
(Aug 2016)

MOL Group Corporate Principles
Long-term Vision
To develop the MOL Group into an excellent and resilient organization that leads the world shipping industry
As a multi-modal transport group, we will:
• actively contribute to global economic growth and development, anticipating the needs of our customers and the challenges of this new era
• strive to maximize corporate value through creativity, operating efficiency and promotion of ethical and transparent management
• nurture and protect the natural environment by maintaining the highest standards of operational safety and navigation

【Contents】
MOL at a Glance ①Highlights of Business Performance 03
②Strategically Balanced Business Portfolio 05
③Market Position 07
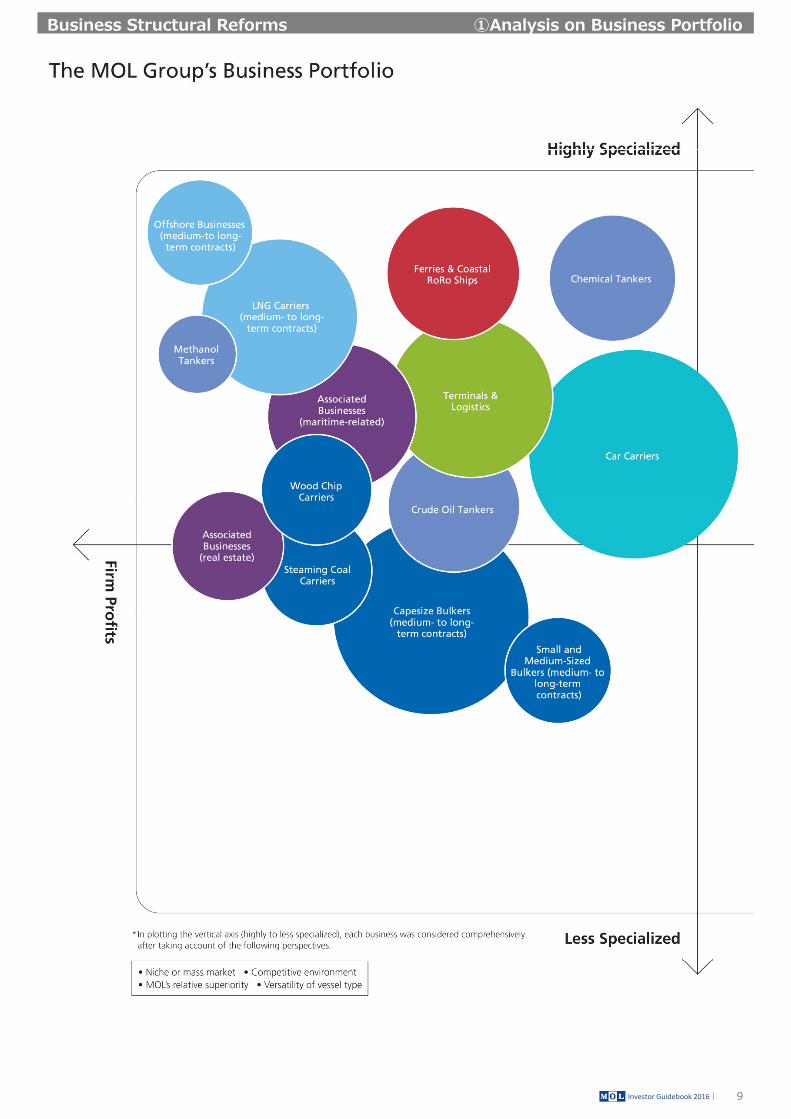
Business Structural Reforms ①Analysis on Business Portfolio 09
②Analysis on Earnings Structure 11
③Content of the Business Structural Reforms 12
Segment Information ①Overall View 13
②Dry Bulkers 15
③Tankers 18
④LNG Carriers・Offshore Business 21
⑤Car Carriers 23
⑥Containerships・Terminal・Logistics 24
⑦Ferries & Coastal RoRo Ships (Roll on/Roll off) 27
⑧Associated Businesses 28
Management Foundation ①Corporate Governance/Compliance 29
②Safe Operation 30
③Environment 31
④Social Responsibility 32
Financial Data ①Profitability & Efficiency Indices 33
②Stability Indices 34
③Cash Flow Indices 35
④Performance Indices 36
⑤Financial Statements(Consolidated) 37
General Information 39

MOL at a Glance ①Highlights of Business Performance P/L
3
Reinforce Cost Competitiveness
Exchange Rate & Bunker Price (Fiscal year average)
Investor Guidebook 2016|
0.8 0.8 1.1 1.6 2.5 2.2 3.3 3.8 1.7 2 2 1.9 2 2.1 1.80.3 0.3 0.3 0.3 0.3 0.3 0.3 0.3 0.2 0.2 0.2 0.17 0.18 0.24 0.19
+19 -10 -14 -14 -15 -1 -33 -94 +12 -30 -51 +7 +44 +37 +72*Maximum estimation
Effect to Ordinary income/loss(\bn)
FX Sensitivity(\bn/\/$)
Bunker PriceSensitivity(\bn/$/MT)

Note: ”Shareholdersʼ Equity” refers to : To FY2005: Shareholders ʼequity on the consolidated Balance Sheet From FY2006: Ownersʼ equity plus accumulated gains/losses from valuation and translation adjustments
B/S
4
Dividends
【Dividend Policy】 The company recognizes the importance of increasing corporate value through aggressive
business investment and returning profits directly to the shareholders through dividends.
We are seeking to increase our corporate value per share while utilizing internally reserved funds and solidifying our financial position.
In consideration of the above issues, the company will use 20% as a guideline for the dividend payout ratio over the coming terms, and pay dividends in conjunction with consolidated performance. However, MOL will address the need to increase the ratio under its mid-and long-term management policies.
Investor Guidebook 2016|
MOL at a Glance ①Highlights of Business Performance
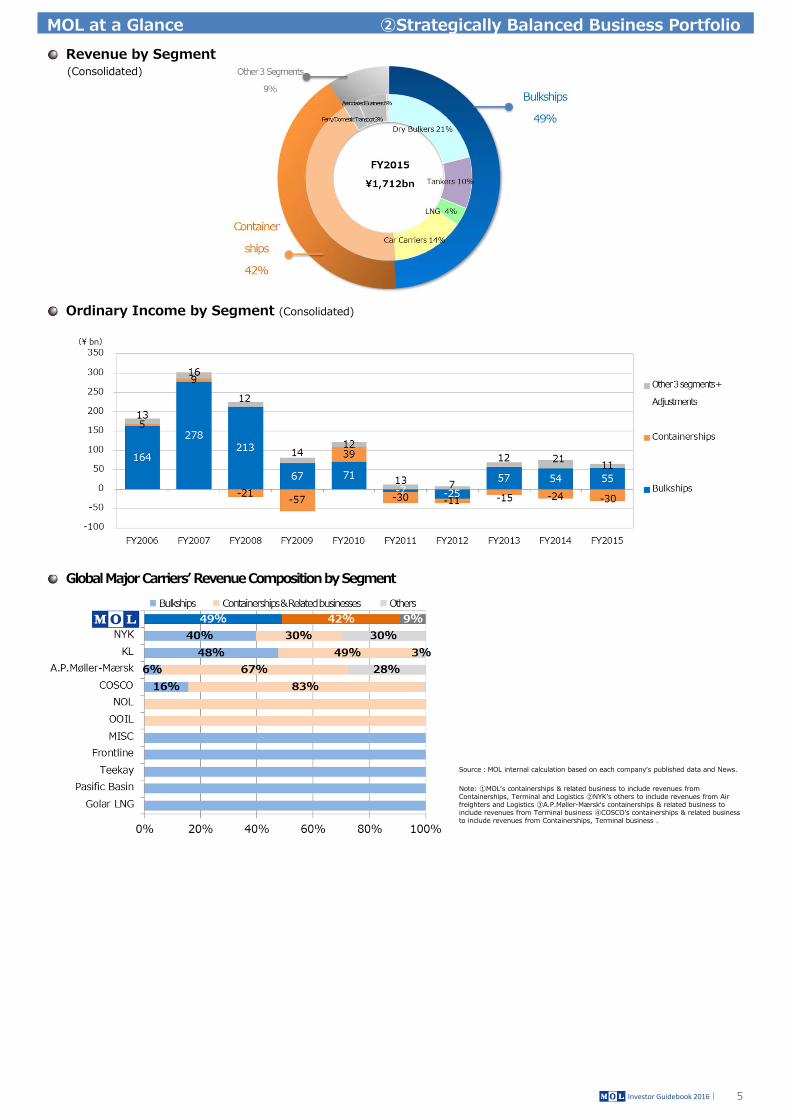
Revenue by Segment(Consolidated)
5
Ordinary Income by Segment (Consolidated)
Investor Guidebook 2016|
MOL at a Glance ②Strategically Balanced Business Portfolio
Source:MOL internal calculation based on each companyʻs published data and News.
Note: ①MOLʻs containerships & related business to include revenues from Containerships, Terminal and Logistics ②NYKʼs others to include revenues from Air freighters and Logistics ③A.P.Møller-Mærskʻs containerships & related business to include revenues from Terminal business ④COSCOʼs containerships & related business to include revenues from Containerships, Terminal business .
Global Major Carriers̓ Revenue Composition by Segment
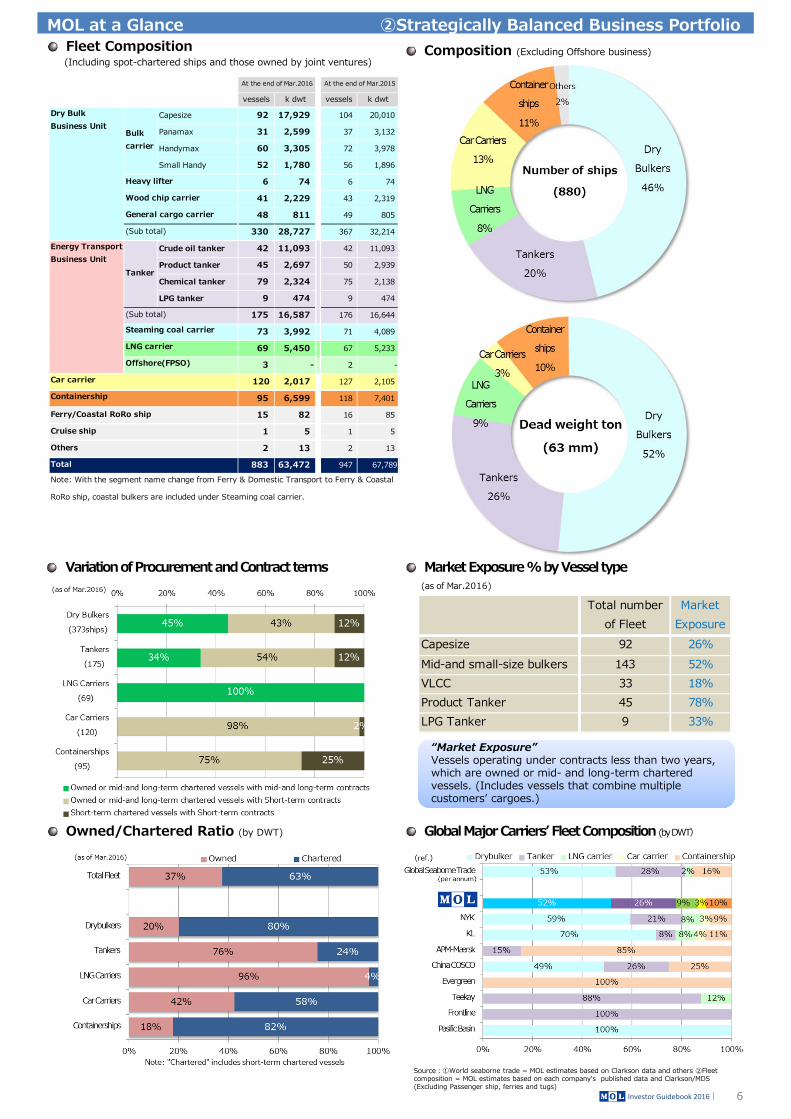
Fleet Composition(Including spot-chartered ships and those owned by joint ventures)
6
Variation of Procurement and Contract terms
Owned/Chartered Ratio (by DWT)
Investor Guidebook 2016|
Composition (Excluding Offshore business)
Market Exposure % by Vessel type
Global Major Carriers̓ Fleet Composition (by DWT)
MOL at a Glance ②Strategically Balanced Business Portfolio
Source:①World seaborne trade = MOL estimates based on Clarkson data and others ②Fleet composition = MOL estimates based on each company's published data and Clarkson/MDS (Excluding Passenger ship, ferries and tugs)
“Market Exposure”Vessels operating under contracts less than two years, which are owned or mid- and long-term chartered vessels. (Includes vessels that combine multiple customersʼ cargoes.)
“Market Exposure”Vessels operating under contracts less than two years, which are owned or mid- and long-term chartered vessels. (Includes vessels that combine multiple customersʼ cargoes.)
(as of Mar.2016)
Total numberof Fleet
MarketExposure
Capesize 92 26%Mid-and small-size bulkers 143 52%VLCC 33 18%Product Tanker 45 78%LPG Tanker 9 33%
vessels k dwt vessels k dwt
Capesize 92 17,929 104 20,010
Panamax 31 2,599 37 3,132
Handymax 60 3,305 72 3,978
Small Handy 52 1,780 56 1,896
6 74 6 74
41 2,229 43 2,319
48 811 49 805
330 28,727 367 32,214
Crude oil tanker 42 11,093 42 11,093
Product tanker 45 2,697 50 2,939
Chemical tanker 79 2,324 75 2,138
LPG tanker 9 474 9 474
175 16,587 176 16,644
73 3,992 71 4,089
69 5,450 67 5,233
3 - 2 -
120 2,017 127 2,105
95 6,599 118 7,401
15 82 16 85
1 5 1 5
2 13 2 13
883 63,472 947 67,789
RoRo ship, coastal bulkers are included under Steaming coal carrier.
Total
Steaming coal carrier
Tanker
LNG carrier
Offshore(FPSO)
Energy TransportBusiness Unit
At the end of Mar.2016
Note: With the segment name change from Ferry & Domestic Transport to Ferry & Coastal
At the end of Mar.2015
Others
(Sub total)
Dry BulkBusiness Unit
Bulkcarrier
Heavy lifter
Wood chip carrier
General cargo carrier
(Sub total)
Car carrier
Containership
Ferry/Coastal RoRo ship
Cruise ship
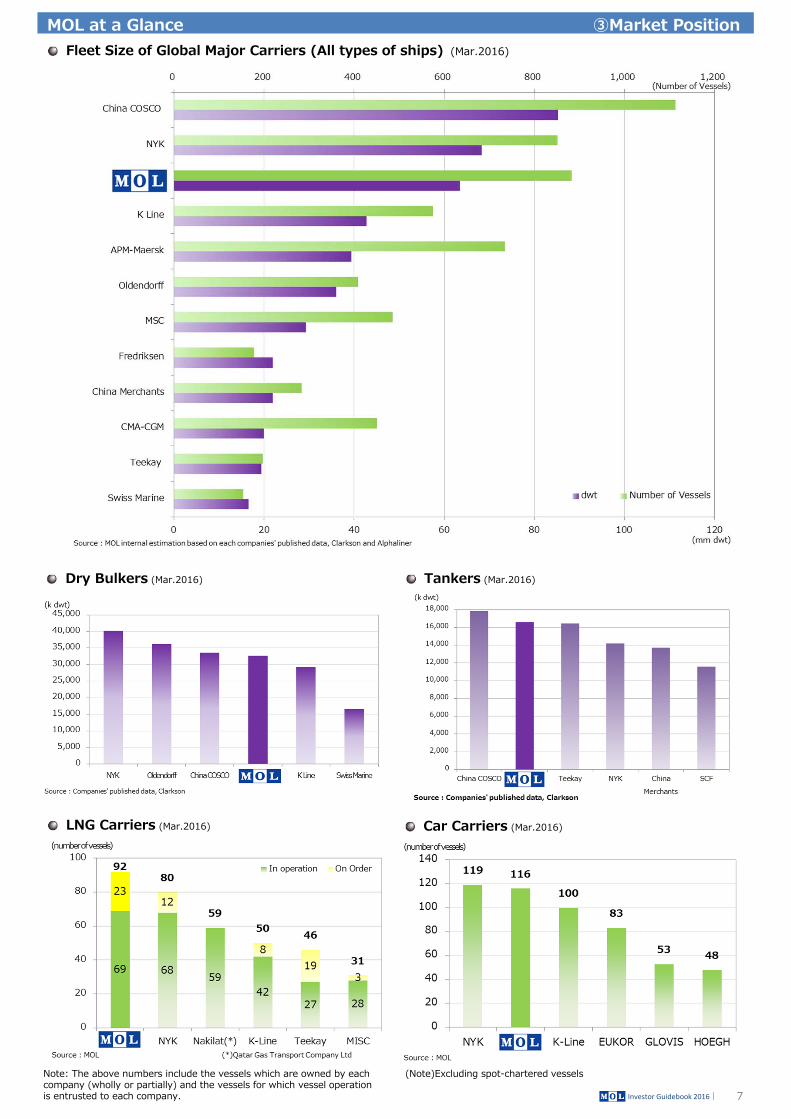
Fleet Size of Global Major Carriers (All types of ships) (Mar.2016)
7
Dry Bulkers (Mar.2016)
LNG Carriers (Mar.2016)
Investor Guidebook 2016|
Tankers (Mar.2016)
Car Carriers (Mar.2016)
MOL at a Glance ③Market Position
(Note)Excluding spot-chartered vesselsNote: The above numbers include the vessels which are owned by each company (wholly or partially) and the vessels for which vessel operation is entrusted to each company.

Containerships (by TEU)
8
Containerships:Major Operators/Alliances Share by TEU (Mar.2016)
Investor Guidebook 2016|
MOL at a Glance ③Market Position
Greater Alliances
(G6)Services started on AE trade in Mar.2012, expanded to TP trade(USEC) in May 2013, TP trade(USWC) and Atlantic trade in May 2014(2M)Service started in Jan 2015(CKYHE) Service started on AE(including Mediterranean region) in April 2014 and expanded to TP Trade in spring 2015(Ocean3)Service started in 2015
9Investor Guidebook 2016|
Business Structural Reforms ①Analysis on Business Portfolio

10Investor Guidebook 2016|
Business Structural Reforms ①Analysis on Business Portfolio

11Investor Guidebook 2016|
Business Structural Reforms ②Analysis on Earnings Structure

12Investor Guidebook 2016|
Business Structural Reforms ③Content of the Business Structural Reforms

World Population & Global Seaborne Traffic
13
Seaborne Traffic by Commodity
Investor Guidebook 2016|
Segment Information ①Overall View

Growth of World GDP & Seaborne Traffic by Commodity
14
(Ref.)Ship Prices
Investor Guidebook 2016|
Segment Information ①Overall View

MOL Dry Bulkers : Revenue Breakdown(Consolidated)
15
Global Seaborne Trade of Major Dry Bulk Cargoes
Crude Steel:Global Production by Area
Iron Ore:Global Seaborne Trade by Import Area
Investor Guidebook 2016|
Segment Information ②Dry Bulkers
ExportAustralia→Shanghai: 3,100miles(about 18days)Brazil →Shanghai : 11,000miles(about 48days)Australia→Shanghai: 3,100miles(about 18days)Brazil →Shanghai : 11,000miles(about 48days)
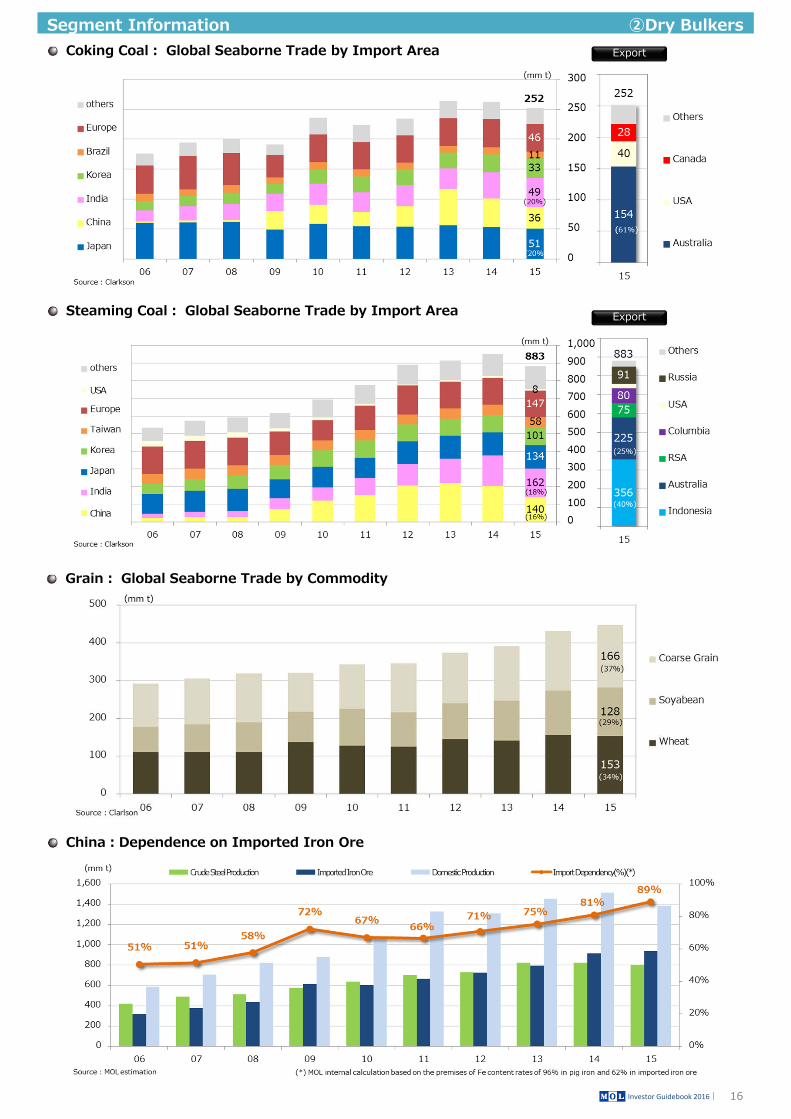
Coking Coal: Global Seaborne Trade by Import Area
16
Steaming Coal: Global Seaborne Trade by Import Area
Grain: Global Seaborne Trade by Commodity
China:Dependence on Imported Iron Ore
Investor Guidebook 2016|
Segment Information ②Dry BulkersExport
Export

Vessel Supply (Source:MOL internal calculation based on IHS-Fairplay)
17Investor Guidebook 2016|
Segment Information ②Dry Bulkers
Main cargoes: Steel, Cement, Grain, Ore
Main cargoes: Iron ore, Coking coal
Main cargoes: Thermal coal, Grain, Salt, Cement, Steel
Main cargoes: Iron ore, Coking coal, Steaming coal, Grain

MOL Tankers : Revenue Breakdown(Consolidated)
18
Oil:Global Demand
Investor Guidebook 2016|
Segment Information ③Tankers
(Ref.)
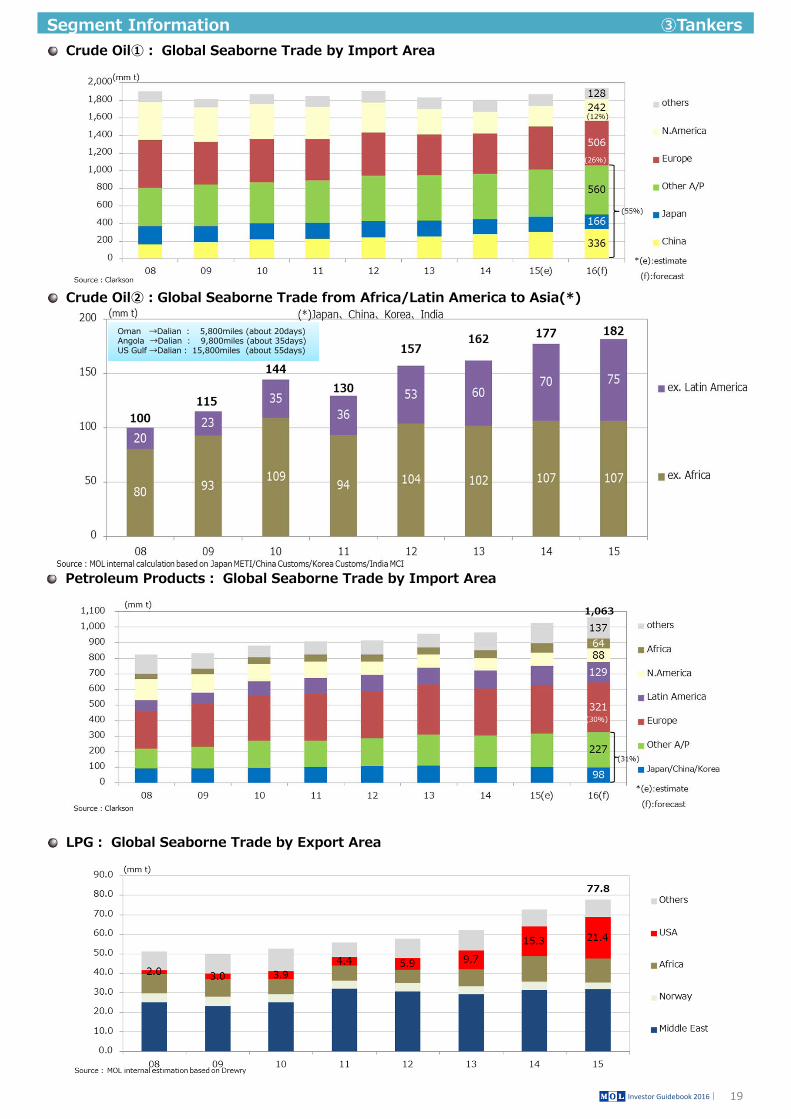
Crude Oil①: Global Seaborne Trade by Import Area
19
Crude Oil②:Global Seaborne Trade from Africa/Latin America to Asia(*)
Petroleum Products: Global Seaborne Trade by Import Area
LPG: Global Seaborne Trade by Export Area
Investor Guidebook 2016|
Segment Information ③Tankers
Oman →Dalian : 5,800miles (about 20days)Angola →Dalian : 9,800miles (about 35days)US Gulf →Dalian: 15,800miles (about 55days)
Oman →Dalian : 5,800miles (about 20days)Angola →Dalian : 9,800miles (about 35days)US Gulf →Dalian: 15,800miles (about 55days)

Chemical Products:Demand Forecast by Product
20Investor Guidebook 2016|
Segment Information ③Tankers
Vessel Supply (Source:MOL internal calculation based on IHS-Fairplay)

LNG:Seaborne Trade (Result & Forecast)
21
LNG:Demand Forecast by Area
Japan:Import % of LNG by Nation of Origin
Investor Guidebook 2016|
Segment Information ④LNG Carriers/Offshore Business
US Gulf →Japan: 9,300miles (about 23days)East Africa →Japan: 7,400miles (about 17days)Middle East →Japan: 6,700miles (about 15days)West Australia →Japan: 3,700miles (about 9days)Indonesia →Japan: 2,600miles (about 7days)
US Gulf →Japan: 9,300miles (about 23days)East Africa →Japan: 7,400miles (about 17days)Middle East →Japan: 6,700miles (about 15days)West Australia →Japan: 3,700miles (about 9days)Indonesia →Japan: 2,600miles (about 7days)

FPSO
An FPSO (Floating Production Storage and Offloading) is a floating production system that receives fluids (crude oil, water and a host of other things) from a subsea reservoir.
22
FSRU
MOL:Signed Long-Term Contracts as of Mar.2016 (to start in/after Apr.2014) *Bold=In operation
Investor Guidebook 2016|
An FSRU (Floating Storage & Regasification Unit) is a floating facility for storing and regasifying LNG, which then pressurized and piped ashore.
FSRU(left/image)(photo:ENGIE)
Segment Information ④LNG Carriers/Offshore Business

Global Car Seaborne Trade
23
Car Export from Japan
Car Export from Emerging Countries
Investor Guidebook 2016|
Segment Information ④Car Carriers
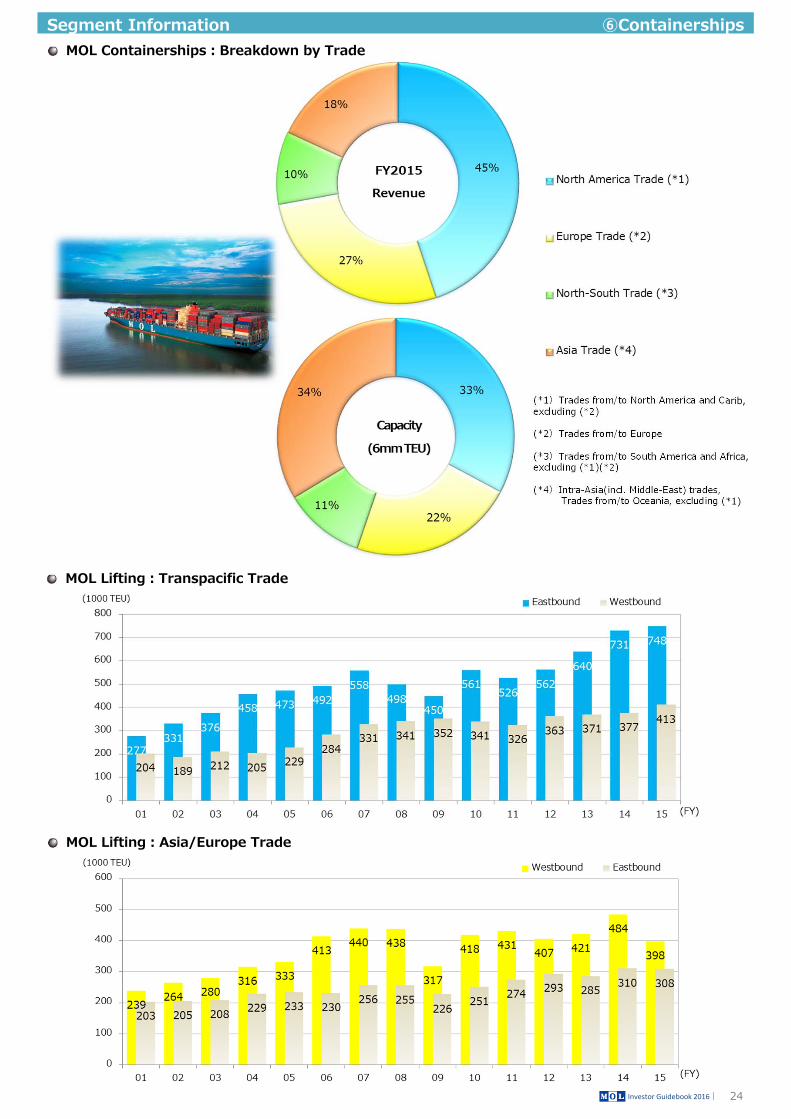
MOL Containerships:Breakdown by Trade
24
MOL Lifting:Transpacific Trade
MOL Lifting:Asia/Europe Trade
Investor Guidebook 2016|
Segment Information ⑥Containerships
(*1)Trades from/to North America and Carib, excluding (*2)
(*2)Trades from/to Europe
(*3)Trades from/to South America and Africa, excluding (*1)(*2)
(*4)Intra-Asia(incl. Middle-East) trades, Trades from/to Oceania, excluding (*1)

Cargo Movements in Major Trades (Transpacific・Asia/Europe・Intra-Asia Trades)
25
Transpacific Trade:Cargo Movements(Outbound by Export Area)
Transpacific Trade:Cargo Movement by Commodity
Global Containership Capacity by TEU size range
Investor Guidebook 2016|
Segment Information ⑥Containerships
Outbound Inbound

Berth Length Area Gantry Throughput (1000 TEU)(m) (1000 m2) Crane 2015 2014 2013
① Tokyo Japan 684 277 6 645 689 733Yokohama 300 105 3 142 150 145Osaka 350 105 2 142 148 155Kobe 800 258 5 599 556 534
② LA USA 930 704 10 828 662 658③ Oakland 336 136 4 259 257 236④ Jacksonville 730 647 6 230 233 194⑤ Laem Chabang Thailand 300 105 5 777 924 842⑥ Cai Mep Vietnam 590 346 6 979 924 644⑦ Hai Phong 750 450 6
⑧ Rotterdam(*) Netherlands 1,900 1,560 14 89(*)Rotterdam World Gateway (RWG) Opened in Q3/2015
to be opened in 2018
MOL:ULCS(over 10,000TEUs) delivery schedule (Result/Plan)
26
Cost Items & Structure:Comparison between Containerships and Bulkships
Container Terminal Business
Investor Guidebook 2016|
ContainershipsContainerships BulkshipsBulkships
Segment Information ⑥Containerships・Terminal
(*)Alliance with Brookfield
Voyage expenses(Port /fuel charges)
Vessel expenses(Capital expense + crew wages,
or charterage)
General and administrative expenses
delivery size(TEU) number trade own/charterFY2013 14,000 ×4 Asia-Europe charterFY2014 14,000 ×1 Asia-Europe charter
10,000 ×4 Asia-Europe charterFY2015 10,000 ×1 Asia-Europe charter
10,000 ×4 Transpacific charterFY2016 10,000 ×1 Transpacific charter
20,000 ×1 Asia-Europe charterFY2017 20,000 ×5 Asia-Europe charter

MOL Group Logistics Business
27
MOL Groupʼs Share in Long Course Ferry Market in Japan
Traffic Volume by Long Course Ferry Service
Investor Guidebook 2016|
Segment Information ⑥Logistics/⑦Ferries & Coastal RoRo Ships
Revenue by Area
Revenue by Segment

28
Daibiru Corp.:Midterm Management Plan ”Design100” Project Phase-1
Number of Cruise Passengers in Japan
MOL Group Tugboat Fleet Scale
Investor Guidebook 2016|
Segment Information ⑧Associated Businesses
Real Estate Creating stable profits mainly by Daibiru Corp., the core company in the MOLʼs real estate business
Cruise Ship Operating cruise ship “NIPPON MARU”
Tugboat Expanding businesses in foreign ports in addition to domestic ports
Trading Selling fuel oil, Ship equipments (PBCF) and materials, etc.
Others Travel agent, Temporary staffing, etc.
Asso
ciat
ed
Busi
ness
es
Sales Results of PBCF(*)Installed with Ships(*)Propeller Boss Cap Fins, jointly developed by MOL and other parties, improve propeller efficiency and produce a 4% to 5% improvement in fuel efficiency.
(Retirement of FUJI MARU)

MOLʼs Philosophy on Corporate Governance
MOL aims to maximize stakeholders' profits through the most appropriate allocation of management resources, with higher transparency of corporate management from the shareholdersʼ viewpoint. This philosophy is set out in the MOL Group Corporate Principles as follows: “We will strive to maximize corporate value by always being creative, continually pursuing higher operating efficiency, and promoting an open and transparent management style that is guided by the highest ethical and social standards.”
29
MOL adopts a structure whereby the Board of Directors, with the participation of independent outside directors, supervises and encourages business operations, which are carried out by the president as chief executive officer. The company introduced an outside director system in 2000.
[Corporate Governance System]
Since MOL conducts business globally, it aims to instill and entrench a compliance-oriented mind-set not only at Head Office, but also at Group companies in Japan and overseas. To this end, it regularly conducts E-learning and in-house training programs. In fiscal 2012, MOL revised its guidelines on antimonopoly laws in order to further enforce compliance and notified the amendments to Group companies in Japan and overseas.
Investor Guidebook 2015|
Overview of Corporate Governance Organization (as of Jun 21, 2016)
MOL believes compliance means not only complying with legislation and internal rules, but also observing voluntarily established internal rules (Rules of Conduct) in carrying out corporate activities, including respecting human rights, refusing to permit discrimination and harassment, and preventing corruption in accordance with social norms and corporate ethics.
Management Foundation ①Corporate Governance/Compliance☛for further information http://www.mol.co.jp/en/csr/index.html
[Compliance System]
Type of system Company with the corporate auditors
Number of directors 9
Of which, number of outside directors(ratio)
3(1/3)
Number of corporate auditors 4
Of which, number of outside corporate auditors(ratio)
2(1/2)
Number of Independent directors/corporate auditors
5
Number of Board Meetings held in FY2015
10 times
Term of office for directors 1 year
Stock Option to Directors Yes (excluding corporate auditors)
System of retirement benefits No
Takeover defense measures No
Compliance policy Yes
Basic Policies for Compliance (Compliance Rules Article 3)
1.Strive to follow the MOL Corporate Principles and make them a reality.
2.Always recognize the public mission and social responsibilities of MOL's business, and maintain the trust of the company's stakeholders.
3.Strictly comply with laws, regulations, and so on, and conduct fair and transparent corporate activities in the context of social norms and corporate ethics.
4.Never yield to antisocial influence, and never be a party to antisocial acts.

☛for further information http://www.mol.co.jp/en/csr/index.html
30
Nationality Ratio of Seafarers(MOL owned vessel)
Making Processes for Realizing Safe Operation VisibleMOL has introduced objective performance indicators for measuring safety levels, and also set the following numerical targets, including the Four Zeroes.① Four Zeroes (an unblemished record in terms of serious marine incidents, oil pollution,
fatal accidents and heavy cargo damage)② LTIF(*1)(Lost Time Injury Frequency): 0.25 or below③ Operational stoppage time(*2): 24 hours/ship or below④ 4.Operational stoppage accident rate(*3): 1.0/ship or below
Investor Guidebook 2015|
Management Foundation ②Safe Operation
Safe Operation Management Structure
〜Forging Ahead to Become the World Leader in Safe Operation〜
The MOL Training Centers, where excellent seafarers around the world are trained
(*1) Number of work-related accidents per one million hours worked that resulted in time lost from work of one day or more. Average for all industries (2014) was 1.66; for shipping industry, 1.33; for transportation equipment manufacturing industry, 0.51. (Source: 2014 Survey on Industrial Accidents issued by the Ministry of Health, Labour and Welfare)
(*2) Expresses the amount of ship operational stoppage time due to accidents per ship per year.(*3) Expresses the number of accidents that result in ship operational stoppage per ship per year.
・ Ship management coordinating divisions
・ Marine technical teams supporting vessel operations for business divisions
・ In-house ship management companies leading working level ship management ** MOL Ship Management Co., Ltd., and MOL LNG Transport Co., Ltd
Safe Operations Headquarters
Marine Safety Division
Executive Committee
Operational Safety Committee
SafetyAssuranceCommittee
ShipStandard
Specification
ManningCommittee

Schedule of Environmental Regulations by IMO,etc.
31
Next-generation Car Carriers “FLEXIE” to Feature
Investor Guidebook 2015|
Management Foundation ③Environment
(CG image)
Reduce environmental impact through overall optimization and serving for global environmental protection by engaging incompany-wide efforts and response to diverse environmental regulations.
(*1) EEDI(Energy Efficiency Design Index)is a measure of ships energy efficiency (g/ton-mile). The required EEDI of each Phase is as follows:Phase 0=0%, Phase 1=max 10%, Phase 2=max 20% (Applied to new ships)
(*2) SEEMP (Ship Energy Efficiency Management Plan) is required to be drawn up to show optimal measures of operation that should be adjusted to the characteristics of individual ships, and to be kept on board a ship. (Applied to both new and existing ships)
(*3) The regulation for reduction of NOx in exhaust gases: TierⅠis applied to ships laid down in 2000〜2010, TierⅡ to ships laid down in/after 2011, and TierⅢ to ships laid down in/after 2016.
(*4) The existing ECAs (Emission Control Areas) are: ①Within 200 miles off the coast of USA and Canada(NOx/SOx)②The USA Caribbean Sea area(NOx/SOx)③The Baltic Sea and the North Sea areas (SOx)
(*5) The regulations for reduction of SOx contained in fuel oil (Applied to both new and existing ships)(*6) A review in 2018 on the availability of the required fuel oil may conclude to postpone the application to 2025.(*7) The convention shall enter in force 12 months after the following conditions are met, and it is increasingly likely that it enters into force in 2017.(Applied to both new
ships and, after certain grace periods, to existing ships)(Conditions) Ratification by not less than 30 countries representing a combined total G/T of more than 35% of the worldʼs merchant fleet.(As of May 2016, 49 countries representing a combined total G/T of 34.79% have ratified.)
(*8) Regional regulation by U.S. Coast Guard. (*9) The guideline aimed at minimizing transfer of invasive aquatic species attaching to the bottom of ships, recommending installation of the systems on vessels to keep the
bottom clean without marine organisms and other measures. (It remains as a voluntary guideline during the review period.)(*10) The convention prohibits and restricts the fitting and use of treaty-specified hazardous materials, and requires vessels to prepare, record and update inventory lists
showing the quantity and location of hazardous materials on ships over a ship's lifetime. The convention shall enter into force 24 months after the following conditions are met:(Conditions) Ratification by not less than 15 countries representing a combined total G/T of more than 40% of the worldʼs merchant fleet and an annual ship recycling volume not less than 3% of the combined tonnage of the ratifying countries.(As of Mar. 2016, 3 countries have ratified.)
Environmental Investments (¥bn)
【CO2 and Cost Reductions from Environmental Measures】
[to be delivered in 2017]The rounded bow shape will minimize wind resistance and is expected to reduce CO2 emissions by about 2% compared to todayʼs car carriers.
(FY) 2014 2015
Environment-related R&D activities 0.7 0.3
Utilization and expansion of existing environmental technologies
2.1 0.9
Response to environmental regulations 0.5 2.2
Initiatives to save bunker fuel 0.9 1.0
Initiatives of Group companies 0.2 3.0
Total 4.3 4.6
(FY) 2013 2014 2015
CO2 emission reductions(1,000t)
27.9 34.8 30.3
Cost Reduction(¥ bn)
5.5 5.5 3.1
2015 2016 2017 2018 2019 2020 2025
EEDI*1 Phase 2 Phase 3
SEEMP*2
General Sea
Areas
ECA*4
General Sea
Areas
ECA
General Sea
Areas
Regulation by
USCG*8
(Enoforced
in 2012)
(Adopted in 2009: not ratified)
*Introdoction of MRV (Monitoring, Reporting and Verification of actual consumption) and MBM (Market-based Measures) is under
study torward further reduction of GHG emissions.
Minimizing the transfer of invasive aquatic species
by shipping *9
Ship Recycling Convention *10
Sox emissions*5
Sulfur limit 3.5% Sulfur limit 0.5% *6
Sulfur limit 0.1%
MarineEnvironmentProtection
Ballast Water
Management
Convention *7
(Adopted in 2004: not ratified) Required ?
Required
(Guideline adopted in 2011)
Regulations
TacklingGlobal
Warning
GHGemissions
Phase 1
Required
PreventingAir Pollution
Nox emissions*3
Tier Ⅱ
Tier Ⅱ Tier Ⅲ
☛for further information http://www.mol.co.jp/en/csr/index.html

☛for further information http://www.mol.co.jp/en/csr/index.htmlParticipating in the UN Global CompactMOL became the first Japanese shipping company to participate in the United Nations Global Compact in 2005.
32
Selection as a Component in Dow Jones Sustainability IndicesSince 2003, MOL has been included in the Dow Jones Sustainability Index (DJSI) Asia Pacific. This designation is reserved for companies meeting international criteria for social responsibility in areas such as environmental protection, human rights, corporate governance, and relationships with stakeholders. The component companies are also expected to demonstrate sustainable business practices. Selection as a Component in FTSE4Good IndexFTSE is a global index company owned by the London Stock Exchange. Since 2003, FTSE has included MOL in one of its major indices, the FTSE4Good Global Index, which is a socially responsible investment index. Morningstar Socially Responsible Investment Index (MS-SRI)MOL has been included in the MS-SRI since 2003 for its superior social responsibility. The MS-SRI is composed of stocks that have been selected by Morningstar Japan K.K.. Global 100 Most Sustainable Corporations in the WorldIn 2011, MOL was included among the "Global 100 Most Sustainable Corporations in the World," a listing announced each year by Canadian publishing company Corporate Knights Inc. SMBC Sustainability Assessment LoanIn 2016, MOL received the highest rating for SMBC Sustainabitliy Assessment Loans form Sumitomo Mitsui Banking Corporation (SMBC). The loan program evaluates corporate actions such as disclosure of environmental, social, and corporate governance (ESG) information and initiatives on sustainablity. SMBC Nadeshiko Assessment LoanIn 2016, MOL became the first Japanese company in the ocean shipping industry to acquire SMBC NadeshikoAssessment Loan status in recognition of MOL as a growth company in which more women have the opportunity of a career.
External Recognition
Certification from DNV for LNG Carrier Seafarer Training ProgramMOL's LNG Carrier Standard Training Course, which is run in Japan and overseas, acquired certification in 2007 from Det Norske Veritas AS (DNV) for compliance with the LNG carrier crew ability standards advocated by SIGTTO(*).(*)Society of International Gas Tanker & Terminal Operators Ltd. Certification from DNV for Seafarer Education and Training Management ProgramMOL obtained certification in 2012 in its tanker and LNG carrier operations for its independent seafarer education and training program by DNV. The program received certification for compliance with the Competence Management System (CMS), recognizing its effectiveness.
ISO 14001 CertificationMOL introduced environmental management system̶MOL EMS21̶in 2001, and acquired internationally recognized ISO 14001 certification. DBJ Environmental RatingsIn 2011, MOL became the first company in the ocean shipping industry to acquire the "DBJ Environmental Ratings" from the Development Bank of Japan Inc. (DBJ). MOL received the highest rating from DBJ, which cited MOL's "particularly forward-looking approaches to environmental consciousness." Recognized by CDP as leader for Climate Change MOL has been recognized as a leader for the depth and quality of climate change data it has disclosed to investors and the global marketplace through CDP global environmental disclosure system for independent assessment. MOL achieved a position in CDPʼs Japan 500 Climate Disclosure Leadership Index (CDLI).
Investor Guidebook 2015|
General CSR Activities-Related(Including SRI)
Safe Operation(Including Recognition of Seafarer Training Program)
Environmental Related
Management Foundation ④Social Responsibility
10 Principles of the Global Compact Human Right Principle 1:The support and respect of the protection of international human rights;
Principle 2:The refusal to participate or condone human rights abuses.Labour Principle 3:The support freedom of association and the recognition of the right to collective bargaining;
Principle 4:The abolition of compulsory labor;Principle 5:The abolition of child labor;Principle 6:The elimination of discrimination in employment and occupation.
Environment Principle 7:The implementation of a precautionary and effective program to environmental issues;Principle 8:Initiatives that demonstrate environmental responsibility;Principle 9:The promotion of the diffusion of environmentally friendly technologies.
Anti-Corruption Principle 10:The promotion and adoption of initiatives to counter all forms of corruption, including extortion and bribery.

Assets Turnover
33
Ordinary Income(loss) Margin
Net Income(loss) Margin
ROE・ROA
Investor Guidebook 2016|
☛refer to P37 for figures
Financial Data ①Profitability & Efficiency Indices
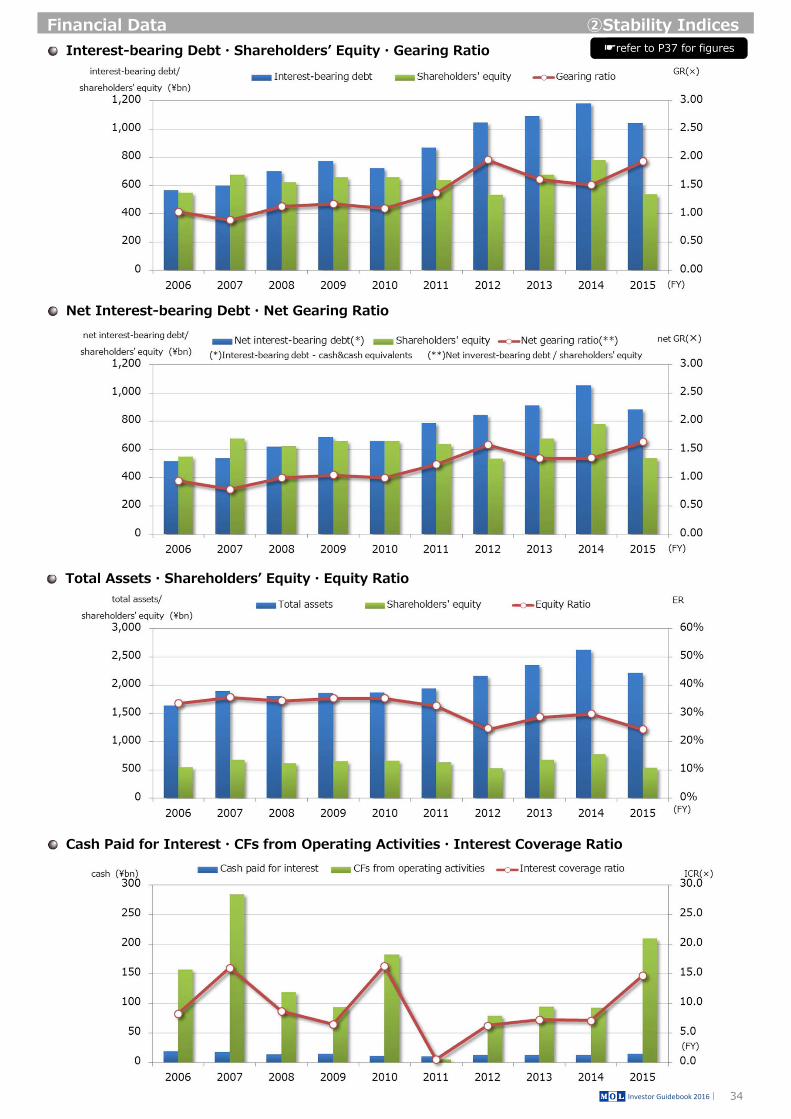
Interest-bearing Debt・Shareholdersʼ Equity・Gearing Ratio
34
Net Interest-bearing Debt・Net Gearing Ratio
Total Assets・Shareholdersʼ Equity・Equity Ratio
Cash Paid for Interest・CFs from Operating Activities・Interest Coverage Ratio
Investor Guidebook 2016|
Financial Data ②Stability Indices☛refer to P37 for figures

CFs from Operating Activities・CFs from Investing Activities・Free CFs
35
Capital Expenditure・Depreciation & Amortization
CFs from Financing Activities・Cash & Cash Equivalents at term end
Investor Guidebook 2016|
Financial Data ③Cash Flow Indices☛refer to P37 for figures
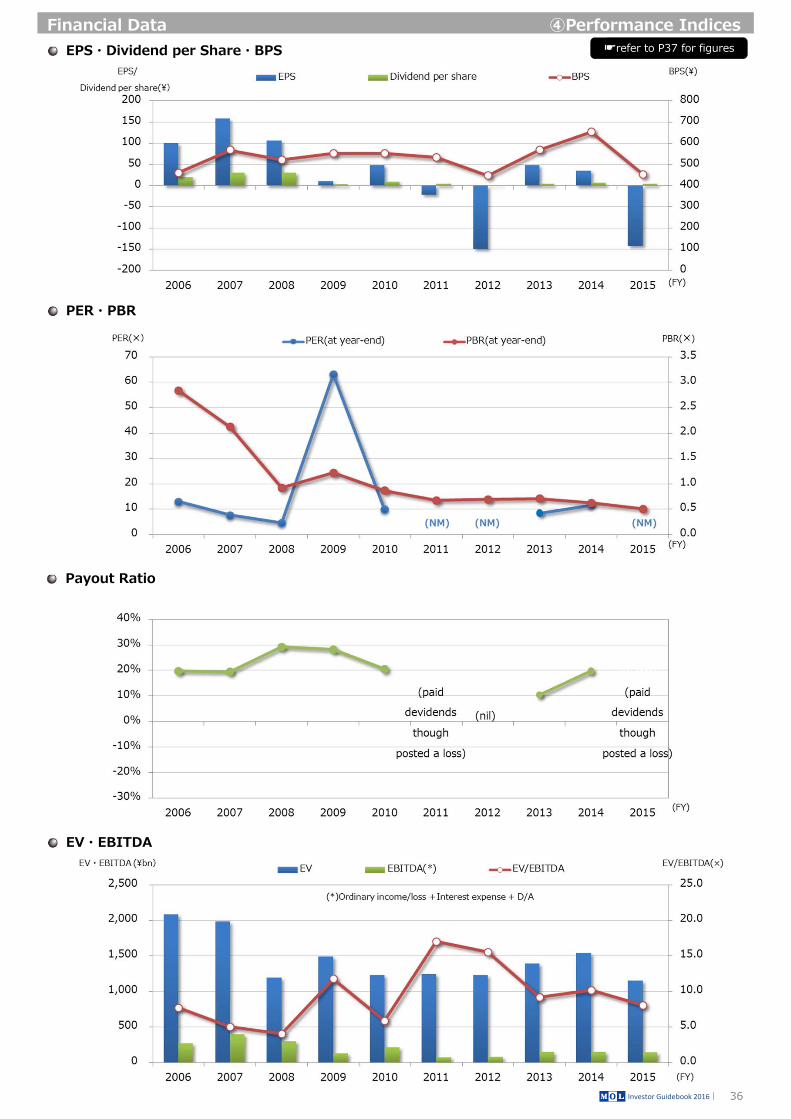
EPS・Dividend per Share・BPS
36
PER・PBR
Payout Ratio
EV・EBITDA
Investor Guidebook 2016|
Financial Data ④Performance Indices☛refer to P37 for figures

Financial Statements (10-year summary)
37Investor Guidebook 2016|
Financial Data ⑤Financial Statements(Consolidated)
(\ mm)
2006 2007 2008 2009 2010 2011 2012 2013 2014 2015Mar.2007 Mar.2008 Mar.2009 Mar.2010 Mar.2011 Mar.2012 Mar.2013 Mar.2014 Mar.2015 Mar.20161,568,435 1,945,696 1,865,802 1,347,964 1,543,660 1,435,220 1,509,194 1,729,452 1,817,069 1,712,222
1,300,038 1,544,109 1,564,485 1,228,478 1,328,959 1,368,794 1,432,014 1,587,902 1,683,795 1,594,568D/A 68,581 74,480 78,155 88,366 77,445 85,624 94,685 83,983 87,803 92,771
100,323 110,302 104,104 98,546 91,300 90,885 92,946 100,458 116,024 115,330
168,073 291,284 197,211 20,939 123,400 -24,459 -15,766 41,092 17,249 2,323
34,806 38,992 31,401 19,996 17,226 17,581 12,304 29,507 48,765 50,747Interests and dividends 7,627 8,780 7,959 4,315 5,506 7,957 5,165 9,340 9,624 10,209Equity in earnings of affiliates 16,171 18,198 15,999 5,362 8,174 3,300 - - 4,930 9,178FX gains - - - 3,353 - - - 11,392 25,523 23,907
20,391 28,058 24,102 16,701 19,005 17,442 25,105 15,613 14,685 16,803Interests 18,275 18,065 13,929 14,175 11,371 11,511 13,020 12,583 12,555 14,576Equity in losses of affiliates - - - - - - 4,935 1,234 - -FX losses - - 4,610 - 4,584 4,440 3,296 - - -
182,488 302,219 204,510 24,234 121,621 -24,320 -28,568 54,985 51,330 36,267
20,551 34,148 20,272 27,559 11,160 14,022 16,064 36,050 26,152 30,011Gain on sale of fixed assets 13,771 19,485 12,824 15,565 6,359 11,558 12,253 7,094 16,225 9,430
5,185 18,164 27,050 24,017 37,415 23,218 125,434 19,325 19,150 220,665Loss on sale of fixed assets 363 1,741 354 5,513 2,459 664 3,104 6,510 896 628Loss for impairment - - - - 10,238 5,468 10,978 6,447 10,198 -
197,854 318,202 197,732 27,776 95,366 -33,516 -137,938 71,710 58,332 (154,385)
63,041 115,183 65,073 8,078 36,431 9,546 11,324 13,796 12,440 11,133
7,468 5,693 638 3,763 -2,797 -20,814 24,799 -4,525 -2,577 260
6,403 7,004 5,032 3,211 3,455 3,761 4,783 5,045 6,113 4,668
120,940 190,321 126,987 12,722 58,277 -26,009 -178,846 57,393 42,356 -170,447
1,639,940 1,900,551 1,807,079 1,861,312 1,868,740 1,946,161 2,164,611 2,364,695 2,624,049 2,219,587Current assets 405,473 506,077 428,597 352,030 344,443 386,936 514,246 533,639 511,795 456,475Tangible fixed assets 847,660 1,047,824 1,106,746 1,209,175 1,257,823 1,293,802 1,303,967 1,379,244 1,498,028 1,376,431
1,018,951 1,148,898 1,112,058 1,125,609 1,128,493 1,228,252 1,545,118 1,581,146 1,731,614 1,572,662Current liabilities 482,810 528,390 440,909 355,185 374,268 322,851 425,725 430,045 505,346 463,794Interest-bearing debt 569,417 601,174 702,617 775,114 724,259 869,619 1,046,865 1,094,081 1,183,401 1,044,980
550,763 679,315 623,715 659,508 660,795 637,422 535,422 679,160 782,556 540,951Ownes' equity 480,091 639,844 727,131 719,532 767,380 732,402 550,714 605,768 636,530 458,121
375,443 536,096 623,626 616,736 664,645 629,667 447,829 502,833 533,484 354,179
20,369 23,291 -71,038 -40,055 46,970 -129,298 -25,285 -25,615 -66,656 182,508CFs from operating activities[a] 156,418 283,359 118,984 93,428 181,755 5,014 78,955 94,255 92,494 209,189CFs from investing activities[b] -136,049 -260,068 -190,022 -133,483 -134,785 -134,312 -104,240 -119,870 -159,150 -26,681
143,376 286,973 210,108 158,918 143,579 152,151 120,886 169,028 164,275 104,813
11.6% 15.5% 11.0% 1.8% 7.9% -1.7% -1.9% 3.2% 2.8% 2.1%
11.7% 17.1% 11.0% 1.3% 6.5% -1.3% -1.4% 2.4% 2.1% 1.5%
1.01 1.10 1.01 0.73 0.83 0.75 0.73 0.76 0.73 0.71
269,344 394,764 296,594 126,775 210,437 72,815 79,137 151,551 151,688 143,614
7.7 5.0 4.0 11.8 5.9 17.0 15.5 9.2 10.15 8.03
8.2 15.9 8.6 6.4 16.2 0.5 6.2 7.2 7.1 14.6
24.8% 30.9% 19.5% 2.0% 8.8% -4.0% -30.5% 9.5% 5.8% -25.8%
11.7% 17.1% 11.0% 1.3% 6.5% -1.3% -1.4% 2.4% 2.1% 1.5%
103% 88% 113% 118% 110% 136% 196% 161% 151% 193%
94% 79% 99% 105% 100% 123% 158% 135% 135% 164%
33.6% 35.7% 34.5% 35.4% 35.4% 32.8% 24.7% 28.7% 29.8% 24.4%
101.20 159.14 106.13 10.63 48.75 -21.76 -149.57 47.99 35.42 (142.50)
459.55 567.74 521.23 551.70 552.83 533.27 447.76 567.90 654.26 452.28
20 31 31 3 10 5 0 5 7 5
12.92 7.57 4.53 63.12 9.83 NM NM 8.38 11.52 NM
2.84 2.12 0.92 1.22 0.87 0.68 0.69 0.71 0.62 0.51
19.8% 19.5% 29.2% 28.2% 20.5% NM NM 10.4% 19.8% NM
130.9 236.8 99.4 78.2 152.0 4.2 66.0 78.8 77.3 174.9
1,195,295,415 1,196,526,410 1,196,629,561 1,195,407,722 1,196,043,380 1,196,052,230 1,196,067,835 1,195,955,286 1,196,111,575 1,196,075,900
*1 After FY2006: "Owners' equity" + "accumulated gains/losses from valuation and translation adjustments"*2 The actual amount calculated by deducting proceeds from the sale of vessels when delivered from “tangible/intangible fixed assets increased” *3 Ordinary income(loss) + Interest expense + Depreciation and amortizaion*4 Net income / Average shareholders' equity at the beginning and the end of the fiscal year*5 Ordinary income(loss) / Average total assets at the beginning and the end of the fiscal year *6 Interest-bearing debt / Shareholders' equity*7 (Interest-bearing debt- cash&cash equivalents) / Shareholders' equity*8 Excluding "Treasury shares"
PER(at fiscal year-end)
PBR(at fiscal year-end)
Extraordinary loss
Extraordinary profit
Ordinary income/loss
Free cash flows : [a]+[b]
Retained earnings
Shareholders' equity *1
Total liabilities
Total assets
EBITDA *3
Assets turnover
Return on assets(ordinary income)
Ordinary income margin
Capital Expenditure *2
Net gearing ratio *7
(FY)
(Year ended)
Shipping and other revenues
Non-operating expenses
Operating income/loss
Non-operating income
Selling,general/administrative expenses
Shipping and other expenses
P/L
Profit/loss attributable to owners of parent
Profit/loss attributable to non-controlling interests
Income taxes-deferred
Income taxes-current
Income/loss before income tax
B/S
C/F
Indi
ces
Per s
hare
Number of shares issued and outstanding at year-end*8
Cash flows per share(¥)
Payout ratio(consolidated)
Dividend per share(¥)
Shareholders' equity per share(¥)
EPS(¥)
Equity ratio
Gearing ratio *6
ROA *5
ROE *4
Interest coverage ratio
EV/EBITDA

Segment Information(10-year summary)
38
Quarterly Segment Information (two years)
Investor Guidebook 2016|
Financial Data ⑤Financial Statements(Consolidated)
(\ mm)
2014 2015Q1 Q2 Q3 Q4 Full-year Q1 Q2 Q3 Q4 Full-year
Bulkships 212,537 205,279 210,491 228,982 857,289 215,247 221,227 201,949 200,470 838,893Containerships 187,311 196,260 201,151 202,346 787,068 194,530 194,619 171,828 158,131 719,108
Ferry/Domestic transport 13,649 14,613 14,480 13,290 56,032 12,810 13,028 12,553 11,227 49,618Associated businesses 28,244 28,216 26,402 25,526 108,388 24,884 24,434 23,877 23,411 96,606
Others 2,169 1,878 2,224 2,019 8,290 1,962 1,940 2,244 1,850 7,996Total 443,913 446,245 454,748 472,163 1,817,069 449,435 455,249 412,450 395,088 1,712,222
Bulkships 10,874 5,629 15,130 22,472 54,105 10,826 18,294 15,755 9,982 54,857Containerships -7,256 -3,614 -10,079 -3,197 -24,146 -5,001 -4,178 -9,244 -11,408 -29,831
Ferry/Domestic transport 612 1,482 1,263 1,104 4,461 861 1,577 1,443 543 4,424Associated businesses 3,240 2,941 3,131 1,613 10,925 2,521 1,802 2,939 2,909 10,171
Others 1,049 1,073 1,280 781 4,183 1,385 237 1,769 158 3,549Adjustment -976 -492 4,498 -1,228 1,802 298 -823 -1,670 -4,708 ▲ 6,903
Total 7,543 7,018 15,225 21,544 51,330 10,892 16,907 10,993 -2,525 36,267
(Quarter)(FY)
Ship
ping
and
oth
erre
venu
esOr
dina
ry in
com
e/lo
sse
(\ mm)
2006 2007 2008 2009 2010 2011 2012 2013 2014 2015Bulkships 787,039 1,024,797 998,542 721,725 790,572 726,011 731,269 836,408 857,289 838,893
Containerships 568,590 686,828 639,694 466,378 586,649 542,426 606,588 713,503 787,068 719,108Logistics 55,570 61,236 56,270 - - - - - - -
Ferry/Domestic transport 49,848 53,099 54,534 50,815 50,089 52,134 54,285 55,603 56,032 49,618Associated businesses 99,669 108,859 107,033 99,795 108,447 106,709 109,649 116,599 108,388 96,606
Others 7,716 10,875 9,727 9,250 7,901 7,939 7,401 7,338 8,290 7,996Total 1,568,435 1,945,696 1,865,802 1,347,964 1,543,660 1,435,220 1,509,194 1,729,452 1,817,069 1,712,222
Bulkships 163,580 277,570 213,345 66,986 70,837 -6,921 -24,799 57,121 54,105 54,857Containerships 3,150 6,882 -21,329 -56,878 38,853 -29,910 -11,291 -14,553 -24,146 -29,831
Logistics 2,256 2,215 822 - - - - - - -Ferry/Domestic transport 19 497 -888 -2,340 -565 -533 1,282 2,236 4,461 4,424
Associated businesses 13,073 13,812 12,976 9,712 10,676 9,098 10,745 11,146 10,925 10,171Others 3,026 5,005 2,767 1,263 3,361 4,303 2,449 4,576 4,183 3,549
Adjustment -2,618 -3,765 -3,183 5,490 -1,542 -356 -6,954 -5,541 1,802 -6,903Total 182,488 302,219 204,510 24,234 121,621 -24,320 -28,568 54,985 51,330 36,267
Bulkships 817,316 989,607 910,659 1,008,724 1,173,526 1,194,813 1,298,682 1,501,313 1,719,713 1,526,582Containerships 271,484 352,856 362,536 357,412 386,911 365,975 403,166 449,725 496,486 397,080
Logistics 56,714 55,960 47,053 - - - - - - -Ferry/Domestic transport 50,049 50,686 42,664 42,721 38,407 36,089 36,420 35,088 40,535 44,096
Associated businesses 300,113 290,991 293,066 315,924 342,748 355,341 379,969 386,851 426,130 416,454Others 360,501 412,947 376,655 376,316 317,865 278,060 303,649 325,937 346,182 162,724
Adjustment -216,239 -252,498 -225,556 -239,786 -390,718 -284,118 -257,276 -334,220 -404,999 -327,352Total 1,639,940 1,900,551 1,807,079 1,861,312 1,868,740 1,946,161 2,164,611 2,364,695 2,624,049 2,219,587
Bulkships 41,706 46,828 48,949 54,612 50,509 58,370 66,689 55,545 59,234 62,112Containerships 11,820 13,523 15,398 17,778 11,776 13,433 14,900 15,014 16,109 16,907
Logistics 1,468 1,537 1,413 - - - - - - -Ferry/Domestic transport 3,578 3,365 3,948 5,231 4,255 3,866 3,530 3,302 2,278 2,022
Associated businesses 6,416 6,225 6,033 8,640 9,049 8,254 7,963 8,622 8,510 10,090Others 3,320 2,775 2,156 1,921 1,604 1,446 410 326 283 272
Adjustment 270 224 256 183 250 252 1,190 1,171 1,388 1,366Total 68,581 74,480 78,155 88,366 77,445 85,624 94,685 83,983 87,803 92,771
Bulkships 109,856 198,809 154,274 146,949 136,262 158,188 128,440 140,188 138,058 87,115Containerships 30,327 80,485 36,640 30,592 38,604 8,209 11,462 28,510 21,782 15,525
Logistics 908 716 971 - - - - - - -Ferry/Domestic transport 4,387 10,452 1,082 1,131 1,316 829 1,101 1,424 3,193 5,865
Associated businesses 8,285 9,736 26,643 24,374 41,187 5,442 20,339 10,484 32,341 5,177Others 110 3,401 3,562 1,180 2,342 2,768 621 145 181 123
Adjustment - -28 32 -37 730 289 2,924 5,395 587 1,903Total 153,876 303,573 223,208 204,190 220,443 175,726 164,890 186,148 196,145 115,712
Note: Logistics segment has been integrated into Containerships segment since FY2009.
tang
ible
/inta
ngib
le f
ixed
asse
ts in
crea
sed
(FY)Sh
ippi
ng a
nd o
ther
reve
nues
Ordi
nary
inco
me/
loss
eAs
sets
D/A

1884 Osaka Shosen Kaisha(OSK Line) is founded.1930 The high-speed cargo ship KINAI MARU is launched, and covers the Yokohama-NYC route in 25 days and 17.5 hours,
well below the industry average of 35 days.1939 The ARGENTINA MARU and BRASIL MARU are built as cargo/passenger liners on the South America route, which
represent the state-of-the-art in Japanese shipbuilding at the time.1942 Mitsui & Co., Ltd. spins off its Shipping Department to create Mitsui Steamship Co., Ltd.1961 World's first automated ship, the KINKASAN MARU, with an engine room operated entirely from the bridge, is launched.1964 Japan's shipping industry undergoes a major consolidation, with mergers creating six companies; Mitsui O.S.K.
Lines(MOL) by a merger of OSK Lines/Mitsui Steamship, Japan Line(JL) by a merger of Nitto Shosen/Daido Kaiun, Yamashita-Shinnihon Steamship(YSL) by a merger of Yamashita Kisen/Shinnihon Kisen.
1965 Japan's first specialized car carrier, the OPPAMA MARU, is launched.1968 MOL, JL, and YSL launch the full containerships AMERICA MARU, JAPAN ACE, and KASHU MARU, respectively, on the
Japan-California route.1982 MOL enters methanol transport business.1983 MOL enters LNG transport business. 1984 MOL expands into product tanker business.1985 The container terminal company TraPac, Inc. is founded in Los Angeles.
Double-stack container train(DST) operations begin from Los Angeles.1989 Navix Line is established by the merger of JL and YSL.
Japan's first full-fledged cruise ship, the FUJI MARU, is launched, ushering in the era of leisure cruises in Japan.1991 MOL acquires a share in Gearbulk, a Norwegian open-hatch bulker operator.1993 Crew training school is established in Manila.1994 A series of the mid-term management plans calling for “Creative Redesigning” begin.1995 Container route service through a strategic international tie-up called The Global Alliance (TGA), begins.
The first double hull VLCC the ATLANTIC LIBERTY, is launched.1996 MOL acquires a share in chemical tanker operator Tokyo Marine(becomes a consolidated subsidiary of MOL).1998 The New World Alliance (TNWA) is inaugurated.1999 New Mitsui O.S.K. Lines is established by the merger of MOL and Navix Line. 2000 Corporate governance system is reformed; introduce executive officer system and invites outside directors.2001 MOL Group Corporate Principles is issued.2004 Mid-term management plan MOL STEP, with the main theme of “Growth” starts.
Daibiru Corporation becomes a consolidated subsidiary of MOL.2005 MOL forms a strategic tie-up with Kintetsu World Express.2006 Utoc Corporation becomes a consolidated subsidiary of MOL.
MOL Formulates Measures to Reinforce Safe Operation Structure with the Slogan "Returning to Basics", addressingfour marine incidents with utmost seriousness.
2007 Mid-term management plan MOL ADVANCE, with the main theme of “Growth with Enhanced Quality” starts.The world's largest iron ore carrier, third-generation BRASIL MARU is launched.
2009 MOL forms the concept for its next generation vessels "ISHIN "Series.Japanʼs first Shuttle and Regasification Vessel(SRV) the GDF SUEZ NEPTUNE is launched.
2010 Mid-term management plan GEAR UP! MOL, with the main theme of “Challenge to Create New Growth ” starts.
The first participation in FPSO chartering for Petrobras, the Brazilian national oil company.2011 Support Activities by MOL cruise ship and ferry in areas stricken by the Great East Japan earthquake and Tsunami.
The G6 Alliance is inaugurated in Asia/Europe trade by TNWA and GA(Grand Alliance).The LR1 product tanker pool management company “Straits Tankers” is founded.The VLCC pool management company “Nova Tankers” is founded.
MOL wins orders for Indonesia's 1st Coastal LNG Transport Project.2012 World's first Hybrid car carrier Emerald Ace is launched.
MOL receives EVO's Top Award for Container Service. *Eigen Verladers Organisatie(EVO)
2013 Business Structural Reforms executed; Transferred sales and vessel operations of the dry bulker fleet (over 130 vessels) to Singapore.The single-year management plan "RISE 2013“, with the target of absolutely achieving profitability in FY2013.G6 Alliance expands cooperation to Transpacific(Asia/USEC) trade.Japanʼs first participation in FSRU project (Build and charter world's largest FSRU in Uruguay) .The chemical tanker pool management company “Milestone Chemical Tankers” is founded by Tokyo Marine.
39
Expansion into new transport business, Delivery of innovative ships/M&A/Alliance, Pool company/Management reforms, others
MOL General Information 【History】
History
Investor Guidebook 2016|

40
Credit Ratings (as of Jul.2016)
Bonds (as of Jul.2016)
Investor Guidebook 2016|
MOL General Information
☛for latest information http://www.mol.co.jp/ir-e/stock_e/rate_e.html
Nissan Kisen Kaisha
Kawasaki Kisen Kaisha Kawasaki Kisen Kaisha Kawasaki Kisen KaishaIino Kisen
Iino Kaiun Kaisha
Nippon Yusen K.K.
Mitsubishi Shipping1998
Nippon Oil TankerShowa Line
1991Nippon Yusen K.K. Nippon Yusen K.K.
Navix LineNitto Shosen
Japan LineDaido Kaiun Kaisha Nippon Liner System
Yamashita SteamshipYamashita-Shinnihon Steamship
Shinnihon Steamship 1989
1999Mitsui Steamship
Mitsui O.S.K. Lines Mitsui O.S.K. LinesOsaka Shosen Kaisha
Apr.1, 1964Major Consolidation
(Ref.)Major Consolidation
2014 Mid-term management plan STEER FOR 2020, with the main theme of “Solid growth through innovative changes” starts.MOL forms a strategic alliance with Brookfield, aimed at enhancing and expanding MOL's container terminal business.G6 Alliance expands cooperation to Transpacific(Asia/USWC) and Transatlantic trades.MOL signs the first contract for a LNG carrier to transport shale gas from USA to Japan (for Tokyo Gas).MOL signs ship building contracts for ice class LNG carriers for Yamal (Russia) LNG project.MOL establishes a J/V with Viken Shipping and embarks on a shuttletanker business.MOL seals long term shipping deal with Reliance, whichmakes MOL to be the first shipping company to serve liquefied ethane transportation by very large ethane carriers (VLEC).The MR product tanker pool management company “Clean Products Tankers Alliance” is founded.
2015 New LNG carrier Papua delivered - 1st LNG carrier built in China for non-Chinese shipping companyThe VLGC product tanker pool management company “Helios LPG” is founded.MOL announces building and chartering 6x 20,000TEU containerships, which are the world's largest among existing and on-order containerships.MOL Introduces "MOL CHART" Rotterdam World Gateway (RWG) Opens in Port of Rotterdam
2016 MOL Breaks Ground on New Maritime Academy in Philippines
Credit Agency Type of Rating RatingJCR Long-term senior debt(issuer) rating A-R&I Issuer rating BBB
Moody's Corporate family rating Ba1
Date of issue Years Interest RateTotal amount
of issueOutstanding
Straight bonds No.12 May/27/2009 10 years 1.999% JPY 20 bn JPY 18.5 bnStraight bonds No.13 Dec/17/2009 7 years 1.106% JPY 20 bn JPY 20 bnStraight bonds No.15 Jun/21/2011 10 years 1.361% JPY 20 bn JPY 17.8 bnStraight bonds No.17 Jul/12/2012 5 years 0.461% JPY 20 bn JPY 20 bnStraight bonds No.18 Jul/12/2012 10 years 1.139% JPY 10 bn JPY 9.2 bn
Euro USD Zero Coupon Convertible bonds(*1)(*3) Apr/24/2014 4 years Zero coupon USD 300 mm USD 300 mmEuro USD Zero Coupon Convertible bonds(*2)(*3) Apr/24/2014 6 years Zero coupon USD 200 mm USD 200 mm
Straight bonds No.19 Jun/19/2014 10 years 0.970% JPY 29.6 bn JPY 29.6 bn
☛Please refer to our press release of 25/4/2014 for further information.
(*1) Conversion Price USD5.34:However, a bondholder may exercise its stock acquisition rights only if the closing price of the shares is more than 130 per cent of the conversionprice for a certain period of time.(*2) Conversion Price USD4.80:However, a bondholder may exercise its stock acquisition rights only if the closing price of the shares is more than 130 per cent of the conversion pricefor a certain period of time.(*3) The aggregate anticipated future dilution ratio would be 8.11% (which is the percentage by which the total number of issued shares as of 31 March 2014 would increase in casethat the two bonds are fully converted into shares at the above initial conversion prices). However, the Company may give notice to the bondholders, no earlier than three monthsbefore the maturity date of each Bond, to acquire from the Bondholders all the Bonds in exchange for an amount equal to 100 per cent of the principal amount of such bonds plus theAcquisition Shares, in order to mitigate the dilutive impact of conversion.“Acquisition Shares” means such number of Shares per Bonds calculated by dividing (i) the amount by which the Acquisition Share Value exceeds the principal amount of each Bond by(ii) the Average VWAP per Share.“Acquisition Share Value” means USD amount of the Bond calculated in accordance with the formula below :Principal amount of the Bond/Conversion Price × Average VWAP per share

Share Price
41
Shareholder Composition
Shareholder Information (as of Mar. 2016)
Investor Guidebook 2016|
MOL General Information
Capital JPY 65,400,351,028 HQ 2-1-1, Toranomon, Minato-ku, Tokyo 105-8688, Japan Number of employees 10,500(Consolidated) Number of shares authorized 3,154,000,000 Number of shares issued 1,206,286,115 Trading unit 1,000 Dividend record dates Mar.31 for Year-end dividend / Sep.30 for Interim dividend Number of shareholders 104,202 Listed in Tokyo, Nagoya Stock Exchange (code:9104) Transfer agent Sumitomo Mitsui Trust Bank, Limited
1-4-1, Marunouchi, Chiyoda-ku, Tokyo

【Disclaimer】Information contained in Investor Guidebook is provided solely for informational purposes and is not an offer or a solicitation of an offer to buy or sell securities. You are requested to make investment decisions using your own judgment. Although the Company has made sufficient effort to ensure the accuracy of information provided herein, the Company assumes no responsibility for any damages or liabilities including, but not limited to, those due to incorrect information or any other reason.
【Forward-Looking Statements】This Investor Guidebook contains forward-looking statements concerning MOLʼs future plans, strategies and performance. These statements represent assumptions and beliefs based on information currently available and are not historical facts. Furthermore, forward-looking statements are subject to a number of risks and uncertainties that include, but are not limited to, economic conditions, worldwide competition in the shipping industry, customer demand, foreign currency exchange rates, price of bunker, tax laws and other regulations. MOL therefore cautions readers that actual results may differ materially from these predictions.

(IR Tools)■Website: http://www.mol.co.jp/en/ir/index.html■Annual Report■Investor Guidebook■Corporate Profile■Environmental and Social Report
Investor Relations Office, Mitsui O.S.K. Lines, Ltd.
2-1-1, Toranomon, Minato-ku, Tokyo 105-8688, JapanEMAIL: [email protected]
Investor Guidebook 2016|