Embed Size (px)
Citation preview

COHORTCOHORT

What is Cohort ?A group of people who have certain similar characteristics.
Examples:– Birth Cohort– Marital Cohort– Medical Faculty Admission Cohort– Smoker Cohort – IUD Users Cohort

COHORT STUDYcomparing the exposed and the un-exposed groups, then inquiring the disease incidence prospectively, in order to study the relationship between a risk factor and a disease outcome
“CAUSE TO EFFECT”
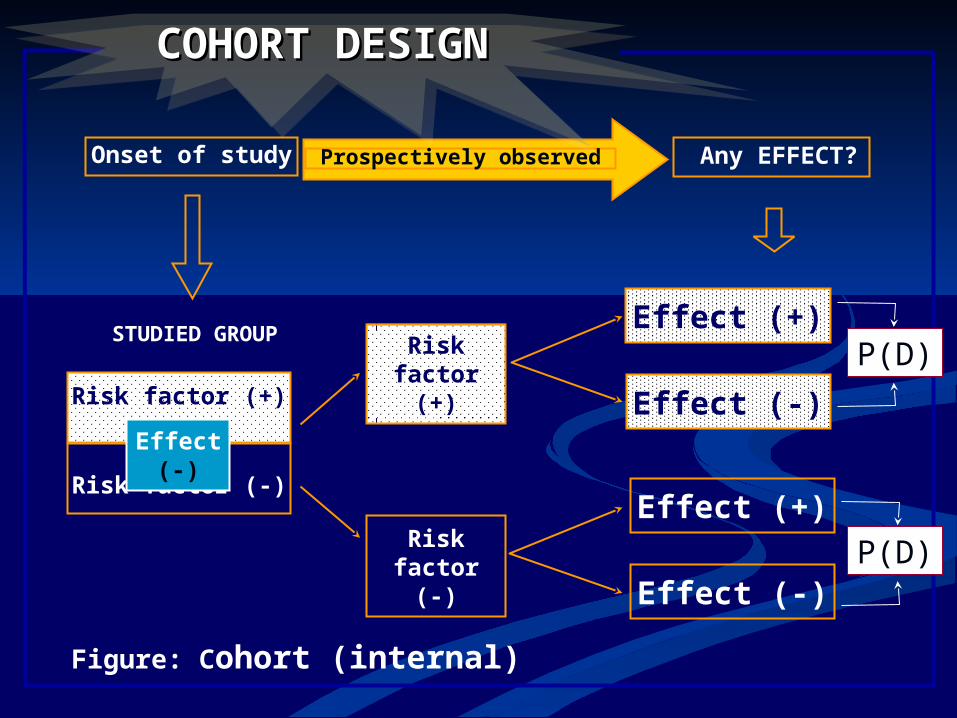
Figure: Cohort (internal)
Prospectively observedOnset of study Any EFFECT?
STUDIED GROUP
Risk factor (+)
Risk factor (-)
Effect (-)
Risk factor (+)
Risk factor (-)
Effect (+)
Effect (-)
Effect (+)
Effect (-)
COHORT DESIGNCOHORT DESIGN
P(D)
P(D)

TYPES1. Cohort
prospective.2. Cohort
retrospective. (Historical
cohort )
Eligible subjects
Exposed
Unexposed
Disease
No disease
Disease
No disease
TimeOnset of study
Direction of inquiry
Cohort prospective
Eligible subjects
Exposed
Unexposed
Disease
No disease
Disease
No disease
TimeOnset of study
Direction of inquiry
Cohort retrospective
1989 2000 2001
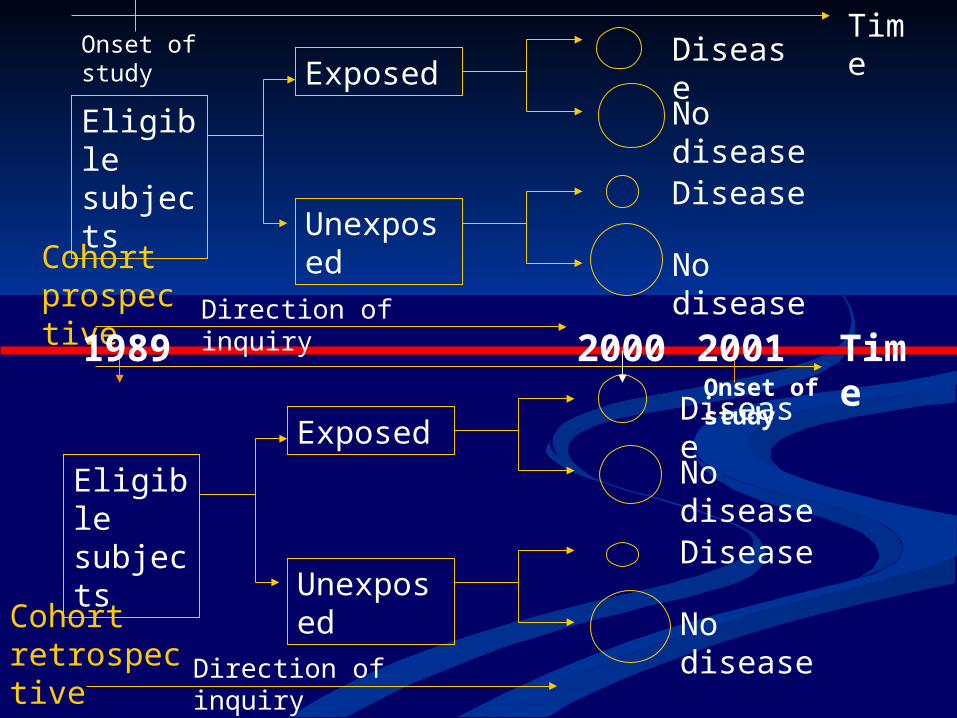
INDICATIONSINDICATIONS To study relationship between risk To study relationship between risk
factor and disease factor and disease Incidence of the disease in Incidence of the disease in
population is not rarepopulation is not rare Yield information on the incidence Yield information on the incidence
of the diseaseof the disease
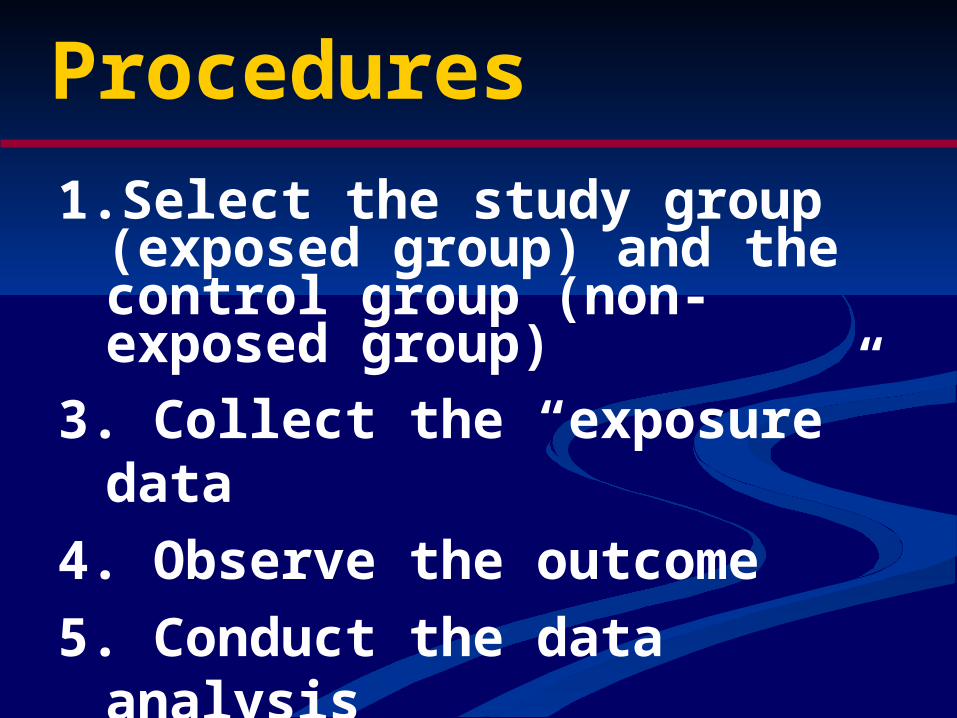
Procedures1. Select the study group (exposed
group) and the control group (non-exposed group)
3. Collect the “exposure” data4. Observe the outcome5. Conduct the data analysis
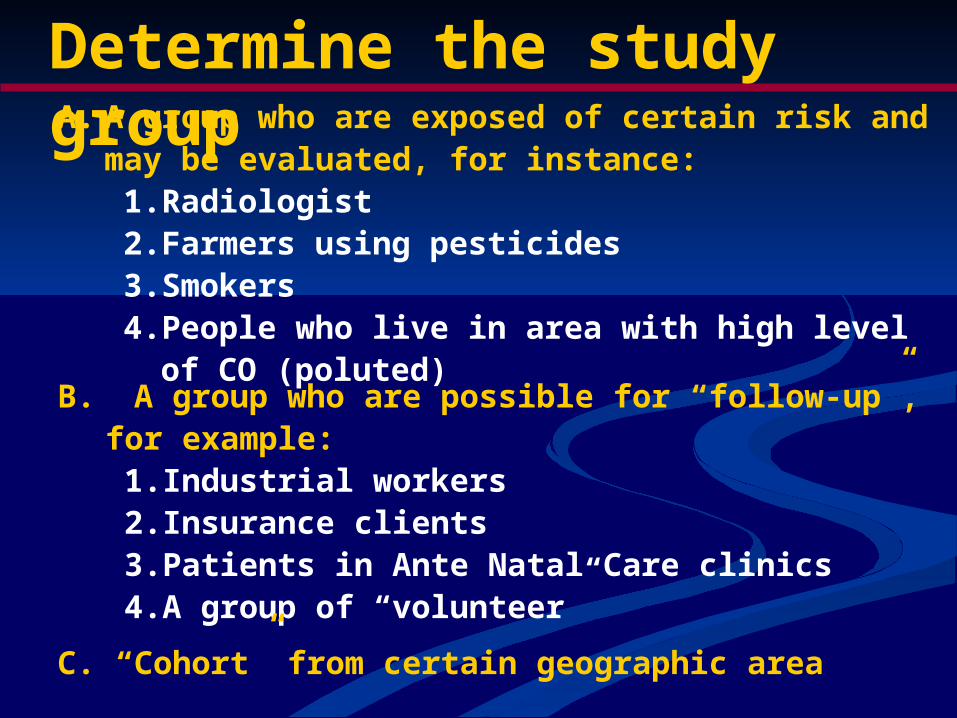
Determine the study groupA. A group who are exposed of certain risk and may be
evaluated, for instance:1. Radiologist2. Farmers using pesticides3. Smokers4. People who live in area with high level of CO (poluted)
B. A group who are possible for “follow-up”, for example:1. Industrial workers2. Insurance clients3. Patients in Ante Natal Care clinics4. A group of “volunteer”
C. “Cohort” from certain geographic area
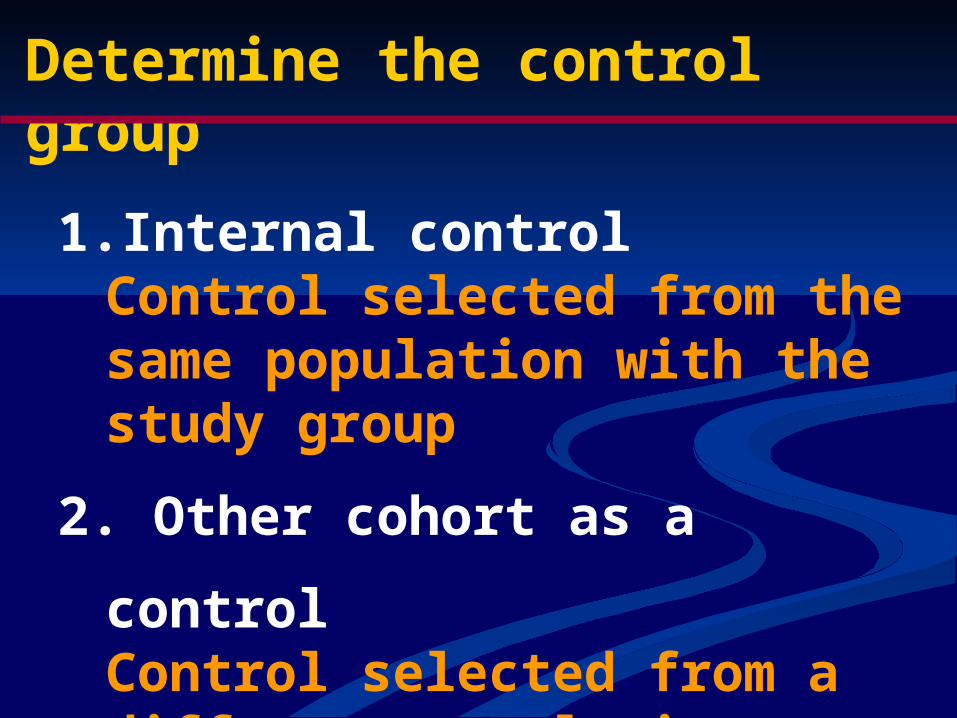
Determine the control group
1. Internal controlControl selected from the same population with the study group
2. Other cohort as a controlControl selected from a different population
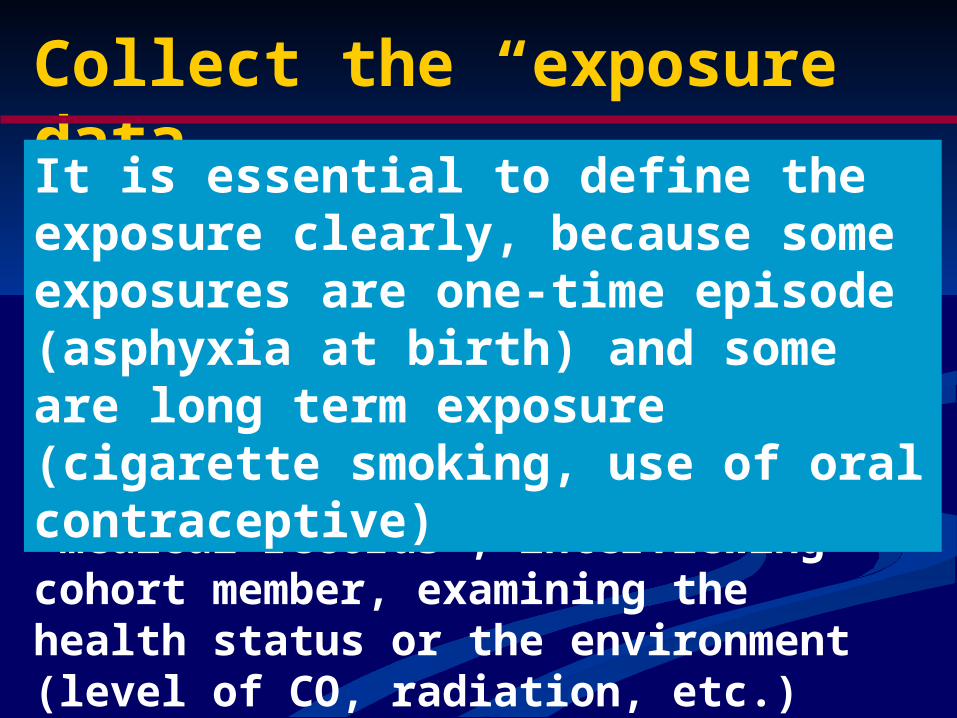
Collect the “exposure” data
The data can be gathered from the “medical records”, interviewing cohort member, examining the health status or the environment (level of CO, radiation, etc.)
It is essential to define the exposure clearly, because some exposures are one-time episode (asphyxia at birth) and some are long term exposure (cigarette smoking, use of oral contraceptive)
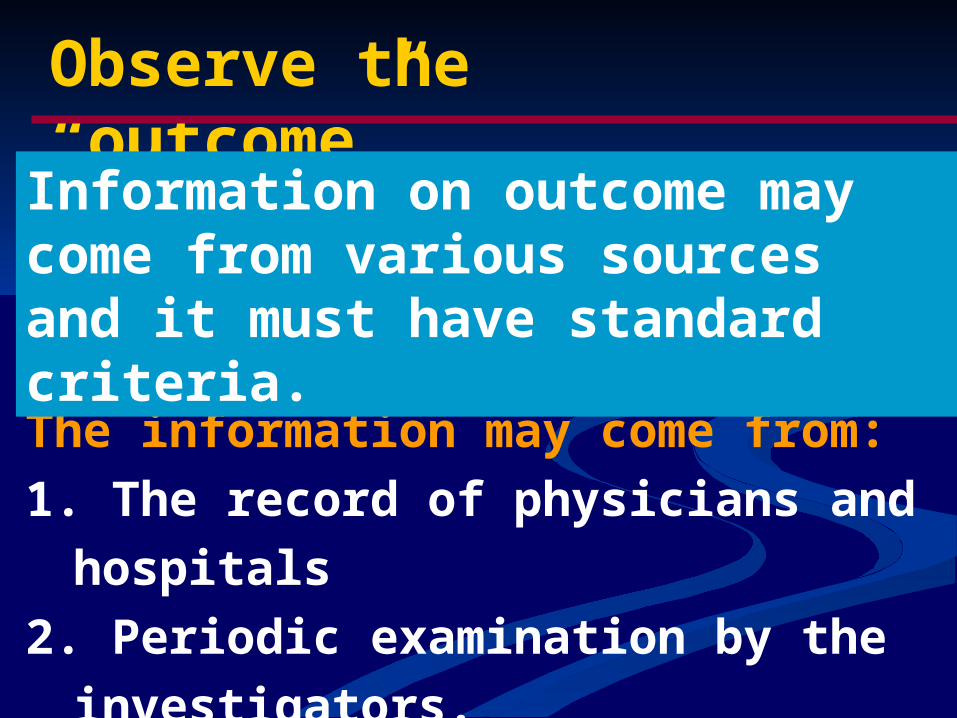
Observe the “outcome”
The information may come from:1. The record of physicians and hospitals2. Periodic examination by the investigators.3. Combination of the two
Information on outcome may come from various sources and it must have standard criteria.
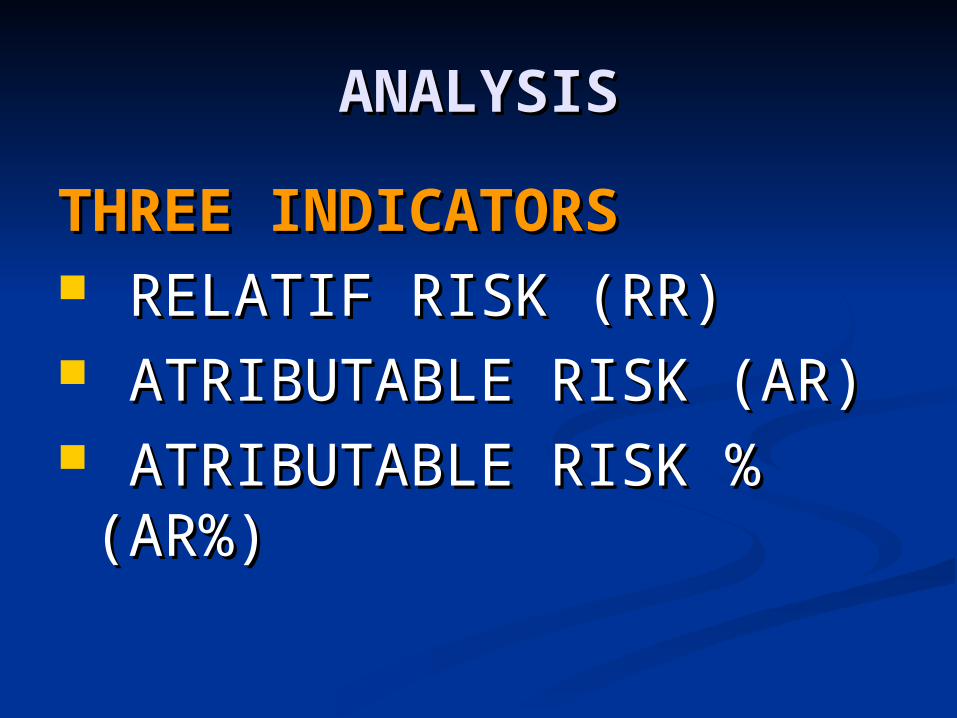
ANALYSISANALYSIS
THREE INDICATORSTHREE INDICATORS RELATIF RISK (RR)RELATIF RISK (RR) ATRIBUTABLE RISK (AR)ATRIBUTABLE RISK (AR) ATRIBUTABLE RISK % ATRIBUTABLE RISK %
(AR%)(AR%)
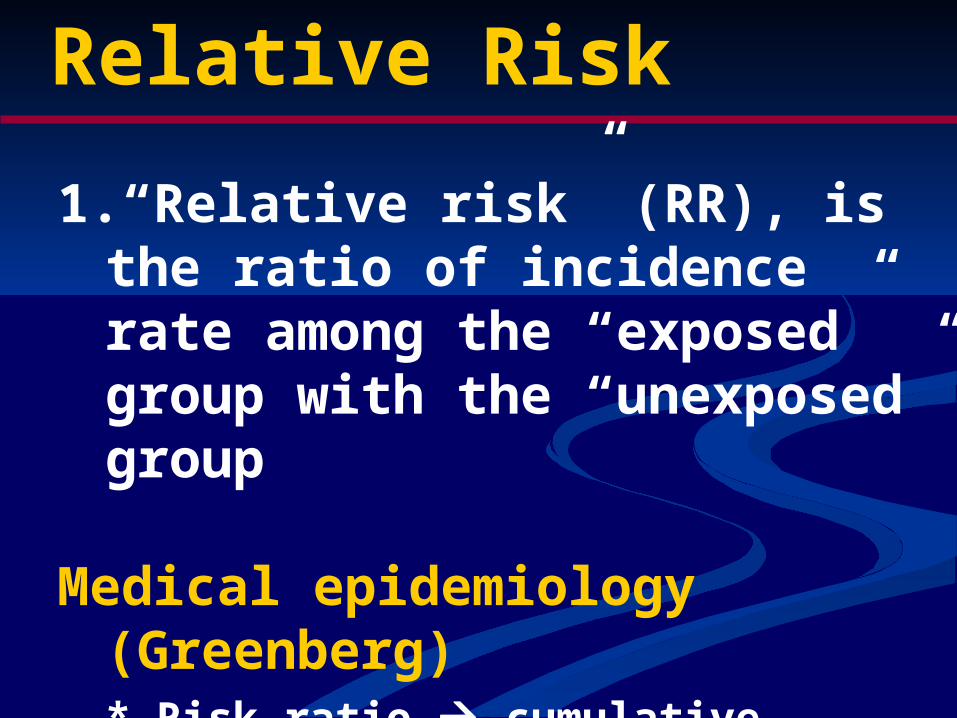
Relative Risk1. “Relative risk” (RR), is the ratio of
incidence rate among the “exposed” group with the “unexposed” group
Medical epidemiology (Greenberg)* Risk ratio cumulative incidence
* Rate ratio incidence with the person- time
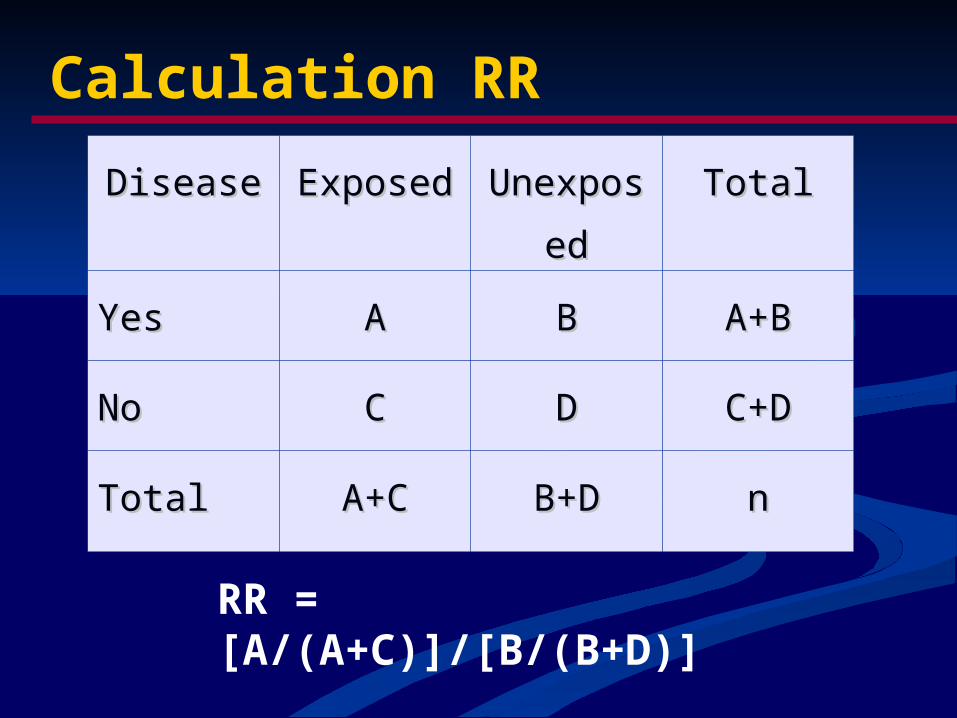
Calculation RR
DiseaseDisease ExposedExposed UnexposUnexposeded
TotalTotal
YesYes AA BB A+BA+B
NoNo CC DD C+DC+D
TotalTotal A+CA+C B+DB+D nn
RR = [A/(A+C)]/[B/(B+D)]
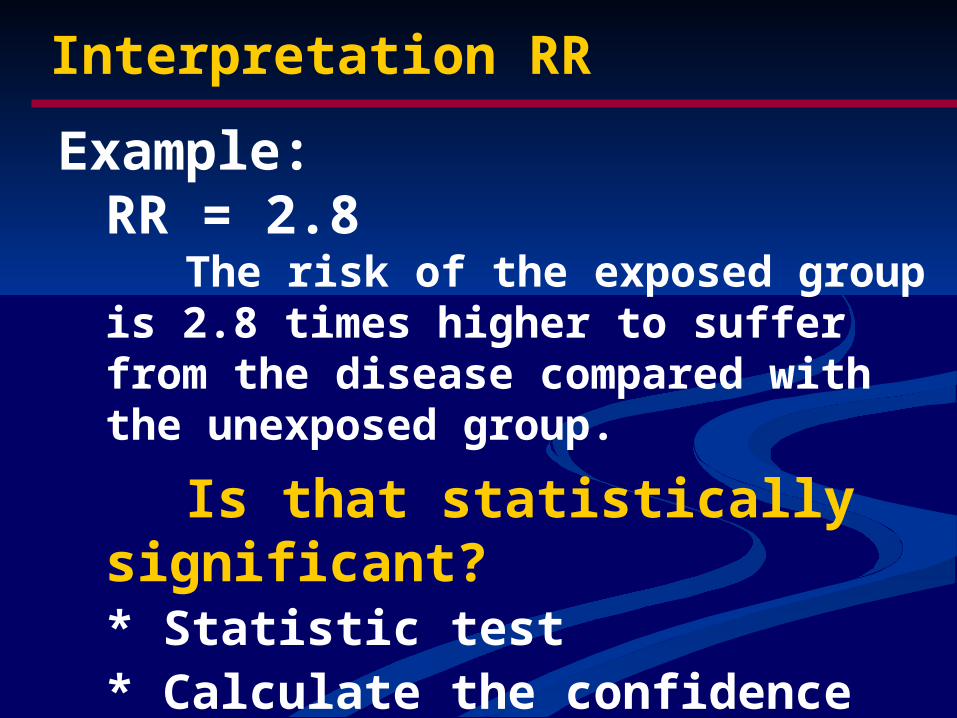
Interpretation RRExample:
RR = 2.8 The risk of the exposed group is 2.8 times
higher to suffer from the disease compared with the unexposed group.
Is that statistically significant? * Statistic test* Calculate the confidence interval (CI)
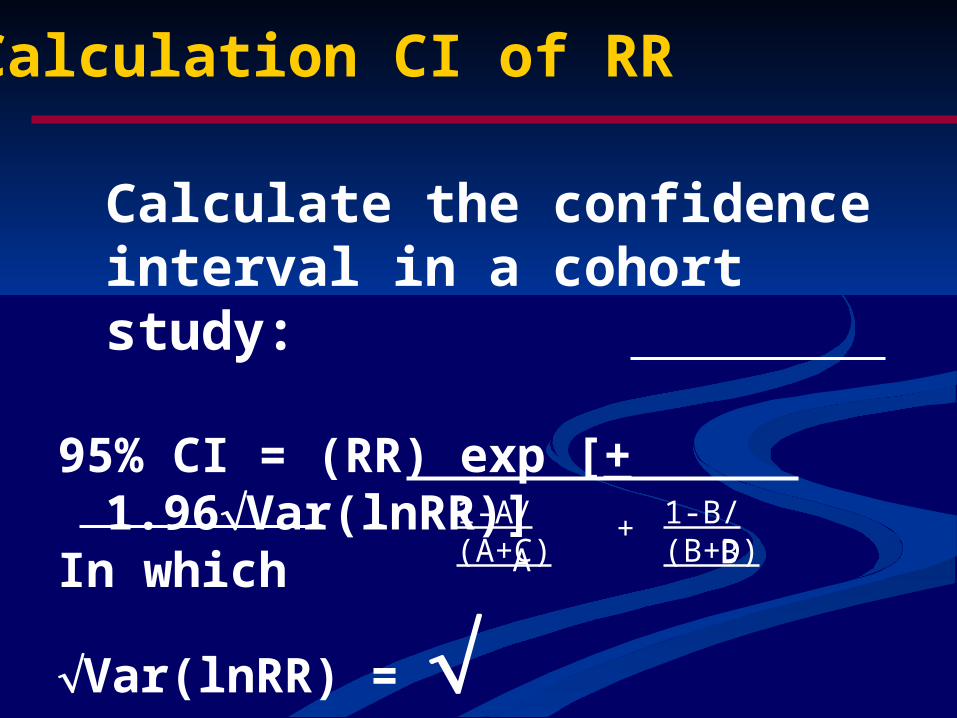
Calculate the confidence interval in a cohort study:
95% CI = (RR) exp [+ 1.96Var(lnRR)]In which
Var(lnRR) = 1-A/(A+C)A
+ 1-B/(B+D)B
Calculation CI of RR
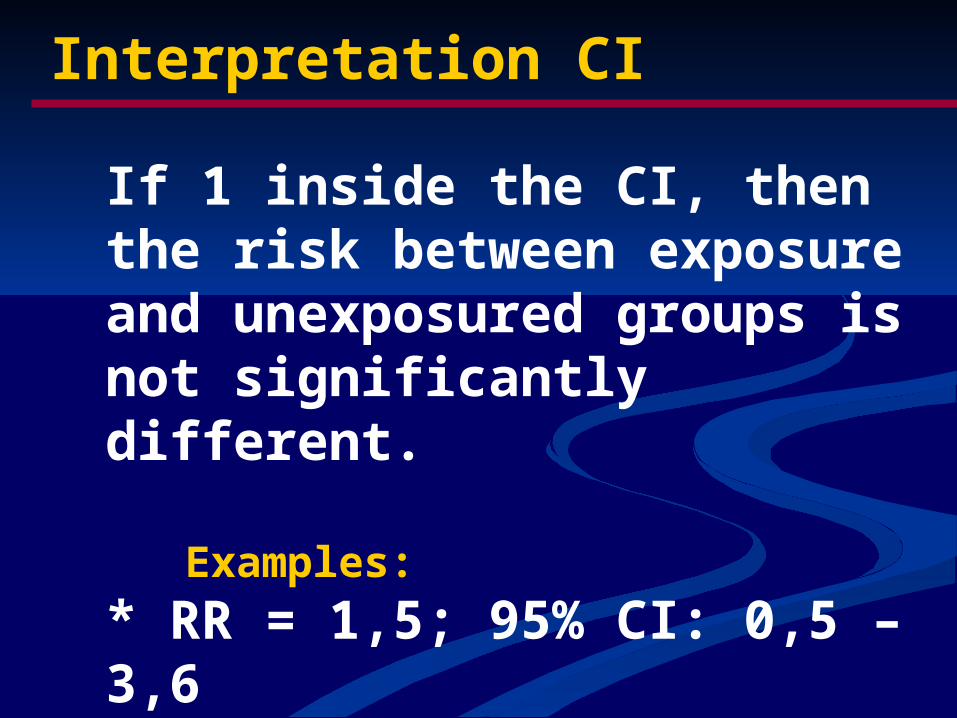
Interpretation CI
If 1 inside the CI, then the risk between exposure and unexposured groups is not significantly different.
Examples: * RR = 1,5; 95% CI: 0,5 – 3,6* 1 inside the CI not significant
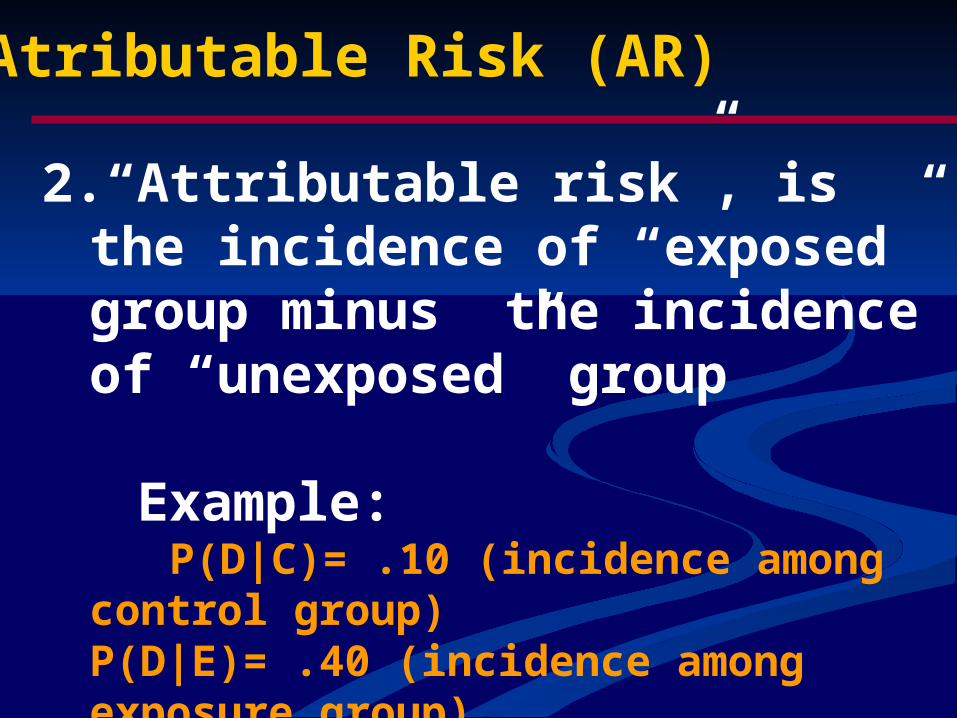
2. “Attributable risk”, is the incidence of “exposed” group minus the incidence of “unexposed” group
Example: P(D|C)= .10 (incidence among control group)
P(D|E)= .40 (incidence among exposure group) AR =P(D|E) – P(D|C) = .40 - .10 = .30 (incidence attributed to exposure)
Atributable Risk (AR)
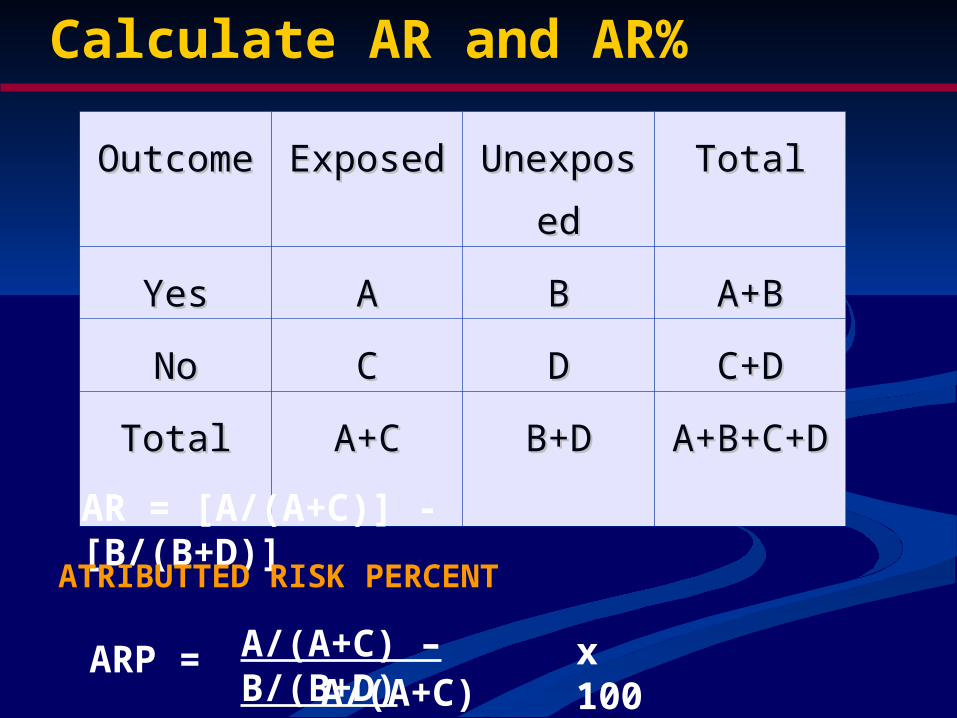
Calculate AR and AR%
OutcomeOutcome ExposedExposed UnexposUnexposeded
TotalTotal
YesYes AA BB A+BA+B
NoNo CC DD C+DC+D
TotalTotal A+CA+C B+DB+D A+B+CA+B+C+D+DAR = [A/(A+C)] - [B/(B+D)]
ARP = A/(A+C) – B/(B+D)A/(A+C)
x 100
ATRIBUTTED RISK PERCENT
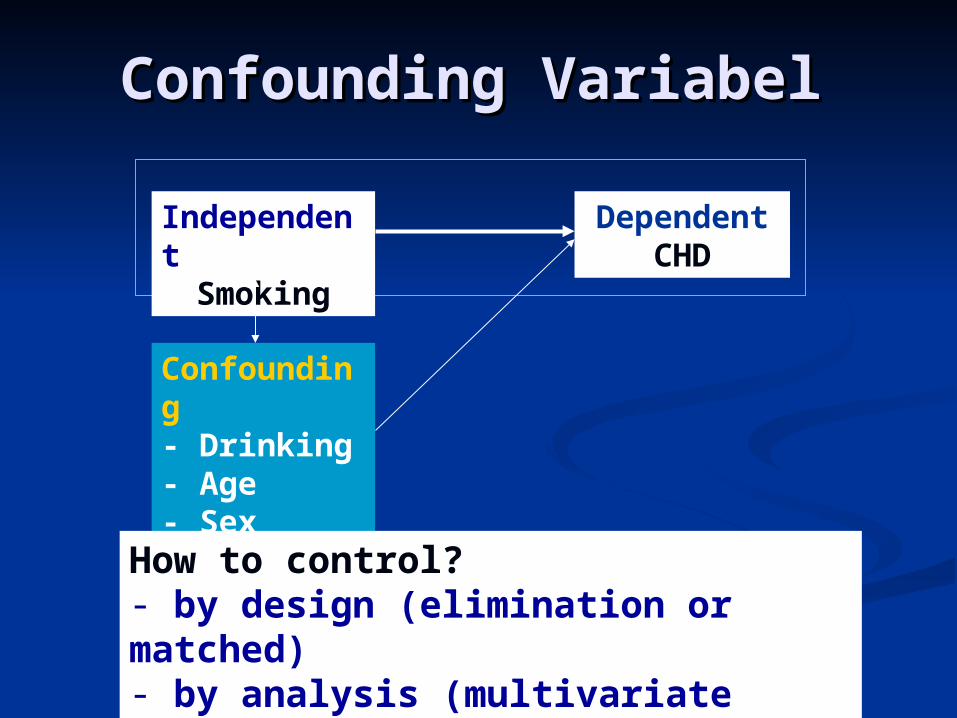
Confounding VariabelConfounding Variabel
IndependentSmoking
DependentCHD
Confounding- Drinking- Age- Sex
How to control?- by design (elimination or matched)- by analysis (multivariate analysis)
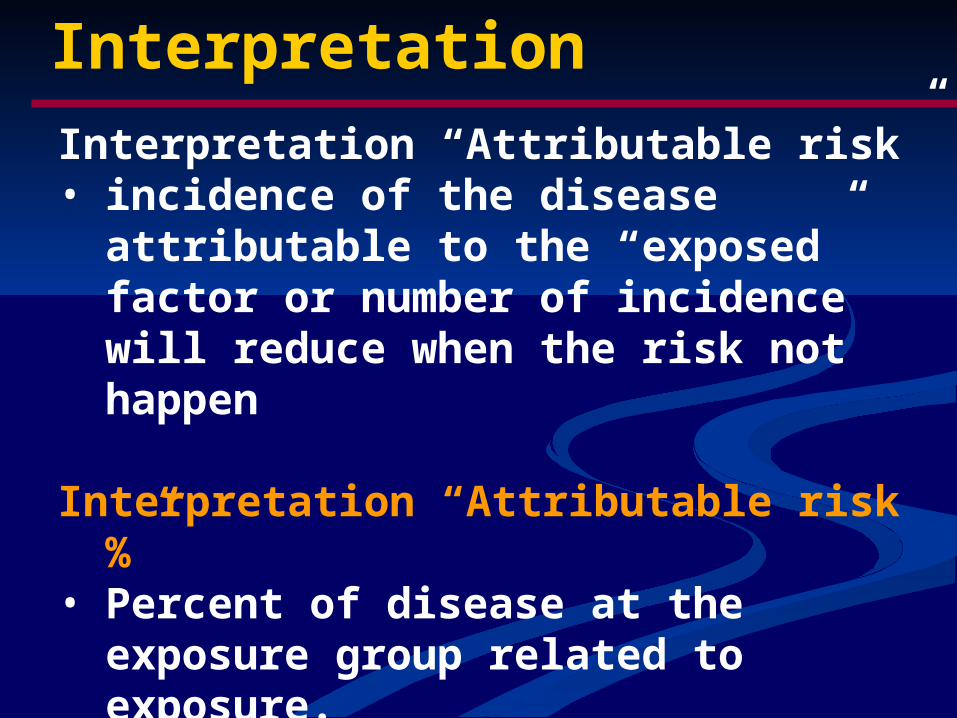
InterpretationInterpretation “Attributable risk”• incidence of the disease attributable to the
“exposed” factor or number of incidence will reduce when the risk not happen
Interpretation “Attributable risk %”• Percent of disease at the exposure group
related to exposure.• Impact of the exposure factor to the disease
(indicator for public health impact)
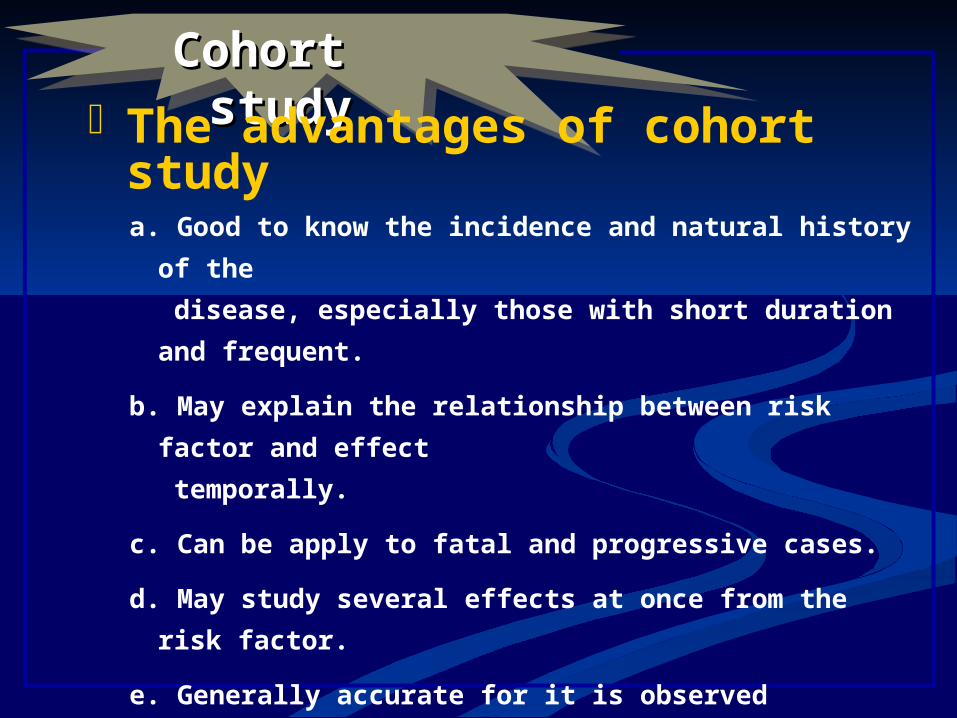
Cohort studyCohort study The advantages of cohort study
a. Good to know the incidence and natural history of the disease, especially those with short duration and frequent.
b. May explain the relationship between risk factor and effect temporally.
c. Can be apply to fatal and progressive cases.
d. May study several effects at once from the risk factor.
e. Generally accurate for it is observed longitudinally and continuously.
Cohort studyCohort study
The weaknesses of cohort studya. Relatively need a long time and expensive
b. Often complicated.
c. Not efficient to study rare cases.
d. Possibility of drop out and alteration of exposure intensity which may disturb the result analysis.
e. May arise ethical problem on certain cases in condition when the exposure may harm the subjects if it is ignored.