Embed Size (px)
Citation preview

CEPT REPORT 30
CEPT Report 30
Report from CEPT to the European Commission in response to the Mandate on
“The identification of common and minimal (least restrictive) technical conditions for 790 - 862 MHz
for the digital dividend in the European Union”
Final Report on 30 October 2009 by the
ECCElectronic Communications Committee
CE
PT
Electronic Communications Committee (ECC) within the European Conference of Postal and Telecommunications Administrations (CEPT)

CEPT REPORT 30 Page 2
0 EXECUTIVE SUMMARY
This Report forms part of the response by CEPT to the second Mandate from the European Commission issued in May 2008 relating to the digital dividend - “on technical considerations regarding harmonisation options for the digital dividend in the European Union”. It addresses ‘task 1’of the Mandate - the identification of common and minimal (least restrictive) technical conditions applicable to the 790-862 MHz sub-band.
WRC-07 allocated the band 790 - 862 MHz to the Mobile Service on a co-Primary basis throughout Region 1 from 17 June 2015. In January 2007, the European Commission issued a first mandate on the Digital Dividend “on tech-nical considerations regarding harmonisation options for the digital dividend”1. Prior to this, in July 2006, the Com-mission issued a Mandate to CEPT “to develop least restrictive technical conditions for frequency bands addressed in the context of WAPECS”2.
The present CEPT Report defines the set of “common and minimal (least restrictive) technical conditions” opti-mised for, but not limited to, fixed/mobile communications networks (two-way) in the 790-862 MHz band, whilst enabling the protection of broadcasting operating in accordance with GE-06 and other applications. For a matter of simplicity, the systems to which these technical conditions are defined are called ECN (Electronic Communication Networks) in this document3. The main non-ECN application to which technical conditions are not applicable is the terrestrial broadcasting. Another non-ECN use of the 790-862 MHz band, Aeronautical Radionavigation systems (ARNS), operating in some CEPT countries according to RR footnote 5.312, is considered in this report in a general way only.
The technical conditions developed in this report are developed independently of the channelling arrangement, and can therefore be applied to various band plans with a 5 MHz block size. For the preferred FDD harmonised fre-quency arrangement (2 x 30 MHz starting at 791 MHz with a duplex gap of 11 MHz), there will be some inter-leaved spectrum in the FDD duplex gap or in the alternative TDD arrangement, there will be a guard band at 790MHz. Several uses can be envisaged (e.g. low power applications such as PMSE) on a non protected/ non inter-fering basis in this interleaved spectrum. This report also considers the minimum technical conditions that these applications must meet.
The definition of the least restrictive technical conditions is based on the block edge mask (BEM) approach, taking into account the corresponding work conducted by CEPT in the previous WAPECS Mandate. The block-edge mask (BEM) approach consists of in-block and out-of-block limits depending on frequency offset. The out-of-block com-ponent of the BEM consists of a baseline limit as well as transitional (or intermediate) limits, to be applied, where applicable, at the frequency boundary of an individual spectrum licence. These limits were derived using studies of appropriate compatibility and sharing scenarios between ECN and other applications in adjacent bands but in the same geographical area.
It should be understood that block edge masks do not always provide the required level of protection of victim ser-vices and in order to resolve the remaining cases of interference additional mitigation techniques would need to be applied.
In adjacent geographical areas (co-channel or adjacent bands), the BEM has to be applied in conjunction with other conditions necessary for the coexistence between ECN systems and other applications. This can be done at a na-tional level by deriving power flux density (pfd) values for areas within the territory of one administration or with cross-border coordination developed by bilateral or multi-lateral agreements. With regard to cross-border coordina-tion, three scenarios have been identified:
- Cross-border coexistence between ECN on one side and terrestrial broadcasting on the other hand. This scenario is addressed in CEPT Report 29;
- Cross-border coexistence between ECN on one side and Aeronautical Radionavigation on the other side. Sharing studies related to this scenario are carried out within CEPT with respect to WRC-12 AI 1.17. The final sharing conditions will be adopted at WRC-12. It is likely that this will lead to methods for coordina-tion which will be applicable to this case.
- Cross-border coexistence between ECN on both sides of the border. It is expected that specific recommen-dation applicable to cross-border coordination for ECN in the 790-862 MHz band will be developed within CEPT.
The most likely use of the band 790-862 MHz for fixed/mobile communication networks is a cellular like topology with two-way communication. Therefore, two different BEM are developed - one for the base station (BS) and one
1 The response to this Mandate is contained in CEPT Reports 21, 22 and 23. 2 The response to this mandate is contained in CEPT Report 19. 3 It is important to note that the scope of ECN within this document is narrower than the definition in Directive 2002/21/EC. It includes mo-
bile, fixed, nomadic and broadcasting networks that respect the technical conditions laid down for ECNs in this Report.
CEPT REPORT 30 Page 3
for the terminal station (TS) – taking into consideration mobile service parameters. The most critical scenarios stud-ied in this report concern compatibility issues between ECN and terrestrial broadcasting, but scenarios between two ECN have also been studied. The following conclusions were reached:
Compatibility of ECN base stations with high power terrestrial broadcasting
Simulations over a range of scenarios indicate that the fraction of locations in which a TV receiver may suffer unac-ceptable levels of interference (failure rate) does not improve significantly with a reduction in the ECN BS BEM baseline below 0 dBm/(8 MHz), based on typical measured values for ACS and on a range of high EIRP of the base station (59 dBm/10MHz). However, for lower EIRP levels, this fraction of locations in which a TV receiver may suffer unacceptable levels of interference (failure rate) shows significant improvement with a reduction in the ECN BS BEM baseline.
The different set of studies realised so far show that the impact of interference can not be arbitrarily reduced through a reduction of the BS out-of-block (OoB) emission alone due to finite TV receiver selectivity. Therefore, other miti-gation mechanisms (beyond the BEM baseline level) would ultimately be required if the protection delivered by the BEM only is considered insufficient by an administration, e.g. by means of additional measures at the national level4. .
This conclusion is valid for situations where the first ECN adjacent channel to a DTT channel is used. In that case, the MCL analysis gives an idea of the extent of this interfered area located around each ECN base station. It has also to be noted that a baseline of 0 dBm/8 MHz may result in a significant constraint for ECN base station when the TV channel is adjacent to the ECN block (e.g. in the case of channel 60) and that it may not be necessary in areas where frequency offset between DTT channel and ECN channels is higher. On the other hand, it was also noted that broad-casting planning may evolve and that a channel not used in an area may be used in the future, after deployment of ECN base stations.
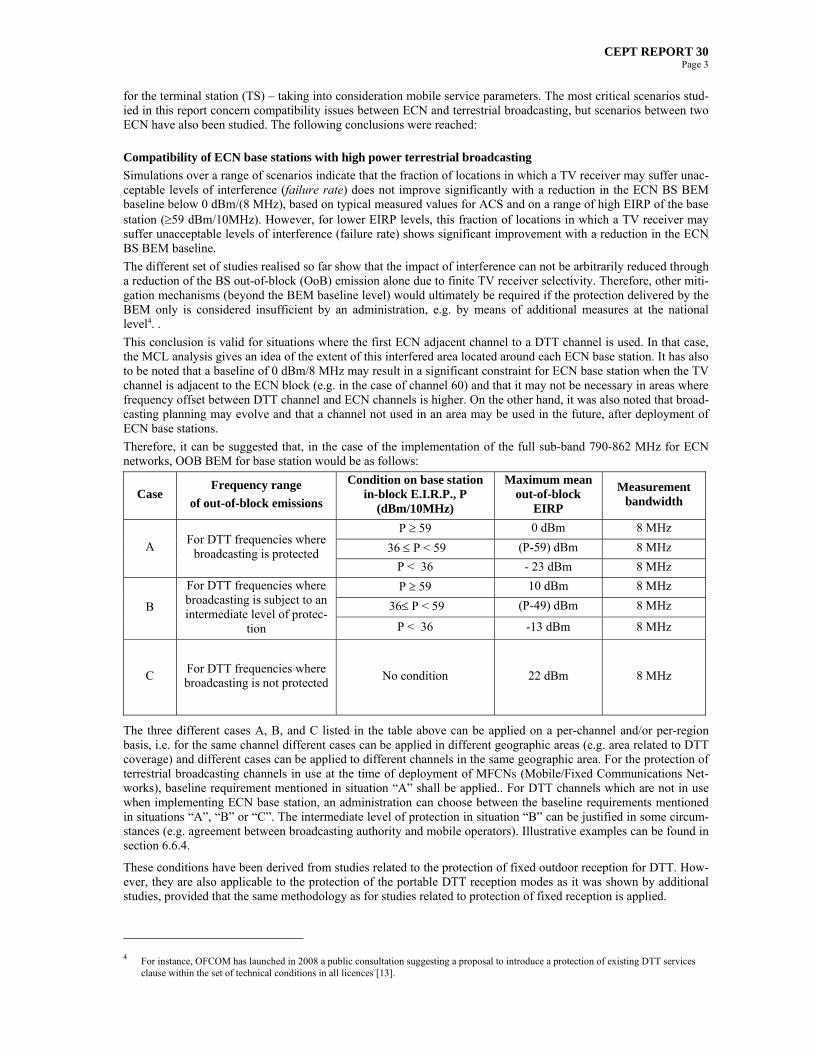
Therefore, it can be suggested that, in the case of the implementation of the full sub-band 790-862 MHz for ECN networks, OOB BEM for base station would be as follows:
Case Frequency range
of out-of-block emissions
Condition on base station in-block E.I.R.P., P
(dBm/10MHz)
Maximum mean out-of-block
EIRP
Measurement bandwidth
P 59 0 dBm 8 MHz
36 P < 59 (P-59) dBm 8 MHz A For DTT frequencies where
broadcasting is protected P < 36 - 23 dBm 8 MHz
P 59 10 dBm 8 MHz
36 P < 59 (P-49) dBm 8 MHz B
For DTT frequencies where broadcasting is subject to an intermediate level of protec-
tion P < 36 -13 dBm 8 MHz
C For DTT frequencies where broadcasting is not protected
No condition 22 dBm 8 MHz
The three different cases A, B, and C listed in the table above can be applied on a per-channel and/or per-region basis, i.e. for the same channel different cases can be applied in different geographic areas (e.g. area related to DTT coverage) and different cases can be applied to different channels in the same geographic area. For the protection of terrestrial broadcasting channels in use at the time of deployment of MFCNs (Mobile/Fixed Communications Net-works), baseline requirement mentioned in situation “A” shall be applied.. For DTT channels which are not in use when implementing ECN base station, an administration can choose between the baseline requirements mentioned in situations “A”, “B” or “C”. The intermediate level of protection in situation “B” can be justified in some circum-stances (e.g. agreement between broadcasting authority and mobile operators). Illustrative examples can be found in section 6.6.4.
These conditions have been derived from studies related to the protection of fixed outdoor reception for DTT. How-ever, they are also applicable to the protection of the portable DTT reception modes as it was shown by additional studies, provided that the same methodology as for studies related to protection of fixed reception is applied.
4 For instance, OFCOM has launched in 2008 a public consultation suggesting a proposal to introduce a protection of existing DTT services clause within the set of technical conditions in all licences [13].

CEPT REPORT 30 Page 4
Compatibility of ECN terminal stations with high power terrestrial broadcasting
An ECN terminal baseline requirement of -50dBm/8MHz for frequencies below 790 MHz is needed for protection of fixed TV reception. In the case of protection of portable TV reception, an ECN baseline of -65 dBm/8 MHz would be needed.
The uplink guard band to protect DTT fixed reception from ECN uplink interference on an adjacent channel is around 7 MHz. Larger guard band would be required for the protection of portable-indoor DTT reception, with a potential need for additional filtering at the TV antenna port. For the preferred FDD channel arrangement, the fre-quency separation between uplink and DTT is at least 42 MHz; the guard band requirement is therefore inherently met and the baseline level is readily met.
Therefore, the regulation of requirements imposed on terminal stations needs to take account of the DTT reception mode and the actual guard band.
Compatibility between ECN networks
A similar approach to the one used in CEPT Report 19 and ECC Report 131 has been applied. A baseline limit of -49.5 dBm/5MHz in the relevant part of the spectrum has been derived for the ECN base stations, and of -37dBm/5MHz for ECN terminal stations. Some transitional levels are also introduced to ease the transition between operators. They are derived from the LTE band-independent spectrum emission mask, which has been assumed to be representative of the technologies envisaged in this band.
In-Block E.I.R.P.
- An administration may specify a base station in-block EIRP limit. Based on compatibility studies and de-ployment requirement, suggested maximum EIRP limits range from 56 dBm/(5 MHz) to 64 dBm/(5 MHz). In case a limit is specified, administrations may consider authorising a power exceeding the limit in particu-lar situations, e.g. in rural areas.
- The limit for ECN terminal station in-block power is 23 dBm TRP for the TS designed to be mobile or no-madic and 23 dBm EIRP for TS designed to be fixed or installed. Administrations may relax this limit in certain situations, for example fixed TS in rural areas, providing that protection of other services, networks and applications is not compromised and cross-border obligations are fulfilled.
It may be necessary to use band pass filters at DTT receivers in order to be sufficiently protected against in-terference caused by this in-block limit.
These different values constitute the set of least restrictive technical conditions, to be met by an ECN operating in the 790 - 862 MHz band.
It should be noted that Administrations should ensure that ECN operators in the 790 - 862 MHz band are free to enter into bilateral or multilateral agreements to develop less stringent technical parameters, if agreed among all affected parties including broadcasting operators.
CEPT REPORT 30 Page 5
Table of contents
0 EXECUTIVE SUMMARY.................................................................................................................................... 2
LIST OF ABBREVIATIONS........................................................................................................................................ 7
1 INTRODUCTION.................................................................................................................................................. 8
2 SCOPE..................................................................................................................................................................... 8
3 ASSUMPTIONS FOR THE DEVELOPMENT OF TECHNICAL CONDITIONS RELATIVE TO ELECTRONIC COMMUNICATION NETWORKS IN THE 790-862 MHZ BAND........................................... 9
3.1 APPROPRIATE MODELS FOR DEFINING LEAST RESTRICTIVE TECHNICAL CONDITIONS ...................................... 9 3.2 RADIO NETWORK SCENARIO AND REFERENCE ECN SYSTEM............................................................................ 9 3.3 PARTITIONING OF THE BAND – CHANNELLING ARRANGEMENTS.................................................................... 10
4 IDENTIFICATION OF THE COMPATIBILITY AND SHARING SCENARIOS .................................... 11
4.1 CASE A AND CASE B: ADJACENT BAND COMPATIBILITY BETWEEN AN ECN BLOCK AND A NON-ECN BLOCK
AT THE 790 AND 862 MHZ FREQUENCY BOUNDARIES OR WITHIN THE BAND............................................................. 12 4.1.1 ECN as interferer ................................................................................................................................... 12 4.1.2 ECN as victim......................................................................................................................................... 13
4.2 CASE C: COMPATIBILITY WITHIN THE BAND 790-862 MHZ BETWEEN TWO ECN ADJACENT BLOCKS WITHIN
THE SAME GEOGRAPHICAL AREA................................................................................................................................. 13 4.3 CASE D: COMPATIBILITY WITHIN THE BAND 790-862 MHZ BETWEEN TWO ECN BLOCKS AT THE SAME
FREQUENCY IN GEOGRAPHICALLY ADJACENT AREAS ................................................................................................. 14 4.4 CASE E: COMPATIBILITY WITHIN THE BAND 790-862 MHZ BETWEEN ONE ECN BLOCK AND A NON-ECN USE
AT THE SAME FREQUENCY IN GEOGRAPHICALLY ADJACENT AREAS ........................................................................... 15 4.4.1 ECN as interferer ................................................................................................................................... 15 4.4.2 ECN as victim......................................................................................................................................... 15
5 APPROACH FOR DERIVING THE TECHNICAL CONDITIONS IN THE 790-862 MHZ BAND....... 16
6 ANALYSIS OF THE STUDIES AND DERIVATION OF THE BEM IN THE 790-862 MHZ BAND..... 16
6.1 STAGE 1: ASSUMPTIONS FOR ECNS IN THIS BAND ......................................................................................... 16 6.2 STAGE 2: COMPATIBILITY BETWEEN ECNS IN THE 790-862 MHZ BAND AND OUT OF BAND NON-ECNS ..... 16
6.2.1 ECN as interferer ................................................................................................................................... 16 6.2.2 ECN as victim......................................................................................................................................... 19
6.3 STAGE 3: COMPATIBILITY BETWEEN ECNS IN THE 790-862 MHZ BAND AND IN-BAND NON-ECNS IN
GEOGRAPHICALLY ADJACENT AREAS.......................................................................................................................... 20 6.3.1 Terrestrial broadcasting as non-ECN ................................................................................................... 20 6.3.2 ARNS as non-ECN.................................................................................................................................. 20
6.4 STAGE 4: COMPATIBILITY BETWEEN ECNS AND OUT-OF-BLOCK ECNS IN THE 790-862 MHZ BAND IN THE
SAME GEOGRAPHICAL AREA........................................................................................................................................ 20 6.4.1 BEM baseline requirement for Base Stations........................................................................................ 20 6.4.2 BEM for Terminal Stations .................................................................................................................... 22
6.5 STAGE 5: COMPATIBILITY BETWEEN ECNS IN THE 790-862 MHZ BAND AND CO-FREQUENCY ECNS IN A
GEOGRAPHICALLY ADJACENT AREA............................................................................................................................ 24 6.6 STAGE 6: ANALYSIS OF THE RESULT AND PROPOSALS FOR THE BEM FOR ECN IN THE 790-862 MHZ BAND24
6.6.1 Technical conditions for ECN base stations (FDD or TDD)................................................................ 25 6.6.2 Technical conditions for ECN FDD or TDD terminal stations ............................................................ 26 6.6.3 Technical conditions for PMSE and low-power (LP) applications within the duplex gap of the FDD frequency arrangement or the guard band of the TDD frequency arrangement.................................................. 28 6.6.4 Illustrative examples .............................................................................................................................. 30
7 CONCLUSIONS................................................................................................................................................... 33
ANNEX 1: STUDIES TO DERIVE BEM APPLICABLE TO ECN BASE STATIONS AT THE FREQUENCY ADJACENCY BETWEEN ECN AND TERRESTRIAL BROADCASTING ........................... 36
ANNEX 2: COMPLEMENTARY STUDIES FOR CONFIRMATION OF ECN BS BEM FOR PORTABLE RECEPTION................................................................................................................................................................. 67
ANNEX 3: STUDIES TO DERIVE BEM APPLICABLE TO ECN TERMINAL STATIONS AT THE ADJACENCY BETWEEN ECN AND TERRESTRIAL BROADCASTING ...................................................... 74

CEPT REPORT 30 Page 6
ANNEX 4: GUIDANCE TO ADMINISTRATIONS ON THE RELEVANT MITIGATION TECHNIQUES AND MEANS TO SOLVE THE INTERFERENCE CASES BETWEEN ECN AND TERRESTRIAL BROADCASTING ON A LOCAL BASIS ................................................................................................................ 99
ANNEX 5: STUDIES TO DERIVE BEM APPLICABLE TO APPLICATIONS IN THE FDD DUPLEX GAP OR INTERLEAVED SPECTRUM ADJACENT TO ECN BLOCKS ................................................................ 102
ANNEX 6: PROPAGATION MODELS.................................................................................................................. 112
ANNEX 7: SECOND EC MANDATE TO CEPT ON DIGITAL DIVIDEND ................................................... 122
LIST OF REFERENCES .......................................................................................................................................... 125
CEPT REPORT 30 Page 7
LIST OF ABBREVIATIONS
Abbreviation Explanation
ACIR Adjacent-Channel Interference Ratio
ACLR Adjacent-Channel Leakage Ratio
ACS Adjacent-Channel Selectivity
a.g.l. Above ground level
AI Agenda Item
ARNS Aeronautical Radionavigation systems
AWGN Additive White Gaussian Noise
BEM Block Edge Mask
BS Base Station
BW Bandwidth
CEPT European Conference of Postal and Telecommunications Administrations
DG Duplex Gap
DL Downlink
DTT Digital Terrestrial Television
DVB-T Digital Video Broadcasting-Terrestrial
EBU European Broadcasting Union
ECC Electronic Communications Committee
ECN Electronic Communication Networks
EIRP Equivalent Isotropic Radiated Power
FDD Frequency Division Duplex
IMT International Mobile Telecommunications
JTG Joint Task Group
LP Low Power
LTE Long Term Evolution (radio interface defined by 3GPP)
MCL Minimum Coupling Loss
MFCN Mobile/Fixed Communications Networks
NF Noise Figure
PMSE Programme Making and Special Events
pfd Power Flux Density
PR Protection Ratio
RB Resource block
RM Radio Microphone
RPC Reference Planning Configuration
SEM Spectrum Emission Mask
TDD Time Division Duplex
TPC Transmitter Power Control
TS Terminal Station
TT Television Tower
TV Television
UL Uplink
UMTS Universal Mobile Telecommunication System
WAPECS Wireless Access Policy for Electronic Communication Services
WRC World Radio Conference

CEPT REPORT 30 Page 8
1 INTRODUCTION
The European Commission issued the second mandate to CEPT on technical considerations regarding harmonisation options for the digital dividend in the European Union. CEPT is mandated to carry out the technical investigations to define the technical conditions applicable for the sub-band 790-862 MHz optimised for, but not limited to, fixed/mobile communications networks (two-way).
This Report deals with the reply to the task 1 of the mandate:
“The identification of common and minimal (least restrictive) technical conditions”. These conditions should be sufficient to avoid interference and facilitate cross-border coordination noting that certain frequencies used for mo-bile multimedia networks may be used primarily for mobile (downlink) in one country and broadcasting networks in another country until further convergence takes place.”
Within the framework of this Mandate, CEPT has already issued the CEPT Report 29 [1] which provides “Guideline on cross border coordination issues between mobile services in one country and broadcasting services in another country”.
It has to be mentioned that the second mandate to CEPT contains two other tasks. The first one is about the most appropriate channelling arrangement for the sub-band 790-862 MHz. CEPT Report 31 [1] contains all relevant in-formation on this matter. The second one, resulting in CEPT Report 32 [15], is about a recommendation on the best approach to ensure the continuation of existing Programme Making and Special Events (PMSE) services operating in the interleaved spectrum between broadcasting allotments, including the assessment of the advantage of an EU-level approach as well as an outline of such an EU level solution if appropriate. "Professional use" and "non-professional use" applications may be addressed separately if needed. This report contains some information on this subject.
2 SCOPE
This Report aims at defining the set of least restrictive technical conditions optimised for, but not limited to, fixed/ mobile communications networks (two-way) in the 790-862 MHz band, whilst enabling the protection of broadcast-ing operating in accordance with GE-06 and other applications. This work has been carried out taking into account existing reports on this subject; in particular information provided by the CEPT Reports 21 [3], 22 [4] and 23 [5].
This task is considered as a continuation of the previous CEPT activities on the WAPECS mandate that resulted in the CEPT Report 19 [6] and ECC Report 131 [7]. Therefore, this Report applies a similar approach to the 790-862 MHz band, when relevant, to the one described in the CEPT Report 19 [6] and ECC Report 131 [7].
The Commission clarified that the WAPECS approach should be followed when answering the mandate stating that the determination of the technical conditions should not be based on high power networks. The Commission added that the market should be free to decide on the block usage, with one way (e. g., broadcasting with lower power) or two way services, as long as the “least restrictive technical conditions” are respected.
Therefore, the definition of the least restrictive technical conditions is based on the most likely electronic communi-cation service to be deployed in the band other than high-power broadcasting, i.e., two-way fixed/mobile communi-cation services. However, it does not prejudge the type of applications that can be implemented under the deter-mined technical conditions.
For a matter of simplicity, the systems to which the technical conditions are defined will be called ECN (Electronic Communication Networks) in the document. The term non-ECN refers to radiocommunication systems for which protection has to be ensured. The technical conditions defined in this Report are not intended to apply to them, for example high power broadcasting noting that some administrations may continue to operate high-power broadcast-ing in the 790-862 MHz band.
The non-ECN may operate within the band 790-862 MHz or in adjacent bands.
The following items are addressed in this Report:
- Choice of the most appropriate model for defining least restrictive technical conditions for ECN applicable for the 790-862 MHz band. The technical conditions should be based on studies assessing the risk of interfer-ence between ECN neighbouring networks, whilst considering the potential implications of the non-ECN use.
- Determination of the technical assumptions for ECN systems in the 790-862 MHz band. This includes the se-lection of reference network scenarios and the choice of technical characteristics for reference ECN systems.
- Identification of the compatibility and sharing scenarios. In order to cover scenarios on the coexistence be-tween ECN and non-ECN, working assumptions on non-ECN technical characteristics are defined.
- Proposed approach for the technical conditions applicable for the 790-862 MHz band.
- Analysis of the studies and derivation of the technical conditions for ECN in the 790-862 MHz band.
CEPT REPORT 30 Page 9
It has to be noted also that, according to the channel arrangements applied to the sub band, there may be some inter-leaved spectrum (e.g. FDD duplex gap in case of FDD channel plan and TDD guard band in the case of a TDD channel plan). This report develops also technical conditions for ‘low-power’ applications such as PMSE intended to be deployed in this interleaved spectrum on a non-protected/ non interfering basis.
3 ASSUMPTIONS FOR THE DEVELOPMENT OF TECHNICAL CONDITIONS RELATIVE TO ELECTRONIC
COMMUNICATION NETWORKS IN THE 790-862 MHZ BAND
3.1 Appropriate models for defining least restrictive technical conditions
During its recent work, e.g. on the 2.5-2.69 GHz and the 3.4 – 3.8 GHz bands ([6], [7]), CEPT has gained expertise on the definition of least restrictive technical conditions with the Block Edge Mask (BEM) model.
It was felt that it would only be able to meet the ambitious timescales established in the Commission Mandate if the experience of developing technical conditions for the 2.6 GHz band was used. The BEM approach is able to fulfil the objectives set out in the Mandate, and it was therefore decided to use this approach as a working assumption for the development of the least restrictive technical conditions for the 790-862 MHz band.
The block-edge mask (BEM) approach consists of in-block and out-of-block components as a function of frequency. The out-of-block component of the BEM itself consists of a baseline level and, where applicable, intermediate levels which describe the transition from the in-block level to the baseline level as a function of frequency.
Correspondingly, the BEMs over all frequencies under study are built up by combining the different values resulting from compatibility studies in such a way that the limit at each frequency is given by the higher (less stringent) value of a) the baseline requirements, b) the boundary-specific requirements and c) the in-block requirements.
It has to be noted that the BEM components have been derived so far following compatibility studies between ECN and other applications in adjacent bands but in the same geographical area. Therefore, the BEM has to be associated with other requirements ensuring coexistence between ECN systems and other applications in adjacent geographical areas (co channel or adjacent bands). This can be done at a national level by deriving power flux density (pfd) val-ues for areas within the territory of one administration or with cross-border coordination developed by bilateral or multi-lateral agreements. It should be noted that currently sharing studies between IMT and ARNS are in progress with respect to WRC AI 1.17 and final sharing conditions will be adopted at WRC-12.
These technical conditions applicable for the sub-band 790-862 MHz are optimised for, but not limited to, fixed/mobile communications networks (two-way). Therefore, they are derived both for base stations (BS) and ter-minal stations (TS).
The BEM shall be applied as an essential component of the necessary conditions for the coexistence in the absence of bilateral or multilateral agreements between neighbouring mobile networks in the 790-862 MHz band, without precluding less stringent technical parameters if agreed among the operators of such networks. Administrations should ensure that fixed/mobile network operators in the 790-862 MHz band are free to enter into bilateral or multi-lateral agreements to develop less stringent technical parameters and, if agreed among all affected parties, these less stringent technical parameters may be used, if the same level of protection is guaranteed for other networks, such as broadcasting, operating inside or outside the 790-862 MHz band.
Two alternative approaches described in CEPT Report 19 were proposed:
- Space centric management, proposed by Futurepace [8];
- Technical licensing conditions based on aggregate PFD, described by Ofcom UK [9].
Both of these approaches show promise. However, they both need further technical development and raise regula-tory questions that would need to be addressed before they could be chosen for implementation in the timescale of a Commission Mandate.
3.2 Radio network scenario and reference ECN system
The main purpose is to define technical conditions optimised for but not limited to two-way electronic communica-tion networks. Therefore, the basic radio network scenario is a cellular like topology with potentially mobile termi-nals and two-ways communication.
CEPT REPORT 30 Page 10
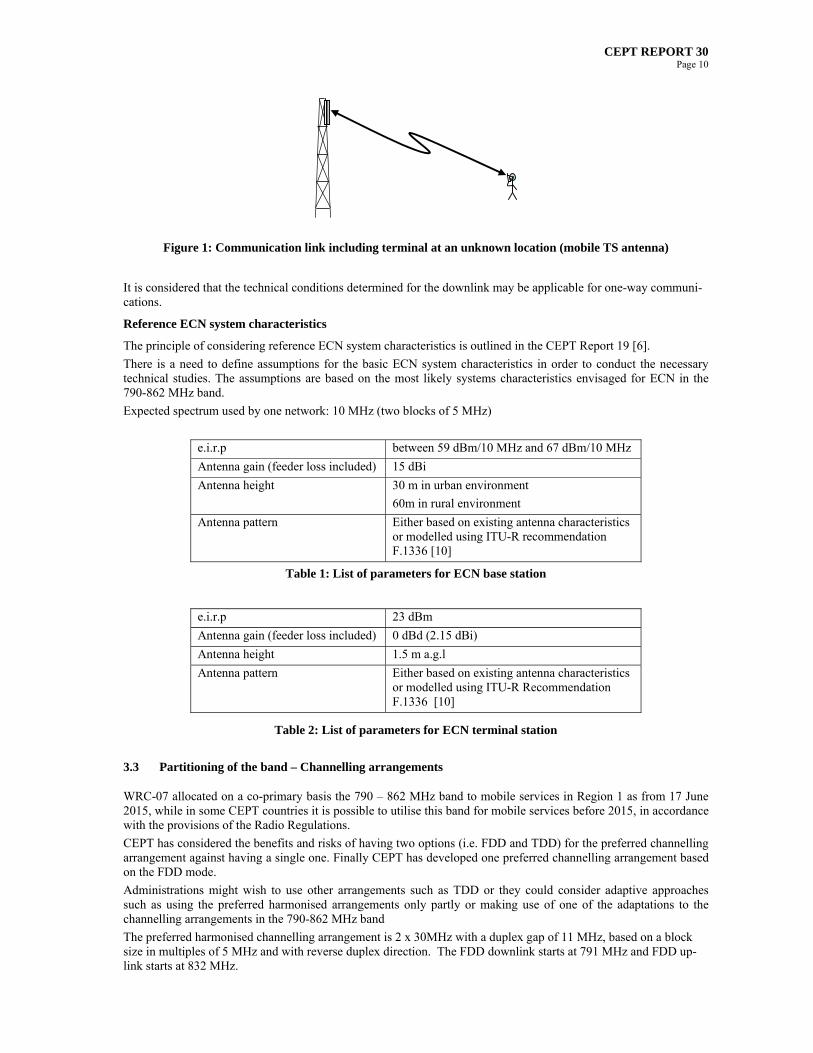
Figure 1: Communication link including terminal at an unknown location (mobile TS antenna)
It is considered that the technical conditions determined for the downlink may be applicable for one-way communi-cations.
Reference ECN system characteristics
The principle of considering reference ECN system characteristics is outlined in the CEPT Report 19 [6].
There is a need to define assumptions for the basic ECN system characteristics in order to conduct the necessary technical studies. The assumptions are based on the most likely systems characteristics envisaged for ECN in the 790-862 MHz band.
Expected spectrum used by one network: 10 MHz (two blocks of 5 MHz)
e.i.r.p between 59 dBm/10 MHz and 67 dBm/10 MHz
Antenna gain (feeder loss included) 15 dBi
Antenna height 30 m in urban environment
60m in rural environment
Antenna pattern Either based on existing antenna characteristics or modelled using ITU-R recommendation F.1336 [10]
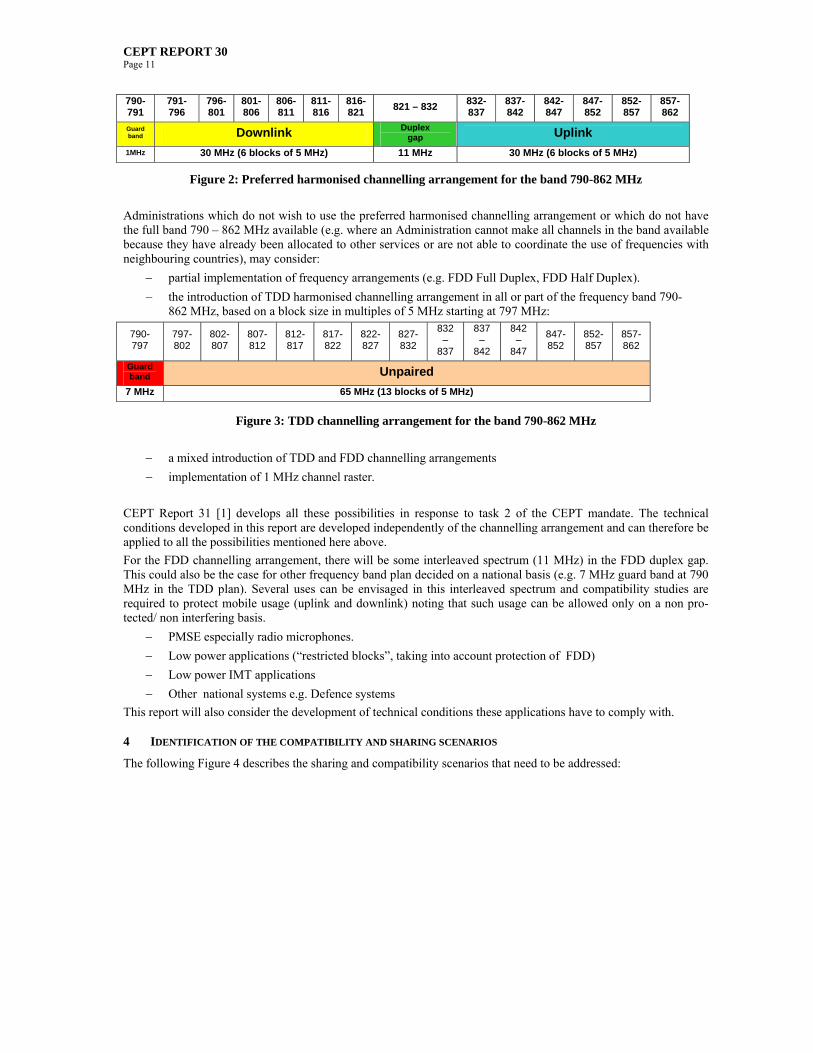
Table 1: List of parameters for ECN base station
e.i.r.p 23 dBm
Antenna gain (feeder loss included) 0 dBd (2.15 dBi)
Antenna height 1.5 m a.g.l
Antenna pattern Either based on existing antenna characteristics or modelled using ITU-R Recommendation F.1336 [10]
Table 2: List of parameters for ECN terminal station
3.3 Partitioning of the band – Channelling arrangements
WRC-07 allocated on a co-primary basis the 790 – 862 MHz band to mobile services in Region 1 as from 17 June 2015, while in some CEPT countries it is possible to utilise this band for mobile services before 2015, in accordance with the provisions of the Radio Regulations.
CEPT has considered the benefits and risks of having two options (i.e. FDD and TDD) for the preferred channelling arrangement against having a single one. Finally CEPT has developed one preferred channelling arrangement based on the FDD mode.
Administrations might wish to use other arrangements such as TDD or they could consider adaptive approaches such as using the preferred harmonised arrangements only partly or making use of one of the adaptations to the channelling arrangements in the 790-862 MHz band
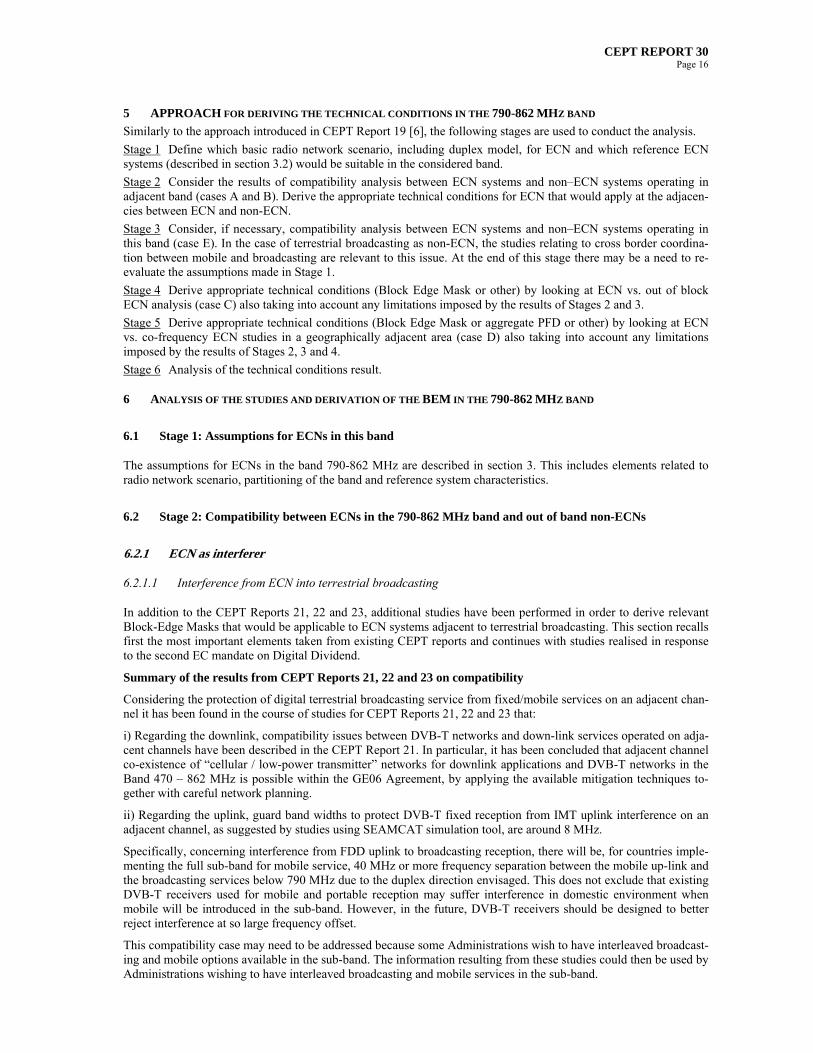
The preferred harmonised channelling arrangement is 2 x 30MHz with a duplex gap of 11 MHz, based on a block size in multiples of 5 MHz and with reverse duplex direction. The FDD downlink starts at 791 MHz and FDD up-link starts at 832 MHz.
CEPT REPORT 30 Page 11
790-791
791-796
796- 801
801-806
806- 811
811-816
816- 821
821 – 832 832- 837
837- 842
842- 847
847- 852
852- 857
857- 862
Guard band Downlink Duplex
gap Uplink
1MHz 30 MHz (6 blocks of 5 MHz) 11 MHz 30 MHz (6 blocks of 5 MHz)
Figure 2: Preferred harmonised channelling arrangement for the band 790-862 MHz
Administrations which do not wish to use the preferred harmonised channelling arrangement or which do not have the full band 790 – 862 MHz available (e.g. where an Administration cannot make all channels in the band available because they have already been allocated to other services or are not able to coordinate the use of frequencies with neighbouring countries), may consider:
partial implementation of frequency arrangements (e.g. FDD Full Duplex, FDD Half Duplex).
the introduction of TDD harmonised channelling arrangement in all or part of the frequency band 790-862 MHz, based on a block size in multiples of 5 MHz starting at 797 MHz:
790-797
797-802
802-807
807-812
812-817
817-822
822-827
827-832
832 –
837
837 –
842
842 –
847
847-852
852-857
857-862
Guard band Unpaired
7 MHz 65 MHz (13 blocks of 5 MHz)
Figure 3: TDD channelling arrangement for the band 790-862 MHz
a mixed introduction of TDD and FDD channelling arrangements
implementation of 1 MHz channel raster.
CEPT Report 31 [1] develops all these possibilities in response to task 2 of the CEPT mandate. The technical conditions developed in this report are developed independently of the channelling arrangement and can therefore be applied to all the possibilities mentioned here above.
For the FDD channelling arrangement, there will be some interleaved spectrum (11 MHz) in the FDD duplex gap. This could also be the case for other frequency band plan decided on a national basis (e.g. 7 MHz guard band at 790 MHz in the TDD plan). Several uses can be envisaged in this interleaved spectrum and compatibility studies are required to protect mobile usage (uplink and downlink) noting that such usage can be allowed only on a non pro-tected/ non interfering basis.
PMSE especially radio microphones.
Low power applications (“restricted blocks”, taking into account protection of FDD)
Low power IMT applications
Other national systems e.g. Defence systems
This report will also consider the development of technical conditions these applications have to comply with.
4 IDENTIFICATION OF THE COMPATIBILITY AND SHARING SCENARIOS
The following Figure 4 describes the sharing and compatibility scenarios that need to be addressed:

CEPT REPORT 30 Page 12
NEIGHBOURING
NON ECN BAND
(i.e. "out of band")
790-862 BAND(i.e. "in band")
NEIGHBOURINGNON ECN
BAND (i.e. "out of band")
ECN block
ECN block
Non ECN use Non ECN use
Case B
ECN block Non ECN use
Non ECN use Non ECN use
Case A Case A Case C
Geographical separation (e.g. country border)
NEIGHBOURING NON ECN
BAND (i.e. "out of band")
NEIGHBOURINGNON ECN
BAND (i.e. "out of band")
790-862 MHz BAND(i.e. "in band")
Case E Case D
Area X
Area Y
Figure 4: Illustration of the different compatibility cases within and adjacent to the band 790-862 MHz
4.1 Case A and Case B: Adjacent band compatibility between an ECN block and a non-ECN block at the 790 and 862 MHz frequency boundaries or within the band
At 790 MHz, the main non-ECN use to consider is the terrestrial broadcasting. In addition to the work performed in the report, the results of CEPT Reports 21, 22 and 23 are also relevant for this case.
In addition, other non-ECN applications have or may have to be considered such as Aeronautical Radionavigation systems (ARNS) operating in the bands 645-862 MHz (in the countries mentioned in footnote RR 5.312) and 862-960 MHz (in the countries mentioned in the footnote RR 5.323).
Case B will only be relevant for administrations where the band 790-862 MHz can be shared in the same area be-tween ECN and non-ECN use.
The Report also considers the possible operation of low-power mobile applications, such as PMSE in the duplex gap of the ECN FDD band plan or within the guard band in the case of a TDD band plan.
The following sharing scenarios can be identified.
4.1.1 ECN as interferer
Table 3 identifies the complete list of sharing scenarios. It also gives indications of the scenarios for which some results of studies were available prior to the development of this Report.

CEPT REPORT 30 Page 13
Victim (receiving interference)
Broadcasting -fixed reception (RPC 1)*
Broadcasting -portable outdoor and mobile
reception (RPC 2) and portable indoor recep-
tion (RPC 3)
Other applications (ARNS, PMSE)
ECN FDD and TDD downlink
From CEPT Reports 21 and 23 and An-
nex 1.
Covered by CEPT Reports 21 and 23 and
Annex 2.
ECN FDD uplink
Relevant in the case of mixed
ECN/broadcasting use. See section
6.2.1.1.
Relevant in the case of mixed
ECN/broadcasting use. See section 6.2.1.1. In
terf
erer
ECN TDD uplink
From CEPT Reports 22 and 23. See sec-
tion 6.2.1.1 and Annex 3.
Section 6.2.1.1 and Annex 3.
For ARNS in the band 790-862 MHz or in adjacent band, this needs to be addressed at a national level
(see section 6.2.1.2)
For PMSE in the FDD duplex gap and TDD guard band, see Annex 5.
*RPC = reference planning configuration (see Annex 3.5 of the Final Acts of GE06). DVB-T reference parameters for each RPC are provided in Annex 1 with other technical information relevant for the assessment of the DVB-T protection. These elements originate from the technical parts of the GE06
Agreement.
Table 3: sharing scenarios under case A (and B) with ECN as interferer
A summary of the results of the studies and an analysis is provided in 6.2.1 as well as Annexes 1, 2 and 3.
For the case of ECN FDD uplink as interferer, this compatibility case is studied because some Administrations wish to have interleaved broadcasting and mobile options available in the sub-band. The information resulting from these studies could then be used by Administrations wishing to have interleaved broadcasting and mobile services in the sub-band.
Regarding ARNS, it is proposed to determine the coexistence conditions related to cases A and B (compatibility between ECN and ARNS operating in adjacent frequencies in the same geographical area) at a national level.
4.1.2 ECN as victim
ECN FDD and TDD downlink receiving interfer-
ence
ECN FDD uplink receiving interference
ECN TDD uplink
receiving interference
Broadcasting -
as interferer Elements available in CEPT
Report 23 to be studied for the case of mixed ECN/broadcasting use
To be studied.
Other systems/services (ARNS, PMSE)
For ARNS, to be defined at a national level
For PMSE, see Annex 5.
For ARNS, to be defined at a national level
For PMSE, see Annex 5.
For ARNS, to be defined at a national level
For PMSE, see Annex 5.
Table 4: sharing scenarios under case A (and B) with ECN as victim
A summary of the results of the studies and an analysis is provided in 6.2.2.
4.2 Case C: Compatibility within the band 790-862 MHz between two ECN adjacent blocks within the same geographical area
One may identify four types of inter-system adjacent-channel interference. These include:
a) base station to terminal station interference (BS-TS);
b) terminal station to base station interference (TS-BS);
c) base station to base station interference (BS-BS); and

CEPT REPORT 30 Page 14
d) terminal station to terminal station (TS-TS) interference.
Categories (a) and (b) above are not different from the types of interference which occur at the frequency boundaries which separate adjacent FDD cellular systems, or those which separate adjacent TDD cellular systems. Moreover, similar types of intra-system interference occur at the channel boundaries within any type of cellular system. There-fore, this is covered by relevant technical standards. This contribution focuses on Categories (c) and (d).
FDD downlink receiving
interference FDD uplink receiving
interference
TDD uplink
receiving interfer-ence
TDD downlink
receiving interference
(Victim: FDD TS) (Victim: FDD BS) (Victim: TDD BS) (Victim: TDD TS)
FDD downlink
as interferer
(BEM for BS)
(Note 2) BEM Baseline level
(Note 1)
In case of mixed FDD/TDD at a na-
tional level :
BEM Baseline level (Note 1)
(Note 2)
FDD uplink
as interferer
(BEM for TS)
Compatibility ensured by duplex gap
(Note 2)
In case of mixed FDD/TDD at a na-
tional level :
(Note 2)
In case of mixed FDD/TDD at a national level :
(Note 3)
TDD downlink
as interferer
(BEM for BS)
In case of mixed FDD/TDD at a national
level :
(Note 2)
In case of mixed FDD/TDD at a na-
tional level :
BEM Baseline level (Note 1)
BEM Baseline level (Note 1)
(Note 2)
TDD uplink as interferer
(BEM for TS)
In case of mixed FDD/TDD at a national
level :
(Note 3)
In case of mixed FDD/TDD at a na-
tional level :
(Note 2)
(Note 2) (Note 2)
Table 5: sharing scenarios under case C
Note 1: The baseline level is part of the out-of-block component of the BEM derived from the studies depicted in Table 5. It should be integrated over the considered 5 MHz block size.
Note 2: Regulatory provisions scenario is similar to those defined in the relevant technical standards for the intra-system interference which occurs at the channel boundaries within any type of cellular system using the same tech-nology.
Note 3: An operator will not be able to ensure for equipment’s SEM defined in the relevant harmonised standard to inherently comply with the BEM when the channel edge is aligned with the block edge.
The results of the studies related to this case are provided in section 6.4.
4.3 Case D: Compatibility within the band 790-862 MHz between two ECN blocks at the same frequency in geographically adjacent areas
The studies relevant to this scenario would have to be conducted on the basis of the assumptions developed in sec-tion 3.2. The following sharing scenarios can be identified.

CEPT REPORT 30 Page 15
FDD downlink receiving interference
FDD uplink receiving inter-ference
TDD uplink and downlink receiving interference
FDD downlink
as interferer To be studied Duplex gap To be studied
FDD uplink
as interferer Duplex gap To be studied To be studied
TDD uplink and downlink
as interferer To be studied To be studied To be studied
Table 6: sharing scenarios under case D
Elements related to this scenario are provided in section 6.5.
4.4 Case E: Compatibility within the band 790-862 MHz between one ECN block and a non-ECN use at the same frequency in geographically adjacent areas
The main non-ECN use to consider is the terrestrial broadcasting. This case is addressed in a separate deliverable (CEPT report 29[1]), which provides guidelines on cross border coordination issues between mobile services in one country and broadcasting services in another country.
However, other applications have or may have to be considered as well, such as ARNS and low power applications such as PMSE. For ARNS, this issue will be addressed; also from cross border coordination standpoint under WRC-12 agenda item 1.17.
4.4.1 ECN as interferer
Broadcasting -
reception
receiving interference
Other systems/services as non-ECN (ARNS, PMSE)
ECN FDD downlink
as interferer Covered in CEPT Report 29
For ARNS, subject to WRC-12 AI 1.17.
ECN FDD uplink
as interferer Covered in CEPT Report 29
For ARNS, subject to WRC-12 AI 1.17.
ECN TDD uplink and downlink
as interferer Covered in CEPT Report 29
For ARNS, subject to WRC-12 AI 1.17.
Table 7: sharing scenarios under case E with ECN as interferer
4.4.2 ECN as victim
ECN FDD downlink receiving interference
ECN FDD uplink receiv-ing interference
ECN TDD up and downlink re-ceiving interference
Broadcasting -
as interferer Covered in CEPT report
29 [1] Covered in CEPT report
29 [1] Covered in CEPT report 29 [1]
Other systems/services at 790 or 862 MHz
(ARNS, PMSE)
For ARNS, subject to WRC-12 AI 1.17.
For ARNS, subject to WRC-12 AI 1.17.
For ARNS, subject to WRC-12 AI 1.17.
Table 8: sharing scenarios under case E with ECN as victim
CEPT REPORT 30 Page 16
5 APPROACH FOR DERIVING THE TECHNICAL CONDITIONS IN THE 790-862 MHZ BAND
Similarly to the approach introduced in CEPT Report 19 [6], the following stages are used to conduct the analysis.
Stage 1 Define which basic radio network scenario, including duplex model, for ECN and which reference ECN systems (described in section 3.2) would be suitable in the considered band.
Stage 2 Consider the results of compatibility analysis between ECN systems and non–ECN systems operating in adjacent band (cases A and B). Derive the appropriate technical conditions for ECN that would apply at the adjacen-cies between ECN and non-ECN.
Stage 3 Consider, if necessary, compatibility analysis between ECN systems and non–ECN systems operating in this band (case E). In the case of terrestrial broadcasting as non-ECN, the studies relating to cross border coordina-tion between mobile and broadcasting are relevant to this issue. At the end of this stage there may be a need to re-evaluate the assumptions made in Stage 1.
Stage 4 Derive appropriate technical conditions (Block Edge Mask or other) by looking at ECN vs. out of block ECN analysis (case C) also taking into account any limitations imposed by the results of Stages 2 and 3.
Stage 5 Derive appropriate technical conditions (Block Edge Mask or aggregate PFD or other) by looking at ECN vs. co-frequency ECN studies in a geographically adjacent area (case D) also taking into account any limitations imposed by the results of Stages 2, 3 and 4.
Stage 6 Analysis of the technical conditions result.
6 ANALYSIS OF THE STUDIES AND DERIVATION OF THE BEM IN THE 790-862 MHZ BAND
6.1 Stage 1: Assumptions for ECNs in this band
The assumptions for ECNs in the band 790-862 MHz are described in section 3. This includes elements related to radio network scenario, partitioning of the band and reference system characteristics.
6.2 Stage 2: Compatibility between ECNs in the 790-862 MHz band and out of band non-ECNs
6.2.1 ECN as interferer
6.2.1.1 Interference from ECN into terrestrial broadcasting
In addition to the CEPT Reports 21, 22 and 23, additional studies have been performed in order to derive relevant Block-Edge Masks that would be applicable to ECN systems adjacent to terrestrial broadcasting. This section recalls first the most important elements taken from existing CEPT reports and continues with studies realised in response to the second EC mandate on Digital Dividend.
Summary of the results from CEPT Reports 21, 22 and 23 on compatibility
Considering the protection of digital terrestrial broadcasting service from fixed/mobile services on an adjacent chan-nel it has been found in the course of studies for CEPT Reports 21, 22 and 23 that:
i) Regarding the downlink, compatibility issues between DVB-T networks and down-link services operated on adja-cent channels have been described in the CEPT Report 21. In particular, it has been concluded that adjacent channel co-existence of “cellular / low-power transmitter” networks for downlink applications and DVB-T networks in the Band 470 – 862 MHz is possible within the GE06 Agreement, by applying the available mitigation techniques to-gether with careful network planning.
ii) Regarding the uplink, guard band widths to protect DVB-T fixed reception from IMT uplink interference on an adjacent channel, as suggested by studies using SEAMCAT simulation tool, are around 8 MHz.
Specifically, concerning interference from FDD uplink to broadcasting reception, there will be, for countries imple-menting the full sub-band for mobile service, 40 MHz or more frequency separation between the mobile up-link and the broadcasting services below 790 MHz due to the duplex direction envisaged. This does not exclude that existing DVB-T receivers used for mobile and portable reception may suffer interference in domestic environment when mobile will be introduced in the sub-band. However, in the future, DVB-T receivers should be designed to better reject interference at so large frequency offset.
This compatibility case may need to be addressed because some Administrations wish to have interleaved broadcast-ing and mobile options available in the sub-band. The information resulting from these studies could then be used by Administrations wishing to have interleaved broadcasting and mobile services in the sub-band.

CEPT REPORT 30 Page 17
Additional studies to derive BEM applicable to ECN at the frequency adjacency between ECN and terrestrial broadcasting
i) BEM for ECN Base Stations
As a general principle, on the basis of the CEPT Report 21, it was decided and confirmed with Annex 2 that the protection of fixed reception broadcasting has to be used as the basis for the determination of ECN BS BEM.
This is justified since interference from the ECN base stations downlink into digital broadcasting fixed reception is the worst case for compatibility in adjacent bands as well as for overloading effects dealing with ECN base stations. This is mainly explained for three reasons:
- Interfering field strength from base station will be generally higher on roof-top. Obviously, the field strength value transmitted from antenna height around 30m or more will be higher when received at 10m than 1.5 m antenna height. It is noted, that at the same time also the wanted field strength will be higher at a receiving height of 10 m.
- Antenna gain for fixed reception is higher. In terms of interference assessment, the maximum antenna gain for roof antenna is higher than portable/handheld devices as mentioned in Geneva’06 agreement Annex 2, Chapter 3, section 3.2.1.2 (12dBd) for fixed reception, section 3.2.2.3. (0dBd) for portable reception and section 3.2.2.6 (0dBd) for mobile reception.
- Wanted signal to be protected is much lower for the case of fixed reception at the edge of coverage. CEPT report 21, section 3.1.1.2, states that ‘three RPCs were assumed for DVB-T planning: RPC 1 for fixed re-ception, RPC 2 for portable outdoor or mobile reception, RPC 3 for portable indoor reception. The refer-ence values for minimum median field strengths assumed in the development of the GE06 Plan are given in Table 1. It can be noted that RPC 3 reference field strength is 32 dB above the reference field strength as-sumed for RPC 1’. On the other hand, the wanted field strength needed for portable reception is lower for single frequency networks (SFN), due to the SFN gain, than provided in the above mentioned CEPT Re-port. This SFN gain has almost no impact for fixed reception, due to receiving antenna directivity.
It was recognised that the potential interference into the various reception modes can in practice require individual assessments to be made on a local basis. Thus, complementary studies were performed to assess the interference from ECN BS into portable reception (see Annex 2 for further details) at the coverage edge of each reception mode, based on exactly the same methodology as chosen for the interference assessment in the case of fixed reception.
Two approaches are proposed for the derivation of BEM for ECN BS:
- The first one is based on a static analysis, which does not take into account any statistical effect. Its aim is to derive the percentage of interfered areas around an ECN BS transmitting an interfering signal similar to that used for deriving protection ratios in ECC Report 138 [12].
- The second one is based on Monte-Carlo simulations and leads to the determination of BEM for ECN BS. Simulations over a range of scenarios indicate that the fraction of locations in which a TV receiver may suffer unacceptable levels of interference (failure rate) does not improve significantly with a reduction in the ECN BS BEM baseline below 0 dBm/(8 MHz), based on typical measured values for ACS and on a range of high EIRP of the base station (59 dBm/10MHz). However, for lower EIRP levels, this fraction of locations in which a TV receiver may suffer unacceptable levels of interference (failure rate) shows sig-nificant improvement with a reduction in the ECN BS BEM baseline.
The details of these studies are contained in the Annex 1.
The different set of studies realised show that the impact of interference can not be arbitrarily reduced through a reduction of the BS out-of-block (OoB) emission alone due to finite TV receiver selectivity. Therefore, other mitiga-tion mechanisms (beyond the BEM baseline level) would ultimately be required at a national level if the protection delivered by the BEM only is considered insufficient by an administration, e.g. by means of additional measures at national level in order to solve the remaining interference cases5 .
Some elements are contained in Annex 4 in order to provide guidance to administrations on the relevant mitigation techniques.
This conclusion is valid for situations where the first ECN adjacent channel to a DTT channel is used. In that case, the MCL analysis gives an idea of the extent of this interfered area located around each ECN base station. It has also to be noted that a baseline of 0 dBm/8 MHz may result in a significant constraint for ECN base station when the TV channel is adjacent to the ECN block (e.g. in the case of channel 60) and that it may not be necessary in areas where frequency offset between DTT channel and ECN channels is higher. On the other hand, it was also noted that broad-
5 For instance, OFCOM has launched in 2008 a public consultation suggesting a proposal to introduce a protection of existing DTT services clause within the set of technical conditions in all licences [13].

CEPT REPORT 30 Page 18
casting planning may evolve and that a channel not used in an area may be used in the future, after deployment of ECN base stations.
Therefore, it can be suggested that, in the case of the implementation of the full sub-band 790-862 MHz for ECN networks, OOB BEM for base station would be as follows:
Case Frequency range
of out-of-block emissions
Condition on base station in-block E.I.R.P., P (dBm/10MHz)
Maximum mean out-of-block EIRP
Measurement bandwidth
P 59 dBm 0 dBm 8 MHz
36 dBm P < 59 dBm P-59 dB 8 MHz A For DTT frequencies where
broadcasting is protected P < 36 dBm - 23 dBm 8 MHz
P 59 dBm 10 dBm 8 MHz
36 dBm P < 59 dBm P-49 dB 8 MHz B For DTT frequencies where broadcasting is subject to an
intermediate level of protection P < 36 dBm -13 dBm 8 MHz
C For DTT frequencies where broadcasting is not protected
No condition 22 dBm 8 MHz
Table 9: Baseline requirements – BS BEM out-of-block EIRP limits over frequencies occupied by broadcast-ing
The three different cases A, B, and C listed in the table above can be applied on a per-channel and/or per-region basis, i.e. for the same channel different cases can be applied in different geographic areas (e.g. area related to DTT coverage) and different cases can be applied to different channels in the same geographic area. For the protection of terrestrial broadcasting channels in use at the time of deployment of MFCNs, baseline requirement mentioned in situation “A” shall be applied. For DTT channels which are not in use when implementing ECN base station, an administration can choose between the baseline requirements mentioned in situations “A”, “B” or “C”. The interme-diate level of protection in situation “B” can be justified in some circumstances (e.g. agreement between broadcast-ing authority and mobile operators). Illustrative examples can be found in section 6.6.4.
ii) BEM for ECN Terminal Stations
For the determination of BEM for ECN Terminal stations at the adjacency with broadcasting, two different scenar-ios are considered, dealing with the interference from TS into broadcasting fixed reception and portable reception respectively.
It should be noted that, given that the impact of interference from terminal stations to DTT TV reception can not be arbitrarily reduced below a lower-bound dictated by TV receiver selectivity, the deployment of appropriate mitiga-tion measures to protect DTT services below 790 MHz may be required on a national basis for the appropriate pro-tection of incumbent DTT services.
Information on potential mitigation measures is provided in Annex 3.
- Impact from ECN TS into fixed broadcasting reception:
The study contains a MCL analysis for the derivation of the TS out-of-block baseline level, and complementary MCL and Monte-Carlo analyses to estimate the percentage of locations within the DTT coverage area where TV receivers would suffer an unacceptable level of interference, given the calculated TS BEM out-of-block baseline level. Details of the study can be found in Annex 3.
The conclusion of this study is that a terminal station BEM out-of-block (baseline) limit of -50 dBm/(8 MHz) for frequencies below 790 MHz is necessary to protect fixed DTT reception.
- Impact from ECN TS into portable broadcasting reception:
The study contains a MCL analysis for the derivation of the TS out-of-block baseline level, and complementary Monte-Carlo analyses to estimate the percentage of locations within the DTT coverage area where portable TV receivers would suffer an unacceptable level of interference, given the calculated TS BEM out-of-block baseline level. Details of the study can be found in Annex 3.
The conclusion of this study is that a terminal station BEM out-of-block (baseline) limit of -65 dBm/(8 MHz) for frequencies below 790 MHz is necessary to protect portable DTT reception.
CEPT REPORT 30 Page 19
6.2.1.2 Interference from ECN into ARNS
Regarding ARNS, it is proposed to determine the coexistence conditions related to cases A and B (compatibility between ECN and ARNS operating in adjacent frequencies in the same geographical area) at a national level.
6.2.1.3 Interference from ECN into PMSE
The issue of interference from FDD electronic communications network (ECN) equipment to PMSE equipment operating in the FDD duplex gap of the 790-862 MHz digital dividend band-plan is considered in this section. This is also valid for PMSE devices deployed in the guard band of a TDD band plan. The results of the studies on the protection distances between ECN and PMSE equipment required for the operation of PMSE equipment in the FDD duplex gap shown that, with the exception of the upper 1 MHz and the lower 200 kHz of the FDD duplex gap where the required protection distances may be considered prohibitive for certain applications, the operation of radio mi-crophones in the FDD duplex gap would generally not be constrained as a result of interference from ECN equip-ment.
Further details of this analysis are presented in Annex 5.
6.2.2 ECN as victim
6.2.2.1 Interference from terrestrial broadcasting into ECN
Considering the protection of fixed/mobile services from the digital terrestrial broadcasting service on an adjacent channel (Cases A and B) it has been found in the course of studies for CEPT Reports 22 and 23 that:
(i) A sufficient frequency separation between the digital terrestrial broadcasting service and fixed/mobile FDD uplink and TDD is needed in order not to exceed the out of band blocking level of a fixed/mobile base sta-tion.
For a TDD channelling plan, a guard band of 7 MHz is needed for the protection of broadcasting. However, in the case of the preferred FDD channel arrangements, there is unlikely to be a problem due to the frequency separation resulting from the channel plan between DTT and the FDD up-link.
For Administrations which cannot implement the preferred harmonized channelling arrangement, if the broadcasting service is deployed within the frequencies 832-862 MHz, the frequency separation between broadcasting and FDD UL should be calculated in order to evaluate the feasibility of implementing FDD UL.
(ii) The impact of the digital terrestrial broadcasting service on fixed/mobile downlink capacity in adjacent chan-nel would be negligible where transmitters are co-located, even without a guard band. When transmitters are not co-located the frequency separation required between a DVB-T channel and a mobile downlink channel to minimize the impact of loss of capacity has not yet been precisely determined.
6.2.2.2 Interference from ARNS into ECN
Regarding ARNS, it is proposed to determine the coexistence conditions related to cases A and B (compatibility between ECN and ARNS operating in adjacent frequencies in the same geographical area) at a national level.
6.2.2.3 Interference from low power applications such as PMSE into ECN
While the analysis performed in Annex 5 is specifically developed in the context of the use of the FDD duplex gap by low power applications such as PMSE, the results also apply to the use by these applications of any guard-band between ECN and DTT in a TDD-only band-plan for the 790-862 MHz digital dividend spectrum. This would, however, be with the understanding that the susceptibility to interference of the relevant TDD base stations (BSs) and terminal stations (TSs) would not exceed those of their FDD counterparts as presented in this document.
Further details of this analysis are given in Annex 5.
These requirements can be considered as the least restrictive technical conditions to be fulfilled by low power appli-cations such as PMSE deployed in the interleaved spectrum adjacent to ECN block (e.g. FDD duplex gap or guard band in a TDD band plan).
It is highlighted that the following separation distances have been used in the derivation of BEM for PMSE and low power applications BS/TS:
a) 15 m between PMSE and ECN TS
CEPT REPORT 30 Page 20
b) 60 m between PMSE and ECN BS
c) 50 m between low power applications BS and ECN BS
d) 10 m between low power applications BS and ECN TS.
6.3 Stage 3: Compatibility between ECNs in the 790-862 MHz band and in-band non-ECNs in geographi-cally adjacent areas
6.3.1 Terrestrial broadcasting as non-ECN
This case is the subject of a separate deliverable (CEPT Report 29 [1]), which provides guidelines on cross border coordination issues between mobile services in one country and broadcasting services in another country.
Concerning the compatibility scenarios addressing overlapping frequencies in adjacent areas, it is possible to obtain, on the basis of ITU-R Recommendation BT.1368 [11], the equation to be used to derive the values of maximum interfering power flux density for fixed/mobile services to limit co-channel interference into the digital terrestrial broadcasting service. It is noted that these scenarios are also addressed in the cross-border coordination between neighbouring administrations. CEPT Report 29 [1] contains guidelines on cross-border coordination which may therefore be also of interest for administrations facing such compatibility scenarios.
Attention should be given to the case of compatibility between IMT in one country and broadcasting in another country (possibly a non-EU country) where both countries are party to the GE-06 Agreement.
Whilst the procedure to identify potentially affected administrations is given in the GE-06 Agreement, the method to perform the bi-lateral or multi-lateral coordination discussions is not defined. In this context, the CEPT Report 29 includes elements to determine the interfering field strength taking into account the protection ratio applicable to the coordination scenario and the planning field strength of the broadcasting service. It should also be noted that appro-priate values for protection ratios may be found from the ECC Report 138 [12] currently under development.
It is also worth noting that this issue of compatibility between broadcasting and the mobile service in the 790-862 MHz in neighbouring countries is addressed in the context of WRC-12 Agenda Item 1.17.
6.3.2 ARNS as non-ECN
Sharing studies between IMT and ARNS are carried out within CEPT with respect to WRC-12 AI 1.17. The final sharing conditions will be adopted at WRC-12. It is likely that this will lead to methods for coordination which will be applicable to this case.
6.4 Stage 4: Compatibility between ECNs and out-of-block ECNs in the 790-862 MHz band in the same geographical area
6.4.1 BEM baseline requirement for Base Stations
The derivation of block-edge mask (BEM) out-of-block baseline levels for BS is based on the translation of the results previously derived for the 2.6 GHz band as documented in CEPT Report 19. This is developed in the context of base-to-base (BS-BS) interference. Such interference may occur, for example, at frequency boundaries between operators of unsynchronised TDD ECNs in the 790-862 MHz band.
For a given spatial separation, BS-BS interference is most severe where transmission powers are high, where the respective antennas have high gains and are within line-of-sight of each other, and where radio propagation condi-tions approach those of free space. This is likely to be the case for wide-area (macro-cellular) base stations with high antenna placements, resulting in the worst-case geometry depicted in Figure 2.

CEPT REPORT 30 Page 21
GTilt
GAGTilt
GPL PTx EIRPx
PRx GA
Separation distance 100 m
Figure 2: Base-to-base interference scenario
Clearly, a requirement for large coordination distances can result in excessive coordination overheads and ineffi-ciencies in network deployment. In accordance with the assumptions in CEPT Report 19 [6], the BS BEM baseline level is computed for a line-of-sight base-to-base separation distance of 100 metres, and for a 1 dB desensitisation of the victim BS.
For line-of-sight base station separations of less then 100 metres, some form of cooperation between the licensees may be required. This might involve a judicious choice of carrier frequencies and/or antenna orientations, or some other form of mitigation.
The requirements that must be met in order to avoid the need for coordination at separations of 100 metres (and beyond) can be considered with reference to the adjacent-channel interference ratio6 (ACIR). With reference to Figure 3, a minimum coupling loss analysis indicates that an ACIR of no less than 107 dB is required in order for potentially interfering base stations to operate without the need for coordination at a line-of-sight separation of 100 metres. This can be seen by noting that (in the logarithmic domain),
dB, 5.107
)65.99()15371364(
)INR()EIRP(
ACIR
NATiltPLTiltx
IRx
P+ G+ G+ G+ G
PP
where RxP is the received adjacent-channel interferer power, IP is the “experienced” interference power at the re-ceiver, xEIRP = 64 dBm/(10 MHz) is the interfering base station’s in-block mean EIRP (see CEPT Report 19),
TiltG = -3 dB represents loss due to antenna tilt at each of the transmitter and receiver, PLG = -71 dB is free-space mean path gain7 for a separation of 100 metres at a nominal frequency of 820 MHz, AG = 15 dBi is the re-ceiver antenna gain, NP = -99.5 dBm/(10 MHz) is the receiver noise floor8 (for a nominal receiver bandwidth of 9 MHz and noise figure of 5 dB), and finally, INR = -6 dB is the interference-to-noise ratio for a 1 dB receiver de-sensitization. Note that a 1 dB desensitization implies an experienced interference power of -105.5 dBm/(10 MHz).
The required ACIR of 107.5 dB can be achieved through various combinations of transmitter adjacent-channel leak-age ratio (ACLR) and receiver adjacent-channel selectivity (ACS)9. The possible trade-offs between ACLR and ACS are illustrated in Figure 3 for an ACIR of 107.5 dB.
Subject to the constraint that the interferer’s ACLR and the victim’s ACS be equal (i.e., that the burden of protection from interference is placed equally on the interferer and victim BSs), it follows that we require ACS = ACLR = 110.5 dB in order to realise an ACIR of 107.5 dB.
6 The ACIR is defined as the ratio of the power of an adjacent-channel interferer as received at the victim, divided by the interference power “experienced” by the victim receiver as a result of both transmitter and receiver imperfections.
7 Path loss is -147.56 + 20 log10(f) + 20 log10(d) dB where d is separation in metres, and f is frequency in Hz. 8 Equal to kTB.NF, where k is Boltzmann’s constant, T is the ambient temperature, B is the noise-equivalent bandwidth, and NF is the noise
figure. 9 The ACLR of a signal is defined as the ratio of the signal’s power divided by the power of the signal when measured at the output of a
(nominally rectangular) receiver filter centred on an adjacent frequency channel. The ACS of a receiver is defined as the ratio of the re-ceiver’s filter attenuation over its passband divided by the receiver’s filter attenuation over an adjacent frequency channel. It can be readily shown that ACIR1 = ACLR1+ ACS1.

CEPT REPORT 30 Page 22
Figure 3: Victim receiver ACS vs. interferer transmitter ACLR for an ACIR of 107.5 dB
Given an interferer ACLR of 110.5 dB, the corresponding BS BEM baseline level, BLBS,P , may be computed as
),dBm/(10MHz 5.465.11064ACLREIRP xBLBS, P
where xEIRP is the base station in-block EIRP.
The implementation of filters at the BS transmitters and receivers for the mitigation of BS-BS interference should be readily possible, given the requirement for a 10 MHz guard-band (see section 6.4.2 on BEM for Terminal Stations) for the mitigation of TS-TS interference at the affected frequency boundaries.
6.4.2 BEM for Terminal Stations
6.4.2.1 Derivation of BEM out-of-block baseline level for TS
The derivation of block-edge mask (BEM) out-of-block baseline levels for TS is based on the translation of the results previously derived for the 2.6 GHz band as documented in ECC Report 131 [7]. This is developed in the context of terminal-to-terminal (TS-TS) interference. Such interference may occur, for example, at frequency boundaries between operators of unsynchronised TDD ECNs in the 790-862 MHz band.
Figure 4 depicts a scenario involving adjacent-channel interference from TS to other TS in its near vicinity.
BS -Operator A BS-Operator B
Wantedsignal
TS-TSinterference
TSTS
BS -Operator A BS-Operator B
Wantedsignal
TS-TSinterference
TSTS
Figure 4: Terminal-to-terminal interference scenario
The TS BEM baseline level for the 2.6 GHz band was calculated in ECC Report 131 through a study of the statistics of the out-of-block EIRP level, OOBP , of an interfering TS located in the vicinity of a victim TS in a densely popu-lated hot-spot.
It was concluded that, where the probability of collisions between victim and interferer packets can be taken into account (as among packet-based mobile broadband systems), a BEM baseline level of -15.5 dBm/(5 MHz) can be

CEPT REPORT 30 Page 23
justified10. Where the probability of collisions between victim and interferer packets can not be taken into account, the corresponding BEM baseline level was calculated as -27 dBm/(5 MHz).
In the course of the studies, it has been demonstrated that the above results can be translated to the 790-862 MHz
band, by simply accounting for the reduced radio propagation path loss in comparison with that in the 2.6 GHz band.
Specifically, given similar TS deployment geometries as envisaged in the 2.6 GHz band, and given that mean path-
loss between two TSs increases with the square of the operating frequency11, one may conclude that the TS BEM
baseline level, )( 0BLTS, fP , at an operating frequency of f0 MHz may be written (in the logarithmic domain) as
2600log 20GHz) (2.6 )( 0
10BLTS,0BLTS,
fPfP ,
where GHz) (2.6BLTS,P = -15.5 dBm/(5 MHz) where the probability of collisions between victim and interferer
packets can be taken into account.
So, for a nominal operating frequency of 820 MHz, we have
MHz). dBm/(5 25.5
2600
820log 205.15 MHz) (820 10BLTS,
P
Similarly, where the probability of collisions between victim and interferer packets can not be taken into account, the TS BEM baseline level is
MHz). dBm/(5 37
2600
820log 2027 MHz) (820 10BLTS,
P
In short, due to the reduced coupling loss at lower frequencies (and with all else being equal), the TS BEM baseline level appropriate for the mitigation of TS-TS interference in the 790-860 MHz band is roughly 10 dB more stringent than that in the 2.6 GHz band.
6.4.2.2 Considerations related to the implementation of the baseline level
It is informative to understand the frequency offset from the channel edge for which a typical FDD or TDD TS is likely to be able to meet the calculated TS BEM baseline level of –22.5 dBm/(10 MHz).
Figure 5 shows the simulated emission masks of a LTE TS for a 10 MHz channel bandwidth12. The green curve illustrates the scenario where the TS transmitter utilises all the available 50 radio blocks. As can be seen from the figure, the LTE TS emission mask complies with the calculated BEM baseline of -22.5 dBm/(10 MHz) over a 10 MHz bandwidth starting at a frequency offset of 10 MHz from the LTE channel-edge.
This suggests, for example, that an edge to edge frequency separation of 10 MHz may be needed by an LTE (10 MHz) device in order to comply with that baseline level at frequency boundaries where there is a potential for TS-TS interference.
10 This BEM baseline level is calculated based on the probability of collision between wanted packets and interferer packets at the victim receiver assuming a TDD uplink to downlink ratio of 1. Data destined for a receiver is assumed to be transmitted within a single packet of 2.5 ms duration over an interval of 20 ms (i.e., an activity factor of 12.5%).
11 For example, note that free-space path loss is given by -147.56 + 20 log10(f) + 20 log10(d) dB, where d is separation in metres and f is fre-quency in Hz.
12 R4-070382-Ericsson, 3GPP TSG RAN WG4 (Radio) Meeting #42bis, Sophia Antipolis, France, 2–4 April 2007.

CEPT REPORT 30 Page 24
10 MHZ RF bandwidth
SE
M [
dB
c/100
kH
z]
-10
-20
-30
-40
-50
-60
-70
-80
-90
-100
-110
0
-10
-20
-30
-40
-50
-60
-70
-80
-90
-100
-110
0
WCDMAmask
LTE mask
Adjacent ChannelException level
Baseline level(-48 dBm/30 kHz)
Interferer LTE TS(50 RB)
10 MHzGuard band
LTE mask
10 MHzchannel
bandwidth
Average powerof the interferer’s
emission integratedwithin the victim’s receiver channel
= -49 dBm/(30 kHz)
Spectrum emissionof LTE TS (1 RB)
VictimLTE TS
-44
-58
Figure 5: Emission mask of a LTE TS (10 MHz channel bandwidth)
Note that the TS BEM baseline of -22.5 dBm/(10 MHz) is shown as -47.7 dBm/(30 kHz).
6.5 Stage 5: Compatibility between ECNs in the 790-862 MHz band and co-frequency ECNs in a geo-graphically adjacent area
The key element in this scenario is the field strength level developed at the border of the geographical neighbouring ECNs. There may be a need to consider sub-scenarios, whether the considered blocks are TDD or FDD. In particu-lar, the scenarios where one block is TDD and the geographically separated block is FDD would require special care. Appropriate field strength values may be agreed between concerned parties.
One of the main cases belonging to this scenario relates with cross-border coordination between two or more ad-ministrations, where alternative methods may be used such as code coordination or preferential channels. It is ex-pected that specific recommendation applicable to cross-border coordination for ECN will be developed within CEPT in the 790-862 MHz band.
6.6 Stage 6: Analysis of the result and proposals for the BEM for ECN in the 790-862 MHz band
The technical conditions developed in this Report are based on a block-edge mask (BEM) approach. The BEM con-cept is defined in section 3.1.
A BEM is an emission mask that is defined, as a function of frequency, relative to the edge of a block of spectrum that is licensed to an operator. It consists of in-block and out-of-block components which specify the permitted emission levels over frequencies inside and outside the licensed block of spectrum respectively. The out-of-block component of the BEM itself consists of a baseline level and, where applicable, intermediate (transition) levels which describe the transition from the in-block level to the baseline level as a function of frequency.
Accordingly, the BEMs levels are built up by combining the values listed in the Tables below in such a way that the limit at any frequency is given by the highest (least stringent) value of a) the baseline requirements, b) the transition requirements and c) the in-block requirements (where appropriate).
The BEMs in the 790-862 MHz band are optimised for, but are not limited to, FDD and TDD mobile/fixed commu-nications networks (two-way). In addition, a number of technical conditions have also been derived for Programme Making and Special Events (PMSE) equipments and low-power applications in the FDD duplex gap or TDD guard band. Therefore, the BEMs are derived for base stations (BSs), terminal stations (TSs) and PMSE equipments.
The BEMs are presented as upper limits on the mean EIRP or TRP (total radiated power) over an averaging time interval, and over a measurement frequency bandwidth. In the time domain, the EIRP or TRP is averaged over the active portions of signal bursts and corresponds to a single power control setting. In the frequency domain, the EIRP or TRP is determined over the measurement bandwidth (e.g. block or TV channel) specified in the following tables. It should be noted that the actual measurement bandwidth of the measurement equipment used for purposes of com-pliance testing may be smaller than the measurement bandwidth provided in the tables.
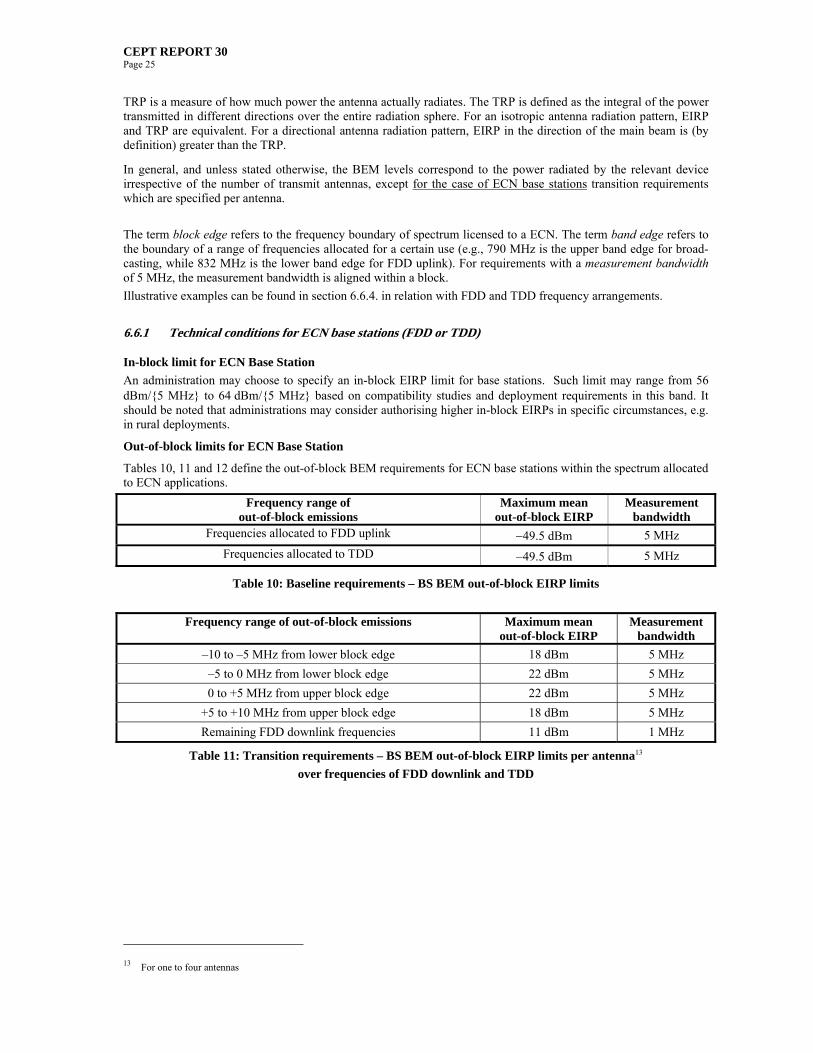
CEPT REPORT 30 Page 25
TRP is a measure of how much power the antenna actually radiates. The TRP is defined as the integral of the power transmitted in different directions over the entire radiation sphere. For an isotropic antenna radiation pattern, EIRP and TRP are equivalent. For a directional antenna radiation pattern, EIRP in the direction of the main beam is (by definition) greater than the TRP.
In general, and unless stated otherwise, the BEM levels correspond to the power radiated by the relevant device irrespective of the number of transmit antennas, except for the case of ECN base stations transition requirements which are specified per antenna.
The term block edge refers to the frequency boundary of spectrum licensed to a ECN. The term band edge refers to the boundary of a range of frequencies allocated for a certain use (e.g., 790 MHz is the upper band edge for broad-casting, while 832 MHz is the lower band edge for FDD uplink). For requirements with a measurement bandwidth of 5 MHz, the measurement bandwidth is aligned within a block.
Illustrative examples can be found in section 6.6.4. in relation with FDD and TDD frequency arrangements.
6.6.1 Technical conditions for ECN base stations (FDD or TDD)
In-block limit for ECN Base Station
An administration may choose to specify an in-block EIRP limit for base stations. Such limit may range from 56 dBm/{5 MHz} to 64dBm/{5 MHz} based on compatibility studies and deployment requirements in this band. It should be noted that administrations may consider authorising higher in-block EIRPs in specific circumstances, e.g. in rural deployments.
Out-of-block limits for ECN Base Station
Tables 10, 11 and 12 define the out-of-block BEM requirements for ECN base stations within the spectrum allocated to ECN applications.
Frequency range of out-of-block emissions
Maximum mean out-of-block EIRP
Measurement bandwidth
Frequencies allocated to FDD uplink 49.5 dBm 5 MHz
Frequencies allocated to TDD 49.5 dBm 5 MHz
Table 10: Baseline requirements – BS BEM out-of-block EIRP limits
Frequency range of out-of-block emissions Maximum mean out-of-block EIRP
Measurement bandwidth
–10 to –5 MHz from lower block edge 18 dBm 5 MHz
–5 to 0 MHz from lower block edge 22 dBm 5 MHz
0 to +5 MHz from upper block edge 22 dBm 5 MHz
+5 to +10 MHz from upper block edge 18 dBm 5 MHz
Remaining FDD downlink frequencies 11 dBm 1 MHz
Table 11: Transition requirements – BS BEM out-of-block EIRP limits per antenna13
over frequencies of FDD downlink and TDD
13 For one to four antennas

CEPT REPORT 30 Page 26
Frequency range of out-of-block emissions
Maximum mean out-of-block EIRP
Measurement bandwidth
Guard band between broadcasting band edge and FDD downlink band edge
17.4 dBm 1 MHz
Guard band between broadcasting band edge and TDD band edge 15 dBm 1 MHz
Guard band between FDD downlink band edge and FDD uplink band edge (duplex gap)
15 dBm 1 MHz
Guard band between FDD downlink band edge and TDD band edge
15 dBm 1 MHz
Guard band between FDD uplink band edge and TDD band edge
15 dBm 1 MHz
Table 12: Transition requirements – BS BEM out-of-block EIRP limits per antenna14 over frequencies (e.g. above 790 MHz) used as guard band
Table 13 defines the out-of-block BEM baseline requirements for ECN base stations within the spectrum allocated to the broadcasting (DTT) service.
Case
Frequency range
of out-of-block emissions
Condition on base sta-tion in-block EIRP, P
dBm/{10 MHz}
Maximum mean out-of-block
EIRP
Measurement bandwidth
P 59 0 dBm 8 MHz 36 P < 59 (P-59) dBm 8 MHz A
For DTT frequencies where broadcasting is protected
P < 36 - 23 dBm 8 MHz P 59 10 dBm 8 MHz
36 P < 59 (P-49) dBm 8 MHz B For DTT frequencies where
broadcasting is subject to an intermedi-ate level of protection P < 36 -13 dBm 8 MHz
C For DTT frequencies where broadcasting
is not protected No conditions 22 dBm 8 MHz
Table 13: Baseline requirements – BS BEM out-of-block EIRP limits over frequencies occupied by broad-casting
The three different cases A, B, and C listed in Table 4 can be applied on a per-channel and/or per-region basis, i.e. for the same channel different cases can be applied in different geographic areas (e.g. area related to DTT coverage) and different cases can be applied to different channels in the same geographic area.
For the protection of digital terrestrial broadcasting channels in use at the time of deployment of MFCNs , the base-line requirement in case A shall be applied. In circumstances where the relevant broadcasting channels are not in use at the time of deployment of ECN, an administration may choose between the baseline requirements in cases A, B and C. An administration may choose baseline requirement in case A where it intends to bring the relevant broad-casting channels into use in the foreseeable future, and the administration wishes to provide these with the same level of protection as other broadcasting channels already in use. The baseline requirement in case B may be used where an administration wishes to reserve the option of bringing the relevant broadcasting channels into use at a future date, but can accept a lower level of protection for these channels. Baseline requirement in case C may be used where an administration does not intend to bring the relevant broadcasting channels into use.
Other baseline requirements can be applied in specific circumstances subject to agreements between the broadcast-ing authority, ECN operators and the administration if required. Illustrative examples can be found in section 6.6.4.
6.6.2 Technical conditions for ECN FDD or TDD terminal stations
In Tables 14 to 18, the power limits are specified as EIRP for TS designed to be fixed or installed and as TRP for the TS designed to be mobile or nomadic. Note that EIRP and TRP are equivalent for isotropic antennas.
In-block requirements for all terminal stations
Table 14 defines the maximum value of the in-block emission level for FDD or TDD terminal stations (TS). Ad-ministrations may relax this limit in certain situations, for example fixed TS in rural areas, providing that protection of other services, networks and applications is not compromised and cross-border obligations are fulfilled.

CEPT REPORT 30 Page 27
Maximum mean in-block power 23 dBm14
Table 14: FDD or TDD TS in-block emission limit
Out-of-band requirements for terminal stations
The requirements given in this section apply without prejudice to spurious emission requirements (which continue to apply). This document does not address spurious emission levels; this is the responsibility of the standards develop-ment organisations (SDOs)15. The technical conditions for these terminals are defined relative to the channel edge to enable them to be taken into account by the SDOs.
The term channel edge refers to the lowest and highest frequency of the occupied bandwidth.
Out-of-band requirements for FDD terminal stations for the preferred harmonised frequency ar-rangement
Table 15 defines the maximum value of the out-of-band emission level for FDD TS for the preferred harmonised frequency arrangement.
Frequency range of out-of-band emissions Maximum mean out-of-band power
Measurement bandwidth
Below 790 MHz -65dBm* 8 MHz
790 to791 MHz -44 dBm 1 MHz
791to821 MHz -37 dBm 5 MHz
821 to 822 MHz -13 dBm 1 MHz
822 MHz to –5 MHz from FDD uplink lower channel edge -6 dBm 5 MHz
–5 to 0 MHz from FDD uplink lower channel edge 1.6 dBm 5 MHz
0 to +5 MHz from FDD uplink upper channel edge 1.6 dBm 5 MHz
+5 MHz from FDD uplink upper channel edge to 862 MHz -6 dBm 5 MHz
Table 15: Out-of-band requirements for FDD TS
* Full duplex FDD terminal stations designed to operate in the preferred harmonised FDD channelling arrangement are expected to be inherently compliant with this out-of-band emission level.
Out-of-band requirements for other FDD terminal stations and for TDD terminal stations
Tables 16 to 18 define the out-of-band requirements for FDD and TDD terminal stations, except FDD terminal stations for the preferred harmonised frequency arrangement.
Frequency range of out-of-band emissions
Maximum mean out-of-band power
Measurement bandwidth
Frequencies allocated to FDD downlink -37 dBm 5 MHz
Table 16: Out-of-band requirements for TS over frequencies of the FDD downlink
14 It is recognised that this value is subject to a tolerance of up to +2dB, to take account of operation under extreme environ-mental conditions and production spread.
15 The CEPT recommended spurious emission limits given in ERC Recommendation 74-01.
CEPT REPORT 30 Page 28
Frequency range of out-of-band emissions Maximum mean out-of-band power
Measurement bandwidth
–10 to –5 MHz from lower channel edge -6 dBm 5 MHz
–5 to 0 MHz from lower channel edge 1.6 dBm 5 MHz
0 to +5 MHz from channel edge 1.6 dBm 5 MHz
+5 to +10 MHz from channel edge -6 dBm 5 MHz
Remaining TDD frequencies -37 dBm 5 MHz
Remaining FDD uplink frequencies -13 dBm 1 MHz
Frequencies allocated to broadcasting -65 dBm 8 MHz
Table 17: Out-of-band requirements for TS over frequencies of the TDD and FDD uplink and broadcasting frequencies
Frequency range of
out-of-band emissions
Maximum mean out-of-band power
Measurement bandwidth
Guard band between broadcasting band edge and FDD downlink band edge
–44 dBm 1 MHz
Guard band between broadcasting band edge and TDD band edge –5.4 dBm 1 MHz
Guard band between FDD downlink band edge and FDD uplink band edge (duplex gap)
–5.4 dBm 1 MHz
Guard band between FDD downlink band edge and TDD band edge –5.4 dBm 1 MHz
Guard band between FDD uplink band edge and TDD band edge –5.4 dBm 1 MHz
Table 18: Out-of-band requirements for TS over frequencies used as guard band
6.6.3 Technical conditions for PMSE and low-power (LP) applications within the duplex gap of the FDD frequency arrangement or the guard band of the TDD frequency arrangement
PMSE devices (channel bandwidth 200 kHz) and low-power (LP) applications (channel bandwidth 5 MHz) are allowed on a non-protected, non-interfering basis within the duplex gap of a FDD frequency arrangement. PMSE devices (channel bandwidth 200 kHz) are also allowed on a non-protected, non-interfering basis within the guard band of a TDD frequency arrangement.
The technical conditions in this section can be relaxed at a national level subject to specific restrictions (e.g., mini-mum spatial distance between interferer and victim), or where it is judged that no material interference would arise.
In Tables 19, 20, 23 and 24, the power limits are specified as TRP for PMSE equipment and TS. Note that EIRP and TRP are equivalent for isotropic antennas.
- Technical conditions for PMSE equipment
Table 19 defines the maximum permitted in-band emission level for PMSE equipment operating within the duplex gap of the FDD frequency arrangement or within the guard band of the TDD frequency arrangement.

CEPT REPORT 30 Page 29
Frequency range of in-block emissions Maximum mean in-block TRP
+5 MHz from FDD downlink upper band edge to FDD uplink lower band edge From broadcasting upper band edge to -5 MHz from TDD lower band edge From +5 MHz from TDD upper band edge to broadcasting lower band edge
20 dBm
+2 to +5 MHz from FDD downlink upper band edge
-5 to -2 MHz from TDD lower band edge
+2 to +5 MHz from TDD upper band edge
13 dBm handheld terminals
20 dBm bodyworn terminals
Table 19: In-band requirements – PMSE equipment
Table 20 defines the out-of-band BEM requirements for PMSE equipment within the spectrum allocated to ECN.
Frequency range of out-of-band emissions
Maximum mean out-of-band TRP
Measurement bandwidth
Frequencies allocated to FDD downlink -43 dBm 5 MHz
0 to +2 MHz from FDD downlink upper band edge -20.6 dBm 2 MHz
Frequencies allocated to FDD uplink -25 dBm 5 MHz
-2 to 0 MHz from the TDD lower band edge -20.6 dBm 2 MHz
Frequencies allocated to TDD -43 dBm 5 MHz
0 to +2 MHz from TDD upper band edge -20.6 dBm 2 MHz
Table 20: Out-of-band requirements – PMSE equipment
- Technical conditions for low-power base stations
Table 21 defines the maximum permitted in-block EIRP for LP base stations operating within the duplex gap of the FDD frequency arrangement.
Frequency range of in-block emissions Maximum mean in-block EIRP
Measurement bandwidth
5 MHz from FDD downlink upper band edge to FDD uplink lower band edge
13dBm 5 MHz
Table 21: In-block requirements – LP base stations
Table 22 defines the out-of-band BEM requirements for LP base stations within the spectrum allocated to ECN and broadcasting.
Frequency range of out-of-band emissions
Maximum mean out-of-band EIRP
Measurement bandwidth
Frequencies allocated to FDD downlink -43dBm 5 MHz
0 to +5 MHz from FDD downlink upper band edge -9 dBm 5 MHz Frequencies allocated to FDD uplink -43 dBm 5 MHz
Frequencies allocated to TDD -43 dBm 5 MHz
Frequencies allocated to broadcasting -65 dBm 8 MHz
Table 22: Out-of-band requirements – LP base stations
The above BEM specifications for LP base stations have been derived based on a LP base station antenna height of 4 metres. Administrations who wish to authorise deployment of LP base stations with antenna heights that are greater than 4 metres may need to apply more restrictive BEM requirements.
- Technical conditions for low-power terminal stations
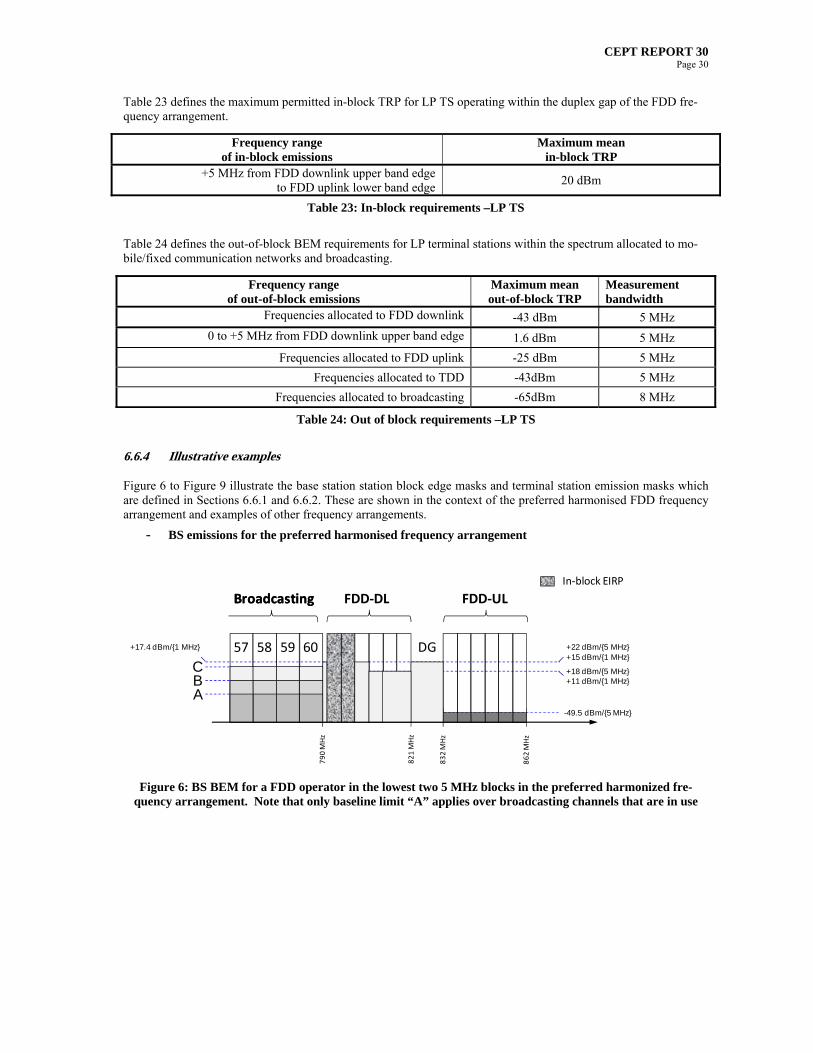
CEPT REPORT 30 Page 30
Table 23 defines the maximum permitted in-block TRP for LP TS operating within the duplex gap of the FDD fre-quency arrangement.
Frequency range of in-block emissions
Maximum mean in-block TRP
+5 MHz from FDD downlink upper band edge to FDD uplink lower band edge
20 dBm
Table 23: In-block requirements –LP TS
Table 24 defines the out-of-block BEM requirements for LP terminal stations within the spectrum allocated to mo-bile/fixed communication networks and broadcasting.
Frequency range of out-of-block emissions
Maximum mean out-of-block TRP
Measurement bandwidth
Frequencies allocated to FDD downlink -43 dBm 5 MHz
0 to +5 MHz from FDD downlink upper band edge 1.6 dBm 5 MHz
Frequencies allocated to FDD uplink -25 dBm 5 MHz
Frequencies allocated to TDD -43dBm 5 MHz
Frequencies allocated to broadcasting -65dBm 8 MHz
Table 24: Out of block requirements –LP TS
6.6.4 Illustrative examples
Figure 6 to Figure 9 illustrate the base station station block edge masks and terminal station emission masks which are defined in Sections 6.6.1 and 6.6.2. These are shown in the context of the preferred harmonised FDD frequency arrangement and examples of other frequency arrangements.
- BS emissions for the preferred harmonised frequency arrangement
-49.5 dBm/{5 MHz}
821 MHz
832 MHz
FDD‐ULFDD‐DLBroadcastingBroadcasting
+17.4 dBm/{1 MHz}
In‐block EIRP
60595857 DG
CBA
+15 dBm/{1 MHz}
+18 dBm/{5 MHz}+11 dBm/{1 MHz}
+22 dBm/{5 MHz}
790 MHz
862 MHz
Figure 6: BS BEM for a FDD operator in the lowest two 5 MHz blocks in the preferred harmonized fre-quency arrangement. Note that only baseline limit “A” applies over broadcasting channels that are in use
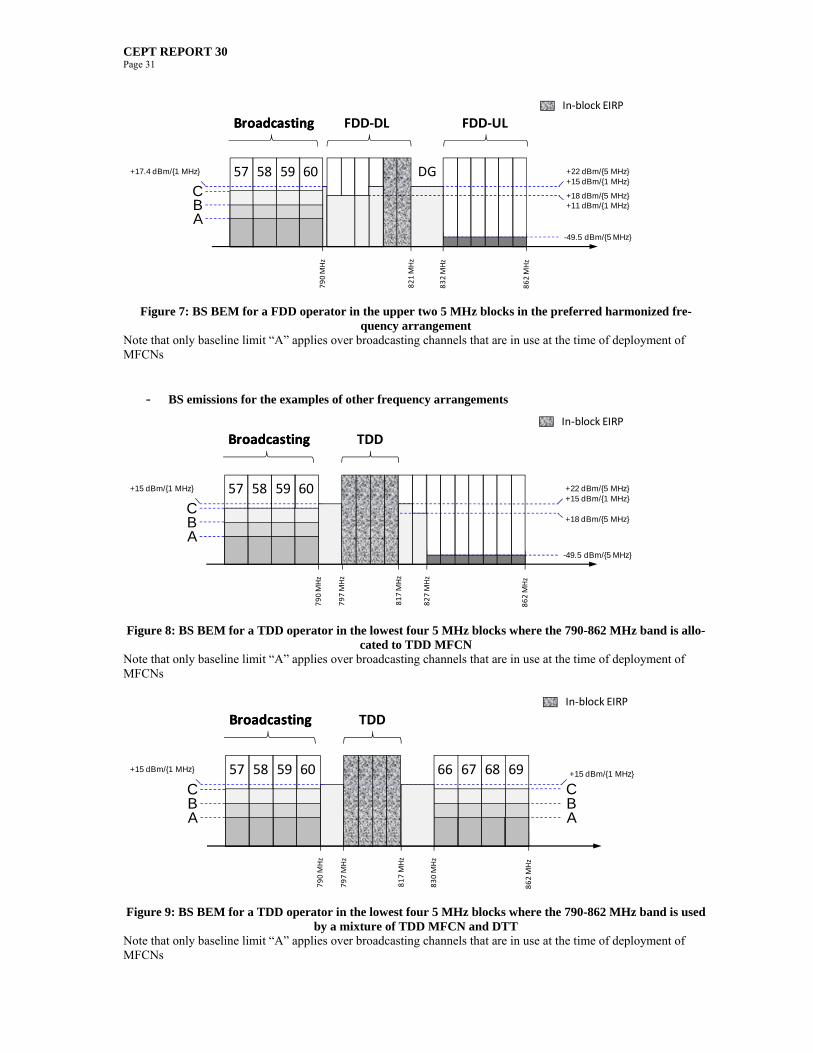
CEPT REPORT 30 Page 31
C+15 dBm/{1 MHz}
+18 dBm/{5 MHz}
-49.5 dBm/{5 MHz}
FDD‐ULFDD‐DLBroadcastingBroadcasting
+17.4 dBm/{1 MHz}
In‐block EIRP
60595857 DG
BA
+11 dBm/{1 MHz}
+22 dBm/{5 MHz}
821 MHz
832 MHz
790 MHz
862 MHz
Figure 7: BS BEM for a FDD operator in the upper two 5 MHz blocks in the preferred harmonized fre-quency arrangement
Note that only baseline limit “A” applies over broadcasting channels that are in use at the time of deployment of MFCNs
- BS emissions for the examples of other frequency arrangements
C+15 dBm/{1 MHz}
+18 dBm/{5 MHz}
-49.5 dBm/{5 MHz}
TDDBroadcastingBroadcasting
+15 dBm/{1 MHz}
In‐block EIRP
60595857
BA
+22 dBm/{5 MHz}
817 MHz
827 MHz
790 MHz
862 MHz
797 MHz
Figure 8: BS BEM for a TDD operator in the lowest four 5 MHz blocks where the 790-862 MHz band is allo-cated to TDD MFCN
Note that only baseline limit “A” applies over broadcasting channels that are in use at the time of deployment of MFCNs
C+15 dBm/{1 MHz}
TDDBroadcastingBroadcasting
+15 dBm/{1 MHz}
In‐block EIRP
60595857
BA
69686766
BA
C
817 MHz
830 MHz
790 MHz
862 MHz
797 MHz
Figure 9: BS BEM for a TDD operator in the lowest four 5 MHz blocks where the 790-862 MHz band is used by a mixture of TDD MFCN and DTT
Note that only baseline limit “A” applies over broadcasting channels that are in use at the time of deployment of MFCNs
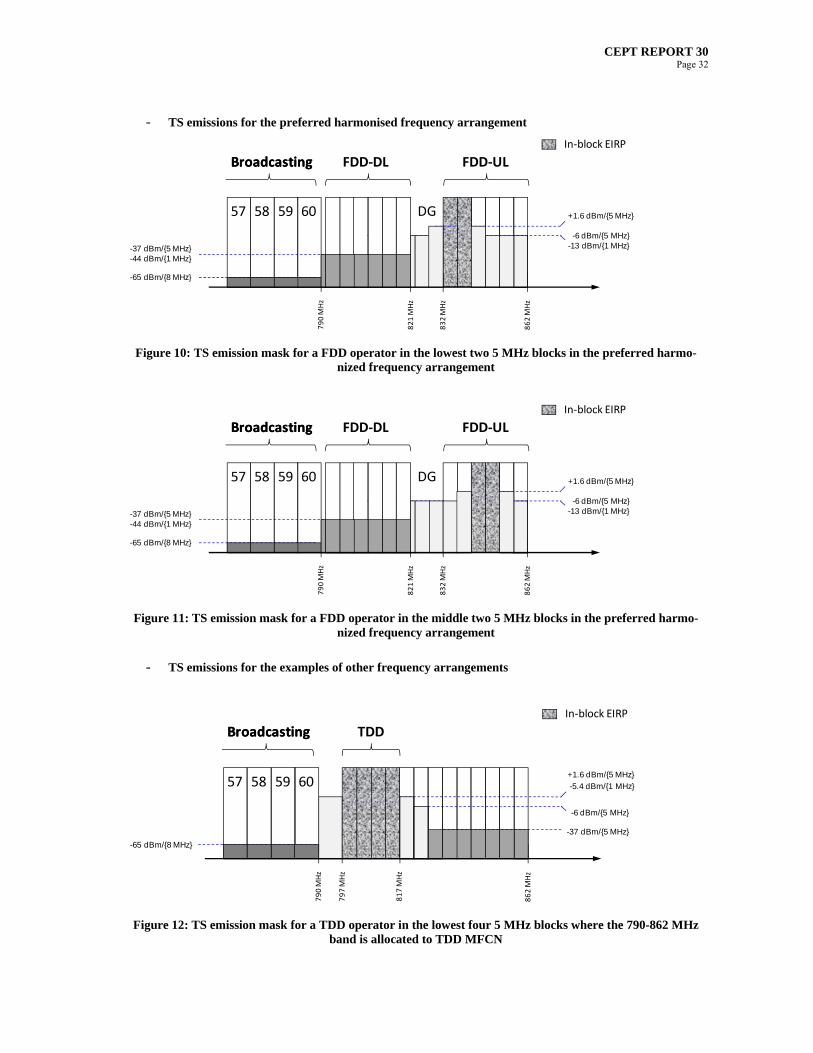
CEPT REPORT 30 Page 32
- TS emissions for the preferred harmonised frequency arrangement
821 MHz
832 MHz
FDD‐ULFDD‐DLBroadcastingBroadcasting
In‐block EIRP
60595857 DG
-6 dBm/{5 MHz}-13 dBm/{1 MHz}
+1.6 dBm/{5 MHz}
-65 dBm/{8 MHz}
-37 dBm/{5 MHz}-44 dBm/{1 MHz}
790 MHz
862 MHz
Figure 10: TS emission mask for a FDD operator in the lowest two 5 MHz blocks in the preferred harmo-nized frequency arrangement
821 MHz
832 MHz
FDD‐ULFDD‐DLBroadcastingBroadcasting
In‐block EIRP
60595857 DG
-6 dBm/{5 MHz}-13 dBm/{1 MHz}
+1.6 dBm/{5 MHz}
-65 dBm/{8 MHz}
-37 dBm/{5 MHz}-44 dBm/{1 MHz}
790 MHz
862 MHz
Figure 11: TS emission mask for a FDD operator in the middle two 5 MHz blocks in the preferred harmo-nized frequency arrangement
- TS emissions for the examples of other frequency arrangements
-6 dBm/{5 MHz}
-37 dBm/{5 MHz}
797 MHz
TDDBroadcastingBroadcasting
-5.4 dBm/{1 MHz}
In‐block EIRP
60595857+1.6 dBm/{5 MHz}
817 MHz
-65 dBm/{8 MHz}
790 MHz
862 MHz
Figure 12: TS emission mask for a TDD operator in the lowest four 5 MHz blocks where the 790-862 MHz band is allocated to TDD MFCN

CEPT REPORT 30 Page 33
797 MHz
TDDBroadcastingBroadcasting
In‐block EIRP
60595857 69686766
817 MHz
830 MHz
-65 dBm/{8 MHz}
-5.4 dBm/{1 MHz}
790 MHz
862 MHz
Figure 13: TS emission mask for a TDD operator in the lowest four 5 MHz blocks where the 790-862 MHz band is used by a mixture of TDD MFCN and DTT
7 CONCLUSIONS
The present CEPT Report defines the set of “common and minimal (least restrictive) technical conditions” opti-mised for, but not limited to, fixed/mobile communications networks (two-way) in the 790-862 MHz band, whilst enabling the protection of broadcasting operating in accordance with GE-06 and other applications. For a matter of simplicity, the systems to which these technical conditions are defined are called ECN (Electronic Communication Networks) in this document16. The main non-ECN application to which technical conditions are not applicable is the terrestrial broadcasting. Another non-ECN use of the 790-862 MHz band, Aeronautical Radionavigation systems (ARNS), operating in some CEPT countries according to RR footnote 5.312, is considered in this report in a general way only.
The technical conditions developed in this report are developed independently of the channelling arrangement, and can therefore be applied to various band plans with a 5 MHz block size. For the preferred FDD harmonised fre-quency arrangement (2x30MHz starting at 791 MHz with a duplex gap of 11 MHz), there will be some interleaved spectrum in the FDD duplex gap or in the alternative TDD arrangement, there will be a guard band at 790MHz. Several uses can be envisaged (e.g. low power applications such as PMSE) on a non protected/ non interfering basis in this interleaved spectrum. This report also considers the minimum technical conditions that these applications must meet.
The definition of the least restrictive technical conditions is based on the block edge mask (BEM) approach, taking into account the corresponding work conducted by CEPT in the previous WAPECS Mandate. The block-edge mask (BEM) approach consists of in-block and out-of-block limits depending on frequency offset. The out-of-block com-ponent of the BEM consists of a baseline limit as well as transitional (or intermediate) limits, to be applied, where applicable, at the frequency boundary of an individual spectrum licence. These limits were derived using studies of appropriate compatibility and sharing scenarios between ECN and other applications in adjacent bands but in the same geographical area.
It should be understood that block edge masks do not always provide the required level of protection of victim ser-vices and in order to resolve the remaining cases of interference additional mitigation techniques would need to be applied.
In adjacent geographical areas (co channel or adjacent bands), the BEM has to be applied in conjunction with other conditions necessary for the coexistence between ECN systems and other applications. This can be done at a na-tional level by deriving power flux density (pfd) values for areas within the territory of one administration or with cross-border coordination developed by bilateral or multi-lateral agreements. With regard to cross-border coordina-tion, three scenarios have been identified:
- Cross-border coexistence between ECN on one side and terrestrial broadcasting on the other hand. This scenario is addressed in CEPT Report 29;
- Cross-border coexistence between ECN on one side and Aeronautical Radionavigation on the other side. Sharing studies related to this scenario are carried out within CEPT with respect to WRC-12 AI 1.17. The final sharing conditions will be adopted at WRC-12. It is likely that this will lead to methods for coordina-tion which will be applicable to this case.
16 It is important to note that the scope of ECN within this document is narrower than the definition in Directive 2002/21/EC, which includes mobile, fixed, nomadic and broadcasting networks that respect the technical conditions laid down for ECNs in this Report.
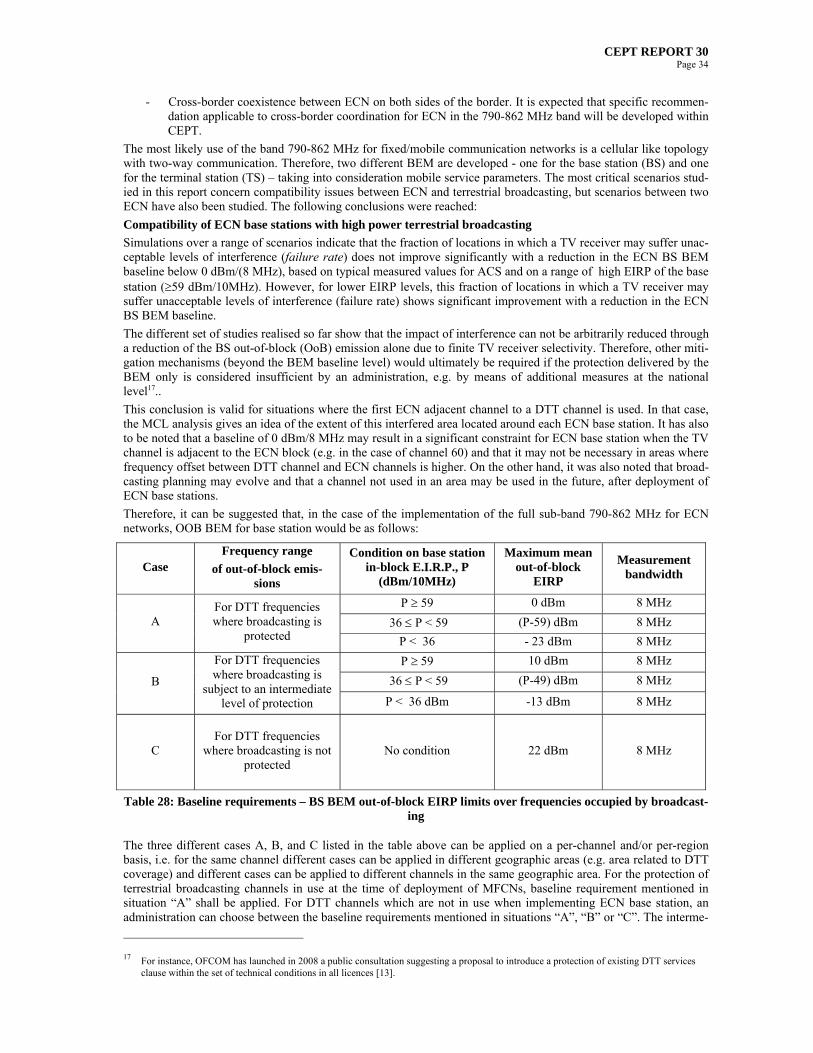
CEPT REPORT 30 Page 34
- Cross-border coexistence between ECN on both sides of the border. It is expected that specific recommen-dation applicable to cross-border coordination for ECN in the 790-862 MHz band will be developed within CEPT.
The most likely use of the band 790-862 MHz for fixed/mobile communication networks is a cellular like topology with two-way communication. Therefore, two different BEM are developed - one for the base station (BS) and one for the terminal station (TS) – taking into consideration mobile service parameters. The most critical scenarios stud-ied in this report concern compatibility issues between ECN and terrestrial broadcasting, but scenarios between two ECN have also been studied. The following conclusions were reached:
Compatibility of ECN base stations with high power terrestrial broadcasting
Simulations over a range of scenarios indicate that the fraction of locations in which a TV receiver may suffer unac-ceptable levels of interference (failure rate) does not improve significantly with a reduction in the ECN BS BEM baseline below 0 dBm/(8 MHz), based on typical measured values for ACS and on a range of high EIRP of the base station (59 dBm/10MHz). However, for lower EIRP levels, this fraction of locations in which a TV receiver may suffer unacceptable levels of interference (failure rate) shows significant improvement with a reduction in the ECN BS BEM baseline.
The different set of studies realised so far show that the impact of interference can not be arbitrarily reduced through a reduction of the BS out-of-block (OoB) emission alone due to finite TV receiver selectivity. Therefore, other miti-gation mechanisms (beyond the BEM baseline level) would ultimately be required if the protection delivered by the BEM only is considered insufficient by an administration, e.g. by means of additional measures at the national level17..
This conclusion is valid for situations where the first ECN adjacent channel to a DTT channel is used. In that case, the MCL analysis gives an idea of the extent of this interfered area located around each ECN base station. It has also to be noted that a baseline of 0 dBm/8 MHz may result in a significant constraint for ECN base station when the TV channel is adjacent to the ECN block (e.g. in the case of channel 60) and that it may not be necessary in areas where frequency offset between DTT channel and ECN channels is higher. On the other hand, it was also noted that broad-casting planning may evolve and that a channel not used in an area may be used in the future, after deployment of ECN base stations.
Therefore, it can be suggested that, in the case of the implementation of the full sub-band 790-862 MHz for ECN networks, OOB BEM for base station would be as follows:
Case Frequency range
of out-of-block emis-sions
Condition on base station in-block E.I.R.P., P
(dBm/10MHz)
Maximum mean out-of-block
EIRP
Measurement bandwidth
P 59 0 dBm 8 MHz
36 P < 59 (P-59) dBm 8 MHz A For DTT frequencies where broadcasting is
protected P < 36 - 23 dBm 8 MHz
P 59 10 dBm 8 MHz
36 P < 59 (P-49) dBm 8 MHz B
For DTT frequencies where broadcasting is
subject to an intermediate level of protection P < 36 dBm -13 dBm 8 MHz
C For DTT frequencies
where broadcasting is not protected
No condition 22 dBm 8 MHz
Table 28: Baseline requirements – BS BEM out-of-block EIRP limits over frequencies occupied by broadcast-ing
The three different cases A, B, and C listed in the table above can be applied on a per-channel and/or per-region basis, i.e. for the same channel different cases can be applied in different geographic areas (e.g. area related to DTT coverage) and different cases can be applied to different channels in the same geographic area. For the protection of terrestrial broadcasting channels in use at the time of deployment of MFCNs, baseline requirement mentioned in situation “A” shall be applied. For DTT channels which are not in use when implementing ECN base station, an administration can choose between the baseline requirements mentioned in situations “A”, “B” or “C”. The interme-
17 For instance, OFCOM has launched in 2008 a public consultation suggesting a proposal to introduce a protection of existing DTT services clause within the set of technical conditions in all licences [13].

CEPT REPORT 30 Page 35
diate level of protection in situation “B” can be justified in some circumstances (e.g. agreement between broadcast-ing authority and mobile operators). Illustrative examples can be found in section 6.6.4.
These conditions have been derived from studies related to the protection of fixed outdoor reception for DTT. How-ever, they are also applicable to the protection of the portable DTT reception modes as it was shown by additional studies, provided that the same methodology as for studies related to protection of fixed reception is applied.
Compatibility of ECN terminal stations with high power terrestrial broadcasting
An ECN terminal baseline requirement of -50dBm/8MHz for frequencies below 790 MHz is needed for protection of fixed TV reception. In the case of protection of portable TV reception, an ECN baseline of -65 dBm/8 MHz would be needed.
The uplink guard band to protect DVB-T fixed reception from ECN uplink interference on an adjacent channel is around 7 MHz. Larger guard band would be required for the protection of portable-indoor DTT reception, with a potential need for additional filtering at the TV antenna port. For the preferred FDD channel arrangement, the fre-quency separation between uplink and DVB-T is at least 42 MHz; the guard band requirement is therefore inher-ently met and the baseline level is readily met.
Therefore, the regulation of requirements imposed on terminal stations needs to take account of the DTT reception mode and the actual guard band.
Compatibility between ECN networks
A similar approach to the one used in CEPT Report 19 and ECC Report 131 has been applied. A baseline limit of -49.5 dBm/5MHz in the relevant part of the spectrum has been derived for the ECN base stations, and of -37dBm/5MHz for ECN terminal stations. Some transitional levels are also introduced to ease the transition between operators. They are derived from the LTE band-independent spectrum emission mask, which has been assumed to be representative of the technologies envisaged in this band.
In-Block EIRP
- An administration may specify a base station in-block EIRP limit. Based on compatibility studies and de-ployment requirement, suggested maximum EIRP limits range from 56 dBm/(5 MHz) to 64 dBm/(5 MHz). In case a limit is specified, administrations may consider authorising a power exceeding the limit in particu-lar situations, e.g. in rural areas.
- The limit for ECN terminal station in-block power is 23 dBm TRP for the TS designed to be mobile or no-madic and 23 dBm E.I.R.P. for TS designed to be fixed or installed. Administrations may relax this limit in certain situations, for example fixed TS in rural areas, providing that protection of other services, networks and applications is not compromised and cross-border obligations are fulfilled.
It may be necessary to use band pass filters at DVB-T receivers in order to be sufficiently protected against interference caused by this in-block limit, this is particularly important for portable reception.
These different values constitute the set of least restrictive technical conditions, to be met by an ECN operating in the 790-862 MHz band.
It should be noted that Administrations should ensure that ECN operators in the 790-862 MHz band are free to enter into bilateral or multilateral agreements to develop less stringent technical parameters, if agreed among all affected parties including broadcasting operators.

CEPT REPORT 30 Page 36
ANNEX 1: STUDIES TO DERIVE BEM APPLICABLE TO ECN BASE STATIONS AT THE FREQUENCY ADJACENCY
BETWEEN ECN AND TERRESTRIAL BROADCASTING
A1.1 DESCRIPTION OF THE SIMULATION PROCESS
A1.1.1 GEOMETRY
A single-frequency ring of six mobile network cells surrounding a central cell is considered. The impact of adjacent-channel interference is evaluated for the case of a TV receiver located within the central cell. The TV receiver an-tenna (fixed roof top) is directed toward the DTT transmitter.
DTT transmitter
Ring of mobile network cells
rDTT
DTT transmitter
Ring of mobile network cells
rDTT
Figure A1.1: Relative configuration of ECN and DTT cells
A1.1.2 LIST OF PARAMETERS USED IN THIS ANNEX
SINR = Signal-to-interference-plus-noise ratio at TV receiver,
SINRT = Target SINR at TV receiver,
SIR = Signal-to-interference ratio at TV receiver,
SNR = Signal-to-noise ratio at TV receiver,
C/I = carrier-to-interference ratio at TV receiver,
C/N = carrier-to-noise ratio at TV receiver,
Oth = overloading threshold of the TV receiver
PS = Wanted DTT signal power at TV receiver (measured over 8 MHz),
PN = Noise power at TV receiver, = kTB.NF,
PI,AC,i = Adjacent-channel interference power caused by the ith BS,
PI,CC,i = Co-channel interference power caused by the ith BS,
PAC,i = Adjacent-channel received interferer power from the ith BS,
PTT = TT EIRP, measured over 8 MHz.
ACS = TV receiver’s adjacent channel selectivity,
PIB,(BS) = BS in-block EIRP measured over 10 MHz (same for all BSs),
POOB,(BS) = BS out-of-block EIRP measured over 8 MHz (same for all BSs),
g,(BS) = BS antenna directional pattern as a function of elevation ,
g,(BS) = BS antenna directional pattern as a function of azimuth
GPL,(BS-TV),i = Propagation path-gain between mth BS transmitter and TV receiver,
GA,(TV) = TV antenna gain (including cable loss),
g,(TV)(.) = TV antenna directional pattern as a function of azimuth ,
gPol,(TV)(.) = TV antenna cross-polar discrimination pattern as a function of azimuth,
g,(TV)(.) = TV antenna directional pattern as a function of elevation ,
= Azimuth offset of TV receiver from bore sight of ith BS antenna,
i = Elevation offset of TV receiver from bore sight of ith BS antenna,

CEPT REPORT 30 Page 37
i = Azimuth offset of ith BS from bore sight of TV receiver antenna,
i = Elevation offset of ith BS from bore sight of TV receiver antenna.
A1.1.2.1 DTT cell radius
Table A1. 1: Link budget used for DTT dimensioning
In urban areas, a typical EIRP of 72.15dBm is considered. A maximum allowed path loss of 149.42dB leads to a DTT cell coverage of 28.715 km when applying the JTG5-6 model (see Annex 6).
In rural areas, a typical EIRP of 79.15dBm is considered. A maximum allowed path loss of 156.42dB leads to a DTT cell coverage of 49.588 km when applying the JTG5-6 model (see Annex 6).
A1.1.2.2 ECN cell radius
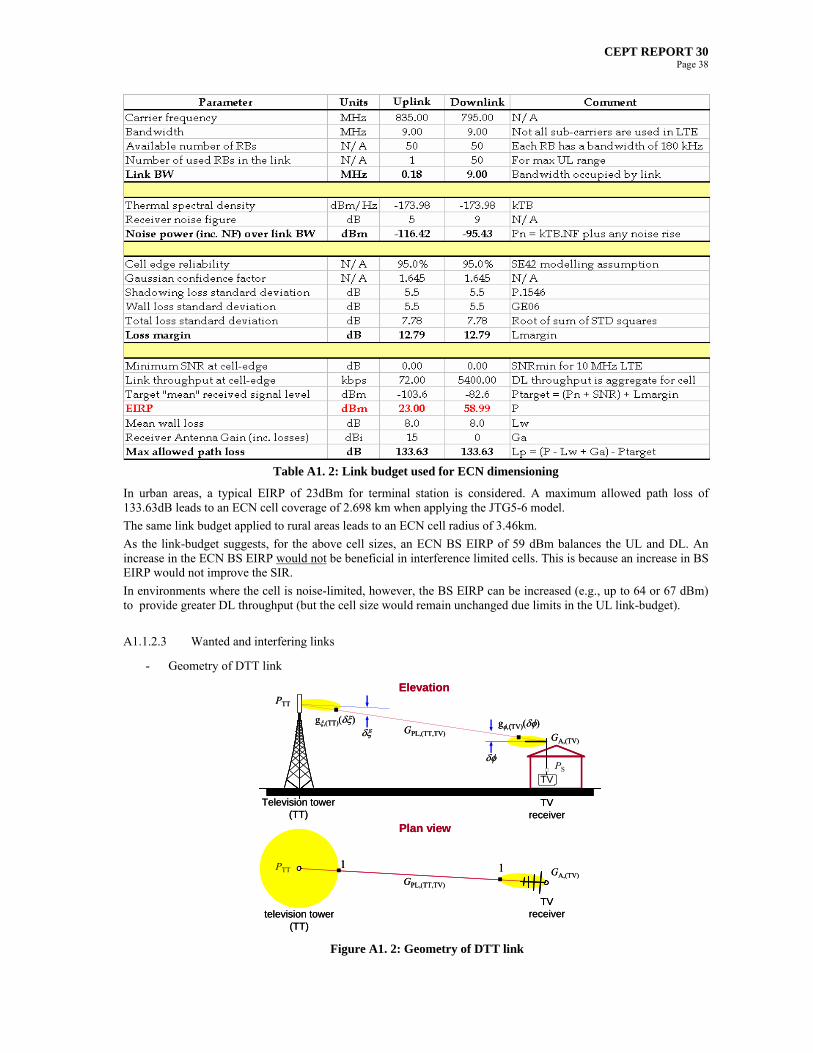
CEPT REPORT 30 Page 38
Table A1. 2: Link budget used for ECN dimensioning
In urban areas, a typical EIRP of 23dBm for terminal station is considered. A maximum allowed path loss of 133.63dB leads to an ECN cell coverage of 2.698 km when applying the JTG5-6 model.
The same link budget applied to rural areas leads to an ECN cell radius of 3.46km.
As the link-budget suggests, for the above cell sizes, an ECN BS EIRP of 59 dBm balances the UL and DL. An increase in the ECN BS EIRP would not be beneficial in interference limited cells. This is because an increase in BS EIRP would not improve the SIR.
In environments where the cell is noise-limited, however, the BS EIRP can be increased (e.g., up to 64 or 67 dBm) to provide greater DL throughput (but the cell size would remain unchanged due limits in the UL link-budget).
A1.1.2.3 Wanted and interfering links
- Geometry of DTT link
PTT
TV receiver
1
g,(TT)()
TVPS
g,(TV)()GPL,(TT,TV)
Plan view
Elevation
Television tower (TT)
television tower (TT)
GPL,(TT,TV)
1
GA,(TV)
GA,(TV)
TV receiver
PTT
PTT
TV receiver
1
g,(TT)()
TVPS
g,(TV)()GPL,(TT,TV)
Plan view
Elevation
Television tower (TT)
television tower (TT)
GPL,(TT,TV)
1
GA,(TV)
GA,(TV)
TV receiver
PTT
Figure A1. 2: Geometry of DTT link

CEPT REPORT 30 Page 39
- Geometry of victim-interferer link
g,(TV)()
TV receiver
1
g,(BS)()
TVPI,CC
PAC
GPL,(BS,TV)
Plan view
Elevation
Base station (BS)
GPL,(BS,TV)
GA,(TV)
GA,(TV)
TV receiver
PIB,(BS)
POOB,(BS)
PIB,(BS)
POOB,(BS)
Base station (BS)
towardsDTT transmitter
g,(TV)()
g,(BS)()
g,(TV)()
TV receiver
1
g,(BS)()
TVPI,CC
PAC
GPL,(BS,TV)
Plan view
Elevation
Base station (BS)
GPL,(BS,TV)
GA,(TV)
GA,(TV)
TV receiver
PIB,(BS)
POOB,(BS)
PIB,(BS)
POOB,(BS)
Base station (BS)
towardsDTT transmitter
g,(TV)()
g,(BS)()
Figure A1.3: Geometry of victim-interferer link
A1.1.3 GENERAL ASSUMPTIONS
A1.1.3.1 General assumptions related to TV
Television tower (TT)
EIRP Urban: 72.15 dBm/(8 MHz)
Rural: 79.15 dBm/(8 MHz)
Cell radius Urban: 28.715 km
Rural: 49.588 km
Antenna height Urban: 100 metres
Rural: 200 metres
Antenna pattern As in Figure A1.4
Antenna tilt 0
Table A1.3: Assumptions related to television tower
g,(TT)() 1°
7°
g,(TT)()g,(TT)() 1°
7°
Figure A1. 4: TT antenna gain as a function of eleva-
tion. TT antenna pattern is assumed to be omni-directional in azimuth
TV receiver (victim)
Antenna gain (inc. feeder loss) 12 – 5 = 7 dBd
Antenna height 10 m
Receiver minimum C/N 21 dB (64QAM, rate 2/3 coding)
Antenna pattern ITU-R BT.419-3 [14]
Noise figure 7 dB
Noise equivalent bandwidth 7.6 MHz
Table A1.4: Assumptions related to television receiver

CEPT REPORT 30 Page 40
A1.1.3.2 General assumptions related to ECN
ECN base station
EIRP (noise limited sce-nario)
Urban: 64 dBm/(10 MHz)
Rural: 67 dBm/(10 MHz)
EIRP (uplink limited sce-nario)
UL/DL balanced: 59 dBm/(10 MHz)
Cell radius Urban: 2698 m
Rural: 3460 m
Antenna height Urban: 30 metres
Rural: 60 metres
Antenna elevation pattern ITU-R F.1336 (section A1.2) or as in Figure A1.5 (section A1.3)
Antenna tilt 0
Table A1.5: Assumptions related to ECN base station
g,(BS)()2.5°
15°
-33
-15
g,(BS)()2.5°
15°
-33
-15
Figure A1. 5: BS antenna gain as a function of elevation. BS antenna
pattern is assumed to be omni-directional in azimuth
A1.1.3.3 Others
General
Operating frequency 790 MHz
Min. horizontal separation between Tx and Rx 10 m
Free space:
-147.56 + 20log10(f) + 20 log10(d) dB
Mean path loss
JTG model as described in Annex 6 (Hata model up to 100m, P.1546 beyond 1km and linear interpolation be-tween
Log-normal shadowing standard deviation:
3.5 dB for d < d0 m,
5.5 dB for d > d0 m, where for d0 = 100 m.
Mean wall loss 8 dB
Log-normal wall loss standard deviation 5.5 dB
Cross polarization (in the main lobe) 3 dB or 16dB
Table A1.6: Other sets of general assumptions
A1.2 MINIMUM COUPLING LOSS ANALYSIS
A1.2.1 ADDITIONAL ASSUMPTIONS
A1.2.1.1 Protection ratio and interfering signal
Protection ratios18 were determined to ensure the absence of picture failure during a minimum observation time of 30 s. The wanted and interfering signal levels were measured at the receiver input as the rms power in an additive white Gaussian noise (AWGN) channel. Measurement results were noted as C/I (see [12] for more details).
18 It is the minimum value of the signal-to-interference ratio required to obtain a specified reception quality under specified conditions at the
receiver input (see Rec. ITU-R V.573-5). Usually, protection ratio (PR) is specified as a function of the frequency offset between the wanted and interfering signals over a wide frequency range. PR curves show the ability of a receiver to discriminate against interfering signals on frequencies differing from that of the wanted signal.
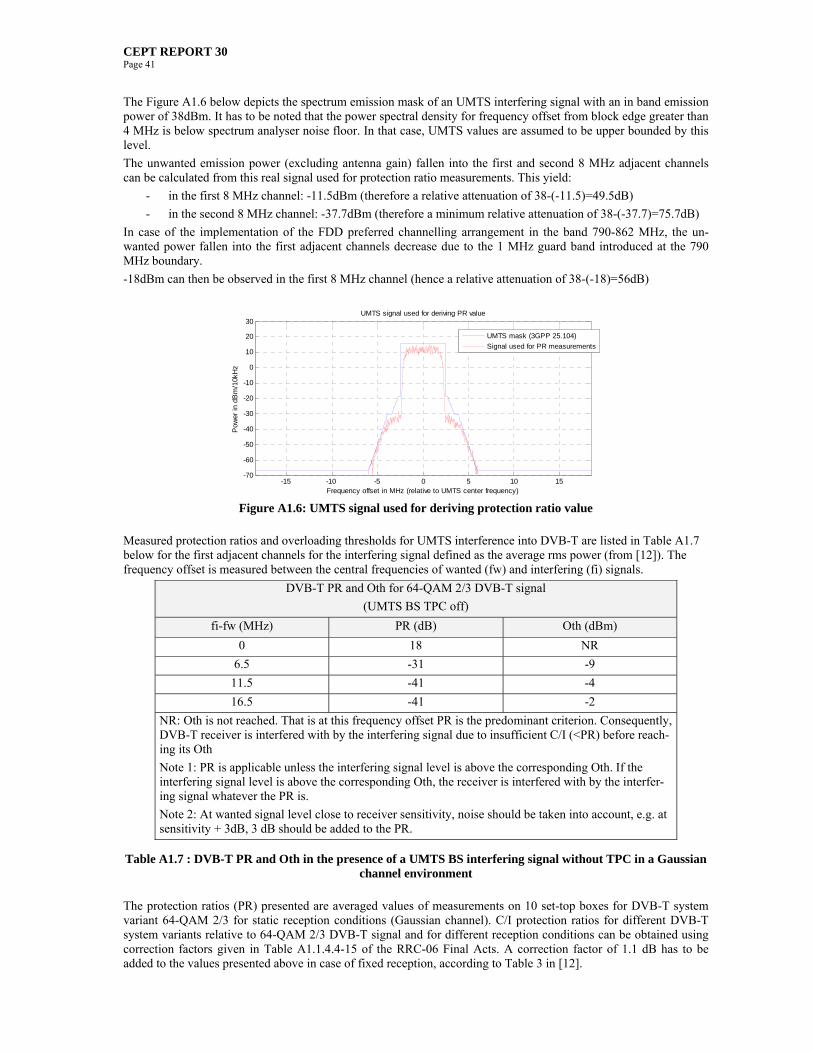
CEPT REPORT 30 Page 41
The Figure A1.6 below depicts the spectrum emission mask of an UMTS interfering signal with an in band emission power of 38dBm. It has to be noted that the power spectral density for frequency offset from block edge greater than 4 MHz is below spectrum analyser noise floor. In that case, UMTS values are assumed to be upper bounded by this level.
The unwanted emission power (excluding antenna gain) fallen into the first and second 8 MHz adjacent channels can be calculated from this real signal used for protection ratio measurements. This yield:
- in the first 8 MHz channel: -11.5dBm (therefore a relative attenuation of 38-(-11.5)=49.5dB)
- in the second 8 MHz channel: -37.7dBm (therefore a minimum relative attenuation of 38-(-37.7)=75.7dB)
In case of the implementation of the FDD preferred channelling arrangement in the band 790-862 MHz, the un-wanted power fallen into the first adjacent channels decrease due to the 1 MHz guard band introduced at the 790 MHz boundary.
-18dBm can then be observed in the first 8 MHz channel (hence a relative attenuation of 38-(-18)=56dB)
-15 -10 -5 0 5 10 15-70
-60
-50
-40
-30
-20
-10
0
10
20
30
Frequency offset in MHz (relative to UMTS center frequency)
Pow
er in
dB
m/1
0kH
z
UMTS signal used for deriving PR value
UMTS mask (3GPP 25.104)
Signal used for PR measurements
Figure A1.6: UMTS signal used for deriving protection ratio value
Measured protection ratios and overloading thresholds for UMTS interference into DVB-T are listed in Table A1.7 below for the first adjacent channels for the interfering signal defined as the average rms power (from [12]). The frequency offset is measured between the central frequencies of wanted (fw) and interfering (fi) signals.
DVB-T PR and Oth for 64-QAM 2/3 DVB-T signal
(UMTS BS TPC off)
fi-fw (MHz) PR (dB) Oth (dBm)
0 18 NR
6.5 -31 -9
11.5 -41 -4
16.5 -41 -2
NR: Oth is not reached. That is at this frequency offset PR is the predominant criterion. Consequently, DVB-T receiver is interfered with by the interfering signal due to insufficient C/I (<PR) before reach-ing its Oth
Note 1: PR is applicable unless the interfering signal level is above the corresponding Oth. If the interfering signal level is above the corresponding Oth, the receiver is interfered with by the interfer-ing signal whatever the PR is.
Note 2: At wanted signal level close to receiver sensitivity, noise should be taken into account, e.g. at sensitivity + 3dB, 3 dB should be added to the PR.
Table A1.7 : DVB-T PR and Oth in the presence of a UMTS BS interfering signal without TPC in a Gaussian channel environment
The protection ratios (PR) presented are averaged values of measurements on 10 set-top boxes for DVB-T system variant 64-QAM 2/3 for static reception conditions (Gaussian channel). C/I protection ratios for different DVB-T system variants relative to 64-QAM 2/3 DVB-T signal and for different reception conditions can be obtained using correction factors given in Table A1.1.4.4-15 of the RRC-06 Final Acts. A correction factor of 1.1 dB has to be added to the values presented above in case of fixed reception, according to Table 3 in [12].

CEPT REPORT 30 Page 42
In case of the implementation of the FDD preferred channelling arrangement in the band 790-862 MHz, the protec-tion ratio need to be calculated taken into account a frequency offset of 1MHz at the 790 MHz boundary. 2dB im-provement can be estimated from interpolation between measurements.
A1.2.2 ADJACENT CHANNEL INTERFERENCE ASSESSMENT
A1.2.2.1 General consideration
The potential impact of ECN base stations on DTT is primarily governed by adjacent channel interference scenario. This is explained in the executive summary of CEPT Report 21 which indicates that ‘the risk of adjacent channel interference exists only in close vicinity of the interfering multimedia broadcasting transmitter, located within the coverage area of the non-co-sited service’. This can result in adjacent channel interference (referred to as hole punching) to receivers close to the transmitters used in the dense network.
Therefore, the impact assessment aims at defining a protection zone radius beyond which a DVB-T antenna will not suffer from interference.
As pointed out in section 6.2.1.1 of this Report, interference into digital broadcasting fixed reception is the worst case with regard to interference from ECN base stations (including overloading effects) in adjacent bands.
A1.2.2.2 Calculation
The interfered area is calculated for different ECN cell locations as shown in Figure A1.7. In this study, no statisti-cal effect is taken into account. Therefore, the minimum DTT field strength is equal to the median DTT field strength.
DTT transmitter
(A) Mobile network cell
rDTT
(B) Mobile network cell
(C) Mobile network cell
DTT transmitter
(A) Mobile network cell
rDTT
(B) Mobile network cell
(C) Mobile network cell
Figure A1.7: Location of the different ECN cells
It has also to be noted that the exact location of the ECN cell is not needed. These locations sample the DTT cell for different DVB-T field strength starting from DTT sensitivity (49dBm) and increasing with 10 dB step size.
Mobile network cell (A) (B) (C)
DVB-T received power Ps (dBm) -77 -67 -57
DVB-T field strength E (dBµV/m)19 49 59 69
Table A1.8: Characteristics of the different ECN cells
It is likely that the higher received power Ps, the closer ECN cell to DTT emitter.
19 E(dBµV/m)=Ps(dBm)+20Log(f)+77.21-G(dBd) where f is the operating frequency in MHz and G the receiver antenna gain in dBd (including feeder losses)

CEPT REPORT 30 Page 43
For each of these situations, an UMTS interfering signal is considered. Its spectrum emission mask follows that one described in Figure A1.6 shifted by the necessary factor to fit with ECN base stations EIRP as given in Table A1.6. The protection zone radius is then calculated estimating the distance for which the ECN received power on the DVB-T roof antenna is equal to the DVB-T receiver power P (see Table A1.8) plus a margin. This margin is equal to the needed protection ratio plus the cross polarization gain when applicable (Table A1.3).
In order for the TV receiver to function correctly it is required that SIRP
P
I
S where SIR is the protection ratio in
co-channel situation (no frequency offset e.g. 18dB as given in Table A1.7).
The interfering power PI can be split into two parts PI,CC and PI,AC (see equation A1.2) standing respectively for adjacent-channel interference power caused by the ECN BS and co-channel interference power caused by the ECN BS,
, ..GACSACS
, ..G .ACLR
)(δg . )(δg . )(δg . . .)(δg . )(δg .
(TV)A,TV)(BS,PL,(BS)IB,
1
AC
1
ACI,
(TV)A,TV)(BS,PL,(BS)IB,CCI,
TT
(TV),(TV),Pol(TV),(TV)A,TV),-(BSPL,
BS
BS)(,BS)(,(BS)OOB,CCI,
BS
BS1-
GG
GGPGPP
GGPGP
GGPP
TT
TT
θi
(Eq A1.1)
Therefore,
, ..G
, ..G ACSACLR
(TV)A,TV)(BS,PL,(BS)IB,
(TV)A,TV)(BS,PL,(BS)IB,
1
I
BS1
BS-1
,,
GGPGACIR
GGPGPPP
TT
TTACICCI
(Eq A1.2)
Noting that the adjacent-channel interference ratio (ACIR) is the ratio of the adjacent-channel interferer power, PAC, over the interference power, PI, experienced by the victim; i.e.,
. PR
SIR/ ACIR
AC
S
I
S
I
AC
P
P
P
P
P
P
(Eq A1.3)
One can derive,
11BS
11
BSBS1
.G
..GSIR
PR ..G
(TV)A,(BS)IB,TV)(BS,PL,
(TV)A,TV)(BS,PL,(BS)IB,(TV)A,TV)(BS,PL,(BS)IB,
TTS
STTTT
SI
I
S
GGPPR
PG
SIR
PGGPGGGPGACIR
SIR
PP
SIRP
P
(Eq A1.4)
Knowing the propagation losses TV)(BS,PL,
G , it can be derived two performance metrics in the interference assessment
of ECN transmitter on DVB-T receiver
- A minimum and maximum protection zone radius (corresponding to the minimum and maximum distances where the DVB-T protection criteria is exceeded) around an ECN BS transmitter
- Percentage of the ECN cell area where a DVB-T receiver can be interfered.
Two calculations are realised. The first one does not consider angular discrimination providing either by DVB-T roof or ECN BS antennas. Therefore, the interfered area is a discus as illustrated and the minimum and maximum exclusion zone radius are the same. The percentage of ECN cell area for which DVB-T protection criterion is ex-ceeded is obviously calculated as the square of the protection zone radius divided by the ECN cell radius. Figure A1.3 is then simplified and leads to the following configuration depicted in Figure A1.8.
The second one considers angular discriminations brought by DVB-T roof antenna and ECN BS. Within the ECN cell, DVB-T roof antenna points towards the DVB-T transmitter. Therefore, according to their relative positions, an angle offset can be calculated (, , , ). This will lead to a modification of the interfered area.

CEPT REPORT 30 Page 44
d(BS,TV)
GPL, (BS,TV)
TransmitChannel #61
PIB,(BS) GA,(TV)
TV
ReceiveChannel #60
Mobile networkbase station (BS)
PAC
TransmitChannel #60
PTT
POOB,(BS)
GPL, (TT,TV)
d(TT,TV)Television tower(TT)
d(BS,TV)
GPL, (BS,TV)
TransmitChannel #61
PIB,(BS) GA,(TV)
TV
ReceiveChannel #60
Mobile networkbase station (BS)
PAC
TransmitChannel #60
PTT
POOB,(BS)
GPL, (TT,TV)
d(TT,TV)Television tower(TT)
Figure A1. 8: Interferer geometry in case of no angular discrimination
A1.2.3 RESULTS
A1.2.3.1 Case A: DTT received field strength equal to 49dBµV/m in urban areas
X-range (m)
Y-r
ange
(m
)
ECN field strength (dBµV/m@790MHz)
-2000 -1000 0 1000 2000
-2500
-2000
-1500
-1000
-500
0
500
1000
1500
2000
2500 60
70
80
90
100
110
120
130
X-range (m)
Y-r
ange
(m
)
ECN field strength (dBµV/m@790MHz)
-2000 -1000 0 1000 2000
-2500
-2000
-1500
-1000
-500
0
500
1000
1500
2000
2500 60
65
70
75
80
85
90
95
100
105
110
No angular discrimination
ECN cell radius 2.7km
Rmin 1.55km
Rmax 1.55km
% 33%
With angular discrimination
ECN cell radius 2.7km
Rmin 0.33km
Rmax 1.55km
% 9.8%
Figure A1.9: Illustration of the interfered area around an ECN BS for a DTT received field strength equal to 49dBµV/m
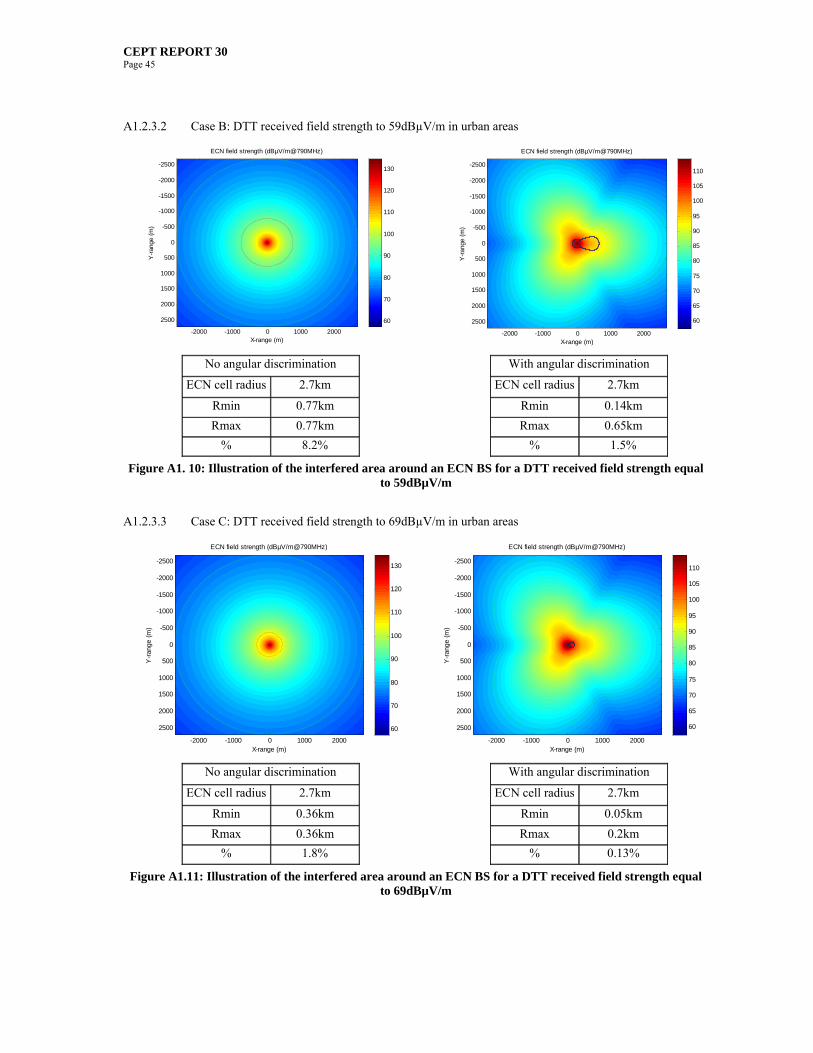
CEPT REPORT 30 Page 45
A1.2.3.2 Case B: DTT received field strength to 59dBµV/m in urban areas
X-range (m)
Y-r
ange
(m
)ECN field strength (dBµV/m@790MHz)
-2000 -1000 0 1000 2000
-2500
-2000
-1500
-1000
-500
0
500
1000
1500
2000
2500 60
70
80
90
100
110
120
130
X-range (m)
Y-r
ange
(m
)
ECN field strength (dBµV/m@790MHz)
-2000 -1000 0 1000 2000
-2500
-2000
-1500
-1000
-500
0
500
1000
1500
2000
2500 60
65
70
75
80
85
90
95
100
105
110
No angular discrimination
ECN cell radius 2.7km
Rmin 0.77km
Rmax 0.77km
% 8.2%
With angular discrimination
ECN cell radius 2.7km
Rmin 0.14km
Rmax 0.65km
% 1.5%
Figure A1. 10: Illustration of the interfered area around an ECN BS for a DTT received field strength equal to 59dBµV/m
A1.2.3.3 Case C: DTT received field strength to 69dBµV/m in urban areas
X-range (m)
Y-r
ange
(m
)
ECN field strength (dBµV/m@790MHz)
-2000 -1000 0 1000 2000
-2500
-2000
-1500
-1000
-500
0
500
1000
1500
2000
2500 60
70
80
90
100
110
120
130
X-range (m)
Y-r
ange
(m
)
ECN field strength (dBµV/m@790MHz)
-2000 -1000 0 1000 2000
-2500
-2000
-1500
-1000
-500
0
500
1000
1500
2000
2500 60
65
70
75
80
85
90
95
100
105
110
No angular discrimination
ECN cell radius 2.7km
Rmin 0.36km
Rmax 0.36km
% 1.8%
With angular discrimination
ECN cell radius 2.7km
Rmin 0.05km
Rmax 0.2km
% 0.13%
Figure A1.11: Illustration of the interfered area around an ECN BS for a DTT received field strength equal to 69dBµV/m
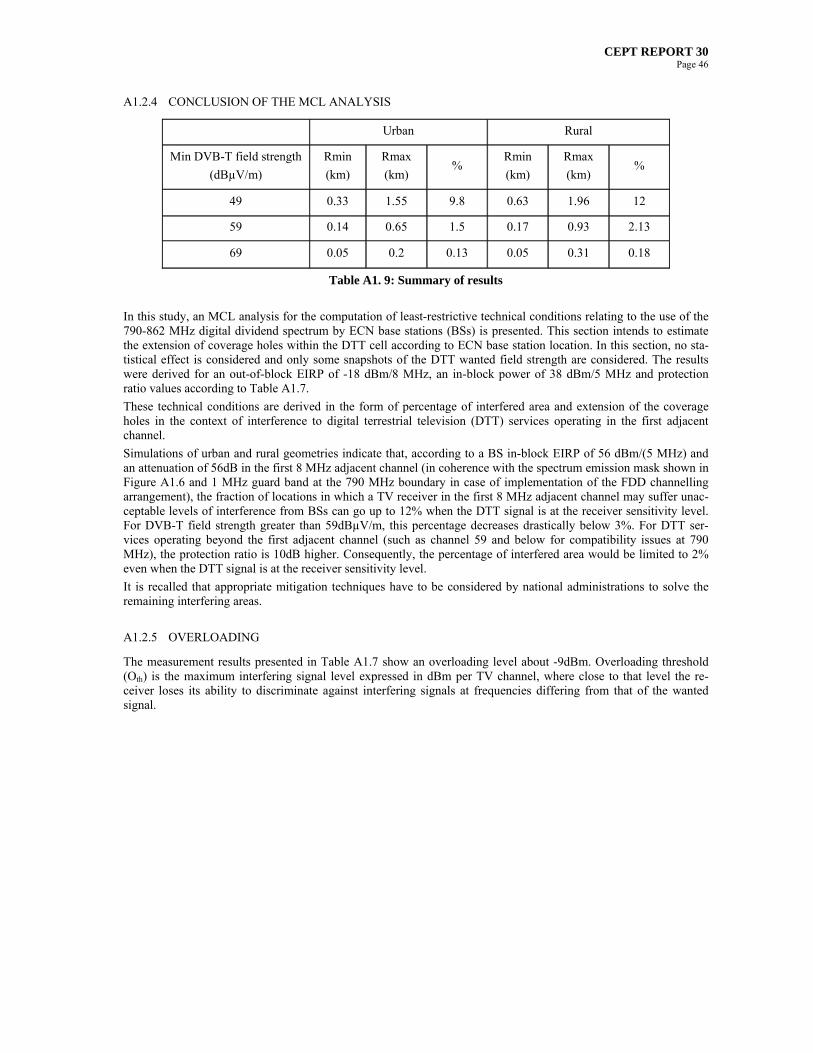
CEPT REPORT 30 Page 46
A1.2.4 CONCLUSION OF THE MCL ANALYSIS
Urban Rural
Min DVB-T field strength
(dBµV/m)
Rmin
(km)
Rmax
(km) %
Rmin
(km)
Rmax
(km) %
49 0.33 1.55 9.8 0.63 1.96 12
59 0.14 0.65 1.5 0.17 0.93 2.13
69 0.05 0.2 0.13 0.05 0.31 0.18
Table A1. 9: Summary of results
In this study, an MCL analysis for the computation of least-restrictive technical conditions relating to the use of the 790-862 MHz digital dividend spectrum by ECN base stations (BSs) is presented. This section intends to estimate the extension of coverage holes within the DTT cell according to ECN base station location. In this section, no sta-tistical effect is considered and only some snapshots of the DTT wanted field strength are considered. The results were derived for an out-of-block EIRP of -18 dBm/8 MHz, an in-block power of 38 dBm/5 MHz and protection ratio values according to Table A1.7.
These technical conditions are derived in the form of percentage of interfered area and extension of the coverage holes in the context of interference to digital terrestrial television (DTT) services operating in the first adjacent channel.
Simulations of urban and rural geometries indicate that, according to a BS in-block EIRP of 56 dBm/(5 MHz) and an attenuation of 56dB in the first 8 MHz adjacent channel (in coherence with the spectrum emission mask shown in Figure A1.6 and 1 MHz guard band at the 790 MHz boundary in case of implementation of the FDD channelling arrangement), the fraction of locations in which a TV receiver in the first 8 MHz adjacent channel may suffer unac-ceptable levels of interference from BSs can go up to 12% when the DTT signal is at the receiver sensitivity level. For DVB-T field strength greater than 59dBµV/m, this percentage decreases drastically below 3%. For DTT ser-vices operating beyond the first adjacent channel (such as channel 59 and below for compatibility issues at 790 MHz), the protection ratio is 10dB higher. Consequently, the percentage of interfered area would be limited to 2% even when the DTT signal is at the receiver sensitivity level.
It is recalled that appropriate mitigation techniques have to be considered by national administrations to solve the remaining interfering areas.
A1.2.5 OVERLOADING
The measurement results presented in Table A1.7 show an overloading level about -9dBm. Overloading threshold (Oth) is the maximum interfering signal level expressed in dBm per TV channel, where close to that level the re-ceiver loses its ability to discriminate against interfering signals at frequencies differing from that of the wanted signal.
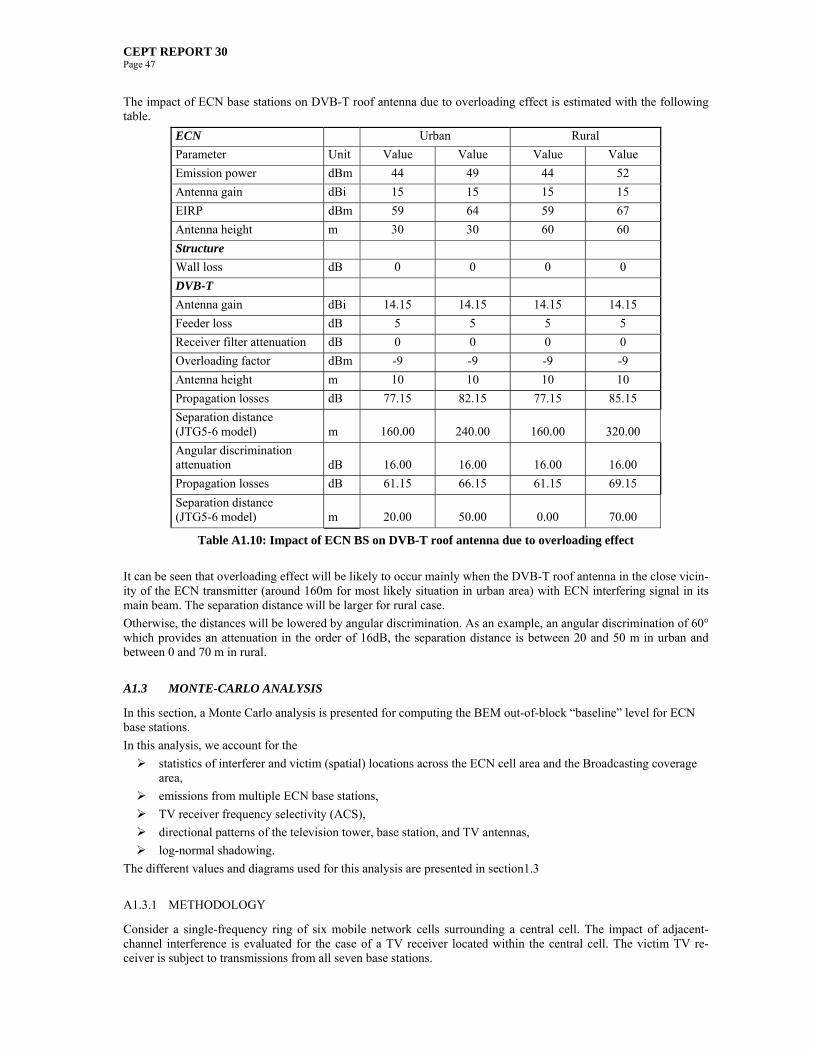
CEPT REPORT 30 Page 47
The impact of ECN base stations on DVB-T roof antenna due to overloading effect is estimated with the following table.
ECN Urban Rural
Parameter Unit Value Value Value Value
Emission power dBm 44 49 44 52
Antenna gain dBi 15 15 15 15
EIRP dBm 59 64 59 67
Antenna height m 30 30 60 60
Structure
Wall loss dB 0 0 0 0
DVB-T
Antenna gain dBi 14.15 14.15 14.15 14.15
Feeder loss dB 5 5 5 5
Receiver filter attenuation dB 0 0 0 0
Overloading factor dBm -9 -9 -9 -9
Antenna height m 10 10 10 10
Propagation losses dB 77.15 82.15 77.15 85.15
Separation distance (JTG5-6 model) m 160.00 240.00 160.00 320.00
Angular discrimination attenuation dB 16.00 16.00 16.00 16.00
Propagation losses dB 61.15 66.15 61.15 69.15
Separation distance (JTG5-6 model) m 20.00 50.00 0.00 70.00
Table A1.10: Impact of ECN BS on DVB-T roof antenna due to overloading effect
It can be seen that overloading effect will be likely to occur mainly when the DVB-T roof antenna in the close vicin-ity of the ECN transmitter (around 160m for most likely situation in urban area) with ECN interfering signal in its main beam. The separation distance will be larger for rural case.
Otherwise, the distances will be lowered by angular discrimination. As an example, an angular discrimination of 60° which provides an attenuation in the order of 16dB, the separation distance is between 20 and 50 m in urban and between 0 and 70 m in rural.
A1.3 MONTE-CARLO ANALYSIS
In this section, a Monte Carlo analysis is presented for computing the BEM out-of-block “baseline” level for ECN base stations.
In this analysis, we account for the
statistics of interferer and victim (spatial) locations across the ECN cell area and the Broadcasting coverage area,
emissions from multiple ECN base stations,
TV receiver frequency selectivity (ACS),
directional patterns of the television tower, base station, and TV antennas,
log-normal shadowing.
The different values and diagrams used for this analysis are presented in section1.3
A1.3.1 METHODOLOGY
Consider a single-frequency ring of six mobile network cells surrounding a central cell. The impact of adjacent-channel interference is evaluated for the case of a TV receiver located within the central cell. The victim TV re-ceiver is subject to transmissions from all seven base stations.
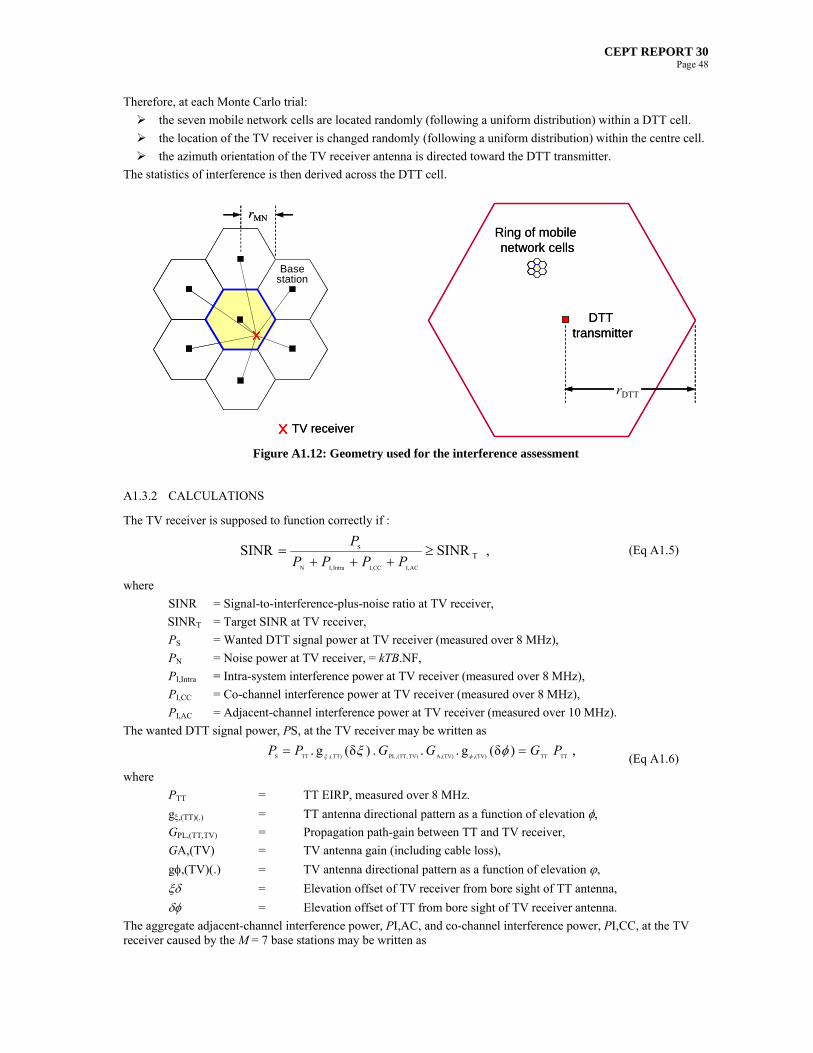
CEPT REPORT 30 Page 48
Therefore, at each Monte Carlo trial:
the seven mobile network cells are located randomly (following a uniform distribution) within a DTT cell.
the location of the TV receiver is changed randomly (following a uniform distribution) within the centre cell.
the azimuth orientation of the TV receiver antenna is directed toward the DTT transmitter.
The statistics of interference is then derived across the DTT cell.
TV receiver
Base station
rMN
TV receiver
Base station
rMN
DTT transmitter
Ring of mobile network cells
rDTT
DTT transmitter
Ring of mobile network cells
rDTT
Figure A1.12: Geometry used for the interference assessment
A1.3.2 CALCULATIONS
The TV receiver is supposed to function correctly if :
, SINRSINR TACI,CCI,IntraI,N
S
PPPP
P (Eq A1.5)
where
SINR = Signal-to-interference-plus-noise ratio at TV receiver,
SINRT = Target SINR at TV receiver,
PS = Wanted DTT signal power at TV receiver (measured over 8 MHz),
PN = Noise power at TV receiver, = kTB.NF,
PI,Intra = Intra-system interference power at TV receiver (measured over 8 MHz),
PI,CC = Co-channel interference power at TV receiver (measured over 8 MHz),
PI,AC = Adjacent-channel interference power at TV receiver (measured over 10 MHz).
The wanted DTT signal power, PS, at the TV receiver may be written as
, )(δg . . . )(δg .
TTTT(TV),(TV)A,TV)(TT,PL,TT)(,TTSPGGGPP (Eq A1.6)
where
PTT = TT EIRP, measured over 8 MHz.
g,(TT)(.) = TT antenna directional pattern as a function of elevation ,
GPL,(TT,TV) = Propagation path-gain between TT and TV receiver,
GA,(TV) = TV antenna gain (including cable loss),
g,(TV)(.) = TV antenna directional pattern as a function of elevation ,
= Elevation offset of TV receiver from bore sight of TT antenna,
= Elevation offset of TT from bore sight of TV receiver antenna.
The aggregate adjacent-channel interference power, PI,AC, and co-channel interference power, PI,CC, at the TV receiver caused by the M = 7 base stations may be written as

CEPT REPORT 30 Page 49
,
)(δg . )(δg . )(δg . . . )(δg .
(BS)OOB,BS
(TV),(TV),Pol(TV),(TV)A,TV),-(BSPL,BS)(,(BS)OOB,
CC,I,CCI,
1
1
PG
GGP
PP
M
θi
M
i
iiiii
i
(Eq A1.7)
and
, ACS
)(δg . )(δg . )(δg . . . )(δg . ACS
ACS
(BS)IB,BS
1
TV)(,(TV),PolTV)(,(TV)A,TV),-(BSPL,BS,(BS)IB,
1
AC,
1
AC,I,ACI,
1
11
PG
GGP
PPP
M
iiii
M
i
M
i
ii
ii
(Eq A1.8)
where all parameters are introduced in section.A1.1.2.
Substituting (Eq A1.6) and (Eq A1.8) into (Eq A1.5) and solving for the BS out-of-block EIRP, POOB,(BS), we have,
, ZACS SINR
1
, SINR ACS
, SINRSINR
(BS)IB,
1
BSIntraI,N
TTTT
BS
(BS)OOB,
(BS)IB,
1
BS(BS)OOB,BSIntraI,N
TTTT
ACI,CCI,IntraI,N
S
T
T
T
PGPPPG
GP
PGPGPP
PG
PPPP
P
(Eq A1.9)
where
)(δg . . . )(δg
(TV),(TV)A,TV)(TT,PL,TT)(,TT GGG
(Eq A1.10)
and
)(δg . )(δg . )(δg . . . )(δg 1
TV)(,TV)(,PolTV)(,(TV)A,TV),-(BSPL,BS,BS
M
iiiii
i
GGG
(Eq A1.11)
The protection criterion may be written as the requirement that
, Pr SINR SINRPr
(BS)OOB,T ZP (Eq A1.12)
where Pr{A} is the probability of event A, and the probability threshold is a design parameter.
Then the BEM out-of-block baseline level may be computed as follows:
Derive the statistical distribution of the random variable Z (see Eq. A1.9).
The out-of-block EIRP level, POOB,(BS), which satisfies the protection criterion has a value which is greater than Z with probability .
The above out-of-block EIRP level, POOB,(BS), is the appropriate BEM baseline limit, PBL.
A1.3.3 RESULTS FOR A NOMINAL TV RECEIVER ACS OF 50 dB
In this section, a first result is derived according to nominal ACS values. A “lower-power” 10 kW (72 dBm) DTT broadcast EIRP in combination with an “urban” 64 dBm ECN BS EIRP is considered. A “nominal” TV receiver ACS of 50 dB and infinity is assumed. The following figure shows the probability of failure as a function of the BEM baseline limit.

CEPT REPORT 30 Page 50
A TV receiver with an ACS of 50 dB would fail
in 12.4% of locations
The TV “failure rate” does notimprove significantly with a
reduction in BS BEM baselinebelow 0 dBm/(8 MHz).
In the absence of interference from ECN BSs, a TV receiver would fail to
achieve the required SNR of 21 dB at 1% of locations.
Figure A1.13: Probability of failure rate as a function of BEM baseline limit for an ECN BS EIRP of 64dBm
by the first adjacent channel considering nominal TV receiver ACS
It can be seen that interference is lower-bounded due to the finite TV receiver ACS of 50 dB. The fraction of loca-tions in which a TV receiver fails to achieve a SINR of 21 dB (failure rate) approaches an irreducible floor of 12.4% at a BS out-of-block EIRP of 0 dBm/(8 MHz).
In the absence of interference from ECN BS in band power (ACS equal to infinity), a TV receiver would fail to achieve the required SNR of 21dB at 1% of locations.
A1.3.4 RESULTS USING MEASURED TV RECEIVER ACS
A nominal value of TV receiver ACS has been considered so far in this analysis. In practice, the ACS drops with an increase in the received wanted signal power, as the receiver approaches saturation and overload (behaves non-linearly) and grows with an increase in the frequency separation between interferer and victim, as receiver filtering becomes more effective. For many existing receivers, an exception from this behaviour is the (N+9) effect.
Therefore, ACS derived from measurements20 are used in this section to model both of the above effects. Specifi-cally, an interpolation is realised between measurement points to capture the non-linear behaviour of the receiver as a function of received signal strength (i.e., saturation/blocking); and use measurements at appropriate frequency offsets corresponding to guard-bands of 0, 1, and 2 MHz between the BS (lower) channel edge and the 790 MHz boundary with DTT services.
The following subsection indicates the TV receiver ACS measurements used. The subsection after (A1.3.4.2) pro-vides the impact of these measurements on the BEM baseline level.
20 These measurements relate to what is considered to be an average performing DTT receiver (out of a total of 15 different units).
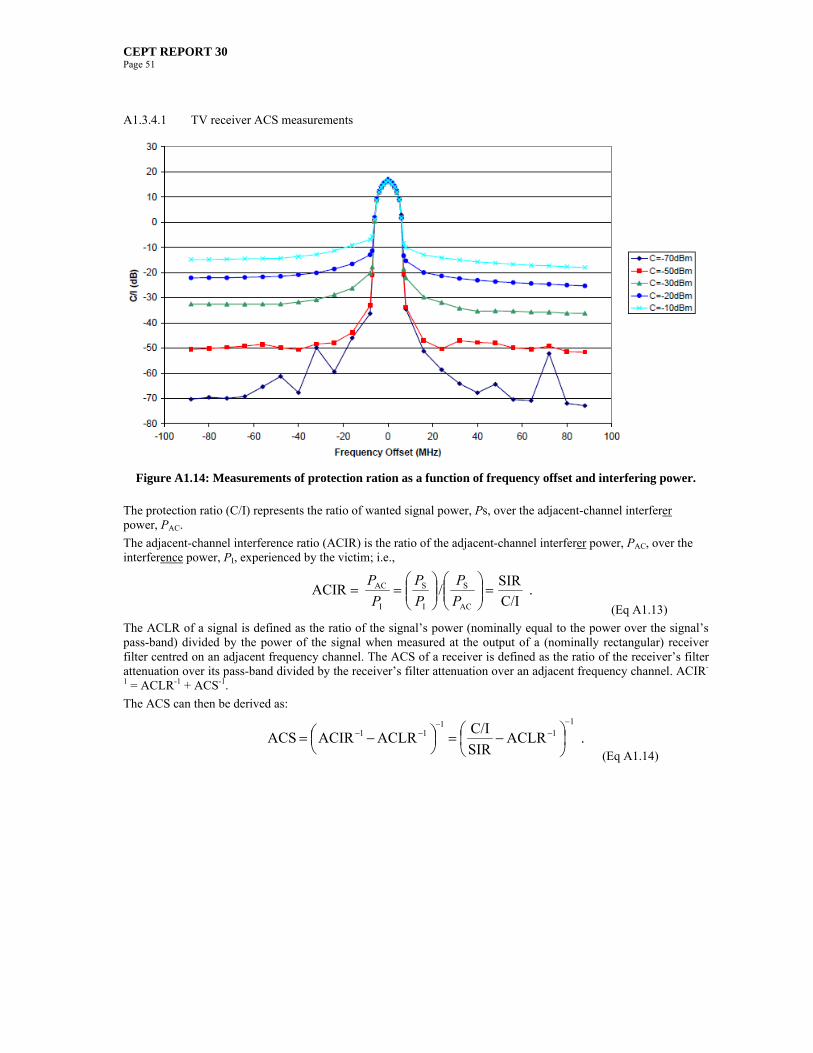
CEPT REPORT 30 Page 51
A1.3.4.1 TV receiver ACS measurements
Figure A1.14: Measurements of protection ration as a function of frequency offset and interfering power.
The protection ratio (C/I) represents the ratio of wanted signal power, Ps, over the adjacent-channel interferer power, PAC.
The adjacent-channel interference ratio (ACIR) is the ratio of the adjacent-channel interferer power, PAC, over the interference power, PI, experienced by the victim; i.e.,
. C/I
SIR/ ACIR
AC
S
I
S
I
AC
P
P
P
P
P
P
(Eq A1.13)
The ACLR of a signal is defined as the ratio of the signal’s power (nominally equal to the power over the signal’s pass-band) divided by the power of the signal when measured at the output of a (nominally rectangular) receiver filter centred on an adjacent frequency channel. The ACS of a receiver is defined as the ratio of the receiver’s filter attenuation over its pass-band divided by the receiver’s filter attenuation over an adjacent frequency channel. ACIR-
1 = ACLR-1 + ACS-1.
The ACS can then be derived as:
. ACLRSIR
C/IACLRACIRACS
11
111
(Eq A1.14)

CEPT REPORT 30 Page 52
5+2 MHz5+1 MHz5 MHz
66.966263.863260.8729ACLR (dB)
-10
-20
-30
-50
-70 58.102555.800053.3461
Ps(dBm)
27.403826.961826.4928
33.462932.690831.8674
41.874840.667639.3834
56.713054.847252.8505
Frequency offset from the790 MHz boundary
ACS(dB)
5+2 MHz5+1 MHz5 MHz
66.966263.863260.8729ACLR (dB)
-10
-20
-30
-50
-70 58.102555.800053.3461
Ps(dBm)
27.403826.961826.4928
33.462932.690831.8674
41.874840.667639.3834
56.713054.847252.8505
Frequency offset from the790 MHz boundary
ACS(dB)
Table A1. 11: ACS calculated values for the first adjacent channel based on protection ratio measurements
shown in Figure A1.14 for different guard band
25+2 MHz15+2 MHz5+2 MHz
117109.114966.9662ACLR (dB)
-10
-20
-30
-50
-70 79.444772.524558.1025
Ps(dBm)
30.875029.668927.4038
37.875036.683633.4629
49.750047.355541.8748
63.128965.479456.7130
Frequency offset from the790 MHz boundary
ACS(dB)
25+2 MHz15+2 MHz5+2 MHz
117109.114966.9662ACLR (dB)
-10
-20
-30
-50
-70 79.444772.524558.1025
Ps(dBm)
30.875029.668927.4038
37.875036.683633.4629
49.750047.355541.8748
63.128965.479456.7130
Frequency offset from the790 MHz boundary
ACS(dB)
Table A1.12: ACS calculated values for the first, second and third adjacent channels based on protection
ratio measurements shown in A1.14 (2 MHz guard band is assumed here)
For any specific frequency offset, a linear interpolation between the curves to capture the effects of saturation is performed. For Ps > -10 dBm, we assume that the receiver completely fails (overload).
Measurements of protection ratios (C/I) for DVB-T interference into a DTT receiver for different received power levels (C). Measurements relate to what is considered to be an average performing DTT receiver (out of 15 different units tested). Note that the protection ratio measured at zero offset represents the signal-to-interference ratio, SIR.
A1.3.4.2 Impact of TV receiver ACS measurements on the BEM baseline level
The same analysis as in section A1.3.3 is realized. We again consider a “lower-power” 10 kW (72 dBm) DTT broadcast EIRP in combination with an “urban” 64 dBm ECN EIRP in this section21. The difference is that this analysis used now measured ACS values (as detailed in the previous subsection) to model TV receiver performance at different frequency offsets and different received signal levels. The ACS measurements allow an assessment of the impact of guard-bands at 790 MHz, as well as interference from non-adjacent channels.
21 For the downlink to be balanced with the uplink, an ECN BS EIRP of 59 dBm is sufficient. An increase in the ECN BS EIRP would not be beneficial in interference limited cells, as this would not improve the DL SIR. In environments where the cell is noise-limited, however, the BS EIRP can be increased (e. g., up to 64 or 67 dBm) to provide greater DL throughput (but the cell size would remain unchanged due limits in the UL link-budget).
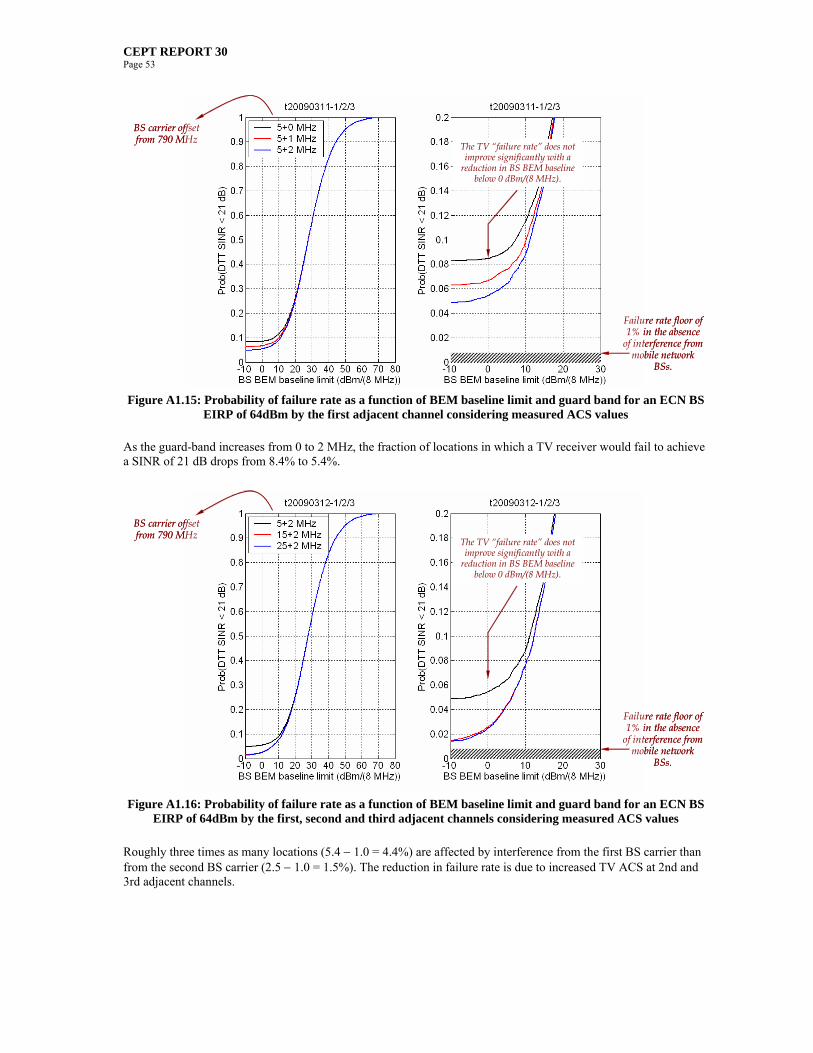
CEPT REPORT 30 Page 53
Failure rate floor of 1% in the absence
of interference from mobile network
BSs.
BS carrier offset from 790 MHz
The TV “failure rate” does notimprove significantly with a
reduction in BS BEM baselinebelow 0 dBm/(8 MHz).
Failure rate floor of 1% in the absence
of interference from mobile network
BSs.
BS carrier offset from 790 MHz
The TV “failure rate” does notimprove significantly with a
reduction in BS BEM baselinebelow 0 dBm/(8 MHz).
Figure A1.15: Probability of failure rate as a function of BEM baseline limit and guard band for an ECN BS
EIRP of 64dBm by the first adjacent channel considering measured ACS values
As the guard-band increases from 0 to 2 MHz, the fraction of locations in which a TV receiver would fail to achieve a SINR of 21 dB drops from 8.4% to 5.4%.
BS carrier offset from 790 MHz
Failure rate floor of 1% in the absence
of interference from mobile network
BSs.
The TV “failure rate” does notimprove significantly with a
reduction in BS BEM baselinebelow 0 dBm/(8 MHz).
BS carrier offset from 790 MHz
Failure rate floor of 1% in the absence
of interference from mobile network
BSs.
The TV “failure rate” does notimprove significantly with a
reduction in BS BEM baselinebelow 0 dBm/(8 MHz).
Figure A1.16: Probability of failure rate as a function of BEM baseline limit and guard band for an ECN BS
EIRP of 64dBm by the first, second and third adjacent channels considering measured ACS values
Roughly three times as many locations (5.4 1.0 = 4.4%) are affected by interference from the first BS carrier than from the second BS carrier (2.5 1.0 = 1.5%). The reduction in failure rate is due to increased TV ACS at 2nd and 3rd adjacent channels.

CEPT REPORT 30 Page 54
A1.3.4 SENSITIVITY ANALYSIS TO DTT AND ECN EIRP
In this section, different combinations are considered to assess sensitivity of the results. First of all, the impact of the DTT power is estimated using two values (“high-power” 50 kW and “low-power” 10 kW DTT broadcast EIRP). This is associated with two sub-scenarios in urban or rural areas which assume either a noise limited ECN cell (ECN cell size estimated by ECN downlink budget) or an interference limited ECN cell (ECN cell size estimated by ECN uplink budget).
“rural”/ “urban” 67 dBm/64 dBm ECN BS EIRP (noise limited cells), or
“rural”/“urban” 59 dBm ECN BS EIRP (interference-limited cells).
ACS values (as detailed previously) derived from a measurement are used to model TV receiver performance at different frequency offsets and different received signal levels. Results are only presented for an ECN BS carrier offset of 5+2 MHz from 790 MHz but similar conclusion is expected for the other guard bands.
Failure rate floor of 1% in the absence
of interference from mobile network
BSs.
The TV “failure rate” does not improve significantly
with a reduction in BS BEM baseline
below 0 dBm/(10 MHz).
Failure rate floor of 1% in the absence
of interference from mobile network
BSs.
The TV “failure rate” does not improve significantly
with a reduction in BS BEM baseline
below 0 dBm/(10 MHz).
Figure A1.17: Probability of failure rate as a function of BEM baseline limit and various assumptions on DTT and ECN
EIRP (interference limited scenario)
The highest failure rates occur for low-power DTT in combination with urban (small-cell) ECN. Note that failure rate refers to percentage of locations and not actual number of TVs affected (which is a function of population den-sity).

CEPT REPORT 30 Page 55
The TV “failure rate” does not improve significantly
with a reduction in BS BEM baseline
below 0 dBm/(10 MHz).
Failure rate floor of 1% in the absence
of interference from mobile network
BSs.
The TV “failure rate” does not improve significantly
with a reduction in BS BEM baseline
below 0 dBm/(10 MHz).
Failure rate floor of 1% in the absence
of interference from mobile network
BSs.
Figure A1.18: Probability of failure rate as a function of BEM baseline limit and various assumptions on
DTT and ECN EIRP (noise limited scenario)
The highest failure rates occur for low-power DTT in combination with high-power rural (large cell) ECN. Note that failure rate refers to percentage of locations and not actual number of TVs affected (which is a function of popula-tion density).
A1.3.5 MITIGATION BROUGHT BY IMPROVED ACS RECEIVERS
It is considered a “lower-power” 10 kW (72 dBm) DTT broadcast EIRP in combination with an “urban” 64 dBm ECN EIRP in this section22. We assess the mitigating impact of improved filtering at TV receivers.
Interference is evaluated as a function of
nominal TV ACS values of 40, 50, 60, 70, and 80 dB, and
improvements of up to 30 dB with respect to measured TV ACS values given an ECN BS carrier offset of 5+2 MHz from 790 MHz.
22 For the downlink to be balanced with the uplink, an ECN BS EIRP of 59 dBm is sufficient. An increase in the ECN BS EIRP would not be beneficial in interference limited cells, as this would not improve the DL SIR. In environments where the cell is noise-limited, however, the BS EIRP can be increased (e. g., up to 64 or 67 dBm) to provide greater DL throughput (but the cell size would remain unchanged due limits in the UL link-budget).

CEPT REPORT 30 Page 56
A1.3.5.1 Mitigation brought by improved nominal ACS receivers
Failure rate floor of 1% in the absence
of interference from mobile network
BSs.
Failure rate floor of 1% in the absence
of interference from mobile network
BSs.
Figure A1.19: Probability of failure rate as a function of BEM baseline limit and TV receiver ACS (nominal
values)
For a TV receiver ACS of 80 dB, the fraction of locations in which a TV receiver would fail to achieve a SINR of 21 dB drops to 2.4%.
A1.3.5.2 Mitigation brought by improved measured ACS receivers
Failure rate floor of 1% in the absence
of interference from mobile network
BSs.
Failure rate floor of 1% in the absence
of interference from mobile network
BSs.
Figure A1.20: Probability of failure rate as a function of BEM baseline limit and TV receiver ACS
(measured values)

CEPT REPORT 30 Page 57
ACSo is the measured TV ACSfor a BS carrier at an offset of 5+2 MHz from 790 MHz. For a TV receiver ACS that is 30 dB better than the measured values, the fraction of locations in which a TV receiver would fail to achieve a SINR of 21 dB drops to 2.4%.
A1.3.6 MITIGATION BROUGHT BY CROSS POLAR DISCRIMINATION
It is considered a “lower-power” 10 kW (72 dBm) DTT broadcast EIRP in combination with an “urban” 64 dBm ECN EIRP in this section23. We assess the mitigating impact of a 16 dB cross-polar discrimination at TV receiver antennas.
ACS values derived from a measurement are used to model TV receiver performance at different frequency offsets and different received signal levels. We assume an ECN BS carrier offset of 5+2 MHz from 790 MHz for illustra-tion. Similar conclusion s expected for the other guard bands.
Failure rate floor of 1% in the absence
of interference from mobile network
BSs.
Failure rate floor of 1% in the absence
of interference from mobile network
BSs.
Figure A1.21: Probability of failure rate as a function of BEM baseline limit and cross polar discrimination
For a cross-polar discrimination of 16 dB, the fraction of locations in which a TV receiver would fail to achieve a SINR of 21 dB drops from 5.4% to 3.1%.
A1.3.7 CONCLUSION ON THE MONTE-CARLO ANALYSIS
A Monte-Carlo analysis has been performed in this section to assess the probability of failure rate according to dif-ferent sets of assumptions. A sensitivity analysis is also realised to estimate the impact on the results of other sets of assumptions. In addition, some mitigation techniques are also considered to evaluate their impact. In Figure A1.22 below which summarises all these evaluations.
23 For the downlink to be balanced with the uplink, a BS EIRP of 59 dBm/(10 MHz) is sufficient.

CEPT REPORT 30 Page 58
Figure A1.22: Summary of the different impact assessments on the probability of TV failure rate as a func-
tion of BEM baseline limit for EIRP BS of 64 dBm
The overall conclusion of this analysis suggests that the impact of interference from ECN BSs to DTT services is ultimately lower bounded due to the finite frequency selectivity of the TV receivers; i.e., the impact of interference can not be arbitrarily reduced through a reduction of the BS out-of-block (OOB) emissions alone.
Simulations of urban geometries indicate that, for a BS in-block EIRP of 64 dBm/(10 MHz) (noise-limited ECL cells), and measured values of TV receiver adjacent-channel selectivity (ACS) for a 1 MHz guard-band, the fraction of locations in which a TV receiver may suffer unacceptable levels24 of interference from BSs is equal to 5.8% to 6.1%25 given a BS out-of-block EIRP of 0 to -10 dBm/(8 MHz)26; For a BS in-block EIRP of 59 dBm/(10 MHz) (interference-limited ECN cells), the corresponding failure rates are 2% to 2.6%.
The size of a guard-band above 790 MHz effects the level of interference to DTT services. This is because the ACS of TV receivers increases as a function of the interferer’s frequency offset from the carrier.
Simulations of urban geometries indicate that, for a BS in-block EIRP of 64 dBm/(10 MHz) in “noise-limited” ECL cells, as the guard-band increases from 0 to 2 MHz, the fraction of locations in which a TV receiver may suffer unacceptable levels of interference decreases from 8.4% to 5.4%27.
Simulations also indicate that mitigation measures such as cross-polar discrimination and/or improved filtering at TV receivers can significantly reduce the impact of interference.
Finally, results indicate that the fraction of locations in which a TV receiver may suffer unacceptable levels of inter-ference does not improve significantly with a reduction in the ECN BS BEM baseline below 0 dBm/(8 MHz).
A1.4 COMPLEMENTARY ANALYSIS
A1.4.1 INTRODUCTION
The simulations carried on in sections A1.2 and A1.3 used ‘high power’ BS EIRPs, e.g. 59 dBm to 67 dBm, and the results are obtained by averaging over the entire broadcasting (BC) coverage area. In this section, a similar Monte-Carlo Analysis has been carried out within circular areas starting from the ECN base station and extending until to the edge of the ECN cell. It shows the impact of the ECN interference on the location probability of the Broadcast-ing service.
This section is also intended to check if the BEM Baseline of 0dBm might be acceptable when decreasing BS EIRP power. Among other things, it is shown in the following sections that these same criteria which are used to propose BEM Baseline value give differing results depending on the Base Station in-block power, and also on the area over which the averaging is being done.
24 Where SINR falls below the minimum required value of 21 dB (64QAM, rate 2/3 coding). 25 Note that these percentage failure rates relates to area coverage and not population coverage. No mitigation measures are assumed in deriving
these percentages. In the absence of interference from ECN BSs the failure rate equals 1%. 26 Effectively a base station ACLR of 63 to 73 dB. 27 Note that these percentages relates to area coverage and not population coverage. No mitigation measures are assumed in deriving these
percentages. In the absence of interference from ECN BSs the failure rate equals 1%.
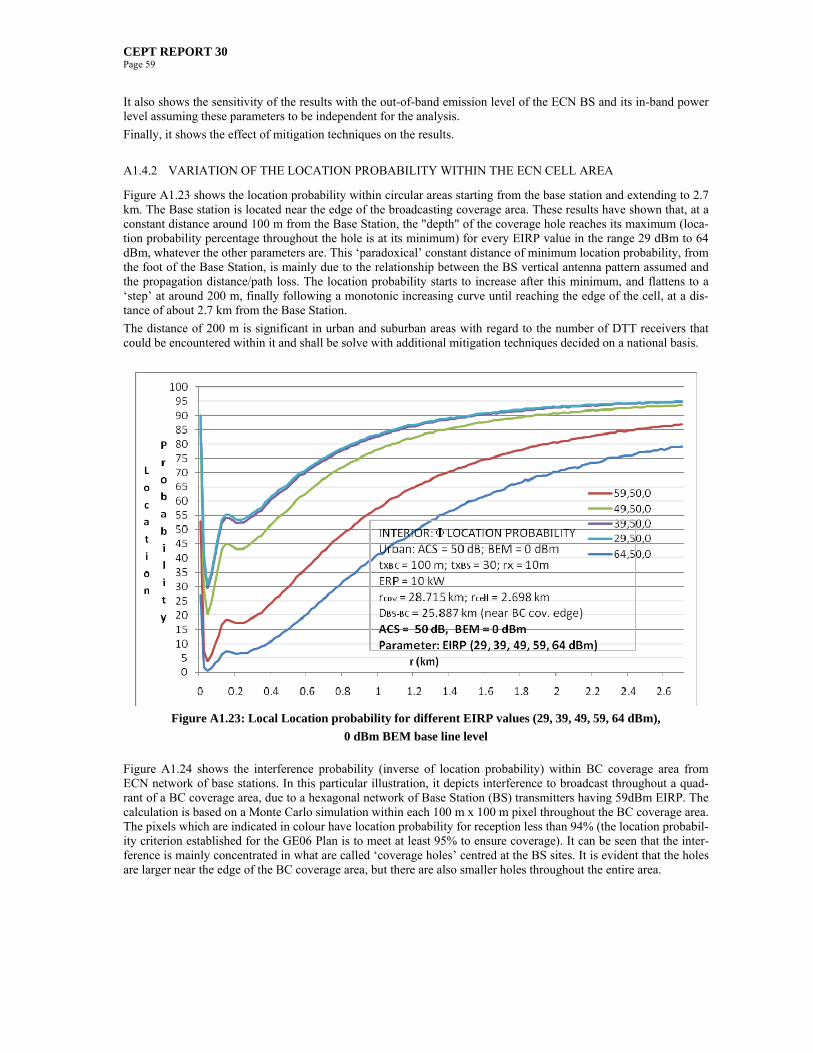
CEPT REPORT 30 Page 59
It also shows the sensitivity of the results with the out-of-band emission level of the ECN BS and its in-band power level assuming these parameters to be independent for the analysis.
Finally, it shows the effect of mitigation techniques on the results.
A1.4.2 VARIATION OF THE LOCATION PROBABILITY WITHIN THE ECN CELL AREA
Figure A1.23 shows the location probability within circular areas starting from the base station and extending to 2.7 km. The Base station is located near the edge of the broadcasting coverage area. These results have shown that, at a constant distance around 100 m from the Base Station, the "depth" of the coverage hole reaches its maximum (loca-tion probability percentage throughout the hole is at its minimum) for every EIRP value in the range 29 dBm to 64 dBm, whatever the other parameters are. This ‘paradoxical’ constant distance of minimum location probability, from the foot of the Base Station, is mainly due to the relationship between the BS vertical antenna pattern assumed and the propagation distance/path loss. The location probability starts to increase after this minimum, and flattens to a ‘step’ at around 200 m, finally following a monotonic increasing curve until reaching the edge of the cell, at a dis-tance of about 2.7 km from the Base Station.
The distance of 200 m is significant in urban and suburban areas with regard to the number of DTT receivers that could be encountered within it and shall be solve with additional mitigation techniques decided on a national basis.
Figure A1.23: Local Location probability for different EIRP values (29, 39, 49, 59, 64 dBm),
0 dBm BEM base line level
Figure A1.24 shows the interference probability (inverse of location probability) within BC coverage area from ECN network of base stations. In this particular illustration, it depicts interference to broadcast throughout a quad-rant of a BC coverage area, due to a hexagonal network of Base Station (BS) transmitters having 59dBm EIRP. The calculation is based on a Monte Carlo simulation within each 100 m x 100 m pixel throughout the BC coverage area. The pixels which are indicated in colour have location probability for reception less than 94% (the location probabil-ity criterion established for the GE06 Plan is to meet at least 95% to ensure coverage). It can be seen that the inter-ference is mainly concentrated in what are called ‘coverage holes’ centred at the BS sites. It is evident that the holes are larger near the edge of the BC coverage area, but there are also smaller holes throughout the entire area.
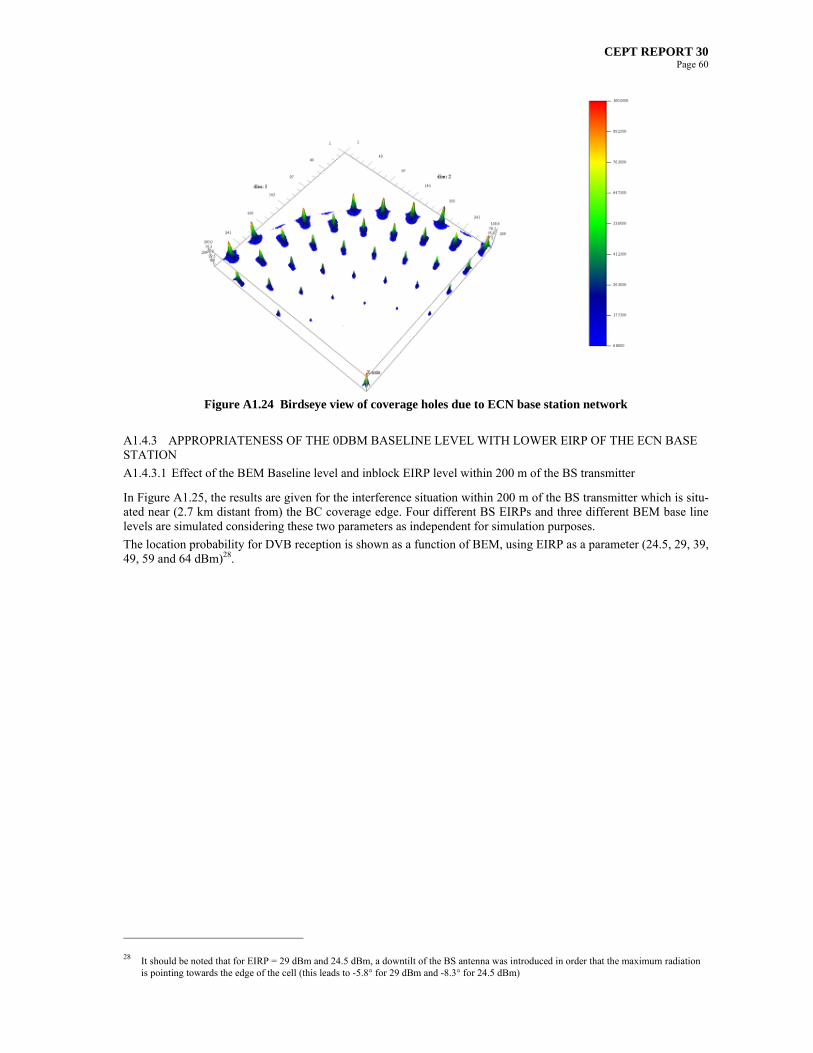
CEPT REPORT 30 Page 60
Figure A1.24 Birdseye view of coverage holes due to ECN base station network
A1.4.3 APPROPRIATENESS OF THE 0DBM BASELINE LEVEL WITH LOWER EIRP OF THE ECN BASE STATION
A1.4.3.1 Effect of the BEM Baseline level and inblock EIRP level within 200 m of the BS transmitter
In Figure A1.25, the results are given for the interference situation within 200 m of the BS transmitter which is situ-ated near (2.7 km distant from) the BC coverage edge. Four different BS EIRPs and three different BEM base line levels are simulated considering these two parameters as independent for simulation purposes.
The location probability for DVB reception is shown as a function of BEM, using EIRP as a parameter (24.5, 29, 39, 49, 59 and 64 dBm)28.
28 It should be noted that for EIRP = 29 dBm and 24.5 dBm, a downtilt of the BS antenna was introduced in order that the maximum radiation is pointing towards the edge of the cell (this leads to -5.8° for 29 dBm and -8.3° for 24.5 dBm)
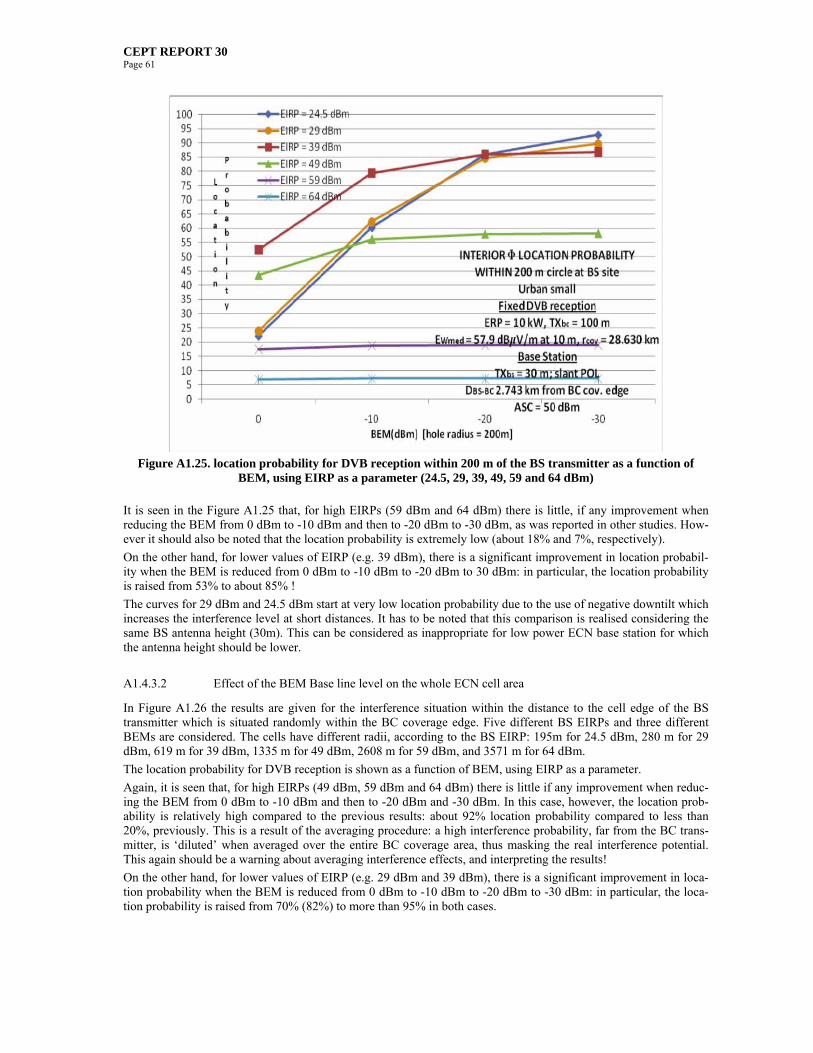
CEPT REPORT 30 Page 61
Figure A1.25. location probability for DVB reception within 200 m of the BS transmitter as a function of
BEM, using EIRP as a parameter (24.5, 29, 39, 49, 59 and 64 dBm)
It is seen in the Figure A1.25 that, for high EIRPs (59 dBm and 64 dBm) there is little, if any improvement when reducing the BEM from 0 dBm to -10 dBm and then to -20 dBm to -30 dBm, as was reported in other studies. How-ever it should also be noted that the location probability is extremely low (about 18% and 7%, respectively).
On the other hand, for lower values of EIRP (e.g. 39 dBm), there is a significant improvement in location probabil-ity when the BEM is reduced from 0 dBm to -10 dBm to -20 dBm to 30 dBm: in particular, the location probability is raised from 53% to about 85% !
The curves for 29 dBm and 24.5 dBm start at very low location probability due to the use of negative downtilt which increases the interference level at short distances. It has to be noted that this comparison is realised considering the same BS antenna height (30m). This can be considered as inappropriate for low power ECN base station for which the antenna height should be lower.
A1.4.3.2 Effect of the BEM Base line level on the whole ECN cell area
In Figure A1.26 the results are given for the interference situation within the distance to the cell edge of the BS transmitter which is situated randomly within the BC coverage edge. Five different BS EIRPs and three different BEMs are considered. The cells have different radii, according to the BS EIRP: 195m for 24.5 dBm, 280 m for 29 dBm, 619 m for 39 dBm, 1335 m for 49 dBm, 2608 m for 59 dBm, and 3571 m for 64 dBm.
The location probability for DVB reception is shown as a function of BEM, using EIRP as a parameter.
Again, it is seen that, for high EIRPs (49 dBm, 59 dBm and 64 dBm) there is little if any improvement when reduc-ing the BEM from 0 dBm to -10 dBm and then to -20 dBm and -30 dBm. In this case, however, the location prob-ability is relatively high compared to the previous results: about 92% location probability compared to less than 20%, previously. This is a result of the averaging procedure: a high interference probability, far from the BC trans-mitter, is ‘diluted’ when averaged over the entire BC coverage area, thus masking the real interference potential. This again should be a warning about averaging interference effects, and interpreting the results!
On the other hand, for lower values of EIRP (e.g. 29 dBm and 39 dBm), there is a significant improvement in loca-tion probability when the BEM is reduced from 0 dBm to -10 dBm to -20 dBm to -30 dBm: in particular, the loca-tion probability is raised from 70% (82%) to more than 95% in both cases.
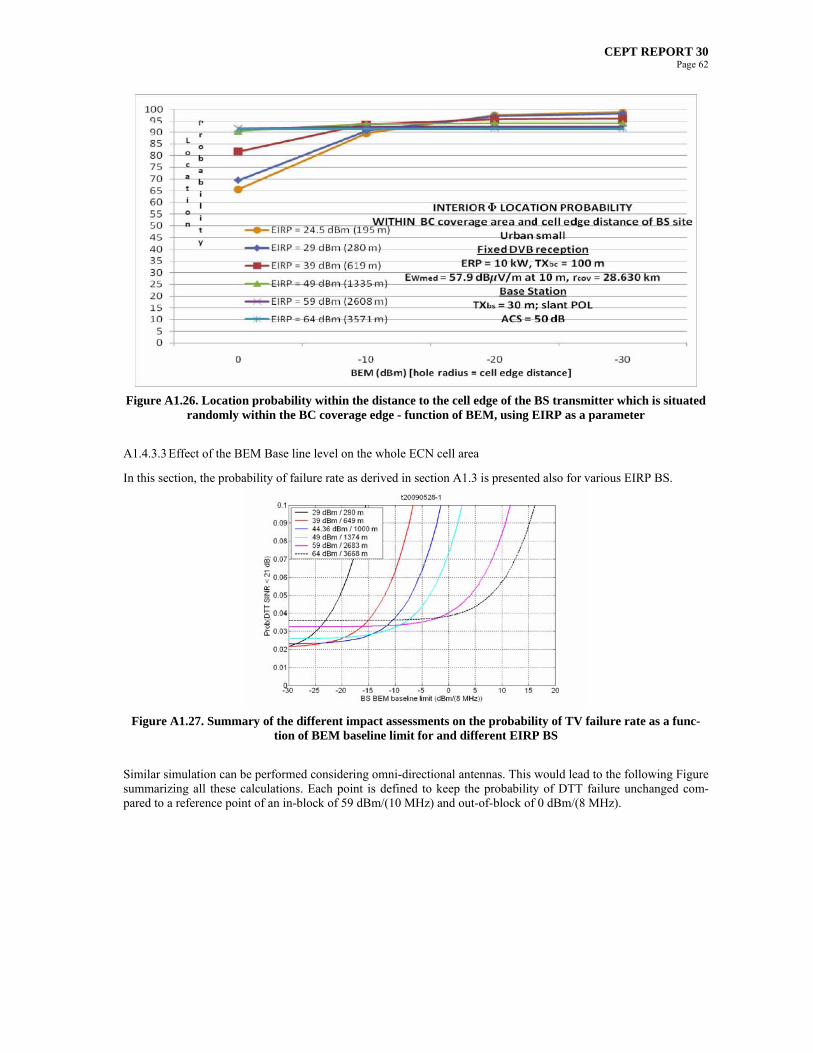
CEPT REPORT 30 Page 62
Figure A1.26. Location probability within the distance to the cell edge of the BS transmitter which is situated
randomly within the BC coverage edge - function of BEM, using EIRP as a parameter
A1.4.3.3 Effect of the BEM Base line level on the whole ECN cell area
In this section, the probability of failure rate as derived in section A1.3 is presented also for various EIRP BS.
Figure A1.27. Summary of the different impact assessments on the probability of TV failure rate as a func-
tion of BEM baseline limit for and different EIRP BS
Similar simulation can be performed considering omni-directional antennas. This would lead to the following Figure summarizing all these calculations. Each point is defined to keep the probability of DTT failure unchanged com-pared to a reference point of an in-block of 59 dBm/(10 MHz) and out-of-block of 0 dBm/(8 MHz).
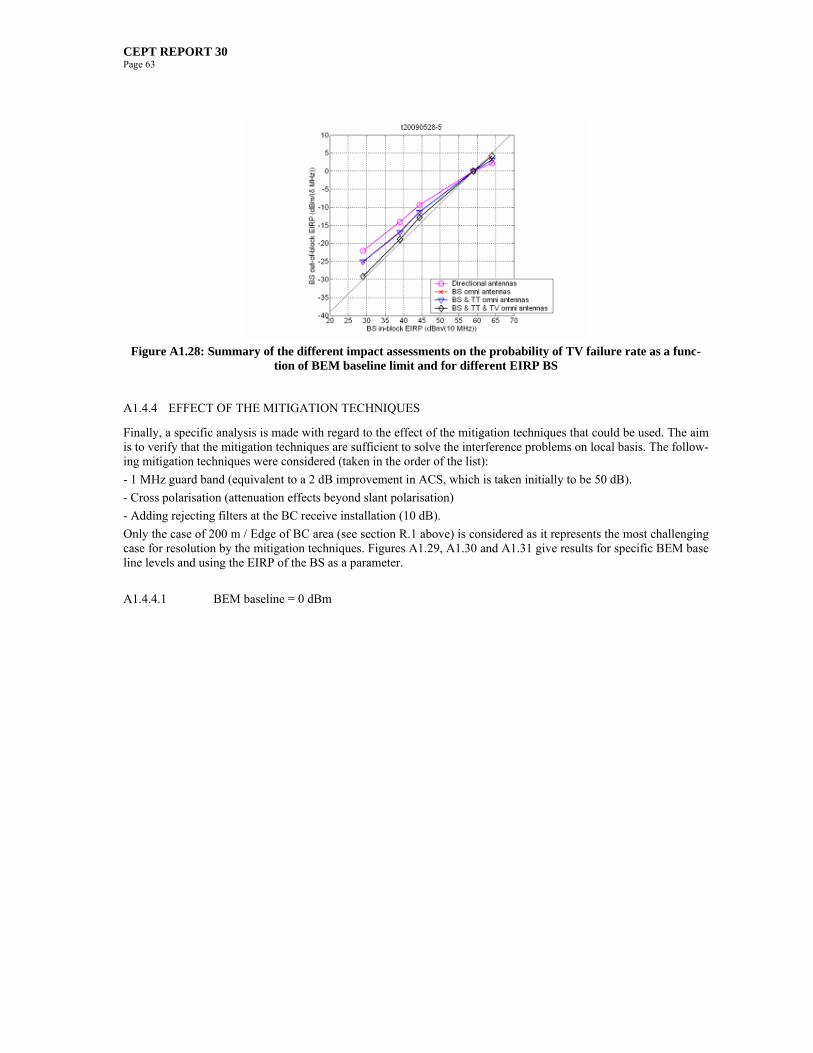
CEPT REPORT 30 Page 63
Figure A1.28: Summary of the different impact assessments on the probability of TV failure rate as a func-
tion of BEM baseline limit and for different EIRP BS
A1.4.4 EFFECT OF THE MITIGATION TECHNIQUES
Finally, a specific analysis is made with regard to the effect of the mitigation techniques that could be used. The aim is to verify that the mitigation techniques are sufficient to solve the interference problems on local basis. The follow-ing mitigation techniques were considered (taken in the order of the list):
- 1 MHz guard band (equivalent to a 2 dB improvement in ACS, which is taken initially to be 50 dB).
- Cross polarisation (attenuation effects beyond slant polarisation)
- Adding rejecting filters at the BC receive installation (10 dB).
Only the case of 200 m / Edge of BC area (see section R.1 above) is considered as it represents the most challenging case for resolution by the mitigation techniques. Figures A1.29, A1.30 and A1.31 give results for specific BEM base line levels and using the EIRP of the BS as a parameter.
A1.4.4.1 BEM baseline = 0 dBm
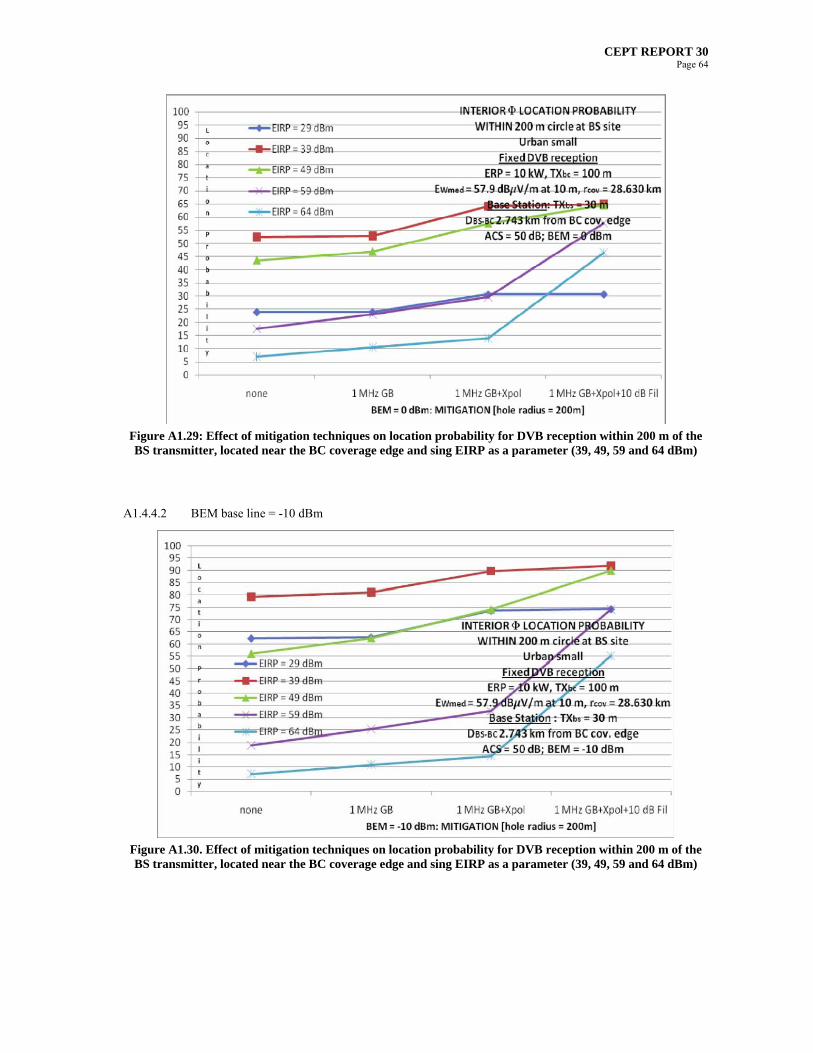
CEPT REPORT 30 Page 64
Figure A1.29: Effect of mitigation techniques on location probability for DVB reception within 200 m of the BS transmitter, located near the BC coverage edge and sing EIRP as a parameter (39, 49, 59 and 64 dBm)
A1.4.4.2 BEM base line = -10 dBm
Figure A1.30. Effect of mitigation techniques on location probability for DVB reception within 200 m of the BS transmitter, located near the BC coverage edge and sing EIRP as a parameter (39, 49, 59 and 64 dBm)

CEPT REPORT 30 Page 65
A1.4.4.3 BEM base line = -20 dBm
Figure A1.31. Effect of mitigation techniques on location probability for DVB reception within 200 m of the BS transmitter, located near the BC coverage edge and sing EIRP as a parameter (39, 49, 59 and 64 dBm)
A1.4.4.4 Analysis
The following remarks can be made with respect to the interference caused to DVB reception within 200 m of the BS transmitter.
In general, from Figures A1.29, A1.30 and A1.31, it can be seen that decreasing BEM from 0 dBm to -20 dBm im-proves greatly the location probability for DVB reception for low power EIRP BS transmitters, whereas there is little effect for high power EIRP BS transmitters
It can also be seen that mitigation techniques ‘mitigate’ less with lower EIRP values (e.g. 39 dBm) than with high EIRP values (e.g. 59 dBm or 64 dBm). On the other hand, with low EIRP powers, and low BEM values (-20 dBm), there is less need for mitigation.
It can be seen from these Figures that, with high power BS EIRP, 59 dBm or 64 dBm, interference cannot be ‘miti-gated’, whatever the value of BEM: the location probability for DVB reception is at best only 75% or 55%, respec-tively.
It can be seen from Figure A1.29 that with an intermediate BS EIRP, 49 dBm, interference can be ‘mitigated’ (i.e. resulting in a location probability of about 95% within 200 m of the BS transmitter) with a BEM = -20 dBm, and in addition all of the examined mitigation techniques implemented: 1 MHz guard band, cross polarisation, and a 10 dB filter at the receiver.
A1.5 CONCLUSION
The different set of studies realised so far show that the impact of interference can not be arbitrarily reduced through a reduction of the BS out-of-block (OoB) emission alone due to finite TV receiver selectivity. They show that inter-ference probability from base stations to DVB-T receivers across the DVB-T coverage area may range from a few percent to about 10 % depending on the base station block-edge mask (BEM) baseline EIRP29 (i.e. up to 10 dBm/8 MHz) and on the assumed value for the TV receiver adjacent channel selectivity. Therefore, other mitigation mechanisms (beyond the BEM baseline level) would ultimately be required if the protection delivered by the BEM only is considered insufficient by an administration.
Finally, simulations over a range of scenarios indicate that the fraction of locations in which a TV receiver may suffer unacceptable levels of interference (failure rate) does not improve significantly with a reduction in the ECN
29 The baseline level refers to the out-of-block (OOB) portion of the BEM.

CEPT REPORT 30 Page 66
BS BEM baseline below 0 dBm/(8 MHz), based on typical measured values for ACS and on a range of high EIRP of the base station (59 dBm/10MHz). However, for lower EIRP levels, this fraction of locations in which a TV receiver may suffer unacceptable levels of interference (failure rate) shows significant improvement with a reduction in the ECN BS BEM baseline. This can be summarized with the Figure A1.32 below.
Figure A1.32. Proposition to derive the BEM baseline level as a function of base station in-block EIRP
This conclusion is valid for situations where the first ECN adjacent channel to a DTT channel is used. In that case, the MCL analysis gives an idea of the extent of this interfered area located around each ECN base station. It has also to be noted that a baseline of 0 dBm/8 MHz may result in a significant constraint for ECN base station when the TV channel is adjacent to the ECN block (e.g. in the case of channel 60) and that it may not be necessary in areas where frequency offset between DTT channel and ECN channels is higher. On the other hand, it was also noted that broad-casting planning may evolve and that a channel not used in an area may be used in the future, after deployment of ECN base stations.
Therefore, it can be suggested that, in the case of the implementation of the full sub-band 790-862 MHz for ECN networks, OOB BEM for base station would be as follows in areas where broadcasting channel 60 (782-790 MHz) needs to be protected (e.g. where channel 60 is actually used or where an administration decides to protect it for future use) :
Description Condition on base station E.I.R.P. P (dBm/10MHz)
Maximum mean out-of-block EIRP
Measurement bandwidth
P 59 dBm 0 dBm 8 MHz
36 dBm P < 59 dBm P-59 dB 8 MHz For DTT frequencies where broadcasting needs to be pro-tected P < 36 dBm - 23 dBm 8 MHz
Table A1.12: OOB BEM for base station in areas where broadcasting channel 60 (782-790 MHz) needs to be protected (e.g. where channel 60 is actually used or where an administration decides to protect it for future
use)
Additional mitigation techniques are required to solve the remaining interference cases on a local.
5936
0
-23
In-block EIRPdBm/(10 MHz)
Out -of -block EIRPdBm/(8 MHz)
59
0
-
In-block EIRPdBm/(10 MHz)
Out -of -block EIRPdBm/(8 MHz)

CEPT REPORT 30 Page 67
ANNEX 2: COMPLEMENTARY STUDIES FOR CONFIRMATION OF ECN BS BEM FOR PORTABLE RECEPTION
These complementary generic studies are related to the portable reception mode of DTT (for fixed see Annex 1).
The goal of these generic studies is the investigation of the possible impact on DTT portable reception of the ECN BS baseline level derived for fixed reception by comparison of results obtained for fixed and for portable indoor reception. They were based on the same methodology as used for the studies related to protection of fixed reception.
A2.1 DESCRIPTION OF THE SIMULATION PROCESS
For simplification and comparison, the same methodologies used for fixed reception are applied for portable recep-tion and the most critical scenario was selected: scenario 1, urban (small city). The geometry, the ECN network and the propagation model including the penetration loss are described in detail in Annex 1 section A1.1
In addition to the assumptions considered in Annex 1 and relevant for the protection of DTT portable mode, addi-tional assumptions for DVB-T, portable indoor have been considered in this annex:
Minimum median field strength: 64.5 dB(V/m) portable indoor at 1.5 m (90.5 dB(V/m) at 10 m, 72.5 dB(V/m) at 1.5 m outdoor)
Protection ratio for 16 QAM 2/3: portable indoor: -33 dB for the first and -43 dB for the second adjacent channel (See ECC Report 138 [12] developed by TG4)
DVB-T transmitter: 50 kW erp at 200 m
DVB-T receiver: antenna gain: 0 dBd, omnidirectional pattern
Minimum input receiver power of the DVB-T receiver: -81.2 dBm (compared with fixed reception: -77.2 dBm)
Vertical antenna pattern of DVB-T Tx as shown below.
Figure A2.1: Simplified DVB-T Tx antenna pattern (red curve)

CEPT REPORT 30 Page 68
DTT cell size according to mean received signal strength, parameters taken from GE06
Parameter Units Downlink Comment
Link BW MHz 7,60 Bandwidth occupied by link
Thermal spectral density dBm/Hz -173.98 kTB
Receiver noise figure dB 7 N/A
Noise power (inc. NF) over link BW dBm -98.17 Pn = kTB.NF plus any noise rise
Cell edge reliability N/A 95.0% SE42 modelling assumption
Gaussian confidence factor N/A 1.645 N/A
Shadowing loss standard deviation dB 5.5 P.1546
Wall loss standard deviation dB 5.5 GE06
Total loss standard deviation dB 7.78 Root of sum of STD squares
Loss margin dB 12.79 Lmargin
Minimum SNR at cell-edge dB 17.00 SNRmin for DTT
Target "mean" received signal level dBm -68.37 Ptarget = (Pn + SNR) + Lmargin
EIRP dBm 79.15 P
Mean wall loss dB 8.0 Lw
Receiver Antenna Gain (inc. losses) dBi 2.15 Ga
Max allowed path loss dB 141.67 Lp = (P - Lw + Ga) - Ptarget
200 m, urban, 1.5 m, 50 % (CG-P-001-EBU…) EBU-curves
alpha dB 105.636 9-15 km
beta 35.170 9-15 km
Radio path km 10.585 D= POTENZ(10;(Lp-alpha)/beta)
DTT transmitter height m 200.000 Ht
DVB-T Rx height m 1.500 Hr
cell size km 10.583 d= SQRT(D*D-(ht-hr)*(ht-hr)/1000000)
Table A2.1 Cell radius for DVB-T portable indoor: 10.583 km
Interference from ECN on DTT impacts different locations of the DTT cell according to the perceived SINR. Ele-mentary interfered areas are located around ECN BS. They are called holes in DTT coverage and estimated in sec-tion A2.2. The aggregation at the DTT cell-edge or across the entire DTT cell of these elementary interfered areas leads to the determination of the DTT failure rate. They are estimated in section A2.3.
A2.2. HOLES IN DTT COVERAGE AT THE CELL-EDGE
General description:
The interference scenario deals with DVB-T reception in most ‘sensitive’ areas, i.e. in areas near the edge of a DVB-T coverage area (see the Figure A2.2). The ECN BS is situated ‘far from’ the DTT transmitter (i.e. near the coverage edge). Within the shaded area, the location probability for acceptable broadcast reception has been reduced to below 95% resulting in a coverage hole.
The Monte Carlo simulation is only carried out within the semi-circle nearest the edge.
The calculation is carried out for the portable indoor DVB configuration, and again for the fixed DVB-T outdoor configuration, in each case near the corresponding coverage edge.
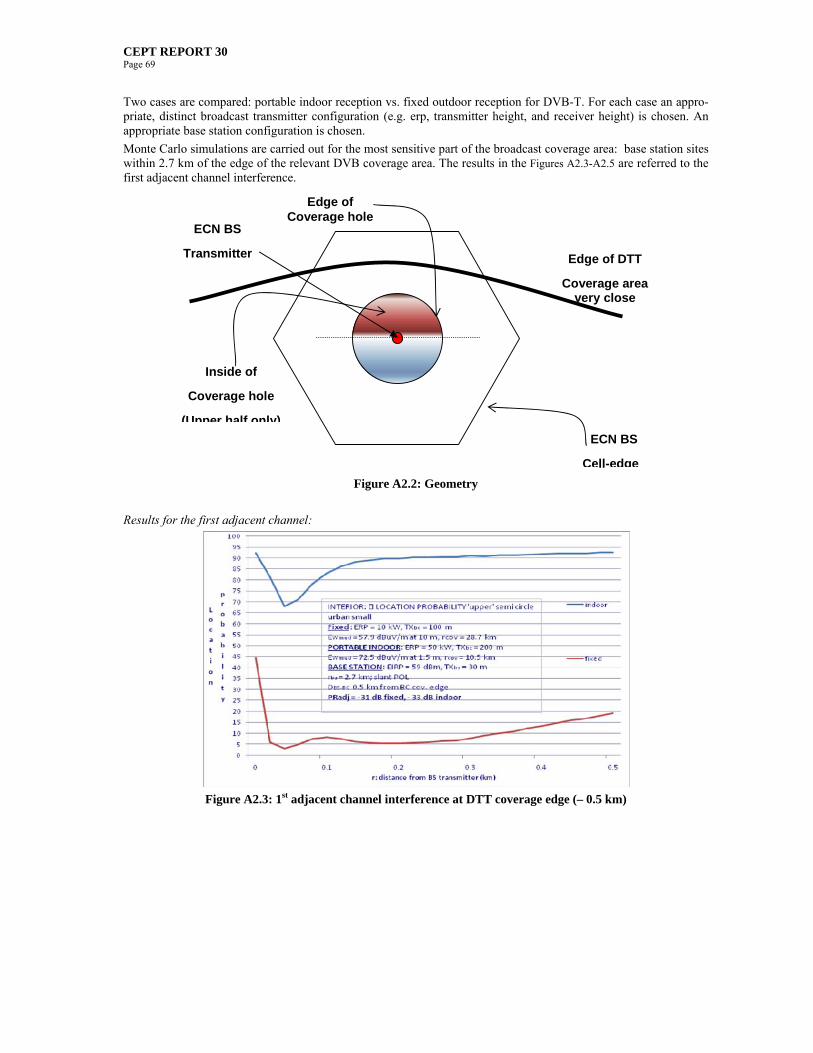
CEPT REPORT 30 Page 69
Two cases are compared: portable indoor reception vs. fixed outdoor reception for DVB-T. For each case an appro-priate, distinct broadcast transmitter configuration (e.g. erp, transmitter height, and receiver height) is chosen. An appropriate base station configuration is chosen.
Monte Carlo simulations are carried out for the most sensitive part of the broadcast coverage area: base station sites within 2.7 km of the edge of the relevant DVB coverage area. The results in the Figures A2.3-A2.5 are referred to the first adjacent channel interference.
Figure A2.2: Geometry
Results for the first adjacent channel:
Figure A2.3: 1st adjacent channel interference at DTT coverage edge (– 0.5 km)
Edge of Coverage hole
ECN BS
Cell-edge
ECN BS
Transmitter
Inside of
Coverage hole
(Upper half only)
Edge of DTT
Coverage area very close

CEPT REPORT 30 Page 70
Figure A2.4: 1st adjacent channel interference at DTT coverage edge (– 1.0 km)
Figure A2.5: 1st adjacent channel interference at DTT coverage edge (– 2.7 km)
Discussion:
Assuming the same methodology as for studies on fixed reception and parameters for the generic studies as provided above, the fixed reception case presents the more serious interference scenario than the portable reception.
Note, it was shown by additional studies that by changes of the methodology (e.g. a different propagation model) and different assumptions for the DTT configuration (antenna pattern, tilting, antenna heights, transmitted power and size of DVB-T cell, etc.) and location of interfering ECN BS closer to the DTT Tx within the DTT cell, that there are cases where portable reception might suffer more than fixed reception.
A2.3 FAILURE RATE AT THE CELL -EDGE AND ACROSS THE CELL30
General description:
The impact of interference was quantified in terms of the fraction of locations across a DTT cell (dimensioned for fixed-rooftop coverage) where a TV receiver would fail to achieve its target SINR. A detailed description is con-tained in Annex 1 sectionA1.3. In this section, the analysis is extended to the case of portable-indoor DTT reception.
The DTT network parameters are naturally different for fixed-rooftop & portable-indoor coverage. The ECN net-work parameters are assumed to be identical in both cases.
30 Note: ‘Across the cell’ means either fixed coverage area or portable coverage area, not within the same area.
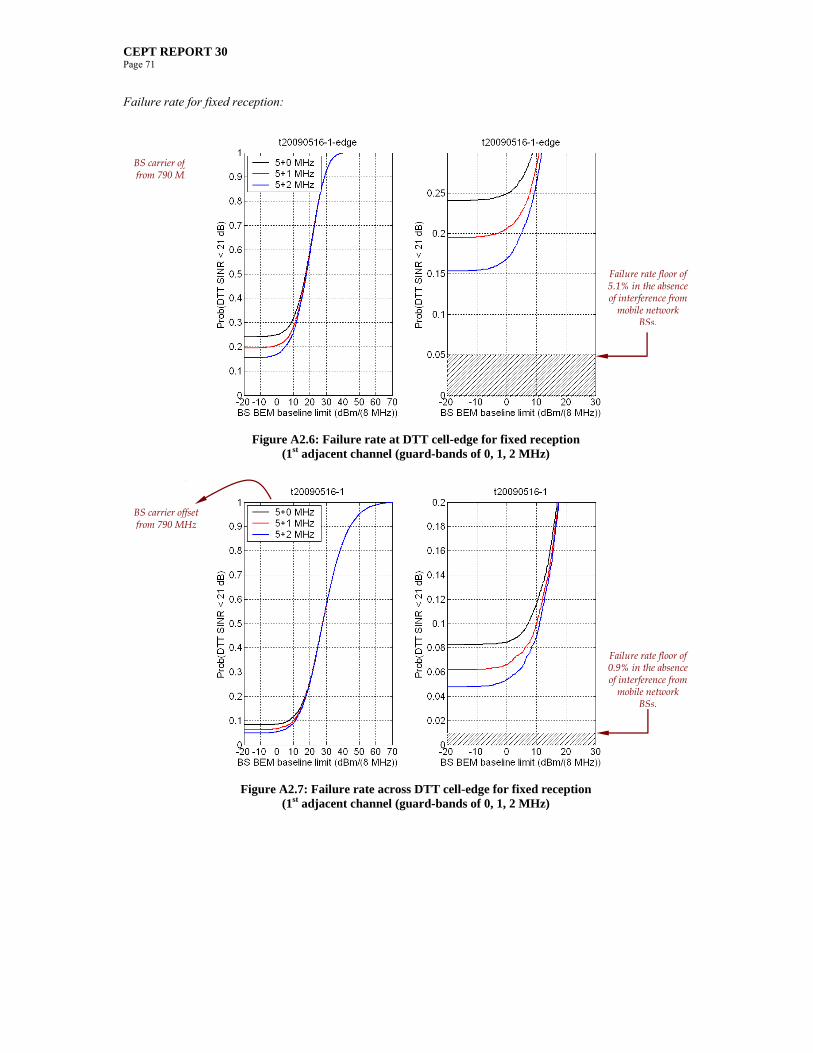
CEPT REPORT 30 Page 71
Failure rate for fixed reception:
Figure A2.6: Failure rate at DTT cell-edge for fixed reception
(1st adjacent channel (guard-bands of 0, 1, 2 MHz)
Figure A2.7: Failure rate across DTT cell-edge for fixed reception
(1st adjacent channel (guard-bands of 0, 1, 2 MHz)
Failure rate floor of 0.9% in the absence of interference from
mobile network BSs.
BS carrier offset from 790 MHz
BS carrier offset from 790 MHz
Failure rate floor of 5.1% in the absence of interference from
mobile network BSs.

CEPT REPORT 30 Page 72
Failure rate for portable-indoor reception:
Figure A2.8: Failure rate at DTT cell-edge for portable-indoor reception
(1st adjacent channel (guard-bands of 0, 1, 2 MHz)
Figure A2.9: Failure rate across DTT cell-edge for portable-indoor reception
(1st adjacent channel (guard-bands of 0, 1, 2 MHz)
Note that the interference from ECN BSs is so low that, for a BEM baseline of 10 dBm/(8 MHz), the failure rate is already within a fraction of a percent of the DTT cell’s inherent failure rate DTT. Improved ACS due to increased guard-band has little impact.
Discussion:
Monte Carlo simulations indicate that, subject to
an ECN BS in-block EIRP of 64 dBm/(10 MHz), and
an ECN BS out-of-block EIRP of 0 dBm/(8 MHz), and
a 1 MHz guard-band at the 790 MHz boundary between ECN and DTT services,
Failure rate floor of 2.95% in the absence of interference from
mobile network
BS carrier offset from 790 MHz
Failure rate floor of 5.4% in the absence of interference from
mobile network BSs.
BS carrier offset from 790 MHz

CEPT REPORT 30 Page 73
the fraction of locations where a TV would fail to achieve its target SINR is
across the DTT cell
6.6% for fixed-rooftop reception (without ECN BS interference: 0.9%), and
3.2% for portable-indoor reception (without: 2.95%),
at the DTT cell-edge
20.6% for fixed-rooftop reception (without: 5.1%), and
6.0% for portable-indoor reception (without: 5.4%),
The above confirms (the intuitive conclusion) that portable-indoor DTT reception is - at the cell-edge and across the whole cell - less susceptible than fixed-outdoor DTT reception to interference from ECN BSs. This also shows that the appropriate baseline level to protect only portable DTT reception mode could have been relaxed up to 10dBm/8MHz (flat failure rate of 2.95% in Figure B10 between 0 and 10dBm/8MHz).
A2.4. CONCLUSIONS
The generic studies have shown that the interference due to the ECN BS on the fixed reception is worse than on the portable-indoor reception with respect to the
Coverage holes at the DTT cell-edge and
The failure rates at DTT cell-edge and across DTT cell.
Therefore, it can be concluded that the BEM derived for the ECN BS to protect broadcasting below 790 MHz is fully sufficient to cover the portable reception modes, too.
Note: Primary objective of these additional studies was to study whether the BEM ECN BS base line limit derived for fixed reception is also sufficient for portable reception. ECN BS may interfere into fixed as well as into portable for any DVB-T network which may require locally additional use of mitigation techniques.

CEPT REPORT 30 Page 74
ANNEX 3: STUDIES TO DERIVE BEM APPLICABLE TO ECN TERMINAL STATIONS AT THE ADJACENCY BETWEEN
ECN AND TERRESTRIAL BROADCASTING
This annex summarises the studies carried out to derive the BEM out-of-block baseline level necessary to protect DTT fixed and portable reception from unacceptable interference from ECN terminal stations.
A3.1 TS BASELINE LEVEL TO PROTECT FIXED DTT RECEPTION
The TS out-of-block baseline level necessary to protect a TV receiver using a fixed rooftop antenna from interfer-ence from a TS located outdoors is established using a MCL analysis. Additional analysis using both MCL and Monte Carlo techniques is used to illustrate the impact of the TS out-of-block baseline level on TV reception within a representative urban and a rural DTT cell (planned for fixed coverage).
A3.1.1 Assumptions (fixed reception)
The following assumptions have been used in the analysis of the TS baseline level needed to protect fixed DTT reception.
Digital Television Tower
Parameter Environment Value Units
EIRP Urban 72.15 dBm/(8 MHz)
Rural 79.15 dBm/(8 MHz)
Cell radius Urban 28.715 km
Rural 49.588 km
Antenna height Urban 100 metres
Rural 200 metres
Antenna down-tilt N/A 0 degrees
Antenna pattern N/A See pattern 1 below
Table A3.1: Assumptions
The curve below represents g,(TT)() where is the elevation offset from TT bore sight. The TT antenna pattern is assumed to be omni-directional in azimuth.
g,(TT)()
1°
7°
10°
-143°
-11
Pattern 1
Pattern 2
g,(TT)()
1°
7°
10°
-143°
-11
Pattern 1
Pattern 2
Figure A3.1: g,(TT)()
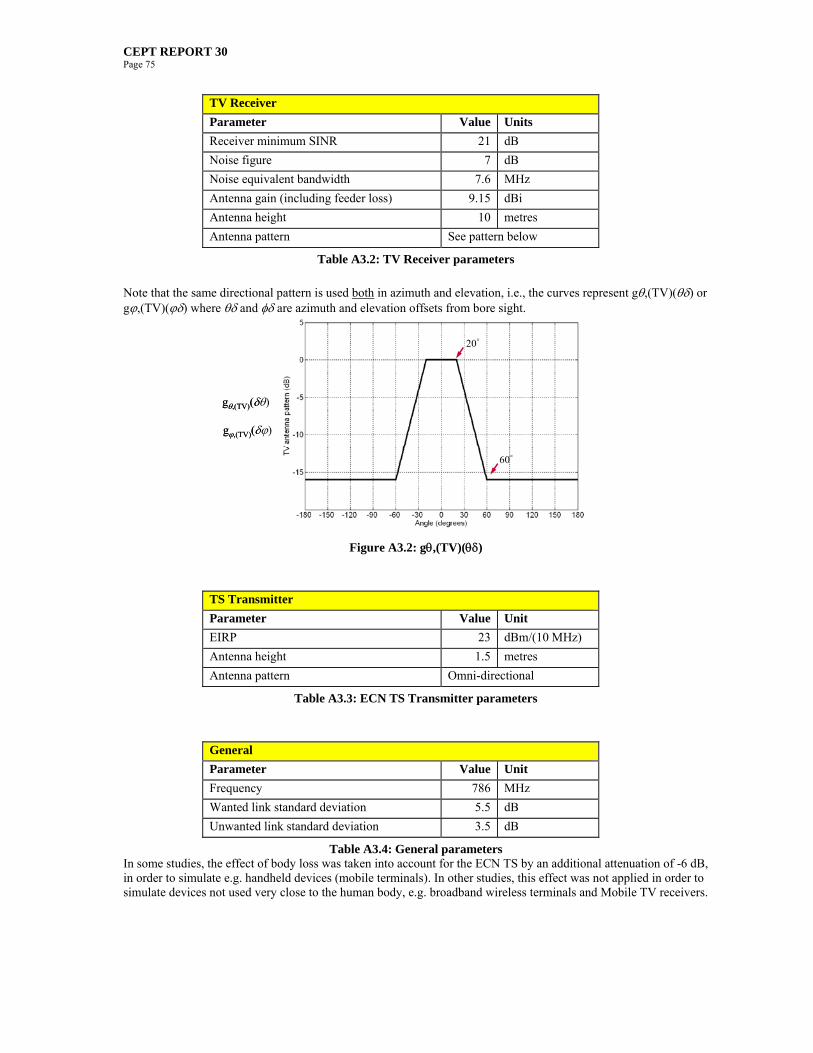
CEPT REPORT 30 Page 75
TV Receiver
Parameter Value Units
Receiver minimum SINR 21 dB
Noise figure 7 dB
Noise equivalent bandwidth 7.6 MHz
Antenna gain (including feeder loss) 9.15 dBi
Antenna height 10 metres
Antenna pattern See pattern below
Table A3.2: TV Receiver parameters
Note that the same directional pattern is used both in azimuth and elevation, i.e., the curves represent g,(TV)() or g,(TV)() where and are azimuth and elevation offsets from bore sight.
g,(TV)()
g,(TV)()
20°
60°
g,(TV)()
g,(TV)()
20°
60°
Figure A3.2: g,(TV)()
TS Transmitter
Parameter Value Unit
EIRP 23 dBm/(10 MHz)
Antenna height 1.5 metres
Antenna pattern Omni-directional
Table A3.3: ECN TS Transmitter parameters
General
Parameter Value Unit
Frequency 786 MHz
Wanted link standard deviation 5.5 dB
Unwanted link standard deviation 3.5 dB
Table A3.4: General parameters In some studies, the effect of body loss was taken into account for the ECN TS by an additional attenuation of -6 dB, in order to simulate e.g. handheld devices (mobile terminals). In other studies, this effect was not applied in order to simulate devices not used very close to the human body, e.g. broadband wireless terminals and Mobile TV receivers.

CEPT REPORT 30 Page 76
A3.1.2 Methodology
A MCL analysis is used for evaluating the impact of adjacent-channel interference from TSs to DTT receivers. The situation is considered where the DTT signal is received at the reference sensitivity level, the worst case separation distance between the TV antenna and the TS is established, accounting for both the path-loss and the elevation pat-tern of a typical TV antenna, and the out-of-block baseline level which would result in a 1 dB desensitization of the TV receiver is then evaluated.
It is assumed that the TV antenna is roof mounted (at a height of 10 metres) and that the TS is outdoors (at a height of 1.5 metres).
Figure A3.3: Overview of the MCL analysis
A3.1.3 Worst-case TS to TV antenna horizontal separation distance
The worst-case TS to TV antenna horizontal separation distance is established by considering both the path-loss between the TS and the TV antenna and the elevation pattern of the TV antenna.
For the path-loss the free-space model is used together with the TV antenna elevation pattern from ITU-R BT.419-3, see below.
The path gain between the TS and the TV receiver is calculated as follows:
)(,)(,),(,),(, TVTVATVTSPLTVTSPG gGGG
where:
GPG,(TS,TV) = Path gain (dB), between TS and TV receiver;
GPL,(TS,TV) = Path-loss (dB), calculated using the free-space model;
GA,(TV) = TV antenna bore-sight gain (dB), including cable losses (9.15 dB);
gφ,(TV)δφ = TV antenna elevation gain (dB).
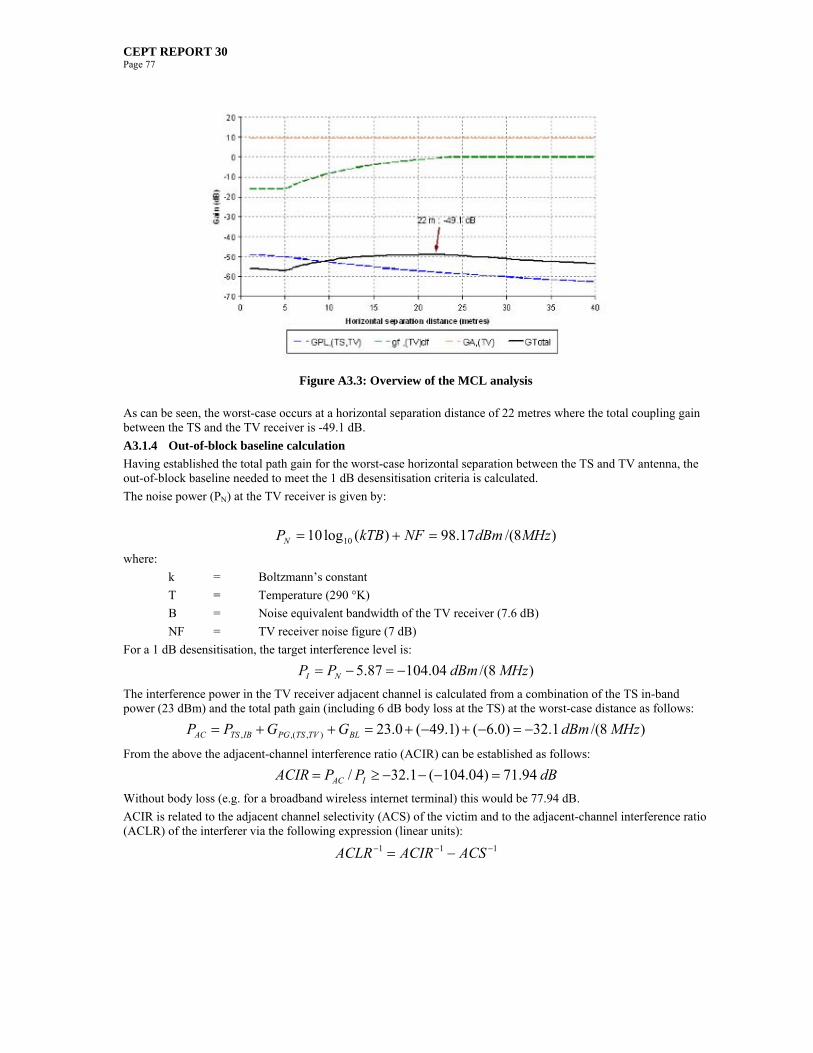
CEPT REPORT 30 Page 77
Figure A3.3: Overview of the MCL analysis
As can be seen, the worst-case occurs at a horizontal separation distance of 22 metres where the total coupling gain between the TS and the TV receiver is -49.1 dB.
A3.1.4 Out-of-block baseline calculation
Having established the total path gain for the worst-case horizontal separation between the TS and TV antenna, the out-of-block baseline needed to meet the 1 dB desensitisation criteria is calculated.
The noise power (PN) at the TV receiver is given by:
)8/(17.98)(log10 10 MHzdBmNFkTBPN
where:
k = Boltzmann’s constant
T = Temperature (290 °K)
B = Noise equivalent bandwidth of the TV receiver (7.6 dB)
NF = TV receiver noise figure (7 dB)
For a 1 dB desensitisation, the target interference level is:
)8/(04.10487.5 MHzdBmPP NI
The interference power in the TV receiver adjacent channel is calculated from a combination of the TS in-band power (23 dBm) and the total path gain (including 6 dB body loss at the TS) at the worst-case distance as follows:
)8/(1.32)0.6()1.49(0.23),(,, MHzdBmGGPP BLTVTSPGIBTSAC
From the above the adjacent-channel interference ratio (ACIR) can be established as follows:
dBPPACIR IAC 94.71)04.104(1.32/
Without body loss (e.g. for a broadband wireless internet terminal) this would be 77.94 dB.
ACIR is related to the adjacent channel selectivity (ACS) of the victim and to the adjacent-channel interference ratio (ACLR) of the interferer via the following expression (linear units):
111 ACSACIRACLR

CEPT REPORT 30 Page 78
If one takes the same ACS values that have been previously used in section A1.3.4 for different adjacent channels (assuming a wanted signal level PS of -70 dBm), this would result in the following table A3.5:
n+1 n+2 n+3 n+4 N+5 n+6 n+7 n+8 n+9 n+10 n+11
51 dB 67 dB 76 dB 80 dB 84 dB 80 dB 86 dB 87 dB 68 dB 88 dB 89 dB
Table A3.5: ACS values By inspection it can be seen that, given a TS at a worst-case location and radiating at maximum in-block EIRP cen-tred in the n+1, n+2, or n+9 adjacent 8 MHz channels, a victim TV receiver would be desensitised by more than 1 dB irrespective of the out-of-block emissions of the TS. This is because the measured ACS of an average-performing TV receiver at the above frequency offsets is already less than the minimum required ACIR of 71.94 dB. In case that no body loss is taken into account (e.g. for broadband wireless terminals), this is true for N+3 as well.
However, with an assumption about reasonable improvement in TV receiver ACS by means of additional external filtering in the antenna down lead it can be concluded that an ACS figure of 80 dB or better is achievable for all adjacent 8 MHz channels with frequency offsets n+4 or greater.
Thus for the purposes of calculating an ACS value of 80 dB has been used.
dBACLR 67.7210
1
10
11log10
10/8010/94.7110
Thus for a TS transmitting at 23 dBm EIRP the out-of-block emissions baseline level will be:
)8/(67.4967.7223 MHzdBm
Rounding to -50 dBm/(8 MHz), this means that an ECN terminal station BEM out-of-block (baseline) limit of -50 dBm/(8 MHz) for frequencies below 790 MHz is necessary to protect fixed DTT reception.
The following table summarises the above calculation:
Parameter Units Value CommentFrequency MHz 786 fo
Target desensitisation dB 1.00 Performance criterionReceiver NF dB 7.00 NFThermal noise floor (7.6 MHz) dBm -98.17 PN = 10log(kTB) + NF + 30INR dB -5.87 INR = 10log(10^(D/10) - 1)Target interference power dBm -104.04 PI = PN + INR
Receiver selectivity (ACS) dB 80.00 Assumed value (consistant with measurements)
In-block EIRP dBm/(10 MHz) 23.00 PIB
FSPL at 22 metres dB -57.80 GPL,(TV,TS)
TV antenna elevation gain at 22 m dB -0.45 GA,(TV)
TV antenna bore-sight gain dB 9.15 gφ,(TV)δφWorst-case path-loss dB -49.10 GPG,(TS,TV)
Interferer body-gain dB -6.00 GBL
Mean wall gain dB 0.00 GWL
Total coupling gain dB -55.10 GTotal = GPG,(TS,TV) + GBL + GWL
ACIR dB 71.94 ACIR = PIB + GTotal - PI
ACLR dB 72.67 ACLR-1 = ACIR-1 - ACS-1 (linear units)Out-of-block baseline EIRP dBm/(8 MHz) -49.67 POOB = PIB - ACLR
Table A3.6: Summary of the Calculations

CEPT REPORT 30 Page 79
A3.1.5 Impact of the TS out-of-block baseline level on fixed DTT reception (MCL)
In this section we estimate the potential area within the coverage of a DTT transmitter that will suffer unacceptable levels of interference from TSs assuming the TS is located at the worst-case separation distance form the TV.
It is assumed that the TV receiver is using a roof mounted antenna (at 10 metres) and receives interference from a TS located outdoors (at 1.5 metres) at the worst-case horizontal separation distance (22 metres). It is considered that a TV receiver suffers unacceptable interference when its SINR falls below 21 dB.
A3.1.5.1 Methodology
For the purposes of this analysis it is assumed that TV receivers are uniformly distributed across the DTT coverage area. The DTT coverage area is divided into a series of 50 equal area concentric annular rings. The outer edge of the furthest annulus being set to the radius of the DTT coverage i.e. 28.715 km for the urban scenario and 49.588 km for the rural scenario (See Annex 1).
The average path-loss between TV receivers located in each annular ring and the DTT transmitter is calculated. Using this path-loss and the worst-case path-loss between the TS and the TV receiver and assuming the OOB base-line established in above, the average SINR for TV receivers in each annulus is calculated. From this and the stan-dard deviations assumed for the path-losses (5.5 dB for the DTT to TV receiver and 3.5 dB for TS to TV receiver), the proportion of locations in each annular ring where the 21 dB SINR criteria will not be met is established. Sum-ming this for each of the 50 annular rings gives the total proportion of locations within the DTT coverage area where the 21 dB SINR criteria will not be met.
The above calculation is performed for 10 MHz TS carriers with centre frequency spaced every 5 MHz from 797 MHz to 857 MHz.
The Figure A3.4 below illustrates the DTT transmitter to TV receiver geometry.
Figure A3.4: DTT transmitter to TV receiver geometry
A3.1.5.2 Calculation
The area of each of our 50 annular rings must be equal (i.e. 1/50th of the DTT coverage area). The outer radius of each annular ring is proportional to the square-root of the area of the circle within.
The outer radius of each annulus is related to the overall radius of the TDD coverage area as follows:
50500 irri
where:
r0 is the radius of the outermost annulus (i.e. the radius of the TDD coverage area); and

CEPT REPORT 30 Page 80
i is the number of each annulus, where i = 0 for the outer annulus and i = 49 for the inner most annulus (circle).
The area of each annulus being:
21
2 iii rra
To calculate the average path-loss for each annulus we calculate the average range of all locations within the annu-lus. This is the radius where the area within the annulus is equal for all locations outside and outside this radius. This is given by:
01.050500, irr PLi
The average path-loss for each annulus is calculated using the JTG 5/6 model (see Annex 6) using breakpoints α and β as follows:
PLiTVTTPLi rG ,10),(,, log10
The average wanted signal power (TT to TV) in each annulus is given by:
)(,)(,)(,),(,,, TTTVTVATVTTPLiTTSi ggGGPP
As calculated above, the noise power (PN) at the TV receiver is -98.17 dBm/(8 MHz).
The average adjacent channel interference power (PAC) from the TS into the TV receiver channel is given by the TS out-of-block baseline (POOB,(TS)) plus the (worst-case) path-gain between the TS and the TV receiver (GPG,(TS,TV)) plus the body loss of the TS user (GBL).
)8/(1.1050.61.490.50),(,)(, MHzdBmGGPP BLTVTSPGTSOOBAC
The average in-band interference power (PI,CC) from the TS into the TV receiver adjacent channel is given by the TS in-band power (PIB,(TS)) plus the total (worst-case) path-gain between the TS and the TV receiver (GPG,(TS,TV)) plus the body loss of the TS user (GBL) minus the TV ACS for the relevant frequency offset.
ACSGGPP BLTVTSPGTSIBCCI ),(,)(,,
The average SINR for each annulus is given by:
10101010, 101010log10 , NCCIAC PPP
Sii PSINR
The percentage of locations (L%) within each annulus where the SINR is less than the 21 dB interference threshold is calculated as follows:
SINRii SINRfL /00.211%
where:
f() is the standard normal cumulative distribution function, and
σSINR is the standard deviation of the SINR, given by:
2),(
2),( TVTSTVTTSINR
where:
σ(TT,TV) is the standard deviation of the wanted link (5.5 dB) and
σ(TS,TV) is the standard deviation of the interfering link (3.5 dB).
The overall percentage of locations within the DTT coverage area which would suffer unacceptable interference (for a worst-case TS to TV receiver separation) is therefore:
49
0
%2%%i
iTotal LL
Due to the different DTT and ECN channel rasters (8 MHz vs 10 MHz), the ECN channels centres will not align with the measures ACS points. Therefore, linear interpolation between the measured ACS points is used to obtain the ACS relevant for each of the ECN channels.
The TV receiver ACS varies as a function of the wanted signal power Ps. Therefore linearly interpolation between measured ACS values for different wanted signal powers has also been used to capture the effect of saturation. The Figure A3.5 below provides details of ACS values derived from measurements for an average performing TV re-ceiver.
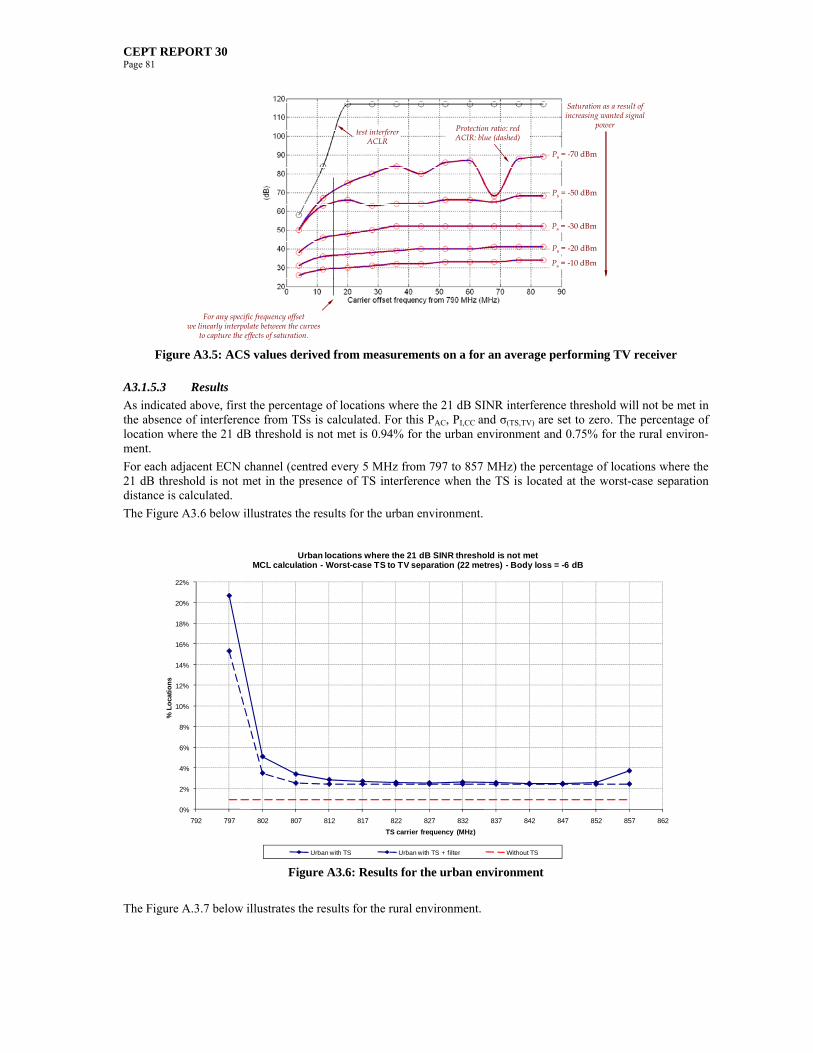
CEPT REPORT 30 Page 81
test interfererACLR
Protection ratio: redACIR: blue (dashed)
Ps = -70 dBm
Ps = -50 dBm
Ps = -30 dBm
Ps = -20 dBm
Ps = -10 dBm
Saturation as a result of increasing wanted signal
power
For any specific frequency offsetwe linearly interpolate between the curves
to capture the effects of saturation.
test interfererACLR
Protection ratio: redACIR: blue (dashed)
Ps = -70 dBm
Ps = -50 dBm
Ps = -30 dBm
Ps = -20 dBm
Ps = -10 dBm
Saturation as a result of increasing wanted signal
power
For any specific frequency offsetwe linearly interpolate between the curves
to capture the effects of saturation. Figure A3.5: ACS values derived from measurements on a for an average performing TV receiver
A3.1.5.3 Results
As indicated above, first the percentage of locations where the 21 dB SINR interference threshold will not be met in the absence of interference from TSs is calculated. For this PAC, PI,CC and σ(TS,TV) are set to zero. The percentage of location where the 21 dB threshold is not met is 0.94% for the urban environment and 0.75% for the rural environ-ment.
For each adjacent ECN channel (centred every 5 MHz from 797 to 857 MHz) the percentage of locations where the 21 dB threshold is not met in the presence of TS interference when the TS is located at the worst-case separation distance is calculated.
The Figure A3.6 below illustrates the results for the urban environment.
0%
2%
4%
6%
8%
10%
12%
14%
16%
18%
20%
22%
792 797 802 807 812 817 822 827 832 837 842 847 852 857 862
% L
oca
tio
ns
TS carrier frequency (MHz)
Urban locations where the 21 dB SINR threshold is not metMCL calculation - Worst-case TS to TV separation (22 metres) - Body loss = -6 dB
Urban with TS Urban with TS + filter Without TS Figure A3.6: Results for the urban environment
The Figure A.3.7 below illustrates the results for the rural environment.

CEPT REPORT 30 Page 82
0%
2%
4%
6%
8%
10%
12%
14%
16%
18%
20%
22%
792 797 802 807 812 817 822 827 832 837 842 847 852 857 862
% L
oca
tio
ns
Frequency (MHz)
Rural locations where the 21 dB SINR threshold is not metMCL calculation - Worst-case TS to TV separation (22 metres) - Body loss = -6 dB
Rural with TS Rural with TS + TV Filter Without TS Figure A3.7: Results for the rural environment
As can bee seen, the urban environment is clearly the worst-case in terms of the potential for interference between TSs and TV receivers.
Investigations carried out in conjunction with a filter manufacturer have demonstrated that a practical ‘low cost’ band edge TV filter (with an edge at 790 MHz) fitted in the antenna down lead could provide approximately a 2 dB attenuation of TS emissions (10 MHz channel) centred at 797 MHz, with 4 dB at 802 MHz, 10 dB at 807 MHz and greater than 20 dB at 812 MHz and above (see the Figure A.3.8 below). The above figures also indicate the impact
of the use of such a filter (dotted blue lines).
Figure A3.8: Filter responses
1 dBinsertion loss
e.g., average value of filterattenuation from 40 to 50 MHz
1 dBinsertion loss
e.g., average value of filterattenuation from 40 to 50 MHz
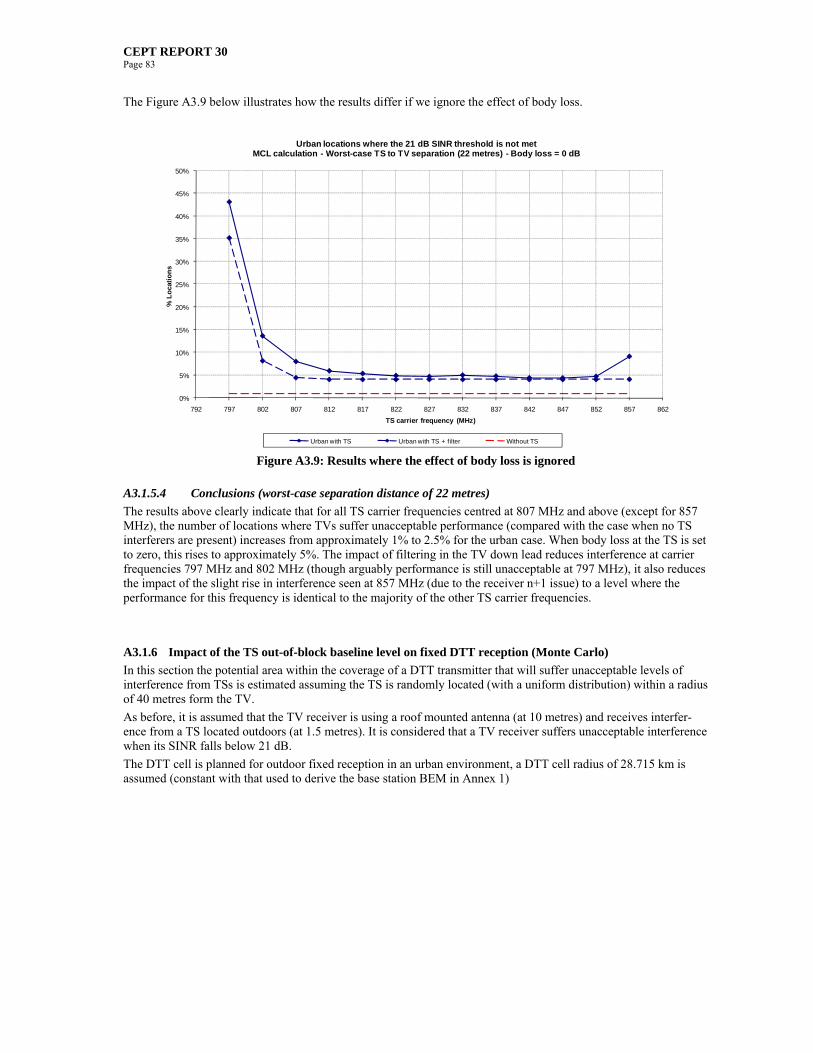
CEPT REPORT 30 Page 83
The Figure A3.9 below illustrates how the results differ if we ignore the effect of body loss.
0%
5%
10%
15%
20%
25%
30%
35%
40%
45%
50%
792 797 802 807 812 817 822 827 832 837 842 847 852 857 862
% L
oca
tio
ns
TS carrier frequency (MHz)
Urban locations where the 21 dB SINR threshold is not metMCL calculation - Worst-case TS to TV separation (22 metres) - Body loss = 0 dB
Urban with TS Urban with TS + filter Without TS Figure A3.9: Results where the effect of body loss is ignored
A3.1.5.4 Conclusions (worst-case separation distance of 22 metres)
The results above clearly indicate that for all TS carrier frequencies centred at 807 MHz and above (except for 857 MHz), the number of locations where TVs suffer unacceptable performance (compared with the case when no TS interferers are present) increases from approximately 1% to 2.5% for the urban case. When body loss at the TS is set to zero, this rises to approximately 5%. The impact of filtering in the TV down lead reduces interference at carrier frequencies 797 MHz and 802 MHz (though arguably performance is still unacceptable at 797 MHz), it also reduces the impact of the slight rise in interference seen at 857 MHz (due to the receiver n+1 issue) to a level where the performance for this frequency is identical to the majority of the other TS carrier frequencies.
A3.1.6 Impact of the TS out-of-block baseline level on fixed DTT reception (Monte Carlo)
In this section the potential area within the coverage of a DTT transmitter that will suffer unacceptable levels of interference from TSs is estimated assuming the TS is randomly located (with a uniform distribution) within a radius of 40 metres form the TV.
As before, it is assumed that the TV receiver is using a roof mounted antenna (at 10 metres) and receives interfer-ence from a TS located outdoors (at 1.5 metres). It is considered that a TV receiver suffers unacceptable interference when its SINR falls below 21 dB.
The DTT cell is planned for outdoor fixed reception in an urban environment, a DTT cell radius of 28.715 km is assumed (constant with that used to derive the base station BEM in Annex 1)

CEPT REPORT 30 Page 84
A3.1.6.1 Methodology
For the purposes of this analysis a Monte Carlo approach was used. For each Monte Carlo trial a TV antenna is randomly placed (with a uniform distribution) within the DTT coverage area. An interfering TS is randomly placed (with a uniform distribution) within a radius of 40 metres of the TV receiver.
Figure A3.10: Overview of the Monte Carlo approach
The SINR is calculated for each Monte Carlo snapshot applying a random variation to the mean wanted and un-wanted path-loss calculations using a log-normal distribution. The standard deviation for the wanted path σ(TT,TV) = 5.5 dB and the standard deviation of the unwanted path σ(TS,TV) = 3.5 dB.
The Figure below illustrates the TS to TV receiver geometry.
Figure A3.11: TS to TV receiver geometry
40 metres
TS - randomly located within 40 metres of TV
antenna
DTT transmitter
TV Antenna – randomly located within TDD coverage
rDTT
40 metres
TS - randomly located within 40 metres of TV
antenna
DTT transmitter
TV Antenna – randomly located within TDD coverage
rDTT
CEPT REPORT 30 Page 85
A3.1.6.2 Calculation
For each Monte Carlo snapshot, the calculation proceeds as follows.
The mean path-loss between the DTT transmitter and the TV antenna is calculated using the JTG 5/6 model (see Annex 6) using breakpoints α and β as follows:
plnTVTTPL rG ,10),(, log10
The mean wanted signal power (TT to TV) is given by:
)(,)(,)(,),(, TTTVTVATVTTPLTTS ggGGPP
To PS we add a random component to account for location variability derived from standard deviation (σ(TT,TV) = 5.5 dB) of the log-normal distribution of the wanted path.
As calculated above, the noise power (PN) at the TV receiver is -98.17 dBm/(8 MHz).
The mean path-loss between the TS and the TV antenna (GPL,(TS,TV)) is calculate using a free-space model. The path-gain between the TS and the TV is then calculated as:
)(,)(,)(,),(,),(, :min TVTVTVATVTSPLTVTSPG ggGGG
The mean adjacent channel interference power (PAC) from the TS into the TV receiver channel is given by the TS out-of-block baseline (POOB,(TS)) plus the path-gain between the TS and the TV receiver (GPG,(TS,TV)) plus the body loss of the TS user (GBL).
BLTVTSPGTSOOBAC GGPP ),(,)(,
The mean in-band interference power (PI,CC) from the TS into the TV receiver adjacent channel is given by the TS in-band power (PIB,(TS)) (23 dBm) plus the path-gain between the TS and the TV receiver (GPG,(TS,TV)) plus the body loss of the TS user (GBL) minus the TV ACS for the relevant frequency offset.
ACSGGPP BLTVTSPGTSIBCCI ),(,)(,,
To both PAC and PI,CC we add a random component to account for location variability derived from standard devia-tion (σ(TT,TV) = 3.5 dB) of the log-normal distribution of the unwanted path.
The SINR for each Monte Carlo snapshot is given by:
10101010 101010log10 , NCCIAC PPP
SPSINR
Due to the different DTT and ECN channel rasters (8 MHz vs 10 MHz), the ECN channels centres will not align with the measures ACS points. Therefore, linear interpolation between the measured ACS points is used to obtain the ACS relevant for each of the ECN channels.
The TV receiver ACS varies as a function of the wanted signal power Ps. Therefore linearly interpolation between measured ACS values for different wanted signal powers has also been used to capture the effect of saturation.
A3.1.6.3 Results
When no TS is present the percentage of locations where the 21 dB threshold is not met is 0.9%.
For each adjacent ECN channel (centred every 5 MHz from 797 to 857 MHz) we have calculated the percentage of locations where the 21 dB threshold is not met in the presence of TS interference when the TS is placed randomly (with a uniform distribution) within 40 metres of the victim TV antenna. As established previously, the urban envi-ronment is clearly the worst-case environment; therefore only results for the urban environment are presented.

CEPT REPORT 30 Page 86
The Figure A3.12 below illustrates the results for the urban environment.
Locations where the 21 dB SINR threshold is not met (with TV filter) Monte Carlo calculation - TS randomly located within 40 metres of TV receiver - Body loss = -6 dB
0%
1%
2%
3%
4%
5%
6%
7%
8%
9%
10%
792 797 802 807 812 817 822 827 832 837 842 847 852 857 862
TS carrier requency (MHz)
% L
oca
tio
ns
Urban with TS Urban with TS + Filter Without TS
Figure A3.12: Results for the urban environment
As before the above Figures also indicate the impact of the use of a filter fitted to the TV receiver to improve it’s ACS (dotted blue line).
The Figure A.3.13 below illustrates how the results differ if we ignore the effect of body loss.
Locations where the 21 dB SINR threshold is not met (with TV filter) Monte Carlo calculation - TS randomly located within 40 metres of TV receiver - Body loss = 0 dB
0%
1%
2%
3%
4%
5%
6%
7%
8%
9%
10%
792 797 802 807 812 817 822 827 832 837 842 847 852 857 862
TS carrier requency (MHz)
% L
oca
tio
ns
Urban with TS Urban with TS + Filter Without TS
Figure A3.13: Results where the effect of body loss is ignored

CEPT REPORT 30 Page 87
A3.1.6.4 Conclusions (Monte Carlo – TS within radius of 40 metres of victim TV antenna)
The results of the Monte Carlo simulation show that for all TS carrier centre frequencies centred at 807 MHz and above, the number of locations where a TV would suffer unacceptable performance is virtually indistinguishable with and without the TS present i.e. approximately 1%. When body loss at the TS is set to zero there is a small rise to approximately 1.2%. Again, the impact of filtering in the TV down lead reduces interference at carrier frequen-cies 797 MHz and 802 MHz (though arguably performance is still unacceptable at 797 MHz), it also reduces the impact of the slight rise in interference seen at 857 MHz when TS body loss is set to zero (due to the receiver n+1 issue) to a level where the performance for this frequency is identical to the majority of the other TS carrier frequen-cies.
A3.2 TS BASELINE LEVEL TO PROTECT PORTABLE DTT RECEPTION
The TS out-of-block baseline level necessary to protect portable TV reception from interference from a TS is estab-lished using MCL analysis. Additional analysis using a Monte Carlo technique is used to illustrate the impact of the TS out-of-block baseline level on portable TV reception within a representative urban DTT cell (planned for port-able indoor coverage).
A3.2.1 Assumptions (portable indoor reception)
The following assumptions have been used in the analysis of the TS baseline level needed to protect portable DTT reception.
Digital Television Tower
Parameter Value Units
EIRP 79.15 dBm/(8 MHz)
Cell radius 10.583 km
Antenna height 200 metres
Antenna down-tilt 0 degrees
Antenna pattern See pattern 2 below
Table A3.7: Digital Television Tower parameters
The curve below represents g,(TT)() where is the elevation offset from TT bore sight. The TT antenna pattern is assumed to be omni-directional in azimuth.
g,(TT)()
1°
7°
10°
-143°
-11
Pattern 1
Pattern 2
g,(TT)()
1°
7°
10°
-143°
-11
Pattern 1
Pattern 2
Figure A3.14: g,(TT)()
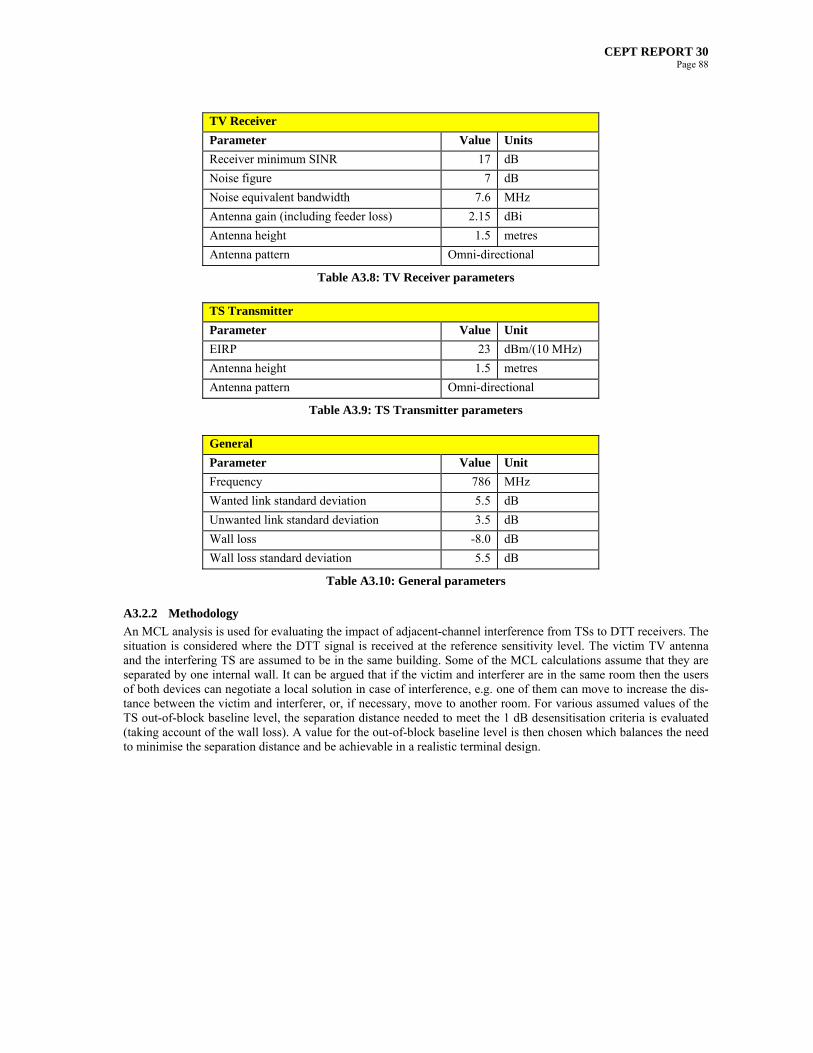
CEPT REPORT 30 Page 88
TV Receiver
Parameter Value Units
Receiver minimum SINR 17 dB
Noise figure 7 dB
Noise equivalent bandwidth 7.6 MHz
Antenna gain (including feeder loss) 2.15 dBi
Antenna height 1.5 metres
Antenna pattern Omni-directional
Table A3.8: TV Receiver parameters
TS Transmitter
Parameter Value Unit
EIRP 23 dBm/(10 MHz)
Antenna height 1.5 metres
Antenna pattern Omni-directional
Table A3.9: TS Transmitter parameters
General
Parameter Value Unit
Frequency 786 MHz
Wanted link standard deviation 5.5 dB
Unwanted link standard deviation 3.5 dB
Wall loss -8.0 dB
Wall loss standard deviation 5.5 dB
Table A3.10: General parameters
A3.2.2 Methodology
An MCL analysis is used for evaluating the impact of adjacent-channel interference from TSs to DTT receivers. The situation is considered where the DTT signal is received at the reference sensitivity level. The victim TV antenna and the interfering TS are assumed to be in the same building. Some of the MCL calculations assume that they are separated by one internal wall. It can be argued that if the victim and interferer are in the same room then the users of both devices can negotiate a local solution in case of interference, e.g. one of them can move to increase the dis-tance between the victim and interferer, or, if necessary, move to another room. For various assumed values of the TS out-of-block baseline level, the separation distance needed to meet the 1 dB desensitisation criteria is evaluated (taking account of the wall loss). A value for the out-of-block baseline level is then chosen which balances the need to minimise the separation distance and be achievable in a realistic terminal design.
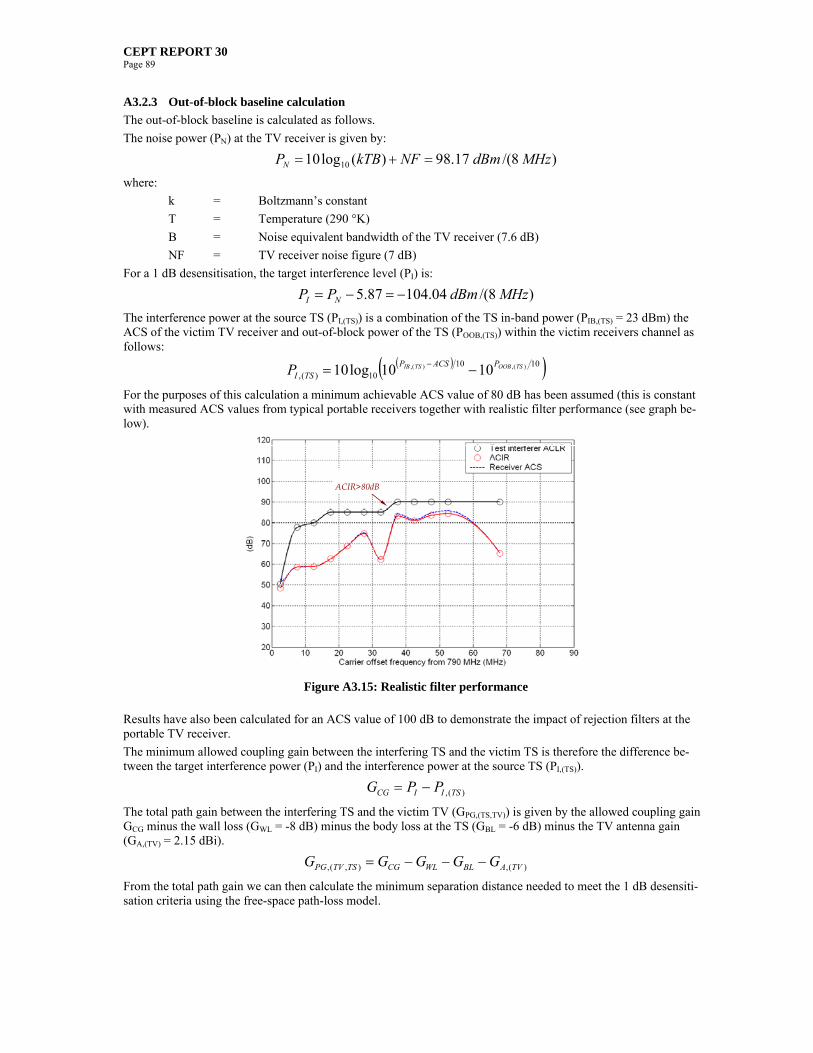
CEPT REPORT 30 Page 89
A3.2.3 Out-of-block baseline calculation
The out-of-block baseline is calculated as follows.
The noise power (PN) at the TV receiver is given by:
)8/(17.98)(log10 10 MHzdBmNFkTBPN
where:
k = Boltzmann’s constant
T = Temperature (290 °K)
B = Noise equivalent bandwidth of the TV receiver (7.6 dB)
NF = TV receiver noise figure (7 dB)
For a 1 dB desensitisation, the target interference level (PI) is:
)8/(04.10487.5 MHzdBmPP NI
The interference power at the source TS (PI,(TS)) is a combination of the TS in-band power (PIB,(TS) = 23 dBm) the ACS of the victim TV receiver and out-of-block power of the TS (POOB,(TS)) within the victim receivers channel as follows:
101010)(,
)(,)(, 1010log10 TSOOBTSIB PACSPTSIP
For the purposes of this calculation a minimum achievable ACS value of 80 dB has been assumed (this is constant with measured ACS values from typical portable receivers together with realistic filter performance (see graph be-low).
ACIR>80dBACIR>80dB
Figure A3.15: Realistic filter performance
Results have also been calculated for an ACS value of 100 dB to demonstrate the impact of rejection filters at the portable TV receiver.
The minimum allowed coupling gain between the interfering TS and the victim TS is therefore the difference be-tween the target interference power (PI) and the interference power at the source TS (PI,(TS)).
)(, TSIICG PPG
The total path gain between the interfering TS and the victim TV (GPG,(TS,TV)) is given by the allowed coupling gain GCG minus the wall loss (GWL = -8 dB) minus the body loss at the TS (GBL = -6 dB) minus the TV antenna gain (GA,(TV) = 2.15 dBi).
)(,),(, TVABLWLCGTSTVPG GGGGG
From the total path gain we can then calculate the minimum separation distance needed to meet the 1 dB desensiti-sation criteria using the free-space path-loss model.

CEPT REPORT 30 Page 90
A3.2.4 Results
As indicated above, for various assumed values of the TS out-of-block baseline level, the separation distance needed to meet the 1 dB desensitisation criteria has been evaluated. Results have been obtained for assumed TV ACS values of both 80 dB (consistent with some measured values for portable TV receivers) and 100 dB (to assess the impact of rejection filters at the portable TV receiver).
A3.2.4.1 TV ACS = 80 dB
The graph below illustrates the relationship between separation distance and out-of-block baseline. The lower blue curve takes into account -8 dB wall loss whereas the upper pink cure does not.
Portable reception - TS OOB baseline level vs separation distance(TV ACS = 80 dB - TS body loss = -6 dB)
0
2
4
6
8
10
12
14
16
18
20
-80 -75 -70 -65 -60 -55 -50 -45 -40 -35 -30
TS OOB baseline level (dBm/(8 MHz))
Sep
ara
tio
n d
ista
nce
(m
etre
s)
Wall loss = -8 dB Wall loss = 0 dB
Figure A3.16: Relationship between separation distance and out-of-block baseline
As can be seen, the curves have essentially flattened out for a baseline level of -65 dBm/(8 MHz) and below i.e. for baseline levels lower that -65 dBm/(8 MHz) there is minimal improvement in separation distance. From this it is concluded a TS out-of-block level of – 65 dBm/(8 MHz) is optimal.
The graph below provides results where the TS body loss is set to zero.

CEPT REPORT 30 Page 91
Portable reception - TS OOB baseline level vs separation distance(TV ACS = 80 dB - TS body loss = 0 dB)
0
2
4
6
8
10
12
14
16
18
20
-80 -75 -70 -65 -60 -55 -50 -45 -40 -35 -30
TS OOB baseline level (dBm/(8 MHz))
Sep
arat
ion
dis
tan
ce (
me
tres
)
Wall loss = -8 dB Wall loss = 0 dB
Figure A3.17: Results where the TS body loss is set to zero
The following table summarises the calculation of separation distance for the situation where the assumed TV re-ceiver ACS is 80 dB and the out-of-block baseline is set to -65 dBm/(8 MHz) for the various combinations of wall loss and body loss.
Parameter Units Value Value Value Value Comment
Frequency MHz 786 786 786 786 fo
Target performance
Target desensitisation dB 1.00 1.00 1.00 1.00 Performance criterion
Receiver NF dB 7.00 7.00 7.00 7.00 NF
Thermal noise floor (9MHz) dBm -98.17 -98.17 -98.17 -98.17 PN = 10log(kTB) + NF + 30
INR dB -5.87 -5.87 -5.87 -5.87 INR = 10log(10^(D/10) - 1)
Target interference power dBm -104.04 -104.04 -104.04 -104.04 PI = PN + INR
Victim's performance
Receiver selectivity (ACS) dB 80.00 80.00 80.00 80.00 Assumed value (consistant with measurements)
BEM limits
In-block dBm/(10 MHz) 23.00 23.00 23.00 23.00 PIB,(TS)
Out-of-block dBm/(8 MHz) -65.00 -65.00 -65.00 -65.00 POOB,(TV)
"Total" interference at "source" dBm -56.36 -56.36 -56.36 -56.36 Linear units: PI,(TS) = PIB,(TS)/ACS + POOB,(TS)
Coupling calculation
Coupling gain dB -47.68 -47.68 -47.68 -47.68 GCG = PI - PI,(TS)
Link budget
Interferer body-gain dB -6.00 -6.00 0.00 0.00 GBL
Mean wall gain dB -8.00 0.00 -8.00 0.00 GWL
Victim antenna gain dBi 2.15 2.15 2.15 2.15 GA,(TV)
Path gain dB -35.83 -43.83 -41.83 -49.83 GPG = GCG - GBL - GWL - GA,(TV)
Geometry
Protection distance m 1.88 4.72 3.75 9.42 d, where GPG = 147.56 - 20log10(fo) - 20 log10(d) dB Table A3.11: Calculation of separation distances –ACS 80dB
3.2.4.2 TV ACS = 100 dB
In order to assess the impact of a rejection filter fitted to the portable TV receiver a further set of results are calcu-lated but with an ACS value of 100 dB (rather than 80 dB assumed above).
The graph below provides results where the TS body loss is set to -6 dB.

CEPT REPORT 30 Page 92
Portable reception - TS OOB baseline level vs separation distance(TV ACS = 100 dB - TS body loss = -6 dB)
0
2
4
6
8
10
12
14
16
18
20
-80 -75 -70 -65 -60 -55 -50 -45 -40 -35 -30
TS OOB baseline level (dBm/(8 MHz))
Sep
arat
ion
dis
tan
ce
(met
res)
Wall loss = -8 dB Wall loss = 0 dB
Figure A3.18: Results where the TS body loss is set to -6 dB
The graph below provides results where the TS body loss is set to zero.
Portable reception - TS OOB baseline level vs separation distance(TV ACS = 100 dB - TS body loss = 0 dB)
0
2
4
6
8
10
12
14
16
18
20
-80 -75 -70 -65 -60 -55 -50 -45 -40 -35 -30
TS OOB baseline level (dBm/(8 MHz))
Sep
arat
ion
dis
tan
ce (
me
tres
)
Wall loss = -8 dB Wall loss = 0 dB
Figure A3.19: Results where the TS body loss is set to zero
The following table summarises the calculation of separation distance for the situation where the assumed TV re-ceiver ACS is 100 dB and the out-of-block baseline is set to -65 dBm/(8 MHz) for the various combinations of wall loss and body loss.

CEPT REPORT 30 Page 93
Parameter Units Value Value Value Value Comment
Frequency MHz 786 786 786 786 fo
Target performance
Target desensitisation dB 1.00 1.00 1.00 1.00 Performance criterion
Receiver NF dB 7.00 7.00 7.00 7.00 NF
Thermal noise floor (9MHz) dBm -98.17 -98.17 -98.17 -98.17 PN = 10log(kTB) + NF + 30
INR dB -5.87 -5.87 -5.87 -5.87 INR = 10log(10^(D/10) - 1)
Target interference power dBm -104.04 -104.04 -104.04 -104.04 PI = PN + INR
Victim's performance
Receiver selectivity (ACS) dB 100.00 100.00 100.00 100.00 Improved value (accounts for rejection filter at TV)
BEM limits
In-block dBm/(10 MHz) 23.00 23.00 23.00 23.00 PIB,(TS)
Out-of-block dBm/(8 MHz) -65.00 -65.00 -65.00 -65.00 POOB,(TV)
"Total" interference at "source" dBm -64.73 -64.73 -64.73 -64.73 Linear units: PI,(TS) = PIB,(TS)/ACS + POOB,(TS)
Coupling calculation
Coupling gain dB -39.30 -39.30 -39.30 -39.30 GCG = PI - PI,(TS)
Link budget
Interferer body-gain dB -6.00 -6.00 0.00 0.00 GBL
Mean wall gain dB -8.00 0.00 -8.00 0.00 GWL
Victim antenna gain dBi 2.15 2.15 2.15 2.15 GA,(TV)
Path gain dB -27.45 -35.45 -33.45 -41.45 GPG = GCG - GBL - GWL - GA,(TV)
Geometry
Protection distance m 0.72 1.80 1.43 3.59 d, where GPG = 147.56 - 20log10(fo) - 20 log10(d) dB Table A3.11: Calculation of separation distances –ACS 100dB
A3.2.5 Impact of the TS out-of-block baseline level on portable DTT reception (Monte Carlo)
In this section the potential area within the coverage of a DTT transmitter that will suffer unacceptable levels of interference from TSs is estimated assuming the TS is randomly located (with a uniform distribution) within a radius of 10 metres from the TV.
It is assumed that the TV receiver is located indoors and is using a portable antenna (with 2.15 dBi gain) and re-ceives interference from a TS located within the same building (with 2.15 dBi gain). It is considered that a TV re-ceiver suffers unacceptable interference when its SINR falls below 17 dB.
The DTT cell is planned for indoor portable reception in an urban environment, a DTT cell radius of 10.583 km is assumed (constant with that used for the complementary base station studies in Annex 2)
3.2.5.1 Methodology
For the purposes of this analysis we use a Monte Carlo approach. For each Monte Carlo trial a TV antenna is ran-domly placed (with a uniform distribution) within the DTT coverage area (it is assumed that the TV antenna is lo-cated indoors with one external wall between it and the DTT transmitter). An interfering TS is randomly placed (with a uniform distribution) within a radius of 10 metres of the TV receiver. If the distance between the TS and the TV is greater than 5 metres it is assumed that there is one internal wall separating them.
The SINR for each Monte Carlo snapshot is calculated applying a random variation to the mean wanted and un-wanted path-loss calculations using a log-normal distribution. The standard deviation for the wanted path σ(TT,TV) = 7.8 dB (which is a combination of the log normal shadowing standard deviation of 5.5 dB and the wall loss standard deviation of 5.5 dB) and the standard deviation of the unwanted path σ(TS,TV) = 3.5 dB for distances below 5 metres and 6.5 dB for distances above 5 metres (which is a combination of the log normal shadowing standard deviation of 3.5 dB and the wall loss standard deviation of 5.5 dB).

CEPT REPORT 30 Page 94
The Figure A3.20 below illustrates the TS to TV receiver geometry.
PTT
TV receiver
g,(TT)()
TVPS
GPL,(TT,TV)
Elevation
Television tower (TT)
GA,(TV)GPL,(TS,TV)
PI
PTT
TV receiver
g,(TT)()
TVPS
GPL,(TT,TV)
Elevation
Television tower (TT)
GA,(TV)GPL,(TS,TV)
PI
Figure A3.20: TS to TV receiver geometry
A3.2.5.2 Calculation
For each Monte Carlo snapshot, the calculation proceeds as follows.
The mean path-loss between the DTT transmitter and the TV antenna is calculated using the JTG 5/6 model (see Annex 6) using breakpoints α and β as follows:
plnTVTTPL rG ,10),(, log10
The mean wanted signal power (TT to TV) is given by:
)(,)(,),(, TTTVATVTTPLTTS gGGPP
To PS we add a random component to account for location variability derived from standard deviation (σ(TT,TV) = 7.8 dB) of the log-normal distribution wanted path.
As calculated above, the noise power (PN) at the TV receiver is -98.17 dBm/(8 MHz).
The mean path-loss between the TS and the TV antenna (GPL,(TS,TV)) is calculate using a free-space model. The path-gain between the TS and the TV is then calculated as:
)(,),(,),(, TVATVTSPLTVTSPG GGG
The mean adjacent channel interference power (PAC) from the TS into the TV receiver channel is given by the TS out-of-block baseline (POOB,(TS)) plus the path-gain between the TS and the TV receiver (GPG,(TS,TV)) plus the body loss of the TS user (GBL) plus wall loss (GWL) where the separation distance is greater than 5 metres.
WLBLTVTSPGTSOOBAC GGGPP ),(,)(,
The mean in-band interference power (PI,CC) from the TS into the TV receiver adjacent channel is given by the TS in-band power (PIB,(TS)) (23 dBm) plus the path-gain between the TS and the TV receiver (GPG,(TS,TV)) plus the body loss of the TS user (GBL) plus wall loss (GWL) where the separation distance is greater than 5 metres minus the TV ACS for the relevant frequency offset.
ACSGGGPP WLBLTVTSPGTSIBCCI ),(,)(,,
To both PAC and PI,CC we add a random component to account for location variability derived from standard devia-tion (σ(TT,TV) = 3.5 dB or 6.5 dB depending on separation distance) of the log-normal distribution of the unwanted path.
The SINR for each Monte Carlo snapshot is given by:
10101010 101010log10 , NCCIAC PPP
SPSINR
Due to the different DTT and ECN channel rasters (8 MHz vs 10 MHz), the ECN channels centres will not align with the measures ACS points. Therefore, linear interpolation between the measured ACS points is used to obtain the ACS relevant for each of the ECN channels.
The TV receiver ACS varies as a function of the wanted signal power Ps. Therefore linearly interpolation between measured ACS values for different wanted signal powers has also been used to capture the effect of saturation.

CEPT REPORT 30 Page 95
A3.2.5.3 Results
When no TS is present the percentage of locations where the 17 dB threshold is not met is 1.6%.
For each adjacent ECN channel (centred every 5 MHz from 797 to 857 MHz) we have calculated the percentage of locations where the 17 dB threshold is not met in the presence of TS interference when the TS is placed randomly (with a uniform distribution) in the same building between 1 and 10 metres of the victim TV antenna.
Portable Indoor ReceptionLocations where the 17 dB SINR threshold is not met
Monte Carlo calculation - TS randomly located within 10 metres of TV receiver - Body loss = -6 dB
0%
5%
10%
15%
20%
25%
30%
35%
792 797 802 807 812 817 822 827 832 837 842 847 852 857 862
TS carrier centre frequency (MHz)
% L
oca
tio
ns
Urban with TS Urban with TS + Filter Without TS
Figure A3.21: Results for Portable Indoor Reception
As before the above figures also indicate the impact of the use of a filter fitted to the TV receiver to improve it’s ACS (dotted blue lines). These studies took body loss into account, e.g. in case that a mobile terminal is used.
The figure below illustrates how the results differ if the effect of body loss is not applicable, e.g. in case of broad-band wireless terminals (usually, these devices are not handheld).
Portable Indoor ReceptionLocations where the 17 dB SINR threshold is not met
Monte Carlo calculation - TS randomly located within 10 metres of TV receiver - Body loss = 0 dB
0%
5%
10%
15%
20%
25%
30%
35%
792 797 802 807 812 817 822 827 832 837 842 847 852 857 862
TS carrier centre frequency (MHz)
% L
oc
atio
ns
Urban with TS Urban with TS + Filter Without TS
Figure A3.22: Results for Portable Indoor Reception - the effect of body loss is ignored
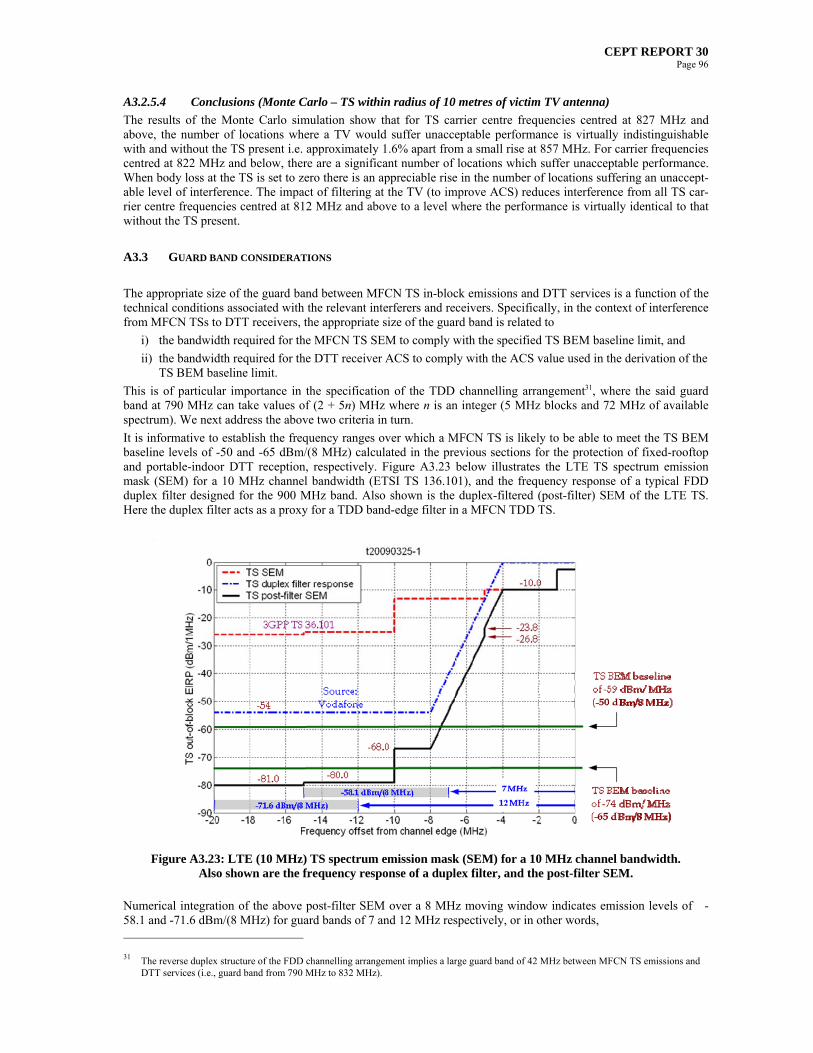
CEPT REPORT 30 Page 96
A3.2.5.4 Conclusions (Monte Carlo – TS within radius of 10 metres of victim TV antenna)
The results of the Monte Carlo simulation show that for TS carrier centre frequencies centred at 827 MHz and above, the number of locations where a TV would suffer unacceptable performance is virtually indistinguishable with and without the TS present i.e. approximately 1.6% apart from a small rise at 857 MHz. For carrier frequencies centred at 822 MHz and below, there are a significant number of locations which suffer unacceptable performance. When body loss at the TS is set to zero there is an appreciable rise in the number of locations suffering an unaccept-able level of interference. The impact of filtering at the TV (to improve ACS) reduces interference from all TS car-rier centre frequencies centred at 812 MHz and above to a level where the performance is virtually identical to that without the TS present.
A3.3 GUARD BAND CONSIDERATIONS
The appropriate size of the guard band between MFCN TS in-block emissions and DTT services is a function of the technical conditions associated with the relevant interferers and receivers. Specifically, in the context of interference from MFCN TSs to DTT receivers, the appropriate size of the guard band is related to
i) the bandwidth required for the MFCN TS SEM to comply with the specified TS BEM baseline limit, and
ii) the bandwidth required for the DTT receiver ACS to comply with the ACS value used in the derivation of the TS BEM baseline limit.
This is of particular importance in the specification of the TDD channelling arrangement31, where the said guard band at 790 MHz can take values of (2 + 5n) MHz where n is an integer (5 MHz blocks and 72 MHz of available spectrum). We next address the above two criteria in turn.
It is informative to establish the frequency ranges over which a MFCN TS is likely to be able to meet the TS BEM baseline levels of -50 and -65 dBm/(8 MHz) calculated in the previous sections for the protection of fixed-rooftop and portable-indoor DTT reception, respectively. Figure A3.23 below illustrates the LTE TS spectrum emission mask (SEM) for a 10 MHz channel bandwidth (ETSI TS 136.101), and the frequency response of a typical FDD duplex filter designed for the 900 MHz band. Also shown is the duplex-filtered (post-filter) SEM of the LTE TS. Here the duplex filter acts as a proxy for a TDD band-edge filter in a MFCN TDD TS.
Figure A3.23: LTE (10 MHz) TS spectrum emission mask (SEM) for a 10 MHz channel bandwidth.
Also shown are the frequency response of a duplex filter, and the post-filter SEM.
Numerical integration of the above post-filter SEM over a 8 MHz moving window indicates emission levels of -58.1 and -71.6 dBm/(8 MHz) for guard bands of 7 and 12 MHz respectively, or in other words,
31 The reverse duplex structure of the FDD channelling arrangement implies a large guard band of 42 MHz between MFCN TS emissions and DTT services (i.e., guard band from 790 MHz to 832 MHz).

CEPT REPORT 30 Page 97
a) the BEM baseline level of -50 dBm/(8 MHz) required for the protection of fixed-rooftop DTT reception can be achieved by a MFCN TS with a guard band of 7 MHz or greater.
b) the BEM baseline level of -65 dBm/(8 MHz) required for the protection of portable-indoor DTT reception can be achieved by a MFCN TS with a guard band of 12 MHz or greater.
This suggests that compliance with the -65 dBm/(8 MHz) with a guard band of 7 MHz will require very challenging transmit filtering at the MFCN TS interferer. However, this should not (in this instance) necessarily be the determin-ing factor for administrations in defining the appropriate size of guard band. This is because the cost of Tx filtering is ultimately at the discretion of the new MFCN licensee.
In determining the required guard band size, the more critical factor for consideration by administrations is the abil-ity of the receivers of the (legacy) DTT service to achieve the target ACS used in the derivation of the MFCN TS BEM baseline limit. Figures A3.24 and A3.25 illustrate examples of measured variations of the ACS of fixed and portable DTT receivers (receiving over 782-790 MHz) as a function of an interferer’s channel-edge offset (i.e., guard band) from 790 MHz. The impact of additional RF filtering at the DTT receiver is also shown. Note that the ACS of portable DTT receivers is poorer than that of fixed DTT receivers.
Figure A3.24: ACS of a fixed DTT receiver

CEPT REPORT 30 Page 98
Figure A3.25: ACS of a portable DTT receiver
The following conclusions can be drawn from the above figures:
a) As indicated in the previous sections, the TS BEM baseline limit of -50 dBm/(8 MHz) for the protection of fixed-rooftop DTT reception was derived based on an assumed DTT receiver ACS of 80 dB (see Table A3.6). It can be readily shown that if the more stringent level of -65 dBm/(8 MHz) is adopted for the protection of fixed-rooftop DTT reception, then for the same geometry and level of protection, the required DTT receiver ACS is around 72 dB. From Figure A3.24 it is clear that for a guard band of 7 MHz between MFCN TS transmissions and DTT services, the achievement of a 72 dB ACS will require additional filtering at the DTT receiver.
b) As indicated in the previous sections, the TS BEM baseline limit of -65 dBm/(8 MHz) for the protection of portable-indoor DTT reception was derived based on a DTT receiver ACS of 80 dB (see Table A3.11). From Figure A3.25 it is clear that such an ACS requires a guard band that is greater than 7 MHz, and (depending on the actual guard band adopted) may also require additional filtering at the DTT receiver.
To summarise, the size of the guard band between MFCN TS in-block emissions and DTT reception must be suffi-ciently large to allow DTT receivers to achieve the target ACS (used in the derivation of the MFCN TS BEM base-line limit). Based on the protection criteria used in the derivation of the MFCN TS BEMs, measurements of the ACS of typical fixed and portable DTT receivers, and the expected performance of additional filtering at the DTT re-ceiver, we have shown that
1) for the protection of fixed-rooftop DTT reception a guard band of 7 MHz would require additional filtering at the DTT receiver, while a guard band of 12 MHz or greater would require no additional filtering at the DTT receiver.
2) for the protection of portable-indoor DTT reception a guard band of greater than 7 MHz would be required. Appropriate guard bands might be 37 MHz without additional filtering at the DTT receiver and 17 MHz with additional filtering at the DTT receiver.”
CEPT REPORT 30 Page 99
ANNEX 4: GUIDANCE TO ADMINISTRATIONS ON THE RELEVANT MITIGATION TECHNIQUES AND MEANS TO SOLVE
THE INTERFERENCE CASES BETWEEN ECN AND TERRESTRIAL BROADCASTING ON A LOCAL BASIS
This annex provides a list of potential mitigation techniques which may be considered by national administrations to solve or minimise the interference cases between ECN and terrestrial broadcasting on a local / regional / national basis. They would need to be implemented in addition to the techniques (BEM and guard band) addressed in this Report. It should be noted that this list is not exhaustive and that, for example, additional spectrum engineering techniques may be considered, such as additional frequency offset or restricted BEM.
The potential mitigation techniques are divided in 2 main categories:
a) Local interference management between ECN BS and DTT
Mitigation technique Comments
Co-site ECN BS and DTT transmitters, includ-ing DTT repeaters (see also CEPT Report 21)
Co-siting could be an efficient measure to minimise interference, if ECN BS could be deployed at DTT Tx site.
Technical constraints are: antenna coupling, DTT antenna covering the full frequency range (up to 862 MHz), tilt and direction are deemed to differ be-tween ECN and DTT (sector/omni).
A special case of co-siting is the potential use of on-channel DTT repeaters or DTT booster. Further studies are needed, e.g. on echo compensation and us-ability in case of SFN and multi-path reception.
Additional costs for co-siting of an ECN base station and DTT Transmitter have to be calculated.
Cross polarisation,
Slant polarisation (see also CEPT Reports 21 and 23)
General:
Difficult to be evaluated since modern ECN may use MIMO techniques with different polarisations.
Typically ECN base stations today use cross-polarized antennas (two sets of dipoles slanted at ±45° against the horizontal plane), usually transmitting on one of the two polarisation paths (either +45° or −45° for a given frequency) whilst receiving on both paths (to achieve polarisation diversity). Such signals provide an isolation of 3 dB against both horizontally and vertically polarised signals (e.g. DTT signals) due to cross-polarisation discrimination.
Fixed reception:
Some polarisation discrimination can be expected (e.g. around 16 dB pro-vided that broadcast services are limited to horizontal polarisation and mobile services to vertical polarisation). In general, this would depend on the local implementation of broadcasting as well as ECN.
Portable reception:
Polarisation discrimination can not be taken into account due to the scattering in the environment of the reception.
Reducing the power of interfering transmitter (ECN BS) (see also CEPT Reports 21 and 23)
Reducing the ECN BS power could be an efficient measure to reduce inter-ference problems when occurred, e.g. for cases where the adjacent broadcast-ing channels or image channels are used in the same area or to reduce over-loading of TV receivers.
Since the ECN base station density is very high, this may affect a high num-ber of the BS in the mobile network and lead to a reduction in coverage.
The level of the required limitation depends on the level of the wanted broad-casting signal to be protected.
Economic impact needs to be evaluated.
Adjusting the ECN BS transmitter antenna char-acteristics (height, pat-tern, tilt and direction) taking into account local conditions (see also
General:
Could be an efficient measure to reduce interference problems when occurred (e.g. reduction of overloading of DTT receiver).
This technique is preferably applied when planning the ECN network.
Economic impact needs to be evaluated.

CEPT REPORT 30 Page 100
CEPT Reports 21 and 23)
Fixed reception:
Increasing the path loss by adjusting the antenna height, e.g. avoiding line-of-sight, will reduce the interference impact. Values of up to 20-30 dB decoup-ling are the maximum to be expected, at some places.
Portable reception
For portable indoor reception is quite complex due to wave propagation in-side a room and therefore the above mentioned measures can not be taken into account.
Further studies are needed.
Increasing the power of DTT transmitters (see also CEPT Reports 21 and 23)
General:
Increasing the power of DTT transmitters to increase the wanted field strength within the GE06 constraints. Alternatively, installing additional DTT transmitter(s) to cover the area concerned.
An increase of the power of the broadcasting transmitter requires planning studies taking into account possible local difficulties, i.e. possible interference on DTT reception from neighbouring DTT transmitters
This may also create interference to other areas where the channel is used (e.g. due to self-interferences) and not be in conformity with cross-border co-ordination
Installing additional DTT transmitters need further technical studies.
Economic impact of increasing power of the Broadcasting transmitter needs to be evaluated.
Table A4.1
b) Hardware modification in DTT receiver or ECN BS
Mitigation technique Comments
Rejection filters in DTT Receivers, (receiving up to 790 MHz; see CEPT Report 21)
Measure to reduce local interference (including overloading).
Rejection filters can be installed to reject a single carrier or channel (e.g. ECN). However, there will be several channels operating in the band 790 – 862 MHz. For the rejection of a complete range (790 – 862 MHz), the band-width will affect the required performance of the filter. In this case, a low pass filter seems to be more appropriate (see below).
A rejection filter just limits the in-band signal reception (790 – 862 MHz) but the out of Band emission is not reduced
BC coverage area is reduced, due to insertion loss of the additional filter (for example 1 to 3 dB). This needs to be taken into account for existing and fu-ture DTT networks.
More detailed studies are needed.
Low-pass filters in DTT Receivers, (up to 790 MHz)
General:
Is a measure to minimize overloading of as well as to reduce interferences into DTT receivers by ECN UL.
Could be realised as an additional filter for all new receivers (switchable filters might be a solution to serve also markets in which the entire UHF band is used for broadcasting).
Low pass filters just limits the in-band signal reception (790 – 862 MHz), but not the OOB emission below 790 MHz.
It should be noted that the future DTT standards, e.g. DVB-T2, may also require a replacement of existing set-top boxes.
A filter has an impact on the link budget (insertion loss, contributes to re-ceiver noise figure). The insertion loss (for example 1 to 3 dB) will reduce BC coverage area and needs to be taken into account for existing and future DTT networks; studies on impact are needed.
Filters will increase costs of DTT-devices and may lead to diversification of
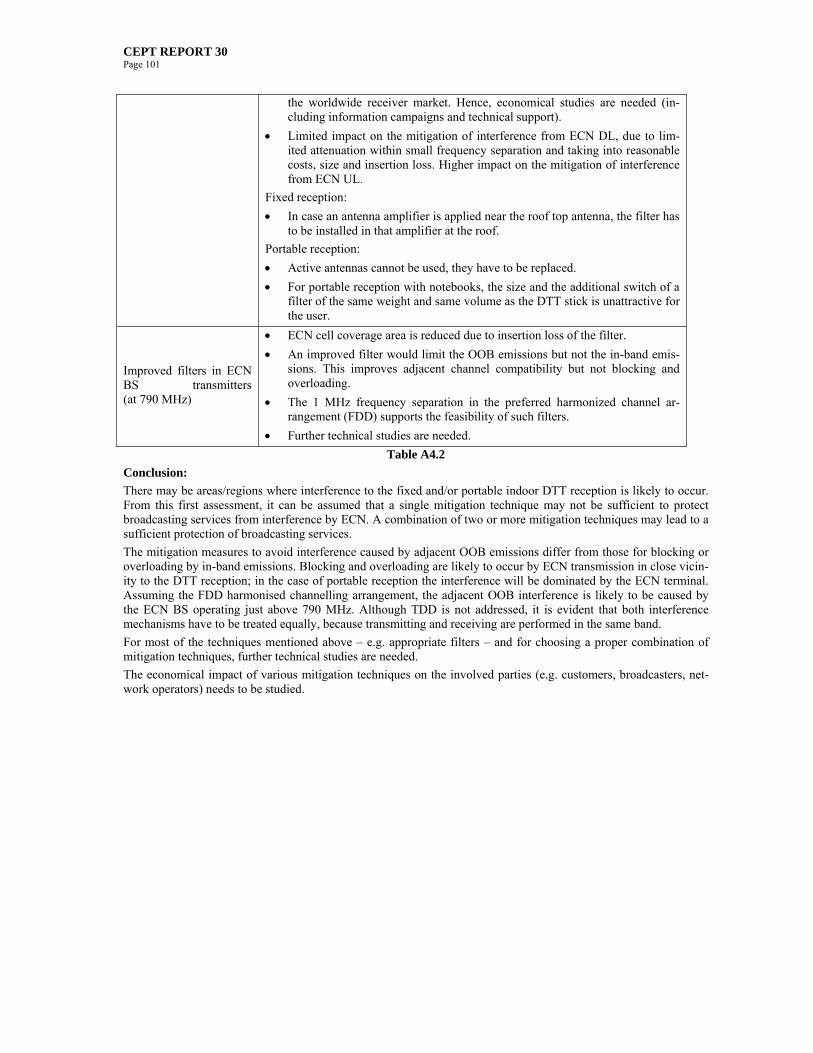
CEPT REPORT 30 Page 101
the worldwide receiver market. Hence, economical studies are needed (in-cluding information campaigns and technical support).
Limited impact on the mitigation of interference from ECN DL, due to lim-ited attenuation within small frequency separation and taking into reasonable costs, size and insertion loss. Higher impact on the mitigation of interference from ECN UL.
Fixed reception:
In case an antenna amplifier is applied near the roof top antenna, the filter has to be installed in that amplifier at the roof.
Portable reception:
Active antennas cannot be used, they have to be replaced.
For portable reception with notebooks, the size and the additional switch of a filter of the same weight and same volume as the DTT stick is unattractive for the user.
Improved filters in ECN BS transmitters (at 790 MHz)
ECN cell coverage area is reduced due to insertion loss of the filter.
An improved filter would limit the OOB emissions but not the in-band emis-sions. This improves adjacent channel compatibility but not blocking and overloading.
The 1 MHz frequency separation in the preferred harmonized channel ar-rangement (FDD) supports the feasibility of such filters.
Further technical studies are needed.
Table A4.2
Conclusion:
There may be areas/regions where interference to the fixed and/or portable indoor DTT reception is likely to occur. From this first assessment, it can be assumed that a single mitigation technique may not be sufficient to protect broadcasting services from interference by ECN. A combination of two or more mitigation techniques may lead to a sufficient protection of broadcasting services.
The mitigation measures to avoid interference caused by adjacent OOB emissions differ from those for blocking or overloading by in-band emissions. Blocking and overloading are likely to occur by ECN transmission in close vicin-ity to the DTT reception; in the case of portable reception the interference will be dominated by the ECN terminal. Assuming the FDD harmonised channelling arrangement, the adjacent OOB interference is likely to be caused by the ECN BS operating just above 790 MHz. Although TDD is not addressed, it is evident that both interference mechanisms have to be treated equally, because transmitting and receiving are performed in the same band.
For most of the techniques mentioned above – e.g. appropriate filters – and for choosing a proper combination of mitigation techniques, further technical studies are needed.
The economical impact of various mitigation techniques on the involved parties (e.g. customers, broadcasters, net-work operators) needs to be studied.
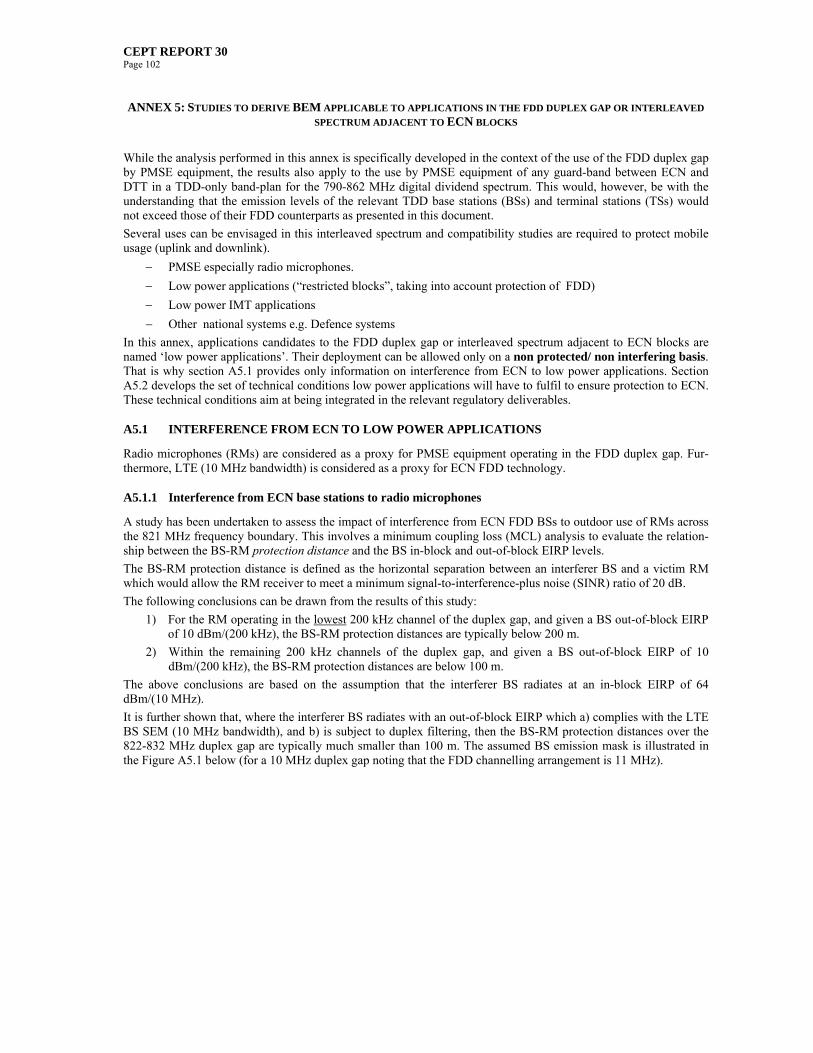
CEPT REPORT 30 Page 102
ANNEX 5: STUDIES TO DERIVE BEM APPLICABLE TO APPLICATIONS IN THE FDD DUPLEX GAP OR INTERLEAVED
SPECTRUM ADJACENT TO ECN BLOCKS
While the analysis performed in this annex is specifically developed in the context of the use of the FDD duplex gap by PMSE equipment, the results also apply to the use by PMSE equipment of any guard-band between ECN and DTT in a TDD-only band-plan for the 790-862 MHz digital dividend spectrum. This would, however, be with the understanding that the emission levels of the relevant TDD base stations (BSs) and terminal stations (TSs) would not exceed those of their FDD counterparts as presented in this document.
Several uses can be envisaged in this interleaved spectrum and compatibility studies are required to protect mobile usage (uplink and downlink).
PMSE especially radio microphones.
Low power applications (“restricted blocks”, taking into account protection of FDD)
Low power IMT applications
Other national systems e.g. Defence systems
In this annex, applications candidates to the FDD duplex gap or interleaved spectrum adjacent to ECN blocks are named ‘low power applications’. Their deployment can be allowed only on a non protected/ non interfering basis. That is why section A5.1 provides only information on interference from ECN to low power applications. Section A5.2 develops the set of technical conditions low power applications will have to fulfil to ensure protection to ECN. These technical conditions aim at being integrated in the relevant regulatory deliverables.
A5.1 INTERFERENCE FROM ECN TO LOW POWER APPLICATIONS
Radio microphones (RMs) are considered as a proxy for PMSE equipment operating in the FDD duplex gap. Fur-thermore, LTE (10 MHz bandwidth) is considered as a proxy for ECN FDD technology.
A5.1.1 Interference from ECN base stations to radio microphones
A study has been undertaken to assess the impact of interference from ECN FDD BSs to outdoor use of RMs across the 821 MHz frequency boundary. This involves a minimum coupling loss (MCL) analysis to evaluate the relation-ship between the BS-RM protection distance and the BS in-block and out-of-block EIRP levels.
The BS-RM protection distance is defined as the horizontal separation between an interferer BS and a victim RM which would allow the RM receiver to meet a minimum signal-to-interference-plus noise (SINR) ratio of 20 dB.
The following conclusions can be drawn from the results of this study:
1) For the RM operating in the lowest 200 kHz channel of the duplex gap, and given a BS out-of-block EIRP of 10 dBm/(200 kHz), the BS-RM protection distances are typically below 200 m.
2) Within the remaining 200 kHz channels of the duplex gap, and given a BS out-of-block EIRP of 10 dBm/(200 kHz), the BS-RM protection distances are below 100 m.
The above conclusions are based on the assumption that the interferer BS radiates at an in-block EIRP of 64 dBm/(10 MHz).
It is further shown that, where the interferer BS radiates with an out-of-block EIRP which a) complies with the LTE BS SEM (10 MHz bandwidth), and b) is subject to duplex filtering, then the BS-RM protection distances over the 822-832 MHz duplex gap are typically much smaller than 100 m. The assumed BS emission mask is illustrated in the Figure A5.1 below (for a 10 MHz duplex gap noting that the FDD channelling arrangement is 11 MHz).
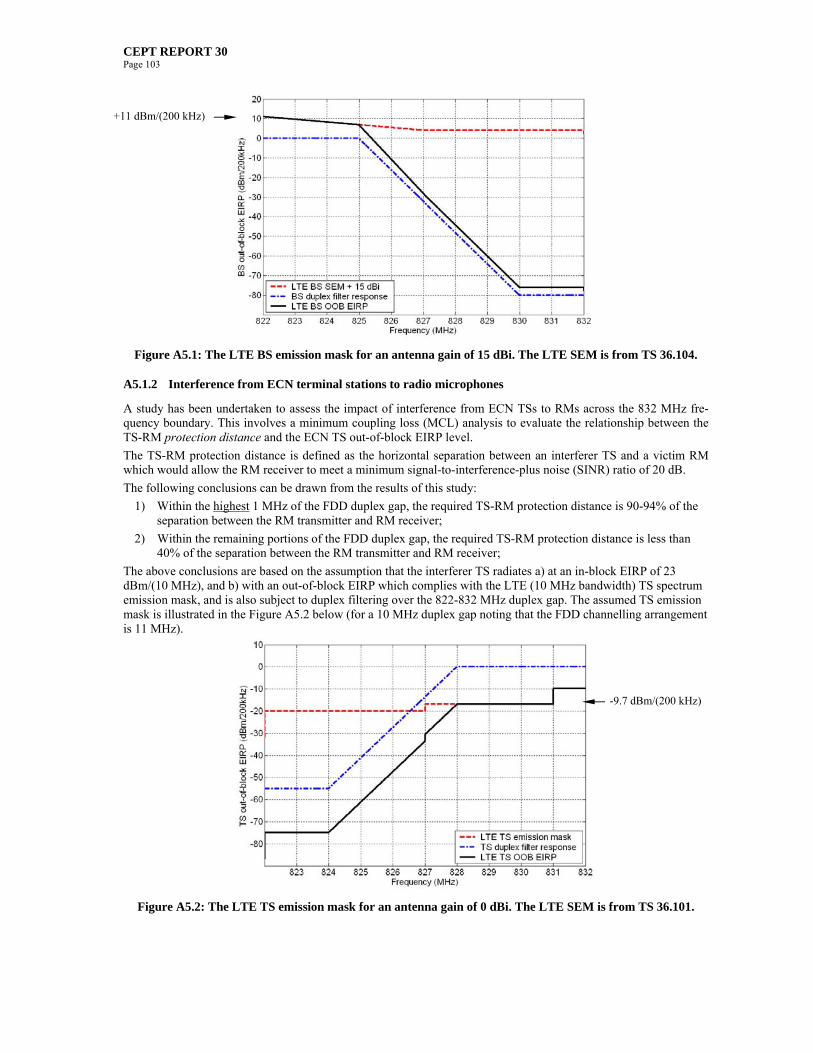
CEPT REPORT 30 Page 103
Figure A5.1: The LTE BS emission mask for an antenna gain of 15 dBi. The LTE SEM is from TS 36.104.
A5.1.2 Interference from ECN terminal stations to radio microphones
A study has been undertaken to assess the impact of interference from ECN TSs to RMs across the 832 MHz fre-quency boundary. This involves a minimum coupling loss (MCL) analysis to evaluate the relationship between the TS-RM protection distance and the ECN TS out-of-block EIRP level.
The TS-RM protection distance is defined as the horizontal separation between an interferer TS and a victim RM which would allow the RM receiver to meet a minimum signal-to-interference-plus noise (SINR) ratio of 20 dB.
The following conclusions can be drawn from the results of this study:
1) Within the highest 1 MHz of the FDD duplex gap, the required TS-RM protection distance is 90-94% of the separation between the RM transmitter and RM receiver;
2) Within the remaining portions of the FDD duplex gap, the required TS-RM protection distance is less than 40% of the separation between the RM transmitter and RM receiver;
The above conclusions are based on the assumption that the interferer TS radiates a) at an in-block EIRP of 23 dBm/(10 MHz), and b) with an out-of-block EIRP which complies with the LTE (10 MHz bandwidth) TS spectrum emission mask, and is also subject to duplex filtering over the 822-832 MHz duplex gap. The assumed TS emission mask is illustrated in the Figure A5.2 below (for a 10 MHz duplex gap noting that the FDD channelling arrangement is 11 MHz).
Figure A5.2: The LTE TS emission mask for an antenna gain of 0 dBi. The LTE SEM is from TS 36.101.
-9.7 dBm/(200 kHz)
+11 dBm/(200 kHz)

CEPT REPORT 30 Page 104
The results indicate that the TS-RM protection distances are typically smaller than the separation between the RM transmitter and receiver, even with the TS interferer radiating at peak power, and with the RM operating at the upper portions of the duplex gap.
A5.1.3 Conclusion
The results of the studies on the protection distances between ECN and PMSE equipment required for the operation of PMSE equipment in the FDD duplex gap shown that, with the exception of the upper 1 MHz and the lower 200 kHz of the FDD duplex gap where the required protection distances may be considered prohibitive for certain appli-cations, the operation of radio microphones in the FDD duplex gap would generally not be constrained as a result of interference from ECN equipment.
A5.2 INTERFERENCE FROM LOW POWER APPLICATIONS TO ECN
A5.2.1 Description of the simulation process
Two most likely low-power uses are considered within the FDD duplex gap for deriving BEM:
PMSE & radio microphones (200 kHz).
Low-power ECN applications based on cellular network topology (e.g. pico-cells involving base and termi-nal stations)
Two set of technical conditions are derived in this annex. On the one hand, one BEM for low-power terminal sta-tions of the mobile service (including PMSE & radio microphones) and on the other hand, one BEM for low power base stations of the mobile service. The first set of applications concerns terminal devices mobile generally at un-known location whereas the second set concerns base station at fixed and known location.
Calculations are based on most likely protection distance as follows:
60 m between low-power devices (PMSE) and ECN BS.
15 m between (PMSE) devices and ECN TS.
6 m between LP-ECN TS and ECN TS.
50 m between LP-ECN BS and ECN BS
10m between low-power devices LP-ECN BS and ECN TS
When deriving BEM limits, scenarios involving interference from PMSE to ECN TS where there is some depend-ence between the ECN user and the PMSE user are not considered. In such circumstances, the victim and/or inter-ferer can take appropriate action to mitigate interference. In this context, a protection distance of 15m between the PMSE interferer and ECN TS victim is considered to be appropriate. This corresponds to scenarios where the ECN user and the PMSE user are independent. In such circumstances, there is no possibility of cooperation between vic-tim and interferer. Such scenarios occur in outdoor environments (e.g., a ECN TS user in proximity to an event in a park/street) or possibly within large indoor environments (e.g., an exhibition centre).
The Figure A5.3 below illustrates the different interference scenarios which need to be investigated. ECNbase
station (BS)
ECNterminal station
(TS)
PMSE
Low-power ECN base station
(LP-ECN BS)
Low-power ECN terminal station
(LP-ECN TS)
ECNbase
station (BS)
ECNterminal station
(TS)
PMSE
Low-power ECN base station
(LP-ECN BS)
Low-power ECN terminal station
(LP-ECN TS) Figure A5.3: Interference scenario between low power mobile applications and ECN TS or ECN BS

CEPT REPORT 30 Page 105
A5.2.2 Parameters used in this annex
The victim ECN receiver performance is based on:
The performance criterion used in victim’s performance relies upon desensitisation and potential blocking as-pects from narrow band and wide band blocking.
o 1 dB desensitisation of victim ECN BS.
o 3 dB desensitisation of victim ECN TS.
Blocking specifications for LTE (10 MHz) TSs and BSs based on 3GPP TS 36.101 and 36.104 (narrow-band & wideband) It is assumed that, in practice, a device’s rejection of an adjacent-channel interferer is 3 dB better than that implied by the 3GPP blocking specifications.
Specification Narrow band blocking on
ECN TS
Wide band blocking on
ECN TS
Narrow band blocking on
ECN BS
Wide band blocking on
ECN BS
Source TS 36.101 section 7.6.3
TS 36.101 sec-tion 7.6..1
TS 36.104 section 7.5
TS 36.104 section 7.6
Blocking require-ment
-55dBm -56dBm -49dBm -52dBm
Associated desensi-tisation
13dB 6dB 6dB 6dB
Calculation
Target desensitiza-tion
3dB 3dB 1dB 1dB
Interfering power -65dBm -59dBm -54dBm -57dBm
Table A5.1: Calculation of maximum interfering power
Improved ACS for narrow-band interfering signal according to frequency offset.
3GPP narrow-band blocking specifications assume that the interferer is immediately adjacent to the vic-tim’s channel-edge and implies a narrowband receiver selectivity of 30 dB. For an offset of 2 MHz from the victim’s channel-edge, the narrowband selectivity is naturally greater than 30 dB. This improvement in narrow-band rejection as a function of frequency offset can be derived from the 3GPP-specified wideband ACS value of 36 dB over 5 MHz. Starting from a narrowband 30dB selectivity at zero offset, a linear slope of 17/5 dB/MHz would result in an wideband selectivity of 36 dB over 5 MHz, as well as a narrowband ACS value of 47dB at 5 MHz offset, and 36.8dB at 2 MHz offset. For the purposes of this study, we will assume a narrowband selectivity of 38 dB at 2 MHz offset.
Duplex filter rejection according to frequency offset.
It is assumed that an ECN TS receiver duplex filter provides an additional rejection of 2 dB (16 dB) at 2 MHz (5 MHz) offset from the channel-edge for narrow band signals (<1 MHz).
It is assumed that an ECN TS receiver duplex filter provides an additional rejection of 27dB for 5 MHz frequency offset for wide band signals (>5MHz). These values have been determined as an average of vari-ous duplex filters characteristics.
An additional rejection due to ECN BS antenna elevation pattern and relative location of low power ECN BS
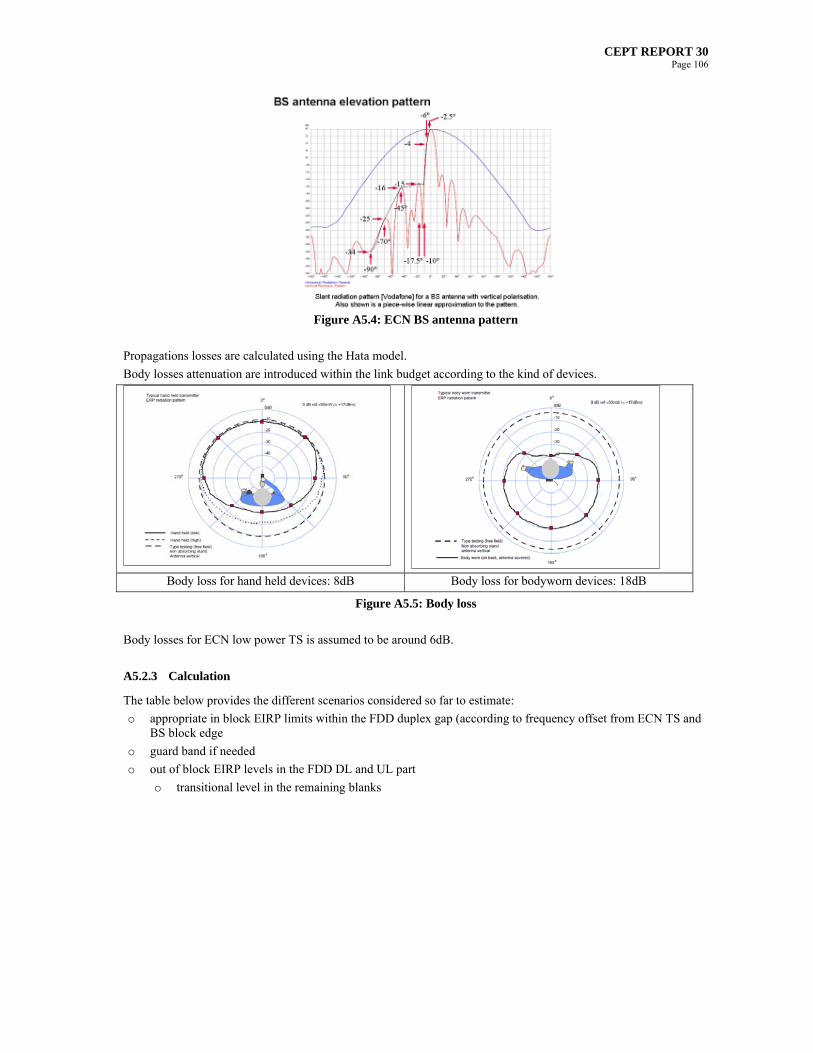
CEPT REPORT 30 Page 106
Figure A5.4: ECN BS antenna pattern
Propagations losses are calculated using the Hata model.
Body losses attenuation are introduced within the link budget according to the kind of devices.
Body loss for hand held devices: 8dB Body loss for bodyworn devices: 18dB
Figure A5.5: Body loss
Body losses for ECN low power TS is assumed to be around 6dB.
A5.2.3 Calculation
The table below provides the different scenarios considered so far to estimate:
o appropriate in block EIRP limits within the FDD duplex gap (according to frequency offset from ECN TS and BS block edge
o guard band if needed
o out of block EIRP levels in the FDD DL and UL part
o transitional level in the remaining blanks

CEPT REPORT 30 Page 107
Table A5.2: Details of calculations between ECN low power applications (including PMSE) and ECN TS and ECN BS

CEPT REPORT 30 Page 108
A5.2.4 Analysis of the results
MCL analysis indicates that ECN TS and BS will be protected if
a RM in-block EIRP of 20 dBm, out-of-block EIRP of -31 dBm/(10 MHz) below 821 MHz, out-of-block EIRP of -22dBm/(10 MHz) above 832 MHz is deployed within the FDD duplex gap with a 5 MHz guard band at 821 MHz boundary,
a handheld RM in-block EIRP of 13 dBm, out-of-block EIRP of -40 dBm/(10 MHz) below 821 MHz, out-of-block EIRP of -22dBm/(10 MHz) above 832 MHz is deployed within the 823-826 MHz (i.e. 2 MHz guard band at 821 MHz boundary),
an ECN LP TS in-block EIRP of 20 dBm, out-of-block EIRP of -38 dBm/(10 MHz) below 821 MHz is de-ployed within the FDD duplex gap with a 5 MHz guard band at 821 MHz boundary,
an ECN LP BS in-block EIRP of 13 dBm, out-of-block EIRP of -39 dBm/(10 MHz) below 821 MHz and above 832 MHz is deployed within the FDD duplex gap with a 5 MHz guard band at 821 MHz boundary,
Some transitional levels can also be determined in the blank areas within the FDD duplex gap. They are not intended to be used for transmission and belong to the out-of-block part of the BEM. They are calculated based on spectrum emission mask of PMSE equipments or ECN low power devices.
In addition to these calculations, ECN TS specifications (36.101) define limits for the emission power within the DL band (below 821 MHz) in order to avoid TS to TS interference. The “spurious emission band UE co-existence” in Section 6.6.3.2 is defined as -50 dBm/MHz (i.e. -43dBm/5MHz).
Defining a BEM keeping in mind service and technology neutrality implies to cover the most likely uses of the FDD duplex gap (or in the guard band of a TDD channelling arrangement). A single set of technical conditions should be defined. In particular, requirements on the out-of-block EIRP should be the most stringent values determined here above according to the different applications. This would lead to:
Proposal for ECN low power TS and PMSE devices in the FDD duplex gap
In-block limits
1) LP-ECN TSs and PMSE equipment can operate within 826-832 MHz at an in-block EIRP of 20 dBm.
2) Narrowband ( < 1MHz) PMSE equipment can also operate within 823-826 MHz
at an in-block EIRP of 13dBm if they are hand-held.
at an in-block EIRP of 20dBm if they are body-worn.
Out-of-block baseline limits
1) Over FDD DL frequencies (< 821 MHz), the out-of-block EIRP is -43 dBm/(5 MHz).
2) Over FDD UL frequencies (> 832 MHz), the out-of-block EIRP is -25 dBm/(5 MHz).
Out-of-block transitional limits
1) Within 821-823 MHz, the out-of-block EIRP is -20.6 dBm/(2 MHz) for PMSE devices.
2) Within 821-826 MHz, the out-of-block EIRP is +1.6 dBm/(5 MHz) for LP-ECN TSs.
Proposal for ECN low power BS in the FDD duplex gap
In-block limits
1) LP-ECN BSs can operate within 826-832 MHz at an in-block EIRP of 13 dBm.
Out-of-block baseline limits
2) Over FDD DL & UL frequencies (< 821 & > 832 MHz), the out-of-block EIRP is -43 dBm/(5 MHz).
Out-of-block transitional limits
3) Within 821-826 MHz, the out-of-block EIRP is -9 dBm/(5 MHz) for LP-ECN BSs.
All the above apply to a maximum BS antenna height limit of 4 m.
A5.2.5 Compliance of PMSE spectrum emission mask with the BEM requirements
PMSE operates with an ERP of 10mW or 50mW (EIRP of 12.15 and 19.15 dBm). Therefore, BEM in block EIRP of 13 or 20dBm within 823-832 MHz would let 9 MHz for PMSE operation.
PMSE would need to comply with an out-of-block requirement of -43dBm/(5MHz) below 821 MHz and -25dBm/(5MHz) above 832 MHz. What is the impact of these requirements given the spectrum emission mask of PMSE?
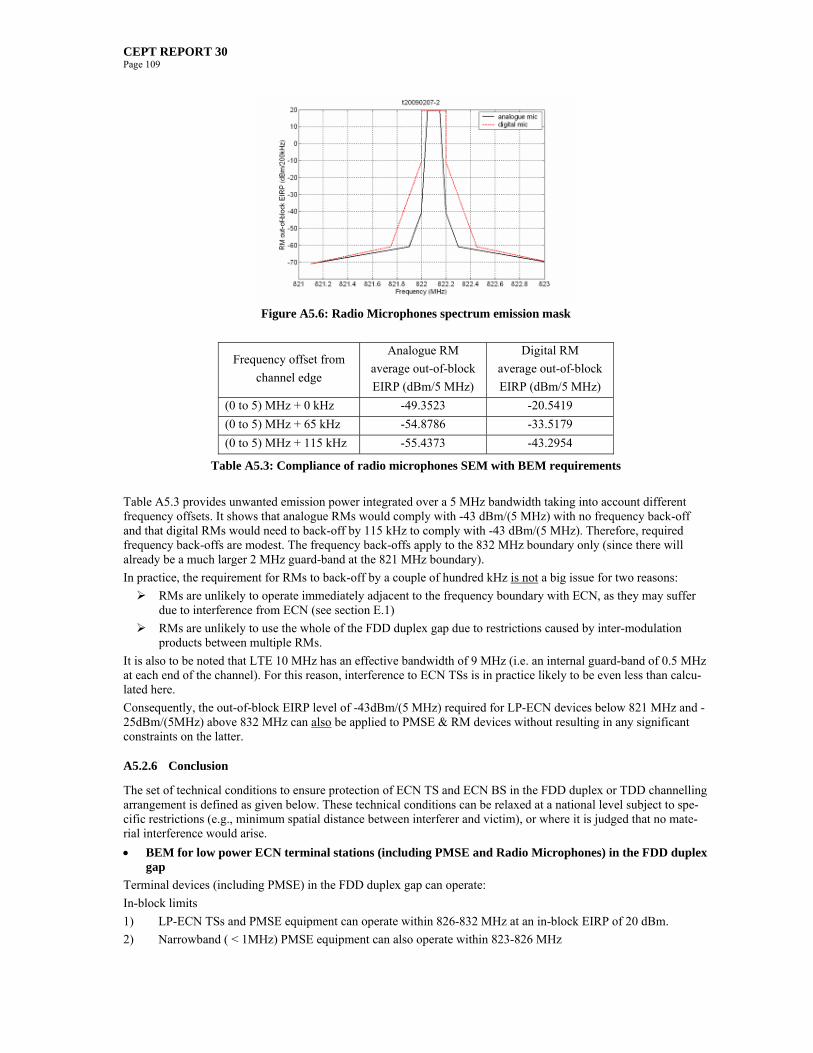
CEPT REPORT 30 Page 109
Figure A5.6: Radio Microphones spectrum emission mask
Frequency offset from
channel edge
Analogue RM
average out-of-block
EIRP (dBm/5 MHz)
Digital RM
average out-of-block
EIRP (dBm/5 MHz)
(0 to 5) MHz + 0 kHz -49.3523 -20.5419
(0 to 5) MHz + 65 kHz -54.8786 -33.5179
(0 to 5) MHz + 115 kHz -55.4373 -43.2954
Table A5.3: Compliance of radio microphones SEM with BEM requirements
Table A5.3 provides unwanted emission power integrated over a 5 MHz bandwidth taking into account different frequency offsets. It shows that analogue RMs would comply with -43 dBm/(5 MHz) with no frequency back-off and that digital RMs would need to back-off by 115 kHz to comply with -43 dBm/(5 MHz). Therefore, required frequency back-offs are modest. The frequency back-offs apply to the 832 MHz boundary only (since there will already be a much larger 2 MHz guard-band at the 821 MHz boundary).
In practice, the requirement for RMs to back-off by a couple of hundred kHz is not a big issue for two reasons:
RMs are unlikely to operate immediately adjacent to the frequency boundary with ECN, as they may suffer due to interference from ECN (see section E.1)
RMs are unlikely to use the whole of the FDD duplex gap due to restrictions caused by inter-modulation products between multiple RMs.
It is also to be noted that LTE 10 MHz has an effective bandwidth of 9 MHz (i.e. an internal guard-band of 0.5 MHz at each end of the channel). For this reason, interference to ECN TSs is in practice likely to be even less than calcu-lated here.
Consequently, the out-of-block EIRP level of -43dBm/(5 MHz) required for LP-ECN devices below 821 MHz and -25dBm/(5MHz) above 832 MHz can also be applied to PMSE & RM devices without resulting in any significant constraints on the latter.
A5.2.6 Conclusion
The set of technical conditions to ensure protection of ECN TS and ECN BS in the FDD duplex or TDD channelling arrangement is defined as given below. These technical conditions can be relaxed at a national level subject to spe-cific restrictions (e.g., minimum spatial distance between interferer and victim), or where it is judged that no mate-rial interference would arise.
BEM for low power ECN terminal stations (including PMSE and Radio Microphones) in the FDD duplex gap
Terminal devices (including PMSE) in the FDD duplex gap can operate:
In-block limits
1) LP-ECN TSs and PMSE equipment can operate within 826-832 MHz at an in-block EIRP of 20 dBm.
2) Narrowband ( < 1MHz) PMSE equipment can also operate within 823-826 MHz
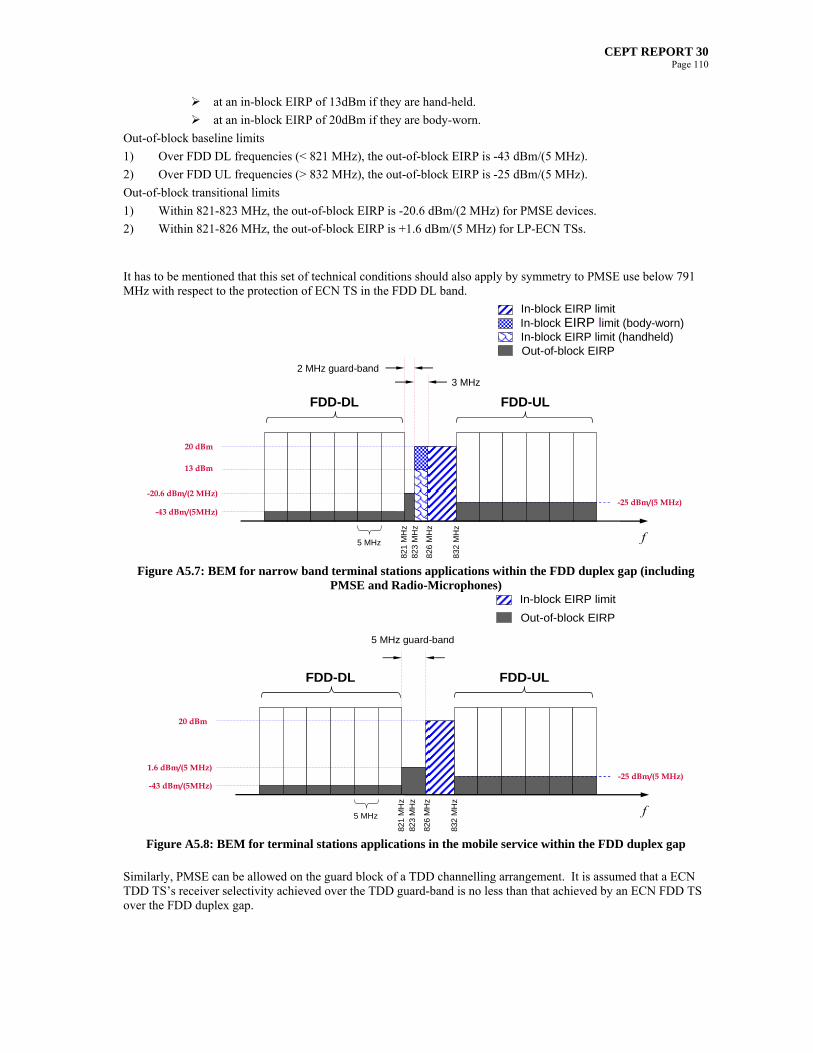
CEPT REPORT 30 Page 110
at an in-block EIRP of 13dBm if they are hand-held.
at an in-block EIRP of 20dBm if they are body-worn.
Out-of-block baseline limits
1) Over FDD DL frequencies (< 821 MHz), the out-of-block EIRP is -43 dBm/(5 MHz).
2) Over FDD UL frequencies (> 832 MHz), the out-of-block EIRP is -25 dBm/(5 MHz).
Out-of-block transitional limits
1) Within 821-823 MHz, the out-of-block EIRP is -20.6 dBm/(2 MHz) for PMSE devices.
2) Within 821-826 MHz, the out-of-block EIRP is +1.6 dBm/(5 MHz) for LP-ECN TSs.
It has to be mentioned that this set of technical conditions should also apply by symmetry to PMSE use below 791 MHz with respect to the protection of ECN TS in the FDD DL band.
823
MH
z
13 dBm
821
MH
z
5 MHz
-25 dBm/(5 MHz)
832
MH
z20 dBm
FDD-ULFDD-DL
f
-43 dBm/(5MHz)
826
MH
z
3 MHz
-20.6 dBm/(2 MHz)
In-block EIRP limit
Out-of-block EIRPIn-block EIRP limit (handheld)In-block EIRP limit (body-worn)
2 MHz guard-band
Figure A5.7: BEM for narrow band terminal stations applications within the FDD duplex gap (including
PMSE and Radio-Microphones)
823
MH
z82
1 M
Hz
5 MHz
832 M
Hz
FDD-ULFDD-DL
f
826
MH
z
In-block EIRP limit
Out-of-block EIRP
5 MHz guard-band
20 dBm
-43 dBm/(5MHz)
1.6 dBm/(5 MHz)-25 dBm/(5 MHz)
Figure A5.8: BEM for terminal stations applications in the mobile service within the FDD duplex gap
Similarly, PMSE can be allowed on the guard block of a TDD channelling arrangement. It is assumed that a ECN TDD TS’s receiver selectivity achieved over the TDD guard-band is no less than that achieved by an ECN FDD TS over the FDD duplex gap.

CEPT REPORT 30 Page 111
FDD-ULBroadcasting
f
3 MHz
In-block EIRP limit
Out-of-block EIRPIn-block EIRP limit (handheld)In-block EIRP limit (body-worn)
2 MHz guard-band
60595857
13 dBm
20 dBm
-43 dBm/(5MHz)
-20.6 dBm/(2 MHz)
Figure A5.9: BEM for PMSE and Radio-Microphones only within the TDD guard band
BEM for low power ECN base stations in the FDD duplex gap (or in the guard band of the TDD channel-ling arrangement)
In-block limits
1) LP-ECN BSs can operate within 826-832 MHz at an in-block EIRP of 13 dBm.
Out-of-block baseline limits
1) Over FDD DL & UL frequencies (< 821 & > 832 MHz), the out-of-block EIRP is -43 dBm/(5 MHz).
Out-of-block transitional limits
1) Within 821-826 MHz, the out-of-block EIRP is -9 dBm/(5 MHz) for LP-ECN BSs.
All the above apply to a maximum BS antenna height limit of 4 m.
821 M
Hz
5 MHz
832 M
Hz
FDD-ULFDD-DL
f
826
MH
z
In-block EIRP limit
Out-of-block EIRP
5 MHz guard-band
13 dBm
-43 dBm/(5MHz)
-9 dBm/(5 MHz)
-43 dBm/(5 MHz)
Figure A5.10: BEM for low power base stations applications within the FDD duplex gap
CEPT REPORT 30 Page 112
ANNEX 6: PROPAGATION MODELS
The propagation model used in the Annexes 1 and 2 is based on the propagation model developed in the ITU-R JTG 5-6 to conduct sharing studies between the broadcast service and the mobile service32 in response to the WRC-12 AI 1.17. The model is a combination of the extended Hata model in Report ITU-R SM.2028 for distances below 1 km and Recommendation ITU-R P.1546-3 for distances greater 1 km. For distances less than 40 m, free space is ap-plied.
For low transmitting antenna heights and distances less than 40 m, free space is generally applied for the studies. Therefore, the following cases need only be considered by the model:
Wanted radio path: Broadcasting: DTT Tx to DTT Rx (fixed and portable reception),
Wanted radio path: ECN BS to ECN TS (portable reception), to determine cell size,
Unwanted (interfering) radio path: ECN BS is interfering DTT Rx (fixed and portable reception).
If additional the wall attenuation has to be considered (e.g. portable indoor), an additional log-normal distribution with a standard deviation of 5.5 dB has to be added.
A6.1 SIMPLIFYING ASSUMPTIONS FOR COMPATIBILITY STUDIES: DTT VS. ECN BS DOWNLINK
Sharing studies are required for urban and/or for suburban conditions. For coverage and interference calculations, a flat land surface will be the reference; this means that the effective antenna height is the same as the height of the antenna above ground level. The reference receiver/mobile antenna height, R, as defined in Recommendation ITU-R P.1546-3 is taken to be 10 m in a suburban environment, and 20 m in an urban environment. The frequencies of interest lie in the 800 MHz range, approximately; so, for distances larger than or equal to 1 km, two reference fre-quencies will be specified, 600 MHz and 2 000 MHz (as done in Recommendation ITU-R P.1546-3), between which results for the relevant frequencies can be found by suitable interpolation (described in section A6.2.3); for applica-ble distances (e.g. 100 m), the extended Hata formula includes an explicit function of frequency. In short, the first assumptions are:
Clutter height R = 10 m (rural/open area), 20 m (urban area)
Flat surfaces are assumed for all propagation paths: all effective antenna heights are assumed to be the height of the antenna above ground level
Land paths only
Frequency: 790 MHz
Time probability: 50 % for wanted and unwanted radio paths
A6.2 DETAILED PROPAGATION PREDICTION ALGORITHM
Elements of the ‘Hata’ model33 will be used for short (i.e. ≤ 0.1 km) distance propagation predictions and elements of Recommendation ITU-R P.1546-3 for long (i.e. ≥ 1 km) distances, with logarithmic interpolation connecting the two in the transition range.
Recommendation ITU-R P.1546-3 provides propagation predictions in terms of ‘field strength’ as a function of distance. The ‘Hata’ model provides propagation predictions in terms of ‘propagation loss’ as a function of distance. In order to be consistent with the units when using the ‘Hata’ model at ‘short’ distances and Recommendation ITU-R P.1546-3 at ‘large’ distances, with an interpolation between ‘short’ and ‘large’ distances, the formula for the con-version between these two parameters, field strength and propagation loss, is the following (assuming a 0 dBkW ERP for the Recommendation ITU-R P.1546-3 tabulated predictions):
E(dBV/m) = 139.3 + 20 log f(MHz) – Loss (A6.2.1)
To be consistent throughout this contribution, field strength values (dBV/m units) will be specified, converting from the calculated propagation loss, using equation (A6.2.1), in the cases where the ‘Hata’ model is applied.
A limited set of elements, formulas, etc. of Report ITU-R SM.2028 (in section A6.2.2) and of Recommendation ITU-R P.1546-3 (in section A6.2.3) build a calculation basis for propagation prediction for the purposes of the JTG 5-6 sharing studies. Designating the horizontal propagation path distance as D, if D is less than or equal to
32 The model is described in detail in the Annex of the Chairman’s Report in document ITU-R JTG5-6/88. 33 The ‘Hata’ model indicated here and elsewhere in this text (with the word Hata in single quotation marks) refers to the “Modified Hata”
propagation model described in Report ITU-R SM.2028.
CEPT REPORT 30 Page 113
0.1 km, only the ‘Hata’ model is used (section A6.2.2); if D is greater than or equal to 1.0 km, only the Recommen-dation ITU-R P.1546 based model is used (section A6.2.3); if D is between 0.1 km and 1.0 km (section A6.2.4), the ‘Hata’ model is used for d = 0.1 km (yielding E0.1, the field strength at 0.1 km), and the Recommendation ITU-R P.1546 based model is used for d = 1.0 km (yielding E1.0, the field strength at 1.0 km), and logarithmic interpolation between E0.1 and E1.0 is used for 0.1 < D < 1.0.
A6.2.1 Reciprocity
A6.2.1.1 General
The predictions of the ‘Hata’ model are generally reciprocal with respect to designations of the transmitting/base station and the receiver/mobile station terminal. Recommendation ITU-R P.1546-3 does not follow the reciprocity principle.
Although Recommendation ITU-R P.1546-3 is not reciprocal with respect to those terminal designations, the Rec-ommendation can still be used in a reciprocal manner as specified in Recommendation ITU-R P.1546-3, and as described here, and it is proposed to use reciprocity in those few cases where it is useful for propagation distances ≥ 1 km, e.g. to facilitate the transition between Recommendation ITU-R 1546-3 predictions at long distances and those of the ‘Hata’ model at short distances.
In the following description, the input antenna heights of the transmit and receive antennas will be designated as Ht and Hr, respectively; here the distinction between mobile service antennas and broadcast service antennas need not be made in general in the following, and this allows a simplification of the notation. To exploit reciprocity, define ht = max(Ht, Hr) and hr = min(Ht, Hr).
The following notation will be used for simplicity:
“Eab” will designate the field strength of a signal transmitted from an antenna of height “a” and received at an antenna of height “b”. The arrow linking “a” to “b” in the subscript of E indicates the ‘direction’ of the transmission (i.e., “ab” means a transmission from an antenna of height “a” to an antenna of height “b”).
“R” 34 will be used to designate the reference antenna height, 10 m or 20 m, for rural/open and urban conditions, respectively.
Guided by section 1.1 of Annex 5 of Recommendation ITU-R P.1546-3, three reference cases (a, b and c) are treated (more details of the calculations indicated in the following 3 subsections are given in sections A6.2.1.2.1 to A6.2.1.2.3).
The notation used below is the following:
The ‘real’ transmitter height is Ht, and the ‘real’ receiver height is Hr. Because of reciprocity the following notation is introduced: ht = max(Ht, Hr), hr = min(Ht, Hr).
The symbol “Ehthr” designates a field strength (or propagation loss) which arises as a result of a transmission from a transmitter antenna height, “ht”, to a receiver antenna height “hr”. “R” is the representative clutter height. Some-times the “ht” and “hr” are interchanged in the subscript of “E”: “Ehrht” = “Ehthr”, which is correct as a result of the assumption/application of reciprocity.
A6.2.1.1.1 Both terminal heights are < R (Case a)
This case is not relevant here because the ECN BS and DTT Tx are always above R!
A6.2.1.1.2 Both terminals heights are ≥ R (Case b)
If both terminals heights, Ht and Hr, are ≥ R, then the terminal with the greater effective height, ht, is treated as the transmitter, the smaller, hr, is treated as the receiver. (For example, R = 10 m or 20 m, and the base station receiver antenna height is hR = 30 m, while the interfering broadcast transmitter antenna height is hT = 20 m, then ht = 30 m, and hr = 20 m.)
– calculate EhtR
34 Recall, the reference receiving/mobile antenna at a height, R (m) is representative of the height of the ground cover surrounding the receiv-ing/mobile antenna, subject to a minimum height value of 10 m. Examples of reference heights are 20 m for an urban area and 10 m for ru-ral/open area.
CEPT REPORT 30 Page 114
– if hr > R, add receiver height correction for hr: R hr to calculate Ehthr from EhtR
– note that Ehthr = Ehrht by reciprocity.
A6.2.1.1.3 Only one terminal is ≥ R (Case c)
If only one terminal height (either Ht or Hr) is ≥ R, then the larger, ht, is treated as the transmitter, and the smaller, hr < R, is treated as the receiver. (For example, R = 10 m or 20 m, and the base station receiver antenna height is hR = 30 m, while the mobile handset transmitter antenna height is hT = 1.5 m, then ht = 30 m, and hr = 1.5 m.)
– calculate EhtR
– add receiver height correction for hr: R hr to calculate Ehthr from EhtR
– Note that Ehthr = Ehrht by reciprocity.
A6.2.1.2 Reciprocity application
Because Recommendation ITU-R P.1546-3 is not reciprocal, it is important to specify uniquely the sequence of the steps of the calculation procedure for distances 1 km and more, in cases where reciprocity is exploited.
Three possible environments may be investigated, urban and rural/open. The parameter R is used to distinguish between an urban environment (R = 20 m) and rural/open environment (R = 10 m). Using the reference transmitter and receiver antenna heights, Ht and Hr, respectively, only the following cases need be examined:
Ht > R, Ht = R, Ht < R (A6.2.2)
Hr > R, Hr = R, Hr < R. (A6.2.3)
A6.2.1.2.1 Case b
This case is treated directly using the relevant Recommendation ITU-R P.1546-3 tables and procedures specified in section A6.2.3; in some cases where ht = 30 m, results are interpolated between the corresponding results for 20 m and 37.5 m transmit antenna heights using the height interpolation equation (A6.2.15) below.
– the field strength EhtR is calculated directly (using section A6.2.3);
– if hr R, the receiving antenna height correction, CORRRhr, for receive antenna height R increased to hr is calculated according to section A6.2.3e below;
– the desired field strength is Eht hr = EhtR + CORRRhr;
– note that Ehthr = Ehrht by reciprocity.
A6.2.1.2.2 Case c
This case is treated as follows:
– Hr < R means hr = 1.5 m;
– the field strength EhtR for (ht, hr = R) is calculated directly (using section A6.2.3);
– the receiving antenna height correction, CORRR1.5, for receive antenna height R reduced to 1.5 m (= hr) is calculated according to section A6.2.3e below;
– the desired field strength is Eht1.5 = EhtR + CORRR1.5;
– note that Eht1.5 = E1.5ht by reciprocity.
–
A6.2.2 Basic propagation loss formula from the ‘Hata’ Model
The formulas for the propagation loss presented in this section are extracted from Report ITU-R SM.2028, for the reference conditions. Note that calculated losses less than free space attenuations are corrected to the free space attenuation.
CEPT REPORT 30 Page 115
A6.2.2.1 Urban environment
For distances from 0 km to 0.1 km, the ‘Hata’ model is used (as prescribed in Report ITU-R SM.2028). ht and hr represent the transmitter and receiver heights, in m. For mobile systems, a terminal may be used for both transmis-sion and reception.
A6.2.2.1.1 d ≤ 0.04 km
The loss for distances less than, or equal to 0.04 km is free space loss:
6
22
10log10log204.32)( rt hh
dfdL (A6.2.7)
A6.2.2.1.2 0.04 km < d ≤ 0.1 km
For distances between 0.04 km and 0.1 km, log interpolation is used, between free space at 0.04 km and ‘Hata’ at 0.1 km.
)04.0()1.0(
)04.0log()1.0log(
)04.0log()log()04.0()( LL
dLdL
(A6.2.8)
Note that if the Hata loss at 0.1 km, L(0.1), is less than the free space loss at 0.1 km, the free space loss is used in-stead of L(0.1) in equation A6.2.8.
A6.2.2.1.3 d = 0.1 km
For d = 0.1 km, the ‘Hata’ formulas are used: Hm = min(ht, hr), Hb = max(ht, hr):
)}10/log(20,0{max)8.0)log(56.1(},10{min)7.0)log(1.1()( mmm HfHfHa (A6.2.9)
)}30/log(20,0{min)( bb HHb (A6.2.10)
For f = 150 MHz to 1 500 MHz
)()()10/)(log(}),30{log(55.69.44
}),30{log(82.13)log(2.266.69)(
622bmrtb
b
HbHahhdH
HfdL
max
max(A6.2.11)
A6.2.2.1.4 0.1 km < d < 1 km
For distances between 0.1 km and 1.0 km, log interpolation is used, between ‘Hata’ at 0.1 km and Recommendation ITU-R P.1546-3 at 1.0 km.
)1.0()0.1(
)1.0log()0.1log(
)1.0log()log()1.0()( LL
dLdL
(A6.2.12)
Note that if the Hata loss at 0.1 km, L(0.1), is less than the free-space loss at 0.1 km, the free space loss is used in-stead of L(0.1) in equation 6.2.12.
A6.2.2.2 Rural/Open environment
For ease of notation, the result of the calculation in the previous section, A6.2.2.1 will be denoted as “Lurban” in the following.
The propagation Loss in an open/rural environment is related to that in an urban environment (as calculated in sec-tion A6.2.2.1) using the following equation, for any given frequency, f:
Lopen = Lurban – 4.78{log[min(max(150,f),2000)]}2 + 18.33 log[min(max(150,f),2000)] – 40.94 (A6.2.13)

CEPT REPORT 30 Page 116
A6.2.2.3 Standard deviation
When the ‘Hata’ approximation is being used for distances less than (or equal to) 0.1 km, the location probability standard deviation of 5.5 dB should be used when calculating propagation location statistics (e.g., interference to broadcast). For distances up to 40 m (free space), the standard deviation is set to 3.5 dB.
A6.2.3 Basic field strength prediction from Recommendation ITU-R P.1546-3 (d ≥ 1 km)
The parameter R takes the values 10 m for a rural/open environment, 20 m for an urban environment, respectively. The numbers in the parentheses preceding the equations are the equation numbers as given in Annex 5 of Recom-mendation ITU-R P.1546-3.
a) The tables of Recommendation ITU-R P.1546-3 are used for distances between 1 km and 1 000 km, for the frequencies 600 MHz and 2 000 MHz, land paths, relevant reference transmitter and receiver antenna heights, and time percentages. In particular the 50% time curves are used to calculate the wanted signal strength.
For the frequencies 600 MHz and 2 000 MHz:
b) For transmitter antenna heights between the Recommendation ITU-R P.1546-3 reference heights (e.g. ha = 30 m), the corresponding field strength is found by interpolating between adjacent (upper and lower, e.g. 37.5 m and 20 m, respectively) reference heights (hu > ha > hl), using the following formula (eqn. 8 of section 4.1 of Annex 5 of Recommendation ITU-R P.1546-3):
E = El + (Eu – El ) log( ha / hl ) / log( hu / hl ) dB(V/m) (A6.2.14)
c) For distances between the Recommendation ITU-R P.1546-3 reference distances (e.g. da = 22 km), the corre-sponding field strength is found by interpolating between adjacent (upper and lower, e.g. 25 km and 20 m, re-spectively) reference distances (du > da > dl), using the following formula (eqn. 13 of section 5 of Annex 5 of Recommendation ITU-R P.1546-3):
E = El + (Eu – El ) log( da / dl ) / log( du / dl ) dB(V/m) (A6.2.15)
d) For frequencies, f, between the two frequencies 600 MHz and 2 000 MHz), the following formula can be ap-plied (eqn. 14 of section 6 of Annex 5 of Recommendation ITU-R P.1546-3)
E = E600 + ( E2000 – E600 ) log( f / 600 ) / log( 2 000 / 600 ) dB(V/m), (A6.2. 16)
with E600 and E2000 the field strength values at 600 MHz and 2 000 MHz, respectively.
e) Section 9 of Annex 5 of Recommendation ITU-R P.1546-3 will be used for receiver height correction:
Receiver height correction for Hrx R (10 or 20 m):
For example, for cases: HT ≥ R (10 m, or 20 m); h1 = HT = 100, 300 m, or h1 = HT = 30, 60 m, h2 = HR = 1.5 m
i) calculate (eqn. 26 of section 9 of Annex 5 of Recommendation ITU-R P.1546-3)
R′ = (1000dR – 15h1)/(1000d – 15) m (A6.2.17)
and a similar correction for h2
h2′ = (1000dh2 – 15h1)/(1000d – 15) m (A6.2.17)
where h1, h2 and R (m) and distance d (km)
ii) calculate (eqns. 27d, 27e, 27g, 27c, 27f, of section 9 of Annex 5 of Recommendation ITU-R P.1546-3):
hdif = R′ − h2′ m (A6.2.18)
θclut = arctan(hdif /27) degrees (A6.2.19)
Knu = 0.0108 f1/2 (A6.2.20)
= Knu ( hdif θclut )1/2 (A6.2.21)
Kh2 = 3.2 + 6.2log ( f ) (A6.2.22)
where f: frequency (MHz)
iii) calculate (eqn. 12a of section 4.3 of Annex 5 of Recommendation ITU-R P.1546-3) :
J() = 6.9 + 20log{ [( − 0.1)2 + 1]1/2 + − 0.1 } (A6.2.23)

CEPT REPORT 30 Page 117
iv) When the receiving/mobile antenna is in an urban environment, the correction is given by (eqn. 27a, 27b of section 9 of Annex 5 of Recommendation ITU-R P.1546-3):
CORRR′≥10 = 6.03 − J () dB for h2′ < R′ (A6.2.24)
CORRR′≥10 = Kh2 log( h2′ / R′) dB for h2′ ≥ R′ (A62.25)
v) If R' is less than 10 m and in an urban environment (R = 20 m), the correction given by equations A6.2.24 and A6.2.25 should be reduced by Kh2 log(10/R′)
CORRR′<10 = CORRR′≥10 – Kh2 log(10/R′) dB for R′ < 10 m. (A6.2.26)
vi) For rural/open environment the correction is:
CORR = Kh2 log(10/R) dB. (A6.2.27)
f) The standard deviation for broadcast signals is taken to be = 5.5 dB.
A6.2.4 Field strength prediction at a distance, d, between 0.1 km (using ‘Hata’ model) and 1 km (using Rec-ommendation ITU-R P.1546-3, as modified above)
The relevant values of transmitter and receiver antenna height, frequency (f), propagation path distance (d), eirp/erp, etc are selected.
1) The ‘Hata’ model is used to determine, for the relevant frequency f, the propagation loss at .1 km (Loss0.1) as described in section A6.2.2 above. The corresponding field strength (for a 0 dBkW erp) is (using equation A6.2.1):
E0.1(f) = 139.3 + 20 log f(MHz) – Loss0.1.
2) Recommendation ITU-R P.1546 is used to determine the field strength at 1 km (for 0 dBkW erp), for the refer-ence frequencies 600 MHz (E1.0(600)) and 2 000 MHz (E1.0(2000)), as described in section A6.2.3 above. The relevant field strength, (E1.0(f), for the frequency f is found using the frequency interpolation formula A6.2.14.
3) The field strength at d km (between 0.1 km and 1 km), Ed(f) is found using El = E0.1(f) and Eu = E1.0(f) in the distance interpolation Equation A6.2.16 (limiting E0.1(f) to free space if necessary).
4) The erp of the transmitter is added to the resulting field strength value.
A6.3 APPROXIMATION OF THE USED SIMPLIFIED PROPAGATION MODEL
The detailed algorithm described in section A6.2 can be approximated by the following path loss formula:
Loss (d) = alpha + beta log10 (D),
where D = [d2 + (Htx – Hrx)2/106]1/2 is the propagation path length and d is the horizontal distance (the ‘from’ – ‘to’
distance) between the transmitter site and the receiver site (d km).
The parameters identifying the various break-point tables are the transmit antenna height (Htx, m), the receive an-tenna height (Hrx, m), the environment (rural or urban small), the wanted or interfering loss approximations.
Alpha and beta in the Tables F3.1 to 3.4 are the ‘break points’ for the antenna heights 30, 60, 100 and 200 m and urban and rural/open environments, respectively, as used in the studies provided in the Annexes 1 and 2.
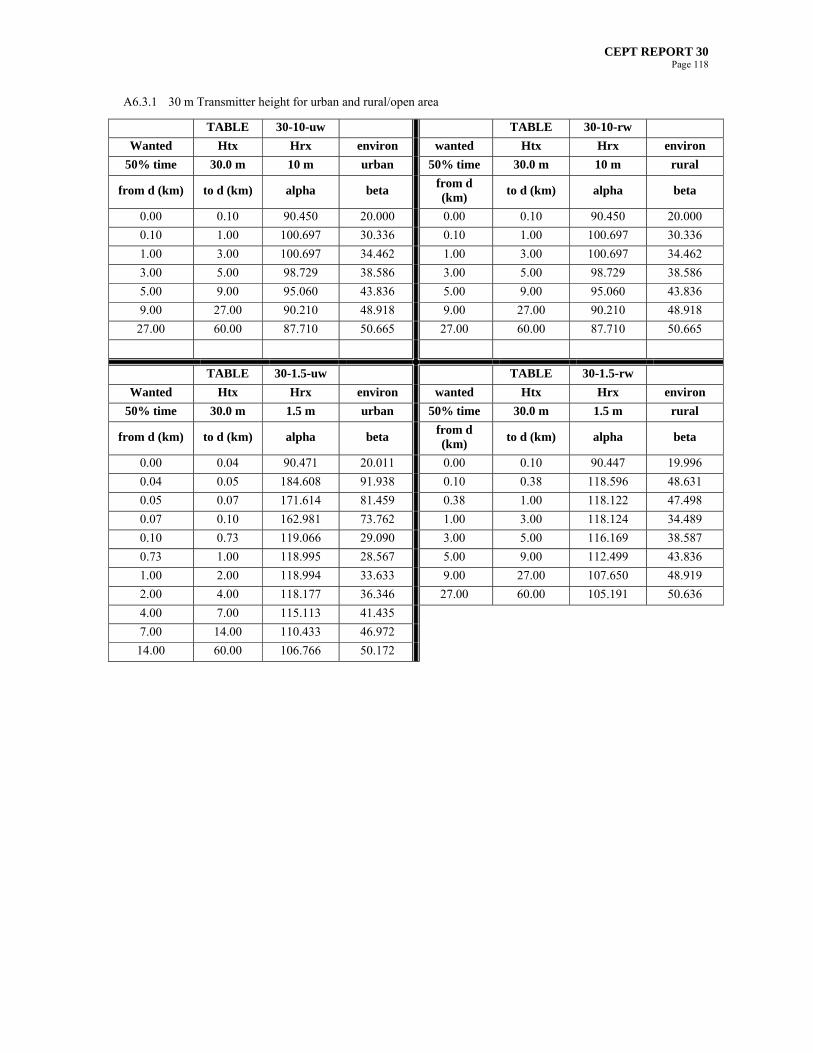
CEPT REPORT 30 Page 118
A6.3.1 30 m Transmitter height for urban and rural/open area
TABLE 30-10-uw TABLE 30-10-rw
Wanted Htx Hrx environ wanted Htx Hrx environ
50% time 30.0 m 10 m urban 50% time 30.0 m 10 m rural
from d (km) to d (km) alpha beta from d (km)
to d (km) alpha beta
0.00 0.10 90.450 20.000 0.00 0.10 90.450 20.000
0.10 1.00 100.697 30.336 0.10 1.00 100.697 30.336
1.00 3.00 100.697 34.462 1.00 3.00 100.697 34.462
3.00 5.00 98.729 38.586 3.00 5.00 98.729 38.586
5.00 9.00 95.060 43.836 5.00 9.00 95.060 43.836
9.00 27.00 90.210 48.918 9.00 27.00 90.210 48.918
27.00 60.00 87.710 50.665 27.00 60.00 87.710 50.665
TABLE 30-1.5-uw TABLE 30-1.5-rw
Wanted Htx Hrx environ wanted Htx Hrx environ
50% time 30.0 m 1.5 m urban 50% time 30.0 m 1.5 m rural
from d (km) to d (km) alpha beta from d (km)
to d (km) alpha beta
0.00 0.04 90.471 20.011 0.00 0.10 90.447 19.996
0.04 0.05 184.608 91.938 0.10 0.38 118.596 48.631
0.05 0.07 171.614 81.459 0.38 1.00 118.122 47.498
0.07 0.10 162.981 73.762 1.00 3.00 118.124 34.489
0.10 0.73 119.066 29.090 3.00 5.00 116.169 38.587
0.73 1.00 118.995 28.567 5.00 9.00 112.499 43.836
1.00 2.00 118.994 33.633 9.00 27.00 107.650 48.919
2.00 4.00 118.177 36.346 27.00 60.00 105.191 50.636
4.00 7.00 115.113 41.435
7.00 14.00 110.433 46.972
14.00 60.00 106.766 50.172
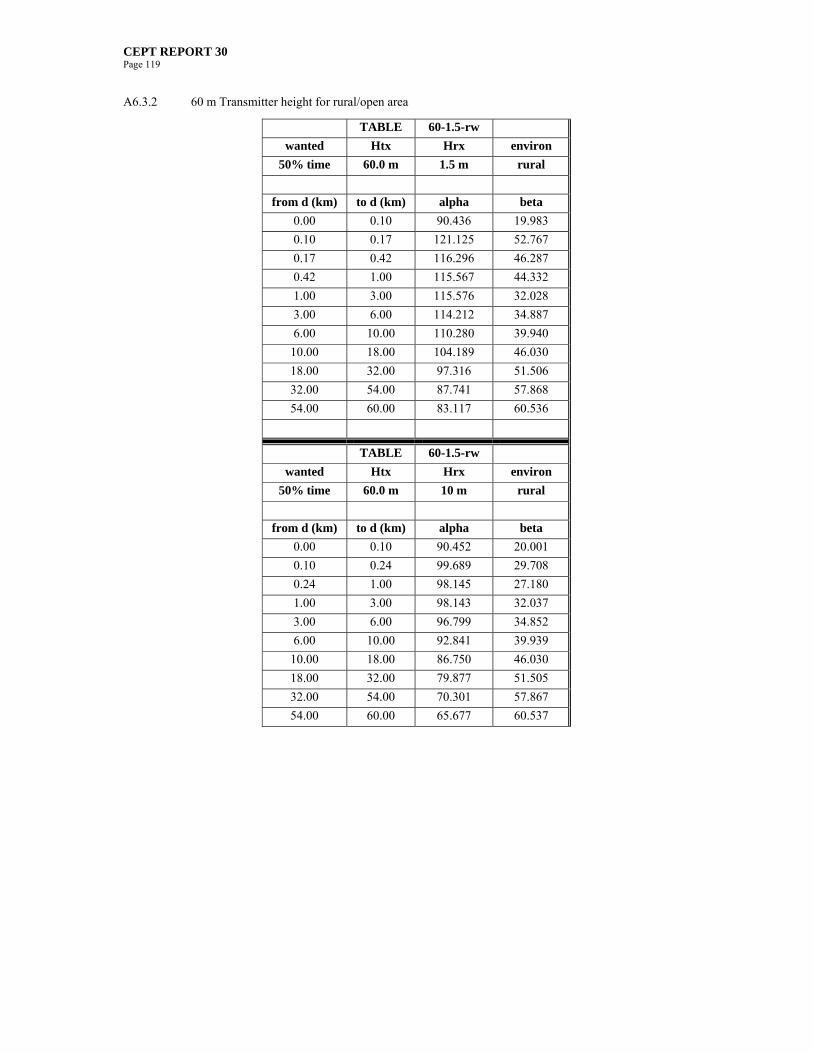
CEPT REPORT 30 Page 119
A6.3.2 60 m Transmitter height for rural/open area
TABLE 60-1.5-rw
wanted Htx Hrx environ
50% time 60.0 m 1.5 m rural
from d (km) to d (km) alpha beta
0.00 0.10 90.436 19.983
0.10 0.17 121.125 52.767
0.17 0.42 116.296 46.287
0.42 1.00 115.567 44.332
1.00 3.00 115.576 32.028
3.00 6.00 114.212 34.887
6.00 10.00 110.280 39.940
10.00 18.00 104.189 46.030
18.00 32.00 97.316 51.506
32.00 54.00 87.741 57.868
54.00 60.00 83.117 60.536
TABLE 60-1.5-rw
wanted Htx Hrx environ
50% time 60.0 m 10 m rural
from d (km) to d (km) alpha beta
0.00 0.10 90.452 20.001
0.10 0.24 99.689 29.708
0.24 1.00 98.145 27.180
1.00 3.00 98.143 32.037
3.00 6.00 96.799 34.852
6.00 10.00 92.841 39.939
10.00 18.00 86.750 46.030
18.00 32.00 79.877 51.505
32.00 54.00 70.301 57.867
54.00 60.00 65.677 60.537

CEPT REPORT 30 Page 120
A6.3.3 100 m Transmitter height for urban area
TABLE 100-1.5-uw
wanted Htx Hrx environ
50% time 100.0 m 1.5 m urban
from d (km) to d (km) alpha beta
0.00 0.04 90.363 19.912
0.04 0.05 350.645 287.303
0.05 0.06 276.891 210.216
0.06 0.07 234.439 164.960
0.07 0.08 207.525 135.635
0.08 0.10 184.754 110.237
0.10 0.15 124.241 39.274
0.15 0.28 116.958 29.513
0.28 1.00 114.508 24.868
1.00 3.00 114.497 30.068
3.00 7.00 113.301 32.573
7.00 12.00 108.838 37.854
12.00 20.00 101.334 44.807
20.00 31.00 91.956 52.015
31.00 46.00 79.819 60.153
46.00 60.00 69.031 66.642
TABLE 100-10-uw
wanted Htx Hrx environ
50% time 100.0 m 10 m urban
from d (km) to d (km) alpha beta
0.00 0.08 92.532 21.986
0.08 0.10 85.874 14.744
0.10 0.16 103.365 34.821
0.16 0.34 97.597 26.986
0.34 1.00 96.208 23.926
1.00 4.00 96.197 30.512
4.00 8.00 94.301 33.660
8.00 13.00 89.318 39.177
13.00 21.00 81.881 45.854
21.00 32.00 72.976 52.589
32.00 47.00 60.710 60.738
47.00 60.00 50.642 66.759
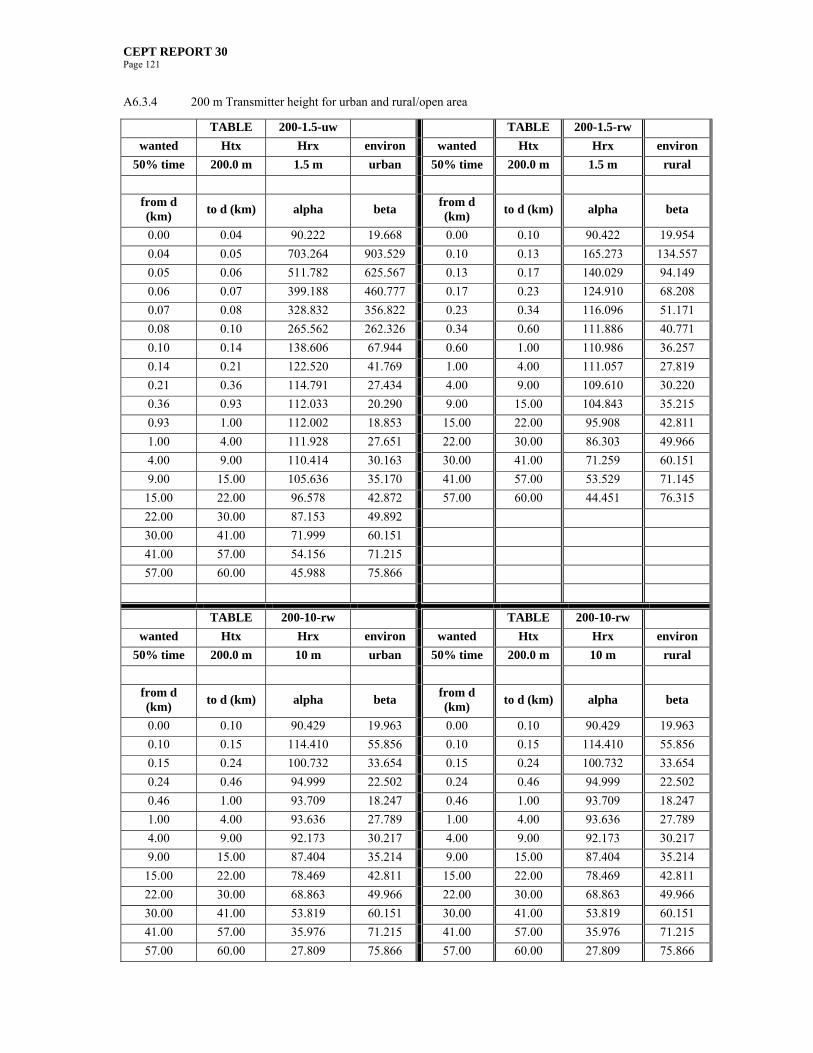
CEPT REPORT 30 Page 121
A6.3.4 200 m Transmitter height for urban and rural/open area
TABLE 200-1.5-uw TABLE 200-1.5-rw
wanted Htx Hrx environ wanted Htx Hrx environ
50% time 200.0 m 1.5 m urban 50% time 200.0 m 1.5 m rural
from d (km)
to d (km) alpha beta from d (km)
to d (km) alpha beta
0.00 0.04 90.222 19.668 0.00 0.10 90.422 19.954
0.04 0.05 703.264 903.529 0.10 0.13 165.273 134.557
0.05 0.06 511.782 625.567 0.13 0.17 140.029 94.149
0.06 0.07 399.188 460.777 0.17 0.23 124.910 68.208
0.07 0.08 328.832 356.822 0.23 0.34 116.096 51.171
0.08 0.10 265.562 262.326 0.34 0.60 111.886 40.771
0.10 0.14 138.606 67.944 0.60 1.00 110.986 36.257
0.14 0.21 122.520 41.769 1.00 4.00 111.057 27.819
0.21 0.36 114.791 27.434 4.00 9.00 109.610 30.220
0.36 0.93 112.033 20.290 9.00 15.00 104.843 35.215
0.93 1.00 112.002 18.853 15.00 22.00 95.908 42.811
1.00 4.00 111.928 27.651 22.00 30.00 86.303 49.966
4.00 9.00 110.414 30.163 30.00 41.00 71.259 60.151
9.00 15.00 105.636 35.170 41.00 57.00 53.529 71.145
15.00 22.00 96.578 42.872 57.00 60.00 44.451 76.315
22.00 30.00 87.153 49.892
30.00 41.00 71.999 60.151
41.00 57.00 54.156 71.215
57.00 60.00 45.988 75.866
TABLE 200-10-rw TABLE 200-10-rw
wanted Htx Hrx environ wanted Htx Hrx environ
50% time 200.0 m 10 m urban 50% time 200.0 m 10 m rural
from d (km)
to d (km) alpha beta from d (km)
to d (km) alpha beta
0.00 0.10 90.429 19.963 0.00 0.10 90.429 19.963
0.10 0.15 114.410 55.856 0.10 0.15 114.410 55.856
0.15 0.24 100.732 33.654 0.15 0.24 100.732 33.654
0.24 0.46 94.999 22.502 0.24 0.46 94.999 22.502
0.46 1.00 93.709 18.247 0.46 1.00 93.709 18.247
1.00 4.00 93.636 27.789 1.00 4.00 93.636 27.789
4.00 9.00 92.173 30.217 4.00 9.00 92.173 30.217
9.00 15.00 87.404 35.214 9.00 15.00 87.404 35.214
15.00 22.00 78.469 42.811 15.00 22.00 78.469 42.811
22.00 30.00 68.863 49.966 22.00 30.00 68.863 49.966
30.00 41.00 53.819 60.151 30.00 41.00 53.819 60.151
41.00 57.00 35.976 71.215 41.00 57.00 35.976 71.215
57.00 60.00 27.809 75.866 57.00 60.00 27.809 75.866

CEPT REPORT 30 Page 122
ANNEX 7: SECOND EC MANDATE TO CEPT ON DIGITAL DIVIDEND
SECOND EC MANDATE TO CEPT ON TECHNICAL CONSIDERATIONS REGARDING HARMONISATION OPTIONS FOR THE DIGITAL DIVIDEND IN THE EUROPEAN UNION
EUROPEAN COMMISSION Information Society and Media Directorate-General
Electronic Communications Policy
Radio Spectrum Policy
Brussels, 3 April 2008
DG INFSO/B4
ADOPTED
Second mandate to CEPT
on technical considerations regarding harmonisation options for the digital dividend in the European Union
This mandate is issued to the CEPT without prejudice to the one-month right of scrutiny by the European Parliament, pursuant to Council Decision 1999/468/EC of 28 June 1999 (OJ L 184, 17.7.1999, p.23) on comitology procedure. This one-month period starts on 5 April 2008.
PURPOSE
This mandate intends to be a follow-up to the initial mandate on the digital dividend35. The main objective of this additional work is to ensure the continuation and timely development of the technical conditions and arrange-ments required to pave the way for non-mandatory, non-exclusive coordinated use of the digital dividend in Europe.
This mandate should provide further technical input to the political process ongoing at EU level36. The common exploitation of the result of this mandate does not entail the development of a technical implementation measure under the Radio Spectrum Decision. Any common action will be guided by an eventual EU-level political agreement involving the Council and European Parliament and the work undertaken under this mandate should not prejudge the contents of any future European agreement.
JUSTIFICATION
Pursuant to Article 4 of the Radio Spectrum Decision37, the Commission may issue mandates to the CEPT for the development of technical implementing measures with a view to ensuring harmonised conditions for the availability and efficient use of radio spectrum. Such mandates shall set the task to be performed and the timetable therefor.
A number of results from related activities justify the need to address an additional EC mandate to CEPT.
CEPT has delivered its final reports to the WAPECS mandate38 and to the initial digital dividend mandate39.
The findings prepared under the initial digital dividend mandate (Report A) discuss two approaches to imple-ment downlinks of mobile multimedia networks in the UHF-bands IV and V:
Approach 1: Implementation without a harmonized sub-band, based on the GE06 Plan entries
Approach 2: Implementation based on a harmonized sub-band
35 Mandate to CEPT on technical considerations regarding harmonisation options for the digital dividend, 30 January 2007 (RSCOM06-89). 36 Communication from the Commission to the European Parliament, the Council, the European Economic and Social Committee and the
Committee of the Regions: Reaping the full benefits of the digital dividend in Europe: a common approach to the use of the spectrum relea-sed by the digital switchover, COM(2007) 700, 13.11.2007.
37 Decision 676/2002/EC of the European Parliament and of the Council of 7 March 2002 on a regulatory framework for radio spectrum policy in the European Community, OJ L 108 of 24.4.2002.
38 Mandate to CEPT to develop least restrictive technical conditions for frequency bands addressed in the context of WAPECS, 5 July 2006 39 CEPT Reports parts A, B and C in response to the Commission mandate to CEPT on the digital dividend issued on 30 January 2007.
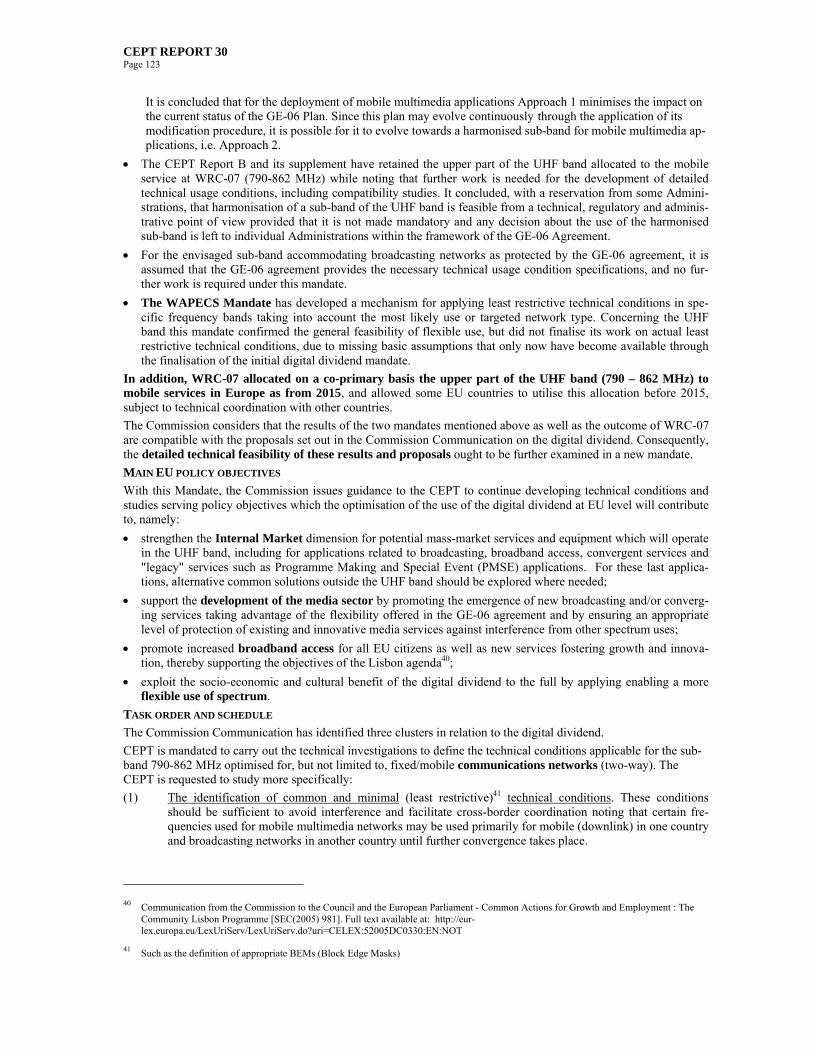
CEPT REPORT 30 Page 123
It is concluded that for the deployment of mobile multimedia applications Approach 1 minimises the impact on the current status of the GE-06 Plan. Since this plan may evolve continuously through the application of its modification procedure, it is possible for it to evolve towards a harmonised sub-band for mobile multimedia ap-plications, i.e. Approach 2.
The CEPT Report B and its supplement have retained the upper part of the UHF band allocated to the mobile service at WRC-07 (790-862 MHz) while noting that further work is needed for the development of detailed technical usage conditions, including compatibility studies. It concluded, with a reservation from some Admini-strations, that harmonisation of a sub-band of the UHF band is feasible from a technical, regulatory and adminis-trative point of view provided that it is not made mandatory and any decision about the use of the harmonised sub-band is left to individual Administrations within the framework of the GE-06 Agreement.
For the envisaged sub-band accommodating broadcasting networks as protected by the GE-06 agreement, it is assumed that the GE-06 agreement provides the necessary technical usage condition specifications, and no fur-ther work is required under this mandate.
The WAPECS Mandate has developed a mechanism for applying least restrictive technical conditions in spe-cific frequency bands taking into account the most likely use or targeted network type. Concerning the UHF band this mandate confirmed the general feasibility of flexible use, but did not finalise its work on actual least restrictive technical conditions, due to missing basic assumptions that only now have become available through the finalisation of the initial digital dividend mandate.
In addition, WRC-07 allocated on a co-primary basis the upper part of the UHF band (790 – 862 MHz) to mobile services in Europe as from 2015, and allowed some EU countries to utilise this allocation before 2015, subject to technical coordination with other countries.
The Commission considers that the results of the two mandates mentioned above as well as the outcome of WRC-07 are compatible with the proposals set out in the Commission Communication on the digital dividend. Consequently, the detailed technical feasibility of these results and proposals ought to be further examined in a new mandate.
MAIN EU POLICY OBJECTIVES
With this Mandate, the Commission issues guidance to the CEPT to continue developing technical conditions and studies serving policy objectives which the optimisation of the use of the digital dividend at EU level will contribute to, namely:
strengthen the Internal Market dimension for potential mass-market services and equipment which will operate in the UHF band, including for applications related to broadcasting, broadband access, convergent services and "legacy" services such as Programme Making and Special Event (PMSE) applications. For these last applica-tions, alternative common solutions outside the UHF band should be explored where needed;
support the development of the media sector by promoting the emergence of new broadcasting and/or converg-ing services taking advantage of the flexibility offered in the GE-06 agreement and by ensuring an appropriate level of protection of existing and innovative media services against interference from other spectrum uses;
promote increased broadband access for all EU citizens as well as new services fostering growth and innova-tion, thereby supporting the objectives of the Lisbon agenda40;
exploit the socio-economic and cultural benefit of the digital dividend to the full by applying enabling a more flexible use of spectrum.
TASK ORDER AND SCHEDULE
The Commission Communication has identified three clusters in relation to the digital dividend.
CEPT is mandated to carry out the technical investigations to define the technical conditions applicable for the sub-band 790-862 MHz optimised for, but not limited to, fixed/mobile communications networks (two-way). The CEPT is requested to study more specifically:
(1) The identification of common and minimal (least restrictive)41 technical conditions. These conditions should be sufficient to avoid interference and facilitate cross-border coordination noting that certain fre-quencies used for mobile multimedia networks may be used primarily for mobile (downlink) in one country and broadcasting networks in another country until further convergence takes place.
40 Communication from the Commission to the Council and the European Parliament - Common Actions for Growth and Employment : The Community Lisbon Programme [SEC(2005) 981]. Full text available at: http://eur-lex.europa.eu/LexUriServ/LexUriServ.do?uri=CELEX:52005DC0330:EN:NOT
41 Such as the definition of appropriate BEMs (Block Edge Masks)
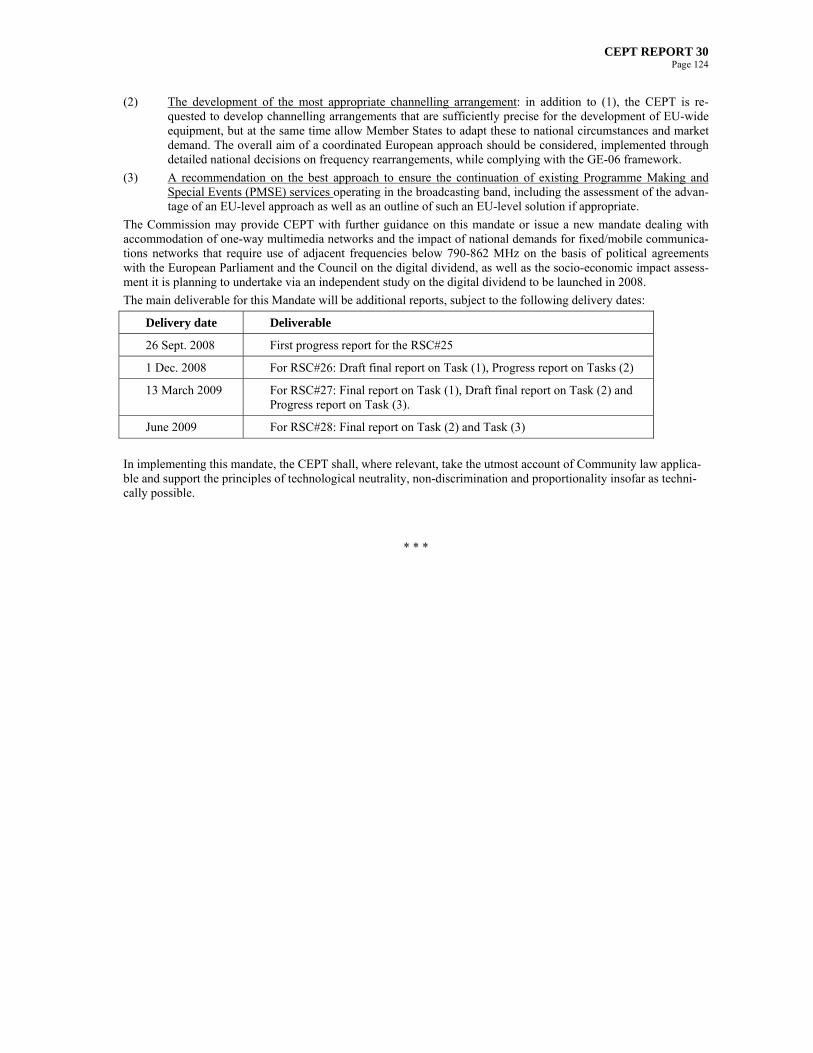
CEPT REPORT 30 Page 124
(2) The development of the most appropriate channelling arrangement: in addition to (1), the CEPT is re-quested to develop channelling arrangements that are sufficiently precise for the development of EU-wide equipment, but at the same time allow Member States to adapt these to national circumstances and market demand. The overall aim of a coordinated European approach should be considered, implemented through detailed national decisions on frequency rearrangements, while complying with the GE-06 framework.
(3) A recommendation on the best approach to ensure the continuation of existing Programme Making and Special Events (PMSE) services operating in the broadcasting band, including the assessment of the advan-tage of an EU-level approach as well as an outline of such an EU-level solution if appropriate.
The Commission may provide CEPT with further guidance on this mandate or issue a new mandate dealing with accommodation of one-way multimedia networks and the impact of national demands for fixed/mobile communica-tions networks that require use of adjacent frequencies below 790-862 MHz on the basis of political agreements with the European Parliament and the Council on the digital dividend, as well as the socio-economic impact assess-ment it is planning to undertake via an independent study on the digital dividend to be launched in 2008.
The main deliverable for this Mandate will be additional reports, subject to the following delivery dates:
Delivery date Deliverable
26 Sept. 2008 First progress report for the RSC#25
1 Dec. 2008 For RSC#26: Draft final report on Task (1), Progress report on Tasks (2)
13 March 2009 For RSC#27: Final report on Task (1), Draft final report on Task (2) and Progress report on Task (3).
June 2009 For RSC#28: Final report on Task (2) and Task (3)
In implementing this mandate, the CEPT shall, where relevant, take the utmost account of Community law applica-ble and support the principles of technological neutrality, non-discrimination and proportionality insofar as techni-cally possible.
* * *
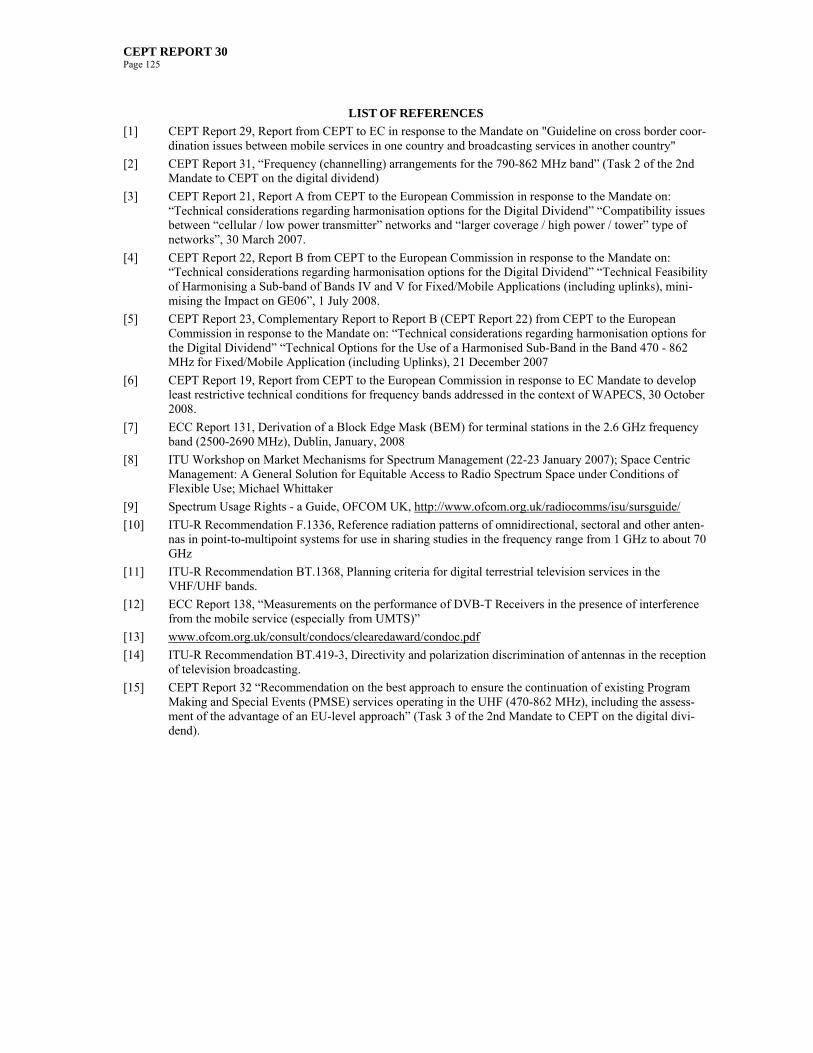
CEPT REPORT 30 Page 125
LIST OF REFERENCES
[1] CEPT Report 29, Report from CEPT to EC in response to the Mandate on "Guideline on cross border coor-dination issues between mobile services in one country and broadcasting services in another country"
[2] CEPT Report 31, “Frequency (channelling) arrangements for the 790-862 MHz band” (Task 2 of the 2nd Mandate to CEPT on the digital dividend)
[3] CEPT Report 21, Report A from CEPT to the European Commission in response to the Mandate on: “Technical considerations regarding harmonisation options for the Digital Dividend” “Compatibility issues between “cellular / low power transmitter” networks and “larger coverage / high power / tower” type of networks”, 30 March 2007.
[4] CEPT Report 22, Report B from CEPT to the European Commission in response to the Mandate on: “Technical considerations regarding harmonisation options for the Digital Dividend” “Technical Feasibility of Harmonising a Sub-band of Bands IV and V for Fixed/Mobile Applications (including uplinks), mini-mising the Impact on GE06”, 1 July 2008.
[5] CEPT Report 23, Complementary Report to Report B (CEPT Report 22) from CEPT to the European Commission in response to the Mandate on: “Technical considerations regarding harmonisation options for the Digital Dividend” “Technical Options for the Use of a Harmonised Sub-Band in the Band 470 - 862 MHz for Fixed/Mobile Application (including Uplinks), 21 December 2007
[6] CEPT Report 19, Report from CEPT to the European Commission in response to EC Mandate to develop least restrictive technical conditions for frequency bands addressed in the context of WAPECS, 30 October 2008.
[7] ECC Report 131, Derivation of a Block Edge Mask (BEM) for terminal stations in the 2.6 GHz frequency band (2500-2690 MHz), Dublin, January, 2008
[8] ITU Workshop on Market Mechanisms for Spectrum Management (22-23 January 2007); Space Centric Management: A General Solution for Equitable Access to Radio Spectrum Space under Conditions of Flexible Use; Michael Whittaker
[9] Spectrum Usage Rights - a Guide, OFCOM UK, http://www.ofcom.org.uk/radiocomms/isu/sursguide/
[10] ITU-R Recommendation F.1336, Reference radiation patterns of omnidirectional, sectoral and other anten-nas in point-to-multipoint systems for use in sharing studies in the frequency range from 1 GHz to about 70 GHz
[11] ITU-R Recommendation BT.1368, Planning criteria for digital terrestrial television services in the VHF/UHF bands.
[12] ECC Report 138, “Measurements on the performance of DVB-T Receivers in the presence of interference from the mobile service (especially from UMTS)”
[13] www.ofcom.org.uk/consult/condocs/clearedaward/condoc.pdf
[14] ITU-R Recommendation BT.419-3, Directivity and polarization discrimination of antennas in the reception of television broadcasting.
[15] CEPT Report 32 “Recommendation on the best approach to ensure the continuation of existing Program Making and Special Events (PMSE) services operating in the UHF (470-862 MHz), including the assess-ment of the advantage of an EU-level approach” (Task 3 of the 2nd Mandate to CEPT on the digital divi-dend).


![c+za08fsf] !* g+= df plNnlvt lg0f{o g+= **^(/cite>lg0f{o](https://img.pdfslide.tips/doc/110x75/5ac3e86e7f8b9ae06c8cbb58/cza08fsf-g-df-plnnlvt-lg0fo-g-.jpg)